Abstract
The pollution of ammonia-nitrogen in water became more serious with the development of the industry. In this paper, hydroxyapatite (HAP) was prepared from waste fish scales; the XRD, FTIR, SEM, TEM and Raman were used to characterize the prepared samples, and the prepared HAP samples were studied as degradation photocatalyst and adsorbing material for the removal of ammonia-nitrogen. The ammonia-nitrogen removal efficiency (ANRE, Removal Rate = (Initial Concentration–Current Concentration)/Initial Concentration × 100%) of the samples was also discussed. The results showed that the HAP sample, which was calcinated at 800 °C for 2 h, had the best ANRE, which was 41%. The UV-Vis, EIS, and PL were used to analyze the reason for the different ANRE. The reason for the high ANRE was attributed to the samples’ superior adsorption capability resulting from their large specific surface area, as well as their superior properties for photocatalytic degradation. This was a meaningful work to explore a treatment of ammonia-nitrogen by HAP.
1. Introduction
As industry and the economy continue to rapidly advance, environmental pollution has become an increasingly critical issue that must be addressed. Therein, ammonia-nitrogen pollution became one of the main problems in modern industrial society. The reasons may be industrial ammonia and domestic waste emissions, excessive use of agricultural fertilizers, and traffic tail gas [1,2]. On the other hand, it can cause eutrophication of surface water and topsoil, leading to massive growth and rapid reproduction of algae species, which further results in the decay of aquatic ecosystem and human environment [3,4]. Traditionally, the high-temperature hydrolysis of urea is used to treat this kind of waste liquid, but its operation and maintenance cost is very high [5]. Using photocatalyst is a potential method to solve this problem, considering that solar energy can be used in large surface water areas. Since Fujishima and Honda used TiO2 to decompose water in 1972 [6], more scholars began to pay extensive attention to photocatalysis. It is also considered to be the most suitable technology for solving ammonia-nitrogen pollution [7,8]. However, traditional catalysts often contain heavy metals, which have adverse effects on the environment, resulting in long-term consequences [9,10]. Therefore, the photocatalysts for ammonia-nitrogen treatment with low environmental pollution and low production cost became a research hotspot.
Hydroxyapatite naturally has the ability to absorb ions or molecules [11,12,13], so it can be used to dispose pollutants. In addition, researchers recently showed that HAP has photocatalytic properties to some extent. The photocatalytic performance of HAP may be due to the formation of lattice defects and O2•− free radicals produced by the calcination during HAP preparation [14]. In addition, a study also showed that PO4 groups in HAP can change when calcined at 200 °C, resulting in vacancy defects in the HAP lattice [15], which, therefore, makes HAP have photocatalytic properties. The pH value, morphology, composition, and other conditions in the preparation process can also affect the structure and the photocatalytic performance of the HAP [16]. In 2015, Tripathi prepared fibrous HAP with yeast extract as a template, which effectively degraded azo dyes in water. The experiment also showed that a small amount of protein left in the extract can be used as the active center of the photocatalyst and improve its catalytic activity [17]. Doping is also used to improve HAP’s photocatalytic ability. For example, Tsukada tested the effect of Ti4+ doping on the band gap of HAP and showed that the 2p orbital of O in the HAP molecule and the 3D orbital of doped Ti can form a new hybrid orbital energy level [18], resulting in the improvement of photocatalysis. In addition, other doping, such as V5+-doped HAP, were also demonstrated to be of enhanced photocatalytic activity [19]. Composite photocatalytic material of HAP and TiO2 was prepared and proved to have synergy photocatalysis between HAP and TiO2 in the composite sample [20]. Therefore, the photocatalytic activity of the composite HAP samples is better than that of single-phase HAP or TiO2. HAP’s doping and recombination with other catalysts have important effects on the photocatalytic activity of HAP [21,22,23].
Alternatively, as a common industrial and domestic waste, fish scales can be used to extract useful HAP components [24,25]. There were attempts to prepare hydroxyapatite using fish scales as raw material, and it was preliminarily found that the calcination temperature and time had significant effects on the structure and photocatalytic properties of hydroxyapatite [24,26,27].
In this study, HAP was prepared at different calcination temperatures and for different calcination times by using waste fish scales as a raw material. Its performance in treating ammonia-nitrogen effluents by adsorption and photocatalytic degradation was also explored. Although some work involved the calcination temperature and time of hydroxyapatite [28,29,30], they did not consider the influence of these preparation conditions on the removal of ammonia-nitrogen. Therefore, this work can provide initial research data for the application of hydroxyapatite as an ammonia-nitrogen removal material.
2. Experimental Method
2.1. Materials and Sample Preparation
One liter of NH4CL solution was prepared by dissolving 0.0382 g of NH4CL; 100 mL of EDTA solution was prepared by dissolving 37.2240 g EDTA and100 mL NaOH solution was prepared by dissolving 40 g of NaOH. Wash the fish scales and soak them in NaOH solution to remove collagen. After rinsing and drying, the grinding fish scales were calcined in the muffle oven at different temperatures and for different times, and then, cooled naturally.
Sodium hydroxide, ammonium chloride, and EDTA are analytical reagent and were purchased from Beijing Chemical works (Beijing, China).
2.2. Characterization and Sample Test
Powder X-ray diffraction (XRD, Rigaku D/max, Rigaku Corporation, Tokyo, Japan) with a Cu Kα radiation in the 2 theta range of 10°–70° at a scanning rate of 5°/min was used to analyze the crystal phases of the samples. Scanning electron microscopy (SEM, JEOL S-500, JEOL Ltd., Tokyo, Japan), transmission electron microscopy (TEM, JEOL JEM-2100F, JEOL Ltd., Tokyo, Japan), and high-resolution transmission electron microscopy (HRTEM, JEOL JEM-2100F, JEOL Ltd., Tokyo, Japan) were utilized to examine the sample morphologies. Fourier transform infrared spectra (FTIR) were tested on a Nicolet FTIR 5700 spectrophotometer (Thermo Fisher Scientific, Waltham, MA, USA). Raman spectra were collected at room temperature using Horiba HR800 recorder (Horiba, Kyoto, Japan) with a 514.5 nm Ar+ laser excitation in the range of 100–4000 cm−1. The UV-Vis scanning spectrophotometer (Perkin-Elmer, Waltham, MA, USA) with absorption at wavelengths between 200 and 800 nm using an integrated sphere of BaSO4 as the standard sample was utilized. The bandgap energy was estimated by generalizing the linear part of the (Ahm)1/2 vs. hv curve to the energy axis.
An amount of 0.0500 g HAP and 20 mL NH4Cl solution of 1 mg/L were placed in reaction test tubes that were located axially in a ring whirligig test tube rack (XPA-7, Xujiang Ltd., Nanjing, China). Mercury lamp of 300 W was used as light source in the center. Before the photoreaction, the suspension was treated with ultrasound and stirred in the dark for about 30 min to reach the adsorption–desorption equilibrium between photocatalysts and NH4Cl solution. During the degradation process, the suspension in the test tube under the light irradiation was stirred by magnetic force. For every 30 min of interval, the supernatant liquid was sampled out and centrifuged to remove the photocatalysts from the suspension. The resultant transparent solutions were examined by ammonia-nitrogen ion-selective electrode.
The above process was used to test the adsorption performance of HAP in dark conditions. When ultraviolet light was switched on, the photocatalytic performance of HAP to remove ammonia-nitrogen was tested.
3. Results and Discussion
3.1. Composition Analysis
The results show that the crystallinity of the HAP samples increased with the increase in calcination temperature, as shown in Figure 1. Figure 1a shows the XRD patterns of HAP samples obtained at different calcination temperatures, and all were calcinated for 2 h. The diffraction peaks of the prepared samples were consistent with the standard card PDF#72-1243, indicating that the prepared samples were hexagonal HAP, of which the 2θ the angles were 25.8, 28.1, 28.9, 31.8, 32.2, 32.9, 34.0, 39.7, 46.6, 49.5, and 53.2°, they correspond to (002), (102), (210), (211), (112), (300), (202), (310), (222), (213), and (004) crystal plane diffraction peaks, respectively [31]. The HAP samples obtained at the calcination temperatures of 200 and 400 °C had only diffraction peaks of (002) and (211) crystal planes, and the half peak width was wide, indicating that the crystallinity of the sample was low. The sharp HAP diffraction peaks obtained at 600, 800, and 1000 °C indicate that the samples had high crystallinity. The results show that the crystallinity of the HAP samples increased with the increase in calcination temperature. Figure 1b shows the sample XRD patterns obtained for different calcination times. The diffraction peaks of the samples were also found to be consistent with those of the standard card PDF#72-1243, indicating that all the as-prepared samples were hexagonal crystal HAP. The diffraction peak width of the 2 h calcination time sample was narrow, and its peak was sharp enough, indicating that the crystallinity of the sample was very high. The transition to narrow and sharp peaks of XRD pattern was revealed with increasing sintering temperature and sintering time. This observation suggested the crystallinity improved with increasing sintering temperatures and sintering time, which was consistent with the literature reports [28,29,30]. Combined with the experiments in the following experiments, the 2 h calcination at 800 °C was the proper sample preparation process.
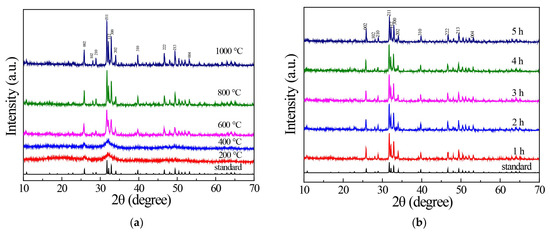
Figure 1.
(a) XRD of HAP prepared at different calcination temperatures; (b) XRD patterns of HAP samples prepared under different calcination time.
The result from Figure 2 demonstrated that with the increase in calcination temperature, the characteristic peak of PO43− group became increasingly evident, which indicated that the purity of HAP increased while the temperature did so. Figure 2 shows the FTIR spectra of samples prepared at different calcination temperatures (a) and for different calcination times (b). The characteristic peaks of samples at 562, 605, 960, 1025, and 1090 cm−1 were the peaks of PO43−. The 400 °C samples had the characteristic peak of CO32- group only at 874 cm−1, and the 600 and 800 °C HAP samples had the characteristic peak of CO32 group at 1465, 1411, and 874 cm−1; this may be because the fish scale itself contained some substitution of CO32− for PO43− in HAP [32]. There was no obvious peak of CO32− group at 200 °C, which may be due to the fact that the organic matter in fish scales was not calcined completely at lower calcination temperatures, resulting in the CO32− group characteristic peaks in HAP not being obvious. The characteristic peak of CO32− group also disappeared at 1000 °C, which may be due to the decomposition of CO32− under the high temperature. The peaks near 633 and 3573 cm−1 were the characteristic peaks of -OH. The -OH peaks appeared in the samples calcined at 600, 800, and 1000 °C for 2 h from Figure 2b. From the above, it can be concluded that when the calcination temperature reaches 600 °C, the organic matter in the fish scale can decompose, so we can obtain a relatively pure HAP sample.
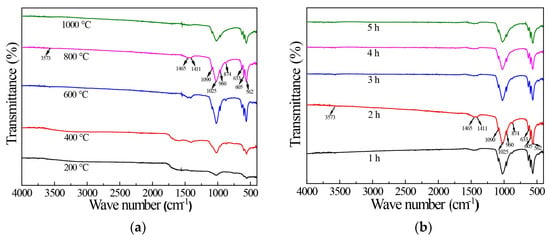
Figure 2.
FTIR diagram of HAP prepared at different calcination temperatures (a) and for different calcination time (b).
The results show that with the increase in calcination temperature, the intensity of the -OH peak of the sample increased, as seen in Figure 3. Figure 3a shows the Raman spectra of HAP samples prepared at different calcination temperatures. It can be seen that the samples obtained at 400–1000 °C had the PO43− characteristic peaks at 424, 588, 955, and 1037 cm−1. There was no characteristic peak in the sample obtained at 200 °C, mainly because of the organic matter in the fish scale. The peak at 3571 cm−1 was the characteristic peak of -OH. The samples obtained at 200 and 400 °C presented fluorescence phenomena. The reason for this phenomenon is that the crystallinity is low and the fluorescence phenomenon occurs under laser excitation [33,34]. Additionally, 2 h of calcination time is enough to obtain good crystallinity, as observed in Figure 3b.
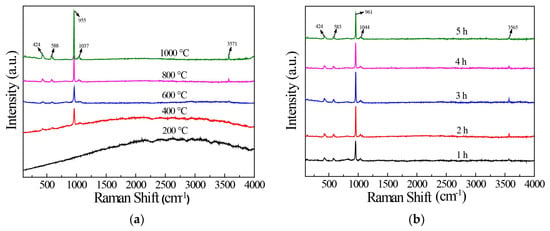
Figure 3.
Raman diagram of HAP prepared at different calcination temperatures (a) and calcined for different time (b).
3.2. Morphology Characterization
Figure 4a,b show the SEM and TEM spectra of HAP obtained at calcination temperature from 200 to 1000 °C. It can be seen that the samples, which were calcined at different temperatures, were irregular and uneven-sized blocks. There were no significant changes in the sample morphology when calcined at different temperatures (Figure S2). The particle size had some variation, which was not obvious (Figure S3). The lattice spacing was 0.338 nm in Figure 4b, which just matched the hexagonal HAP (002) plane, which are consistent with those of XRD in Figure 1. We can also see, from the EDS diagram in Figure 4c,d, that the sample contained trace Mg and its atomic percent was 0.09, which indicates that HAP prepared from fish scales may contain trace Mg by itself. Additionally, the Ca/P of the sample was 1.18, which was lower than 1.67 of common HAP prepared from phosphate and calcium salts [35].
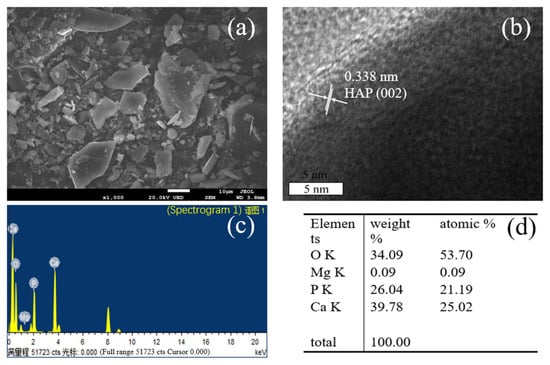
Figure 4.
SEM (a), TEM (b) and EDS (c,d) of HAP samples calcined at 800 °C.
3.3. Optical and Electrochemical Performance
The UV-Vis diffuse reflectance spectra (UV-Vis) in Figure 5a show that the absorption band of all samples was before 400 nm, mainly in the ultraviolet region. With the increase in calcination temperature, the light absorption capacity of samples increased first and then, decreased. The samples with the worst light absorption capacity were those obtained at 200 and 400 °C. The sample prepared at 800 °C had the largest light absorption capacity. It was also of the best photocatalytic degradation to ammonia-nitrogen. Figure 5b shows the Kubelka–Munk curves of the samples obtained via the transformation based on the (Ahν)1/2 vs. energy of the absorbed light. The band gap values of the samples can be estimated by the curves. The sample calcined at 800 °C had the narrowest band gap and its value was 3.11 eV. The band gaps of the sample at 200, 400, 600, and 1000 °C were 3.77, 3.69, 3.59, and 3.52 eV, respectively. This indicates that the band gap decreased as the calcination temperature increased. When the temperature increased, the atomic spacing increased, and the bandwidth became narrower, and so, the band gap width increased [36]. Figure 5c shows the UV-vis spectra of HAP samples calcined for 1 to 5 h. The absorption band of all these HAP samples was mainly in the UV region of fewer than 400 nanometers. With the increase in calcination time, the light absorption capacity of the sample increased at first and then decreased. The sample with the strongest light absorption capacity was that calcined for 2 h, which was also the sample with the best photocatalytic degradation of ammonia-nitrogen. Figure 5d shows the Kubelka–Munk curves of the HAP samples calcined at different times. It can also be seen that the narrowest band gap was 3.11 eV of the sample calcined for 2 h at 800 °C.

Figure 5.
UV-Vis and hv-(Ahv)2 diagram of HAP at different calcination temperatures (a,b), UV-vis and hv-(Ahv)2 diagram of HAP calcined for different time (c,d).
In order to investigate the photocatalytic mechanism of ammonia-nitrogen degradation, photoelectrochemical measurements were carried out. The transient photocurrent response (TPR) was used to reveal the charge separation efficiency. As depicted in Figure 6a, the 800 and 1000 °C samples generated evidently strong and steady photocurrent. It indicated that the samples calcined at high temperatures had better efficient separation efficiency of photogenerated electrons and holes. The electrochemical impedance spectra (EIS) were employed to study the interfacial charge transfer. As seen in Figure 6b, the 800 °C samples had the smallest arc radius of the EIS plot, demonstrating that it had higher interfacial charge transfer efficiency, which corresponds to their enhanced photocatalytic degradation performance. The recombination of photogenerated electrons and holes was surveyed by photoluminescence (PL). A lower PL intensity reflects lower recombination of electrons and holes. Figure 6c shows that the PL emission intensity of low-temperature calcined samples located at around 430 nm was evidently higher than those calcined at high-temperature samples, which implied the lower charge recombination rate of 800 and 1000 °C samples. This observation was in accordance with that of the TPR and EIS results. Figure 6d shows the EIS spectra of HAP samples calcined at 800 °C for 2 h under the light on and the light off. It can be seen that the impedance radius of HAP samples decreased significantly when it was illuminated under the light, indicating that the light was conducive to the activation of photocatalysts and more effective separation of electrons and holes.

Figure 6.
TPR (a), EIS (b), and PL (c) of the as-prepared HAP samples calcined at different temperatures, (d) the EIS diagram of HAP samples calcined at 800 °C for 2 h when the light was on and off.
Figure S1 also shows similar circumstances of the photoelectrochemical measurements for samples calcined at different times. It can be seen that with the increase in calcination time, the photocurrent response intensity of HAP samples increased first and then, decreased with the 2 h sample the largest value, and so, its separation efficiency of electrons and holes was the largest. The EIS of HAP samples showed that the impedance radius of the sample calcined for 2 h was the smallest, indicating that the sample had the lowest charge transfer resistance and the highest charge transfer efficiency. Additionally, it is also of the least PL emission intensity, which implied it was of the lowest charge recombination rate.
3.4. Performance of HAP to Remove Ammonia-Nitrogen
Figure 7a shows the performance of removing ammonia-nitrogen from the water of HAP samples obtained at different calcination temperatures. It can be seen from the blank sample that there was almost no change in the ammonia-nitrogen, even after stirring for 600 min. The sample reached adsorption equilibrium after about 240 min, and then, the light was turned on when it was 300 min after the beginning of the experiment. The best photocatalytic degradation of ammonia-nitrogen was the sample calcined at 800 °C. Followed by 600 °C, 1000 °C, and 400 °C, respectively. Therefore, compared with the blank sample, it can be concluded that ammonia-nitrogen can be removed by the adsorption and photocatalytic degradation of the sample. The main reason is that the sample, which calcined at 800 °C, had a relatively stronger light absorption capacity, larger transient photocurrent intensity, higher efficiency of electron transfer, and lower recombination efficiency of electron-hole pairs. Therefore, its absorption and photocatalytic degradation to ammonia-nitrogen were the best. Figure 7b demonstrates the fitting curve of first-order kinetics of photocatalytic degradation of HAP samples at different calcination temperatures. It can be seen that all samples conformed to the first-order kinetics equation of the photocatalytic reaction. The correlation coefficients of temperature were 0.92216, 0.99338, 0.96838, 0.9921, and 0.9731, respectively. Figure 7c shows the performance of removing ammonia-nitrogen from water by HAP samples calcined at different times. The results show that the sample achieved adsorption equilibrium in about 240 min. Among these samples, the best photocatalytic degradation performance was that of calcined for 2 h. Its removal efficiency was 41%, which was 2.003 mg/g in terms of nitrogen, in 600 min. The main reason, as per the discussion in 3.3, was that the sample had stronger light absorption capacity, higher transient photocurrent intensity, higher efficiency of electron transfer, and lower efficiency of electron-hole pair combination when the sample was calcined for 2 h. Figure 7d is the first-order kinetics fitting curve of photocatalytic degradation of HAP samples at different calcination times. It can be seen that all samples conformed to the first-order kinetics equation of the photocatalytic reaction. The correlation coefficients r of calcination time from low to high were 0.98883, 0.98204, 0.9801, 0.9898985, and 0.9946, respectively. Therefore, Figure 7 shows that the as-prepared samples can effectively remove ammonia-nitrogen from the water. Furthermore, the kinetic equations and the kinetic parameters are available in Figures S4 and S5, which show that the ammonia-nitrogen degradation process was fit to the first-order kinetics equation. Other studies showed that ammonia-nitrogen can be absorbed by sewage sludge-derived biochar (SSL), which was associated with development of the specific surface area (SBET) and a high content of the inorganic fraction and metals. The substitution of CO2 for N2 during pyrolysis results in higher desorption of phosphate and ammonium ions [37].
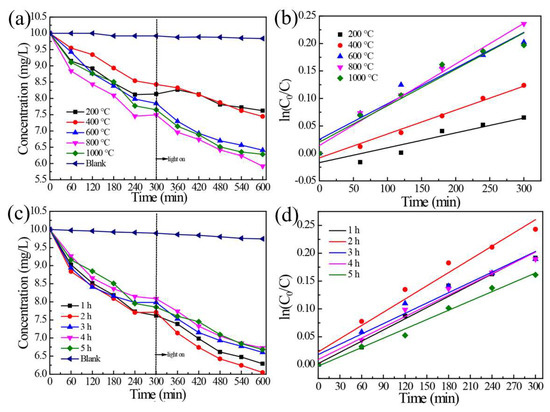
Figure 7.
(a) Ammonia-nitrogen removal performance of HAP samples prepared at different calcination temperatures; (b) fitting curve of first-order kinetics of photocatalytic degradation of HAP samples obtained at different calcination temperatures; (c) performance diagram of removing ammonia-nitrogen from water by HAP sample; (d) fitting curve of first-order kinetics of photocatalytic degradation of HAP samples prepared under different calcination time.
4. Conclusions
In conclusion, this study showed that the purity of HAP in the sample increased with the increase in calcination temperature. Pure HAP samples can be obtained by raising the calcination temperature to over 600 °C. The best ammonia-nitrogen removal performance was the HAP sample calcined at 800 °C for 2 h. The maximum ammonia-nitrogen removal efficiency was 2.003 mg/g in terms of nitrogen after treatment for 600 min. In this study, HAP was prepared from discarded fish scales by a process of alkali treatment-calcination. XRD, SEM, EDS, TEM, FTIR, and Raman were used to investigate the structure of the samples. Additionally, the absorption and photocatalytic degradation performance of the ammonia-nitrogen were tested and UV-vis, TPR, EIS, and PL were carried out to analyze the reasons for the performance improvement. The influence of calcination temperature and time on the HAP samples were also investigated. This may be a innovative solution to ammonia-nitrogen water, which is a good thing for human-beings indeed.
Supplementary Materials
The following supporting information can be downloaded at: https://www.mdpi.com/article/10.3390/w15071274/s1, Figure S1: TPR (a), EIS (b), and PL (c) of the as prepared HAP samples calcined for different time, (d) the EIS diagram of HAP samples calcined at 800 °C for 2 h when light on and off; Figure S2: SEM of the as prepared HAP samples calcined at different temperatures; Figure S3: Laser granularity distribution map of the as prepared HAP samples calcined at different temperatures; Figure S4: The kinetic equations and kinetic parameters of the removing ammonia nitrogen from water by HAP at different calcination temperatures; Figure S5: The kinetic equations and kinetic parameters of the removing ammonia nitrogen from water by HAP for different calcination times.
Author Contributions
H.W., writing, data curation; D.Z., writing, data curation; Q.W., writing; M.Q., resources, validation, supervision; Z.Z., resources, validation, supervision. All authors have read and agreed to the published version of the manuscript.
Funding
This research was funded by by College Students’ Innovative and Entrepreneurial Training Program of China grant number S202211415147 and X202211415281.
Data Availability Statement
The data is unavailable due to privacy or ethical restrictions.
Acknowledgments
My most sincere thanks to my tutor Zhao. We could not have achieved this without your selfless help. Special thanks to Joella Wang, who contributed a large number of critical comments to our article. Additionally, we extend our gratitude to the editors and reviewers. We are deeply touched by your great actions and your brilliant dedication.
Conflicts of Interest
The authors declare that they have no known competing financial interest or personal relationships that could have appeared to influence the work reported in this paper.
References
- David, D.P.; David, R.; Wouter, L.; Jeroen, B. Mapping impact indicators to link airborne ammonia emissions with nitrogen deposition in Natura 2000 sites. Atmos. Environ. 2017, 166, 120–129. [Google Scholar]
- Begoña, A.; Manuel, P.; Elisabeth, A.; Marta, B.; Esther, C.; Francisco, J.G.; Pedro, S.; Lourdes, N.; Magdalena, P.; Elías, D. Real-time monitoring of atmospheric ammonia during a pollution episode in Madrid (Spain). Atmos. Environ. 2018, 189, 80–88. [Google Scholar]
- Zhang, X.; Wu, Y.; Gu, B. Urban rivers as hotspots of regional nitrogen pollution. Environ. Pollut. 2015, 205, 139–144. [Google Scholar] [CrossRef]
- Lu, Z.; Gan, J. Controls of seasonal variability of phytoplankton blooms in the Pearl River Estuary. Deep Sea Res. Part II 2015, 117, 86–96. [Google Scholar] [CrossRef]
- Urbańczyk, E.; Sowa, M.; Simka, W. Urea removal from aqueous solutions—A review. J. Appl. Electrochem. 2016, 46, 1011–1029. [Google Scholar] [CrossRef]
- Fujishima, A.; Honda, K. Electrochemical photocatalysis of water at semiconductor electrode. Nature 1972, 238, 37–38. [Google Scholar] [CrossRef]
- Marco, A.; Gian, L.C.; Annamaria, C.; Marcella, G.; Elena, S. Photocatalytic abatement of ammonia in nitrogen-containing effluents. Chem. Eng. J. 2012, 191, 394–401. [Google Scholar]
- Wang, H.; Zhang, X.; Su, Y.; Yu, H.; Chen, S.; Quan, X.; Yang, F. Photoelectrocatalytic oxidation of aqueous ammonia using TiO2 nanotube arrays. Appl. Surf. Sci. 2014, 311, 851–857. [Google Scholar] [CrossRef]
- Hiroshi, K. Developments and trends of the photocatalyst-Green chemistry (Article). J. Inst. Electr. Eng. Jpn. 2018, 9, 606–609. [Google Scholar]
- Zhao, W.; Wang, D.; Zhu, Y.; Shen, M.; Zhang, Y. Photocatalytic treatment of low concentration ammonia nitrogen wastewater. Xitu 2022, 43, 106–112. (In Chinese) [Google Scholar]
- Sun, C.; Sun, K.; Hou, X.; Leng, L.; Liu, X.; Hu, Z.; Li, C. Preparation and microwave absorption property of HAP/polymer biocomposite. J. Funct. Mater. Devices 2006, 12, 533–536. [Google Scholar]
- Ding, X.J.; Takahata, M.; Akazawa, T.; Iwasaki, N.; Abe, Y.; Komatsu, M.; Murata, M.; Ito, M.; Abumi, K.; Minami, A. Improved bioabsorbability of synthetic hydroxyapatite through partial dissolution-precipitation of its surface. J. Mater. Sci. Mater. Med. 2011, 22, 1247–1255. [Google Scholar] [CrossRef]
- Aryal, S.; Matsunaga, K.; Ching, W.Y. Ab initio simulation of elastic and mechanical properties of Zn- and Mg-doped hydroxyapatite (HAP). J. Mech. Behav. Biomed. 2015, 47, 135–146. [Google Scholar] [CrossRef]
- Harumitsu, N.; Koichi, O. Photocatalytic activity of hydroxyapatite for methyl mercaptane. J. Mol. Catal. A Chem. 2002, 179, 193–200. [Google Scholar]
- Harumitsu, N. Photo-induced catalytic activity of hydroxyapatite based on photo-excitation. Phosphorus Res. Bull. 2007, 21, 97–102. [Google Scholar]
- Reddy, M.P.; Venugopal, A.; Subrahmanyam, M. Hydroxyapatite photocatalytic degradation of calmagite (an azo dye) in aqueous suspension. Appl. Catal. B 2006, 69, 164–170. [Google Scholar] [CrossRef]
- Tripathi, R.M.; Kumar, N.; Singh Bhadwal, A.; Gupta, R.K.; Shrivastav, B.R.; Shrivastav, A. Facile and rapid biomimetic approach for synthesis of HAp nanofibers and evaluation of their photocatalytic activity. Mater. Lett. 2015, 140, 64–67. [Google Scholar] [CrossRef]
- Tsukada, M.; Wakamura, M.; Yoshida, N.; Watanabe, T. Band gap and photocatalytic properties of Ti-substituted hydroxyapatite: Comparison with anatase-TiO2. J. Mol. Catal. A Chem. 2011, 338, 18–23. [Google Scholar] [CrossRef]
- Nishikawa, M.; Tan, L.H.; Nakabayashi, Y.; Hasegawa, T.; Shiroishi, W.; Kawahara, S.; Saito, N.; Nosaka, A.; Nosaka, Y. Visible light responsive vanadium-substituted hydroxyapatite photocatalysts. J. Photoch. Photobio. A 2015, 311, 30–34. [Google Scholar] [CrossRef]
- Anmin, H.; Tong, L.; Ming, L.; Chengkang, C.; Huiqin, L.; Dali, M. Preparation of nanocrystals hydroxyapatite/TiO2 compound by hydrothermal treatment. Appl. Catal. B Environ. 2006, 63, 41–44. [Google Scholar] [CrossRef]
- Chahkandi, M.; Zargazi, M.; Hajizadeh, A.; Tayebee, R. In-situ incorporation of Bi2O3 nanorods and Ag metal plasmonic surface into crystalline HAp nanosheets: Efficient visible light degradation of phenol. J. Alloys Compd. 2022, 902, 163737. [Google Scholar] [CrossRef]
- Ye, F.X.; Ohmori, A.; Tsumura, T.; Nakata, K.; Li, C.J. Microstructural Analysis and Photocatalytic Activity of Plasma-Sprayed Titania-Hydroxyapatite Coatings. J. Therm. Spray Technol. 2007, 16, 776–782. [Google Scholar] [CrossRef]
- Liu, Y.; Yang, Q.; Wei, J.H.; Xiong, R.; Pan, C.X.; Shi, J. Synthesis and photocatalytic activity of hydroxyapatite modified nitrogen-doped TiO2. Mater. Chem. Phys. 2011, 129, 654–659. [Google Scholar] [CrossRef]
- Liu, W.; Huang, Y. Effect of protein content in fish scales on size and distribution of prepared hydroxyapatite pellets. Mingjiao Kexue Yu Jishu 2013, 33, 124–128. (In Chinese) [Google Scholar]
- Liu, W.; Li, G.; Miu, Y.; Chen, J. Research status and application prospect of fish scales. J. Hydrol. 2006, 26, 20–23. (In Chinese) [Google Scholar]
- Duan, R.; Zhang, J.; Du, X. The composition, properties and utilization of fish scale. Food Mach. 2006, 22, 128–131. (In Chinese) [Google Scholar]
- Ji, S. Study on the Extraction of Hydroxyapatite and Collagen in Ionic Liquid form Crucian Carp Scales; Tianjin University of Science and Technology: Tianjin, China, 2019; p. 61. (In Chinese) [Google Scholar]
- Hussain, S.; Sabiruddin, K. Effect of Heat Treatment on the Synthesis of Hydroxyapatite from Indian Clam Seashell by Hydrothermal Method. Ceram. Int. 2021, 47, 29660–29669. [Google Scholar] [CrossRef]
- Khamkongkaeo, A.; Boonchuduang, T.; Klysubun, W.; Amonpattaratkit, P.; Chunate, H.; Tuchinda, N.; Pimsawat, A.; Daengsakul, S.; Suksangrat, P.; Sailuam, W.; et al. Sintering Behavior and Mechanical Properties of Hydroxyapatite Ceramics Prepared from Nile Tilapia (Oreochromis Niloticus) Bone and Commercial Powder for Biomedical Applications. Ceram. Int. 2021, 47, 34575–34584. [Google Scholar] [CrossRef]
- Liu, Y.; Liu, M.; Ji, S.; Zhang, L.; Cao, W.; Wang, H.; Wang, S. Preparation and Application of Hydroxyapatite Extracted from Fish Scale Waste Using Deep Eutectic Solvents. Ceram. Int. 2021, 47, 9366–9372. [Google Scholar] [CrossRef]
- Kato, K.; Kobayashi, F.; Xin, Y.; Nakagawa, S.; Nishikawa, H.; Shirai, T. HAp/TiO2 heterojunction catalyst towards low-temperature thermal oxidation of VOC. Mater. Res. Express 2022, 9, 020007. [Google Scholar] [CrossRef]
- Yuan, X.; Du, H.; Sun, Q.; Sheng, J. Extraction of hydroxyapatite nano-particles from fish scales. Guisuanyan Xuebao 2004, 32, 1256–1259. (In Chinese) [Google Scholar]
- Chung, R. Study of Hydroxyapatite Nano Composites with Photoluminescence Properties. Biomed. Eng. 2011, 23, 107–112. [Google Scholar] [CrossRef]
- Chen, Z.; Wang, J.; Chen, N.; Liu, S.; Wang, T. Temperature Characteristics of Fluorescence Spectra of Cadmium Selenide Quantum Dots Coupled with Hydroxyapatite. Zhongguo Jiguang 2020, 47, 187–194. [Google Scholar]
- Shi, P.; Liu, M.; Fan, F.; Yu, C.; Lu, W.; Du, M. Characterization of natural hydroxyapatite originated from fish bone and its biocompatibility with osteoblasts. Mater. Sci. Eng. C 2018, 90, 706–712. [Google Scholar] [CrossRef] [PubMed]
- Han, J.Y.; Bark, C.W. Influence of the calcination temperature on the structure and optical properties of Bi3.25La0.75CoTi2O12 powders. J. Nanoelectron. Optoelectron. 2015, 10, 163–167. [Google Scholar] [CrossRef]
- Kończak, M.; Huber, M. Application of the engineered sewage sludge-derived biochar to minimize water eutrophication by removal of ammonium and phosphate ions from water. J. Clean. Prod. 2022, 331, 129994. [Google Scholar] [CrossRef]
Disclaimer/Publisher’s Note: The statements, opinions and data contained in all publications are solely those of the individual author(s) and contributor(s) and not of MDPI and/or the editor(s). MDPI and/or the editor(s) disclaim responsibility for any injury to people or property resulting from any ideas, methods, instructions or products referred to in the content. |
© 2023 by the authors. Licensee MDPI, Basel, Switzerland. This article is an open access article distributed under the terms and conditions of the Creative Commons Attribution (CC BY) license (https://creativecommons.org/licenses/by/4.0/).