Article

Investigation of Rainfall-Induced Failure Processes and Characteristics of Wedge Slopes Using Physical Models

1
Department of Civil Engineering, National Yang Ming Chiao Tung University, Hsinchu 30010, Taiwan
2
Department of Civil and Disaster Prevention Engineering, National United University, Miaoli 360302, Taiwan
*
Author to whom correspondence should be addressed.
Water 2023, 15(6), 1108; https://doi.org/10.3390/w15061108
Submission received: 8 January 2023 / Revised: 25 February 2023 / Accepted: 9 March 2023 / Published: 14 March 2023

Abstract

:
In this study, we conducted small-scale physical modeling tests to consider the impact of the infiltration of rainfall in order to investigate the processes involved in wedge slope deformation and failure. The experiments were conducted under controlled conditions of the intersection angle and half-wedge angle. The observations obtained during each stage of deformation and failure were used to explain how gravity deformation varies on wedge slopes and infer how rainfall influences slope failure. The results indicated that half-wedge angle is a crucial factor in the deformation failure of slopes. The failure mechanisms of small-intersection angle slopes (sliding model) differ considerably from those of large-intersection angle slopes (free falling or toppling model). The infiltration of surface water can have a significant influence on rock layer deformation and the speed of failure. Details of the failure characteristics of wedge slope models were discussed in this paper.

1. Introduction

Extreme weather events in recent years have greatly increased the amount of rainfall in the mountains of Taiwan. Substantial rainfall affects rock slope safety by infiltrating rock slopes via weak planes, thereby weakening the shear strength of the slope body, raising the water table, and increasing the weight and downslide stress of the soil. This, in turn, causes parts of the rock slopes to deform and collapse. The fragile geological environment and heavy rainfall conditions in Taiwan make for frequent landslide disasters, mostly around mountain roads, villages, and valley banks. Large-scale rockslide disasters in the past include the complex landslide in Tuchang Village, Hsinchu in 2004, the collapse event at 3.1 km on National Freeway No. 3 in 2010, and the complex landslide in Zhongzhi Village, Wulai in 2016, all of which greatly threatened protected targets downstream. Rock slope failure is generally determined by the discontinuities between strata, such as bedding, faults, foliation, and joints [1]. Prior to rock slope failure and creep deformation, tension cracks can generally be observed developing at the top of the slope, affecting it or causing the rocks on the slope toe to overturn or bulge. The damage gradually extends upwards toward important public facilities or villages, and if the scope of the creep damage is not determined and protective measures are not taken in a timely manner, major disasters may occur. In addition to enhancing emergency responses to landslides, disaster warnings for evacuation are also crucial to minimize losses. Model tests, numerical simulations, and real-time deformation monitoring are thus employed to grasp rock slope deformation, the timing of failure, and the hazard ranges of rock failure and deposits. These are all important issues in rock slope disaster prevention [2,3,4,5,6,7,8].
Wedge failures are a common type of failure in rockslides, and mostly occur where the strata have an oblique attitude [9]. Most wedge failures take place in rock masses via the following methods [10]: (a) sliding along the line of intersection of the two planes, (b) sliding along only a single plane accompanied by rock mass fracturing, (c) rotation and sliding along only a single plane accompanied by rock mass fracturing, and (d) if the rock mass has a high joint density, gradual disintegration of the rock mass along two planes. A number of studies have examined the issue of rock wedge stability [1,2,4,5,9,11,12,13,14,15,16] and also pointed out that wedge failure is related to its intersection angle and half-wedge angle, but they did not consider the three-dimensional rock slope state. Hoek and Bray [9] proposed the rigid wedge method (RWM), which assumes that the wedge is a rigid body and ignores shear forces that intersect perpendicular to the discontinuities. It is assumed to be zero in the slope stability analysis, and RWM does not consider the deformation of the rock mass itself. Kovari and Fritz [17] considered the influence of static and dynamic loads on wedge models and used model tests and numerical methods to assess the applicability of the limit equilibrium method to wedge slopes. Riquelmea et al. [6] used Slope Mass Rating (SMR) to characterize the wedge failure mechanism found through 3D point cloud analysis. Grenon and Hadjigeorgiou [3] proposed a methodology for linking a fracture system model to limit equilibrium and analyze the wedge failure. Smith and Arnhardt [18] proposed the circle method, which can assess the sliding and toppling mechanisms of individual planes and pairs of planes forming wedges. Model verifications were conducted using real-world data from Turkey and Japan, and the influence of dynamic loads on slope stability in earthquake-prone areas was analyzed and discussed using parameter back-calculation. Kusmar et al. [14] designed four types of test models in their study: static tests, dynamic tests, dry tests, and wet tests. Although these tests conformed to the limit equilibrium method, they could not accurately reflect the behavior of wedge slopes for the following reasons:
(a)
The two-dimensional limit equilibrium method cannot describe the behavior of real three-dimensional wedge slope failure;
(b)
Rock wedges are composite materials with both joints and weak planes, so an analysis with a single rigid body model cannot completely describe its physical behavior;
(c)
The material parameters and variability of rock masses are complex and cannot be described using a single material; thus, the limit equilibrium method cannot express the influence of weak planes in the slope on failure characteristics.
To fill these gaps, this study examined the distributions of discontinuities and changes in intersection planes and angles in various types of oblique slopes, developed moderately simplified physical models, and used these models to investigate the deformation of wedge slopes until failure under conditions of rainfall infiltration. The factors of wedge failure caused by rainfall include rise in groundwater level (increase in water pressure), decrease in effective stress and frictional resistance, failure caused by seepage of weak surface of rock mass, etc. The softening of weak interlayers is also an important factor in rainfall-induced landslides. Xu et al. [8] used nanoindentation experiments and simulations to study the softening of weak interlayers during landslides. The results of the study found that the friction angle of shale was almost unchanged after immersion in water, while the elastic modulus and cohesion decreased significantly. The shear strength of the weak interlayer decreased significantly, and the plastic zone developed along the weak interlayer, eventually forming a landslide. However, because of the complexity all the factors, the establishment of more complex physical models or numerical models has its limitations, and it is difficult to deeply understand the characteristics influencing each factor. Therefore, in this study, we only moderately simplified the wedge failure model of the rock slope, and first discussed the shear strength weakening characteristics of the discontinuity of the rock mass, assuming that the shear strength weakening of the discontinuity occurs in the entire rock mass during the rainfall period. In order to initially grasp the failure behavior under different wedge slope conditions, other factors will be gradually explored in the future.

2. Methodology

2.1. Introduction to Study Area

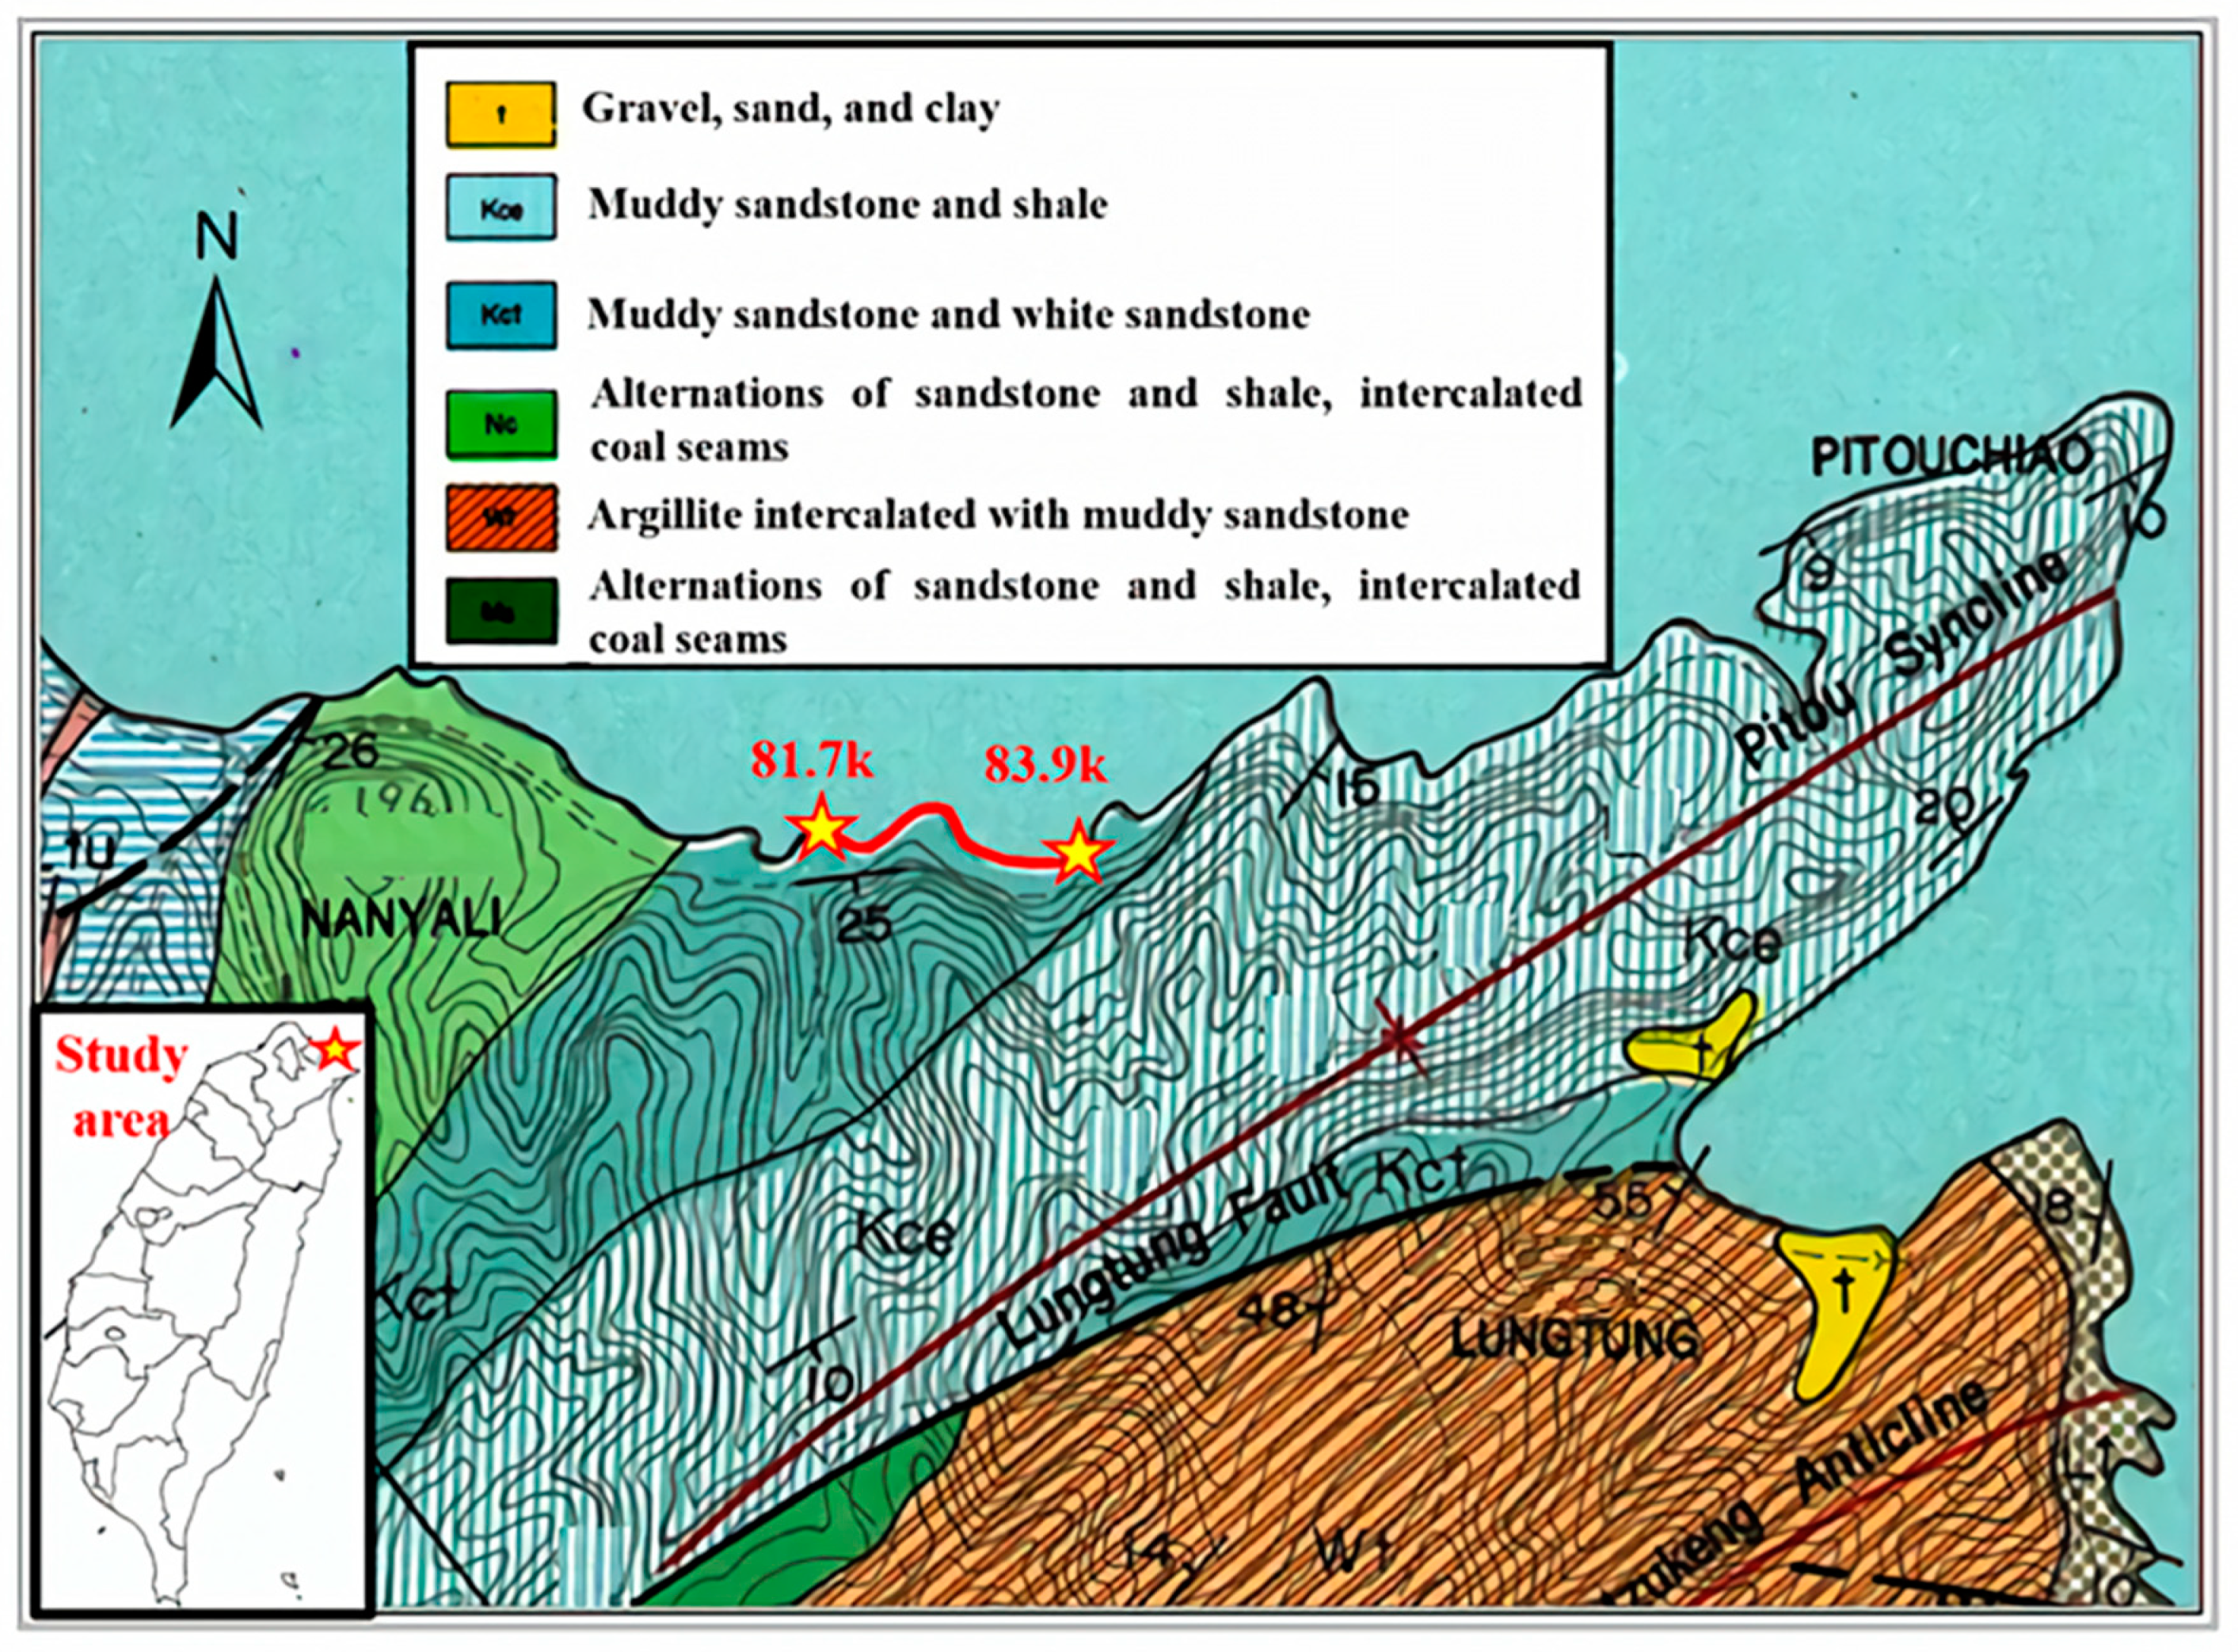
The study area is located between 81.7 km and 81.9 km and at 83.9 km of Provincial Highway No. 2 in Nanyali of Ruifang District, New Taipei City, Taiwan. In terms of geological conditions, the section from 81.7 km to 81.9 km belongs to the Dapu section of the Kueichoulin Formation, which mainly consists of muddy sandstone and white sandstone and is on the west wing of the Pitou Syncline, which strikes northeast–southwest. The 83.9 km location belongs to the Erjiu section of the Kueichoulin Formation, which mainly consists of muddy sandstone and shale (Figure 1). The abundance of vertical joints has created steep rock faces and, on the northeast coast, many of the rock faces are concave due to differential erosion caused by the ocean wind in the muddy sandstone. The shale is often eroded, leaving the sandstone in the upper portion suspended without support. Consequently, the Ruifang section of Provincial Highway No. 2 is prone to rockfalls and wedge sliding after heavy rain or earthquakes, which severely threatens the safety of road users (Figure 2). According to field surveys, there are three primary sets of joint planes in Nanyali. Stereographic projections show that two of the weak planes intersect, and the exposure of intersection lines on the slope surface can easily lead to wedge failure. We found six intersection lines in the study area, and four intersection points were exposed. The plunge at the points where Joint 1 intersects with Joints 2 and 3 is between 60° and 64°, and the plunge of the intersection point of Joints 2 and 3 is approximately 38° (Figure 3). On-site observations revealed that the average slope below Provincial Highway No. 2 was around 30°, whereas most of the upper slopes were steep and near 90°. Due to the three joint sets, many collapses have left V-shaped rock formations with talus cone deposits below them. According to Figure 1, the geological composition of this area is a combination of muddy sandstone and white sandstone. Because of insufficient support from below, wedge-shaped masses formed by Joints 2 and 3 slide along the intersection line. The intersection angle seen onsite is roughly 40°, and triangular rock masses are left behind (Figure 2). Field surveys show that approximately 30% of the wedge slopes are controlled by Joints 1 and 2; roughly 30% are controlled by Joints 1 and 3, and about 40% are controlled by Joints 2 and 3. The dip angles of the wedge slopes mainly controlled by Joint 1 are steeper, at about 60°. The intersection angles of the wedge slopes controlled by Joints 2 and 3 are close to 40°. Thus, this study simplified the site conditions and designed 7 physical models to carry out related experiments. The intersection angles include 40°, 60°, and 70°, and the half-wedge angles include 25°, 45°, 60°, 75°, eccentricity, etc., and their conditions are similar to the field wedge rock mass.

2.2. Design of the Physical Model

We simplified on-site conditions to design simulation tests. A stainless-steel platform was used to simulate the intersection angle and wedge angle of the wedge masses. Both Zhang et al. [7] and Bowa et al. [19] pointed out that the main cause of wedge instability is the water pressure caused by gravity. When the rock slope is affected by rainfall infiltration, the uplift forces acting along the joint planes increase, and can lead to rapid deterioration of the stability of rocky slopes and wedge sliding. Thus, a sprinkler was installed above the platform to simulate rainfall. The rainfall caused surface water that gradually infiltrated the rock mass, affecting the stability of the model and ultimately leading to slope failure. The physical model of the rock mass comprised grinding stone and resin to simulate sandstone and shale, respectively, that weaken upon encountering water. Although these models do not represent complex full-scale cases, they are sufficient for the analysis of wedge slope failure.
In the design of the physical models, we first investigated and generalized the morphology of wedge slope failures in Nanyali. Based on the obtained morphological characteristics, we determined the adjustable variables needed for the platform, including the half-wedge angle (ω) between two discontinuities and the wedge intersection angle (ia). The platform has two major parts that can be adjusted (Figure 4). The first part is the half-wedge angle. The angles between the two discontinuity steel plates on the sides and the normal line can be adjusted from 0° to 90°. The steel plates on the sides can move freely, which means that the angles between the two steel plates and the normal line do not have to be identical; simulations can have designs in which ω 1 ω 2 (unique conditions in which the two half-wedge angles are not the same). The second part is the wedge intersection angle. Two apparatuses on the sides can be used to adjust the intersection angle, the range of which is between 10° and 90°, to simulate gentle to steep slopes.
To ensure that the influence of the rainfall simulated by the sprinkler remained consistent for all the tests, we did not adjust the height, position, or support of the sprinkler and fixed the rainfall intensity at 150 mm/h.

2.3. Simulation Rock Materials

The rock slopes in the study area near Nanyali mainly consist of thick white-gray layers or fine-to-medium-grained blocks of sandstone occasionally interbedded with thin layers of shale. Most of the rocks deposited onsite are shaped like triangular prisms. Thus, after comparing on-site rock wedges with our physical model, we found that grinding stones in the shape of triangular prisms were similar to the on-site sandstone. Thus, we chose triangular grinding stones to represent the sandstone material. Resin has characteristics similar to those of the interbedded shale or muddy material. When it encounters water, it weakens the strength of the simulated rock mass, accelerating the failure of the model. This helped us simulate the behavior of rocks infiltrated by rain. In the test models, we arranged layers of triangular grinding stones and then stacked them to form a wedge. Polyvinyl acetate (resin) was applied between the grinding stones and layers as an adhesive to create an oblique slope structure (Figure 5). We kept the amount of resin in the rock mass to 8 mm3 per layer and 2 mm3 between layers. This ensured the water weakened the planes between layers in the oblique slope to reflect the failure behavior of discontinuities. The physical model thus reflects the failure characteristics of discontinuities (weaker strength). Additionally, we assumed that the intact rock was the undamaged material during the test, and the rock mass failure mainly occurred at the discontinuous position between the rock blocks. The two supports in the upper portion of the platform were both stainless-steel plates, which have smooth surfaces and little friction. We therefore glued the model to the test platform using sandpaper and clamped the sandpaper to the surfaces of the stainless-steel plates to increase the friction between the two. The bottom bases of the models were kept within 15 cm × 25 cm. Before each test, the triangular grinding stones were kept fixed and dry; the resin in the model was left to dry for 5 to 7 days. The purpose was to keep the sizes and strength properties of the models consistent. The details about the rock slope material properties are listed in Table 1.

2.4. Physical Model Test Items

Based on field surveys and inductive analysis, we used physical models to change the characteristics of ω and ia and designed different test items to examine the process and characteristics of wedge failure. We focused on three variables (angle ia, angle ω, and the eccentricity of angle ω) to construct 7 physical models (see Table 2). We also altered the direction of the oblique slope for preliminary observation of the influence of the oblique direction on rock wedge failure.

3. Failure Processes of Physical Wedge Models

Rainfall intensity was controlled at 15 mm/h for constant surface water infiltration conditions. We varied ia, ω, the eccentricity of ω, and the oblique direction while observing the processes and behavioral characteristics of wedge failure in the oblique slope under rainfall and slope toe daylight conditions. The primary conditions of Model A were ia = 40° and ω1 = ω2 = 25°, and the duration of the test was 12 h 27 min 55 s. The test procedure is depicted in Figure 6. In the initial stage, the initial resting state before the rainfall began, the oblique slope strata were inclined towards the left plate, and none of the rocks showed any signs of displacement or deformation. After the test started, the model began to soften from the water, and then, because of its own weight, further softened and deformed. The rock at locations No. 6 and No. 7 (close to the left plate) showed signs of dislocation and deformation. The model gradually slid downwards along the weak plane along the left plate. Some of the rock where the slope toe daylighted (locations No. 9 and No. 10) fell. This stage is mainly characterized by local slope failure (00:00:00–02:36:44) followed by the development of wedge failure (02:36:45–08:02:20). Because of surface water infiltration and the weakening of the strata at locations No. 4–10, approximately 17% of the lower portion of the entire rock mass slid downward, and tension cracks appeared in the upper portion of locations No. 5–9. The tension cracks allowed surface water to infiltrate the model even more easily, thereby accelerating the collapse of the lower portion of the rock. Once some of the rock in the lower portion of the model collapsed, the daylighting of the slope toe caused the upper portion of the rock mass to slide down along the intersection angle. The tension cracks near the top of the slope gradually progressed towards the source, enlarging the wedge failure range. The final stage is the accelerated development of rock mass sliding (08:02:21–12:27:55). Following the collapse of the lower portion of the rock mass, the surface water continued to infiltrate deep into the rock mass, causing tension cracks to form at the source and deeper within the rock. Thus, the lower portion of the rock mass continued to deform and collapse. With progressive wedge failure, tension cracks began appearing in multiple places along the left and right plates and developing along the sides. Ultimately, around 30% of the center of the rock wedge and fell along the intersection line, and only a small-scale collapse took place instead of complete wedge failure.
The duration of the Model B (ia = 40° and ω1 = ω2 = 45°) test was 12 h 26 min 23 s (Figure 7). At first (initial slight deformation stage at 00:00:00–01:29:00), surface water infiltrated the model via weak planes, softening the model and causing slight deformation. At locations No. 2 and No. 3, tension cracks could be seen at the slope toe. In this stage, the model only presented slight deformation toward the left plate with no significant displacement. At 01:29:01–04:32:30, the entire model gradually moved downhill. Tension cracks appeared at the slope toe at location No. 2, and after the rainfall continued for an hour, the slope toe at locations No. 1–4 slowly slid, creating local tension cracks. Apparent bulges could be seen where the slope toe daylighted, and deformation was more significant at the slope toe on the left plate of the model than that on the right plate (continued development of slight deformation). During this stage (slope stabilization at 04:32:31–12:26:23), the rocks at locations No. 6–12 stabilized and showed no signs of deformation. The tension cracks at the slope toe of locations No. 2 and No. 3 continued to develop, and small-scale collapses took place. However, there were no significant deformations or tension cracks in the overall rock mass. Before the end of the test, the rock wedge had not slid significantly and remained stable after 05:56:13.
Model C (ia = 40° and ω1 = ω2 = 60°) was tested for about 10 h 53 min 51 s (Figure 8). During the initial deformation stage (00:00:00–06:15:57), the model began to soften from the infiltrating surface water, and then, because of its own weight, began to deform, and some tension cracks appeared on the surface. Because of the progression of tension cracks, the daylighting of the slope toe at locations No. 8–10 caused some of the rock to fall. Because of the continued influence of surface water infiltration and gravity, the rock wedge slowly slid along the intersection line. Local tension crack development continued on the slope, accelerating the infiltration of surface water and weakening the strength of the rock. This stage is characterized by the sliding of the entire rock mass (06:15:58–08:26:51). As the duration of surface water infiltration increased, the resin at the bottom on the left and right plates gradually lost its shear strength. Ultimately, the entire rock wedge began to slide along the intersection line because of its own weight, and only 5% of the rock remained on the slope (08:26:52–10:53:51). The test conditions of model D (ia = 40° and ω1 = ω2 = 75°) and model C were similar (Figure 9), both ω1 and ω2 exceeded 50 degrees, and only the failure time of the test model was different. In the initial sliding stage (00:00:00–00:56:55), the model began to soften from the infiltrating surface water, and then, because of its own weight, the entire rock wedge began sliding toward the slope toe. As the surface water continued to infiltrate the rock wedge, the surface of the rock showed no apparent tension cracks. However, the strata in the oblique slope were inclined toward the left plate, which caused most of the surface water that had infiltrated the rock mass to flow through the strata on the right plate toward the left plate. Consequently, the rock on the right plate of the mode gradually weakened, resulting in twisting, deformation, and sliding (00:56:56–01:56:51). Then, the bottom of the rock wedge gradually lost its shear strength. Ultimately, the entire rock wedge began to slide along the intersection line and the two intersection planes because of its own weight, and only 10% of the rock remained on the slope (01:56:51–02:37:39).
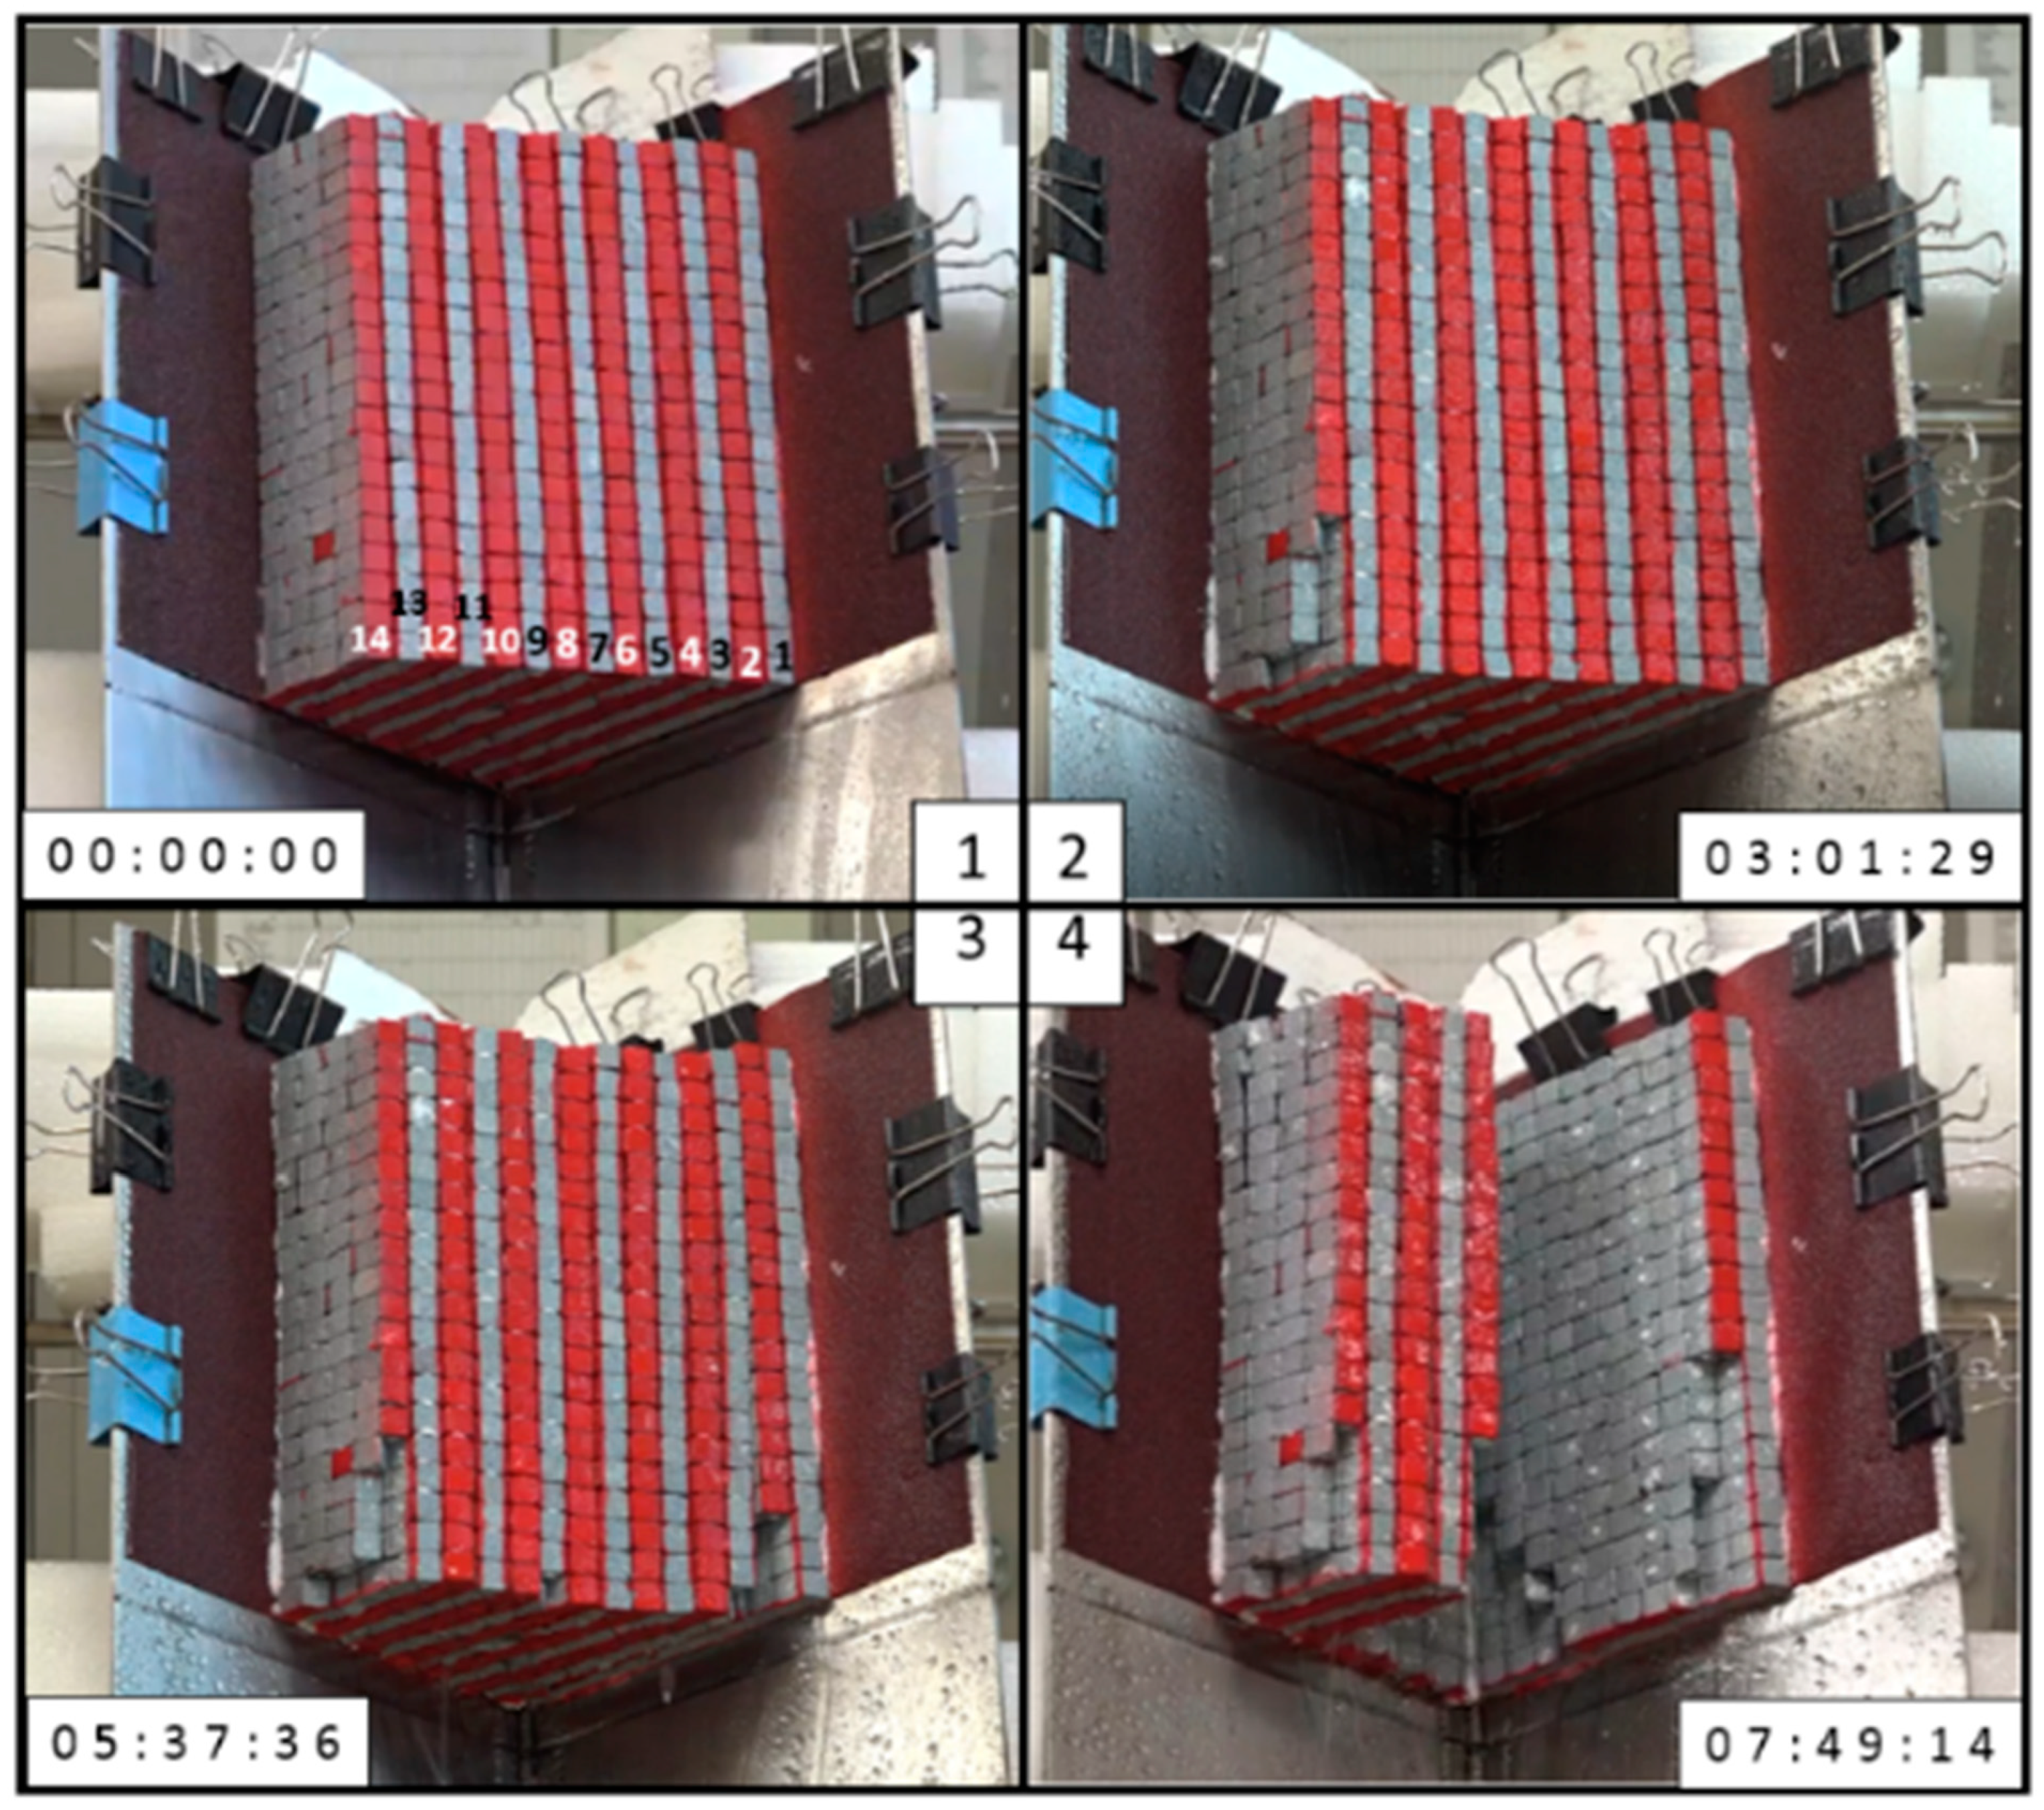
The primary conditions of Model E were ia = 70° and ω1 = ω2 = 25°, and the duration of the test was 3 h 24 min 03 s (Figure 10). At the first stage (the initial deformation stage; 00:00:00–01:44:39), the model softened because of rainfall infiltration, and the greater intersection angle meant that gravity exerted a greater impact on the model. Significant deformation was observed after 20 min of rainfall. The weak planes in the oblique slope were inclined towards the right plate, and, as a result, soon after the surface water had infiltrated the model, the surface layer at the slope toe on the right plate (locations No. 7–10) showed local collapses and toppling failure. During the second stage (the local rock mass failure stage; 01:44:40–03:14:12), as some of the rock at the slope toe on the right plate collapsed, the rock on the right plate also became unstable, gradually resulting in wedge failure. Approximately 30% of the rock wedge slid and collapsed along the slope, greatly reducing the support below the rock mass on the right plate. Losing its support on the right, the entire rock wedge relied on the rock on the left plate and the intersection line for support. Then, as the duration of surface water infiltration increased, gravity and the weakening of the rock near the left led to gradual leaning and deformation. Subsequently, the rock in the back collapsed and toppled on a large scale along the intersection line, and only 5% of the rock remained on the slope. The duration of the Model F (ia = 70° and ω1 = ω2 = 45°) test was 7 h 49 min 14 s (Figure 11). At the first stage (the initial slope deformation stage; 0:00:00–1:30:44), the model softened because of surface water infiltration, and the greater intersection angle meant that gravity exerted a greater impact on the model. The model thus deformed and shifted toward the slope toe, and some of the rock at location No. 14 collapsed. The weak planes in the oblique slope were inclined towards the right plate, and the surface water could easily infiltrate and reach the weak places from above, resulting in weakening and failure on the surface on the right plate. At the local rock mass failure stage (1:30:45–5:37:36), rocks continued to fall at location No. 14. Because of gravity and surface water infiltration, the center of the model deformed and tilted forward. Local collapses were caused at locations No. 1–3, causing the deforming and forward-tilting slope toe at locations No. 3–9 to lose some of its support at the wings. After an hour of rainfall, the rock at locations No. 3–9 continued to deform and tilt forward. After four hours of rainfall, the forward-tilting rock became an independent mass on the verge of collapse. With the continuing infiltration of rainfall and the steep intersection angle, this mass eventually toppled. After the rock at locations No. 3–9 lost its support on the sides, the mass toppled. The remaining rock on the right plate also gradually toppled towards the intersection line, ultimately leaving only about 20% of the rock on the slope (5:37:37–07:49:14).
The primary conditions of Model G were ia = 60°, ω1 = 40°, and ω2 = 10°, with two eccentric half-wedge angles, and the duration of the test was 3 h 24 min 03 s (Figure 12). At the initial deformation stage under conditions of surface water infiltration (00:00:00–02:19:25), the model’s center of gravity was on the left plate (the side with a gentler slope), where ω was greater. In addition, the greater intersection angle meant that gravity exerted a greater impact on the model from the onset. As the surface water continued to infiltrate the model, it began to weaken and gradually deform and slide toward the toe on the left plate, leaving most of the rock on the left plate under compression, while most of the rock on the steep right plate was under tension. Before the midpoint of the test, rock continued to fall from the bottom of the model, resulting in local vertical torsion and displacement at locations No. 2 and No. 3. Weakened by water, the entire tock mass gradually slid and deformed. Next, the overall model reached the stage of local rock mass failure (02:19:26–02:33:32). Vertical torsion and displacement continued at locations No. 2 and No. 3 until tension cracks developed at location No. 8 (the cracks parallel to the intersection angle). The rock at locations No. 3–7 then lost its support on the sides, causing the rock mass to slide downwards along the intersection line, and only approximately 35% of the rock remained on the slope. The last stage is characterized by the rock wedge sliding and acceleration of the failure (02:33:33–04:00:51). After the collapse of the center rock mass, the rock at locations No. 9 and No. 10 remained on the slope. However, due to the loss of the rock on the intersection line, the rock remaining on the right plate gradually toppled toward the intersection line. The remainder of the rock was also softened by the infiltrating surface water and collapsed. Afterwards, approximately 15% of the rock remained on the right plate. The failure behaviors displayed by the entire rock wedge included sliding (gentle slope on left plate), collapsing, and toppling (steep slope on right plate).

4. Discussion

4.1. Comparison of Physical Models

4.1.1. Influence of Small ia and Changing ω

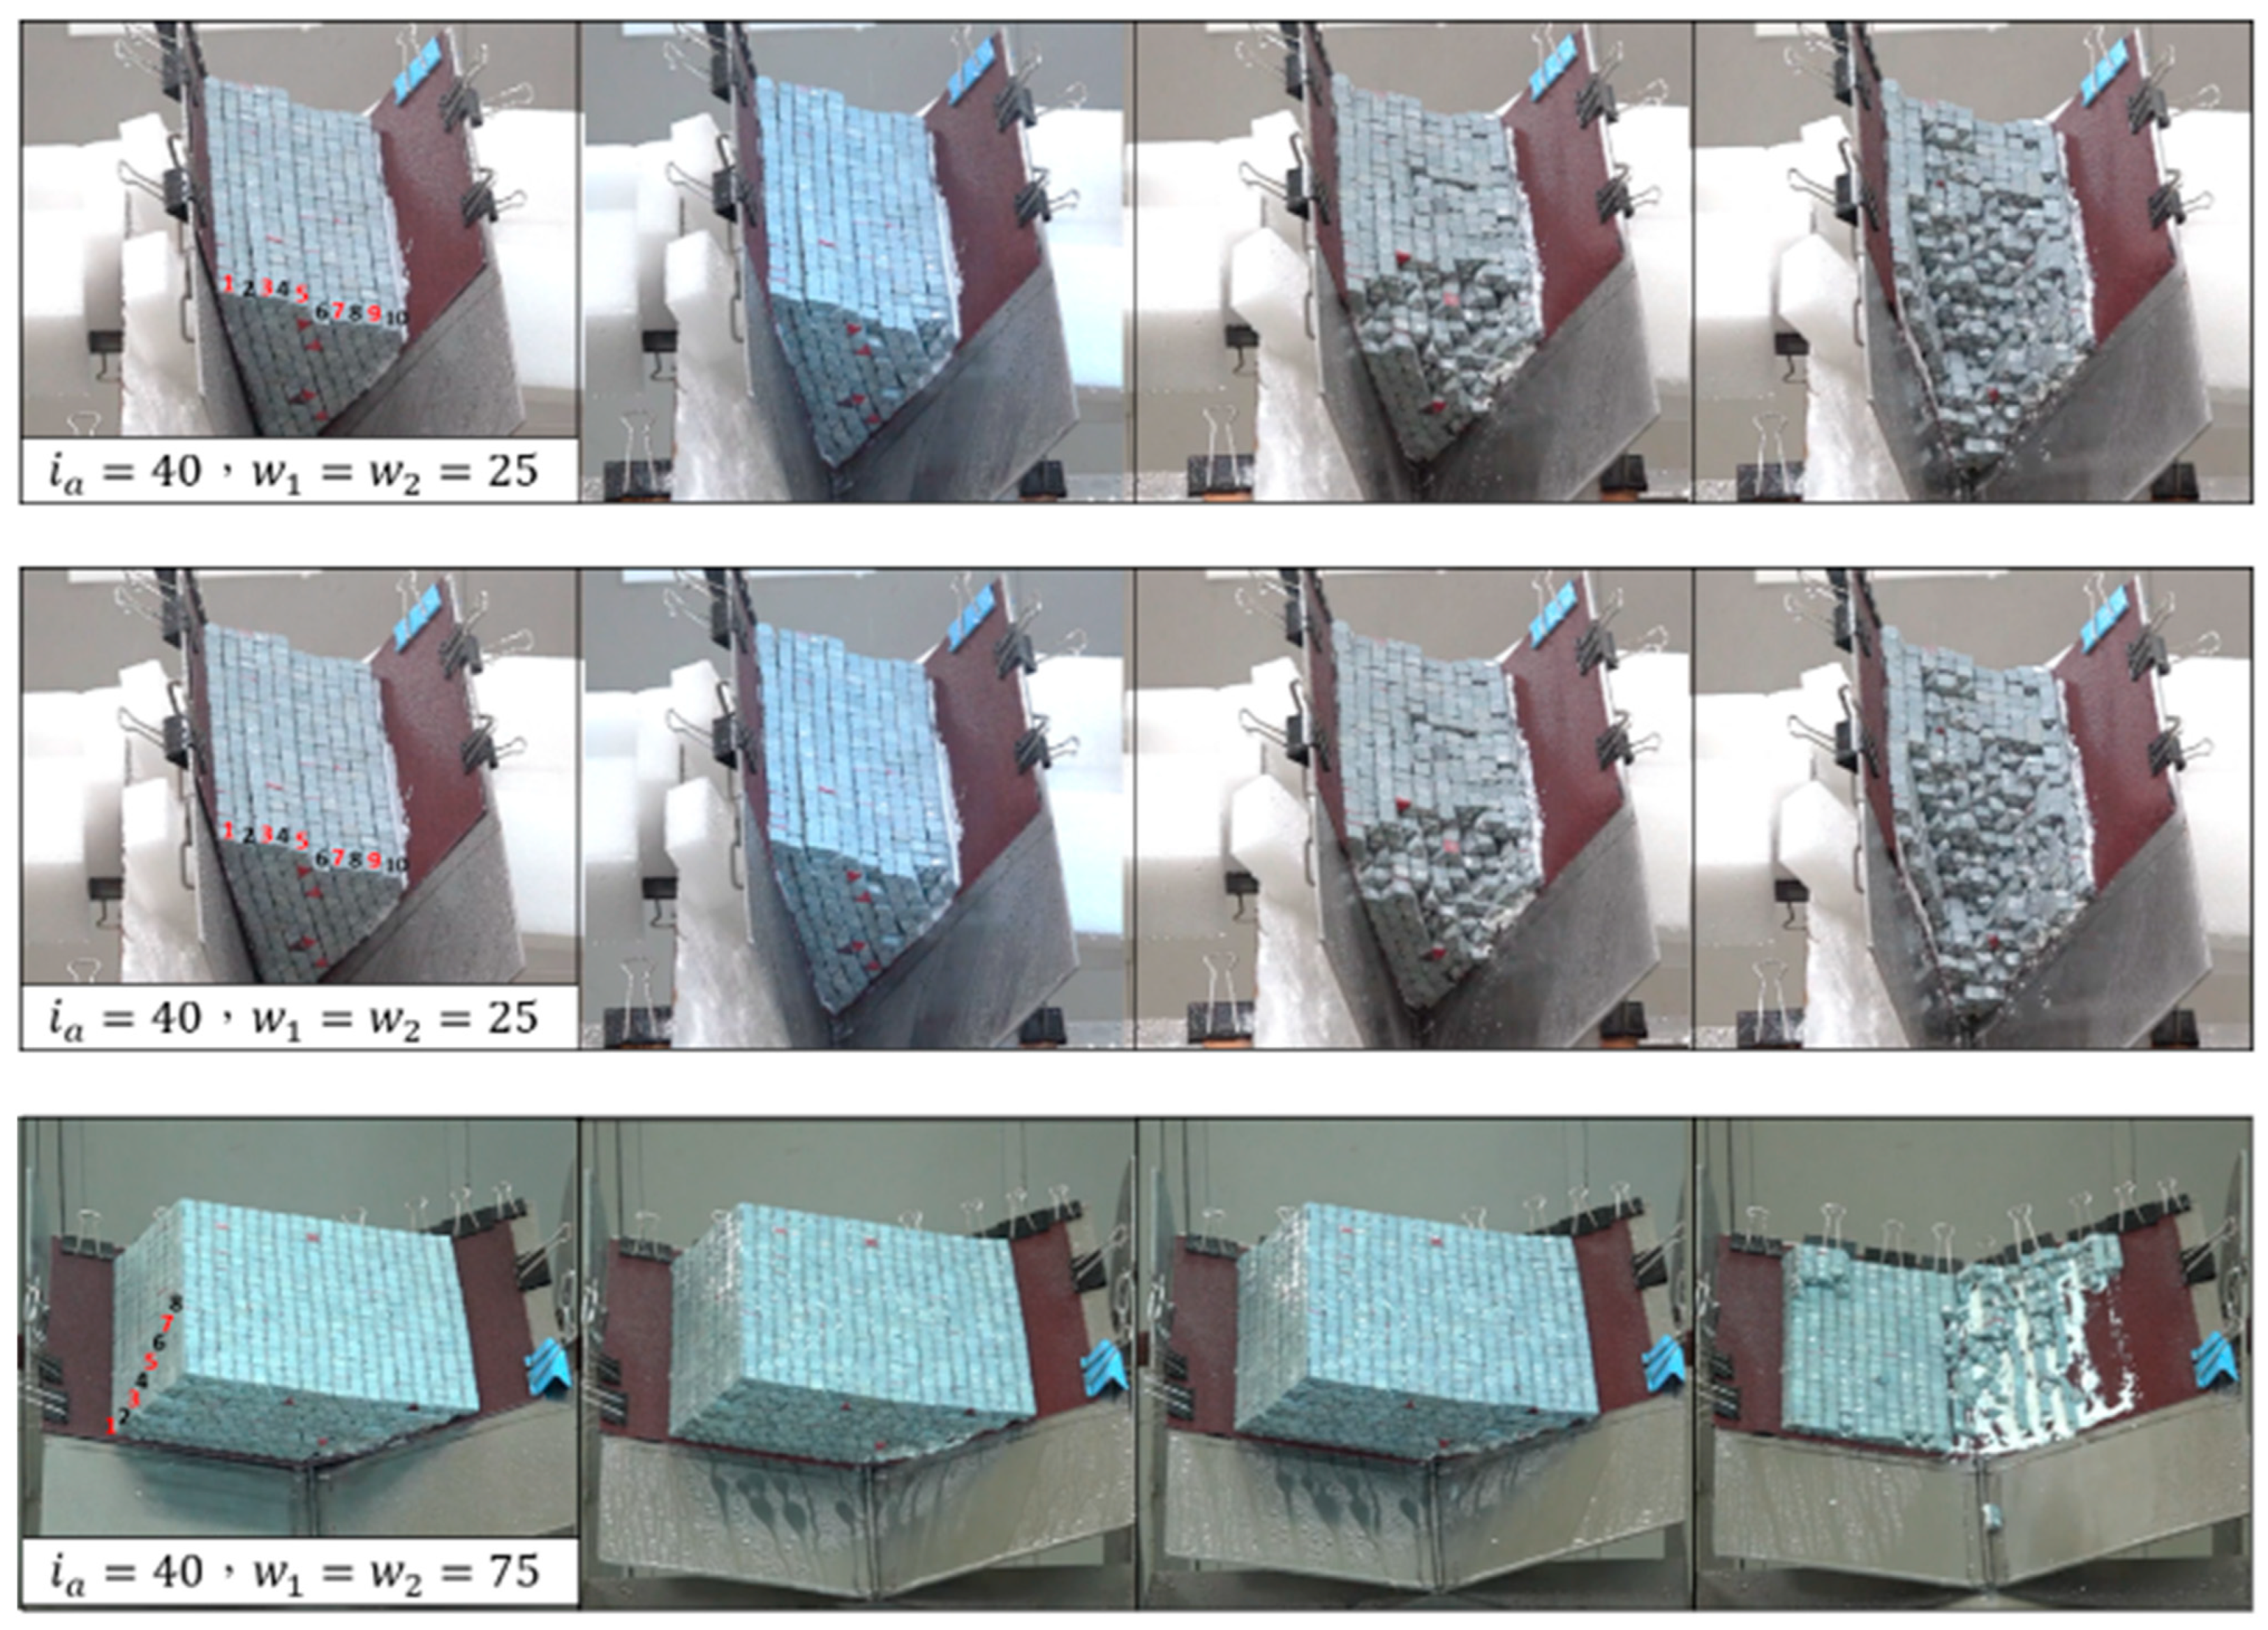
Comparison of the test results with ia fixed at 40° and different ω (Figure 13) revealed that the failures in the models with smaller ω mainly began at the slope toe and gradually progressed towards the source until wedge failure took place. The final failures were shallower in depth. In the model with ω = 60°, collapses initially only took place where the slope toe daylighted, and the surface of the rock showed deformation and tension crack development. In the end, the entire rock wedge collapsed. In the model with ω = 75°, the rock displayed no significant deformation or crack development. Total rock wedge failure took place within a short period of time, and the characteristics were similar to those of planar failure.
A comprehensive comparison of the three tests showed that with a small ia, the failure behavior resulting from a smaller ω produced relatively higher stability and shallower failure depth because of the two discontinuities on the sides, and this is categorized as progressive wedge failure. In contrast, a larger ω resulted in greater failure depth and a larger sliding rock wedge. Additionally, most of the sliding followed the intersection line and planes, and the wedge failure behavior was similar to planar sliding. Clearly, under small ia, the influence of ω on wedge failure characteristics was significant, and failure behavior varied significantly with ω. From a mechanical point of view, the change in the half-wedge angle mainly affected the mechanical properties of wedge rock mass confining pressure. The lower half-wedge angle led to larger confining pressure in the wedge rock mass, which made the resin between the discontinuities in the rock mass more easily damaged by soaking and softening under rainfall conditions. Additionally, the failure behavior of the rock mass was similar to the progressive failure: the damage was first concentrated at the slope toe of the wedge rock mass, and then gradually failed towards the top of the slope. Therefore, under the condition of high confining pressure (the smaller half-wedge angle condition), the failure behavior of this kind of wedge rock mass is characterized by discontinuity, which mainly controls its failure characteristics. However, under the condition of larger half-wedge angles (smaller confining pressure), since the boundary constraints of the wedges on both sides are relatively small, the interface (or discontinuity at the bottom) of the wedge rock mass will dominate its overall failure characteristics. Therefore, its failure behavior is very similar to translation sliding.

4.1.2. Influence of Large ia and Changing ω

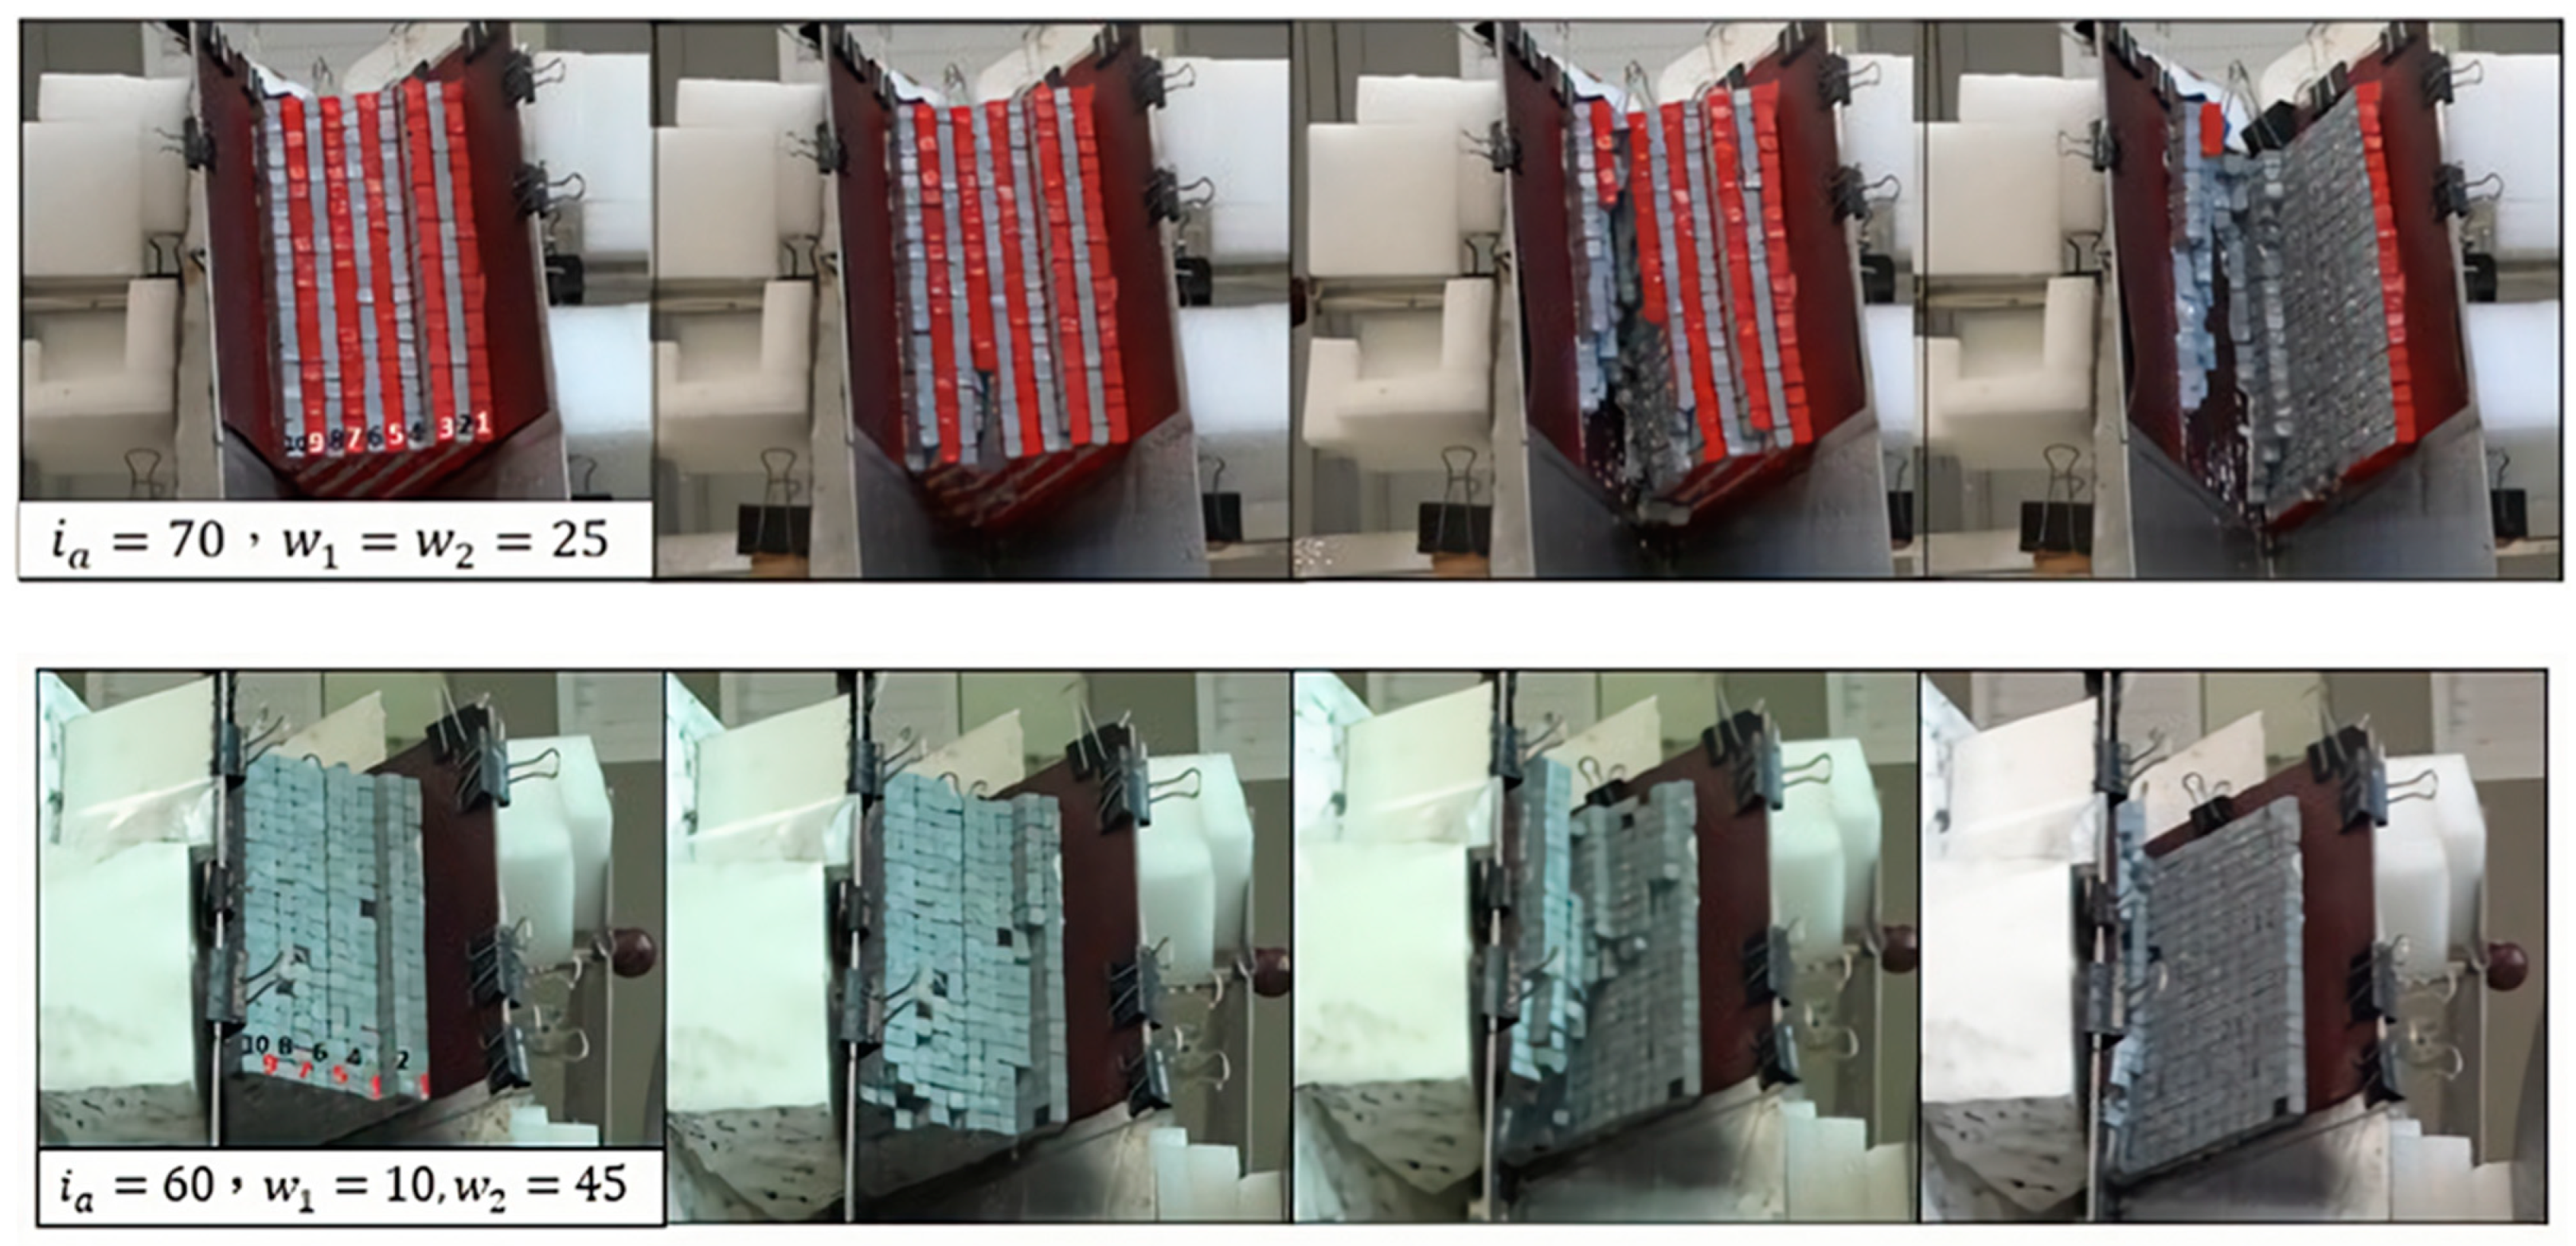
Comparison of the test results with ia fixed at 70° and ω equal to 50° and 90° (Figure 14) revealed that once some of the rock at the toe of the model with a smaller ω collapsed, the steep terrain caused the rock wedge to gradually deform and tilt forwards. After the partial collapse on the right plate and the loss of support, the rock on the left plate was also weakened by infiltrating surface water, resulting in the loss of support on both sides and inducing toppling failure. The model with the greater ω also gradually lost support on both sides, resulting in some of the rock in the middle deforming and tilting forward. In the end, the continuing rain led to toppling failure, and after the rock in the middle toppled over, the rock on the right plate along the intersection line also toppled over. Comparison of the two tests showed that because of the steeper inclination angle, the failure depths were significant in both tests, and the failures were similar in type. Clearly, under large ia, the influence of ω on wedge failure characteristics is smaller, and failure behavior is mainly determined by the extent of discontinuity erosion and the toppling and deformation characteristics of the rock. From the perspective of its mechanical mechanism, when the intersection angle reached 70 degrees, the change of its half-wedge angle (that is, the change of the confining pressure of the wedge rock mass) did not cause a significant impact on the failure mechanism. Both of them exhibited toppling failure characteristics under this condition, and both occurred in the intersection line range. Therefore, when the wedge rock mass reaches the topographical condition of the toppling, the discontinuous strength of the rock mass within the intersection line range is the main factor controlling the toppling failure.

4.1.3. Influence of Large ω, Small ω and Changing ia

Comparison of the test results with ω fixed at 45° and two ia (Figure 15) revealed that after the model with a greater ia was weakened by water, tension cracks developed swiftly, causing the rock in the middle of the model to deform and ultimately topple. Only a small portion of the rock fell in the model with a smaller ia, and no significant deformation or wedge failure took place during the test. Comparison of the two tests showed that toppling or falling was more likely with a greater ia due to gravity, whereas a smaller ia produced greater stability. In addition, most of the failure behavior involved the rock wedge sliding along the intersection line or plane. Comparison of the test results with ω fixed at 25° and two ia (Figure 16) revealed that the model with a smaller ia took longer to reach wedge failure. The tension cracks gradually developed towards the source, and the failure in the end was shallower. The result was similar to progressive wedge failure. Gravity exerted a greater impact on the model with a greater ia, and the common failure types were toppling and falling. A comparison of the two tests revealed a shallower failure depth in the model with a smaller ia, longer time to wedge failure, and greater overall stability than in the model with a greater ia. As far as its mechanical mechanism is concerned, when the wedge rock mass is in a small confining pressure state, the change of its intersection angle causes a significant difference in the failure mode of the rock slope, that is, sliding along the intersection angle and half-wedge face (at intersection angles less than 60 degrees, the failure is dominated by the discontinuity at the bottom), or toppling (at intersection angles greater than 60 degrees, the failure is dominated by the discontinuity strength near the intersection angle) failure behavior. Additionally, when the wedge rock mass is in a state of high confining pressure, it also has the same mechanical properties. That is, progressive failure occurs along the slope toe to the top of the rock slope (at intersection angles less than 60 degrees, the failure is mainly controlled by the discontinuity of the rock mass), or overturning (at intersection angles greater than 60 degrees, the failure is mainly controlled by the discontinuity strength near the intersection angle) failure behavior.

4.1.4. Influence of ω Eccentricity

Comparison of the test results with different ω (eccentric) and identical ω (Figure 17) revealed that the initial failure with identical ω is determined by the distribution of weak planes in the oblique slope and that the type of the failure is determined by ia. In contrast, the initial failure in the eccentric model with different ω is determined by the distribution of weak planes in the oblique slope as well as the slope of the terrain on the left and right plates. The side with the gentler slope was mostly compressed, most of the rock mass was characterized by toppling/sliding failure along this side, and it was the primary sliding zone of the wedge failure. The side with the steeper slope was mostly under tension, and the stability of most of the rock mass on this side was controlled by the steep terrain. In the end, toppling or failing failure occurred on this side. In terms of its mechanical behavior, when the half-wedge angles were different, the wedge rock mass more easily failed along the smaller half-wedge angle position. The main reason for this is that when the wedge rock mass is eccentric, the main stress is concentrated on the relatively gentle half-wedge surface, resulting in sliding or toppling failure first occurring on this side. After the smaller half-wedge angle is damaged to a certain extent, the other side decompresses, and failure behaviors such as falling or overturning occur.

4.1.5. Comparison of Study Models and Kumsar Model

Kumsar et al. (2000) plotted model test results and the FS = 1 curve using a stability model on the same graph to examine the influence of ia and ω on wedge failure (Figure 18). The results in Figure 18 show that wedge slopes with greater ia and ω were less stable (region to the upper right of the FS = 1 curve), whereas those with smaller ia and ω were relatively more stable (region to the smaller left of the FS = 1 curve). In wedge slopes with a greater ia, only a smaller ω can create more stable conditions, whereas if ω is greater, then ia must be smaller for the sake of stability. These results demonstrate the importance of ia and ω in wedge slopes.
The marks of the physical models in Figure 18 show that Models E and F, in which ia = 70° and ω = 25° and 45°, respectively, were both located in the unstable region. This means that a greater ia tended to result in wedge failure (Figure 18). Model E had a smaller ω than Model F; it was thus closer to the FS = 1 curve and had greater stability. Comparison of the wedge failure time of the two models also confirmed that Model F was likely to succumb to total wedge failure sooner than Model E. In contrast, Models A and B were situated in the stable region (wedge failure took place in Model A); however, the stability formula and test only considered rigid wedge failure models, and the formula did not consider the impact of continuous rainfall on the wedge mass. Our models took both the rock material and rainfall infiltration into account, and after the continuous infiltration of surface water weakened the strength of the rock material, progressive wedge failure took place. This demonstrates that these two factors also influence wedge slope stability. The conditions for Models C and D were similar. Although ia was only 40°, the overall wedge failure was similar to planar failure when ω was greater than 50°, and total failure tended to occur swiftly following continuous surface water infiltration. This further demonstrates that the wedge failure of rock material and the continuous infiltration of surface water are suitable predictors for conventional stability analysis. We next marked the parameters of the eccentric model (Model G, where ω = 10° and 45°) in Figure 19 and found that with ω = 45° (G2), Model G fell in the unstable region, whereas with ω = 10° (G1), it fell in the stable region. However, the test results revealed wedge failure occurring within a short period of time (indicating instability), which means that when ω on the two slides of the slope differ, using the greater ω for stability analysis is the best approach (Figure 19).

5. Conclusions

Our field surveys revealed that the wedge slopes along Provincial Highway No. 2 in Nanyali are mainly controlled by three sets of joints. Approximately 40% of the wedge slopes are controlled by Joints 2 and 3, and their intersection angles mostly range from 40° to 60°. We thus designed our physical models accordingly. The results of the physical tests revealed that most of the initial failure took place where the slope toe daylighted and that rockfalls or toppling were the most common. After some of the rock at the slope toe collapsed, tension cracks gradually developed toward the source, and surface water continued to infiltrate the rock mass via tension cracks, which weakened the shear strength within weak planes, reduced the overall stability of the rock wedge, and ultimately led to wedge failure.
The physical tests also revealed that ia had the greatest impact on overall rock wedge stability: ia less than 50° tended to result in sliding-type failure, and ia greater than 90° tended to result in toppling- or falling-type wedge failure. The variable with the second greatest impact was ω; when ω was less than 40°, forces on the rock mass from both sides produced progressive wedge failure characteristics. The failure began at the slope toe which the oblique slope was inclined towards and then gradually developed. Following local wedge failure, tension cracks formed in the rock above, and this cycle continued. The failure behavior resulting from ω greater than 45° was similar to that of planar rock sliding; there were fewer tension cracks, and the sliding mass was relatively whole. Most of the failure took place in deeper locations, thereby demonstrating that the characteristics of wedge failure are mostly controlled by ia and ω. Comparisons of the physical models and stability analysis models revealed that greater ω and ia increase the probability of wedge failure; however, existing stability formulas overlook the influence of rock material and continuous rainfall infiltration on wedge slope stability. This should be a focal point of future improvements to stability formulas. In wedge slopes where ω on the two slides of the slope differ, using the greater ω for stability analysis is the best approach.
Our results indicated that wedge slopes with ω less than 40° in Nanyali should be inspected for progressive wedge failure, and any tension cracks on the slope surface or wedge failure at the slope toe should be noted. Wedge slopes with ω greater than 45° should be inspected for slope toe daylighting to prevent large-scale wedge sliding. In eccentric wedge slopes (ω1 ≠ ω2), a greater ia means a greater chance of large-scale sliding on gentler slopes, which is important information for engineers.
Author Contributions

Conceptualization, C.-M.L. and Y.-S.L.; Methodology, C.-H.C.; Validation, C.-M.L. and C.-H.C.; Formal analysis, C.-M.L.; Investigation, Y.-S.L.; Data curation, C.-H.C.; Supervision, C.-M.L. and Y.-S.L. All authors have read and agreed to the published version of the manuscript.

Funding

This research received no external funding.

Data Availability Statement

Not applicable.

Conflicts of Interest

The authors declare no conflict of interest.

References

  1. Wyllie, D.C.; Mah, C.W. Rock Slope Engineering, 4th ed.; Spon Press: London, UK, 2004. [Google Scholar]
  2. Wang, Y.J.; Yin, J.H.; Chen, Z.; Lee, C.F. Analysis of wedge stability using different methods. Rock Mech. Rock Eng. 2004, 37, 127–150. [Google Scholar] [CrossRef]
  3. Grenon, M.; Hadjigeorgiou, J. A design methodology for rock slopes susceptible to wedge failure using fracture system modelling. Eng. Geol. 2008, 96, 78–93. [Google Scholar] [CrossRef]
  4. Alejano, L.R.; Ferrero, A.M.; Ramirez-Oyanguren, P.; Alvarez Fernandez, M.I. Comparison of limit-equilibrium, numerical and physical models of wall slope stability. Int. J. Rock Mech. Min. Sci. 2011, 48, 16–26. [Google Scholar] [CrossRef]
  5. Havaej, M.; Stead, D. Investigating the role of kinematics and damage in the failure of rock slopes. Comput. Geotech. 2016, 78, 181–193. [Google Scholar] [CrossRef]
  6. Riquelmea, J.A.; Tomas, R.; Jewell; Abellan, A. Characterization of Rock Slopes through Slope Mass Rating using 3D point clouds. Int. J. Rock Mech. Min. Sci. 2016, 84, 165–176. [Google Scholar] [CrossRef] [Green Version]
  7. Zhang, S.; Xu, Q.; Peng, D.; Zhu, Z.; Li, W.; Wong, H.; Shen, P. Stability analysis of rock wedge slide subjected to groundwater dynamic evolution. Eng. Geol. 2020, 270, 105528. [Google Scholar] [CrossRef]
  8. Xu, J.; Tang, X.; Wang, Z.; Feng, Y.; Bian, K. Investigating the softening of weak interlayers during landslides using nanoindentation experiments and simulations. Eng. Geol. 2020, 277, 1–12. [Google Scholar] [CrossRef]
  9. Hoek, E.; Bray, J.W. Rock Slope Engineering, 3rd ed.; Institute of Mining and Metallurgy: London, UK, 1981; p. 358. [Google Scholar]
  10. Piteau, D.R.; Martin, D.C. Mechanics of rock slope failure. In Stability in Surface Mining Volume 3, Proceedings of the Third International Conference on Stability in Surface Mining, Vancouver, BC, Canada, 1–3 June 1982; Society of Mining Engineers of the American Institute of Mining, Metallurgical, and Petroleum Engineers: New York, NY, USA, 1982; pp. 113–169. [Google Scholar]
  11. Adhikary, D.; Dyskin, A.V.; Jewell, R.J.; Stewart, D.P. A study of the mechanism of flexural toppling failure of rock slopes. Rock Mech. Rock Eng. 1997, 30, 75–93. [Google Scholar] [CrossRef]
  12. Bobet, A. Analytical Solutions for Toppling Failure. Int. J. Rock Mech. Min. Sci. 1999, 36, 971–981. [Google Scholar] [CrossRef]
  13. Park, H.; West, T.R. Development of a probabilistic approach for rock wedge failure. Eng. Geol. 2001, 59, 233–251. [Google Scholar] [CrossRef]
  14. Kumsar, H.; Aydan, O.; Ulusay, R. Dynamic and static stability assessment of rock slopes against wedge failures. Rock Mech. Rock Eng. 2000, 33, 31–51. [Google Scholar] [CrossRef]
  15. Yoon, W.S.; Jeong, U.J.; Kim, J.H. Kinematic analysis for sliding failure of multi-faced rock slopes. Eng. Geol. 2002, 67, 51–61. [Google Scholar] [CrossRef]
  16. Ahangar-Asr, A.; Faramarzi, A.; AJavadi, A. A new approach for prediction of the stability of soil and rock slopes. Eng. Comput. 2010, 27, 878–893. [Google Scholar] [CrossRef]
  17. Kovari, K.; Fritz, P. Stability analysis of rock slopes for plane and wedge failure with aid of a programmable pocket calculator. In Proceedings of the 16th US Symposium on Rock Mechanics (USRMS), Minneapolis, MN, USA, 22–24 September 1975; pp. 25–33. [Google Scholar]
  18. Smith, J.V.; Arnhardt, C. A New Assessment Method for Structural-Control Failure Mechanisms in Rock Slopes—Case Examples. AIMS Geosci. 2016, 2, 214–230. [Google Scholar] [CrossRef]
  19. Bowa, V.; Samiselo, W.; Manda, E.; Lei, Y.; Zhou, W.; Shane, A.; Chinyanta, S. Wedge Failure Analysis of the Slope Subjected to Uplift Forces by Analytical Method at Chingola Open Pits F & D. J. Min. Environ. 2021, 12, 941–952. [Google Scholar]
Figure 1. The 1/50,000-scale geological map of the study area.
Water 15 01108 g001
Figure 2. Wedge failure characteristics on the slope at 81.8 km of Provincial Highway No. 2. Red, green and blue frames means joint plane 1, 2 and 3 respectively.
Water 15 01108 g002
Figure 3. Attitudes of primary weak planes and stereographic projection in the study area.
Water 15 01108 g003
Figure 4. Setup of the physical model.
Water 15 01108 g004
Figure 5. Rock wedge (oblique slope) model comprising grinding stones and resin.
Water 15 01108 g005
Figure 6. Physical model A (ia = 40° and ω1 = ω2 = 25°).
Water 15 01108 g006
Figure 7. Physical Model B (ia = 40° and ω1 = ω2 = 45°).
Water 15 01108 g007
Figure 8. Physical test process of Model C (ia = 40° and ω1 = ω2 = 60°).
Water 15 01108 g008
Figure 9. Physical test process of Model D (ia = 40° and ω1 = ω2 = 75°).
Water 15 01108 g009
Figure 10. Physical Model E (ia = 70° and ω1 = ω2 = 25°).
Water 15 01108 g010
Figure 11. Physical Model F (ia = 70° and ω1 = ω2 = 45°).
Water 15 01108 g011
Figure 12. Physical Model G (ia = 60°, ω1 = 40° and ω2 = 10°).
Water 15 01108 g012
Figure 13. Comparison of tests with ia = 40° and different ω.
Water 15 01108 g013
Figure 14. Comparison of tests with ia = 70° and different ω.
Water 15 01108 g014
Figure 15. Comparison of tests with ω = 45° and different ia.
Water 15 01108 g015
Figure 16. Comparison of tests with ω = 25° and different ia.
Water 15 01108 g016
Figure 17. Comparison of tests with ω1 ≠ ω2.
Water 15 01108 g017
Figure 18. Comparison of the study models and Kumsar’s model.
Water 15 01108 g018
Figure 19. Comparison of the eccentric model and Kumsar’s model.
Water 15 01108 g019
Table 1. Material properties for the physical models.
PropertiesValue
Specific gravity (intact artificial rock)3.65
Density (intact artificial rock)2600 kg/m3
Friction angle (intact artificial rock)32°
Permeability (intact artificial rock)1.5 × 10⁻⁹–2.3 × 10⁻⁹ cm/s
Permeability (artificial rock discontinuity)1.2 × 10⁻³–1.7 × 10⁻³ cm/s
Compressive strength (intact artificial rock)7.46 MPa
Compressive strength (the resin in a dry condition)0.15 MPa
Modulus of elasticity (intact artificial rock)3 GPa
Table 2. Experiment parameters for the physical models.
Experiment
Numbering
iaω1ω2Oblique
Direction
A40°25°25°left
B40°45°45°right
C40°60°60°right
D40°75°75°left
E70°45°45°right
F70°25°25°right
G60°10°45°right
Disclaimer/Publisher’s Note: The statements, opinions and data contained in all publications are solely those of the individual author(s) and contributor(s) and not of MDPI and/or the editor(s). MDPI and/or the editor(s) disclaim responsibility for any injury to people or property resulting from any ideas, methods, instructions or products referred to in the content.