3.1. Dew Days and Intensity
The annual average number of dew days in Fujin, Lishu and Changchun were 132.8, 122.9 and 118.1 days, which accounted for 72.2%, 72.7% and 64.2% of the growing season, respectively (
Table 2). The absence of dew days in the study area was due to the occurrence of precipitation events at night, and it could be seen that nighttime condensation of water vapor is a common meteorological phenomenon in Northeast China. The highest number of dew days were all in September and October in the wetland, farmland and urban ecosystems, which was due to the frequent precipitation from June to August during the same period of rain-heat in the study area. The annual number of dew days in our study area was similar to those in a Gansu farmland (135 days) [
21] and in the Tengger Desert (128 days) [
10]. Northeast China has four distinct seasons, and the low temperature and high wind speed in winter and spring make these seasons unsuitable for dew condensation. The annual number of dew days were lower than those in Kenya (265 days) [
33] and the Mu Us Desert (166) [
34], in which the climate is suitable for dew condensation throughout the year.
The daily average dew intensity was 0.125 ± 0.069 mm, with the highest accumulation of 0.315 mm in Fujin, which was higher than that in Lishu (0.061 ± 0.026 mm) and Changchun (0.028 ± 0.009 mm) (
Table 2). The factors that affect dew formation are complicated, as dew is influenced mainly by regional factors (altitude, slope, aspect, etc.), meteorological factors (RH, wind speed, temperature, etc.), and underlying surfaces (plants, bare soil, hardened ground, etc.) [
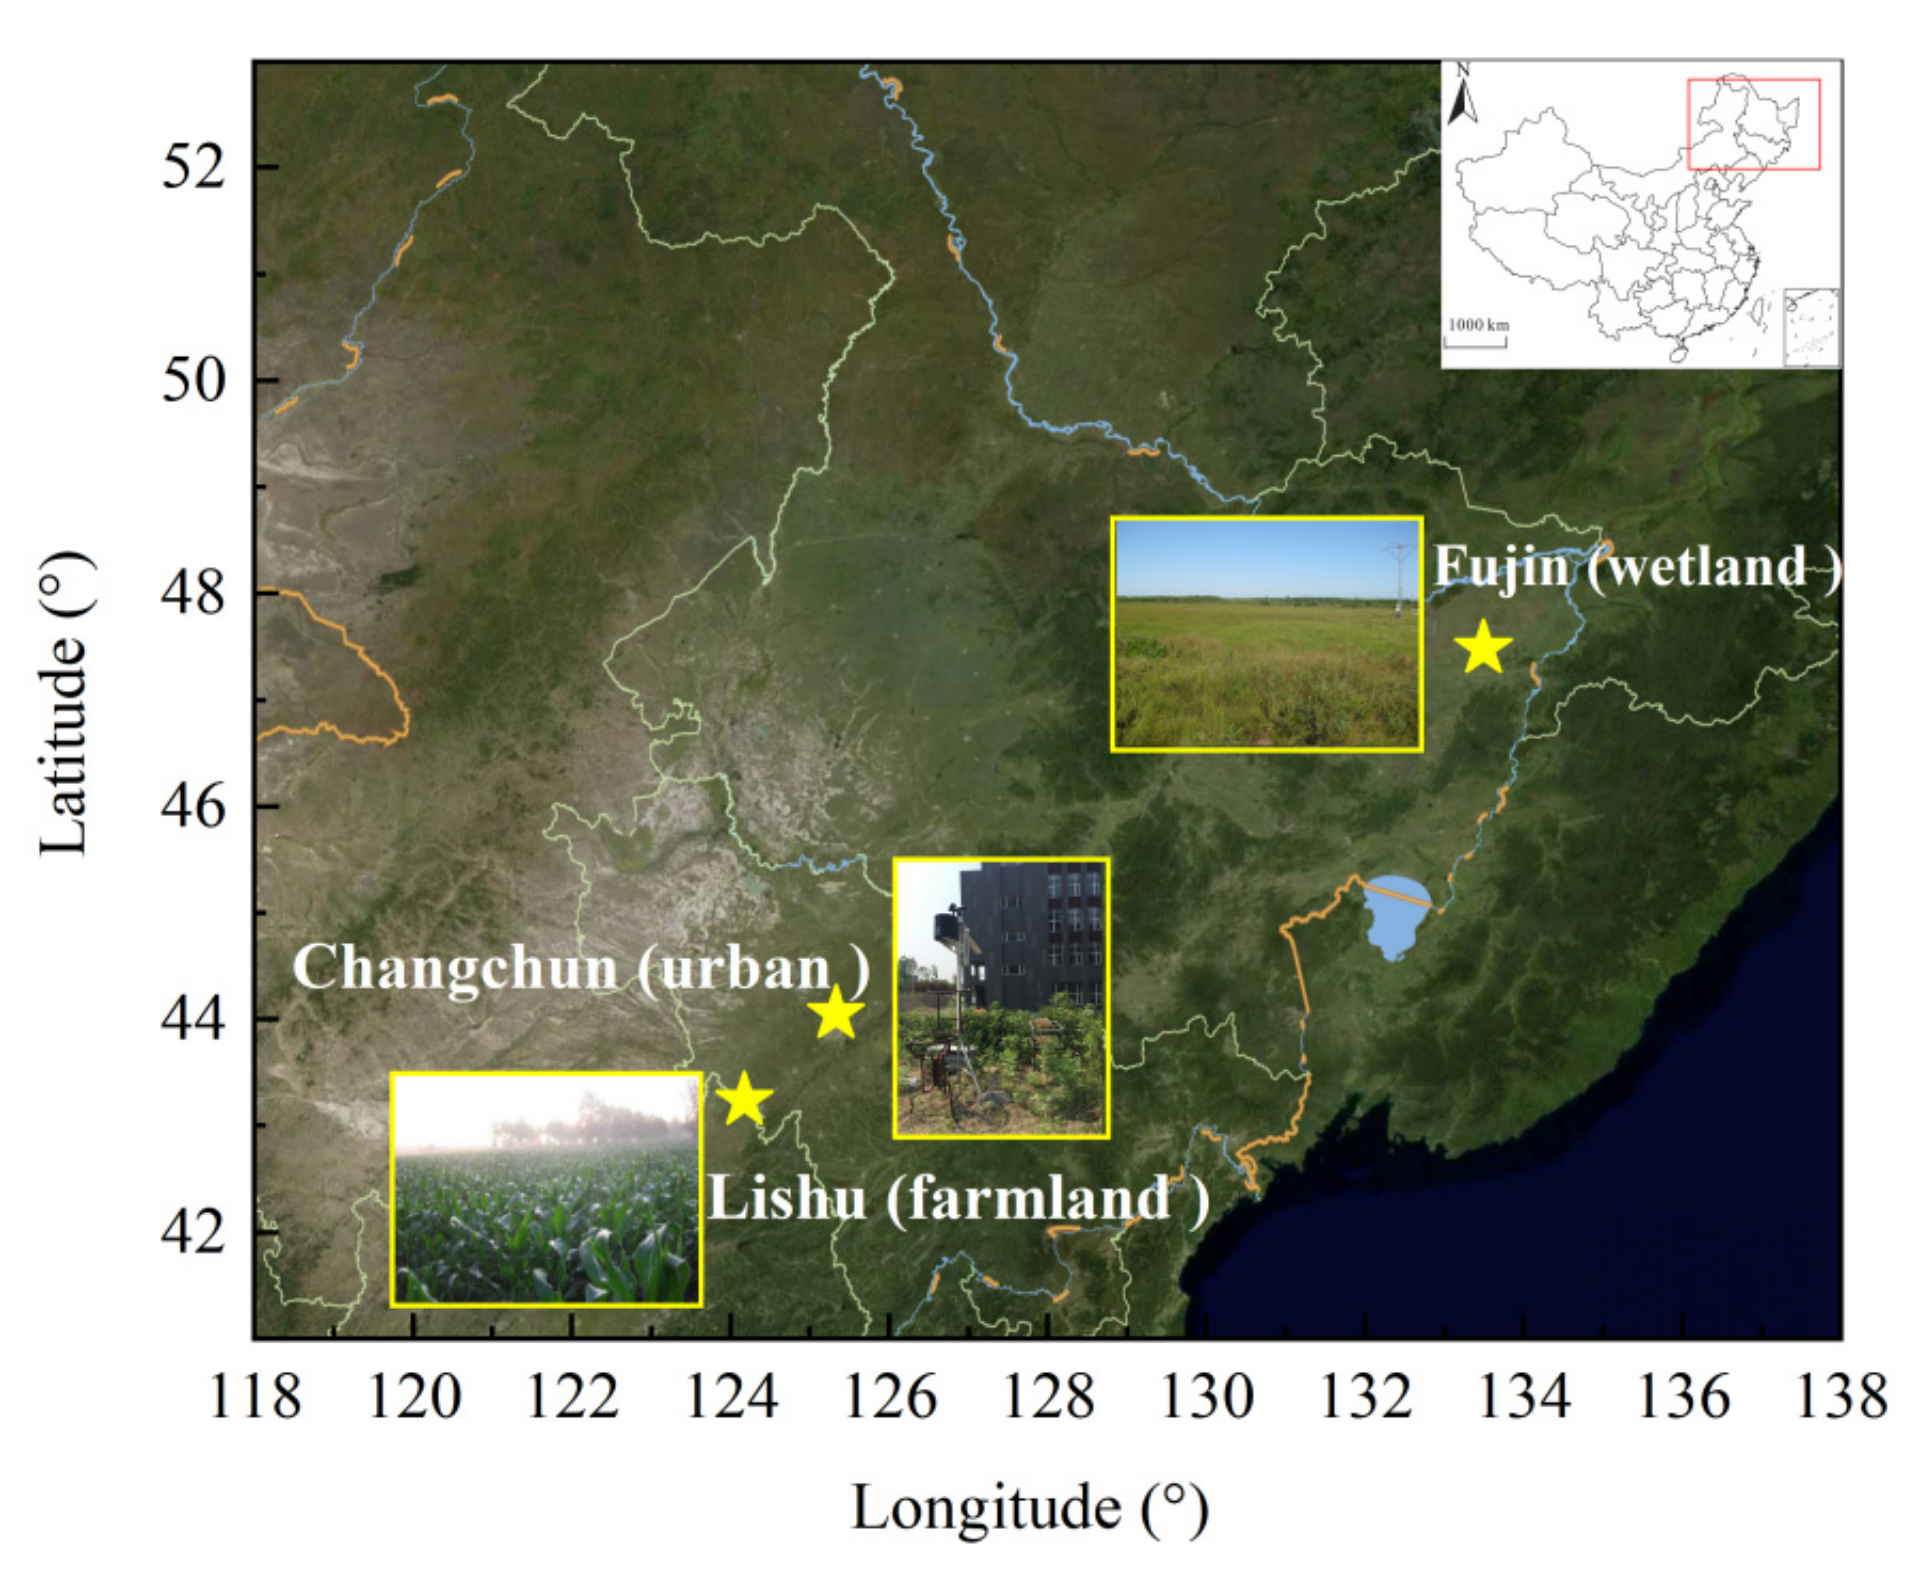
35]. The three monitoring sites were all located in the Northeast Plain of China and had a temperate continental monsoon climate. The different local meteorological factors were essential factors that dominated the difference in dew intensity. As shown in
Table 3, correlation analysis between the dew intensity and nocturnal meteorological data showed that the dew intensity in Lishu was positively correlated with RH, dew point temperature (
Td), and air temperature (
Ta) (
n = 2091,
p < 0.01) and negatively correlated with wind speed (
V) and cloud cover (
n = 2091,
p < 0.01). The dew intensity in Fujin was positively correlated with RH,
Td, and
Ta (
n = 2256,
p < 0.01) and negatively correlated with
V (
n = 2256,
p < 0.01). The dew intensity in Changchun was positively correlated with RH and
Td (
n = 2006,
p < 0.01) and negatively correlated with
V (
n = 2006,
p < 0.01). In Fujin, Lishu and Changchun, RH and
V were the most important factors affecting dew condensation. The maximum dew intensity occurred in July and August in all three studied ecosystems (
Table 2). Abundant rainfall in July and August enriched the atmosphere with moisture, and the higher dew intensity could be explained by the higher RH. The
Td increased accordingly with RH. Wetlands are characterized by higher RH [
25], the average RH (75.41%) of Fujin was significantly higher than that of Lishu (70.75%) and Changchun (61.55%) during the experimental period, and the dew intensity was higher in the wetland than in the farmland and urban areas (
p < 0.01). Dew rarely forms during calm nights with wind speeds near 0 m/s, and breezy conditions are more favorable for the formation of dew. Light winds are conducive to heat emission, and the near-surface temperature quickly reaches
Td. However, a high wind speed limits dew accumulation. Tuure et al. found that wind speeds under 2.4 m/s were good for dew formation [
36]. Zhuang and Zhao also reported that wind speeds under 4.27 m/s were conducive to dew formation [
9]. In this study, the dew formation threshold of RH was 42%, 47% and 45% in Lishu, Fujin and Changchun, respectively. The maximum wind speeds during dew nights were 5.0 m/s, 5.6 m/s and 6.0 m/s in Lishu, Fujin and Changchun, respectively.
The meteorological factors that determined the dew amount were found to be RH,
Td,
V, cloud cover,
Ta, net radiation, soil heat flux, etc. In this study, the meteorological factors related to our study area were selected for comparison with other reported sites. As shown in
Table 4, the factors affecting dew condensation vary from place to place, while RH appears to be the main factor influencing dew condensation. Dew condensation is closely related to water vapor in the atmosphere, and dew intensity is positively related to RH nearly everywhere. Dew intensity is negatively correlated with wind speed in most areas, while dew intensity is not related to wind speed in some places. For example, in Kenya, the wind speed was low and mainly concentrated in the threshold range of dew formation. Dew is insensitive to changes in wind speed [
37]. In some dry desert areas, wind can effectively supply water vapor to the near surface and increase the dew amount. This leads to dew being positively correlated with wind speed [
18]. Dew intensity increased with increasing
Ta in places where rain and heat occurred in the same period. In some arid regions, such as the Gurbantunggut Desert, rain is rare [
38]. The temperature is low at night, and water vapor is prone to condense when the temperature difference between day and night is large, so the dew intensity is negatively correlated with
Ta. In general, cloudy weather does not promote the easy loss of surface heat and is unfavorable to dew formation. However, low cloud cover is always accompanied by blustery weather in some areas, such as Fujin and Changchun. Cloud cover was not an important factor affecting dew formation in these areas.
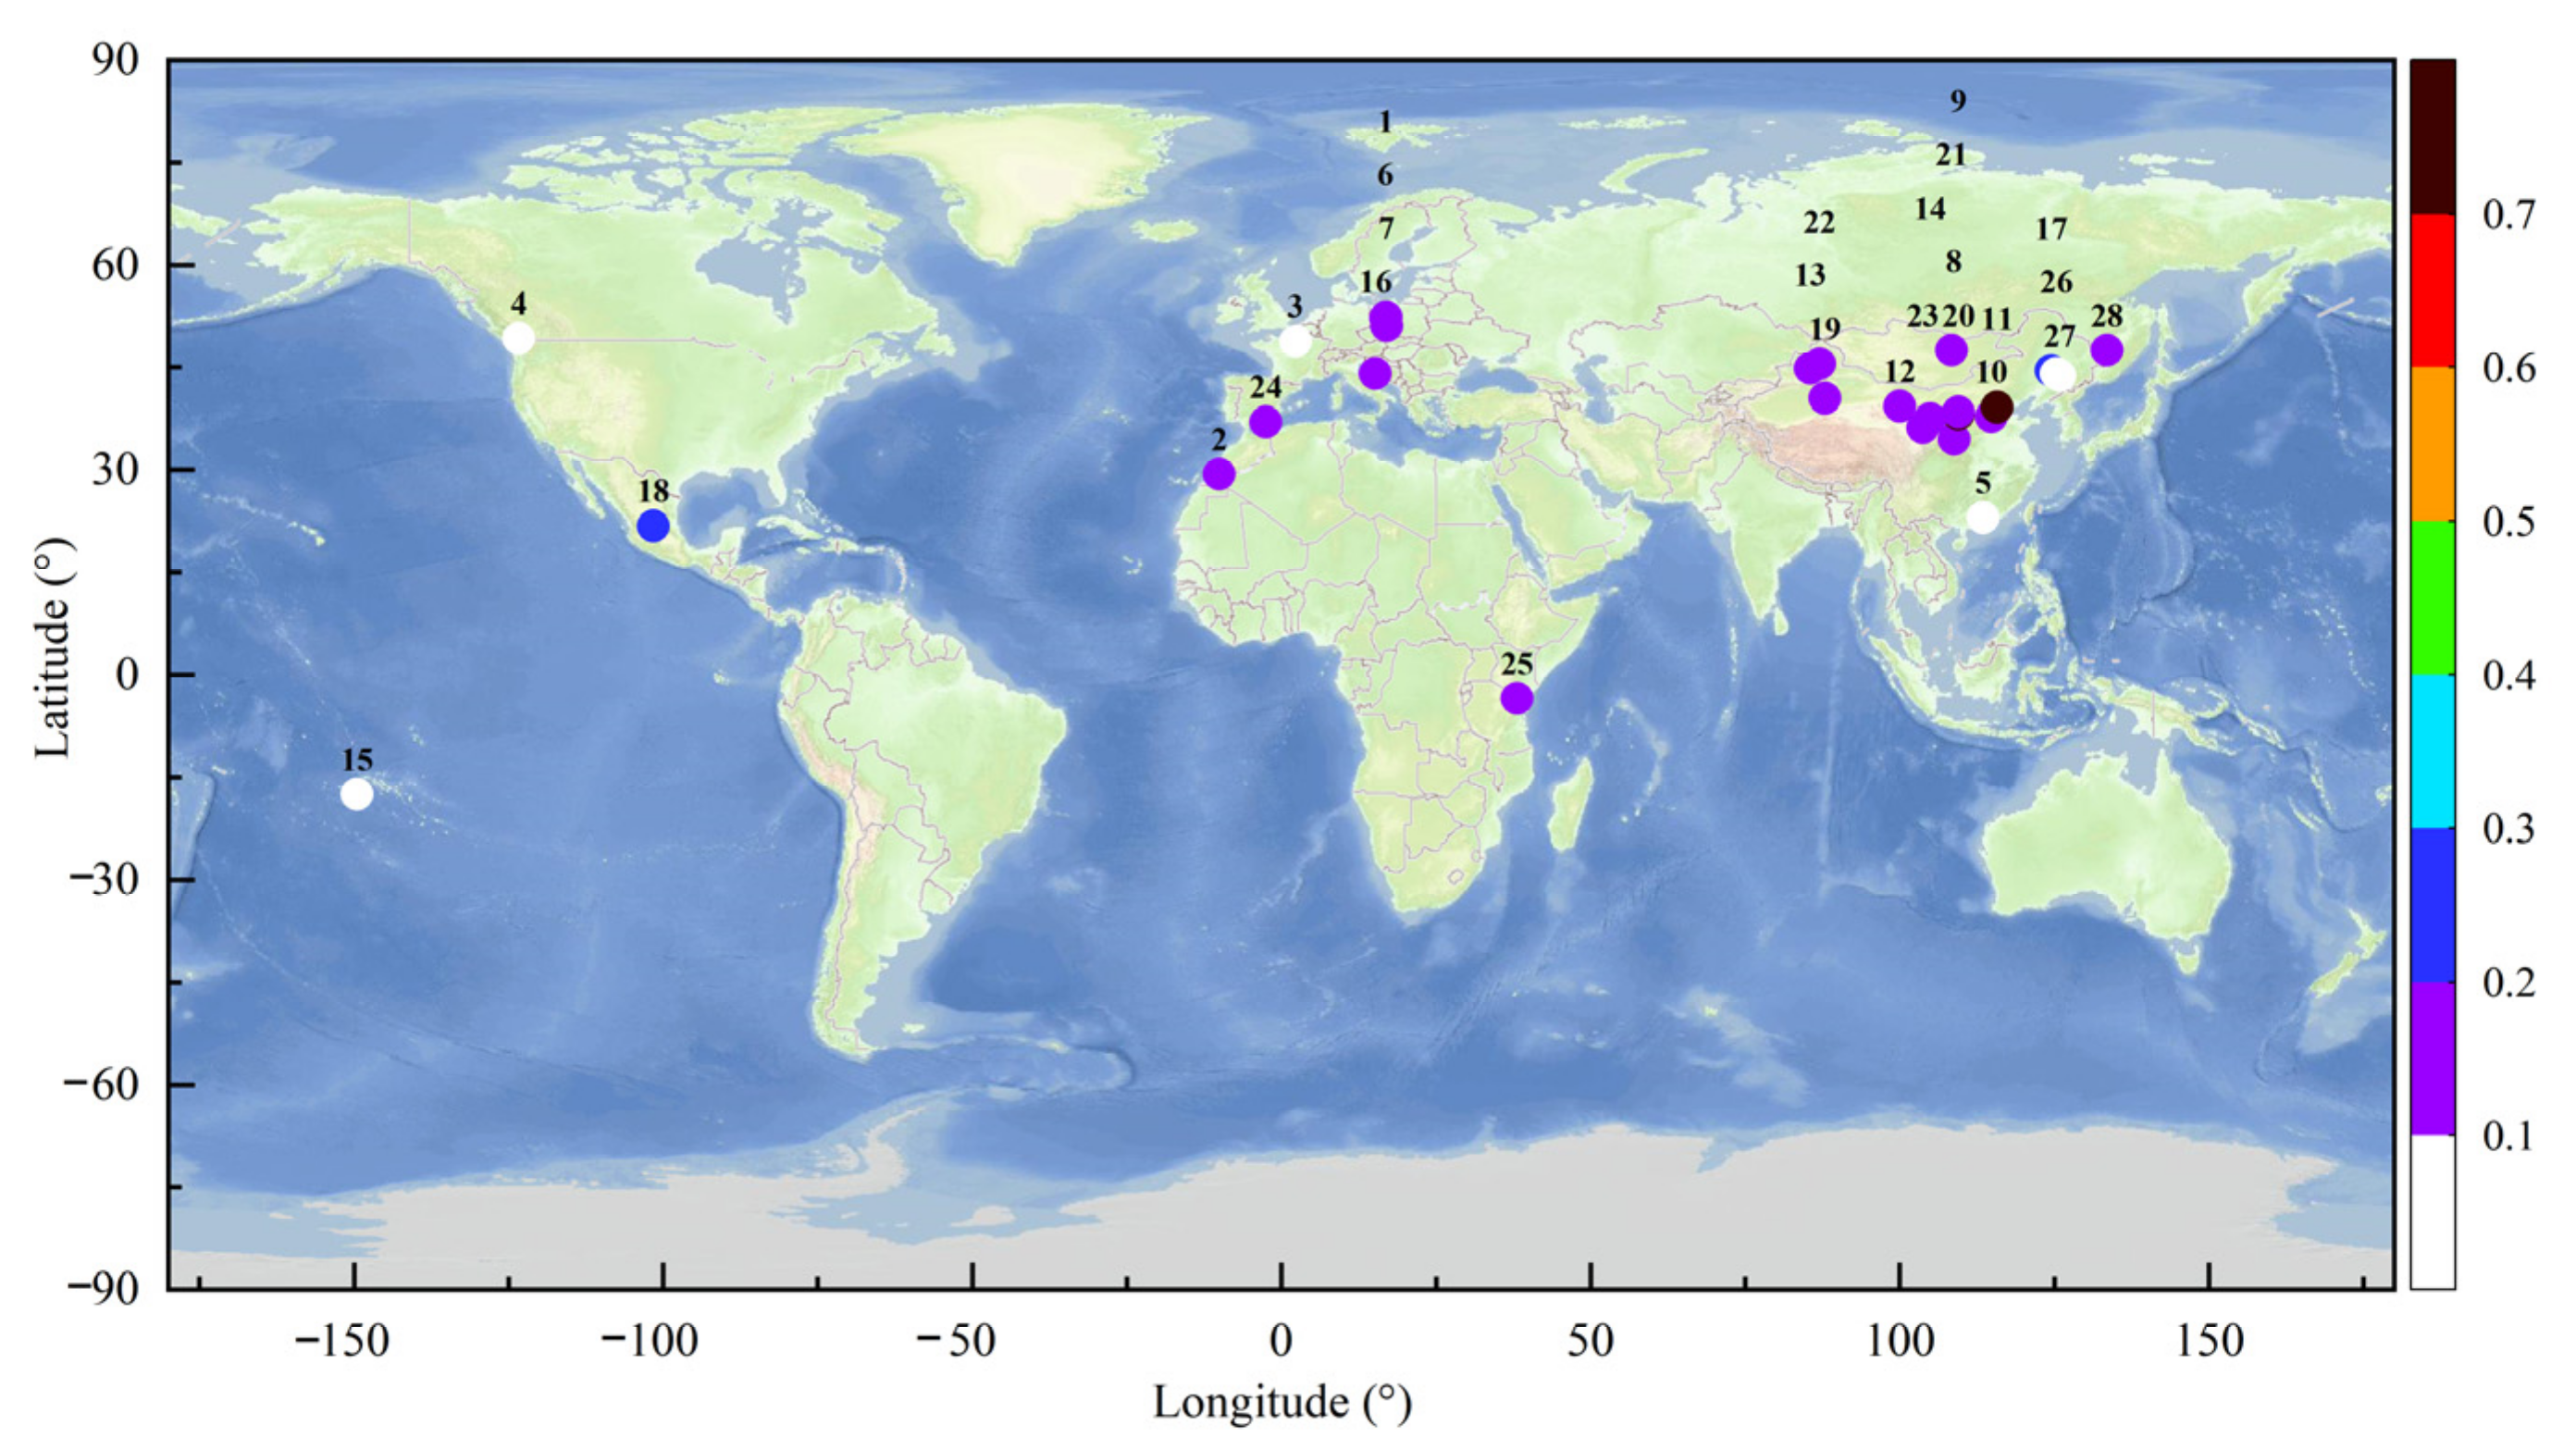
As shown in
Figure 2, the daily dew intensity in most areas can reach 0.1–0.2 mm, with the exception of Mizhi (0.75 mm), Gucheng (0.75 mm), and Momoge (0.27 mm) in China. The dew intensity in urban ecosystems was concentrated between 0.022 mm (Guangzhou, China) and 0.13 mm (Pozan, Poland), which was slightly lower than that in other ecosystems. As a result of the population density, intense transportation activity and surface hardening in urban areas, the temperature was higher in those areas than in suburban and rural areas. Akinbode et al. found that the urban heat island intensity (UHI) spanned between 0.5 and 2.5 °C in southwest Nigeria [
40]. Urban heat island effects and atmospheric pollution in urban environments lead to less dew formation [
15,
16,
24,
41]. The dew intensity of urban ecosystems in China is significantly lower than that in Mirleft, Morocco (0.11 mm), Paris, France (0.055 mm), and Vancouver, Canada (0.07 mm). This is mainly due to the higher population density and degree of surface hardening in Chinese cities. It exacerbated the urban heat island effect.
3.2. Dew Amount
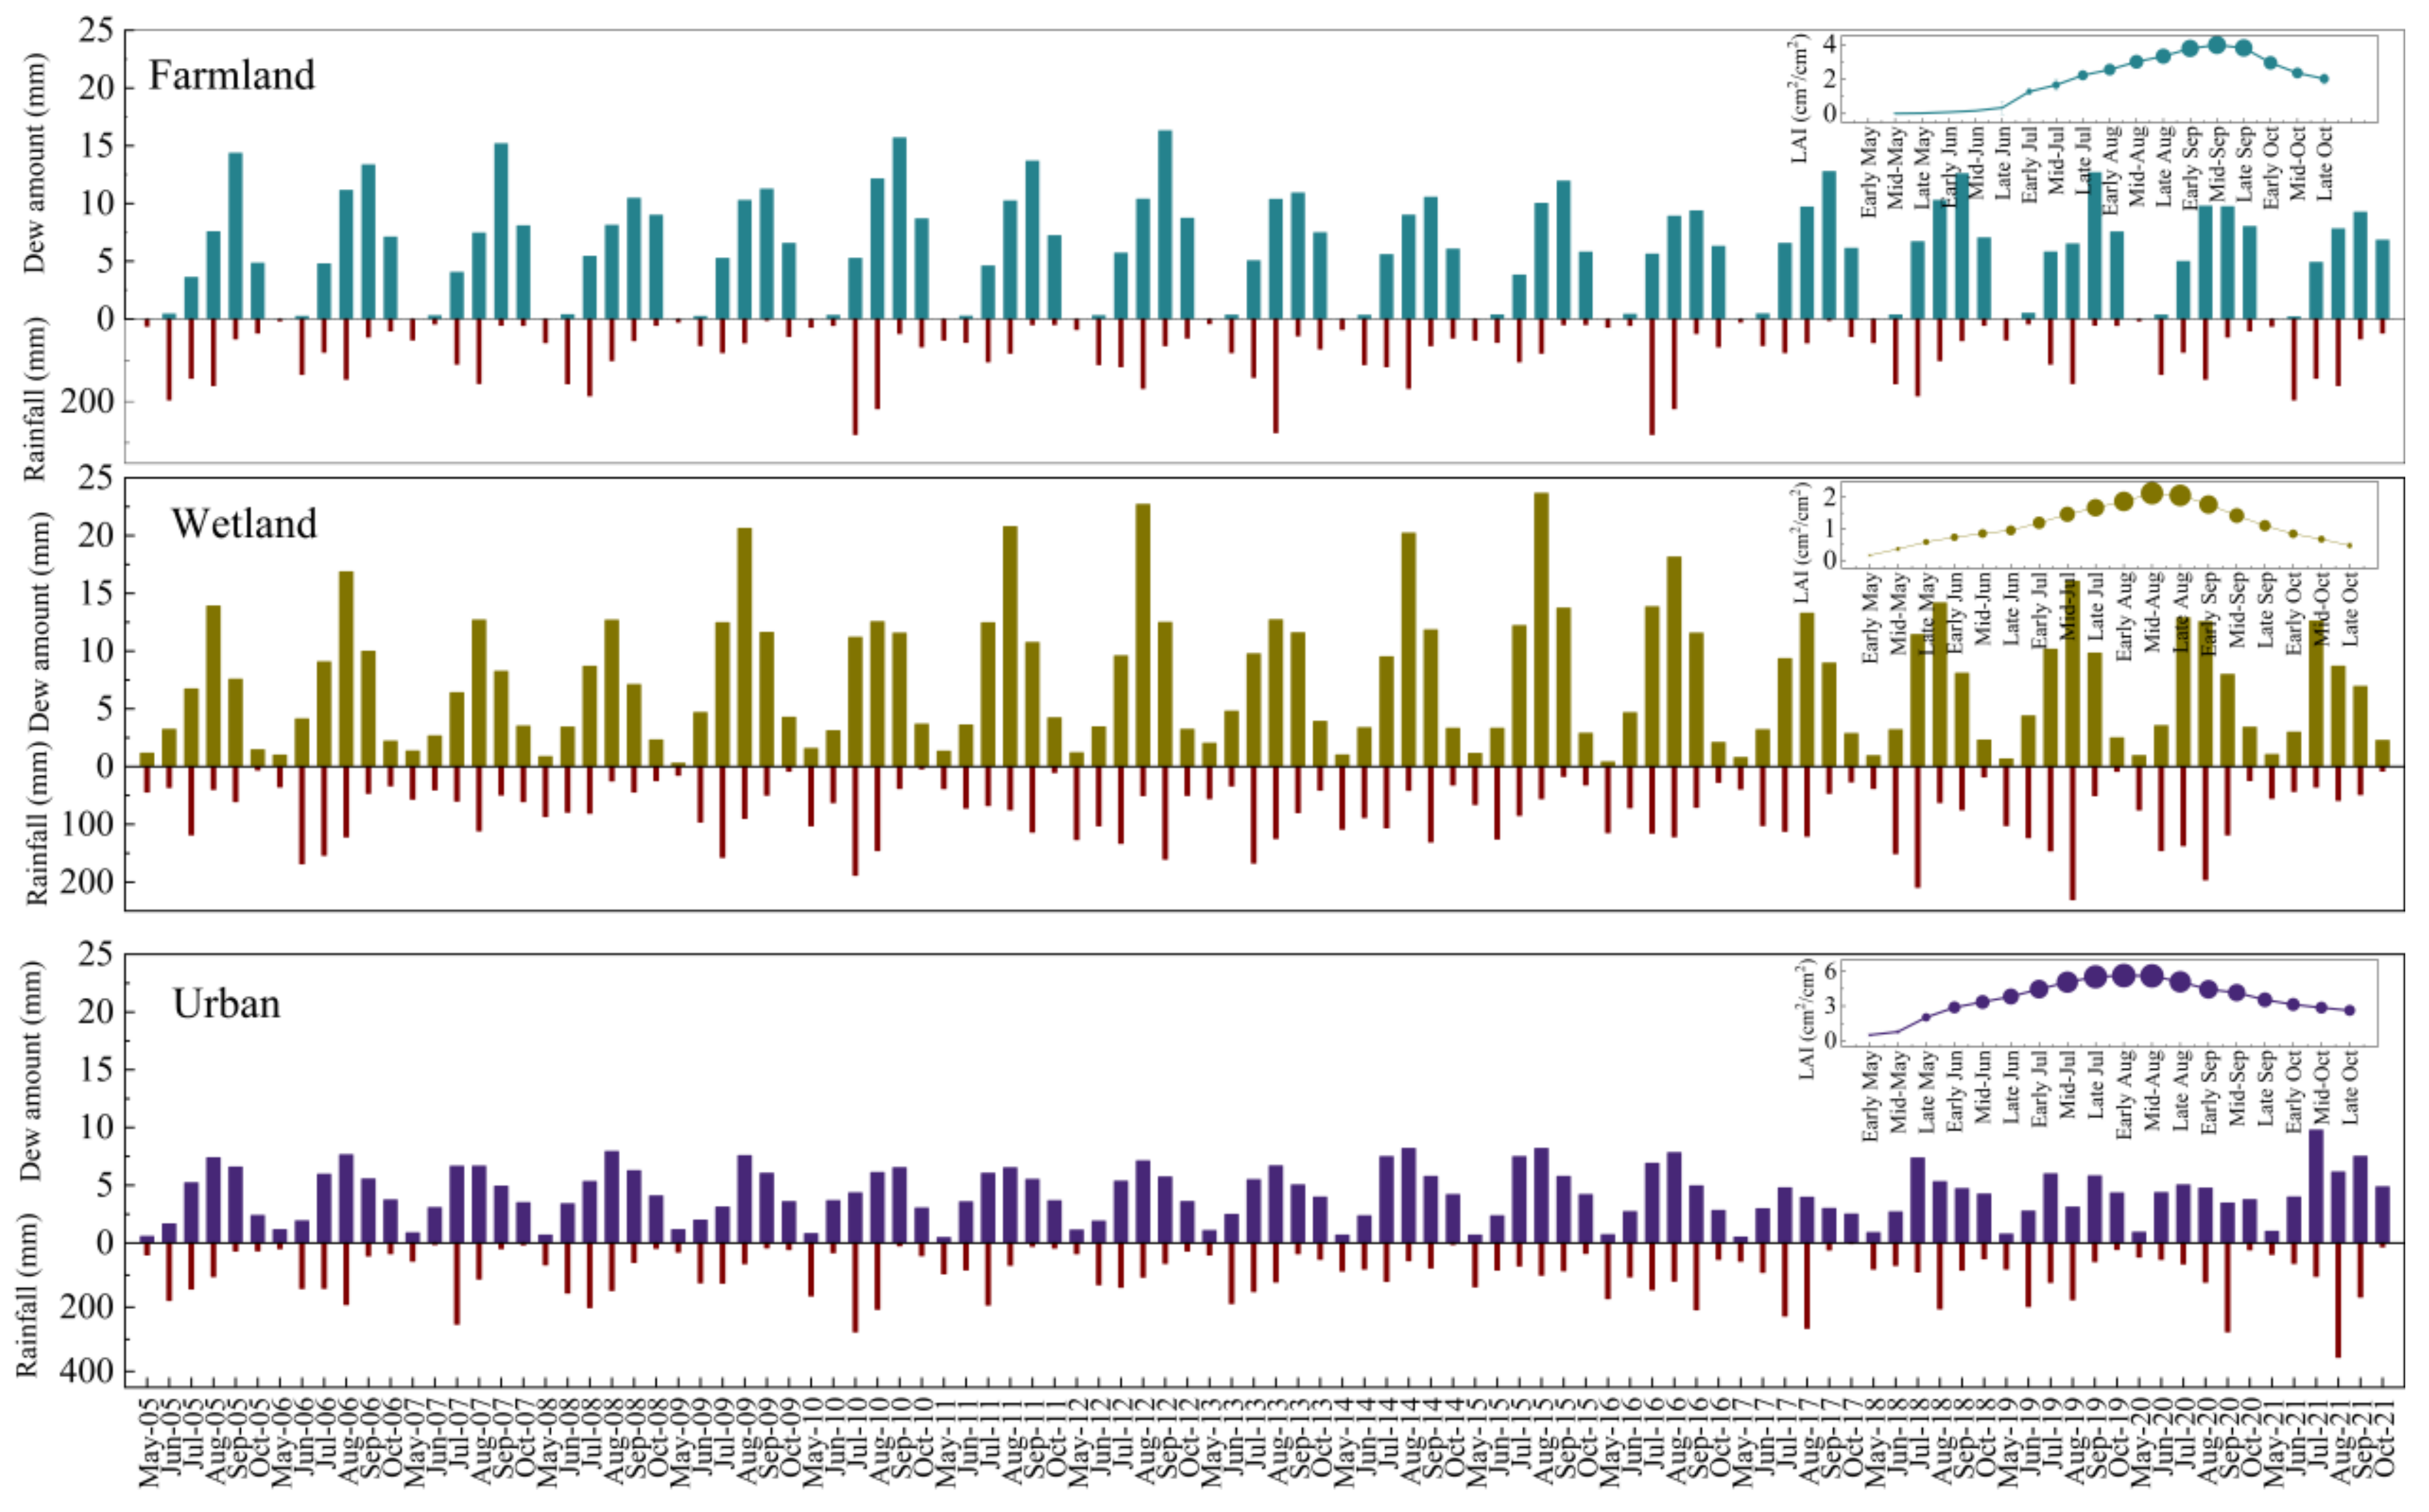
The annual dew amount ranged from 29.09 to 42.17 mm, with a mean of 34.46 ± 3.54 mm, in Lishu from 2005 to 2021. The annual dew amount in Fujin was higher than that in Lishu and ranged between 33.99 and 56.89 mm, with a mean of 44.09 ± 7.51 mm. Dew contributed 17.69 to 33.27 mm (mean of 25.32 ± 3.29 mm) to the annual water amount in Changchun. The annual dew amount in Lishu, Fujin and Changchun accounted for 7.92 ± 2.76%, 14.98 ± 5.93% and 6.71 ± 2.66% of the rainfall in the same period, respectively. Dew is an important water input and can not be ignored. The maximum monthly dew amount occurred in September in Lishu and in August in Fujin and Changchun (
Figure 3). The dew amount is closely related to the daily dew intensity, and
LAI is also an important factor affecting the dew amount (Equation (2)). Using Lishu as an example, the dew intensity was highest in August (0.080 ± 0.021 mm) (
Table 2), while the
LAI of maize reached a maximum in September (3.97 ± 0.19 cm
2/cm
2). In terms of values, the
LAI was two orders of magnitude higher than the dew intensity. Therefore, the variation trend of the monthly dew amount was basically consistent with that of the
LAI (
Figure 3).
The annual dew amount was obviously affected by the climate type. The three monitoring sites were all located in subhumid areas, and the annual dew amount was greater than that in arid areas such as Kenya (18.9–25.3 mm) [
36], the Gurban Tunggut Desert (12.21 mm) [
37], the Badian Jaran Desert (16.1 mm) [
9], and the Tengger Desert (15.3 mm) [
10]. For the same ecosystem type, climate is also an important factor affecting the annual dew amount. Using farmland ecosystems as an example, the annual dew amount in our study was 34.46 ± 3.54 mm in Lishu, which was higher than those in the farmland located in the plateau monsoon transition zone in Gansu (25.9 mm) [
21], the arid artificial oasis cropland in Zhangye (9.9 mm) [
12], and the semiarid loess in Shaanxi (32.8 mm) [
11].
3.3. Effect of Climate Change on Dew Amount
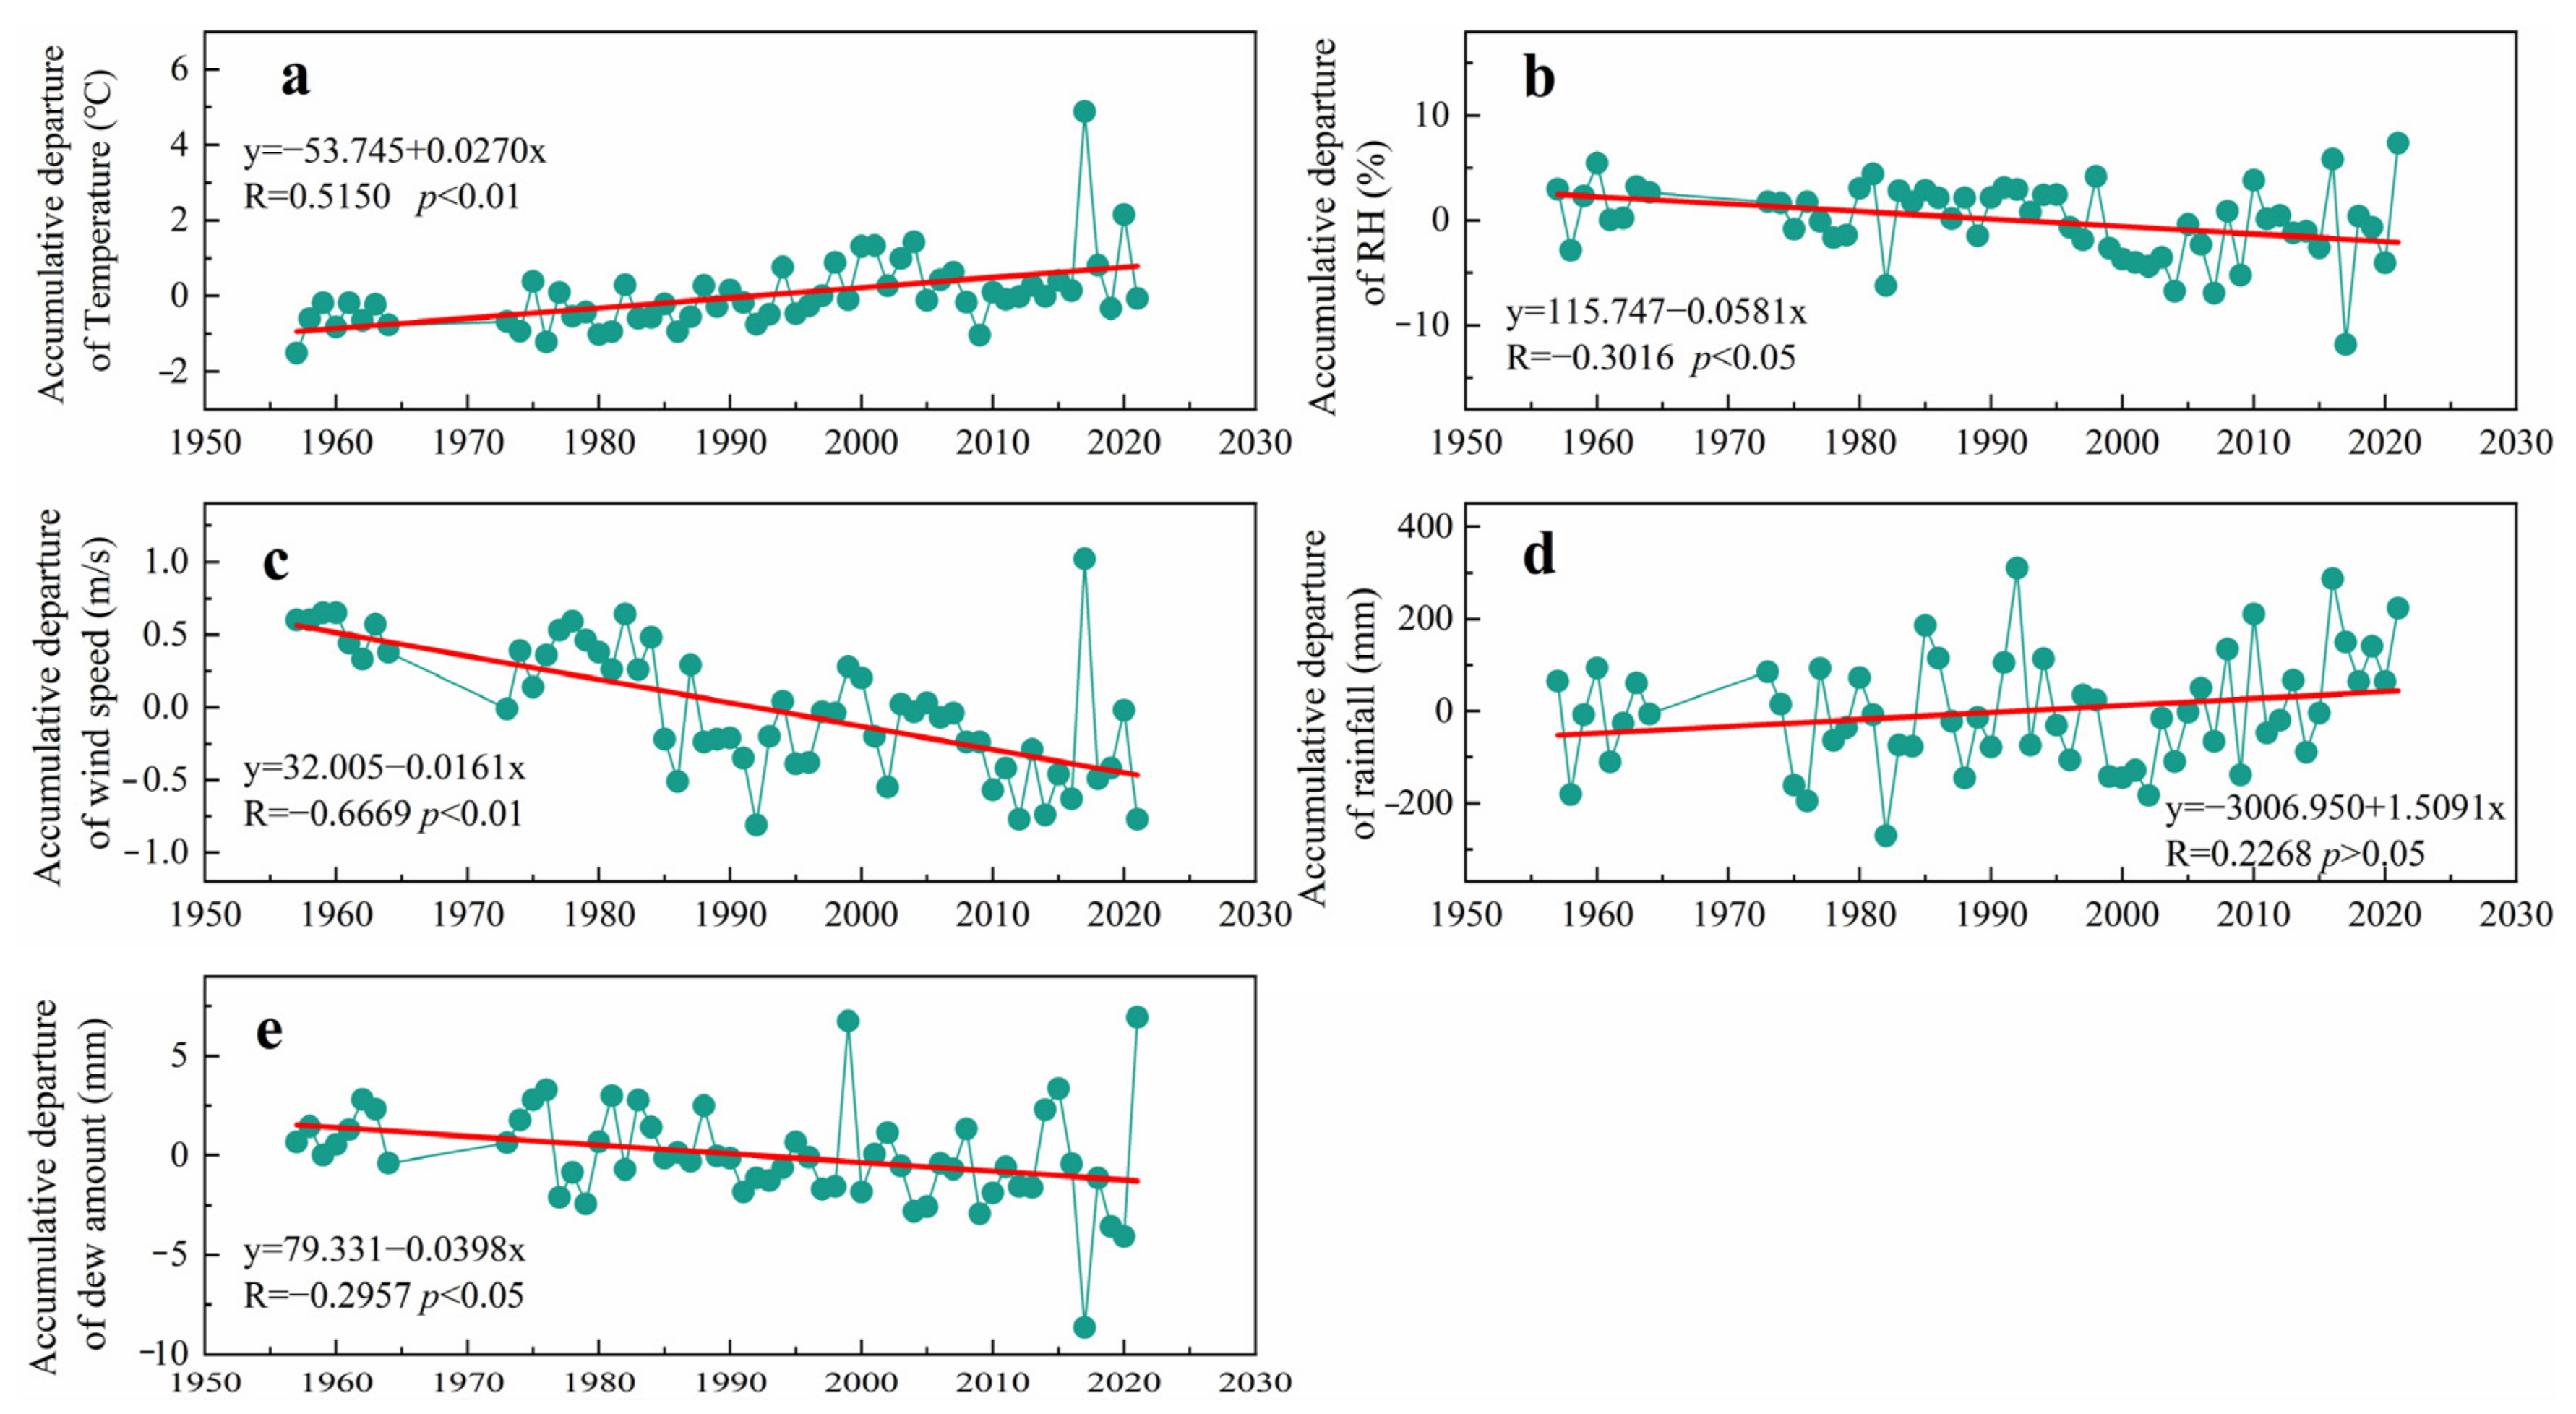
In this section, we use Changchun as an example. Human activities, especially urbanization and industrialization, have had an important impact on climate change. In the past 65 years, the meteorological factors during the dew condensation period in Changchun have changed significantly, and the area is mainly experiencing warming and drying climate change processes (
Figure 4). Since the 1990s, with increased urban development, vegetation surfaces have been replaced by asphalt and other hardened underlying surfaces. Motor vehicles and industrial production in cities emit large amounts of greenhouse gases, which also play an important role in temperature increases [
27,
53].
Figure 4a shows that the average temperature during the dew condensation period in Changchun fluctuated but increased gradually at a rate of 0.27 °C/10a (
p < 0.01). The nocturnal temperature rise in the growing season was lower than the average temperature rise of 0.35 °C/10a in Northeast China in the past 50 years [
28,
32]. The interannual variation trend of rainfall showed a nonsignificant but increasing trend overall, and the rainfall tendency rate was 15 mm/10a (
p > 0.05) (
Figure 4d). The period of 1995–2015 experienced less rainfall, and the 2016–2021 period experienced more concentrated rainfall. The increasing trend of rainfall was not significant, but the temperature gradually increased, leading to a decreasing trend of RH, with a rate of −0.58%/10a (
p < 0.05) (
Figure 4b), especially during 1999–2009. The average wind speed near the surface showed an overall downward trend, with a rate of −0.16 m/(s·10a) (
p < 0.01) (
Figure 4c). The nocturnal average wind speed showed a climatic jump from strong to weak around 1983, and the average wind speed significantly weakened after 1984. The change in wind speed in the study area was negatively correlated with the change in air temperature. The wind speed was stronger in the cold period than in the warm period.
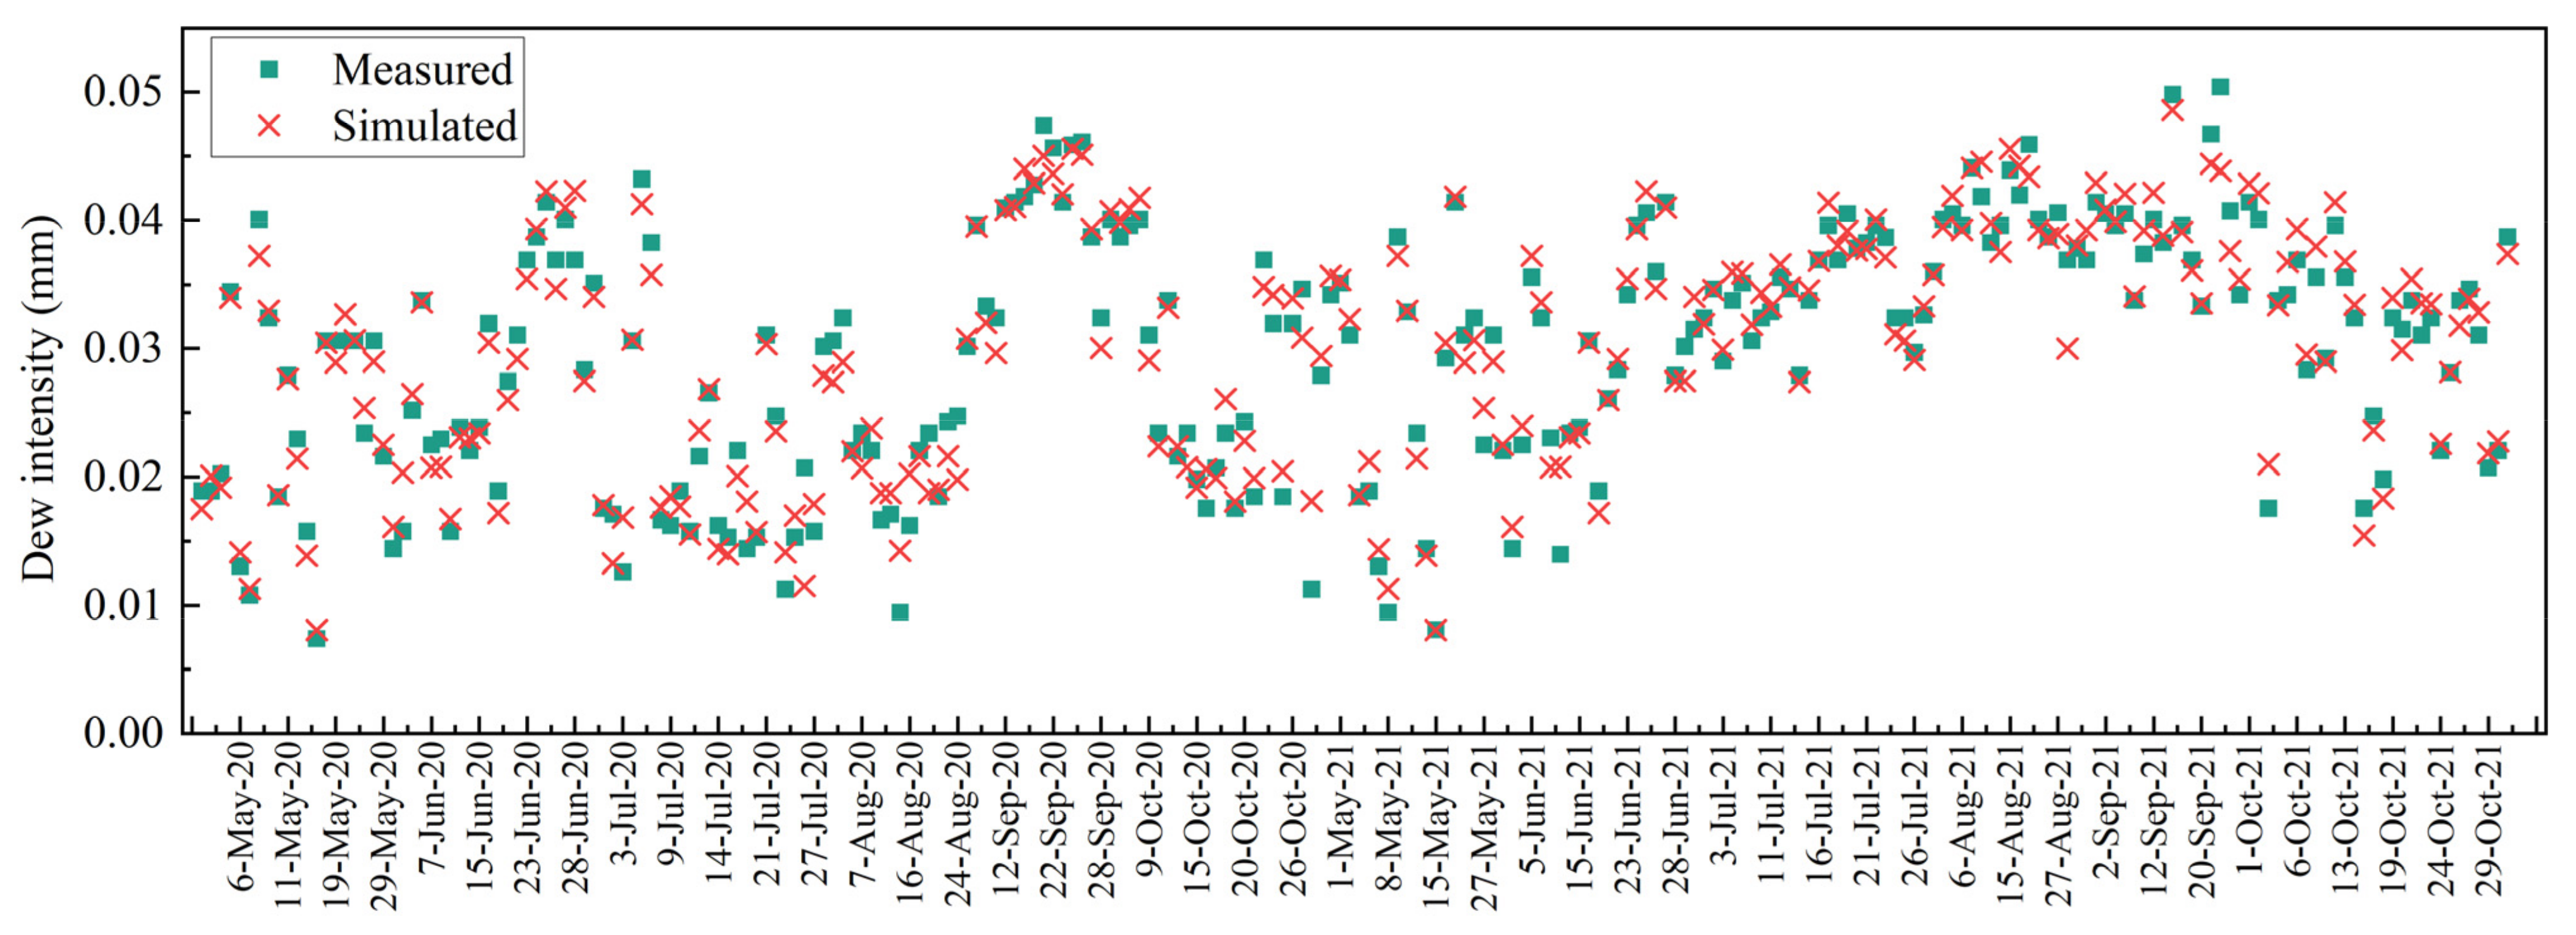
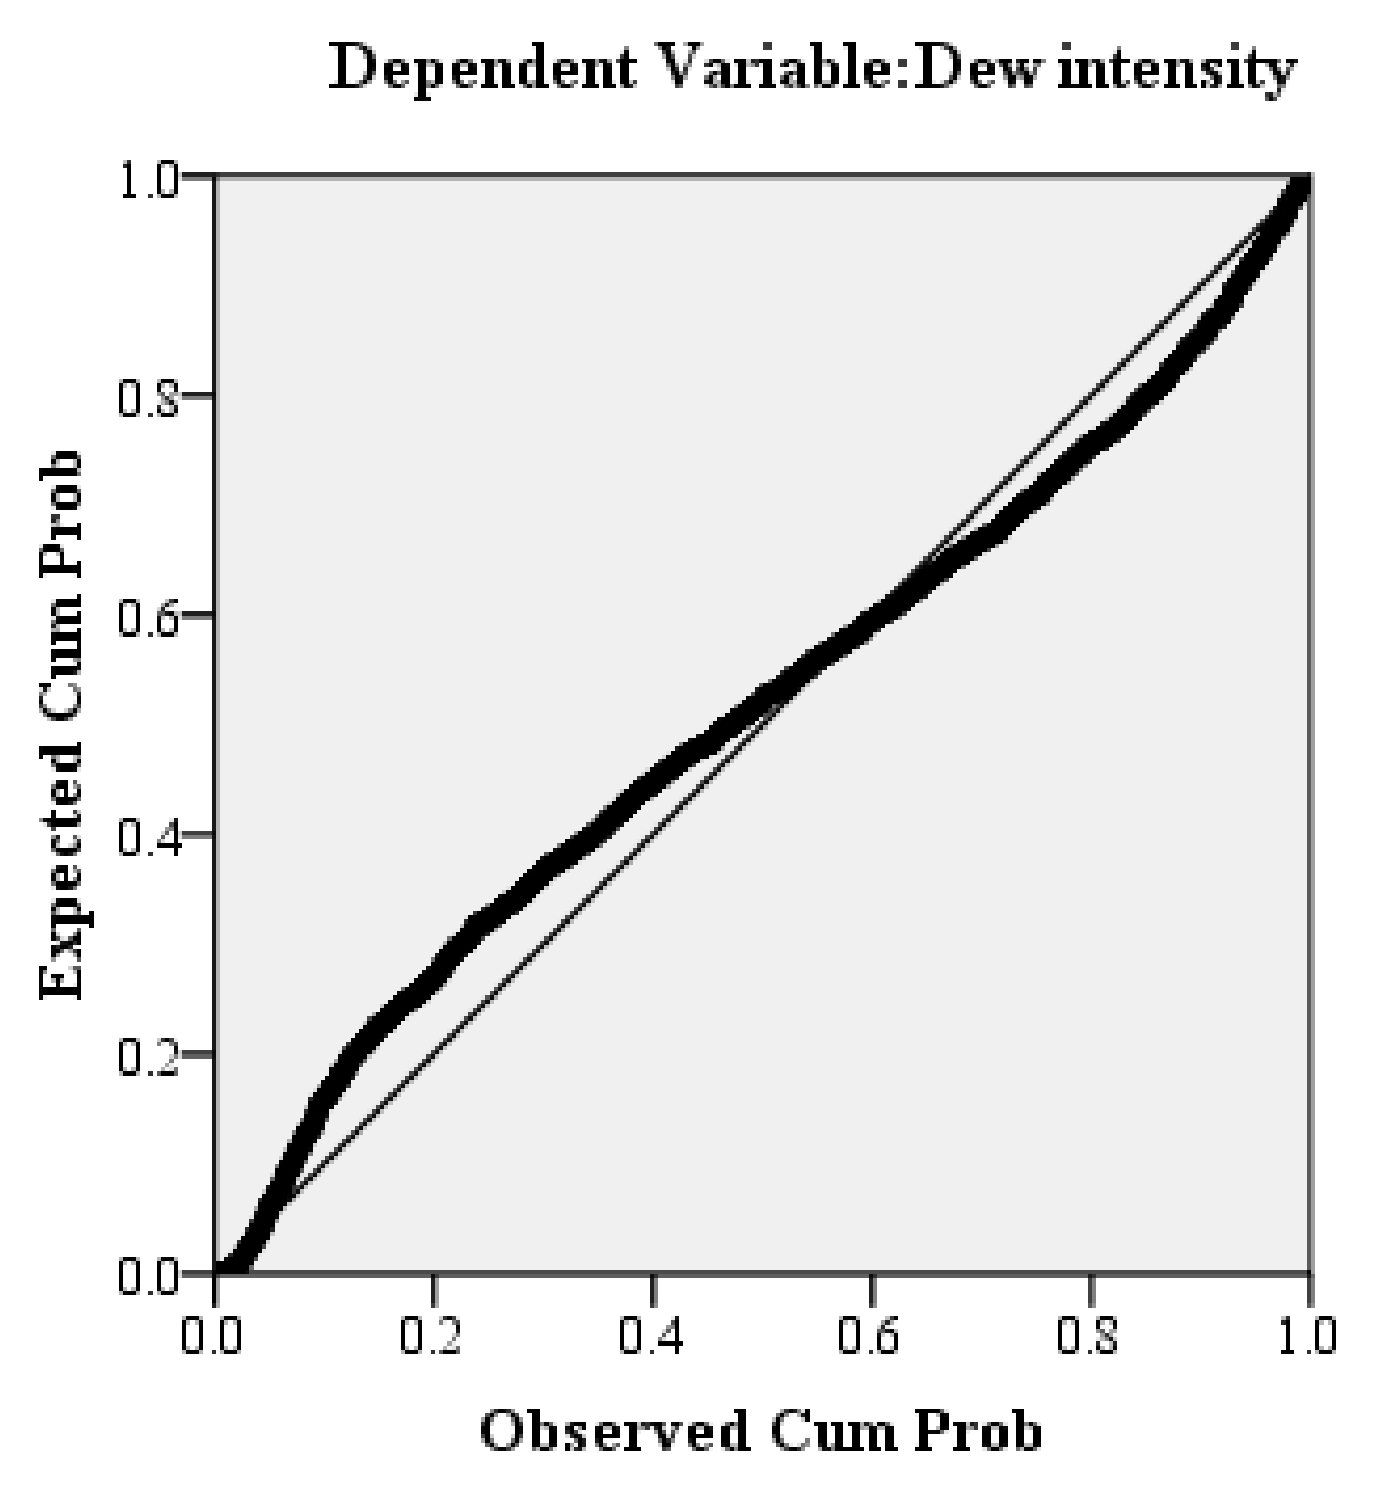
To explore the effect of climate change on dew condensation, 1764 sets of dew intensity monitoring data from 2005 to 2019 were selected to build a stepwise multiple linear regression model (Formula (3)), and 242 sets of dew intensity monitoring data from 2020 and 2021 were used to verify the model. The process of model establishment and verification are shown in the
Appendix A and
Appendix B. Dew formation was largely dependent on nocturnal RH and
V.
According to continuous observations from 2005 to 2021, the variation trend of the
LAI in each growth stage of
Syringa in Changchun was not significant. Assuming that the
LAI of
Syringa in Changchun from May to October remained unchanged, the change rate of the annual dew amount simulated by the model (Equation (3)) was −0.40 mm/10a (
p < 0.05) (
Figure 4e). With the decrease in nocturnal RH, the dew amount showed a downward trend, while dew condensation was negatively correlated with the
V (
Table 3). With climate change, the wind speed in Northeast China showed a downward trend, which made nighttime water vapor condensation easier. This trend was well reflected by the temporal variation series and the linear fitting line of the accumulative departure of the dew amount. Using 2017 as an example, the RH was the lowest (anomaly: −11.84%) and the wind speed was the highest (anomaly: 1.02 m/s) from 1957 to 2021. The annual dew amount in 2017 decreased significantly to only 17.69 mm (anomaly: −8.48 mm). This dew decline phenomenon was also reported in other areas due to climate change. During 1966–2005, the annual RH increased by 0.28–1.3%/10a, while the annual
Td increased by 0.15–0.29 °C/10a in the coastal area of Iran, showing an obvious trend of warming and drying [
54]. Atashi et al. found that the dew intensity during 2001–2014 was lower than the overall mean during the past 40 years as a result of climate change in Iran [
20]. Tomaszkiewicz et al. forecasted trends under future climatic scenarios and showed a 27% decline in the dew amount during the critical summer months in 2080 in the Mediterranean region [
55]. Compared with other parts of the world, climate change has a weak impact on the annual dew amount in Changchun. This is because the climate characteristics in Changchun are suitable for dew condensation. Although the warming and drying trend is obvious, the wind speed shows a declining trend, which is conducive to dew condensation.


