

Mapping of Groundwater, Flood, and Drought Potential Zones in Neom, Saudi Arabia, Using GIS and Remote Sensing Techniques


Abstract
1. Introduction
2. Materials and Methods
2.1. Study Area
2.2. Geology of the Study Area
2.3. Topography and Hydrology
2.4. Methodology
3. Results
3.1. Drainage Density
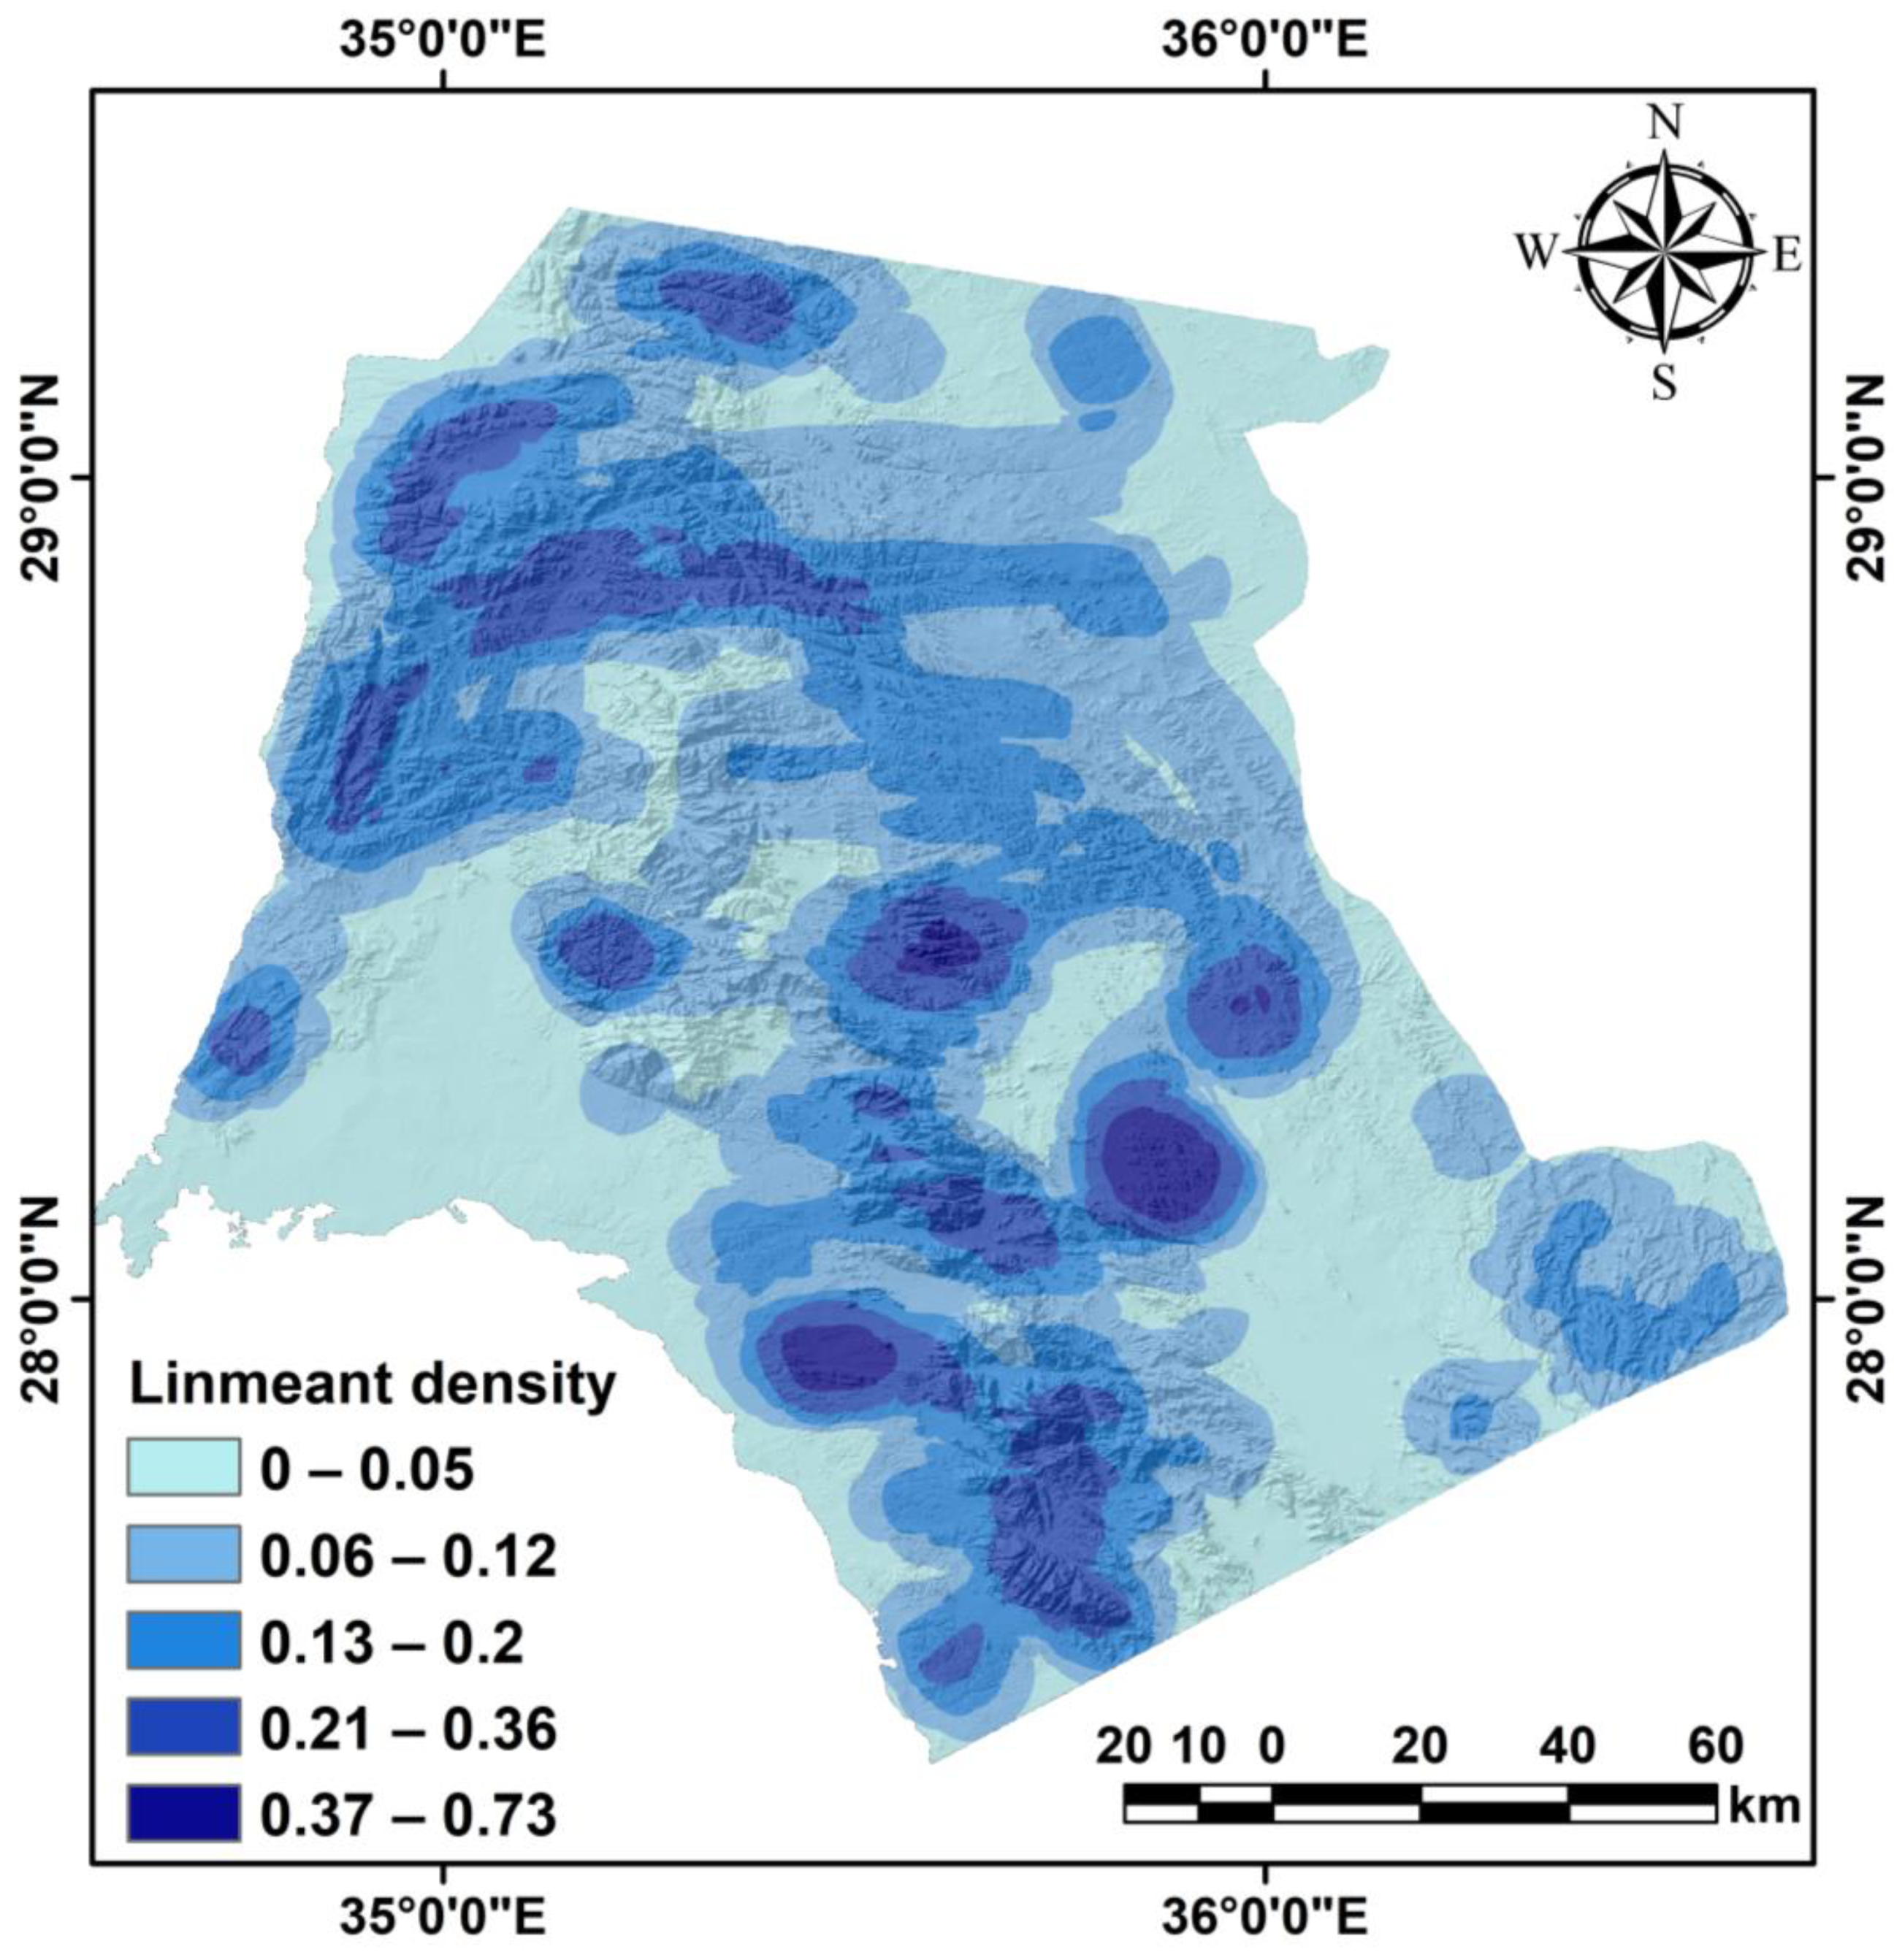
3.2. Lineament Density
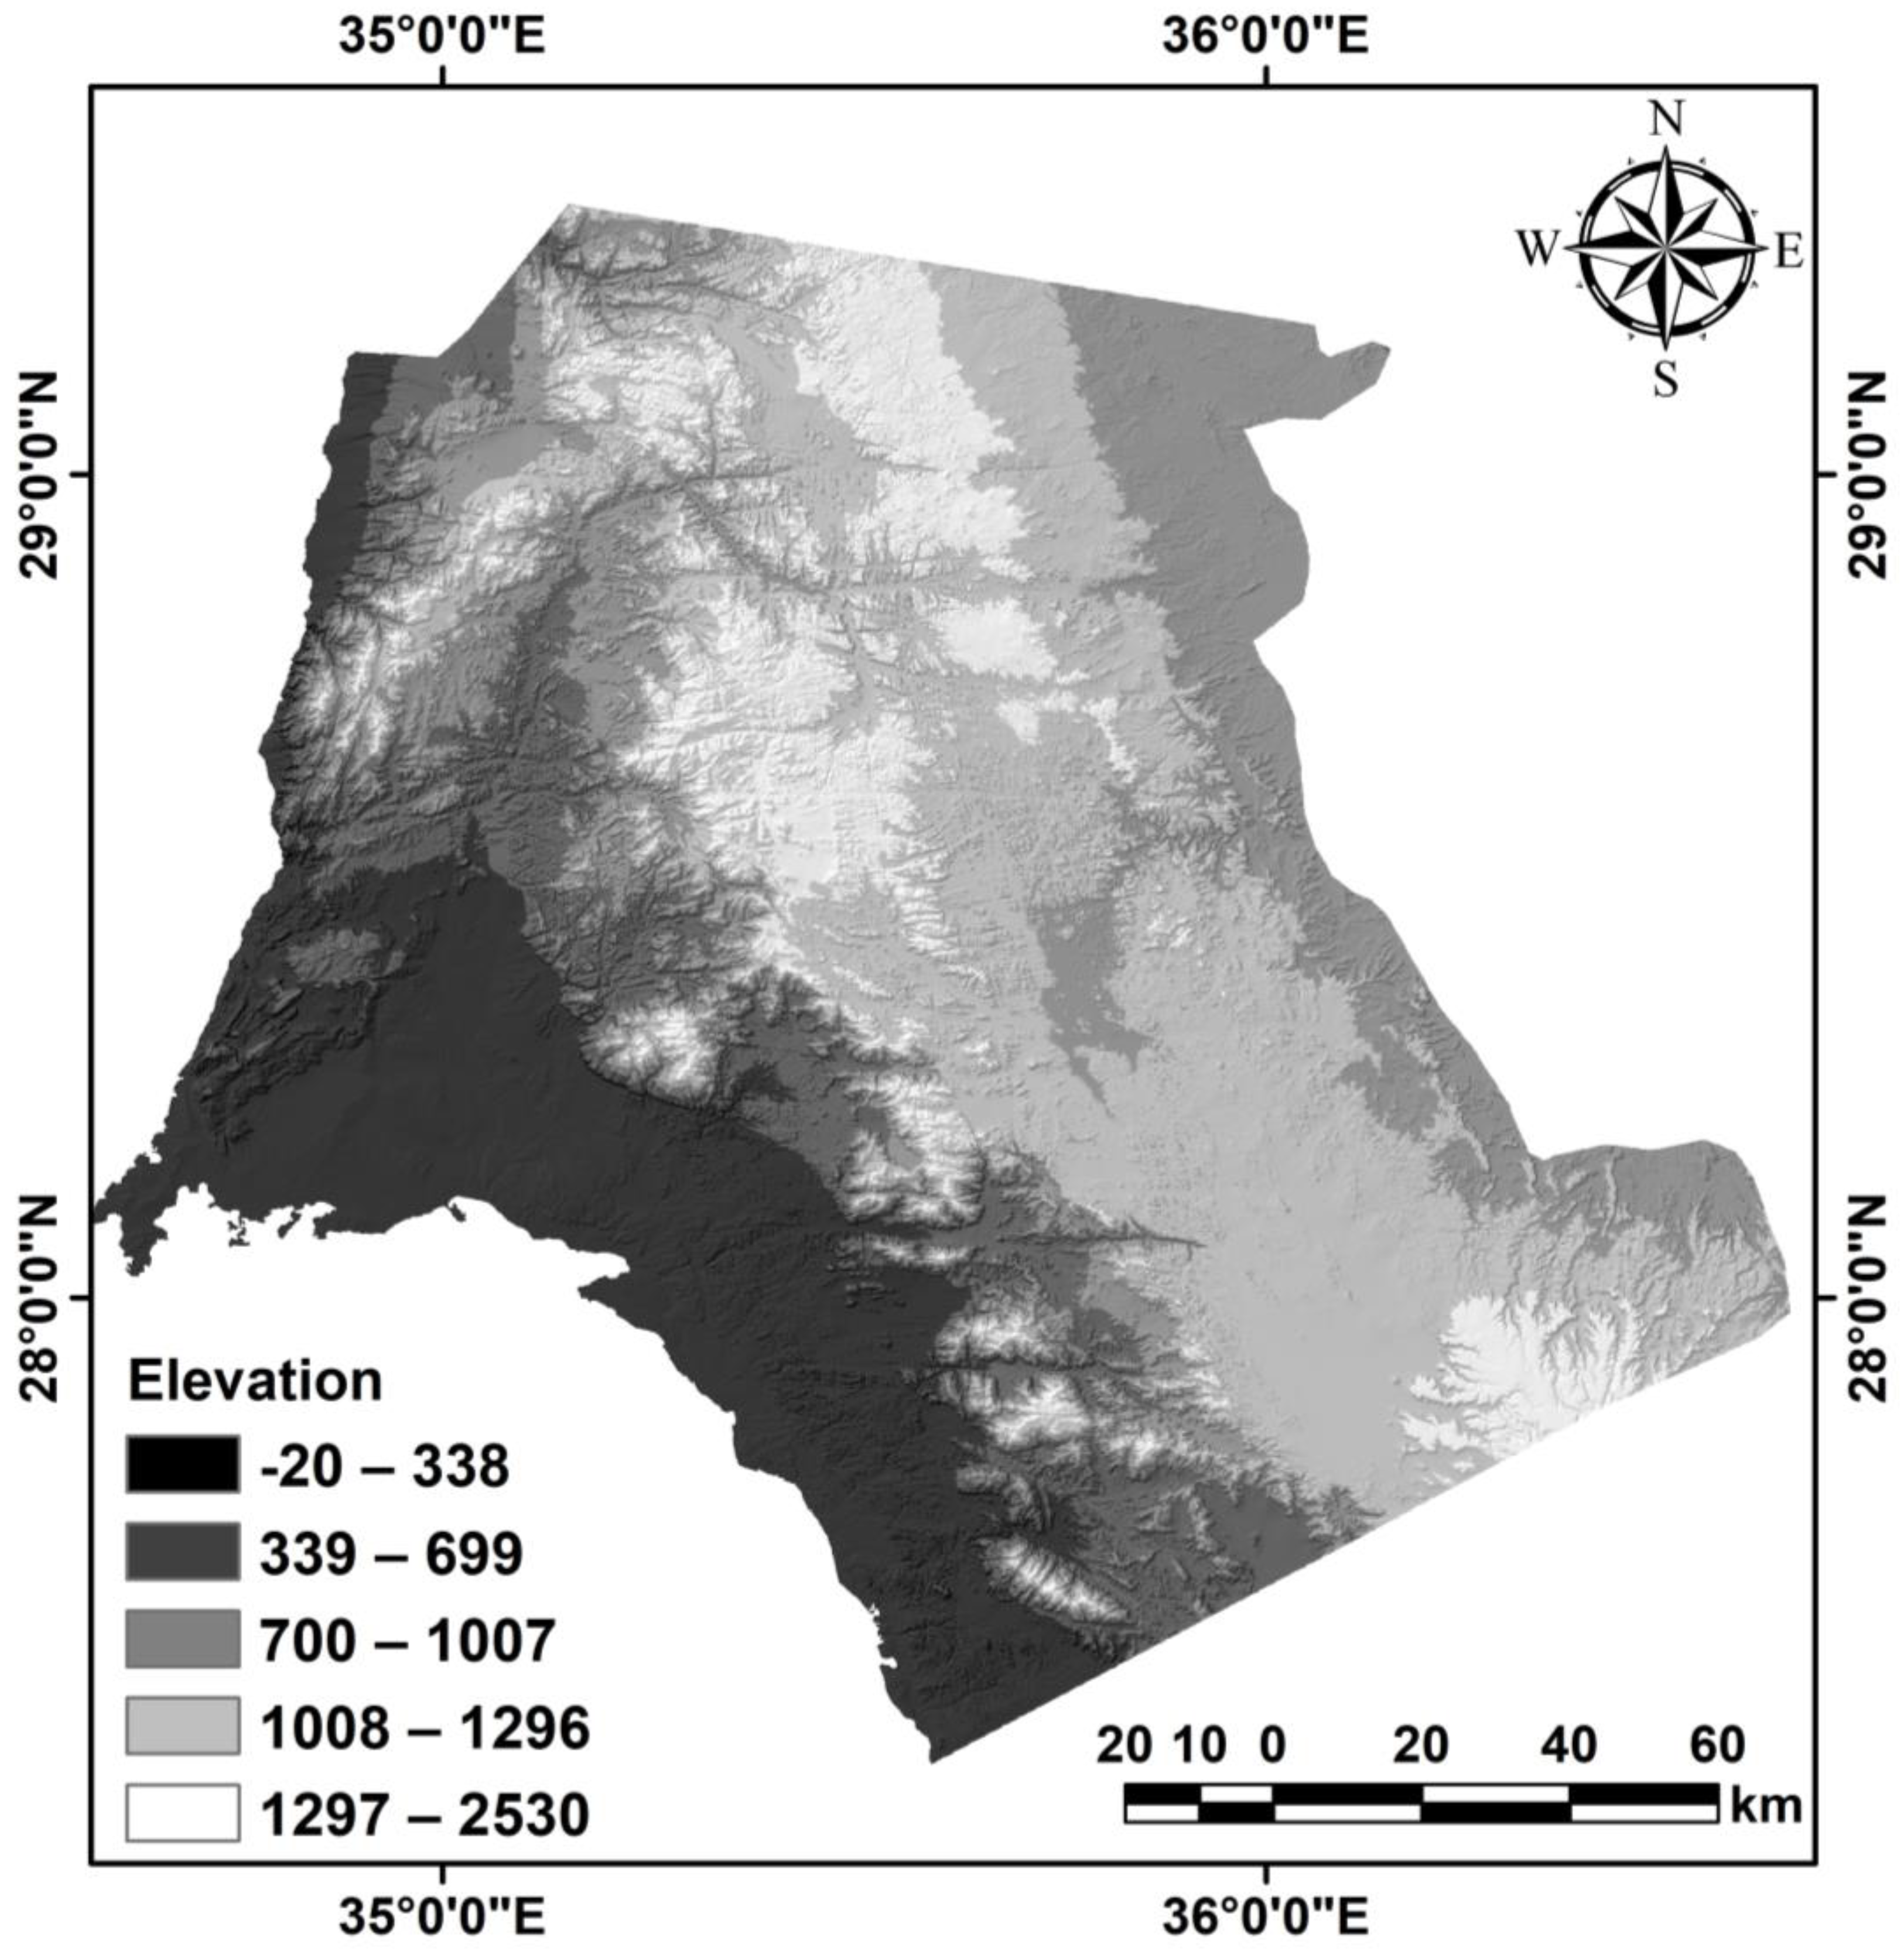
3.3. Elevation
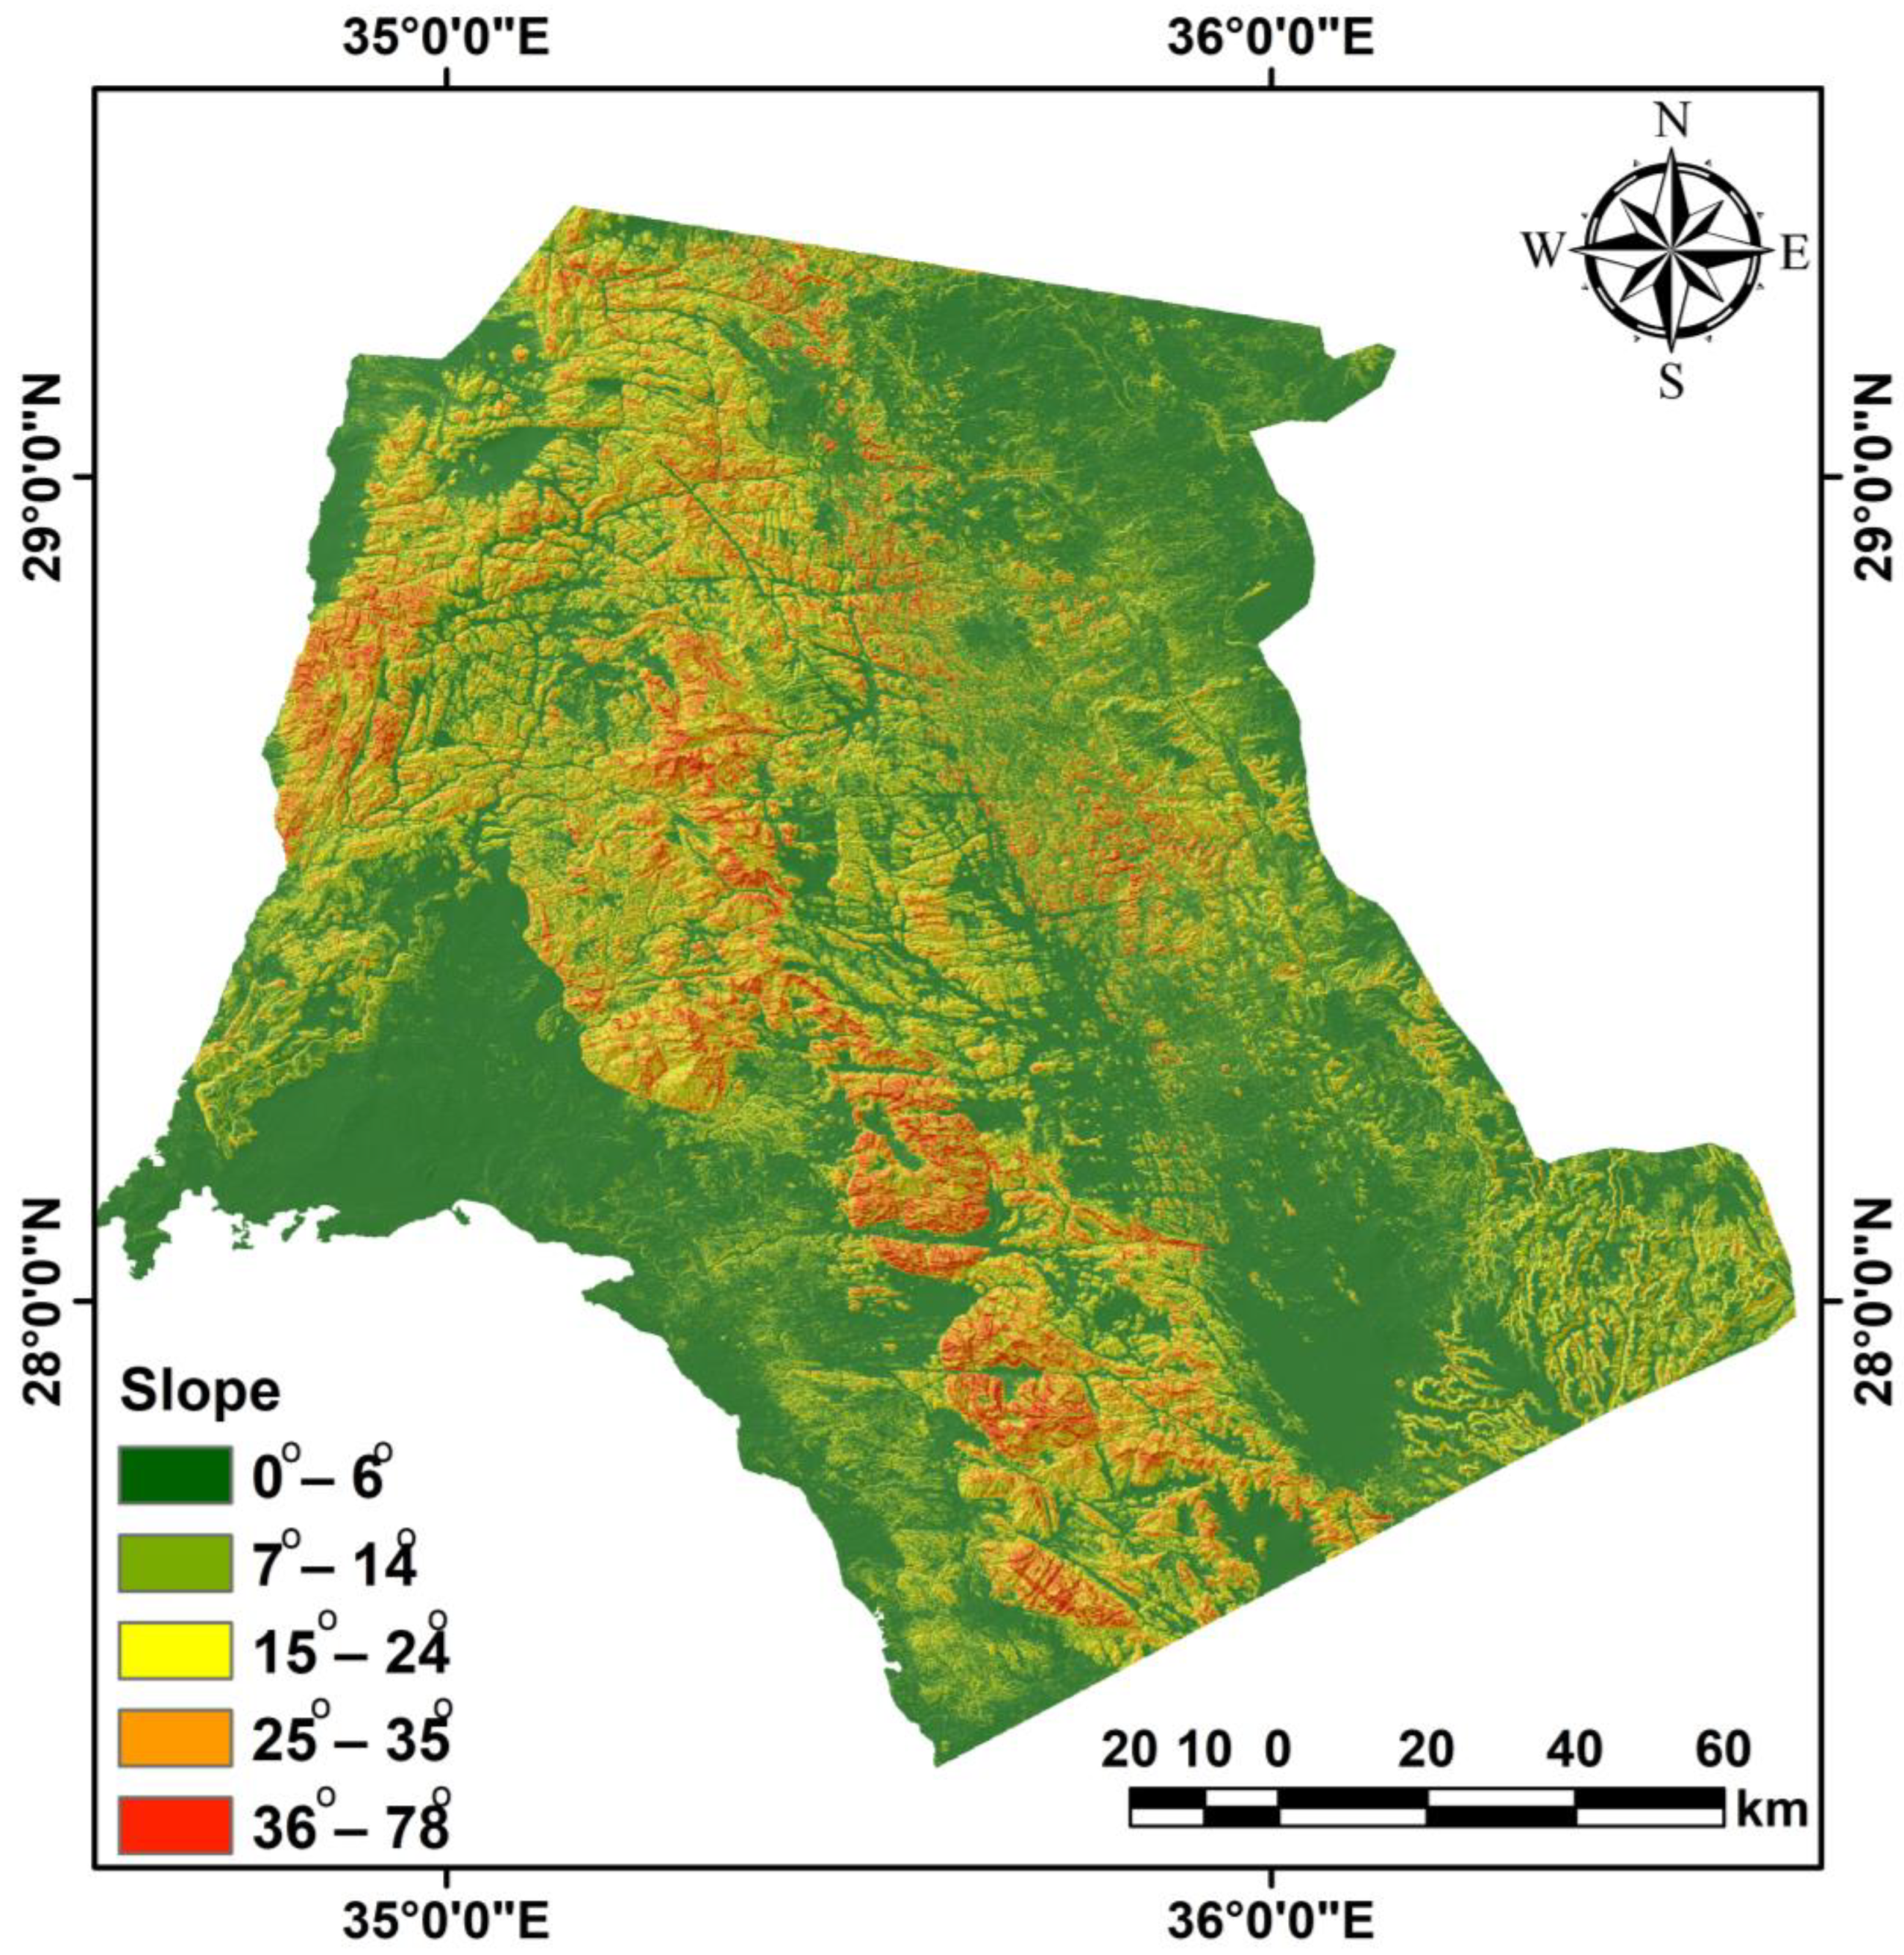
3.4. Slope
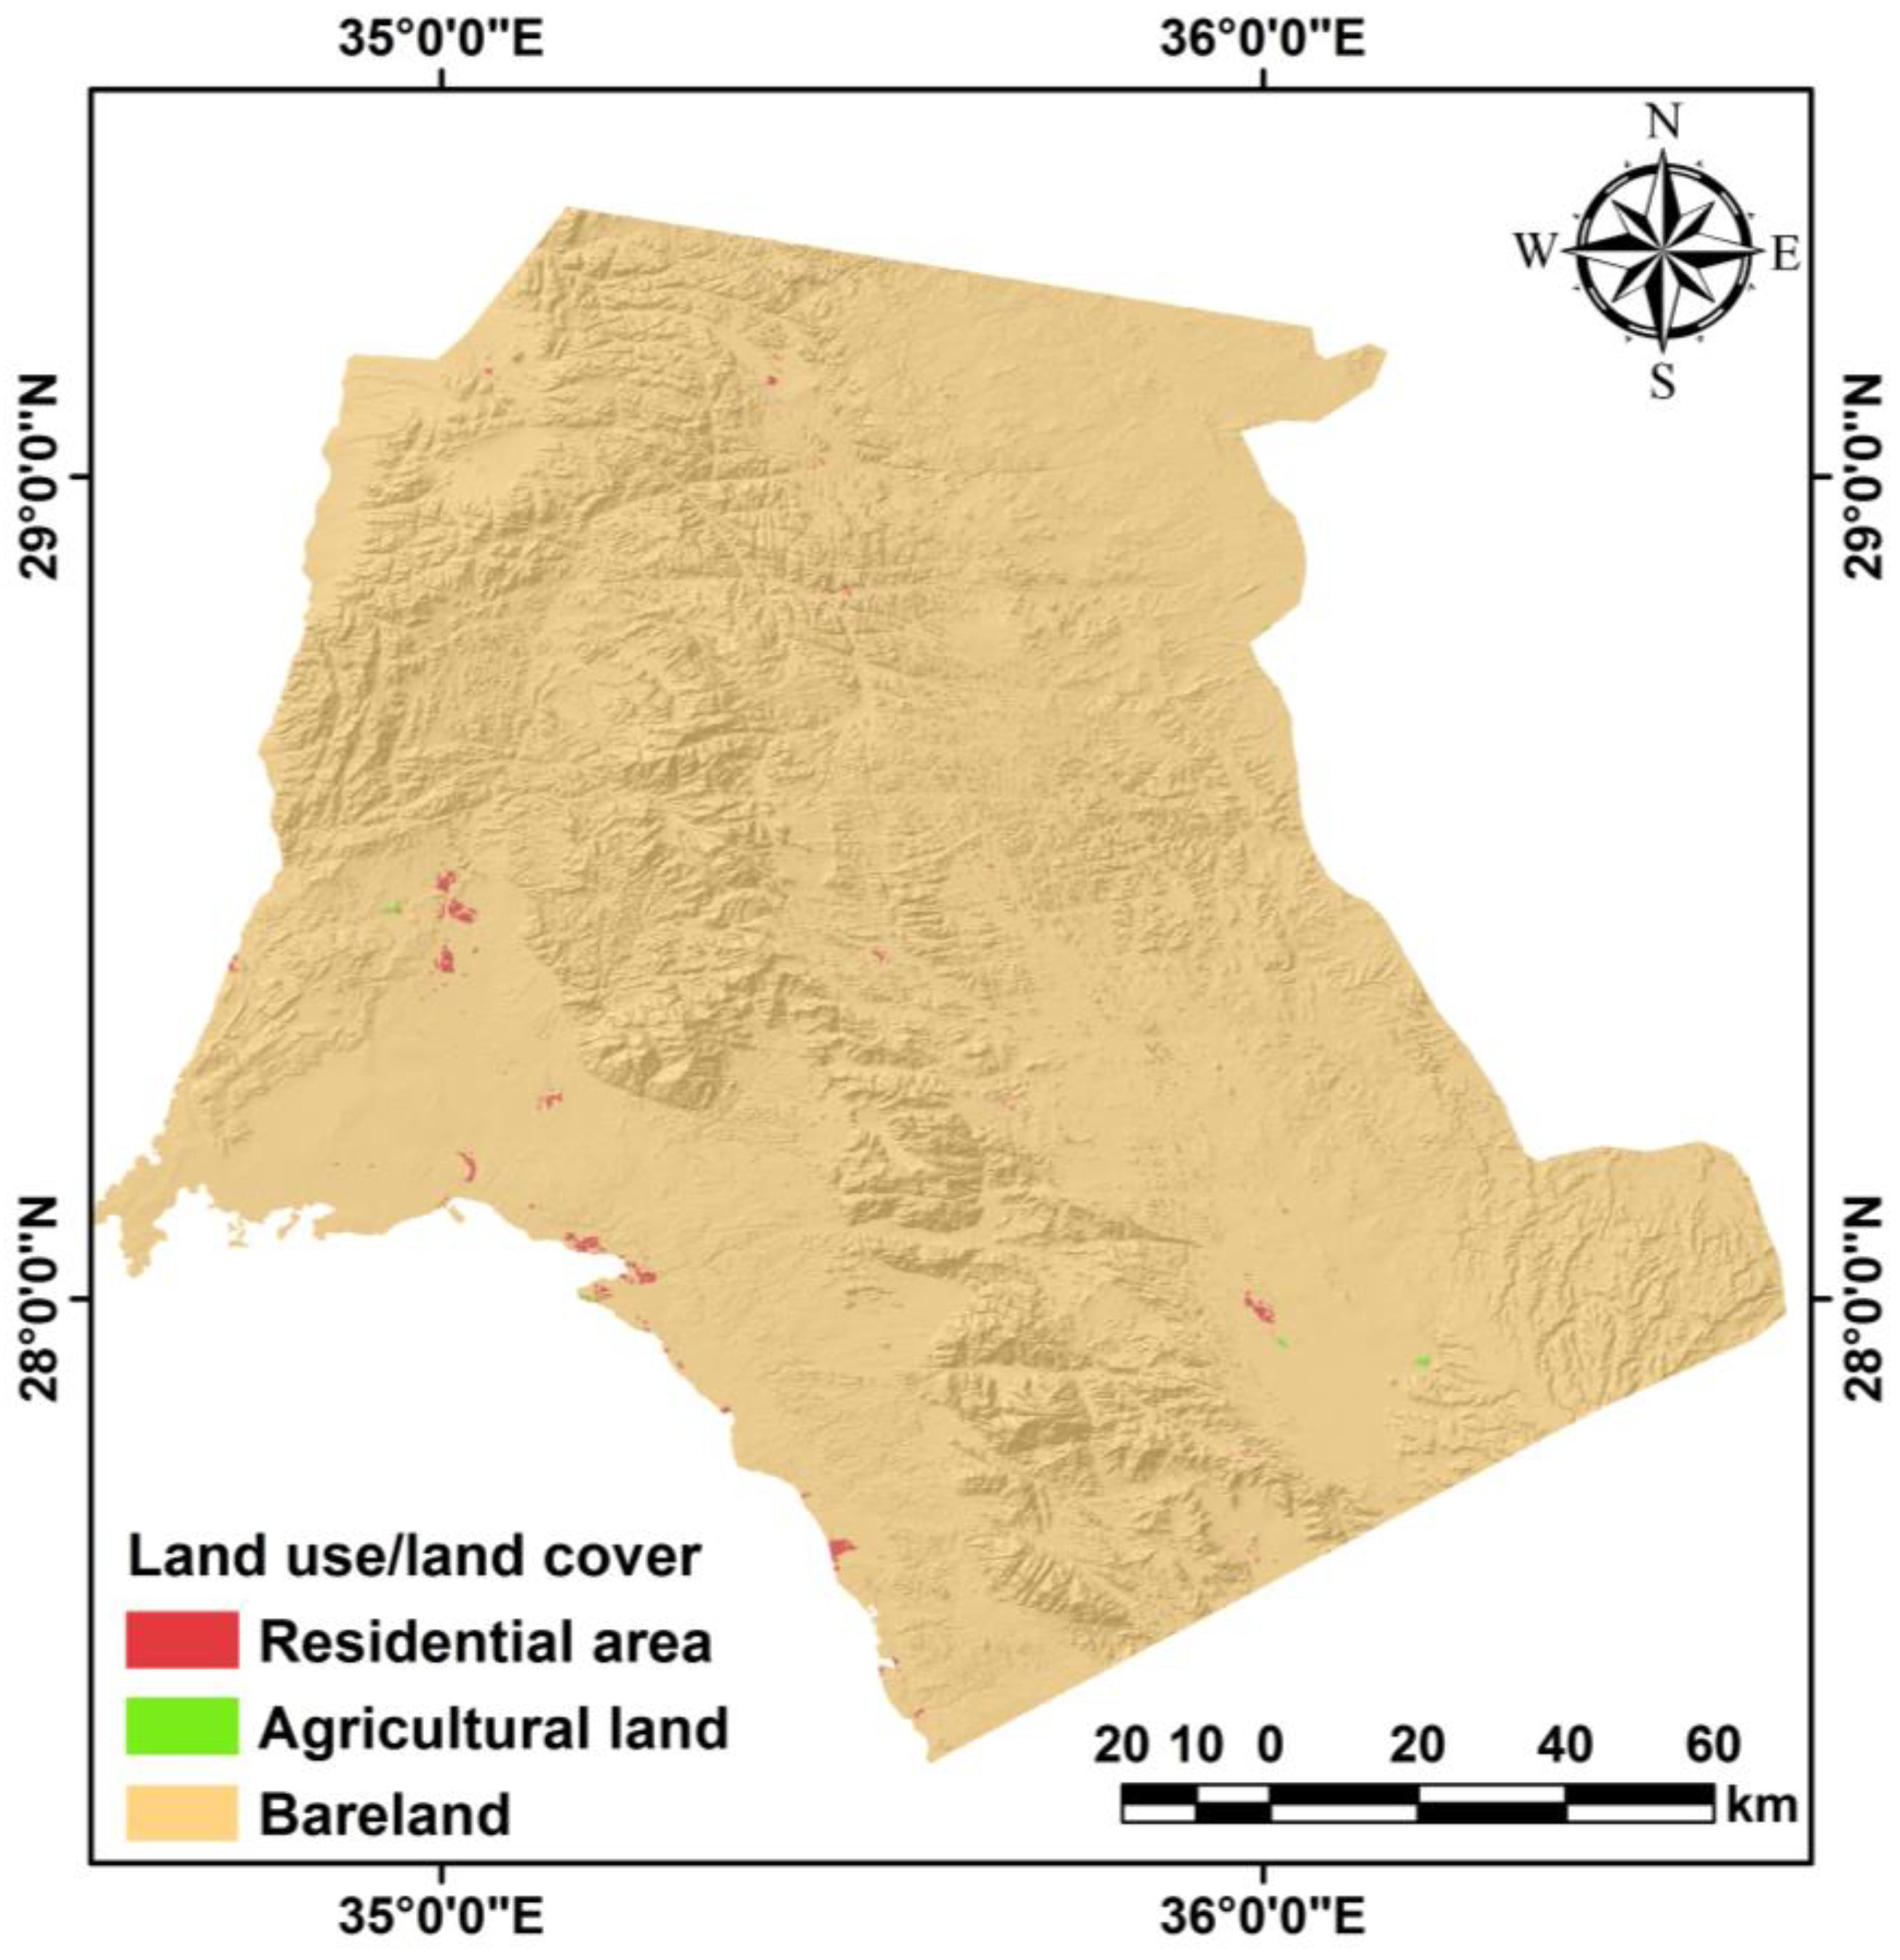
3.5. Land Use and Land Cover
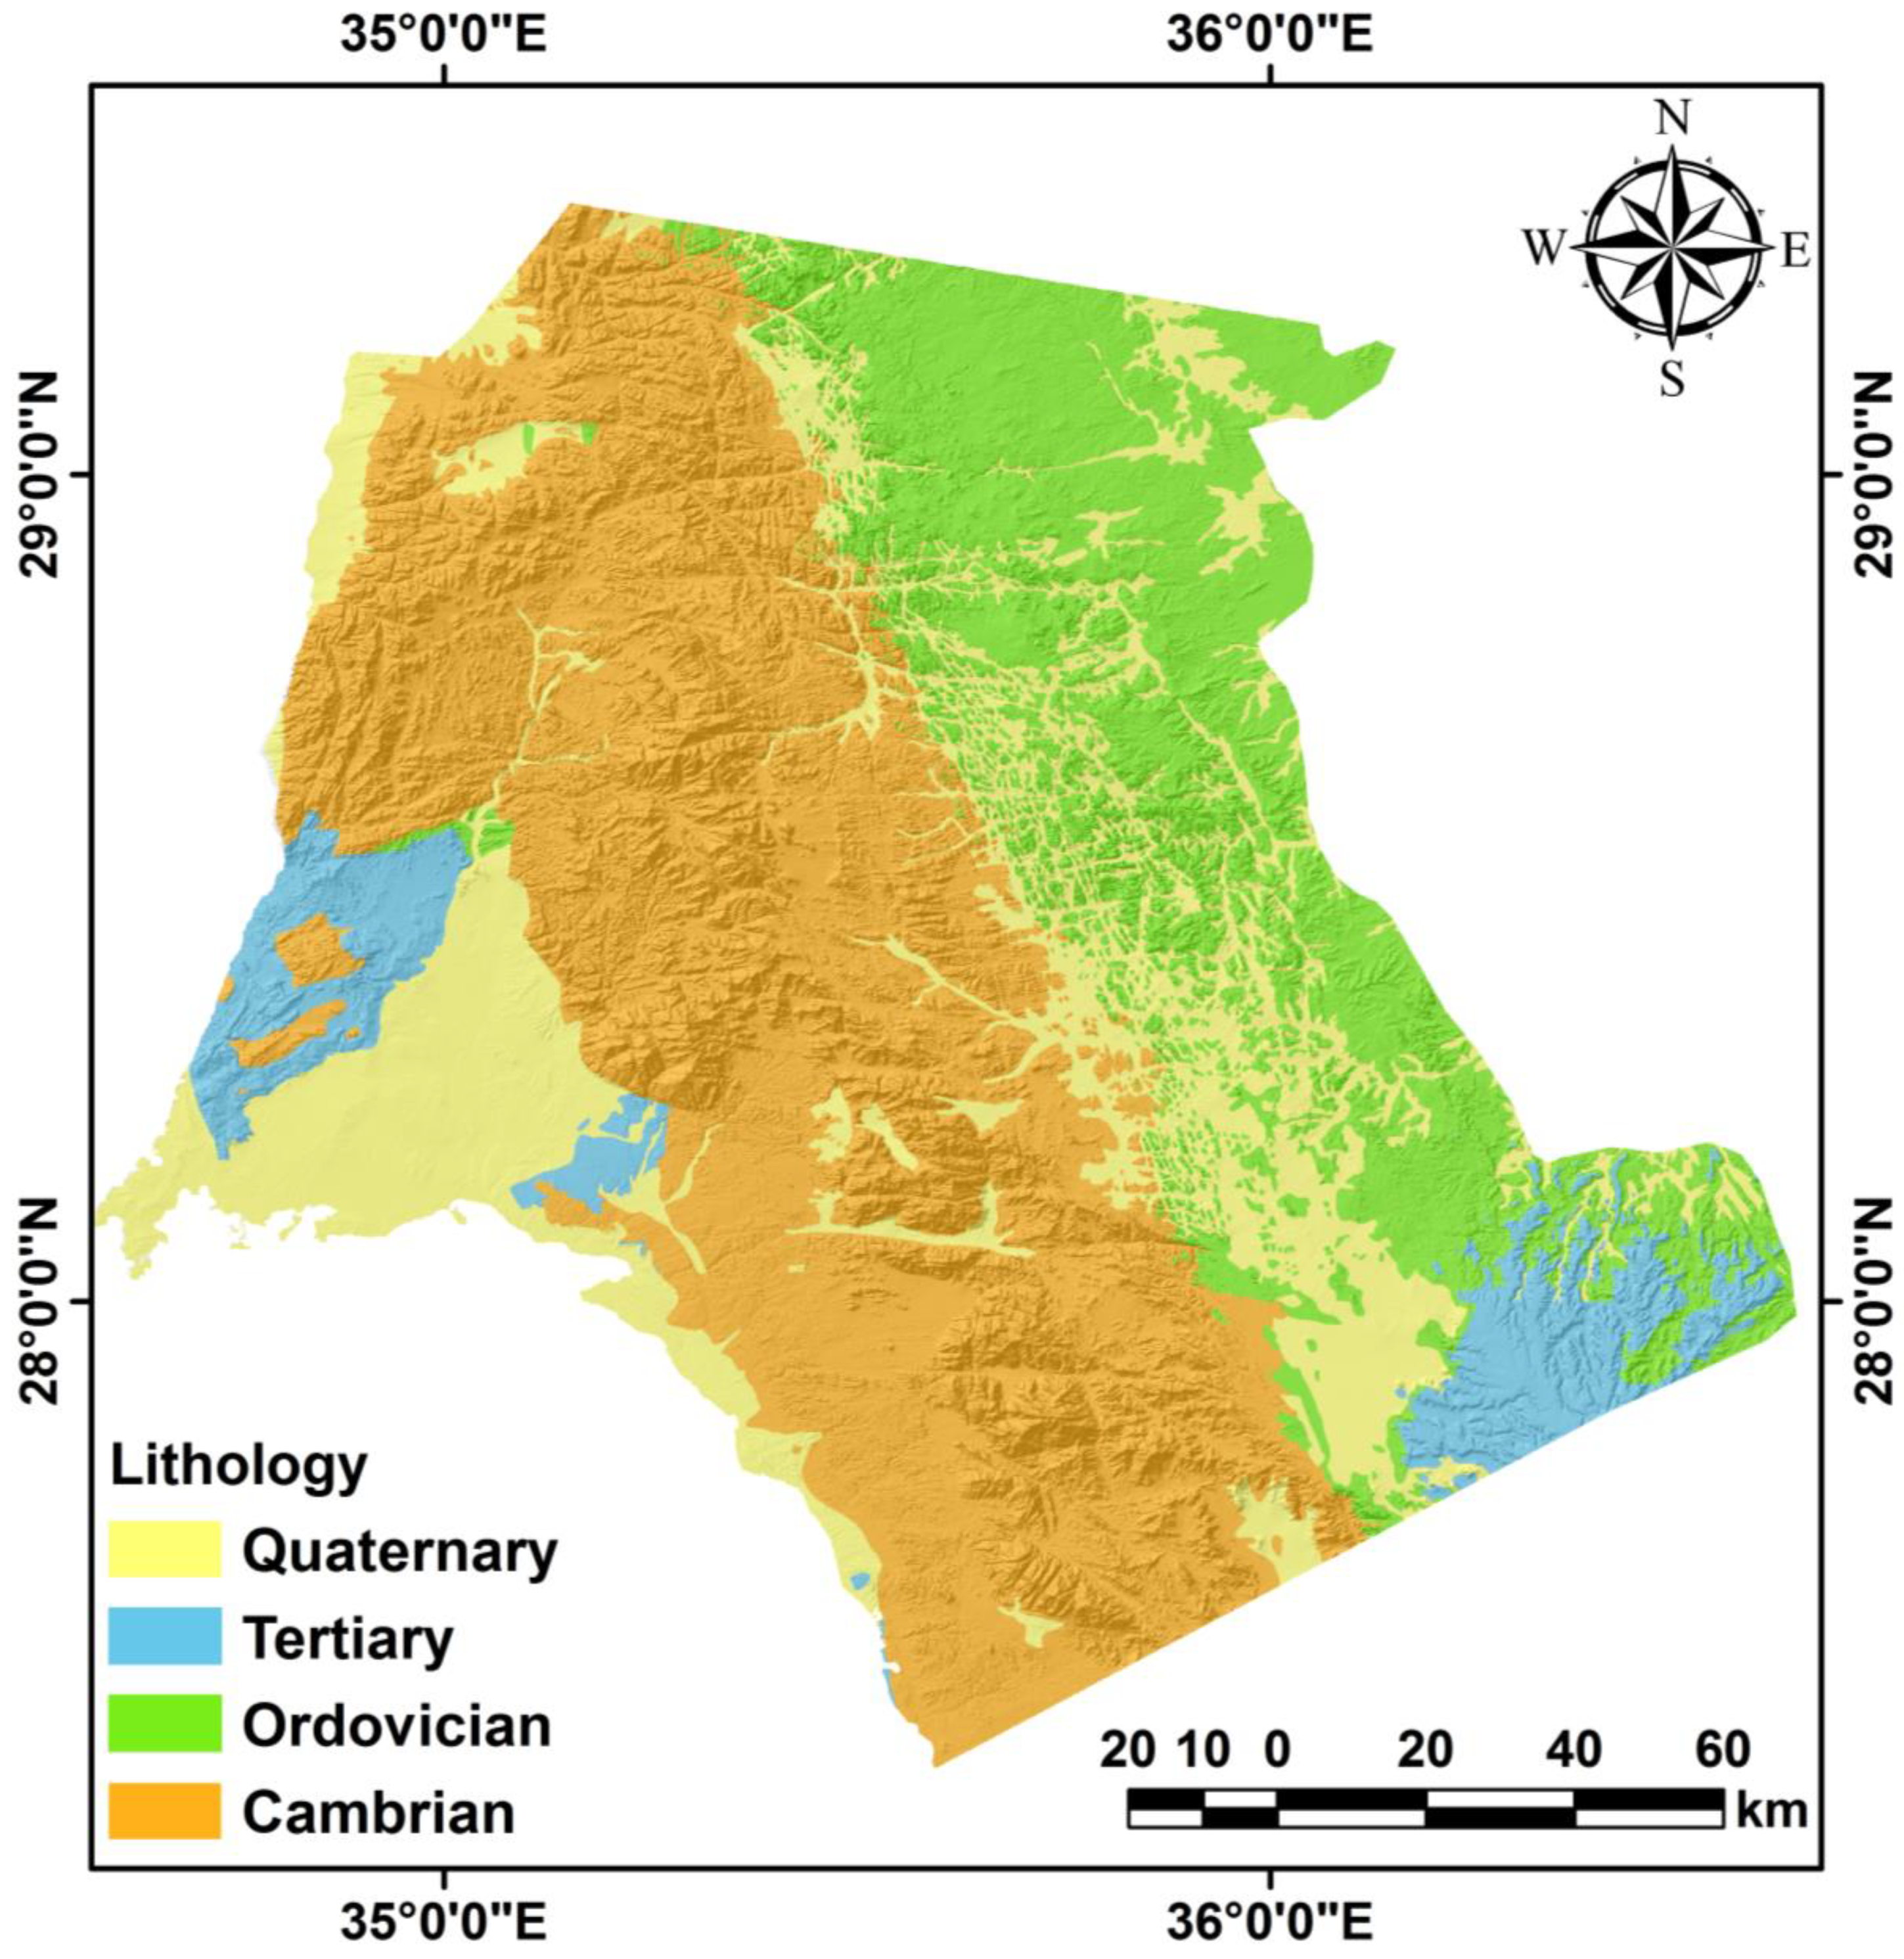
3.6. Lithology
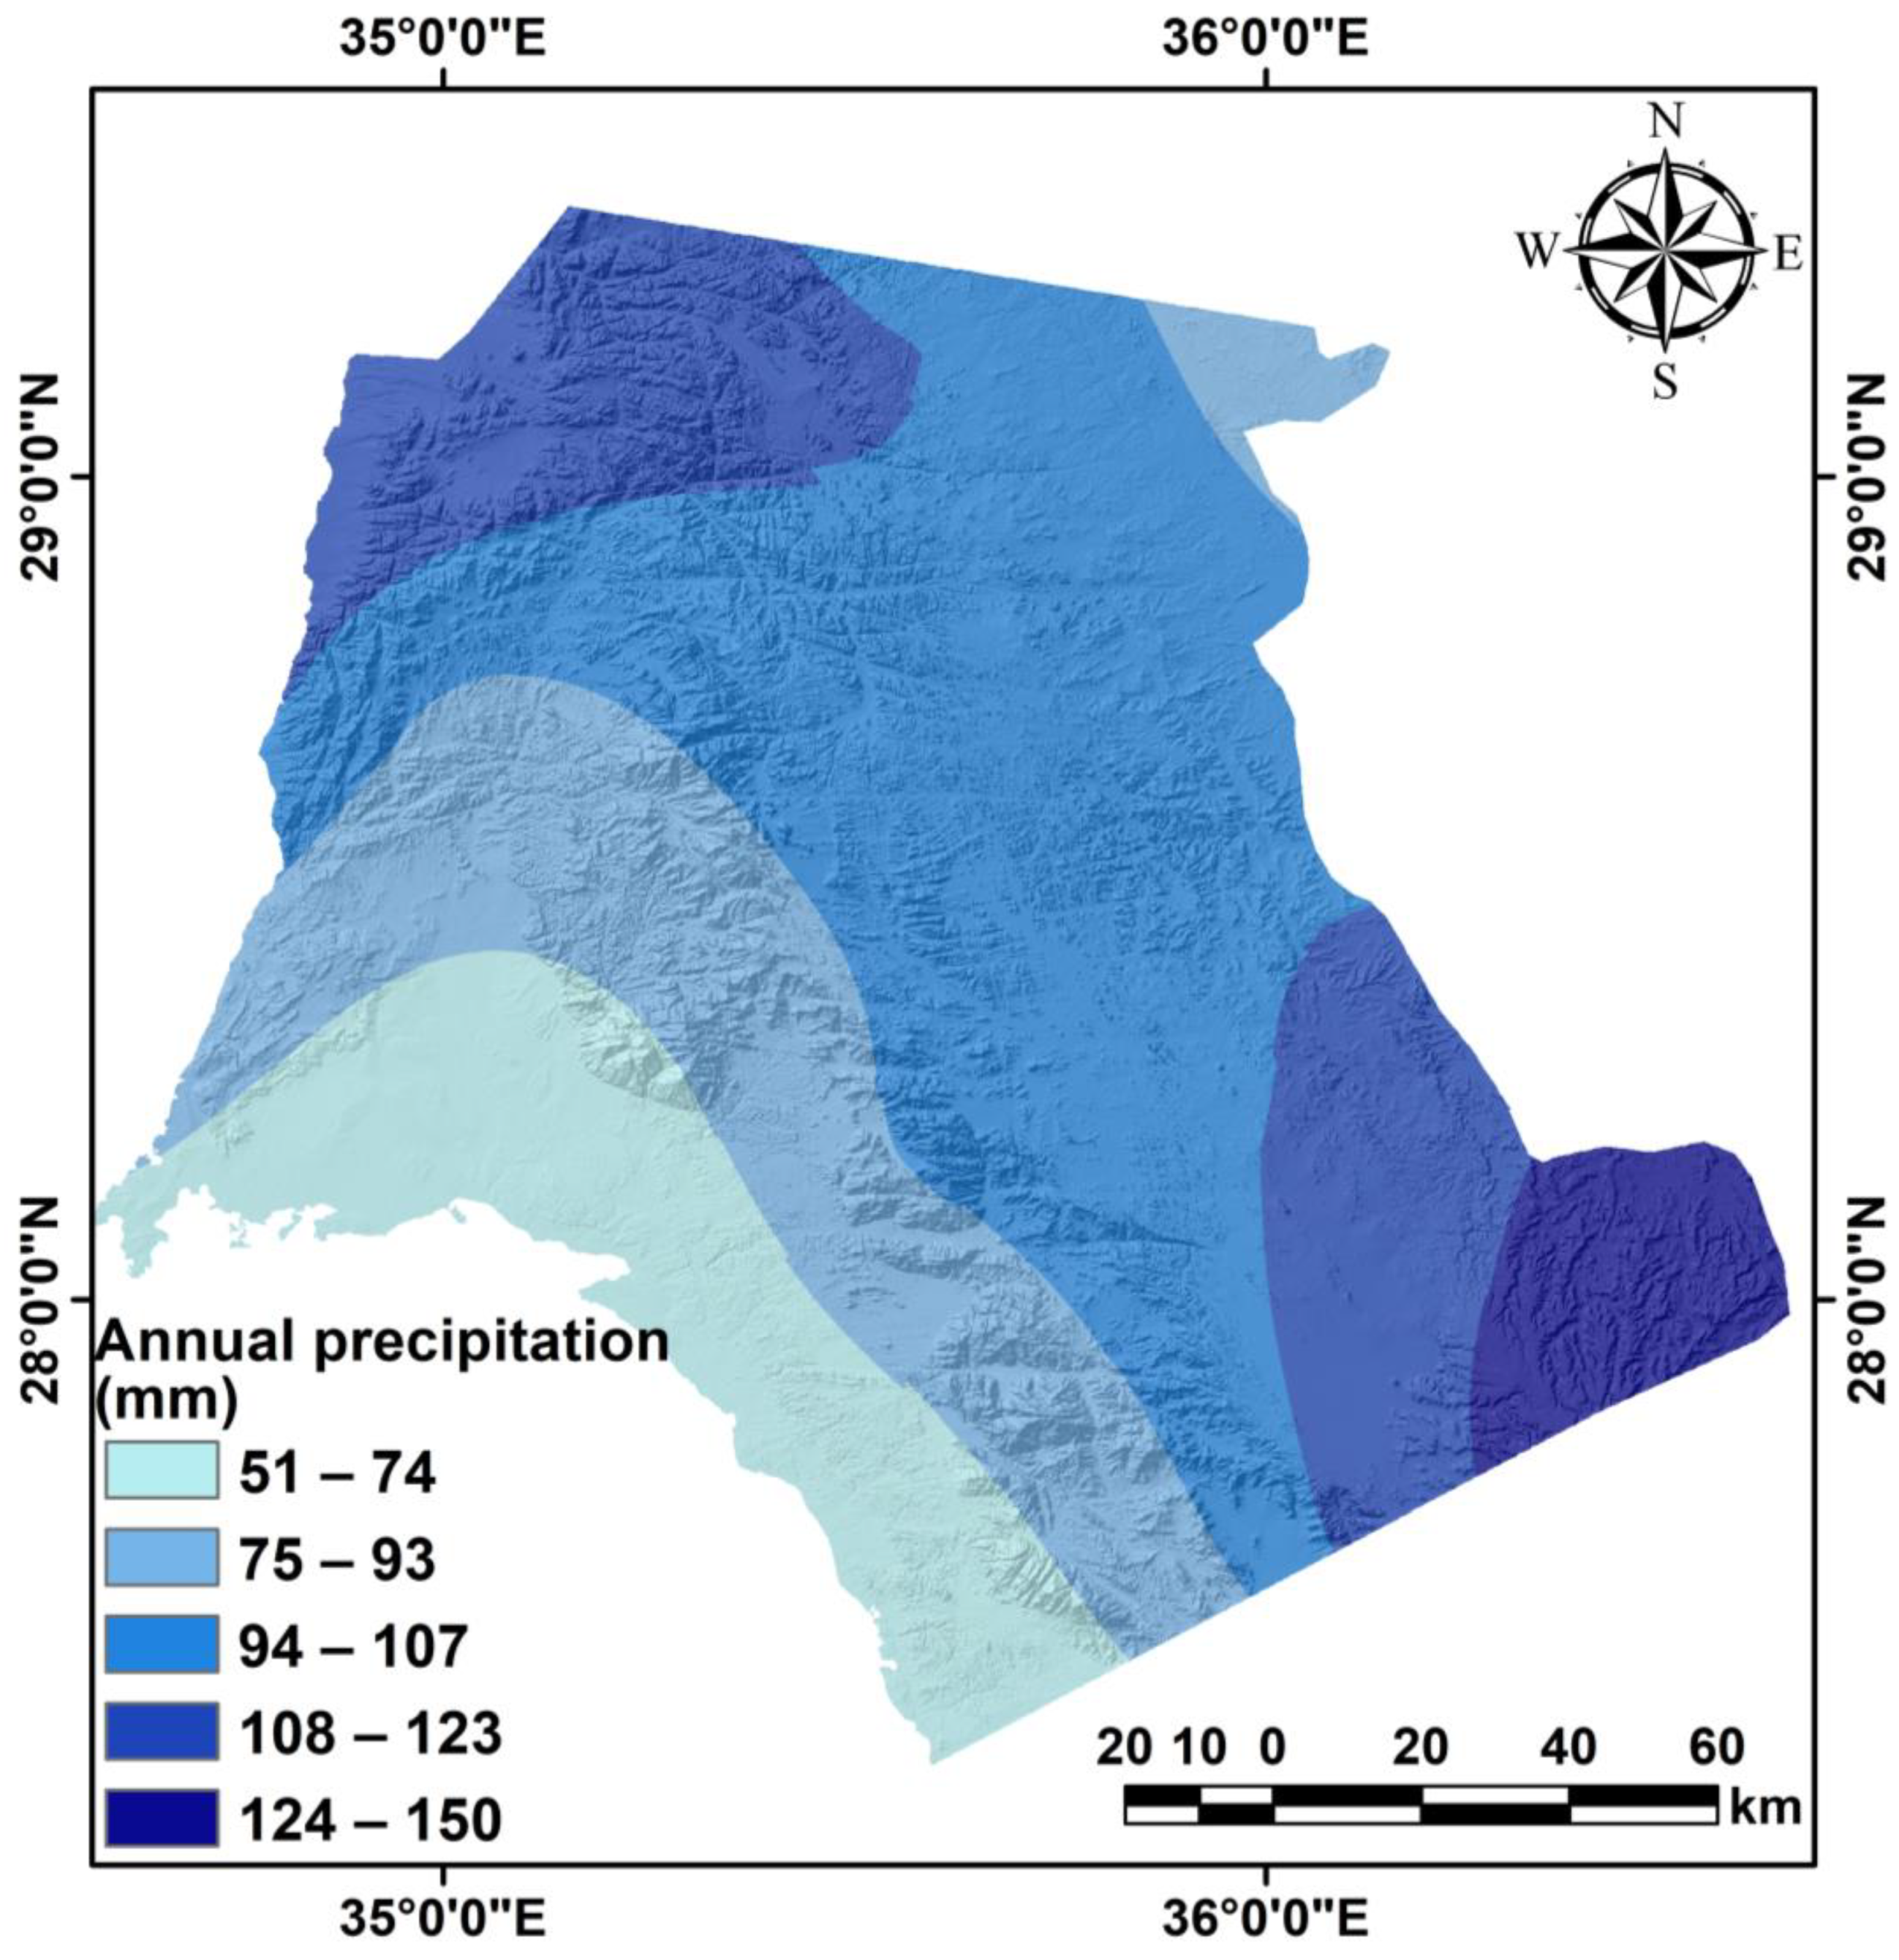
3.7. Annual Precipitation
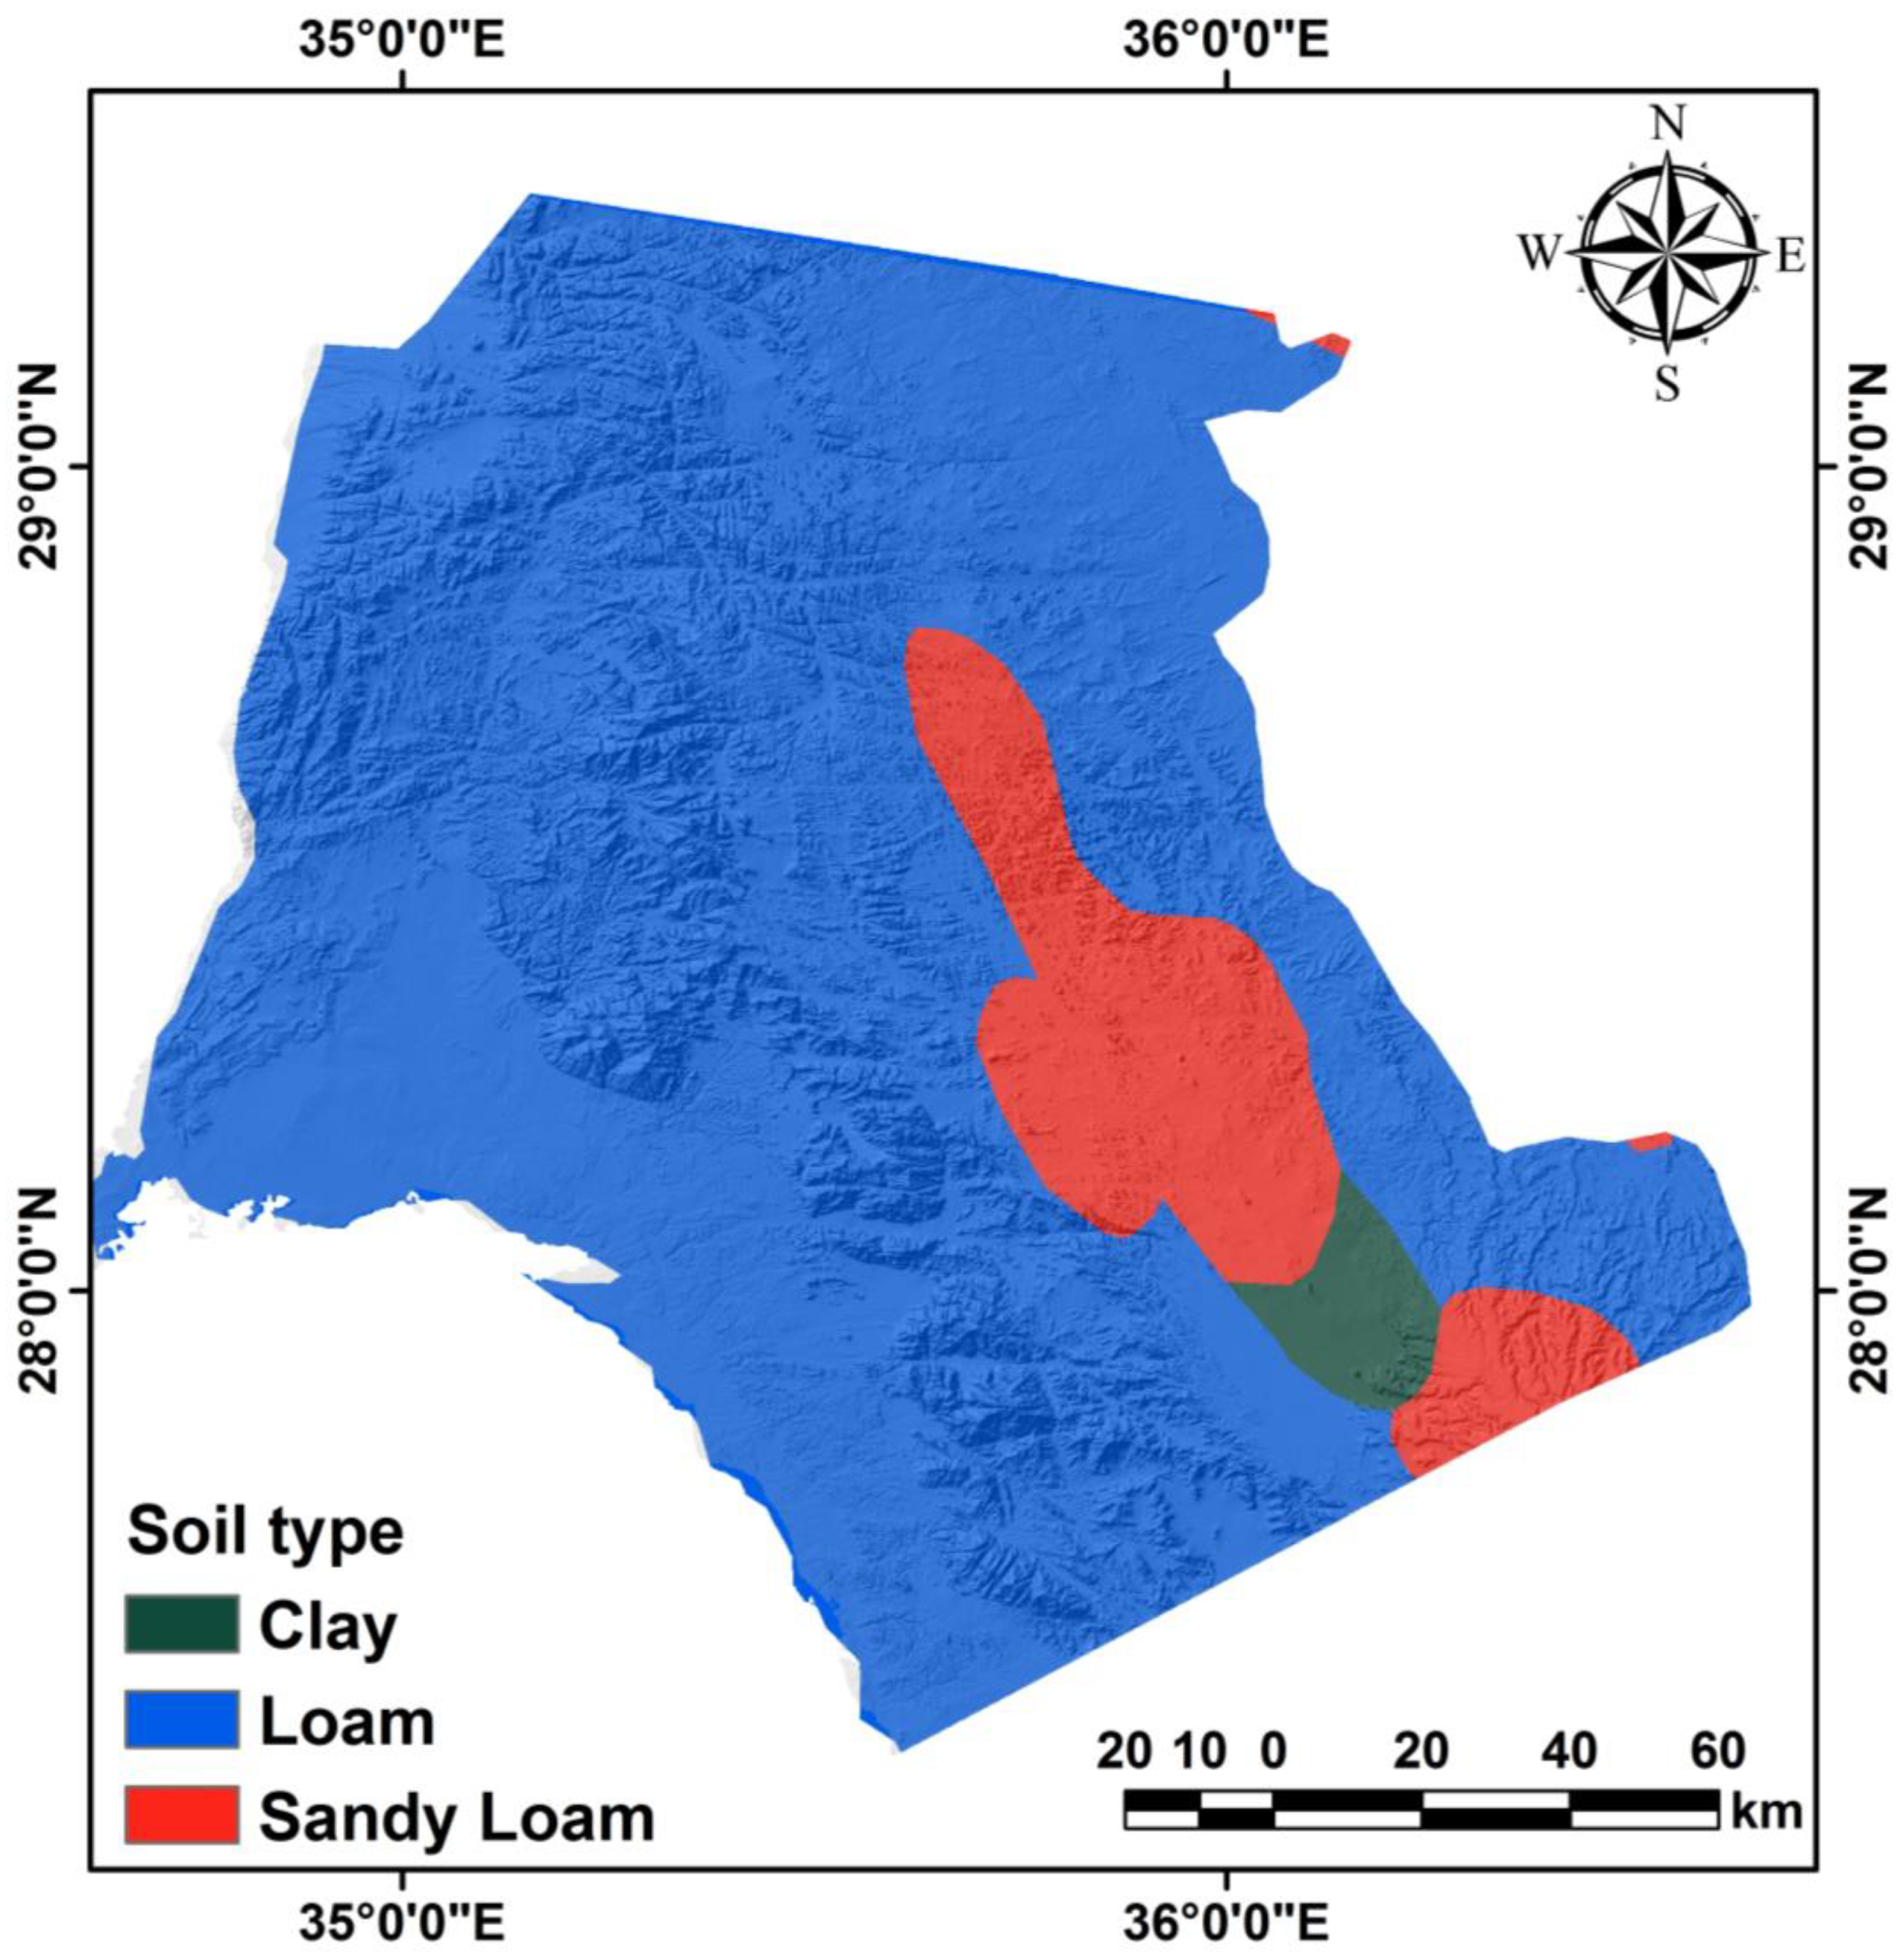
3.8. Soil Type
3.9. Determination of Groundwater, Flood, and Drought Zones
3.9.1. Groundwater Potential Zoning
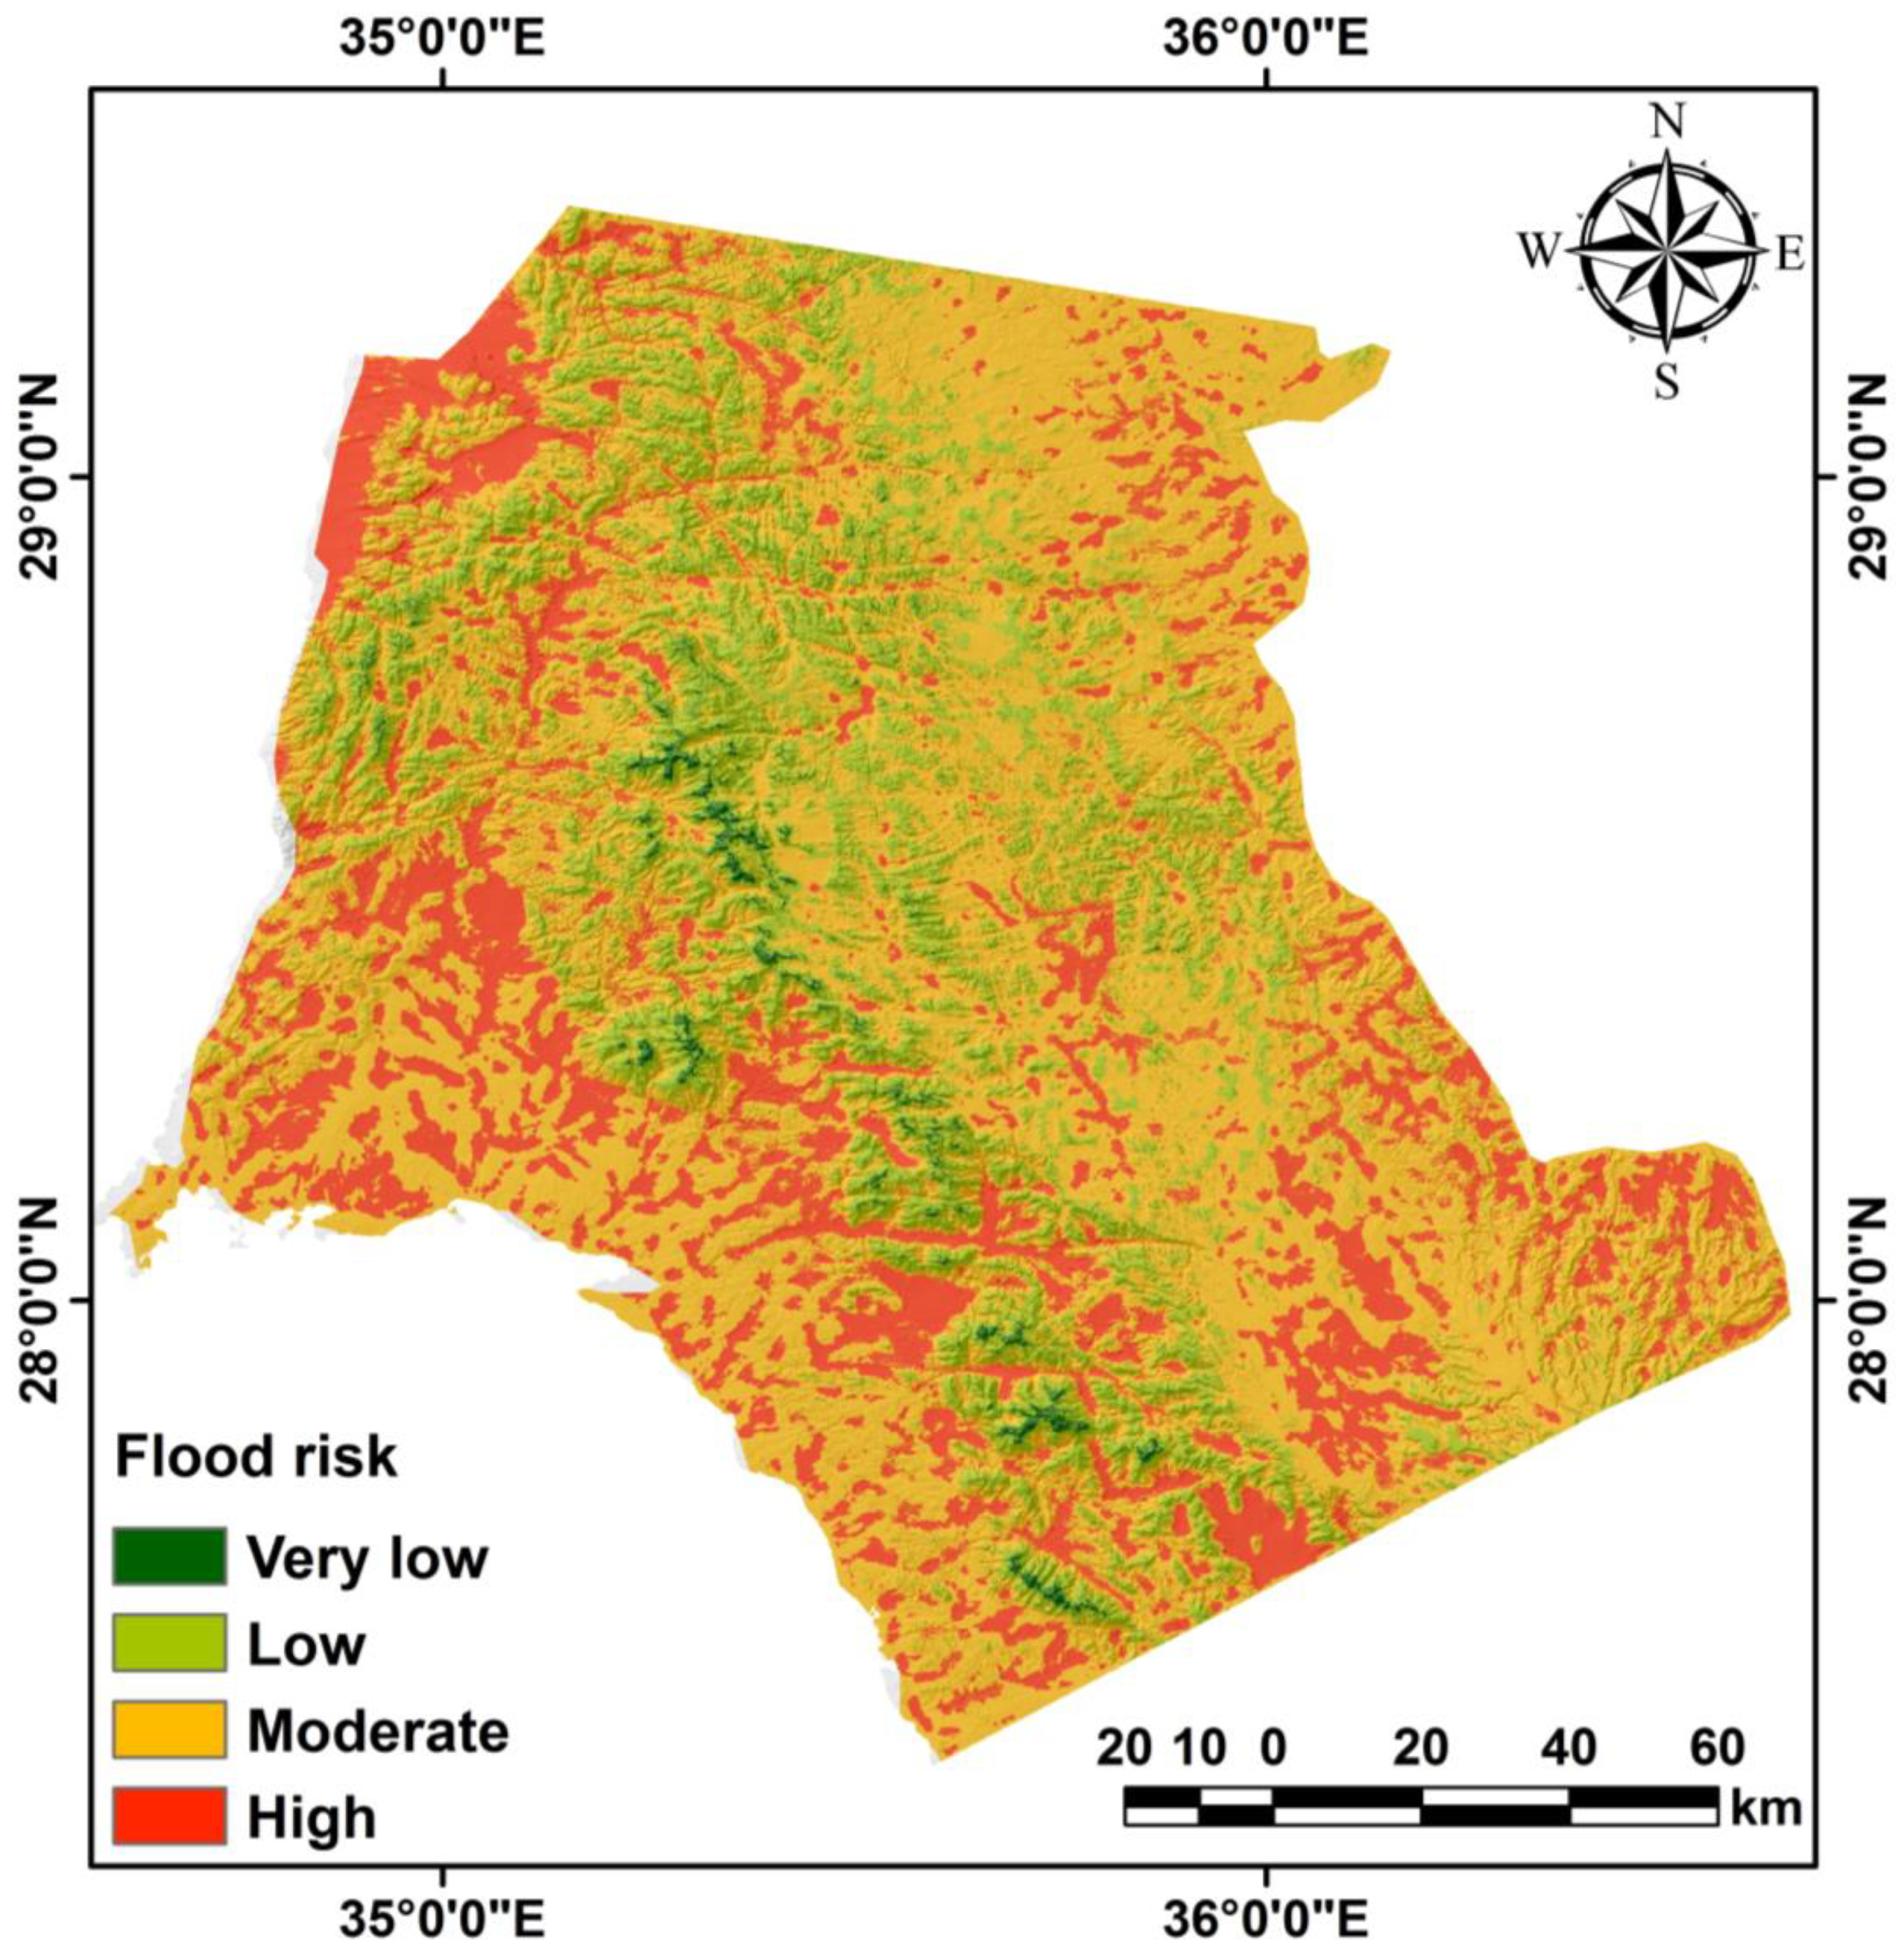
3.9.2. Flood Potential Zoning
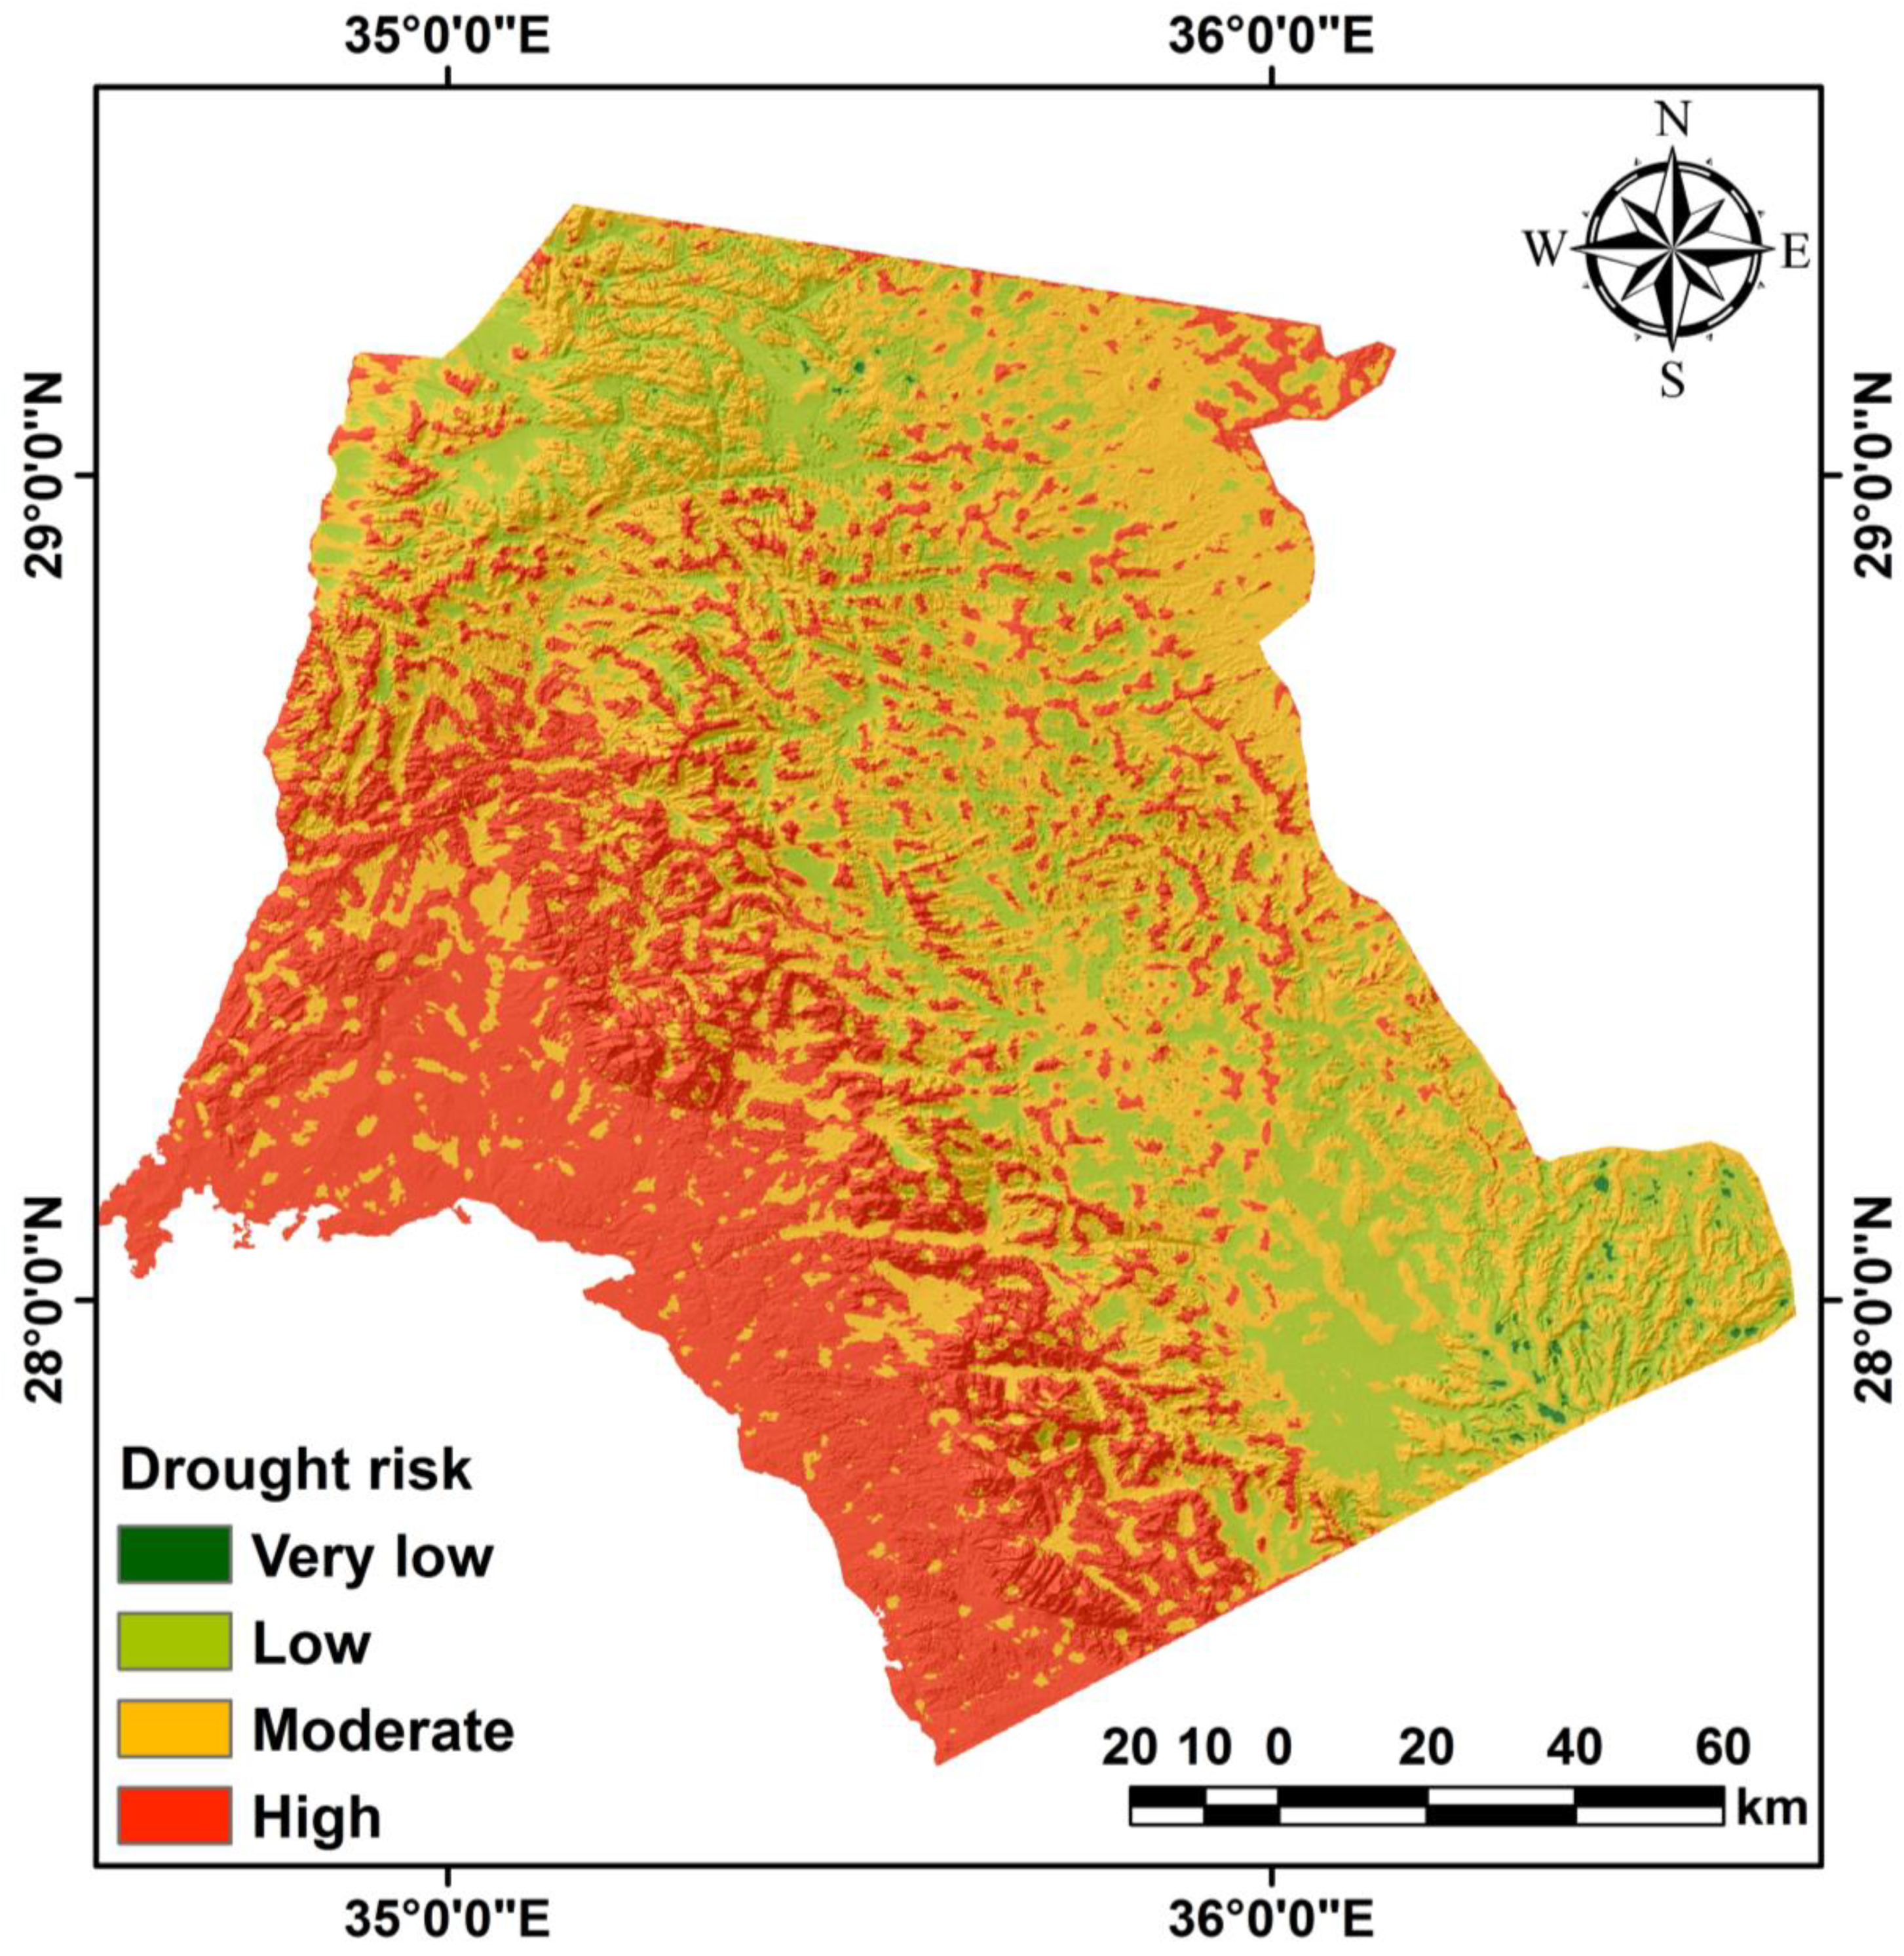
3.9.3. Drought Potential Zoning
4. Conclusions
Funding
Informed Consent Statement
Data Availability Statement
Acknowledgments
Conflicts of Interest
References
- Fallatah, K. Guide for Sustainable Design of NEOM City; Rochester Institute of Technology: Rochester, NY, USA, 2019; MSc; p. 73. [Google Scholar]
- Al-Sefry, S.A.; Şen, Z. Groundwater rise problem and risk evaluation in major cities of arid lands–Jedddah Case in Kingdom of Saudi Arabia. Water Resour. Manag. 2006, 20, 91–108. [Google Scholar] [CrossRef]
- El Waheidi, M.M.; Ghrefat, H.; Qaysi, S.; Batayneh, A.T.; Russo, G.; Jallouli, C.; Badhris, O.; Maeshi, T.; Elawadhi, E.A.; Bahkali, I. Hydrogeophysical characterization of the coastal aquifer system in the northeast Gulf of Aqaba (Saudi Arabia): An investigation in the context of groundwater resources management. J. Coast. Res. 2021, 37, 41–51. [Google Scholar] [CrossRef]
- Youssef, A.M.; Sefry, S.A.; Pradhan, B.; Alfadail, E.A. Analysis on causes of flash flood in Jeddah city (Kingdom of Saudi Arabia) of 2009 and 2011 using multi-sensor remote sensing data and GIS. Geom. Nat. Hazards Risk 2016, 7, 1018–1042. [Google Scholar] [CrossRef]
- Almazroui, M.; Islam, M.N. Coupled model intercomparison project database to calculate drought indices for Saudi Arabia: A preliminary assessment. Earth Syst. Environ. 2019, 3, 419–428. [Google Scholar] [CrossRef]
- Almazroui, M. Assessment of meteorological droughts over Saudi Arabia using surface rainfall observations during the period 1978–2017. Arab. J. Geosci. 2019, 12, 694. [Google Scholar] [CrossRef]
- Alarifi, S.S.; Abdelkareem, M.; Abdalla, F.; Alotaibi, M. Flash Flood Hazard Mapping Using Remote Sensing and GIS Techniques in Southwestern Saudi Arabia. Sustainability 2022, 14, 14145. [Google Scholar] [CrossRef]
- Akhtar, N.; Syakir Ishak, M.I.; Bhawani, S.A.; Umar, K. Various Natural and Anthropogenic Factors Responsible for Water Quality Degradation: A Review. Water 2021, 13, 2660. [Google Scholar] [CrossRef]
- Akhtar, N.; Ishak, M.I.S.; Ahmad, M.I.; Umar, K.; Md Yusuff, M.S.; Anees, M.T.; Qadir, A.; Ali Almanasir, Y.K. Modification of the Water Quality Index (WQI) Process for Simple Calculation Using the Multi-Criteria Decision-Making (MCDM) Method: A Review. Water 2021, 13, 905. [Google Scholar] [CrossRef]
- Chaudhari, R.V.; Lal, D.; Dutta, S.; Umrikar, B.; Halder, S. Weighted overlay analysis for delineation of groundwater potential zone: A case study of pirangut river basin. Int. J. Remote Sens. Geosci. 2018, 7, 2319, 3484. [Google Scholar]
- Cai, T.; Li, X.; Ding, X.; Wang, J.; Zhan, J. Flood risk assessment based on hydrodynamic model and fuzzy comprehensive evaluation with GIS technique. Int. J. Disaster Risk Reduc. 2019, 35, 101077. [Google Scholar] [CrossRef]
- Aziz, M.A.; Hossain, A.B.M.Z.; Moniruzzaman, M.; Ahmed, R.; Zahan, T.; Azim, S.; Qayum, M.A.; Al Mamun, M.A.; Kader, M.A.; Rahman, N.M.F. Mapping of agricultural drought in Bangladesh using geographic information system (GIS). Earth Syst. Environ. 2022, 6, 657–667. [Google Scholar] [CrossRef]
- Ahmad, N.; Khan, S.; Ehsan, M.; Rehman, F.U.; Al-Shuhail, A. Estimating the Total Volume of Running Water Bodies Using Geographic Information System (GIS): A Case Study of Peshawar Basin (Pakistan). Sustainability 2022, 14, 3754. [Google Scholar] [CrossRef]
- Tubbs, R.E.; Fouda, H.G.A.; Afifi, A.M.; Raterman, N.S.; Hughes, G.W.; Fadolalkarem, Y.K. Midyan Peninsula, northern Red Sea, Saudi Arabia: Seismic imaging and regional interpretation. GeoArabia 2014, 19, 165–184. [Google Scholar] [CrossRef]
- Kahal, A.Y. Geological assessment of the Neom megaproject area, Northwestern Saudi Arabia: An integrated approach. Arab. J. Geosci. 2020, 13, 345. [Google Scholar] [CrossRef]
- Rasul, N.M.A.; Stewart, I.C.F.; Nawab, Z.A. Introduction to the Red Sea: Its Origin, Structure, and Environment. In The Red Sea; Springer: Berlin/Heidelberg, Germany, 2015; pp. 1–28. [Google Scholar] [CrossRef]
- Nofal, R.; Abboud, I.A. Geomorphological evolution of marine heads on the eastern coast of Red Sea at Saudi Arabian region, using remote sensing techniques. Arab. J. Geosci. 2016, 9, 163. [Google Scholar] [CrossRef]
- Behling, R.; Roessner, S.; Golovko, D.; Kleinschmit, B. Derivation of long-term spatiotemporal landslide activity—A multi-sensor time series approach. Remote Sens. Environ. 2016, 186, 88–104. [Google Scholar] [CrossRef]
- Alharbi, T.; Sultan, M.; Sefry, S.; ElKadiri, R.; Ahmed, M.; Chase, R.; Milewski, A.; Abu Abdullah, M.; Emil, M.; Chounaird, K. An assessment of landslide susceptibility in the Faifa area, Saudi Arabia, using remote sensing and GIS techniques. Nat. Hazards Earth Syst. Sci. 2014, 14, 1553–1564. [Google Scholar] [CrossRef]
- Milewski, A.; Sultan, M.; Yan, E.; Becker, R.; Abdeldayem, A.; Soliman, F.; Gelil, K.A. A remote sensing solution for estimating runoff and recharge in arid environments. J. Hydrol. 2009, 373, 1–14. [Google Scholar] [CrossRef]
- Selvam, S.; Dar, F.A.; Magesh, N.S.; Singaraja, C.; Venkatramanan, S.; Chung, S.Y. Application of remote sensing and GIS for delineating groundwater recharge potential zones of Kovilpatti Municipality, Tamil Nadu using IF technique. Earth Sci. Inform. 2016, 9, 137–150. [Google Scholar] [CrossRef]
- Vanneschi, C.; Rindinella, A.; Salvini, R. Hazard assessment of rocky slopes: An integrated photogrammetry–GIS approach including fracture density and probability of failure data. Remote Sens. 2022, 14, 1438. [Google Scholar] [CrossRef]
- Allafta, H.; Opp, C.; Patra, S. Identification of groundwater potential zones using remote sensing and GIS techniques: A case study of the Shatt Al-Arab Basin. Remote Sens. 2020, 13, 112. [Google Scholar] [CrossRef]
- Nowreen, S.; Newton, I.H.; Zzaman, R.U.; Islam, A.K.M.S.; Islam, G.M.T.; Alam, M.S. Development of potential map for groundwater abstraction in the northwest region of Bangladesh using RS-GIS-based weighted overlay analysis and water-table-fluctuation technique. Environ. Monit. Assess. 2021, 193, 24. [Google Scholar] [CrossRef] [PubMed]
- Mukherjee, I.; Singh, U.K. Delineation of groundwater potential zones in a drought-prone semi-arid region of East India using GIS and analytical hierarchical process techniques. Catena 2020, 194, 104681. [Google Scholar] [CrossRef]
- Prasad, P.; Priyanka, M.L.; Sarath, R.; Naidu, B.R.; Ravi, T. Mapping Groundwater Potential Zone and Flood Risk Zone in the Visakhapatnam District, India. In IOP Conference Series: Earth and Environmental Science; IOP Publishing: Bristol, UK, 2022; p. 012056. [Google Scholar]
- Awanda, D.; Nurul, H.A.; Musfiroh, Z.; Dwi, N.D. Spatial analysis for potential water catchment areas using GIS: Weighted overlay technique. AWANDA. In IOP Conference Series: Earth and Environmental Science; IOP Publishing: Bristol, UK, 2017; p. 012054. [Google Scholar]
- Polidori, L.; El Hage, M. Digital elevation model quality assessment methods: A critical review. Remote Sens. 2020, 12, 3522. [Google Scholar] [CrossRef]
- Huan, V.D. Accuracy Assessment of Land Use Land Cover LULC. In IOP Conference Series: Earth and Environmental Science; ESRI data in Con Dao island, Ba Ria—Vung Tau province, Vietnam; IOP Publishing: Bristol, UK, 2020; Volume 2022, p. 012010. [Google Scholar]
- Fao.org. Soil Maps and Databases|FAO Soils Portal. Food and Agriculture Organization of the United Nations, n.d. Available online: https://www.fao.org/soils-portal/data-hub/soil-maps-and-databases/en/ (accessed on 19 November 2022).
- Matejicek, L. Spatial modelling of air pollution in urban areas with GIS: A case study on integrated database development. Adv. Geosci. 2005, 4, 63–68. [Google Scholar] [CrossRef]
- Abijith, D.; Saravanan, S.; Singh, L.; Jennifer, J.J.; Saranya, T.; Parthasarathy, K.S.S. GIS-based multi-criteria analysis for identification of potential groundwater recharge zones-a case study from Ponnaniyaru watershed, Tamil Nadu, India. HydroResearch 2020, 3, 1–14. [Google Scholar] [CrossRef]
- Mahalingam, B.; Vinay, M. Identification of ground water potential zones using GIS and Remote Sensing Techniques: A case study of Mysore taluk-Karnataka. Int. J. Geom. Geosci. 2015, 5, 393–403. [Google Scholar]
- Schilling, K.E.; Wolter, C.F.; Isenhart, T.M.; Schultz, R.C. Tile drainage density reduces groundwater travel times and compromises riparian buffer effec-tiveness. J. Environ. Qual. 2015, 44, 1754–1763. [Google Scholar] [CrossRef]
- Subba Rao, N.N. Groundwater potential index in a crystalline terrain using remote sensing data. Environ. Geol. 2006, 50, 1067–1076. [Google Scholar] [CrossRef]
- Morbidelli, R.; Corradini, C.; Saltalippi, C.; Flammini, A.; Dari, J.; Govindaraju, R.S. A new conceptual model for slope-infiltration. Water 2019, 11, 678. [Google Scholar] [CrossRef]
- Scanlon, B.R.; Reedy, R.C.; Stonestrom, D.A.; Prudic, D.E.; Dennehy, K.F. Impact of land use and land cover change on groundwater recharge and quality in the south-western US. Glob. Chang. Biol. 2005, 11, 1577–1593. [Google Scholar] [CrossRef]
- Ghosh, P.K.; Bandyopadhyay, S.; Jana, N.C. Mapping of groundwater potential zones in hard rock terrain using geoinformatics: A case of Kumari watershed in western part of West Bengal. Model. Earth Syst. Environ. 2016, 2, 1. [Google Scholar] [CrossRef]
- Bosworth, W. Geological evolution of the Red Sea: Historical background [Review], and synthesis. In The Red Sea; Springer: Berlin, Germany, 2015; pp. 45–78. [Google Scholar]
- Amin, A.A. The extent of desertification on Saudi Arabia. Environ. Geol. 2004, 46, 22–31. [Google Scholar] [CrossRef]
- Teegavarapu, R.S.V.; Chinatalapudi, S. Incorporating influences of shallow groundwater conditions in curve number-based runoff estimation methods. Water Resour. Manag. 2018, 32, 4313–4327. [Google Scholar] [CrossRef]
- Al-Shammari, M.M.A.; AL-Shamma’a, A.M.; Al Maliki, A.; Hussain, H.M.; Yaseen, Z.M.; Armanuos, A.M. Integrated water harvesting and aquifer recharge evaluation methodology based on remote sensing and geographical information system: Case study in Iraq. Nat. Resour. Res. 2021, 30, 2119–2143. [Google Scholar] [CrossRef]


| Layer | Influence (%) | Parameter | Scale |
|---|---|---|---|
| Drainage density (km2) | 20 | 0–0.77 | 1 |
| 0.78–1.24 | 2 | ||
| 1.25–1.68 | 3 | ||
| 1.69–2.22 | 4 | ||
| 2.23–4.38 | 5 | ||
| Lineament density (km2) | 5 | 0–0.05 | 1 |
| 0.06–0.12 | 2 | ||
| 0.13–0.2 | 3 | ||
| 0.21–0.36 | 4 | ||
| 0.37–0.73 | 5 | ||
| Precipitation (mm) | 15 | 51–74 | 1 |
| 75–93 | 2 | ||
| 94–107 | 3 | ||
| 108–123 | 4 | ||
| 124–150 | 5 | ||
| Elevation (m) | 15 | −20 to 338 | 5 |
| 339–699 | 4 | ||
| 700–1007 | 3 | ||
| 1008–1296 | 2 | ||
| 1297–2530 | 1 | ||
| Lithology | 20 | Quaternary | 4 |
| Tertiary | 3 | ||
| Ordovician | 2 | ||
| Cambrian | 1 | ||
| Slope (°) | 10 | 0–6 | 5 |
| 7–14 | 4 | ||
| 15–24 | 3 | ||
| 25–35 | 2 | ||
| 36–78 | 1 | ||
| Soil | 5 | Clay | 1 |
| Loam | 2 | ||
| Sandy loam | 3 | ||
| Land use/land cover | 10 | Residential area | 2 |
| Agricultural land | 3 | ||
| Barren land | 1 |
| Layer | Influence (%) | Parameter | Scale |
|---|---|---|---|
| Drainage density (km2) | 30 | 0–0.77 | 1 |
| 0.78–1.24 | 2 | ||
| 1.25–1.68 | 3 | ||
| 1.69–2.22 | 4 | ||
| 2.23–4.38 | 5 | ||
| Precipitation (mm) | 20 | 51–74 | 1 |
| 75–93 | 2 | ||
| 94–107 | 3 | ||
| 108–123 | 4 | ||
| 124–150 | 5 | ||
| Elevation (m) | 25 | −20 to 338 | 5 |
| 339–699 | 4 | ||
| 700–1007 | 3 | ||
| 1008–1296 | 2 | ||
| 1297–2530 | 1 | ||
| Slope (°) | 20 | 0–6 | 5 |
| 7–14 | 4 | ||
| 15–24 | 3 | ||
| 25–35 | 2 | ||
| 36–78 | 1 | ||
| Soil | 5 | Clay | 3 |
| Loam | 1 | ||
| Sandy loam | 2 |
| Layer | Influence (%) | Parameter | Scale |
|---|---|---|---|
| Drainage density (km2) | 45 | 0–0.77 | 5 |
| 0.78–1.24 | 4 | ||
| 1.25–1.68 | 3 | ||
| 1.69–2.22 | 2 | ||
| 2.23–4.38 | 1 | ||
| Precipitation (mm) | 35 | 51–74 | 5 |
| 75–93 | 4 | ||
| 94–107 | 3 | ||
| 108–123 | 2 | ||
| 124–150 | 1 | ||
| Elevation (m) | 20 | −20 to 338 | 5 |
| 339–699 | 4 | ||
| 700–1007 | 3 | ||
| 1008–1296 | 2 | ||
| 1297–2530 | 1 |
Disclaimer/Publisher’s Note: The statements, opinions and data contained in all publications are solely those of the individual author(s) and contributor(s) and not of MDPI and/or the editor(s). MDPI and/or the editor(s) disclaim responsibility for any injury to people or property resulting from any ideas, methods, instructions or products referred to in the content. |
© 2023 by the author. Licensee MDPI, Basel, Switzerland. This article is an open access article distributed under the terms and conditions of the Creative Commons Attribution (CC BY) license (https://creativecommons.org/licenses/by/4.0/).
Share and Cite
Alharbi, T. Mapping of Groundwater, Flood, and Drought Potential Zones in Neom, Saudi Arabia, Using GIS and Remote Sensing Techniques. Water 2023, 15, 966. https://doi.org/10.3390/w15050966
Alharbi T. Mapping of Groundwater, Flood, and Drought Potential Zones in Neom, Saudi Arabia, Using GIS and Remote Sensing Techniques. Water. 2023; 15(5):966. https://doi.org/10.3390/w15050966
Chicago/Turabian StyleAlharbi, Talal. 2023. "Mapping of Groundwater, Flood, and Drought Potential Zones in Neom, Saudi Arabia, Using GIS and Remote Sensing Techniques" Water 15, no. 5: 966. https://doi.org/10.3390/w15050966
APA StyleAlharbi, T. (2023). Mapping of Groundwater, Flood, and Drought Potential Zones in Neom, Saudi Arabia, Using GIS and Remote Sensing Techniques. Water, 15(5), 966. https://doi.org/10.3390/w15050966