Article

Mechanism Study of Differential Permeability Evolution and Microscopic Pore Characteristics of Soft Clay under Saturated Seepage: A Case Study in Chongming East Shoal

1
College of Construction Engineering, Jilin University, Changchun 130026, China
2
Key Laboratory of Land Subsidence Monitoring and Prevention, Ministry of Natural Resources, Shanghai 200072, China
3
Shanghai Institute of Geological Survey, Shanghai 200072, China
4
College of Civil Engineering and Architecture, Jiaxing University, Jiaxing 314001, China
*
Author to whom correspondence should be addressed.
Water 2023, 15(5), 968; https://doi.org/10.3390/w15050968
Submission received: 18 January 2023 / Revised: 22 February 2023 / Accepted: 28 February 2023 / Published: 2 March 2023
(This article belongs to the Special Issue Effects of Groundwater and Surface Water on the Natural Geo-Hazards)

Abstract

:
Artificial reclamation is one of the main means of land expansion in coastal cities. However, the permeability of underlying soft clay (USC), derived from the dredged load, has not been paid enough attention, although it is closely related to the long-term deformation and stability of foundation soil. Hence, this paper analyzes the relationship between permeability characteristics and microscopic pore characteristics of USC in Chongming East Shoal (CES), a typical multi-phase reclamation area, through a variable head permeability test, mercury intrusion porosimetry (MIP) test, and scanning electron microscope (SEM) test. Furthermore, grey relation entropy and Pearson correlation analysis are implemented to analyze the influence of micropore parameters on permeability. The results revealed that the seepage process of clay showed a transition from unstable seepage to relatively stable seepage. Meanwhile, the permeability coefficient (PC) attenuated with time cyclically, indicating the alternating effect of the closed and opened unstable seepage channels. During seepage, clay particles could be entrained by pore water and intercepted by pores, thus clogging seepage channels. Then, the increased pore water pressure could break through new seepage channels. The degree of pore clogging was positively correlated with the average cycle period of PCs, and this was also present in the relatively stable stage of PCs. A lower mesopores content, higher fractal dimension, and aggregated flocculate microstructure could promote the clogging effect and result in lower permeability efficiency. Affected by unstable seepage channels, soft clay may face long-term potential deformation in the future, which needs further investigation.

1. Introduction

With economic development and population growth, land reclamation has gradually become an effective way to supply land resources in many coastal cities around the world [1,2,3]. Chongming East Shoal (CES) of Shanghai, as a typical multi-phase reclamation area, has had several reclamation projects implemented [4] since the 1940s, as shown in Figure 1.
Nowadays, mud and sand originally deposited in offshore or river channels have been used as reclamation materials by employing special machinery and hydraulic transportation, resulting in an amount of subsidence in the deposited dredger fill [5]. However, the underlying soft clay (USC) could also be compressed because of a new round of permeability and consolidation processes induced by the dredged load, thereby exacerbating the land subsidence [6]. Land subsidence is essentially caused by the consolidation drainage of the soil layer, with the causes of geological structure excluded, and the consolidation drainage efficiency of the soil layer is closely related to its permeability characteristics. Hu et al. [7] believed that in the settlement calculation based on Darcy’s seepage theory, the large strain deformation and time-varying stress–strain behavior of clay could be captured. Nguyen and Kim [8] assumed that radial seepage was the only contribution of vertical drainage, and constructed a simplified method for calculating the settlement and deformation of soft clay. Moreover, other scholars have studied the relationship between permeability–porosity and consolidation deformation [9,10]. Consequently, it is essential to investigate the permeability of USC, explore potential ground deformations, and provide a reasonable reference for practical engineering.
As a basic geotechnical parameter, the permeability coefficient (PC) reflects the ability and speed of water flow through soil, which is critical to evaluating the process of soil consolidation [11,12,13]. The PC is affected by various factors. For sandy soil [14,15], the PC is closely related to particle size composition, while for cohesive soil, the PC is affected by many factors including moisture content [16], dry density [17], porosity [18,19], particle shape [20], organic matter content [21], clay content [22], etc. It is, thus, clear that the factors affecting permeability characteristics of cohesive soil are very complex. Nevertheless, among them, as the main permeability channel, soil pores directly and closely control the PC, which has always been the top priority of scholars. The effect of soil pores on permeability is mainly reflected by their size, distribution, structure, connectivity, etc. Tang et al. [23] inferred that the increase in the PC of soft soil was due to shrinkage cracks during freeze–thaw events and large pores left by melting ice crystals. Ren et al. [24] summarized the core effect of macropores on permeability. Chen et al. [25] tested whether the complex flow behavior of seepage resulted from the interaction between the microelectric field and micropores, which was also an important reason for the deviation in describing the seepage characteristics of low permeability clay. Zhou et al. [26] found that the hydrodynamic conditions and mechanical properties were largely controlled by the classification of pores. Wang et al. [27] found that soft soils had more severe permeability attenuation under the combined effect of consolidation stress and dry density. The increase in consolidation stress would reduce the number and size of pores between the agglomerates, thus causing the microstructural transformation, while the increase in dry density would fill the pores between the agglomerates and weaken their connectivity. Zhao et al. [28] stressed that the complexity of pores presented a higher impact on permeability than porosity and dominant pores. In other words, the smaller size of a multi-connected pore network means greater effective tortuosity and weaker permeability.
In the above studies, the PC was generally regarded as a constant, but the variability in the permeability process was ignored. Lu et al. [29] found that in the process of seepage, when the concentration of permeate changes, the PC could change with the variation of seepage time; Zha et al. [30] also pointed out that the change of PC is related to seepage time when emphasizing the influence of heavy metal ions on soil permeability. Furthermore, Xu et al. [17] found that the PC of loess with different dry densities shows three evolution patterns of decreasing, ascending–descending, and ascending during the seepage process. Hence, the PC is not constant, and the seepage process is closely related to the fluid velocity [31,32], particles migration [33,34,35], and many physicochemical interactions between porous media [36,37]. In fact, in the seepage process, the seepage may change the distribution of soil particles, and the rearranged soil particles will unavoidably change the pore characteristics of soil, thus, causing varying degrees of interference with the subsequent seepage process. Correspondingly, there is a reciprocal feed between PC and pore characteristics, which has not been fully studied.
For many coastal cities around the world, land reclamation is not accomplished in one stroke. Within this framework, the USC suffers dredged loads of different duration, and the same soil layer could also emerge with various complex permeability patterns among reclamation areas. Furthermore, the time-varying characteristics and mechanism interpretation of soil permeability in different hydraulic reclamation areas have rarely been studied, which is closely related to the potential uneven deformation.
To sum up, the main objective of this study was to explore the differential permeability characteristics and microscopic mechanism of USC in Chongming East Shoal (CES). The novelties mainly include three aspects: (1) revealing temporal and spatial variability in the permeability of USC that has not attracted enough attention in previous research on typical multi-phase reclamation areas; (2) classifying the micropore characteristics corresponding to the “differential” permeability characteristics of the USC layer; and (3) revealing the dynamic evolution and driving mechanism of PC during the seepage process to facilitate a better understanding of the seepage process of soft soil under saturated seepage conditions. Finally, this paper could provide a scientific basis for explaining the differential subsidence phenomenon in different reclamation areas and other similar areas.

2. Materials and Methods

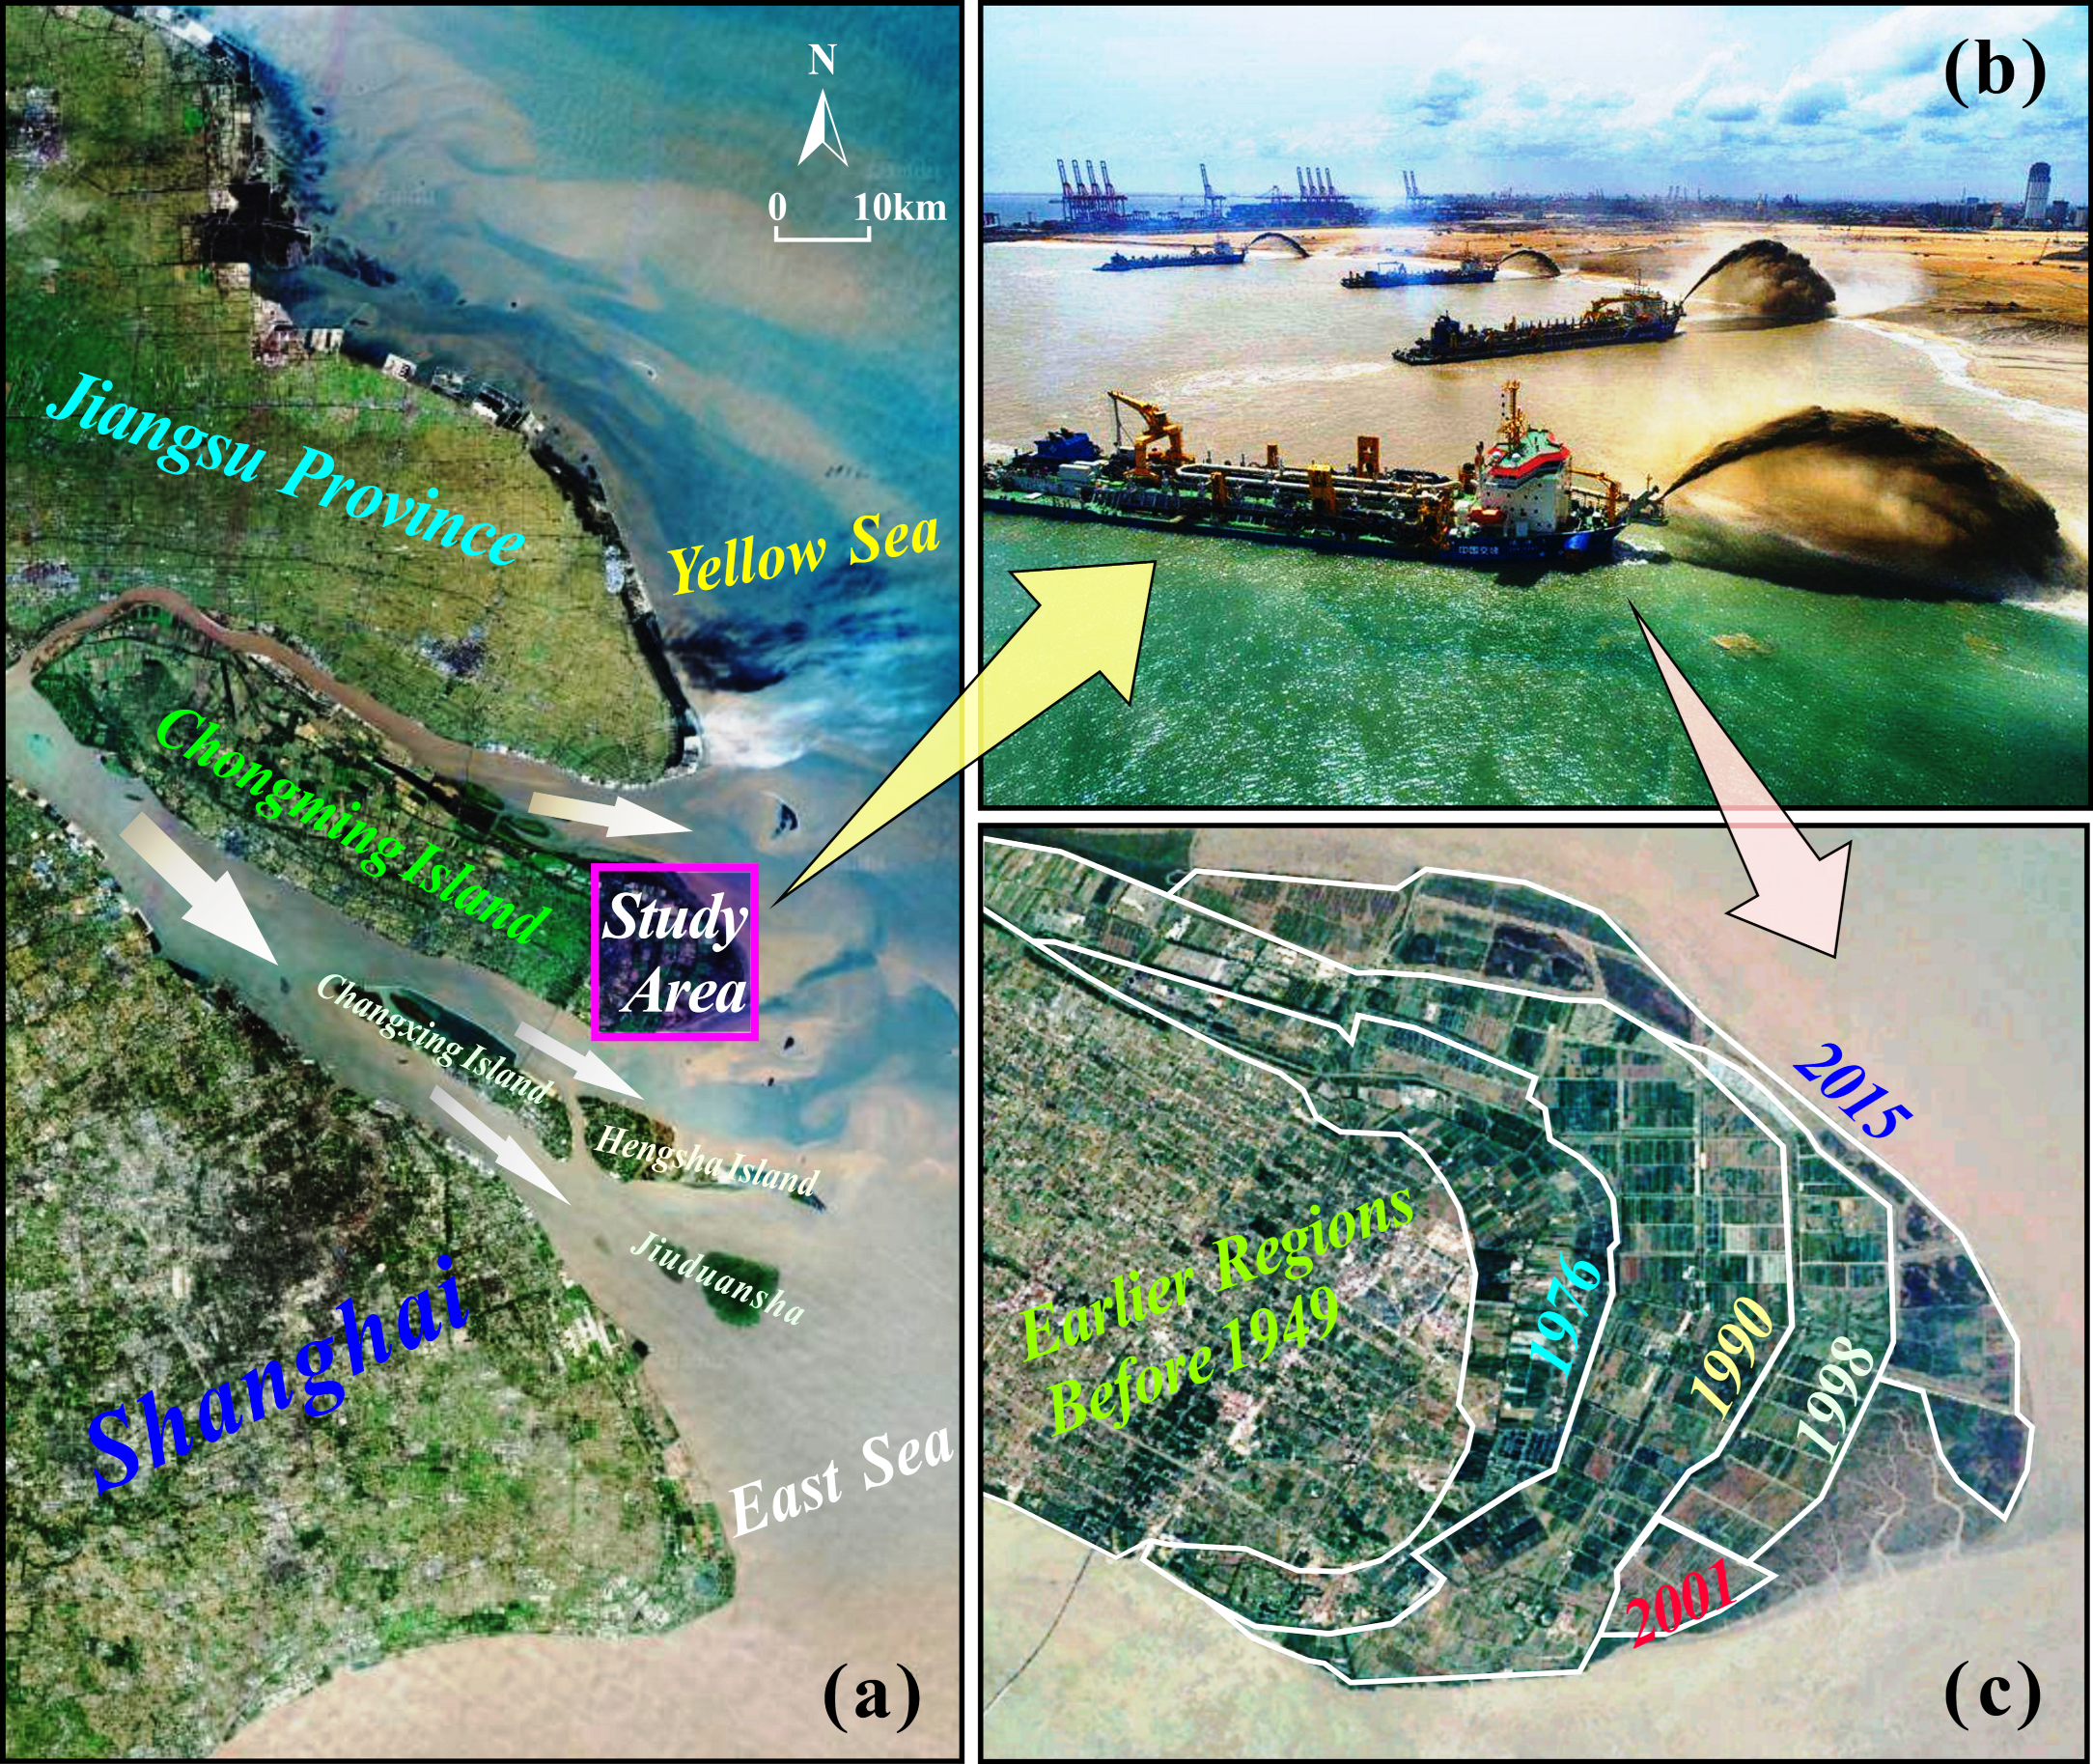
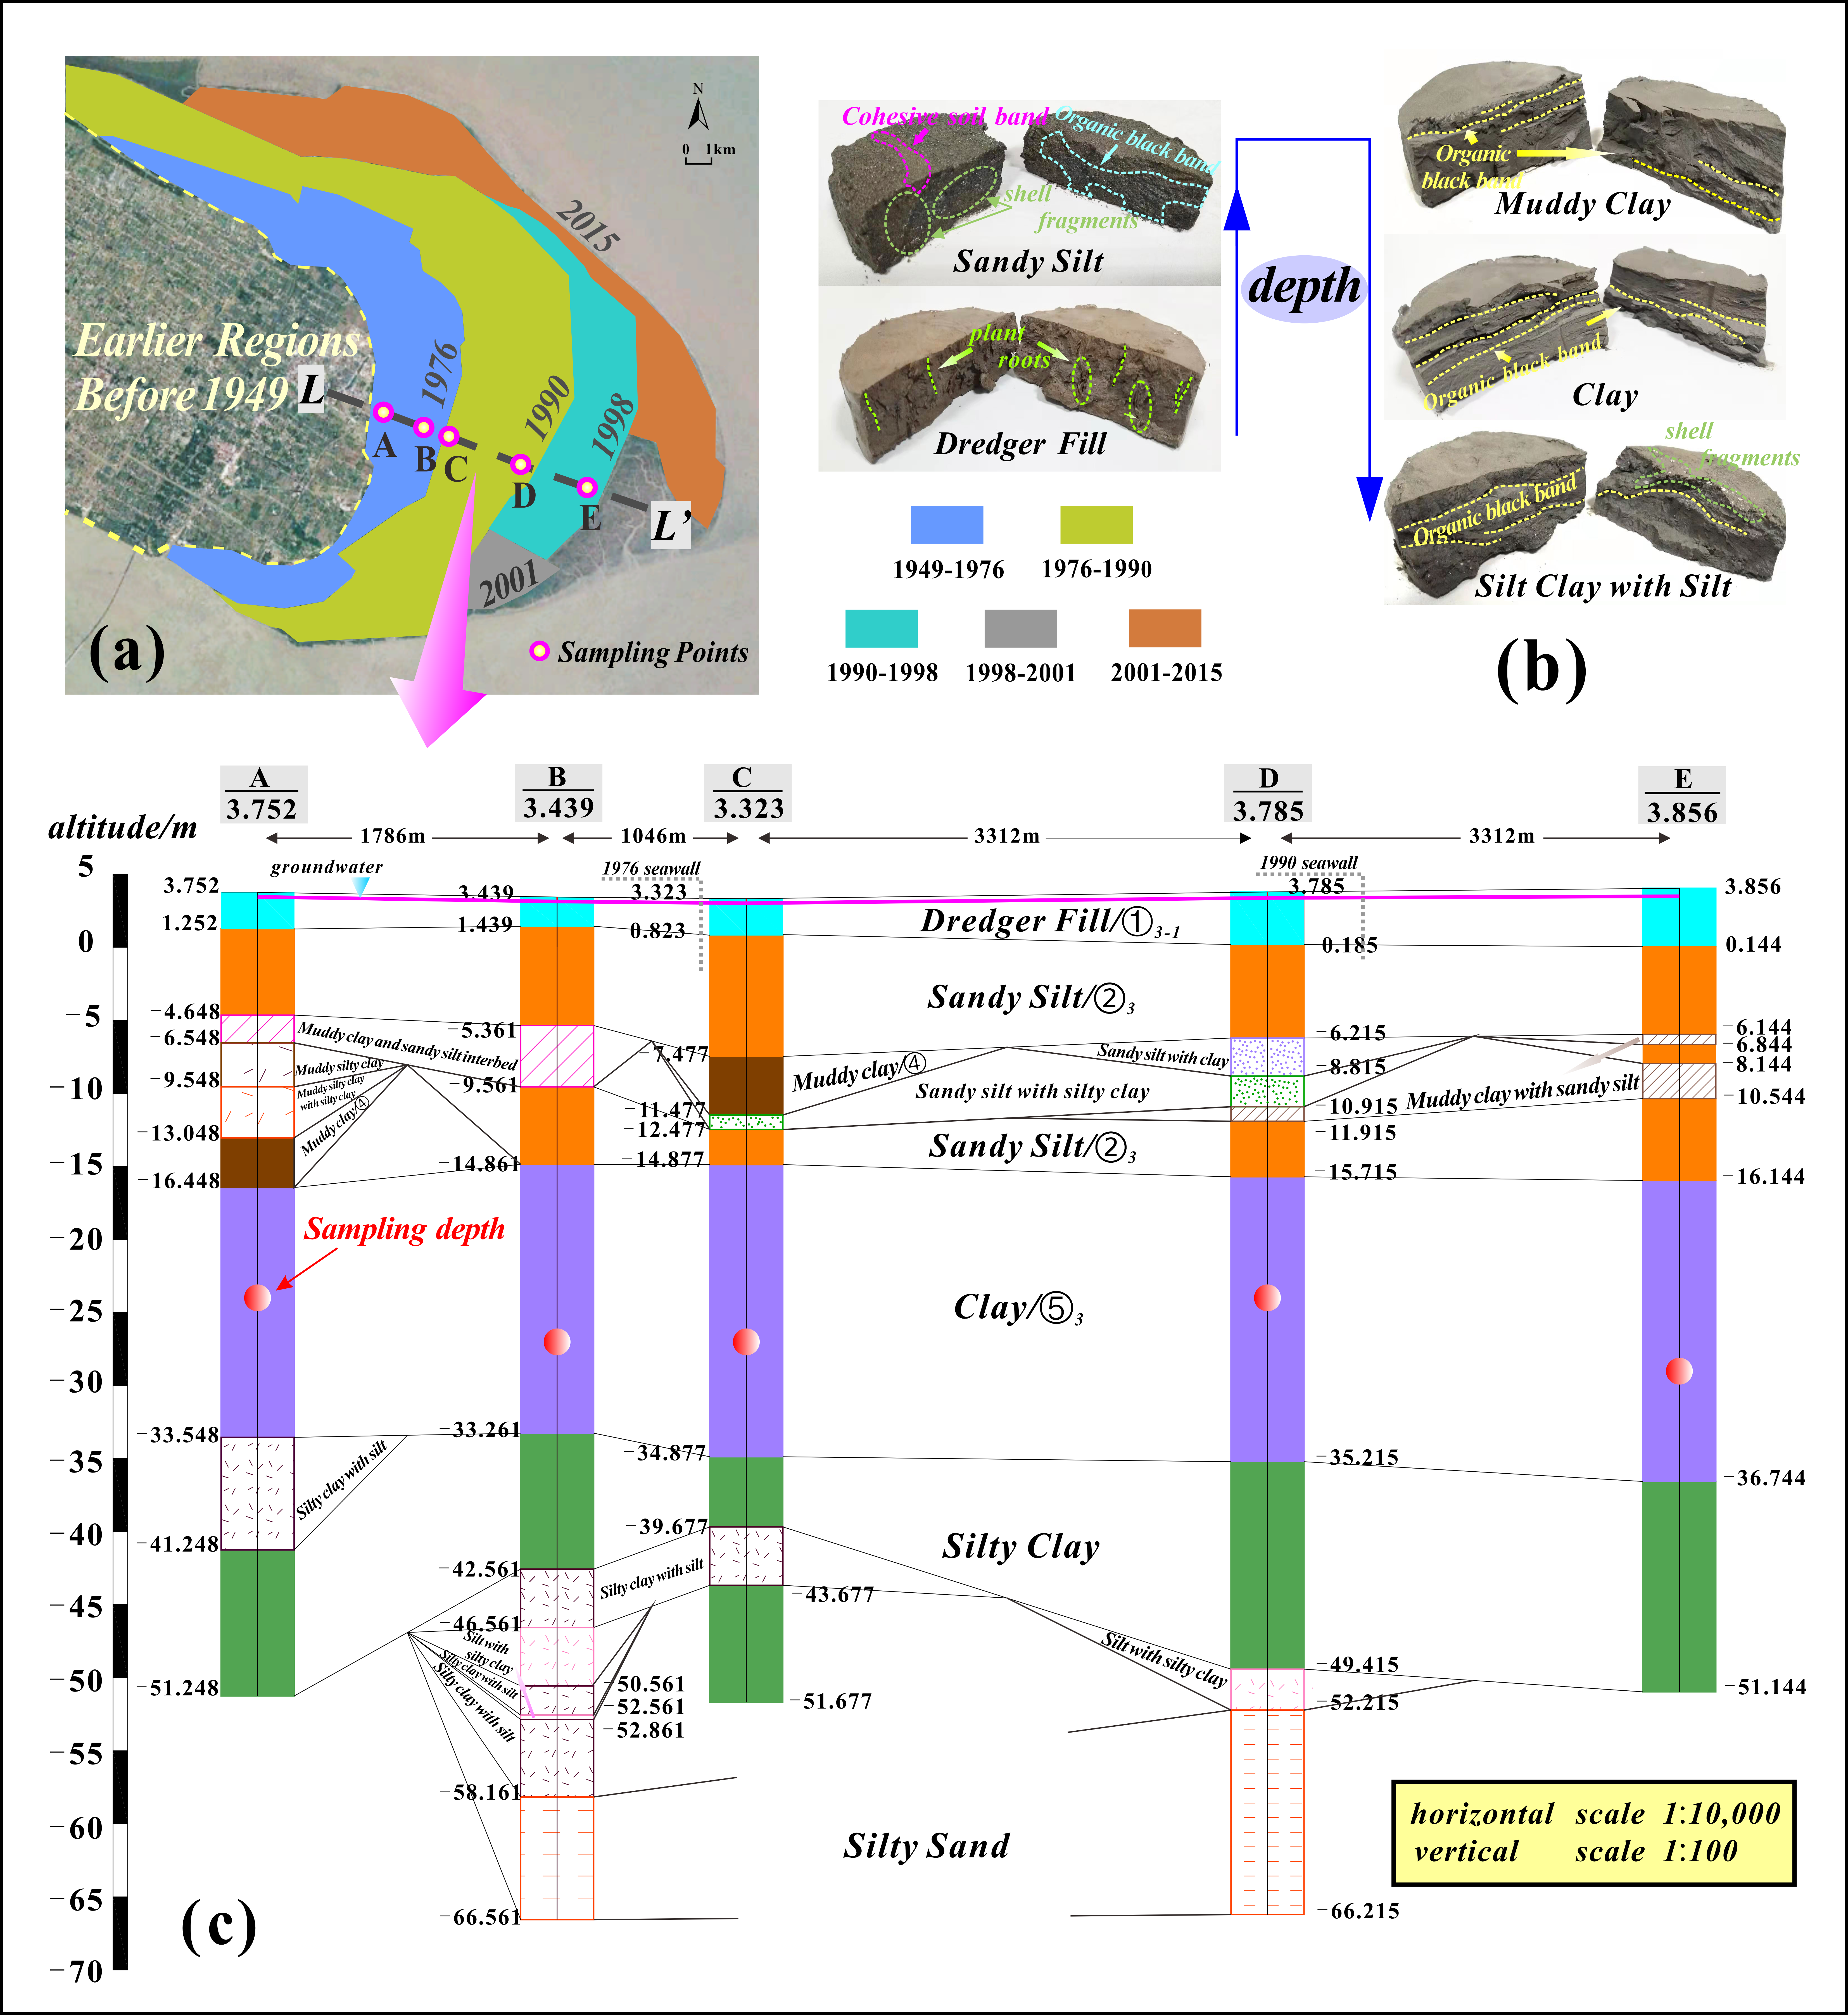
2.1. Site Investigation

CES, located at the eastern end of Chongming Island, is one of the typical multi-phase reclamations in Shanghai. Historically, the eastern side of CES, which is closer to the offshore area, has held shorter reclamation times, and the action time of the reclamation load on USC has been compressed accordingly. Each phase of the reclamation project was bounded by two adjacent cofferdams. The cofferdams were named after the years they were built from west to east, and the study area could be divided into five parts including the 1949 cofferdam, the 1949–1976 reclamation area, the 1976–1990 reclamation area, the 1990–1998 reclamation area, and the reclamation area outside 1998, as shown in Figure 1c. Due to site conditions, it was impossible to enter outside the 1998 cofferdam. Therefore, the research scope of this paper was limited to the west of the 1998 cofferdam. To obtain the property change of the soil layer in different reclamation periods, the L–L’ section was selected to arrange five boreholes (A, B, C, D, and E) from west to east, as shown in Figure 2a. Considering that the soil layer within the main range of ground load was within 30 m, the drilling depth was uniformly limited to 55 m. After collection, the soil samples were immediately sealed with wax and wrapped with several layers of plastic film to avoid water evaporation and disturbance.
The typical stratigraphy of CES is Holocene deposition. According to the geological data and relevant literature regarding Shanghai [38,39], the soil layers formed in the same geological age and sedimentary environment have similar engineering geological characteristics. The widely distributed soil layers could be divided into five main engineering geological layers from top to bottom, namely, ① 3–2 dredger fill, ② 2–3 sandy silt, ④ muddy clay, ⑤ 1–1 clay and ⑤ 1–2 silty clay (Figure 2c) [38,39,40]. Among them, the clay layer had a distinct sedimentary grain layer, a smooth and fine profile, and a more homogeneous soil texture, as shown in Figure 2b. In addition, the clay layer had a thickness of 17.1–20.6 m, which was the thickest of all soil layers and one of the main compression layers that caused ground deformation [41,42]. Therefore, the clay layer was selected as the research object of this paper.

2.2. Basic Properties

The sample number of the A–E sampling hole was labeled S1–S5, respectively. To make the basic parameters of soil samples more convincing, S1–S5 were set in the middle part of the clay layer with depths of 24 m, 27 m, 27 m, 24 m, and 29 m, respectively, as shown in Figure 2. The main physicochemical properties of the natural soil are summarized in Table 1. The particle size distribution of the sample was measured using a laser particle size analyzer (9300LD), as shown in Figure 3a. Among them, the content of silt (0.075–0.005 mm) was greatest, accounting for nearly 70%, followed by the content of clay (<0.005 mm), while sand content (2–0.075 mm) was minimal. Figure 3b depicts the mineral composition of the sample. Quantitative analysis showed that the main minerals were quartz and clay minerals, accounting for 46.3% and 40.6%, respectively. Clay minerals were mainly I/S mixed-layer minerals and illite, with less kaolinite.

2.3. Variable Head Permeability Test

As the USC is horizontally distributed, the variable head permeability test was used to test the vertical PC (Kv). The instrument used was an automatic penetration tester (LFTD-1406), which can automatically collect data through its supporting software. The calculation formula is as follows:
K v = 2.3 a L A t l o g Δ H 1 Δ H 2
where a is the sectional area of the water head measuring tube, a = 0.785 cm2; L is the length of the seepage path, that is, the height of the soil sample, L = 2 cm; A is the area of the soil sample, A = 30 cm2; t is the permeability time (s); ΔH1 is the initial water head height; and ΔH2 is the ending water head height. When the water head dropped by 3–5 cm, a permeability test should have been completed. Meanwhile, each sample was tested 3–5 times in parallel, and the allowable error value should not have exceeded 2 × 10−N cm/s (“N” is the order of magnitude of PC).

2.4. Microscopic Tests

Microscopic tests were conducted to elucidate the mechanism of permeability changes. The liquid nitrogen freeze vacuum sublimation drying method (freeze-drying method) was used to treat samples. This method uses liquid nitrogen to freeze the soil samples rapidly to a low temperature of −196 °C, so that the water in the samples swiftly condensed into amorphous ice. Then, the samples were placed in a freezing vacuum sublimation at from −30 to –50 ℃ (vacuum degree up to 1.3 × 10⁻³ Pa), to sublimate the non-crystalline ice, thereby avoiding compositional changes caused by the surface tension of the water–air interface.

2.4.1. MIP Test

An AUTO-PORE 9500 (Micromeritics Instrument Corp. America) with a maximum intrusion pressure of 228 MPa was used to determine the pore size characteristics of the samples. During the test, mercury intruded the voids of the porous medium only if the pressure was sufficient. The instrument had a pore size measurement range of 0.003–360.000 μm.
As an index to evaluate the overall development degree of the soil pore structure, the average pore diameter (Dave) was used to quantitatively characterize the micropore characteristics of the soil. Moreover, Tanaka et al. [43] proposed that the medium entrance pore diameter (D50) can represent the pore size characteristics to explain the permeability of cohesive soil. Deng et al. [44] used these characteristic parameters in a similar study of cement-stabilized marine clay.
The pores in soil have statistical self-similarity, and the fractal structure characteristics can be measured using a single fractal dimension (FD). A greater FD means a more complex pore structure, which indirectly reduces the connectivity of seepage channels. In the MIP test, the relationship between mercury intrusion pressure and intrusion volume can be expressed as follows [45]:
0 V P d V = 0 S γ c o s θ d S
where P is the mercury injection pressure, V is the mercury injection quantity, γ is the surface tension of mercury, θ is the contact angle between mercury and the pore surface, and S is the surface area of the pore.
Formula (2) is equivalent to Formula (3):
i = 1 n P i ¯ Δ V i = k r n 2 ( V n 1 / 3 r n ) D
where P i ¯ is the ith intrusion pressure of mercury, ΔVi is the intrusion volume of mercury in the ith intrusion, k is a constant, n is equal to the total intrusion times minus 1, and rn and Vn represent the pore radius and cumulative intrusion volume of the nth intrusion, respectively.
We define variables Wn and Qn as
W n = i = 1 n P i ¯ Δ V i
Q n = V 1 / 3 / r n
Formula (3) can be expressed as
l g ( W n / r n 2 ) = D l g Q n + C
where l g   ( Q n ) is the abscissa; l g ( W n / r n 2 ) is the ordinate; D is the slope of the curve, representing the fractal dimension; and C is a constant.

2.4.2. SEM Test

Scanning electron microscopy (Phenom ProX) was used to observe the microstructural characteristics of soil samples before and after seepage in multi-stage reclamation areas. Unlike the MIP specimens, SEM specimens need to be sputtered with a thin layer of gold to improve image quality [46]. The electron gun emitted an electron beam that was focused and scanned on the surface of the soil sample. By detecting the secondary electronic signals generated by the electron beam sample interaction, the structural characteristics, particle morphology, pore distribution, etc., could be observed. SEM images were obtained at a magnification of 2000× or 5000×. Furthermore, IPP software was used to clarify the distribution patterns of particles and pores. Images taken using a 5000× high-power microscope were used for image segmentation to better identify clay particles and pores.

2.5. Grey Relation Entropy

The research focused on using mathematical methods to quantitatively analyze and evaluate the correlation between target variables and dependent variables. Grey relation entropy is a quantitative analysis method based on the grey system theory. It determines the correlation degree between the dependent and target variables according to the similarity and dissimilarity of the development trend between variables [47].
Therefore, in this paper we explored the contribution of different micropore parameters to permeability characteristics using grey relation entropy. Let X0 be the main sequence X0 = {X0(k)|k = 1, 2, …, n}, Xi is the comparison sequence Xi = {Xi(k)|k = 1, 2, …, n; i = 1, 2, …, m}; and m is the comparison factor. The grey relation coefficient can be obtained as follows:
γ 0 i k = m i n i m i n k x 0 k x i k + ε Δ m a x i m a x k | x 0 k x i k | Δ i k + ε Δ m a x i m a x k | x 0 k x i k |
Generally, ε = 0.5 is set to consider the integrity of the system and avoid the influence of outliers [47]. Since the grey relation coefficient only represents the correlation degree between the comparison factor and the main factor, and does not represent the correlation degree between the overall sequence, the average value of the relation coefficient was used for centralized analysis, as shown in Formula (8).
γ 0 i k = 1 n k = 1 n γ 0 i k ,   i = 1 , 2 , , m
Next, the grey relation entropy can be determined:
H R i = h = 1 n γ 0 i k k = 1 n γ 0 i k l n γ 0 i k k = 1 n γ 0 i k
Finally, the grey relation entropy grade was obtained:
E r X i = H R i / l n n
A greater E r X i means a stronger correlation between the comparison factor and X0.

3. Results

3.1. Permeability Characteristics

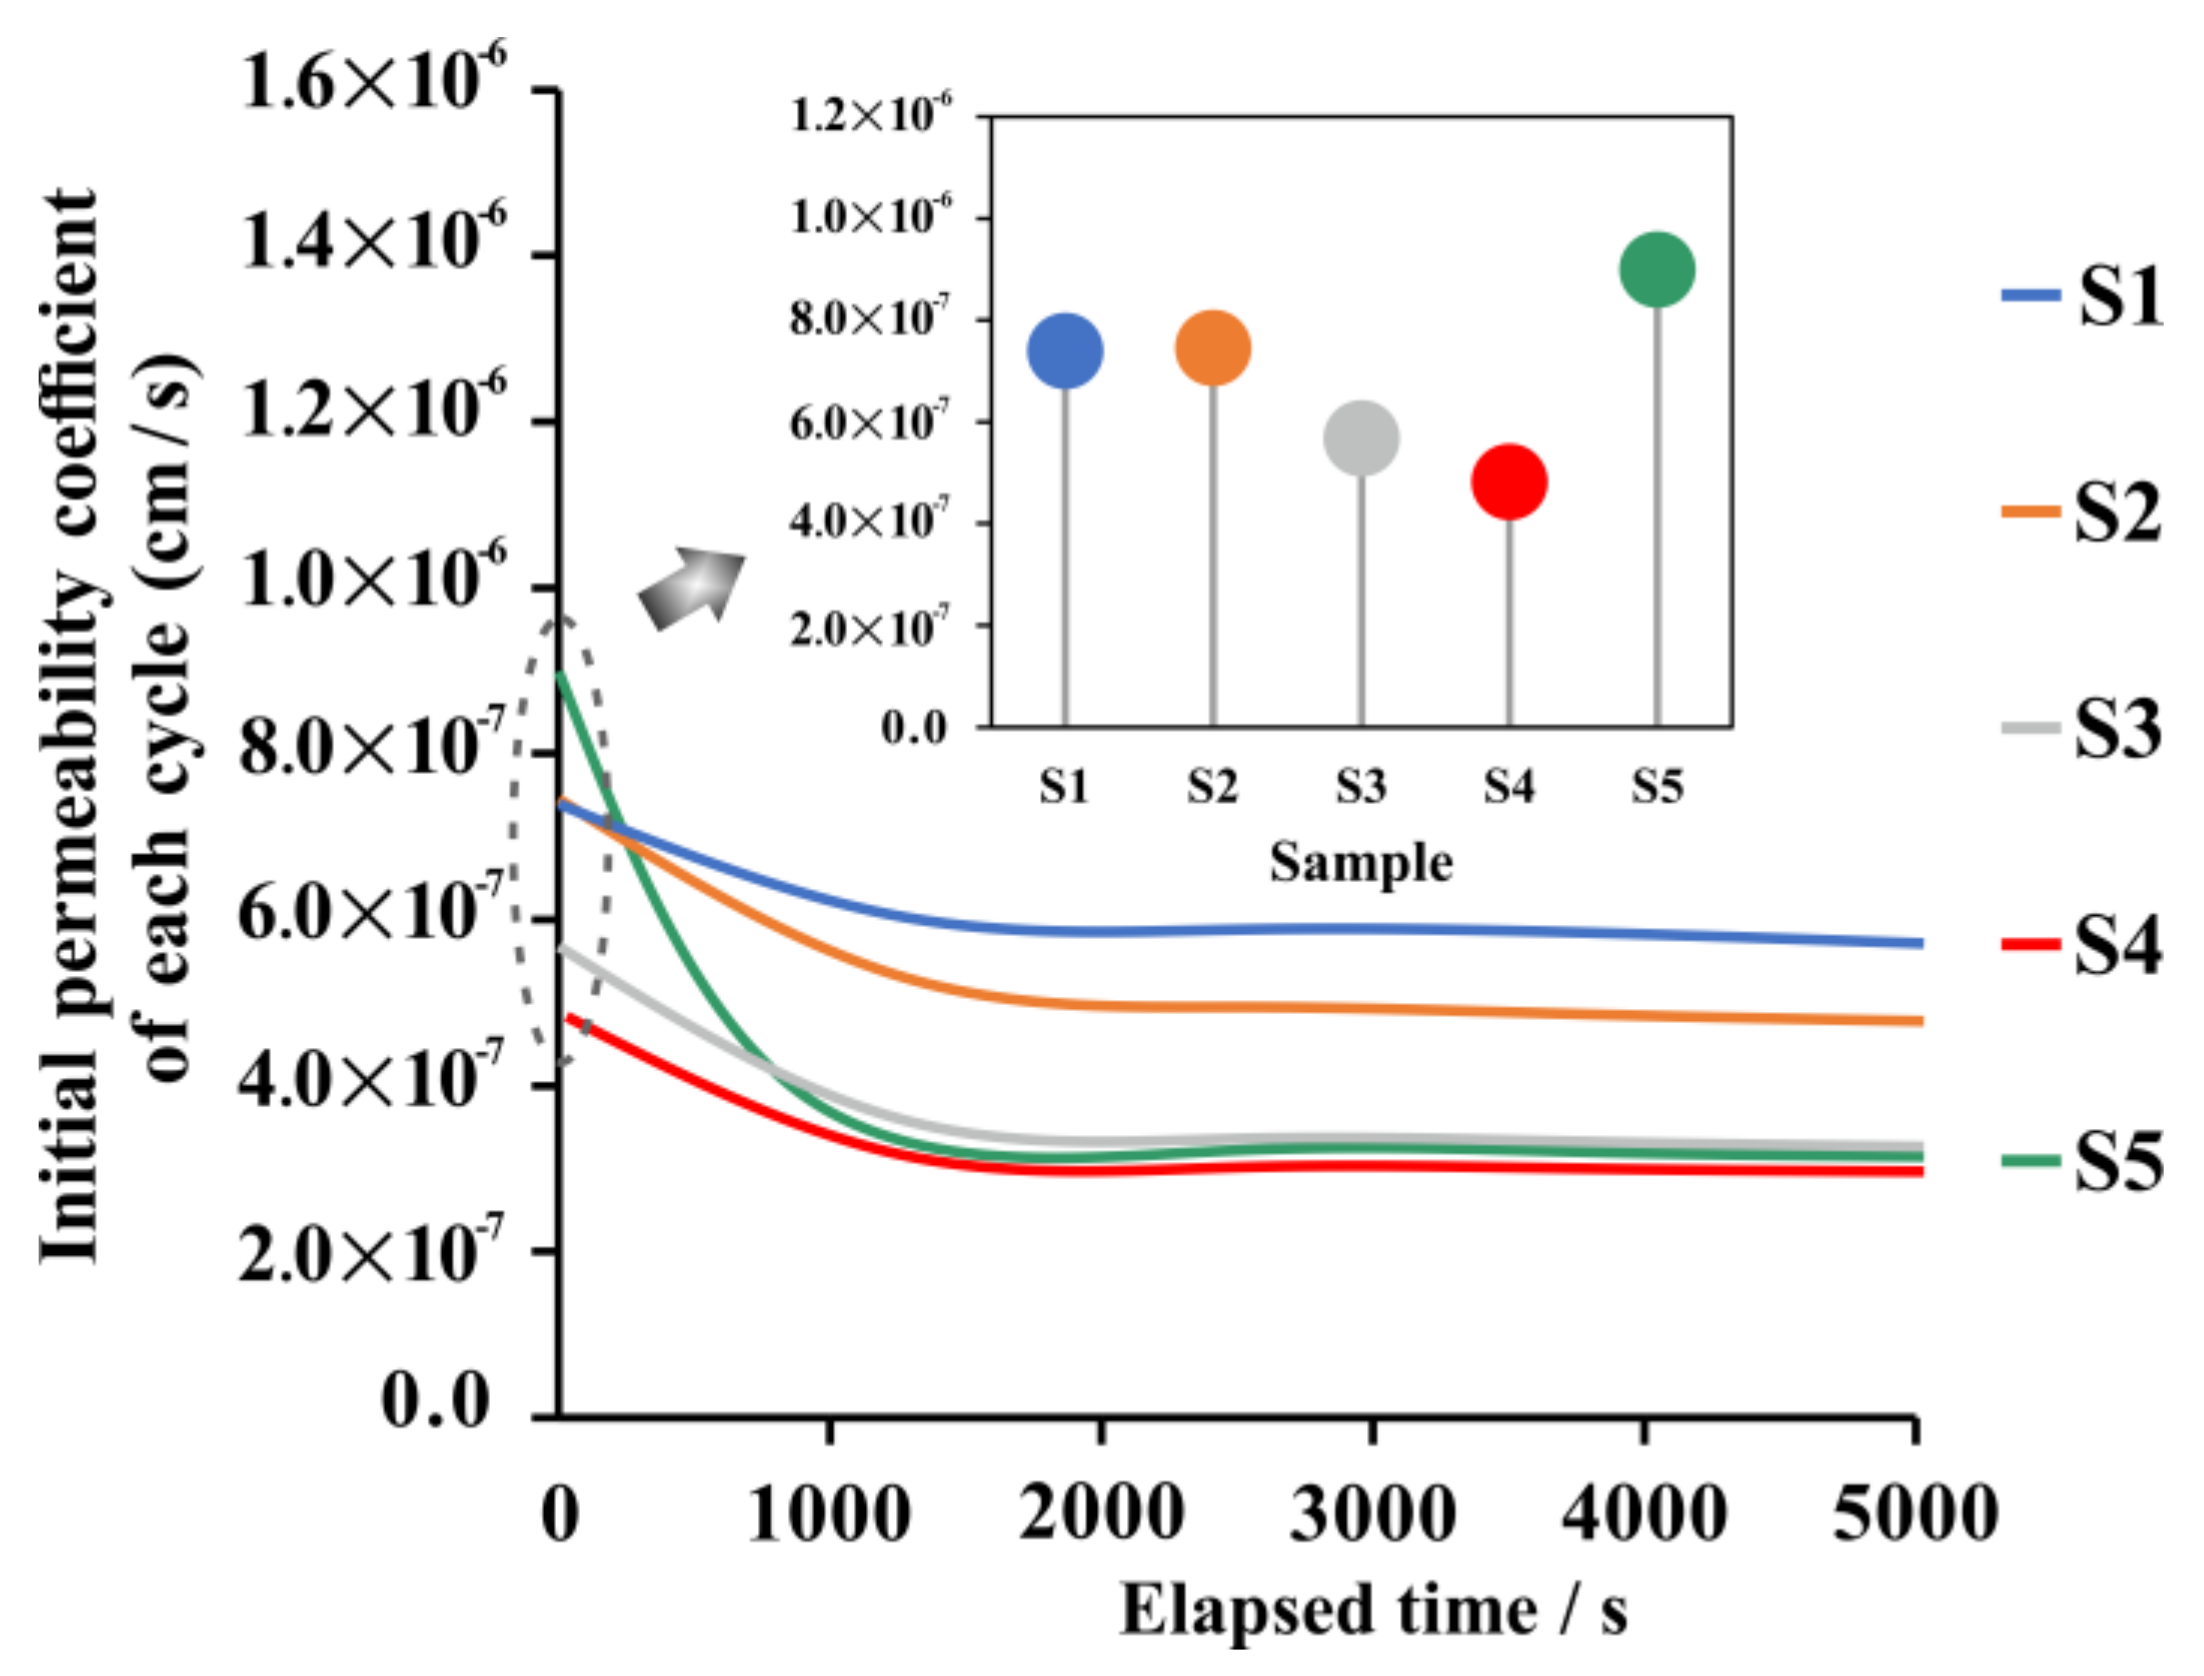
3.1.1. Dynamic evolution

The evolution of the PCs of S1–S5 samples is shown in Figure 4a–e. To ensure the accuracy of test results, three groups of parallel samples were used for comparative analysis. Taking the S1 clay as an example, the three groups of parallel permeability test soil samples were labeled S1-1, S1-2, and S1-3, respectively, and the labeling method of other clay parallel test soil samples was the same as that of the S1 clay. As a whole, during the water injection process, the PCs of each group of soil samples were not constant, but gradually decreased and tended to be stable with time. Therefore, the PC is a process parameter reflecting the transition from unstable seepage to stable seepage. Meanwhile, it was interesting that the PC did not decrease monotonically with time, but was discretely distributed and exhibited obvious cyclical changes, especially when the PC tended to be stable. Although the PCs of soil samples generally showed a downward trend in each cycle, the evolution of the peak and valley PCs in each cycle was not the same: the peak and valley values of the PCs of the S1 and S2 decreased synchronously in each cycle, while the valley values of the PCs of S3, S4, and S5 gradually increased. Within this framework, the difference between the peak value and the valley value of the PC in each cycle as used as the amplitude value of the corresponding cycle (Figure 4), and the average cycle amplitude and average cycle time of S1–S5 PCs are summarized in Table 2. It could be found that the offshore clay had the characteristics of a large single-cycle amplitude and long cycle time, which was especially reflected in S5.
Furthermore, to quantitatively describe the evolution and distribution of the PC, the mean value and coefficient of variation (CV) of the PC in each unit were calculated according to the curve shape, taking 1000 s as the time unit, as shown in Figure 5. Overall, the average PC from 0–1000 s was higher than in other cycles. When the time exceeded 1000 s, the average PC started to stabilize. To divide the stable stage of the PC, the 5% CV was chosen as the criterion for evaluating the stability of the PC in this work. Hence, S1 and S2 tended to be stable after 1000 s, S3 tended to be stable after 2000 s, S4 tended to be stable after 3000 s, and S5 tended to be stable after 4000 s. It could be seen that, compared with the USC in the early-reclaimed area, the USC in the late-reclaimed area needed a longer time to reach the stable seepage stage.

3.1.2. Differential Permeability Patterns among Reclamation Areas

A relatively stable PC can be used to analyze the permeability characteristics that are not restricted by seepage time [48]. The average values of the PCs of S1–S5 in the stable seepage stage were 5.68 × 10⁻⁷ cm/s, 4.79 × 10⁻⁷ cm/s, 3.23 × 10⁻⁷ cm/s, 2.92 × 10⁻⁷ cm/s, and 2.78 × 10⁻⁷ cm/s respectively (Figure 5), showing a decreasing trend. This phenomenon indicated that the drainage efficiency of USC in the early-reclaimed areas seemed to be better than that in the late-reclaimed areas, which is unconventional. Although the relatively stable PCs of offshore clay were lower than those of inland clay, it does not mean that their PCs were always at a low level in the whole seepage stage, as shown in Figure 6. Taking offshore clay S5 as an example, during the initial phase of seepage the peak PC was close to 9 × 10⁻⁷, which is a relatively high level, and has an absolute advantage over other clays. Referring to the enlarged area of Figure 4e, it was found that the PC of S5 was affected by the dense scattered points in the lower part of the cycle, leading to the overall low average PC of S5 in the stable stage.
Therefore, although the relatively high porosity of soil provides more abundant seepage space in theory, it does not necessarily have a relatively high and stable PC in practice (Table 1). When a soil layer exhibits weak permeability, it may be caused by unstable seepage channels in addition to the inherent physical and chemical properties of the soil. This instability is first manifested in the distribution of the PC. As shown in Figure 5, from S1 to S5, in each 1000 s time period, the CV of the PC was always monotonically increasing, especially the CV in S5, which reached 33.6% in 0–1000 s. As a result, the distribution of the PCs from S1 to S5 became more discrete and the cyclical fluctuation was stronger. Figure 7 shows the attenuated PC percentages of S1–S5, and the attenuation rates of the PCs from the initial maximum value to the stable value were 23.14%, 35.70%, 43.13%, 38.32%, and 69.08%, respectively. It can be seen that during the seepage process, the permeability deterioration of the offshore clay was more obvious. To sum up, the offshore clays had more difficulty forming stable seepage than inland clays.

3.2. Pore Characteristics

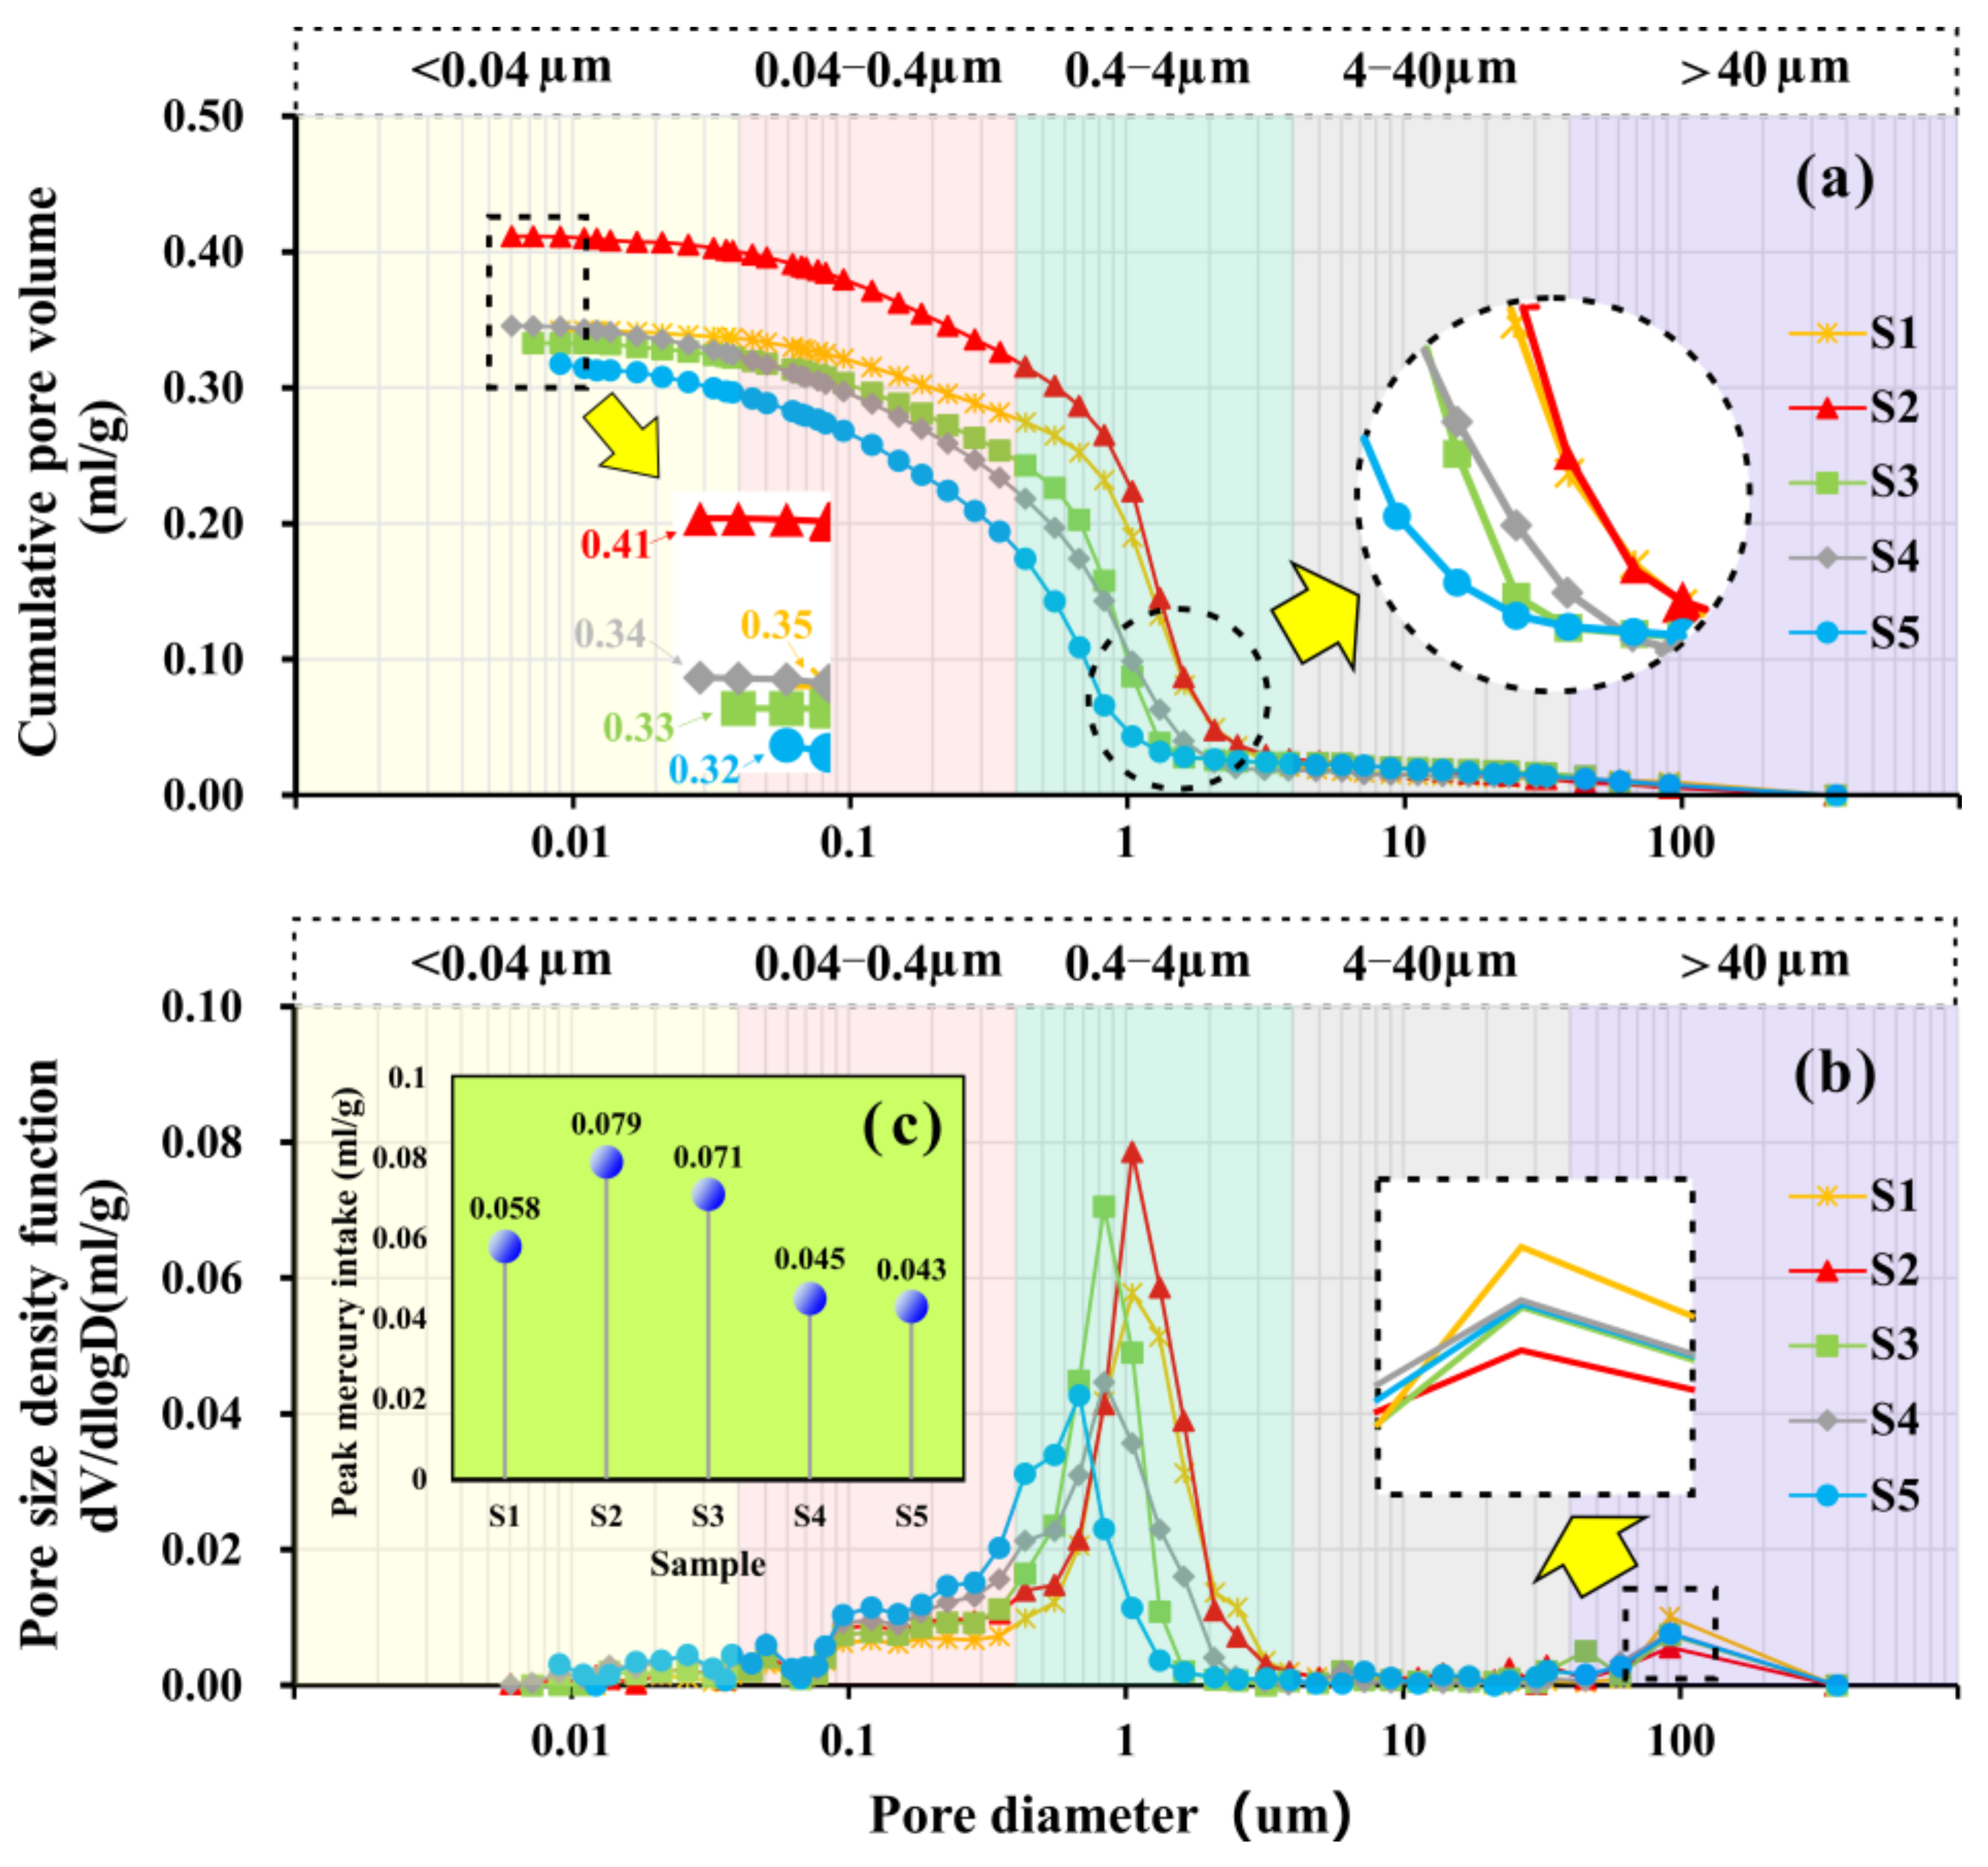
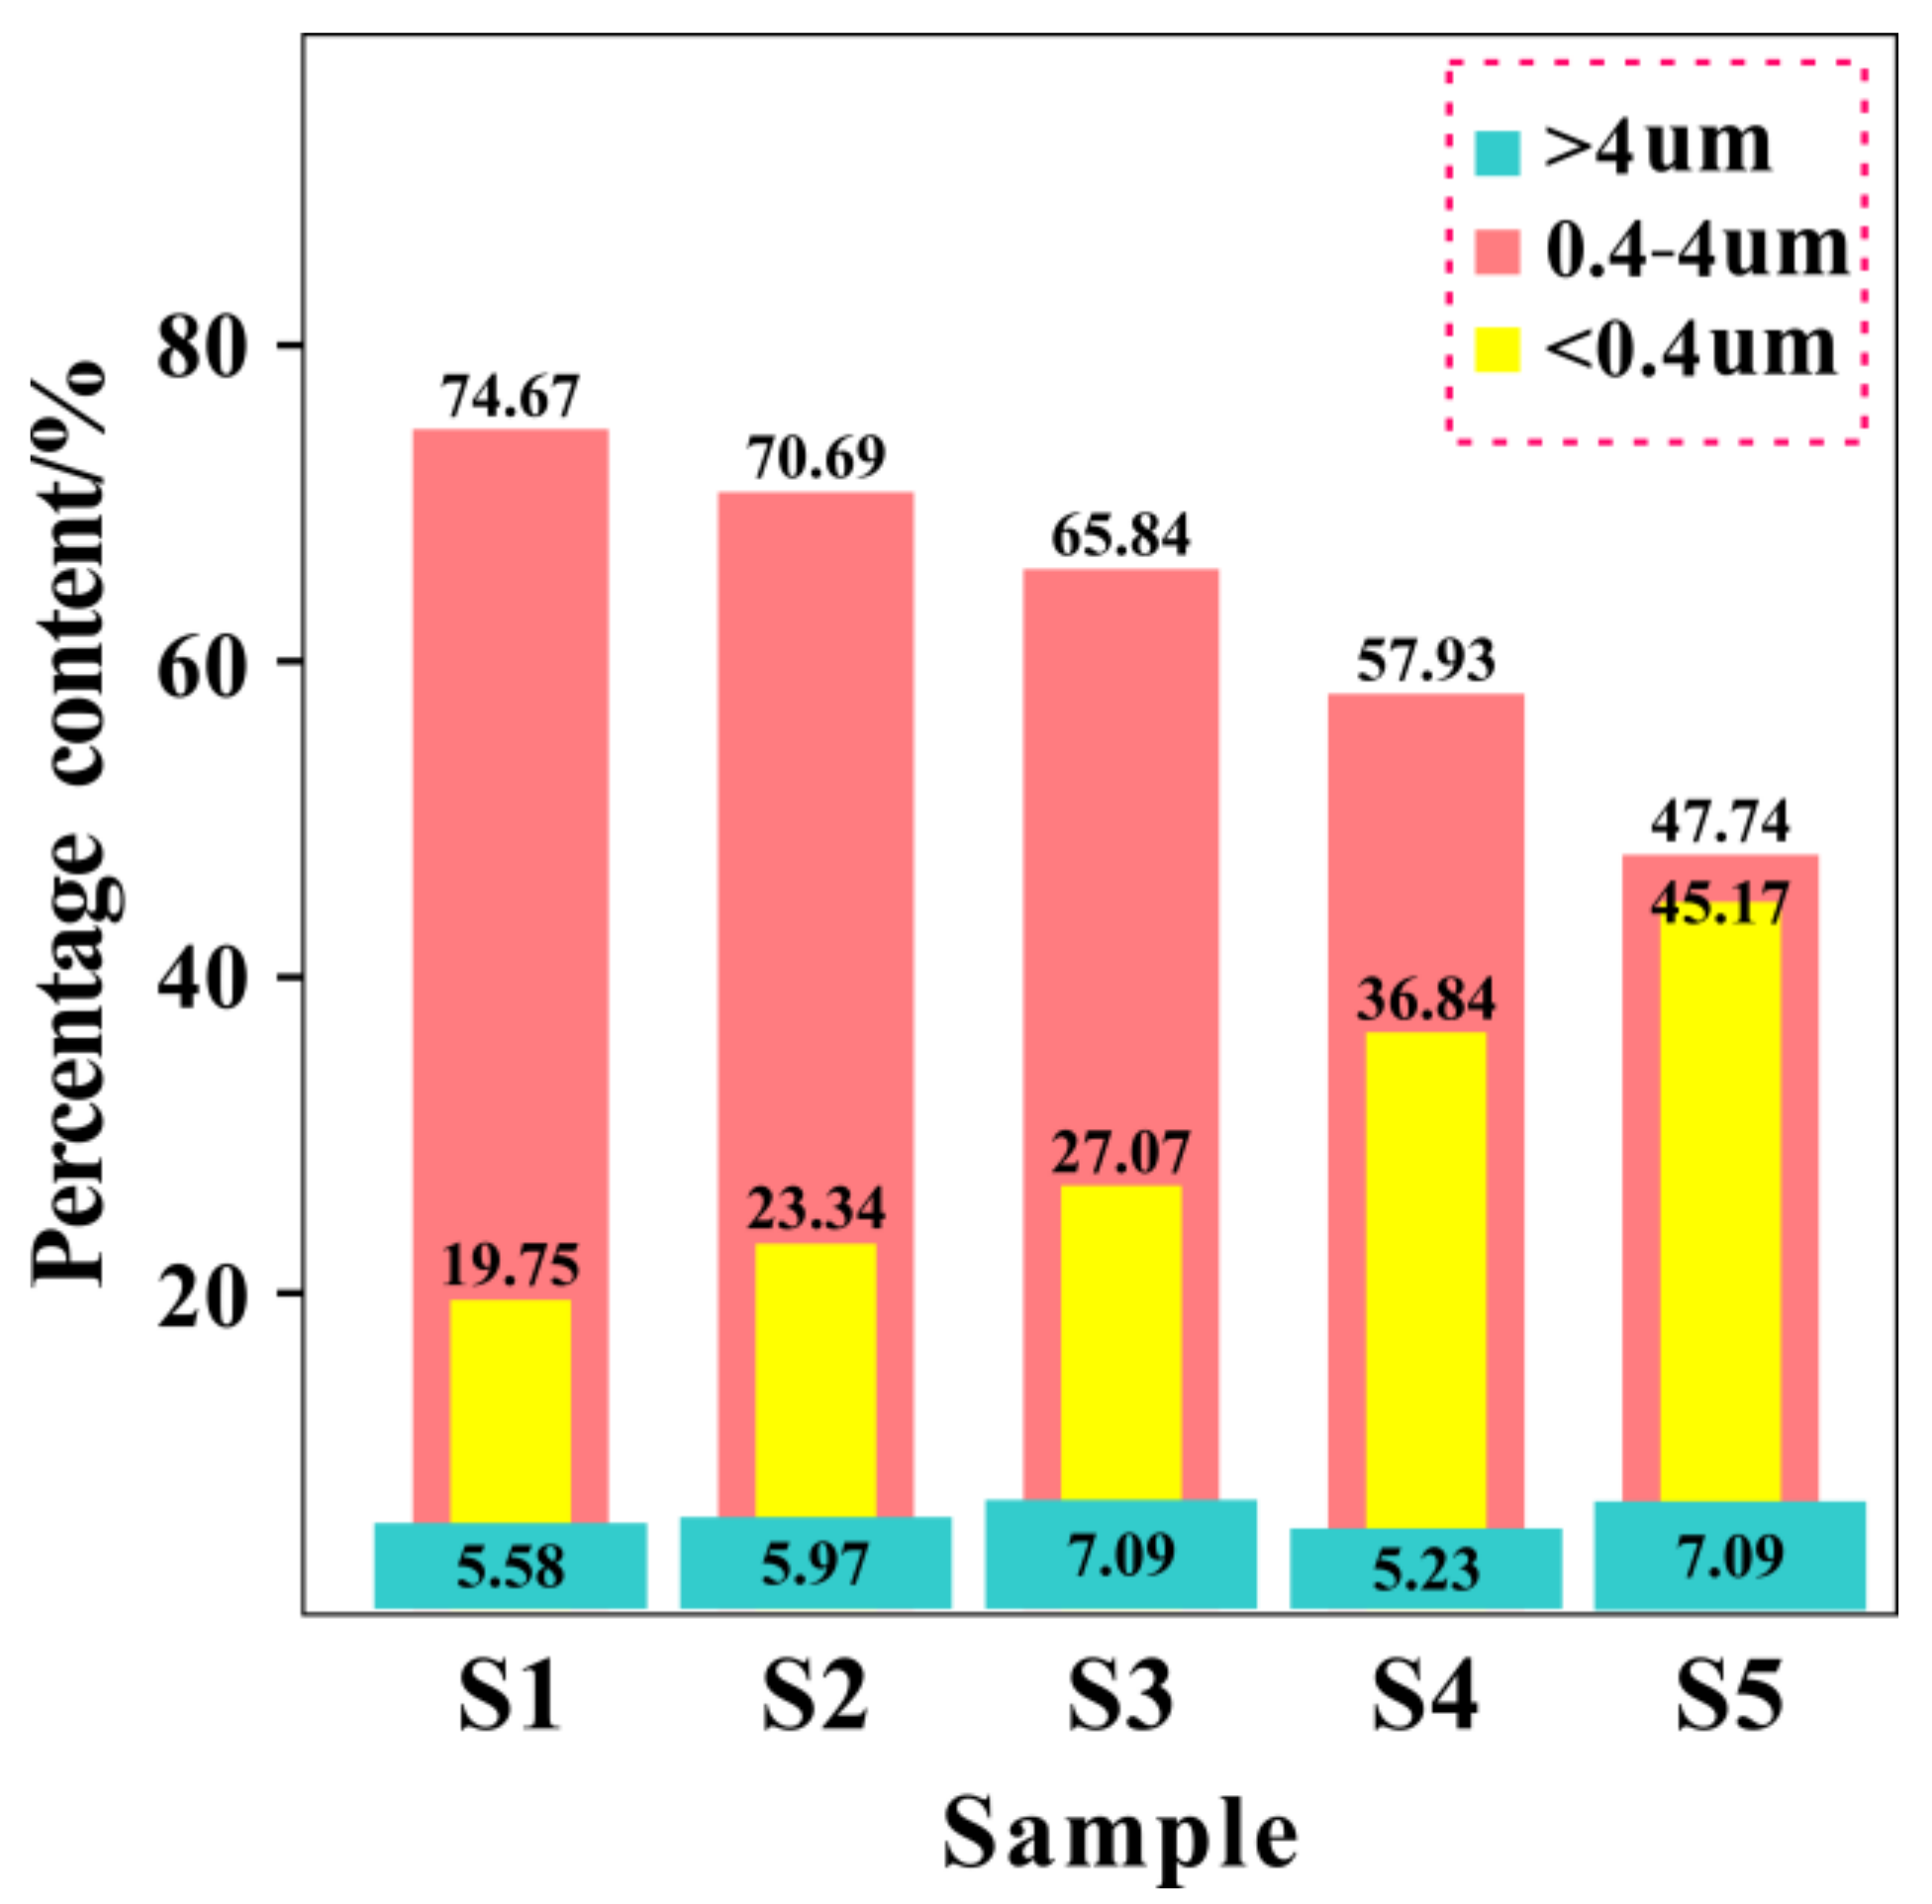
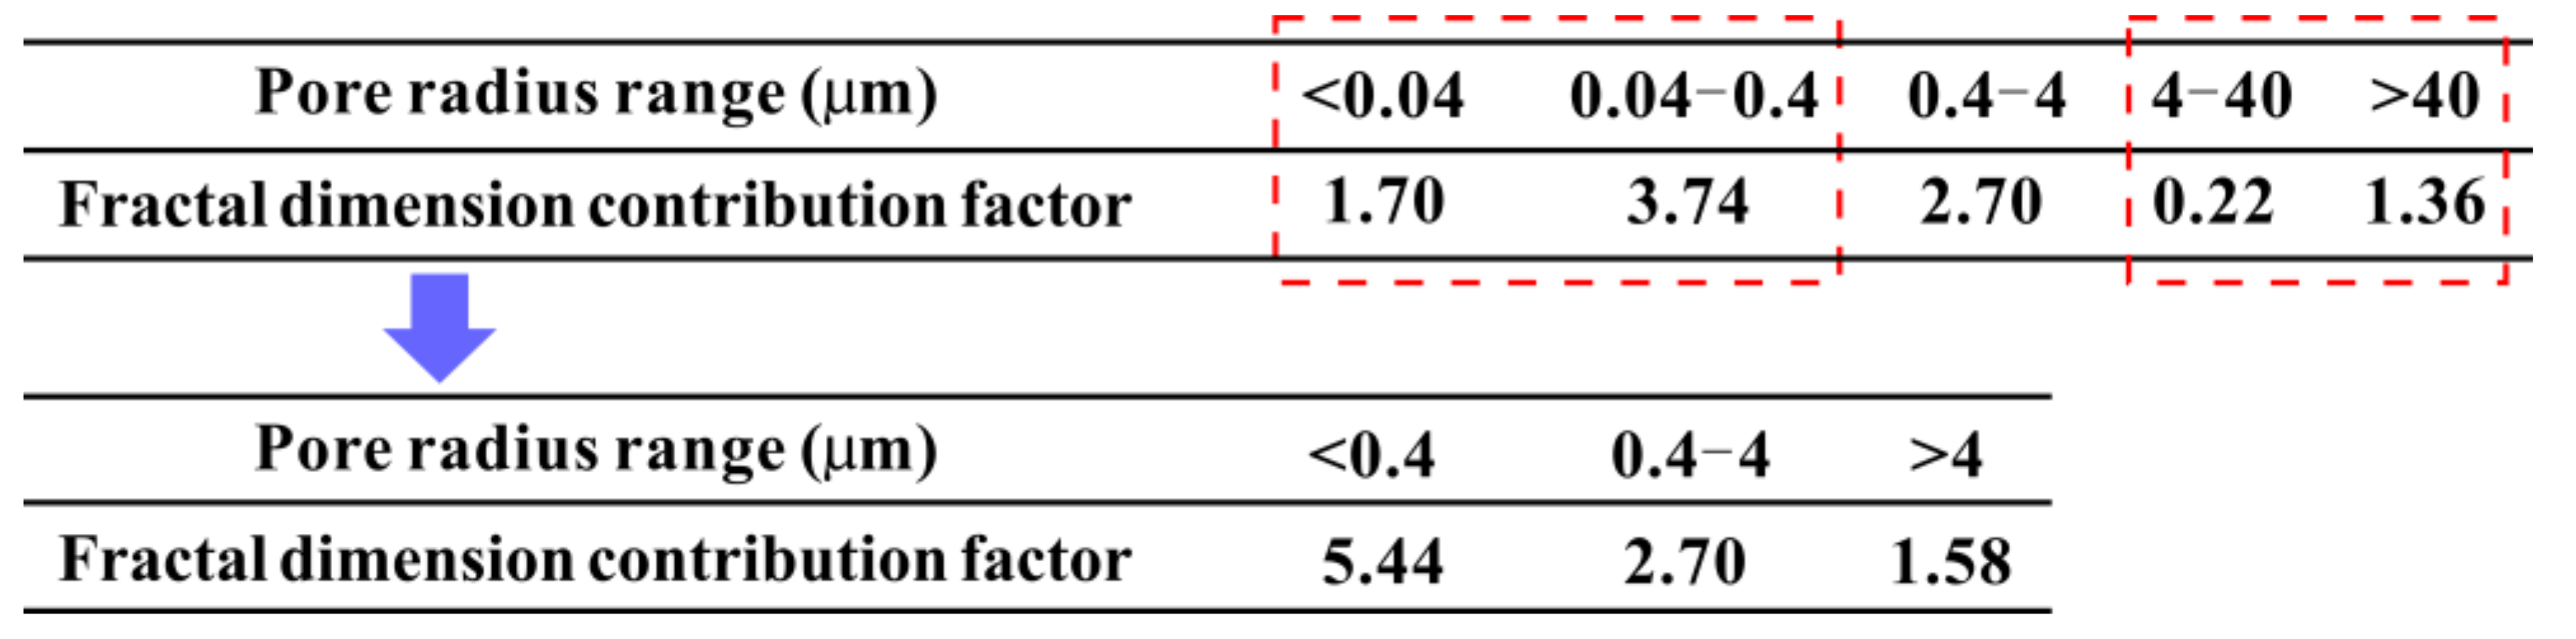
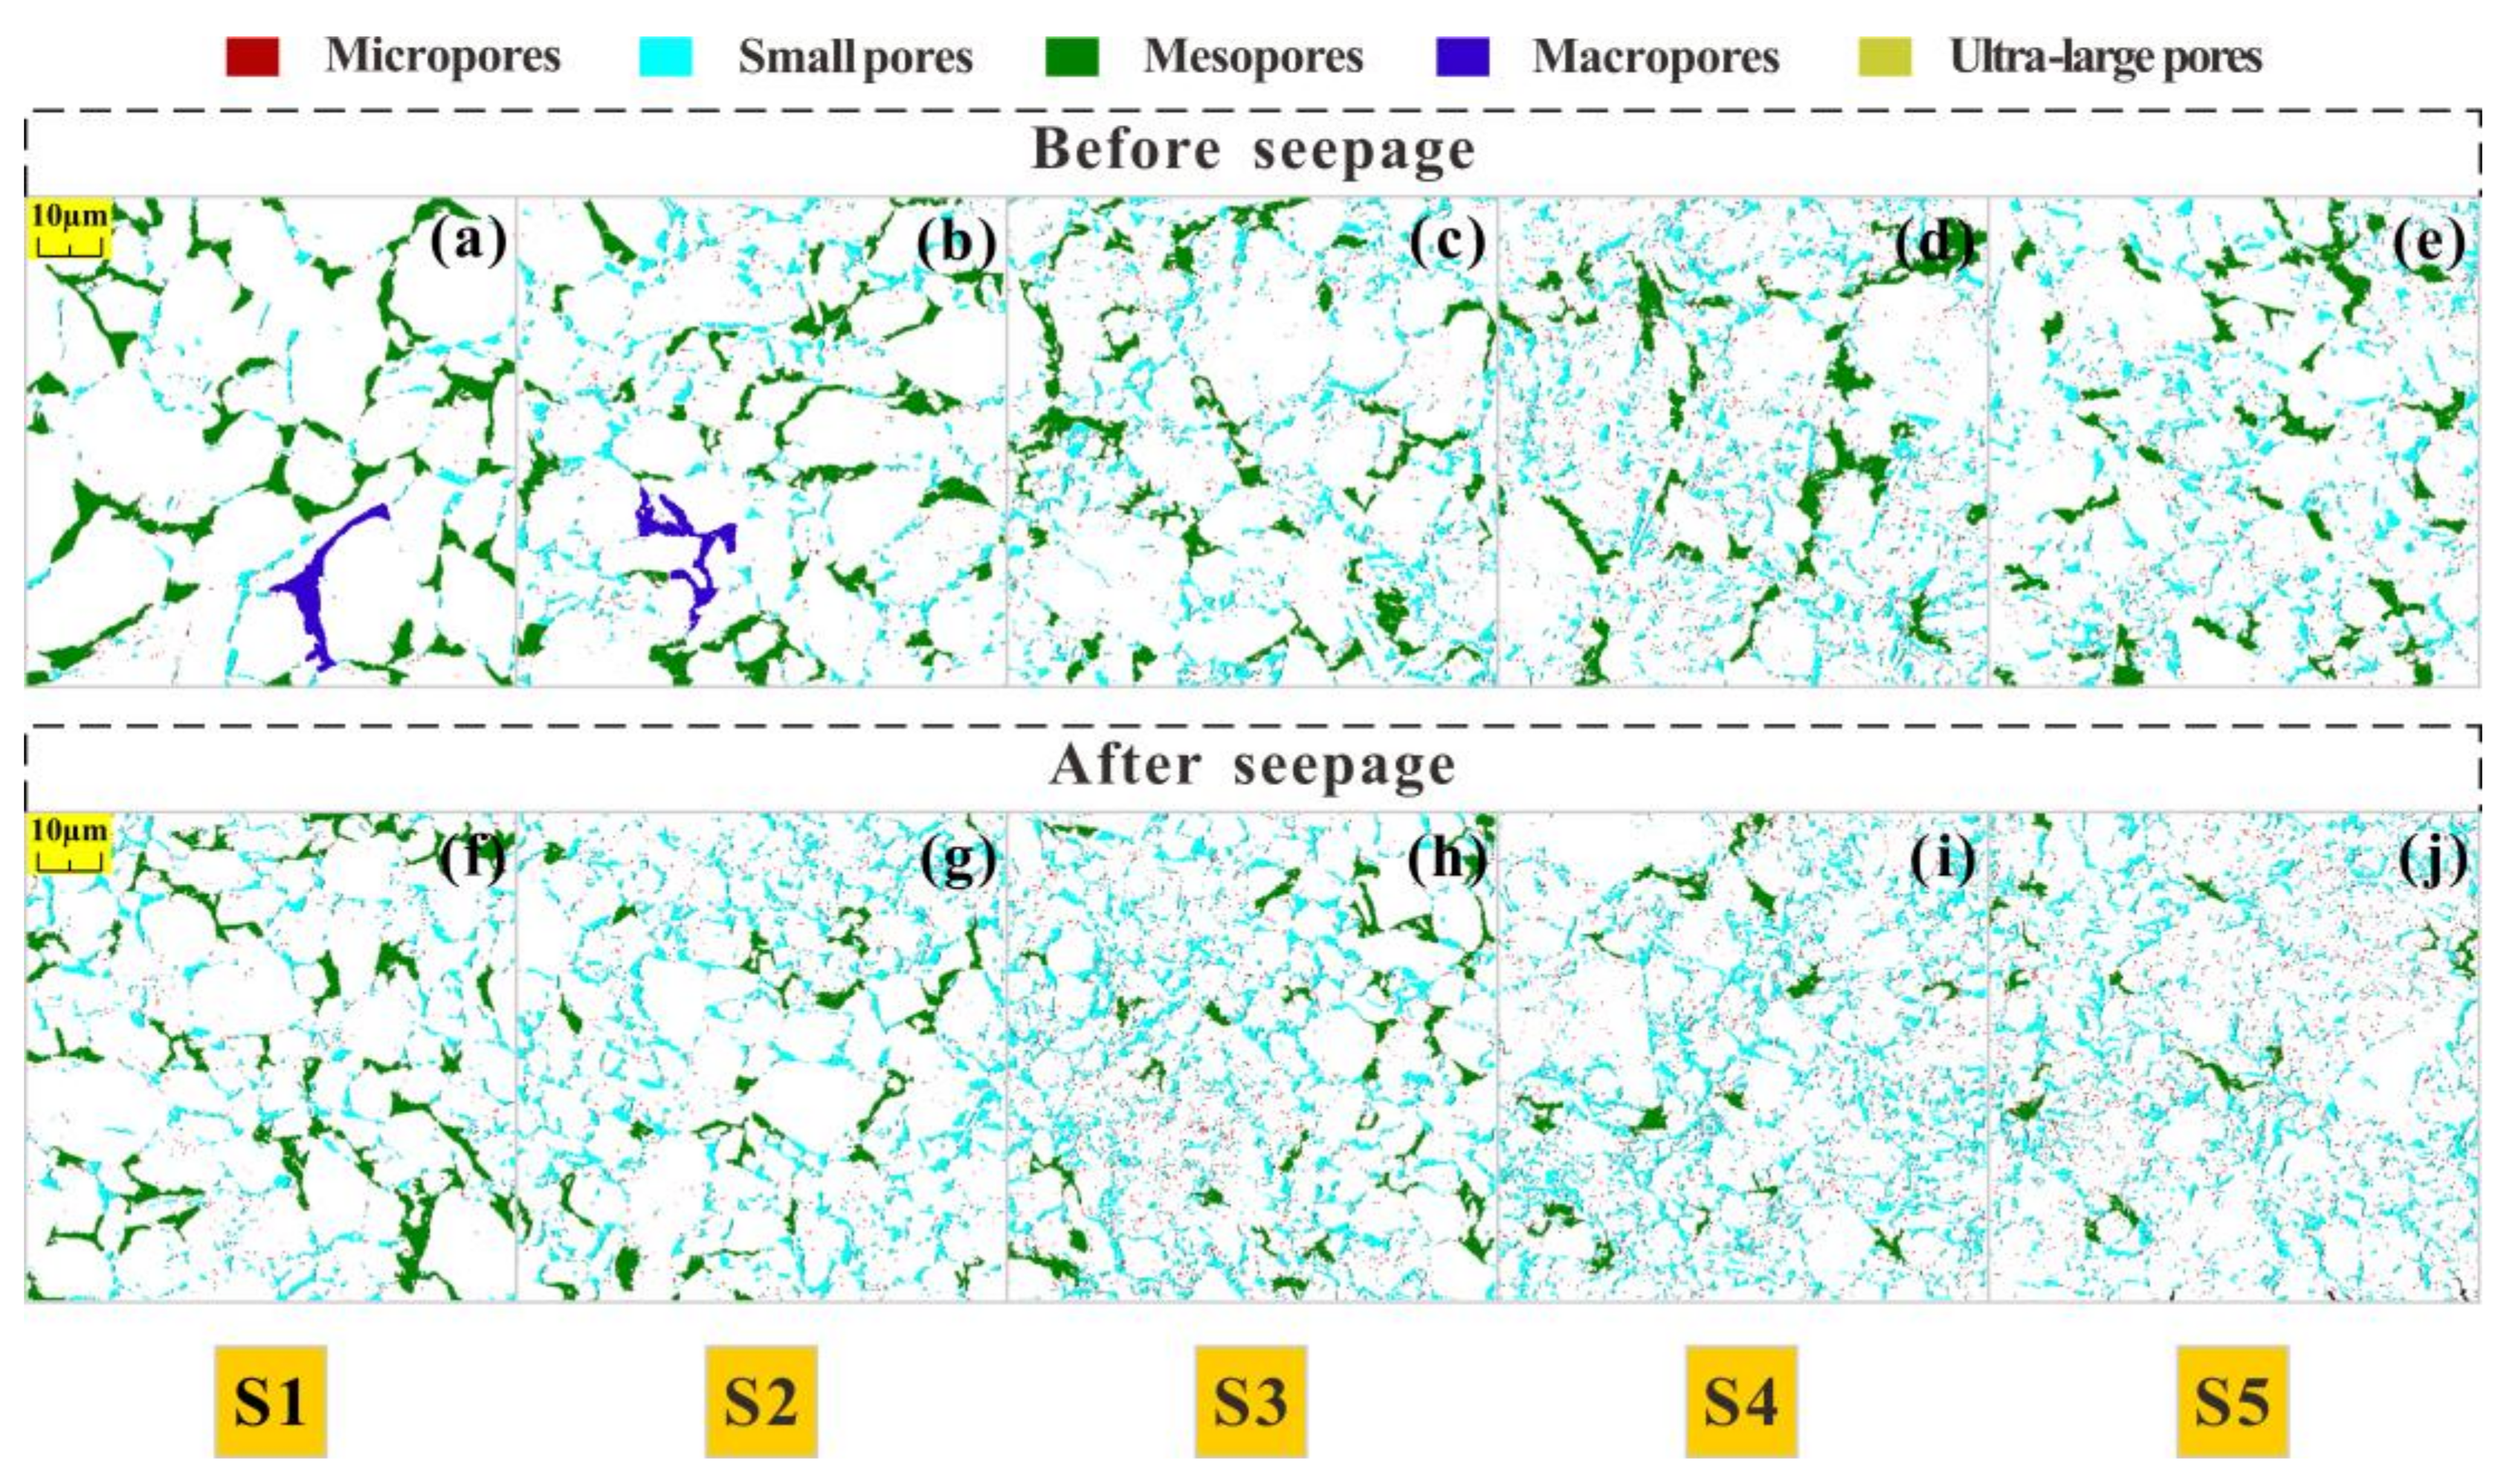
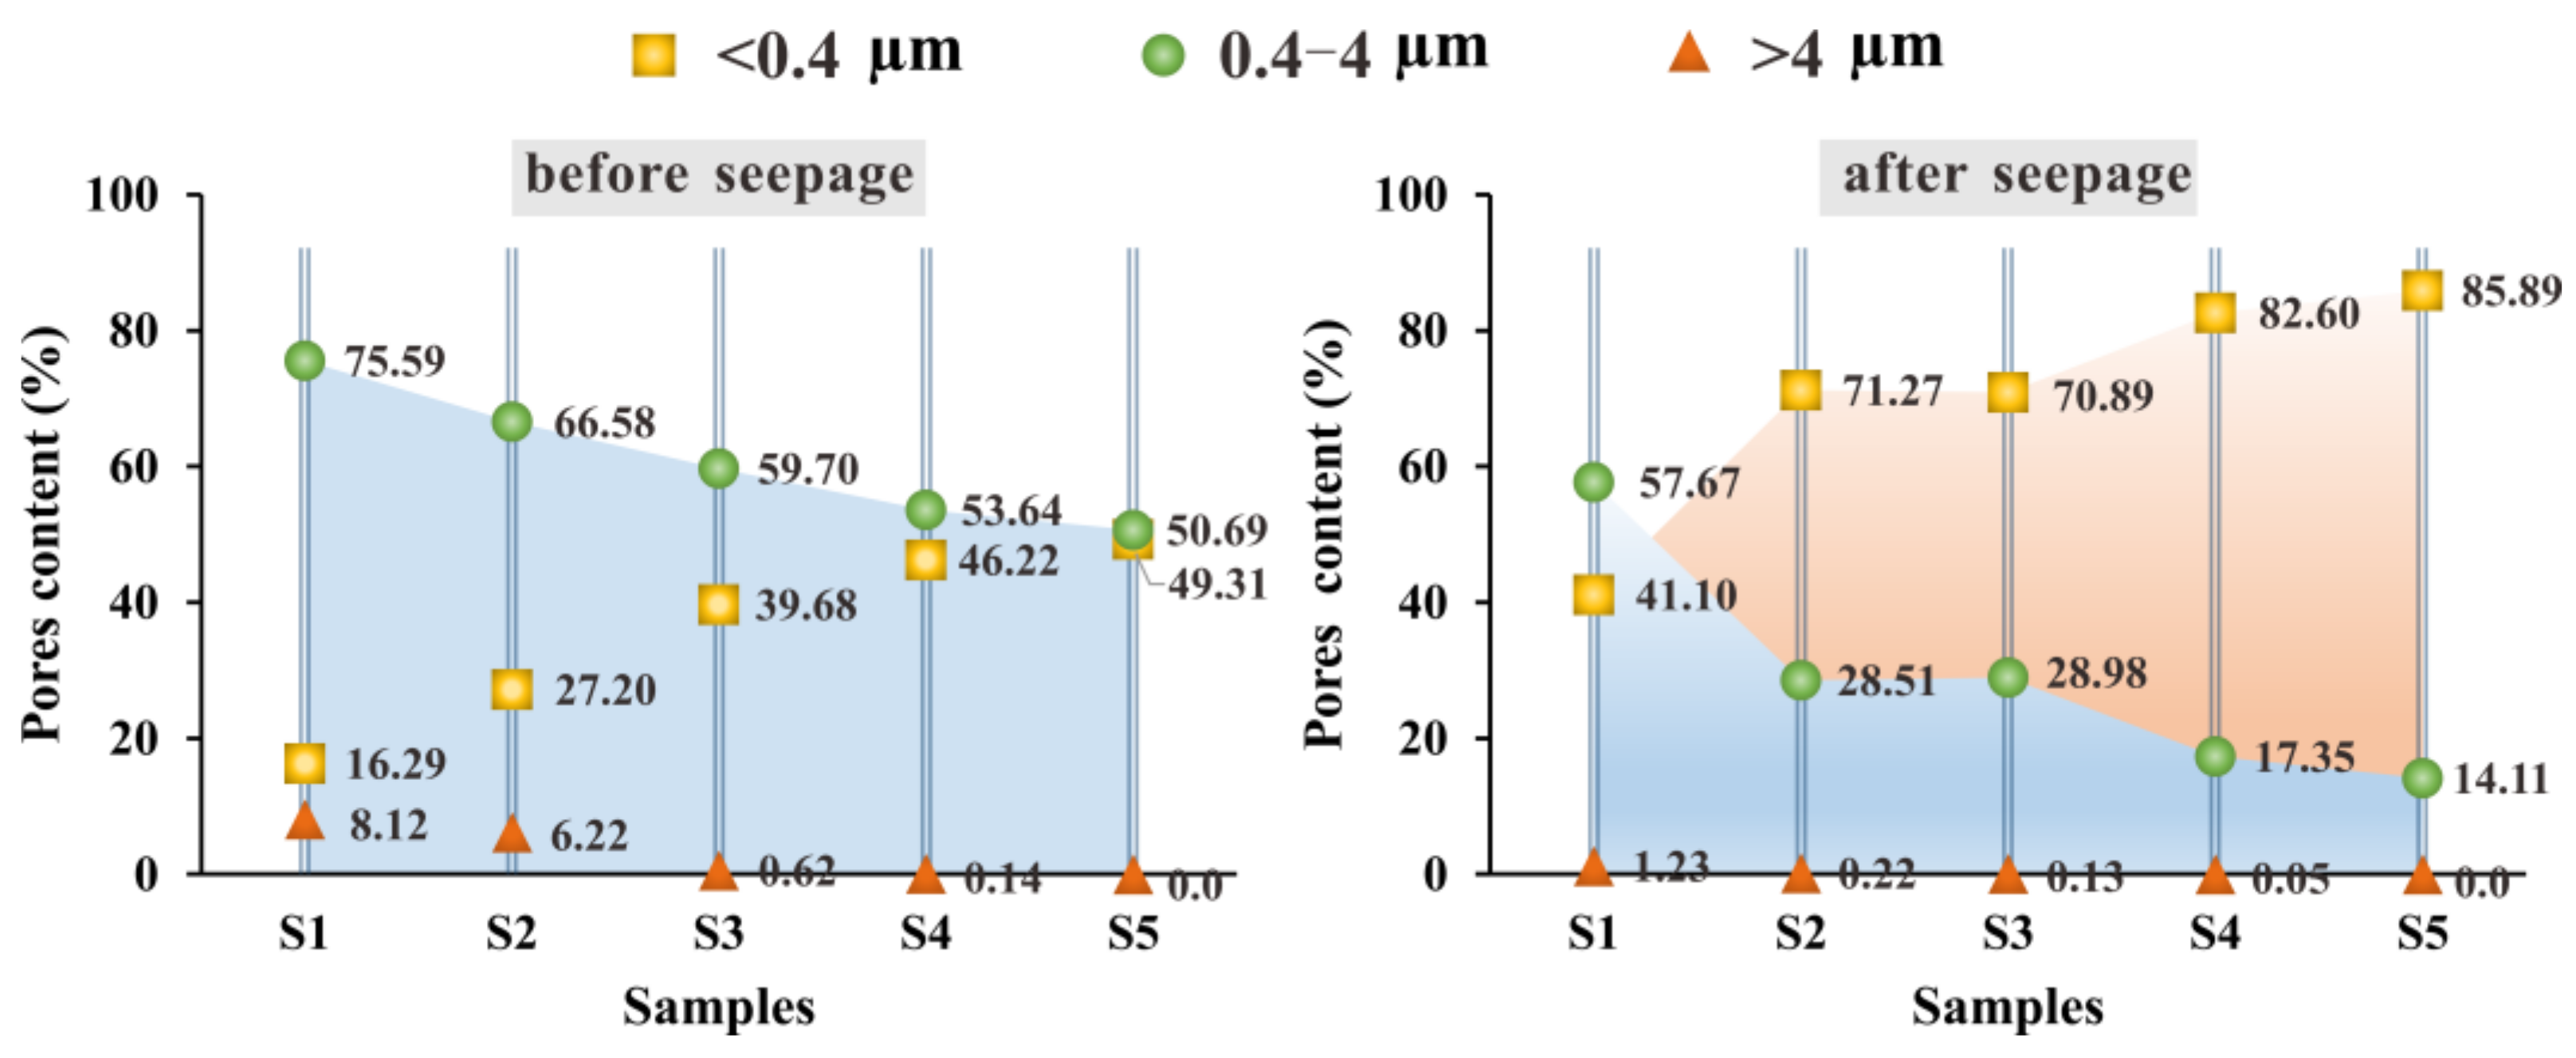
3.2.1. Pore Distribution
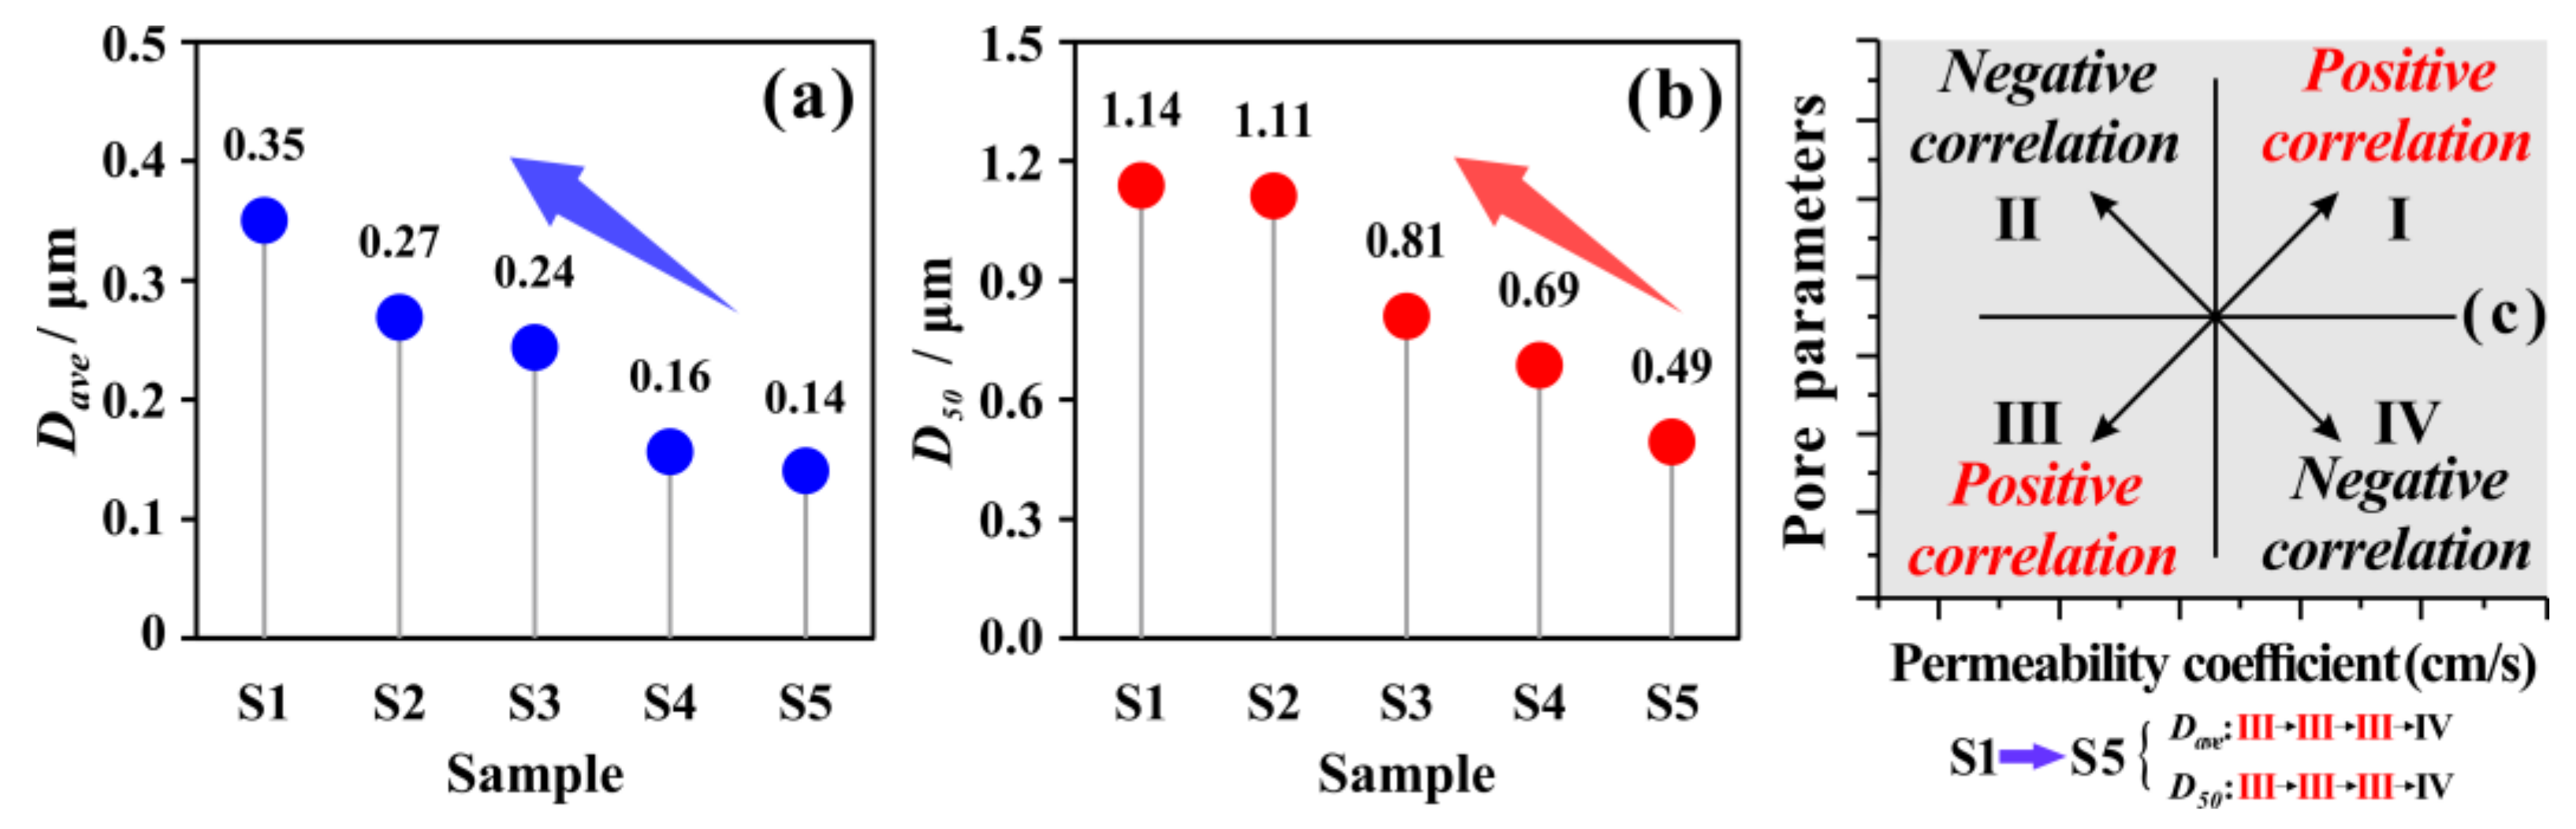
Figure 8a shows the cumulative curve of the “pore size-mercury intrusion”. Overall, the pore diameter was between 7 nm and 0.4 mm, and the intrusion pore size was inversely proportional to the intrusion pressure. In the early stage of the low pressure, the mercury inflow volume increased slowly with the decrease in pore diameter. When the mercury intrusion diameter was as small as 3 μm, the mercury at that time first exhibited a bottleneck effect, and the cumulative mercury inflow increased rapidly until the intrusion diameter was as small as 0.3 μm. Later, when the mercury broke through the second bottleneck effect, the mercury continued to invade the smaller pores. Due to the small size of these pores, the intrusion rate was weakened. According to previous studies [45,49], pores are divided into micropores (<0.04 μm), small pores (0.04–0.4 μm), mesopores (0.4–4 μm), macropores (4–40 μm), and ultra-large pores (>40 μm). In this paper, pore sizes of <0.4 μm and >4 μm are collectively referred to as small pores and macropores, and this division can better reflect the variation law of pores at all levels. The mercury accumulation curves of the S1–S5 samples were all “S” shaped, that is, the two ends of the curves were flat and the middle was steep, indicating that most of the mercury flowed into the mesopores and small pores. Moreover, the total mercury intake of samples S1–S5 was 0.35 mL/g, 0.41 mL/g, 0.33 mL/g, 0.34 mL/g, and 0.32 mL/g, respectively. This indicates that the cumulative mercury intake of inland clay was higher than that of offshore clay, and the inland clay had more abundant pore-invasion space.
Furthermore, Figure 8b displays the pore size distribution curves of the five groups of samples. As can be seen, all curves exhibited similar “single peak” characteristics. The pore size corresponding to the peak of the curve was the dominant pore. The pores in all samples were dominated by mesopores, followed by small pores, with the content of macropores being smallest. Further analysis manifested that the peaks of S1–S5 were 0.058 mL/g, 0.079 mL/g, 0.071 mL/g, 0.045 mL/g, and 0.043 mL/g, respectively (Figure 8c), indicating that inland clay had a more obvious peak advantage than offshore clay. Meanwhile, the dominant pore diameters corresponding to the peaks of S1–S5 were 1.056 μm, 1.055 μm, 0.834 μm, 0.834 μm, and 0.678 μm, respectively, indicating that the curves of S3–S5 shifted to the left, corresponding to a decrease in the content of mesopores and an increase in the content of small pores.
Based on the above results, the percentage variations in pores at all levels in S1–S5 were calculated, as shown in Figure 9. The mesopores content was dominant, accounting for approximately 47.74–74.67% of the total pore content. Furthermore, with the change of reclamation time, the content of pores at all levels in the sample also changed. The mesopores content in S1 and S2 was 26.93% and 22.94% higher than that of S5, respectively. Conversely, inland clays generally had a lower small pore content than offshore clays. Due to having the lowest content, the macropore changes were weaker. Therefore, it was inferred that the mesopore content was the key to controlling the PC.
We compared the tested MIP porosity with the calculated natural porosity, as shown in Figure 10. Overall, the calculated porosity was higher than the tested porosity, especially in offshore clay. Evidently, there were some pores that could not be detected. These pores mainly included (a) isolated pores surrounded by solids; (b) pores that must pass through smaller pores to enter; and (c) pores that were beyond the limits of the instrument due to its minimum actual pressure. Therefore, although the total porosity of the offshore clay was high, there were relatively few pores with better connectivity. The existence of isolated pores and tiny pores cannot be ignored, and they will limit the migration of water to a certain extent [50,51].

3.2.2. Pore Size

Figure 11a, b displays the variation of Dave and D50 in the clay of S1–S5. It can be seen that the Dave and D50 of inland clay were slightly higher, indicating that its overall pore size was larger. To better comprehend the overall pattern of the relationship between PC and different pore characteristics parameters, the variation trends between adjacent data points were employed, as shown in Figure 11c. If the variation trend fell in zones I and III, there was a positive correlation between the PC and a particular pore characteristic parameter; otherwise, if the variation trend fell in zones II and IV, the correlation was negative.

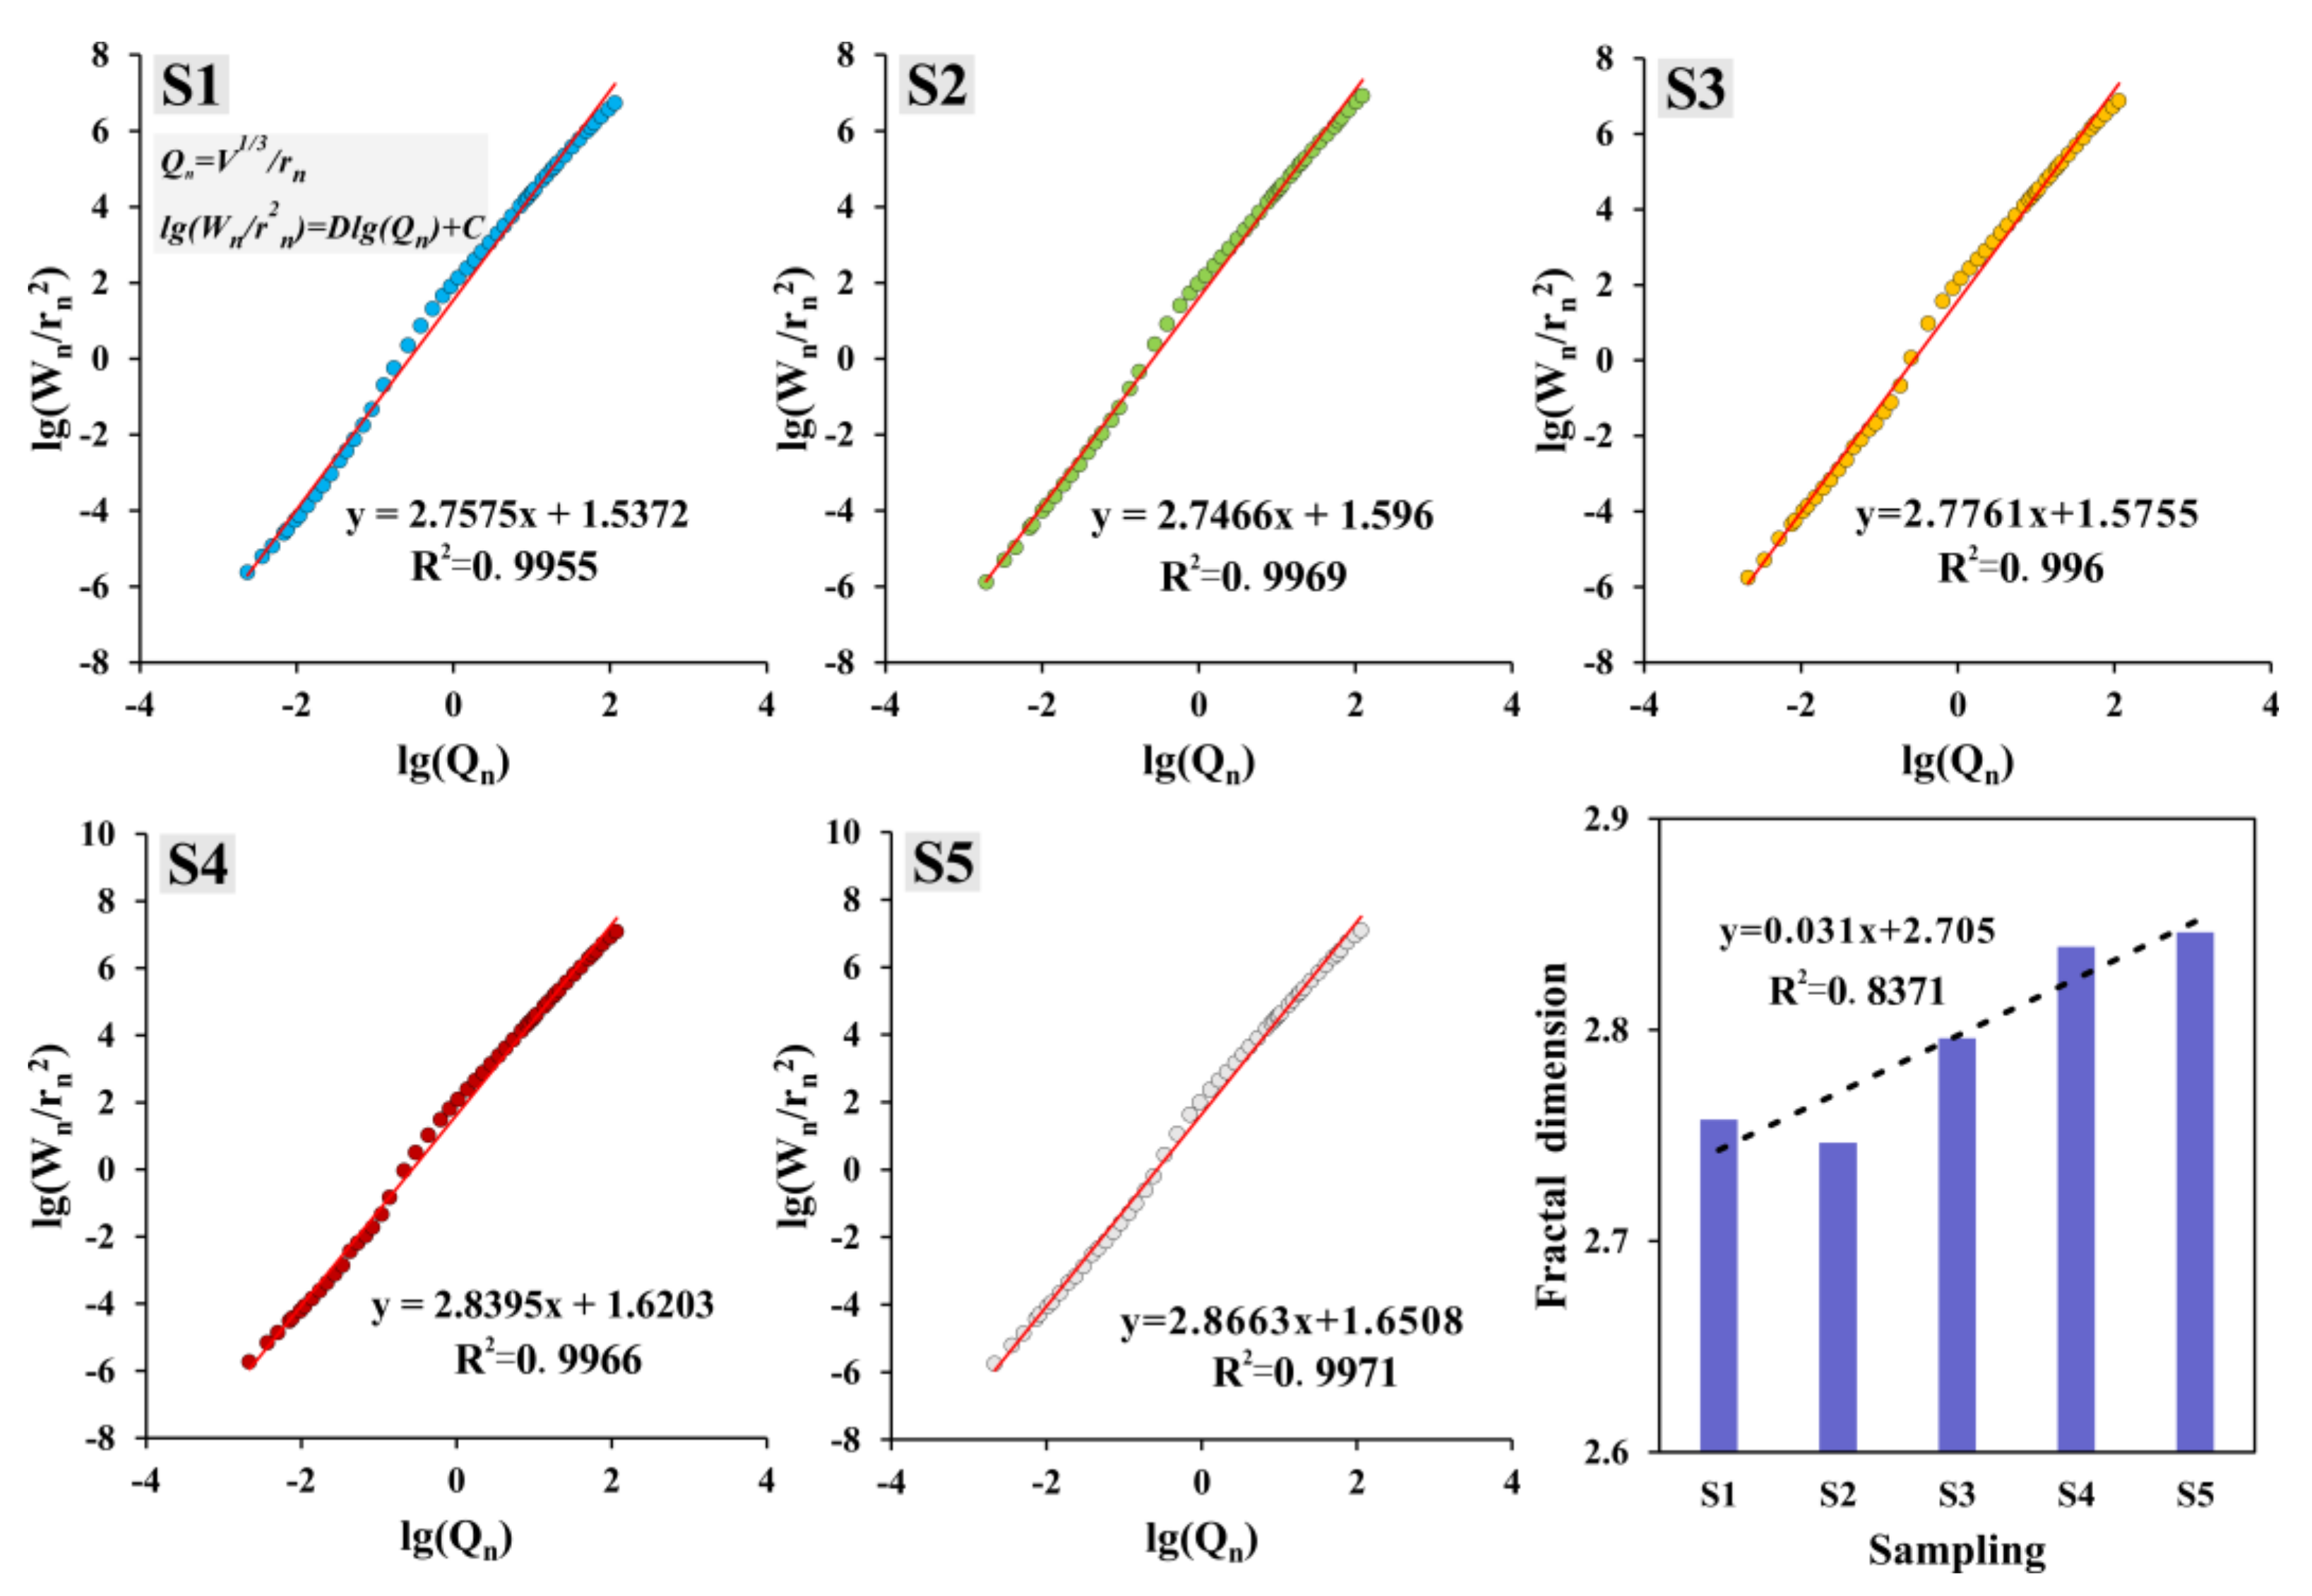
3.2.3. Pore Complexity

The FD can reflect the irregularity of the pore and the roughness of the pore wall. As shown in Figure 12, the fitting degree of the linear functions of pores at all levels of S1–S5 was greater than 99%, and the FD was within a reasonable range of from 2 to 3, indicating that the model was suitable for the test samples [52]. Moreover, the FDs of S1–S5 were 2.7575, 2.7466, 2.7761, 2.8395, and 2.8663, respectively, showing an overall increasing trend. This indicates that the pore morphology of offshore clay was more complex, which is tantamount to indirectly elongating the seepage paths at the microscopic scale, intensifying the momentum loss of seepage, and is unfavorable to the formation of pore water permeability conditions.
In addition, combined with the pore classification mentioned above, it was considered that the fractal dimension consists of five parts, namely,
D = D < 0.04 μ m + D 0.04 0.4 μ m + D 0.4 4 μ m + D 4 40 μ m + D > 40 μ m = i = 1 n C i P i
where C i represents the FD contribution factor and P i represents the standardized proportion of different pore components.
Figure 13 lists the normalized content of the aperture groupings and the contribution factor C i of the FD calculated using least-squares regression analysis. The FD contribution factor of small pores (<0.4 μm) was 5.44, which was much higher than that of mesopores (0.4–4 μm) and macropores (>4 μm). Obviously, if the content of small pores is high, the number of seepage paths for pore water diffusion in the soil may increase, indirectly extending the seepage path lengths. Therefore, the increase in small pores content was beneficial to the improvement of the FD. In the case of a given porosity, the FD contribution factor can reflect the disparity of pore size on the diffusion path of the moving medium to a certain extent.

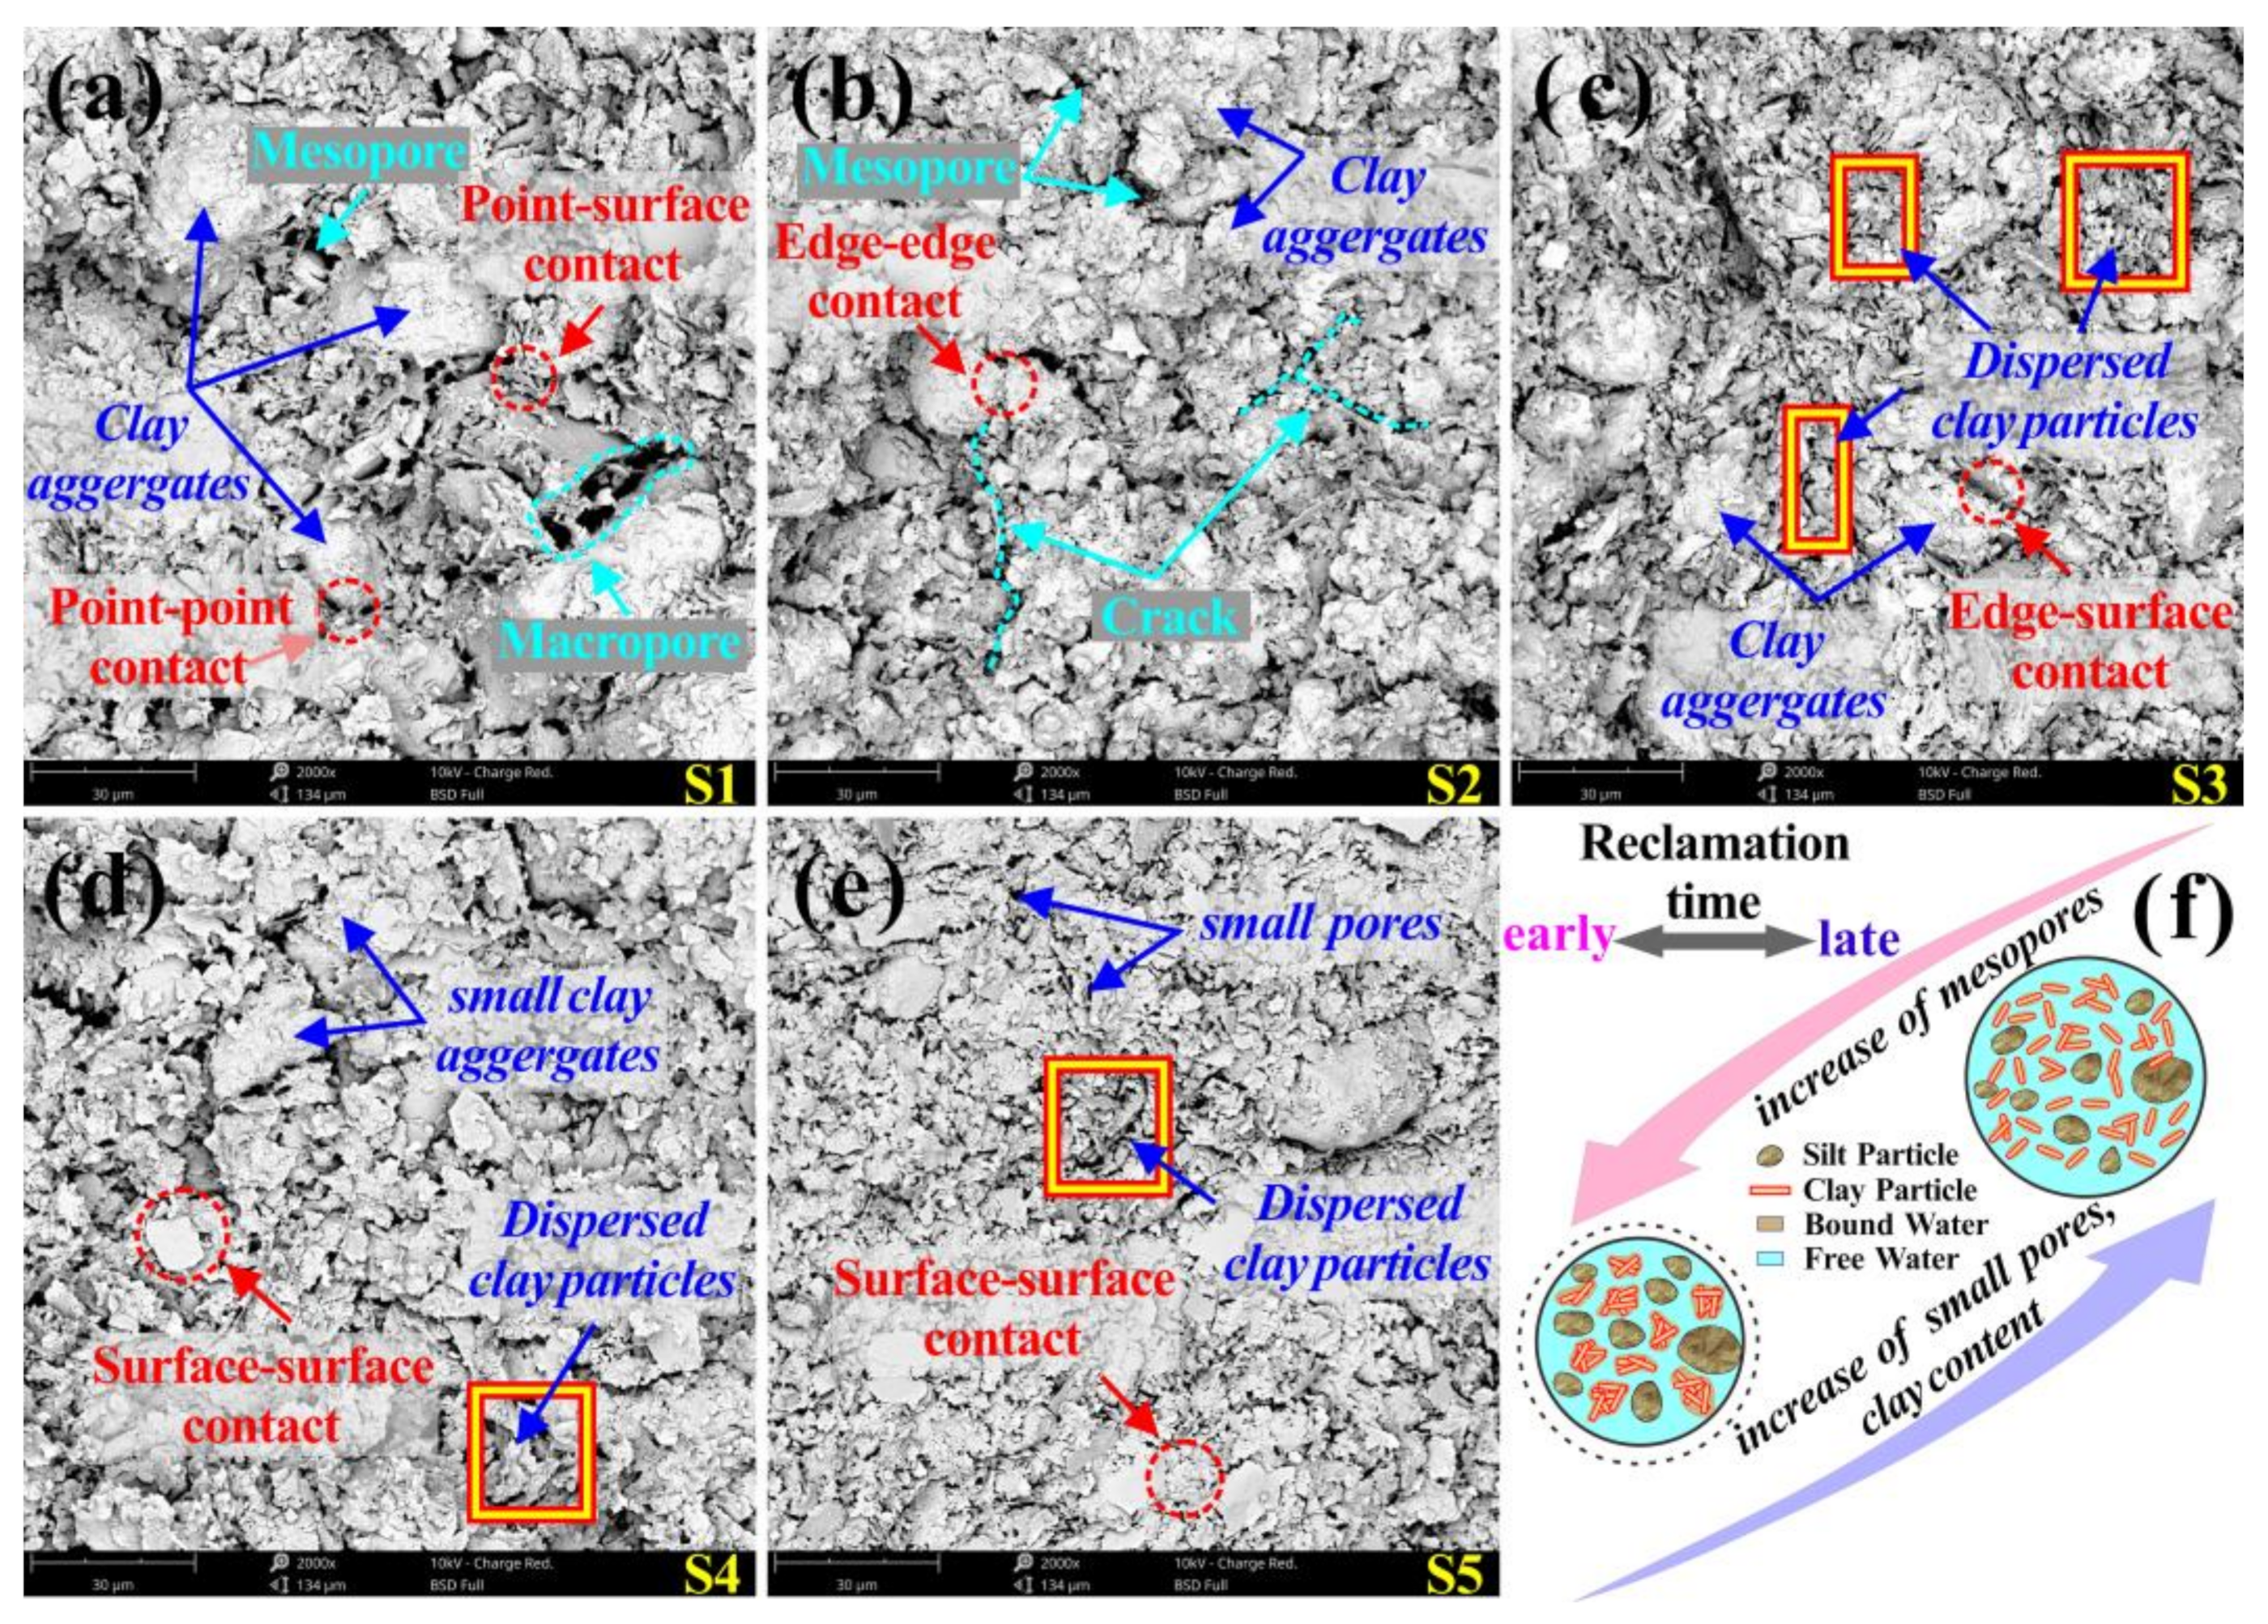
3.3. Microstructure Characteristics

SEM was used to study the microstructure characteristics of samples S1–S5 from different reclamation areas. Figure 14a–e shows the representative images at 2000×. SEM images are described by the following four key elements, namely, the overall microstructure, particle morphology, particle contact mode, and pore type. S1 and S2 presented a skeleton agglomeration structure dominated by silt particles. The clay particles had certain agglomeration, the surfaces of the coarse particles were relatively clean, and only a few fine particles were attached to the small clay aggregates. The particle contact modes were mainly point–point contact and point–surface contact, forming interparticle pores dominated by mesopores. Macropores larger than 4 μm or microfractures connected by originally developed pores could be seen locally. For S3 and S4, the sample structure transitioned from an aggregated structure to an aggregated–flocculate structure, and the contact area between particles increased slightly. The main contact modes were edge–surface contact and surface–surface contact. The number of directly observable coarse particles or clay aggregates was reduced, while the fine particles and small clay aggregates filled the pores, resulting in fewer mesopores and a wider distribution of small pores. As for S5, the sample exhibited an aggregated–flocculate structure. Particles were mainly in edge–surface or face–face contact. Since the small particles covered the surface of coarse particles in the form of stars or films, it was difficult to distinguish individual coarse particles. The pore types were dominated by interparticle pores, followed by intraparticle pores. It can be seen from Table 1 that the clay content increased from S1 to S5, with percentages of 25.24%, 30.92%, 29.81%, 33.27% and 33.91%, respectively, indicating that the number of pores had a certain match with the clay content.
In summary, the particle agglomeration of inland clay was stronger than that of offshore clay, the pores between particles were more developed, and the pore connectivity and drainage were relatively good (Figure 14f).

4. Discussion

Pores are the channels of seepage, and the evolution and cyclical fluctuation of the PC must be inseparable from pore characteristics. There are numerous pore parameters to characterize the distribution (small pores content, mesopores content, macropores content), size (D50, Dave) and complexity (FD) of soil pores. Meanwhile, the PC in the stable stage was selected to represent the permeability of the sample, the CV of the 0–1000 s stage with the largest fluctuation range was selected to represent the cyclical amplitude of the PC, and the average cycle time (ACT) was selected to represent the period. A Pearson correlation analysis was applied to explore the correlation between the above parameters, and the results are shown in Figure 15.

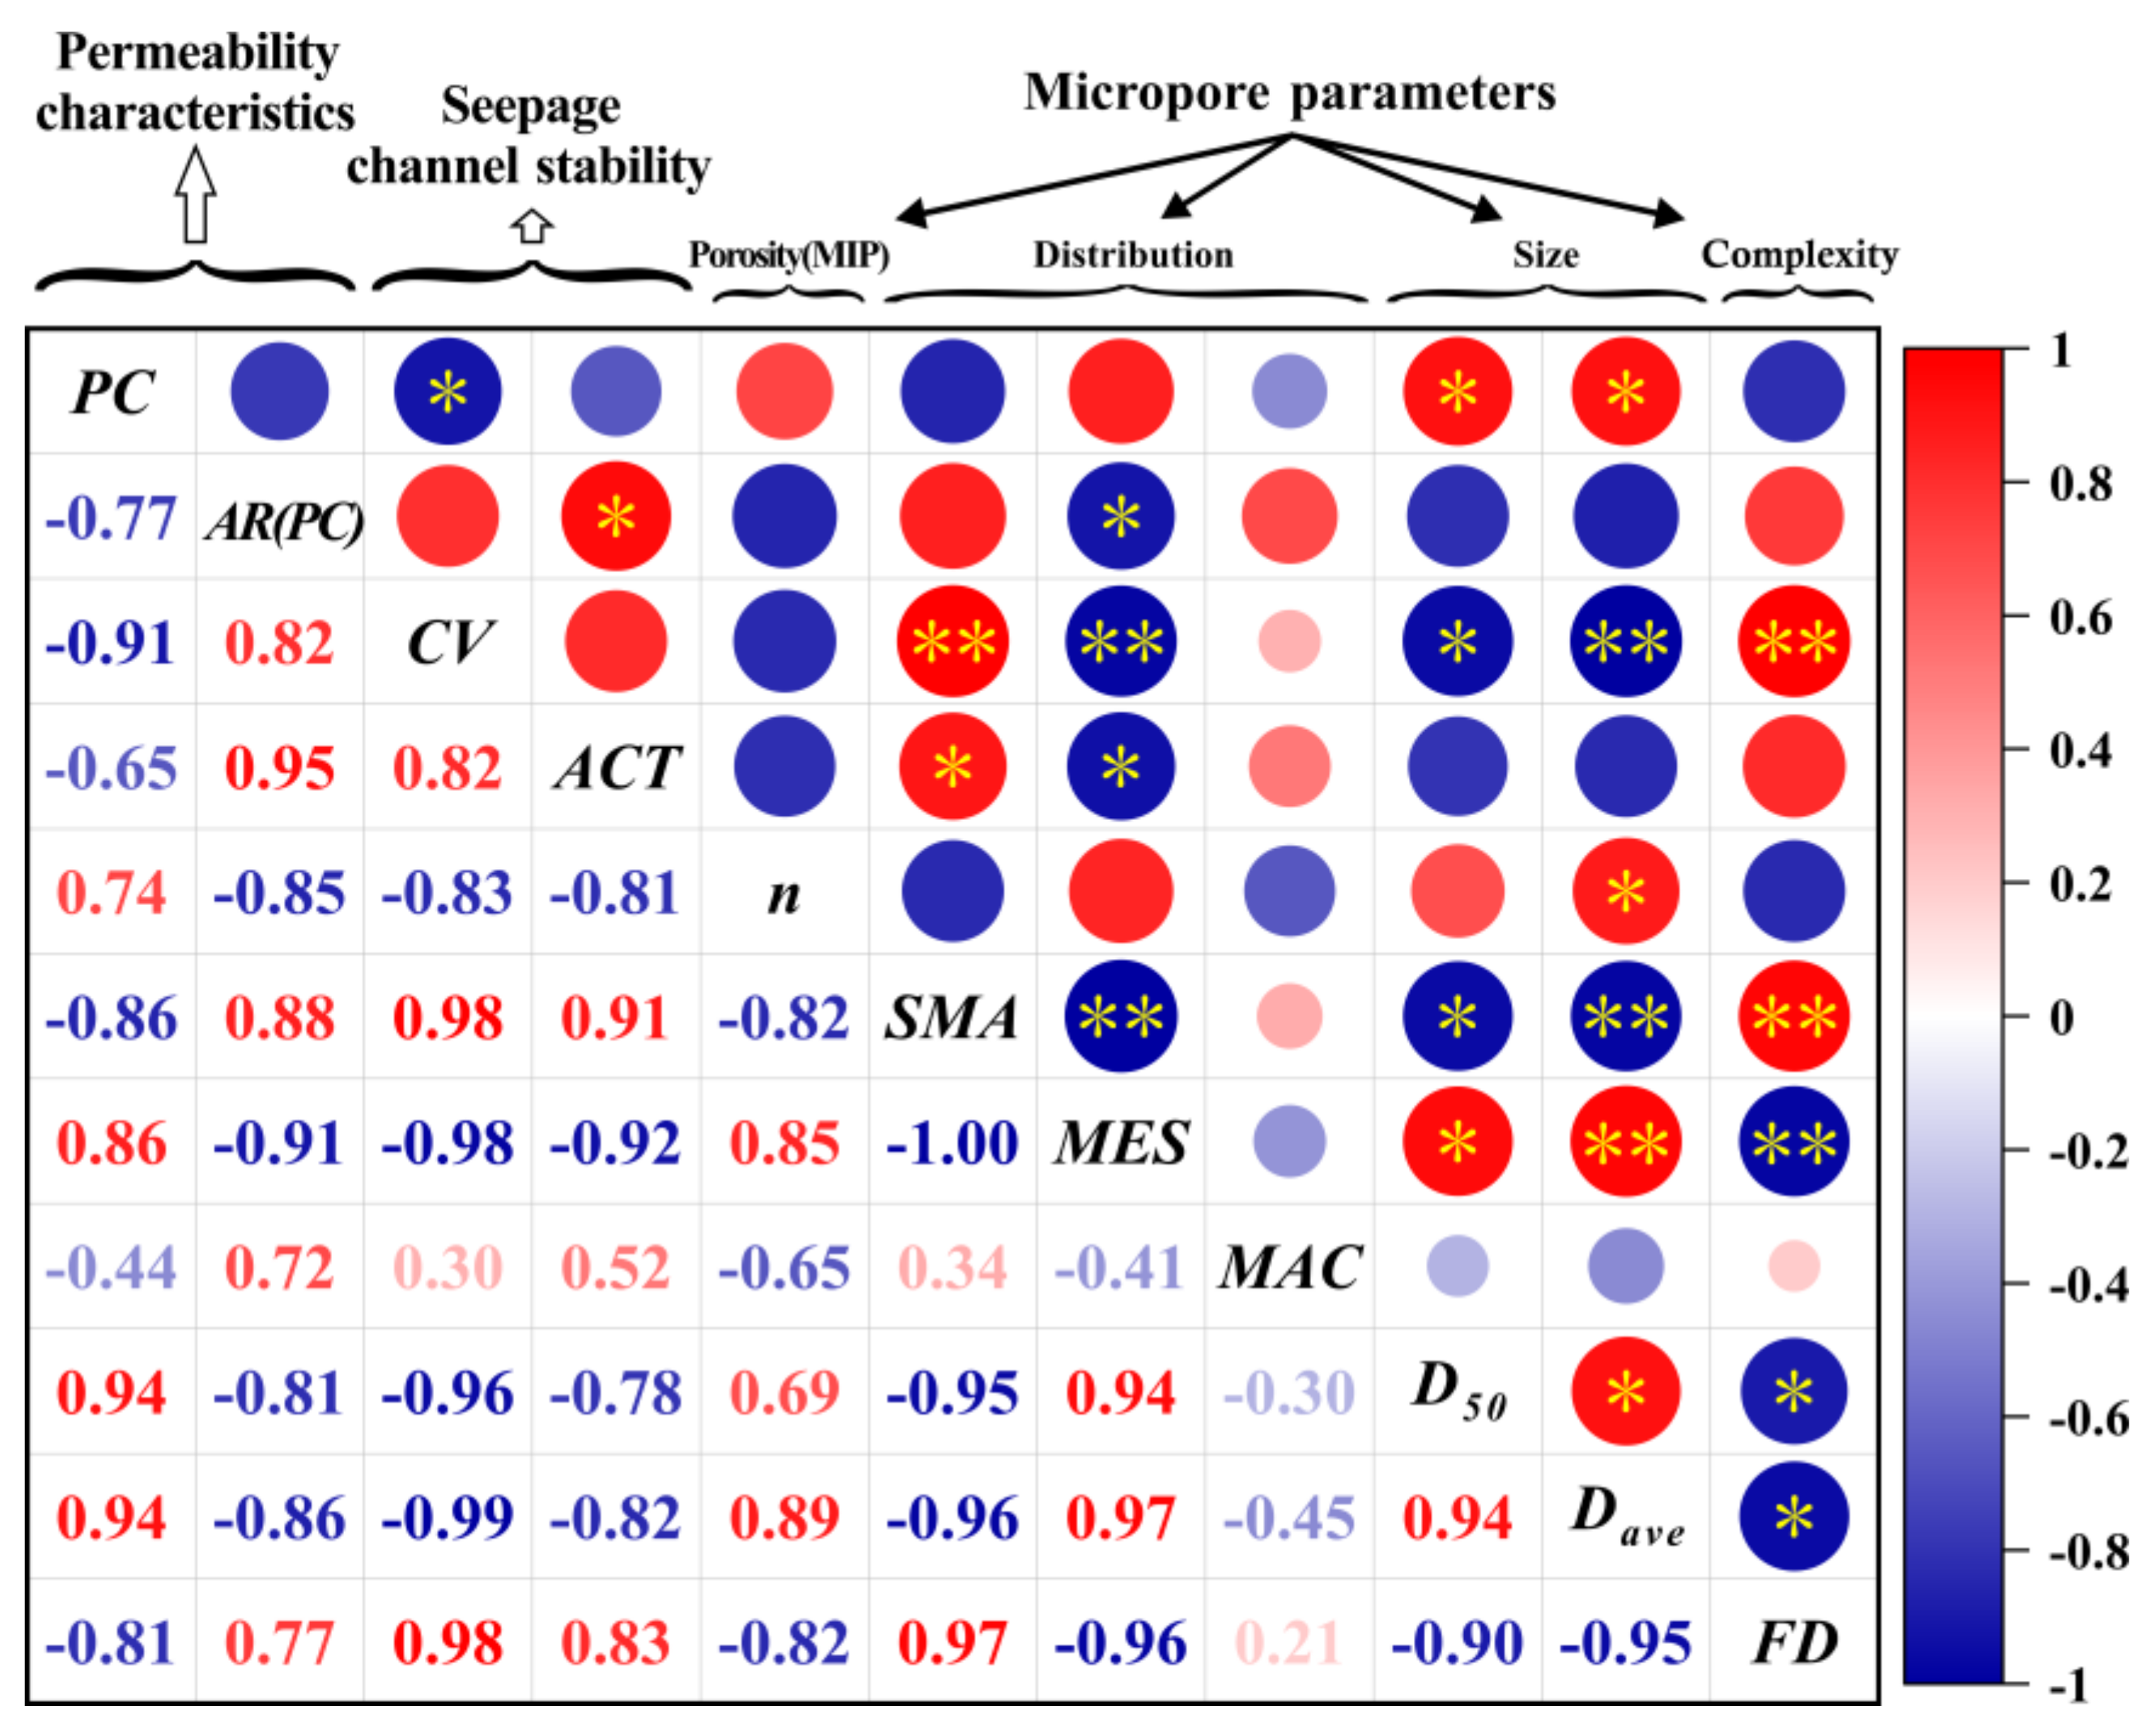
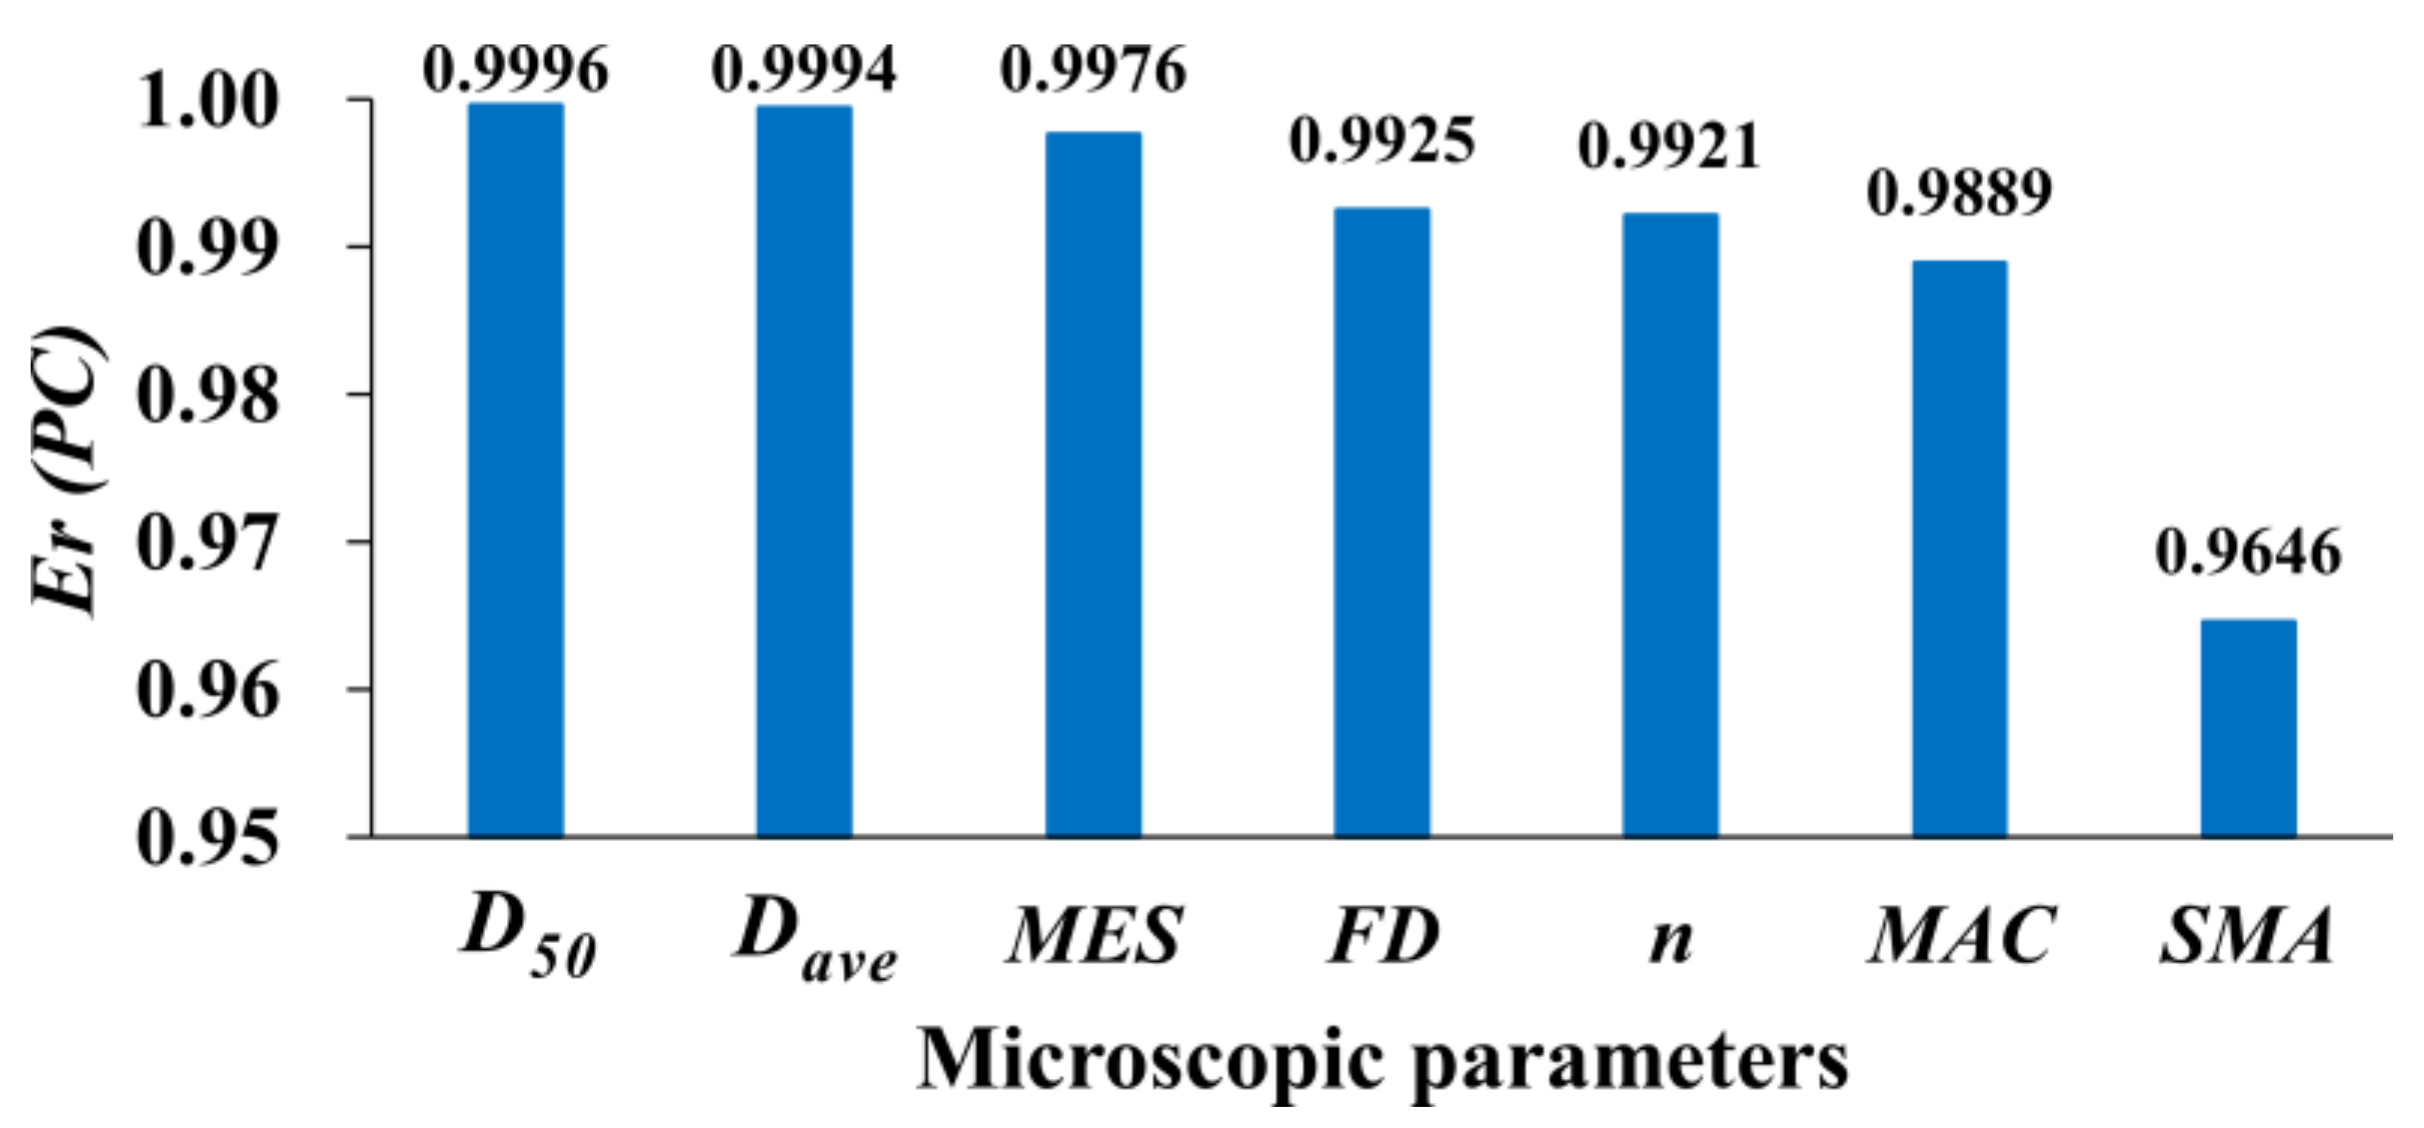
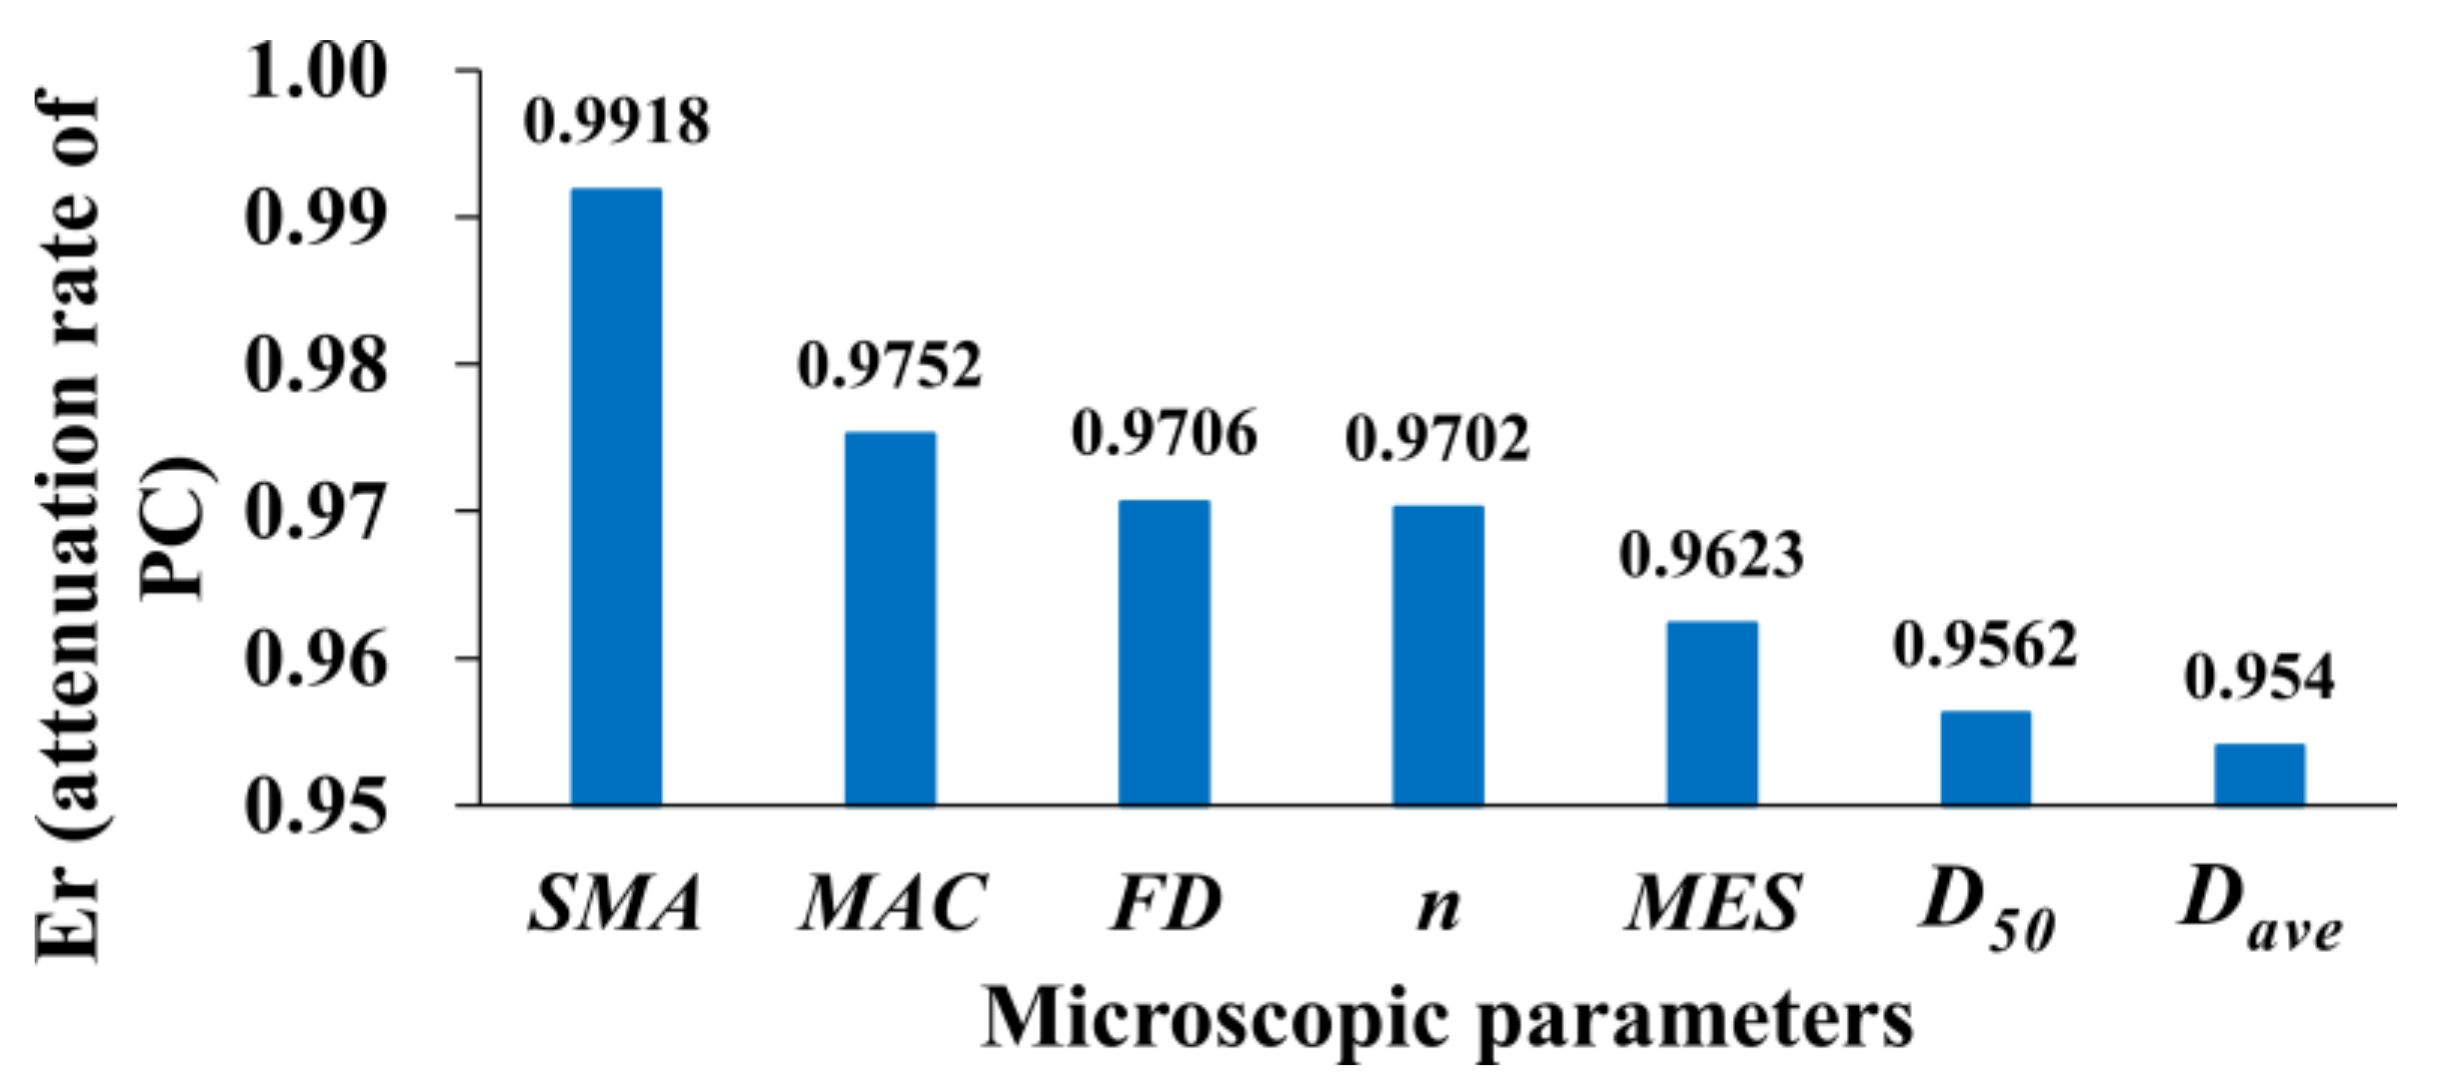
4.1. Correlation between Micropore Parameters and Stable Permeability Coefficient

According to Figure 15, the PC had a significant positive correlation with Dave and D50 (p < 0.05), indicating that the pore size is very important to the permeability. Furthermore, there was a highly significant positive correlation between the Dave and mesopore content (p < 0.01). Combined with Section 3.2, with the increase of reclamation time, the small pores in the USC gradually transformed into mesopores, and the content of mesopores increased, thus promoting the increase of the Dave as a whole. Meanwhile, as shown in Figure 14, small particles in offshore USC tended to be dispersed between large particles or cover the surface of large particles, while inland USC was mostly comprised of particle aggregates, which are difficult to fit closely in morphology. Therefore, it is easier to generate overhead pores, with larger pore diameters and stronger connectivity. In addition, the mesopores content and FD exhibited a highly significant negative correlation (p < 0.01). This was because the content of fine clay particles was higher, and the spatial distribution of small pores is more easily affected by the particle arrangement, so it has more randomness. When the content of mesopores increases, the particle arrangement can be simpler, and under the same seepage conditions the effective seepage area can increase [53]. Note that the correlation between the porosity (MIP) and PC was not significant, indicating that although porosity reflects the overall arrangement of soil particles, permeability is also controlled by factors such as pore distribution, structure, and complexity. To sum up, the increase in the mesopores content in the soil sample directly led to the increase of D50 and Dave, which had a positive effect on its permeability, while the FD had a negative effect on the permeability.
To further explore the contribution of the above microscopic pore parameters to the stable PC, the grey relation entropy was introduced. First, the average stable PC was used as a reference sequence. Various pore parameters, including porosity (MIP), small pores content, mesopores content, macropores content, Dave, D50, and FD were considered as the comparison sequences. Since Xi (k) is non-zero, the first element Xi (1) was used as a divisor for the dimensionless processing of each sequence.
Figure 16 shows the grey relation entropy of micropore parameters and the stable PC. It can be seen that the grey relation entropy ranges from 0.9646 to 0.9996, all exceeding 0.95, indicating a strong statistical significance. According to the entropy increase theory, the important order of grey relation entropy is obtained, namely D50Dave > MES > FD ≈ n > MAC > SMA. It can be seen that for the PC in the stable stage, the overall size of the pores (D50, Dave) had the greatest influence. Simultaneously, the influence of pore distribution (MES, n, SMA) and complexity (FD) cannot be ignored, and the grey relation entropy remained at a high level.

4.2. Analysis of Seepage Channel Stability and Pore Clogging

In this work, the PC showed obvious attenuation and cyclical variation, indicating that the seepage channels in the soil were not stable. Moreover, the PC of the offshore USC had a larger attenuation rate with time (Figure 7), and a more obvious cyclical variation (Figure 5).
To quantitatively describe the attenuation and the cyclicity of PC, the attenuation rate, average cycle time, and CV were selected as representative permeability characteristic parameters, and their relationships with each microscopic pore parameter were explored using grey relation entropy.
Figure 17 shows the contribution of different microscopic parameters to the attenuation rate of PCs. Compared with other micropore indicators, the small pores content had the greatest contribution to the attenuation rate of PC, and the grey relation entropy reached 0.9918. It is not difficult to understand that the increase of small pores content may inhibit the development of effective seepage paths. Meanwhile, the contribution of the FD to the attenuation rate of the PC was also very significant.
The “Waterhead-time” curves shown in Figure 18 also prove the above point well. The filtrate of S5 after seepage was slightly turbid, indicating that under the driving force of seepage, the fine particles in S5 with pore water as the carrier were relatively easily taken out. Furthermore, the Waterhead of S5 shows a rising–falling type (Figure 18b). The rise of Waterhead during water injection indicated that some migrating particles would be intercepted when passing through pores smaller than their particle size, and the seepage process would be inhibited; the subsequent drop of Waterhead indicated that the clogging effect was alleviated and the seepage channel was relatively smooth. It can be seen that the clogging effect may not always exist, and the migration of particles and the clogging of the seepage channel affect each other, and that this is a dynamic process. Sudden fluctuations in test values may be caused by soil particle migration or unstable aggregates lacking cementation under the influence of seepage, resulting in intermittent pore clogging or pore breakthrough [12]. In addition, the Waterhead of S1 declined almost linearly, and the decline rate was significantly greater than that of S5 (Figure 18a). This could show that the clogging effect in the seepage process of inland USC as not as obvious as that of offshore USC. Combined with Section 3.2, the inland USC contained more abundant mesopores, so the overall pore size inside the soil was larger, which provided the necessary channels for the migration of fine particles. Meanwhile, the pore morphology of the inland USC was simpler than that of offshore USC. In this case, small particles in inland USC moved relatively easily in the pores, indicating that the migration of particles is inseparable from the properties of soil pores themselves. The offshore USC was affected by the dredged load for a shorter time, and the porosity of uncompacted soil was higher (Table 1). With the advancement of the seepage process, the position of the soil particles was still constantly adjusted, the soil particles were more easily clogged during the migration process, and the continuous deposition of the clogged particles led to a more serious loss of macroscopic PC. Correspondingly, the shape and distribution of pores could have also changed accordingly. Nguyen [8] observed the microstructure evolution of soil in the process of seepage and found that the inhomogeneous migration of fine particles could lead to the inhomogeneous distribution of the pore ratio and intergranular porosity. Within this framework, a relatively stable seepage was more difficult to form in the offshore clays.
Both the CV and the average cycle time can be used to reflect the cyclic characteristics of the PC. Combined with Figure 15, Dave had a highly significant negative correlation with the CV (p < 0.01), and had the greatest impact on the CV (Figure 19a). This showed that the increase in the overall pore size could reduce the cyclic amplitude of the PC. When the pore size is large, the resistance of water flow in the pores is smaller, and the seepage channel is relatively stable. Additionally, the average cycle of PC was positively correlated with the FD (Figure 16), and the FD contributed most to the average cycle (Figure 19b). The CV and average cycle time of the offshore USC in each cycle time of seepage were higher than those of the inland USC, indicating that the PC of the offshore USC had a stronger cyclicity with time. Hence, seepage caused particles to migrate and be deposited in the pore channels. On the one hand, the migrating particles clogged the pores, causing the soil structure to deteriorate along the seepage direction, resulting in the PC decreasing with time; on the other hand, when clogging occurred, the pore water pressure in the soil could increase. When the pore water pressure increased by a certain amount, the partial pores could not withstand the excess pore water pressure, their edges could gradually be eroded and destroyed, the seepage channel could be opened, the PC would begin to increase again, the seepage process could be promoted again, and particle migration could also start again. This process is cyclic, and the seepage channel cannot maintain stable seepage but will continue to switch between opening and clogging. Therefore, the cyclically changing PC is an external manifestation of unstable seepage channels, and pore expansion and particle migration are interactive processes for controlling the seepage of porous media [54,55,56]. Within this framework, the overall size of offshore clay pores was smaller and the pore morphology was more complex, which weakened the driving effect of hydrodynamic forces on fine particles attached to particle surfaces or pore walls, making it easier for migrating fine particles to be intercepted when encountering fine pores and, thus, exhibit a stronger cyclicity (Table 2).

4.3. Microscopic Verification and Mechanism Analysis of Clogging Effect

To verify the effect of particle migration on the seepage channel during the seepage process, we observed the microstructure images of the bottom and top of the ring cutter sample used in the permeability test, represented by inland sample S1 and offshore sample S5, as shown in Figure 20. For the bottom of the ring cutter, the soil after seepage had a relatively rich pore space. On the contrary, both for S1 and S5, there was obvious small particle deposition between the pores of the soil sample at the top of the ring cutter after seepage. It could be seen that this was different from the relatively uniform particle arrangement characteristics before seepage. Seepage leads to obvious migration of soil particles along the movement direction, thereby changing the original structure of the soil and causing different degrees of clogging in the pores. Zhang [57] and Xu et al. [17] also derived similar conclusions: the particles move upward along the seepage direction, changing the original structure of the soil and forming a dense upper and loose lower structure.
Furthermore, Figure 21 shows SEM images of S1–S5 before and after seepage. Red, cyan, green, blue, and yellow areas represent micropores, small pores, mesopores, macropores, and ultra-large pores, respectively. Consistent with the MIP test, pores with a pore size of less than 0.4 μm were uniformly classified as small pores, pores ranging from 0.4 to 4 μm were mesopores, and pores larger than 4 μm were macropores. The white areas represent soil particles. SEM images of soil samples before seepage are shown in Figure 21a–e. On the whole, the pores were mainly mesopores, followed by small pores. For inland clays, especially S1 and S2, structural units with stronger agglomeration formed a foundation for the formation of mesopores and macropores. In contrast, offshore clays, despite their higher porosity, had more concentrated small pores, a relatively low proportion of mesopores and macropores, and lower drainage efficiency than inland clays.
Figure 21f–j shows microscopic images after S1–S5 seepage. It can be seen that the distribution area of small pores increased widely, while the distribution area of mesopores decreased significantly, and the seepage process hardly involved the compaction of soil particles. Furthermore, seepage could also take away certain soil particles, so the change of pore distribution characteristics came from the retention of migrating particles by pores. Clogging in porous media is not a random process, in particular, the changes in pore structure and pore distribution caused by clogging hinder the flow conditions of pore water, which further promotes clogging [47].
Furthermore, Figure 22 quantifies the change in the proportion of pores of different grades before and after seepage. After seepage, the proportion of small pores areas in S1–S5 increased by 24.81%, 44.07%, 31.21%, 36.38%, and 36.58% respectively, and the proportion of mesopores proportion decreased by 17.92%, 38.07%, 30.72%, 36.29%, and 36.58% respectively. During the seepage process, clay migrates with the pore water, and there are two relatively typical situations when clogging occurs: on the one hand, the clay could partially cover the pores of the same size or smaller; on the other hand, single or multiple clay particles could fill pores of a relatively large size. Since the shape of the soil particles and the pores do not fit perfectly, both of the above cases can create other smaller pores around the clogged pores, with the common result of changing the pore size distribution, that is, to make mesopores transform into small pores (Figure 21). Moreover, the growth rate of small pores and the attenuation rate of mesopores were smaller for inland clays than offshore clays. Combined with the above, the content of mesopores in inland clay was more abundant and the pore morphology was simpler. Consequently, the change of pore structure during the seepage process was relatively limited, the PC in the stable stage was higher, and it had a strong anti-clogging ability, the seepage channel is more stable, and the cyclic change of the PC was less obvious (Figure 4). It can be seen that, since the clogging effect is common in the process of clay seepage, it is controlled by the pore characteristics of soil differences. Even in the same soil layer, the ability of particle migration and the degree of pore-clogging are not the same. Hence, the combined effect of particle arrangement and pore distribution at the microscopic scale will inevitably affect the efficiency of macroscopic permeation.

5. Conclusions

In this work, the differential permeability evolution and corresponding microscopic mechanism of USC in Chongming East Shoal (CES) were analyzed. Based on the evolution of the PC, the cyclic characteristics of permeability and pore-clogging during seepage were revealed, and the stability of the seepage channel was further quantitatively evaluated. The main findings are as follows:
(1)
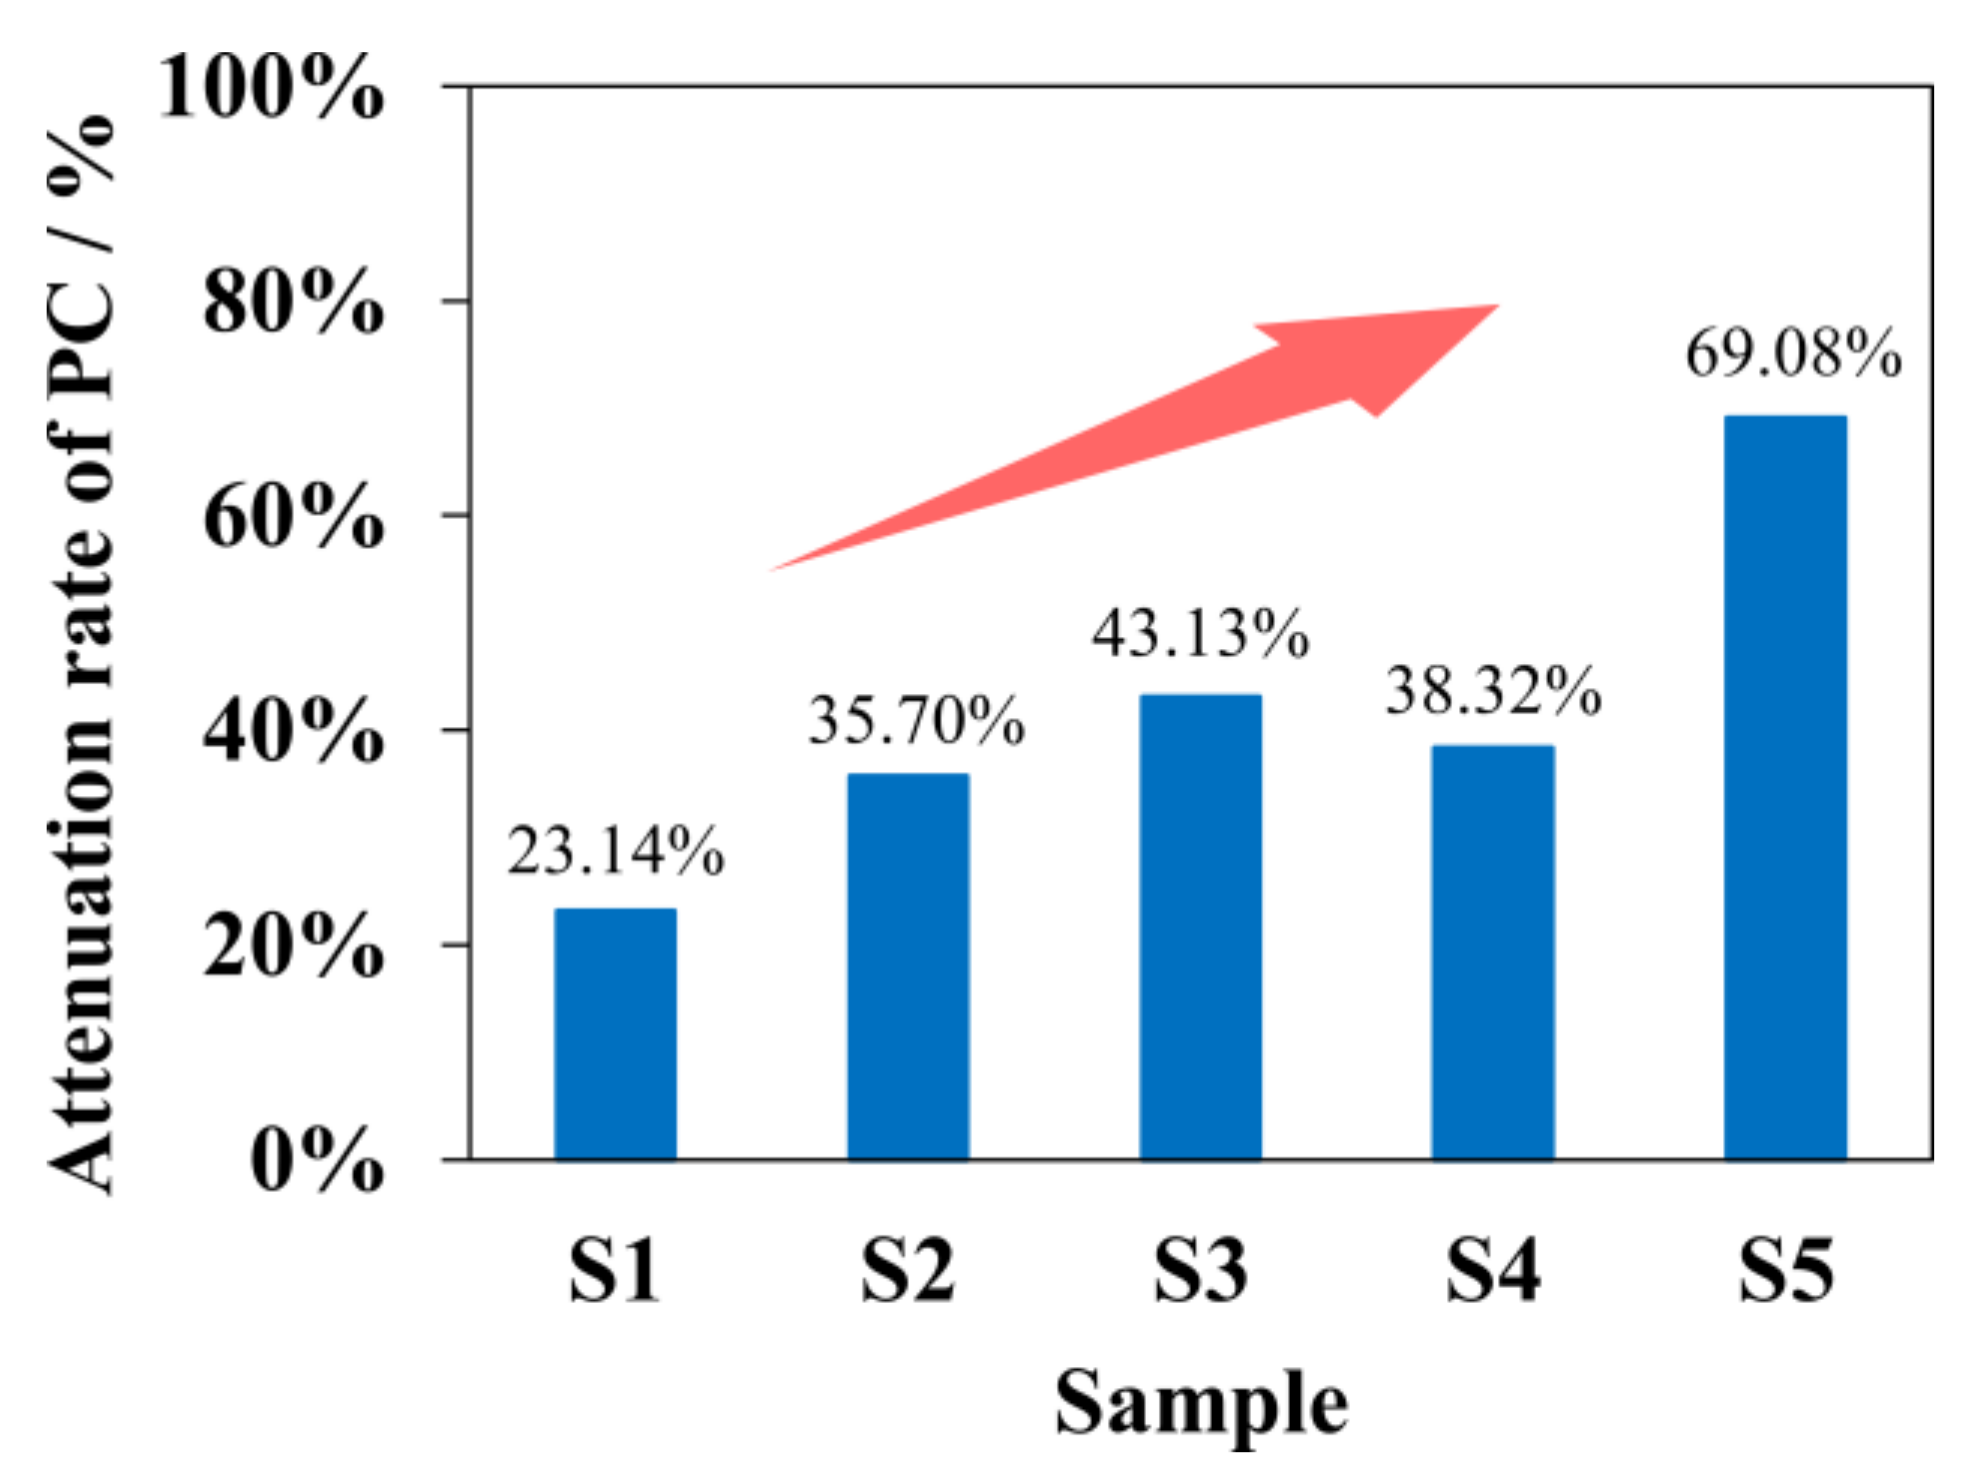
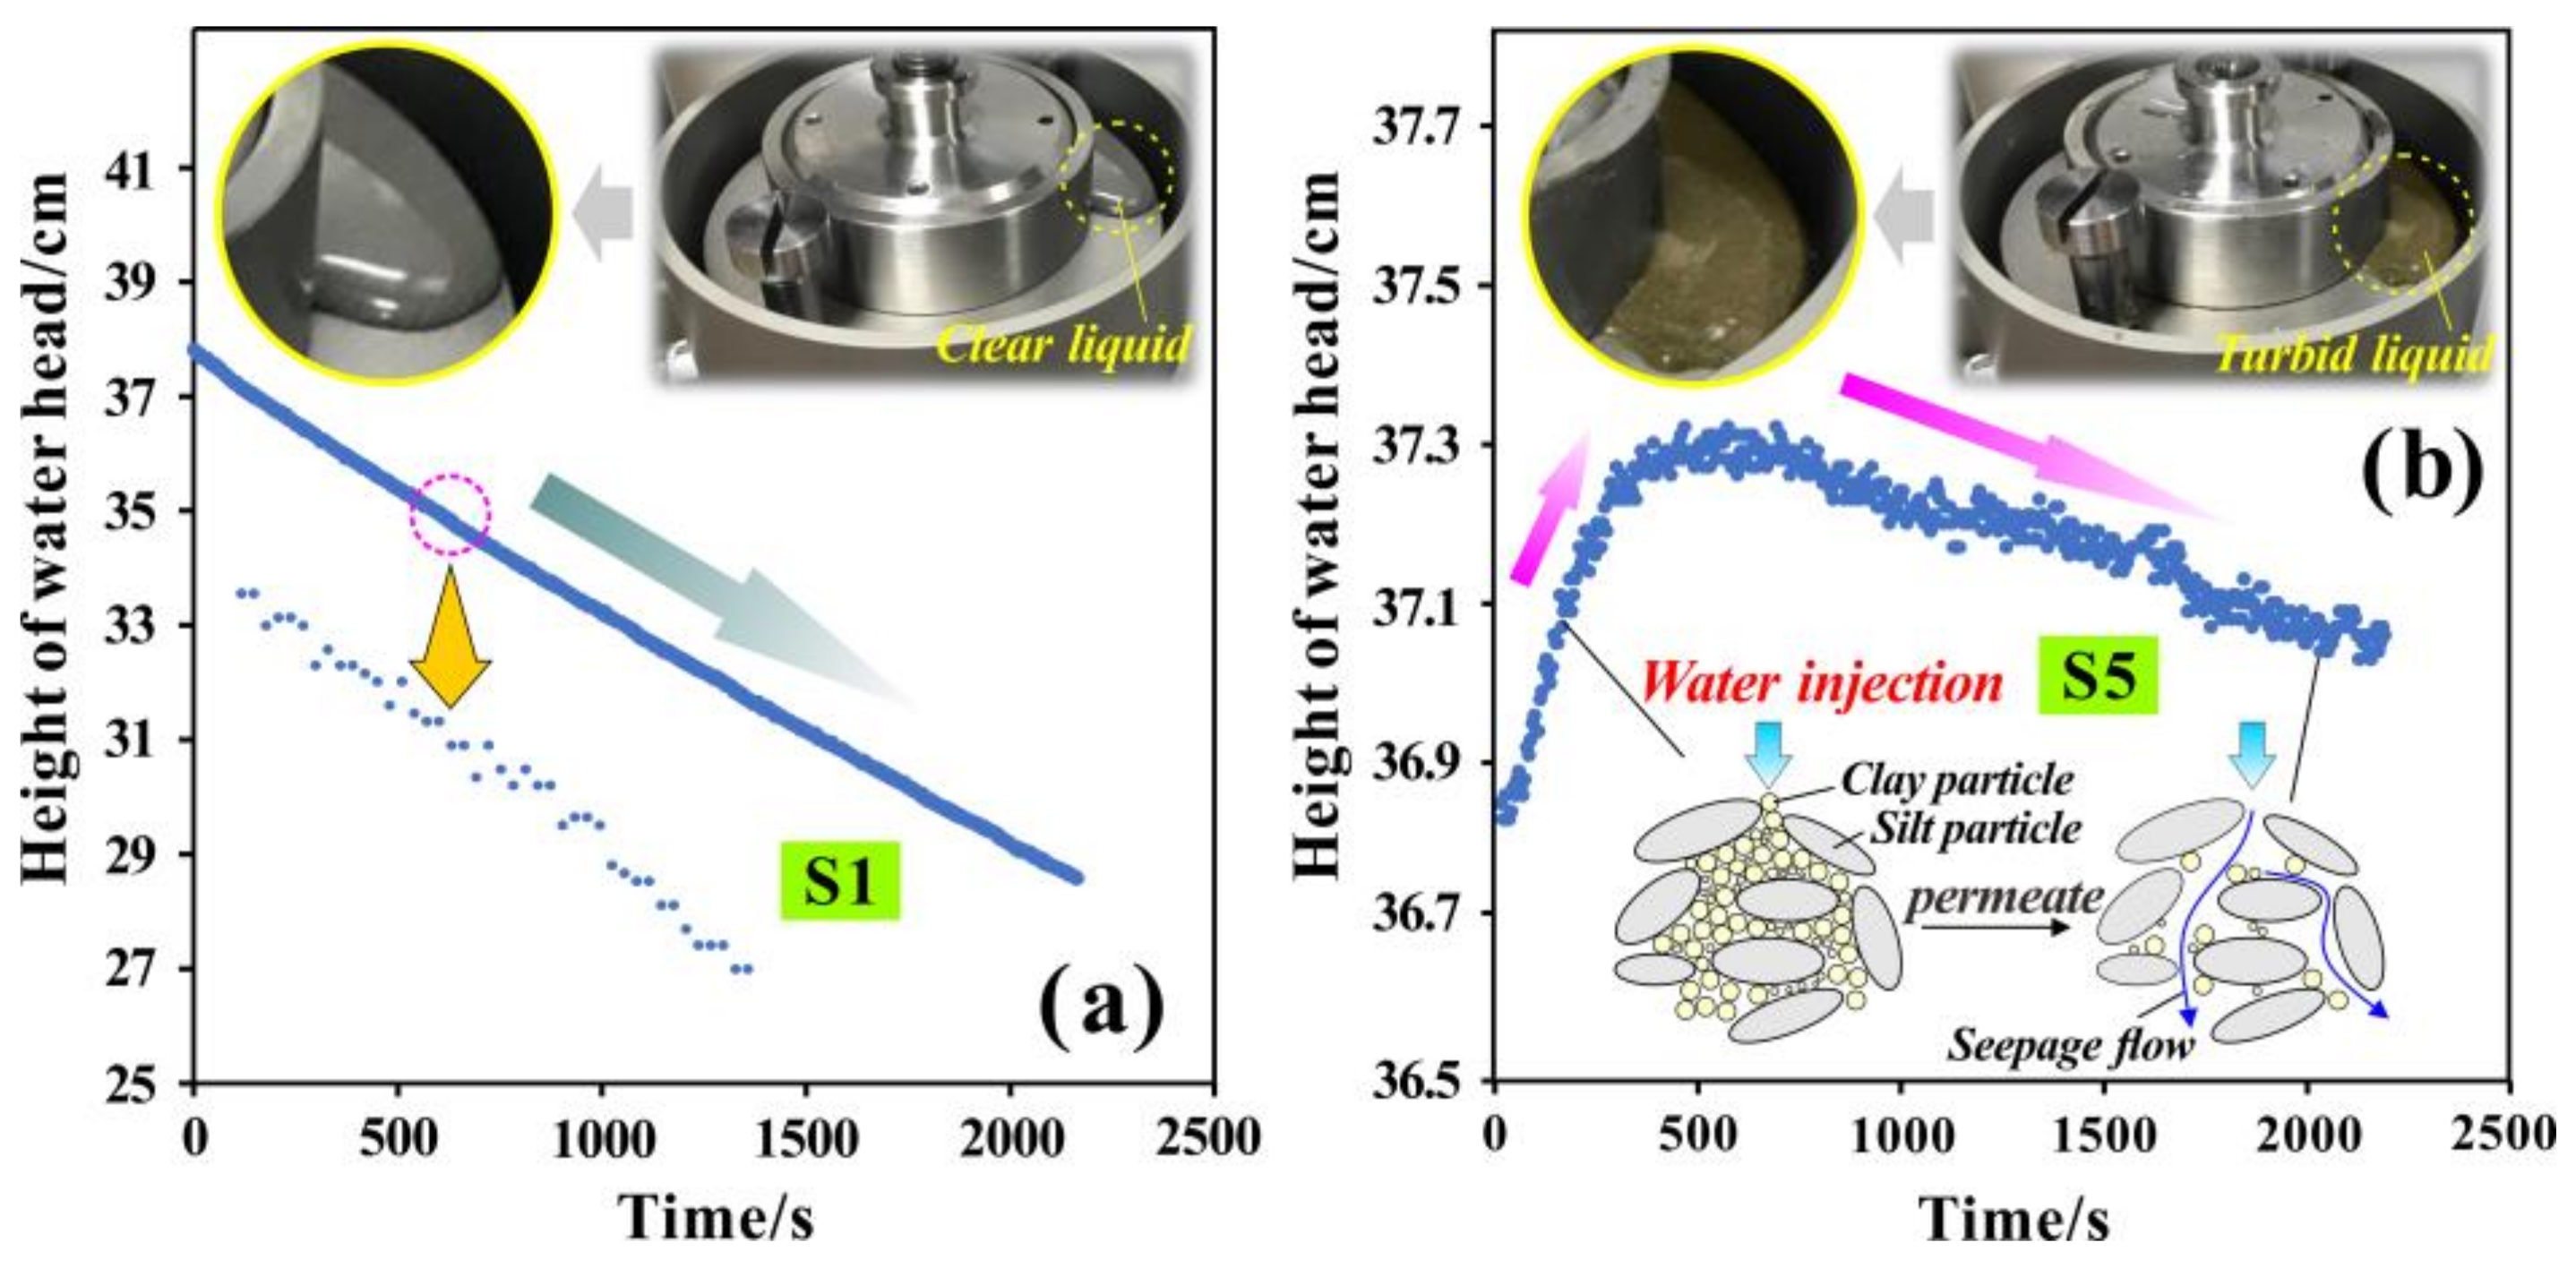
During clay seepage, the PC was not constant, but gradually decayed and tended to become stable with time, which indicated the transition from the unstable seepage stage to the relatively stable seepage stage. Compared with inland clay, the PC of offshore clay not only deteriorated more seriously with time but also took longer to reach a relatively stable seepage state, indicating the unstable seepage channel.
(2)
The attenuation of PC with time was not monotonic but cyclic, resulting from the alternating action of closing and opening seepage channels. During seepage, the clay particles may have migrated with the water flow and changed the original pore structure; these clay particles could be intercepted by pores, thereby clogging the seepage channels. With the advancement of seepage, some weakly-connected particles, derived from the increased pore water pressure caused by the clogging effect, could migrate again. Then, the pores could be gradually expanded and new seepage channels could be generated. If repeated, the unstable seepage channel could lead to the cyclic dynamic change of the PC.
(3)
The PC of the USC in the early reclamation area in the stable stage was abnormally higher than that of the USC in the late reclamation area. Although the overall porosity of the early reclamation area USC was lower, its higher mesopores content, lower FD, and skeleton aggregation structure promoted the water flow effectively. It could be seen that, although the USC in the late-reclamation area suffered from the dredged load for a shorter time, it did not necessarily present high permeability and consolidation efficiency. The effects of pore structure, distribution, and complexity on permeability cannot be ignored, which is characterized by long-term and gradual change.
(4)
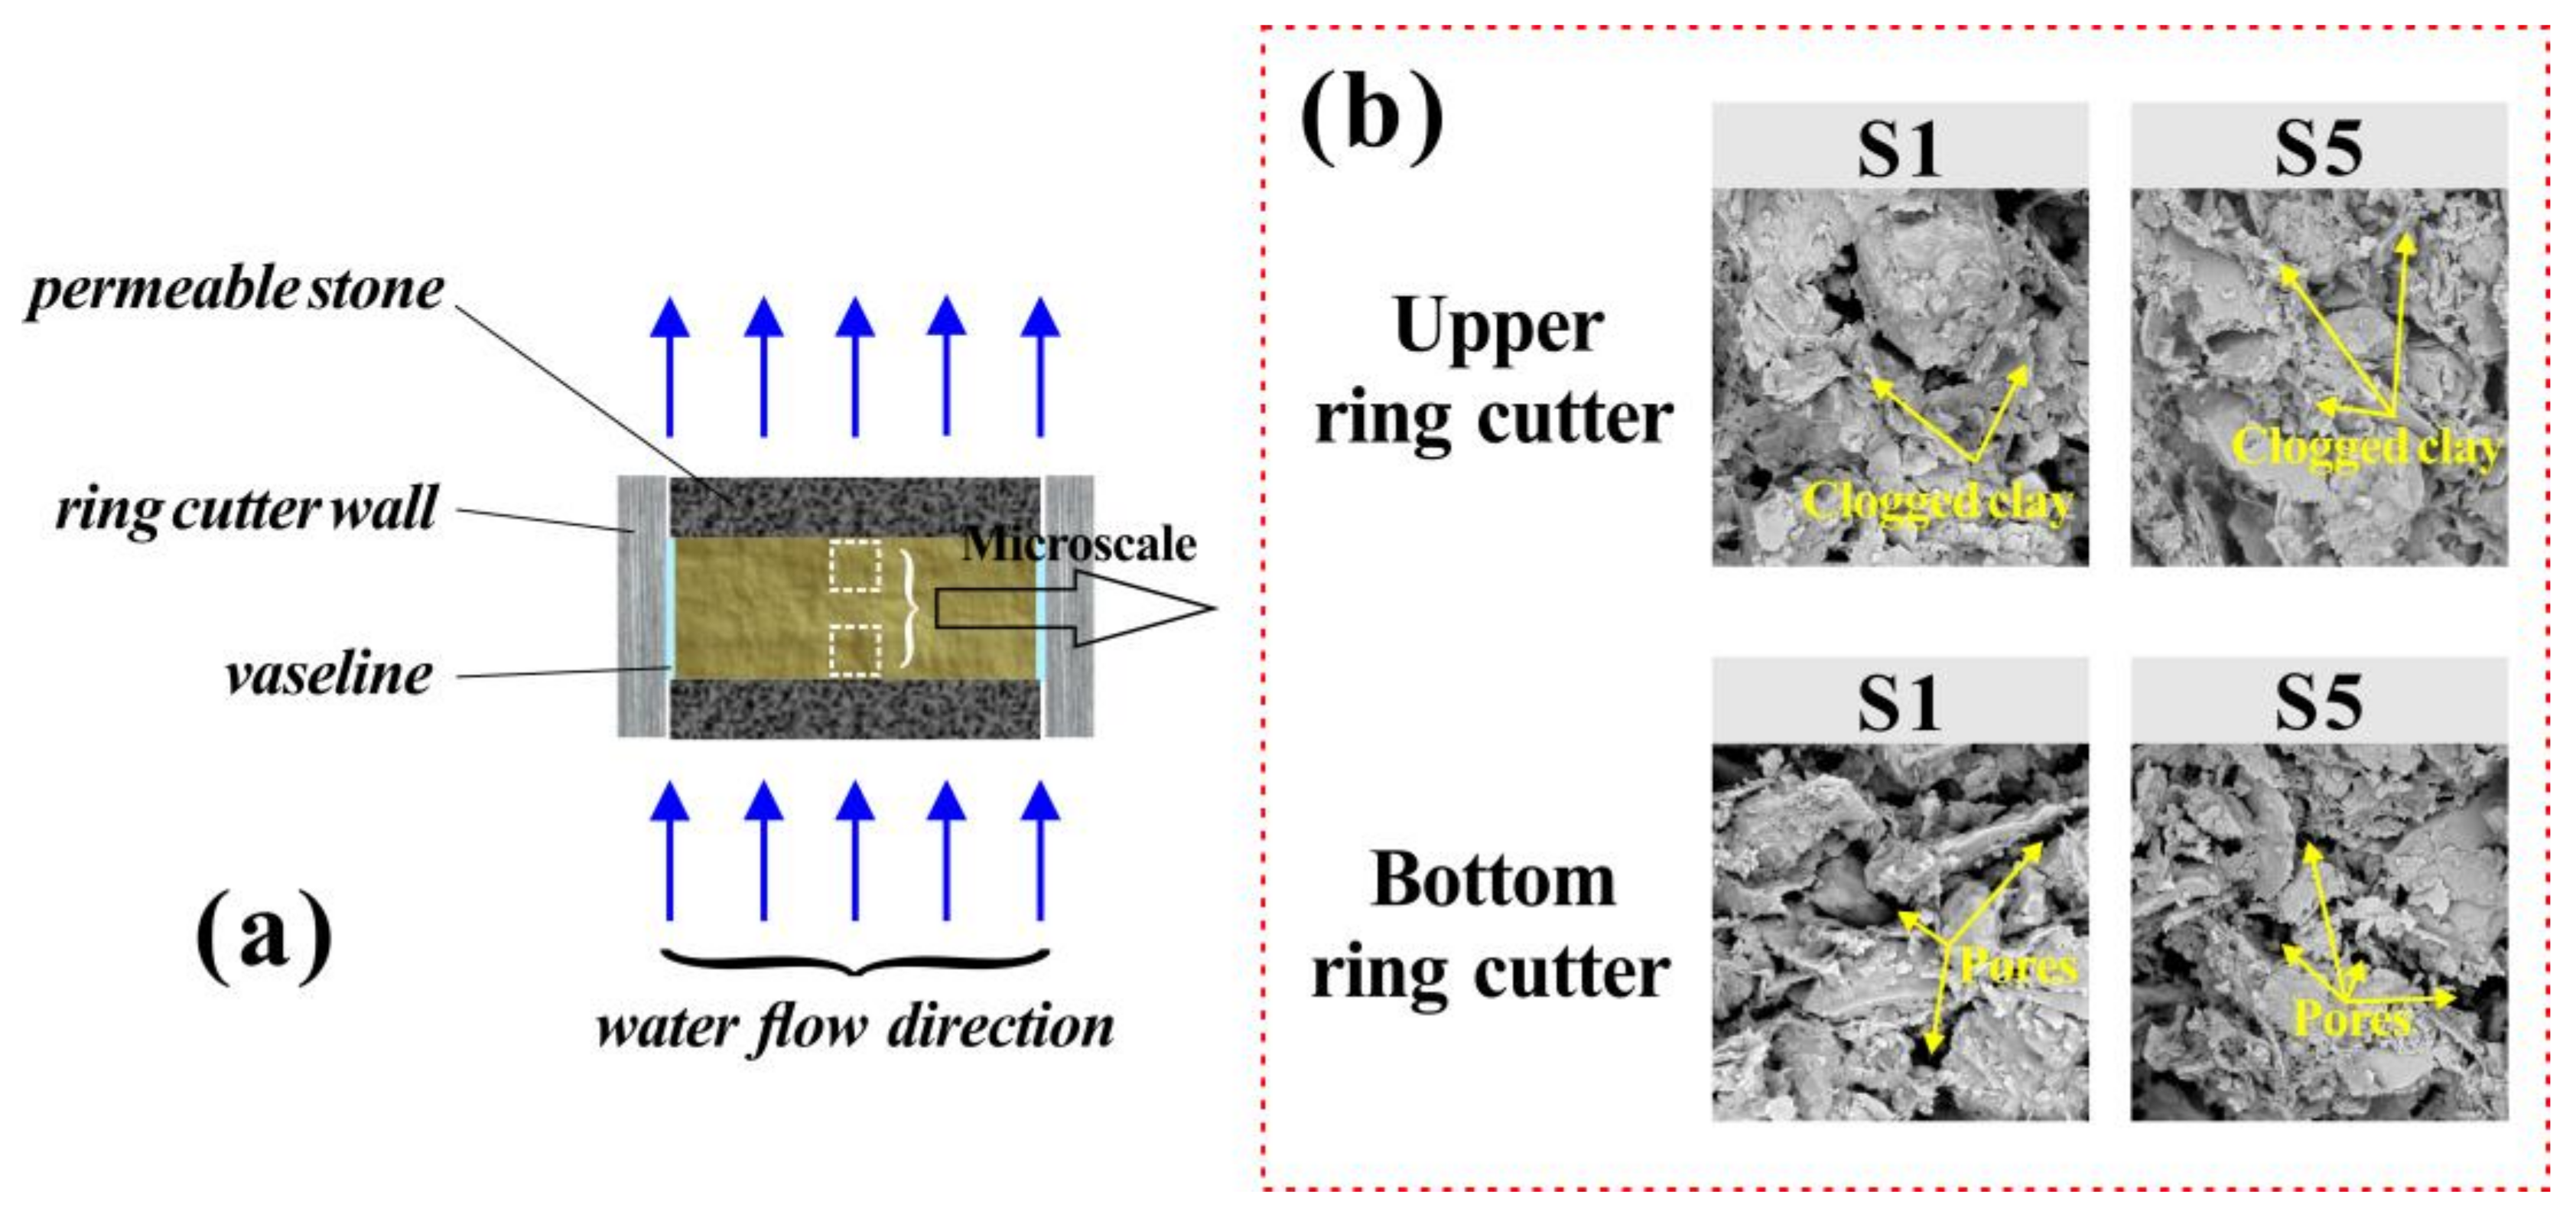
Even though particle migration is common in the clay seepage process, the USC in the early reclamation area had a stronger anti-clogging ability controlled by the different pore characteristics. When soil particles are intercepted by the pores, they may cover part of the pores or fill in the pores, both of which results in changing the pore distribution, so that the mesopores will be converted to small pores. Compared with offshore clay, this pore conversion rate was lower in inland clay, and the pore channels were relatively stable, allowing for more effective seepage.

Author Contributions

Conceptualization, M.Y. and Q.Y.; validation, J.D. and W.X.; formal analysis, Q.Y. and Y.H.; investigation, H.L.; writing—original draft preparation, M.Y.; writing—review and editing, Q.W.; project administration, Q.W. and X.H.; funding acquisition, Q.W., J.W. and X.H. All authors have read and agreed to the published version of the manuscript.

Funding

The research was supported by the Key Laboratory of Land Subsidence Monitoring and Prevention, Ministry of Natural Resources (Grant No. 2021(D)-004(F)-01); the Key Program of International (Regional) Cooperation and Exchange of National Natural Science Foundation (Grant No. 41820104001); and the UNESCO-IUGS project (Grant No. IGCP 663).

Institutional Review Board Statement

Not applicable.

Informed Consent Statement

Informed consent was obtained from all subjects involved in the study.

Data Availability Statement

All data created are provided in this study.

Acknowledgments

The authors would like to express their sincere thanks to the editor and anonymous reviewers for their professional comments and suggestions regarding this manuscript.

Conflicts of Interest

The authors declare no conflict of interest.

Nomenclature

USCunderlying soft clay
CESChongming East Shoal
MIPmercury intrusion porosimetry
SEMscanning electron microscope
PCpermeability coefficient
Daveaverage pore diameter
D50medium entrance pore diameter
FDfractal dimension
CVcoefficient of variation
AR(PC)attenuation rate of permeability coefficient
ACTaverage cycle time
SMAsmall pores content
MESmesopores content
MACmacropores content

References

  1. Breber, P.; Povilanskas, R.; Armaitienė, A. Recent evolution of fishery and land reclamation in Curonian and Lesina lagoons. Hydrobiologia 2008, 611, 105. [Google Scholar] [CrossRef]
  2. Mcleod, E.; Poulter, B.; Hinkel, J.; Reyes, E.; Salm, R. Sea-level rise impact models and environmental conservation: A review of models and their applications. Ocean Coast. Manag. 2010, 53, 507–517. [Google Scholar] [CrossRef]
  3. Wang, W.; Liu, H.; Li, Y.Q.; Su, J.L. Development and management of land reclamation in China. Ocean Coast. Manag. 2014, 102, 415–425. [Google Scholar] [CrossRef]
  4. Yu, Q.B.; Yan, X.X.; Wang, Q.; Yang, T.L.; Kong, Y.Y.; Huang, X.L.; Mehmood, Q. X-ray computed tomography-based evaluation of the physical properties and compressibility of soil in a reclamation area. Geoderma 2020, 375, 114524. [Google Scholar] [CrossRef]
  5. Yuan, X.Q.; Wang, Q.; Lu, W.X.; Zhang, W.; Chen, H.E.; Zhang, Y. Indoor simulation test of step vacuum preloading for high-clay content dredger fill. Mar. Geores. Geotechnol 2018, 36, 83–90. [Google Scholar] [CrossRef]
  6. Yu, Q.B.; Wang, Q.; Yan, X.X.; Yang, T.L.; Song, S.Y.; Yao, M.; Zhou, K.; Huang, X.L. Ground Deformation of the Chongming East Shoal Reclamation Area in Shanghai Based on SBAS-InSAR and Laboratory Tests. Remote Sens. 2020, 12, 1016. [Google Scholar] [CrossRef] [Green Version]
  7. Hu, H.J.; Jiang, M.J.; Peng, J.B.; Shen, Z.F. Pore fractal features of different kinds of loesses before and after stress path tests. Rock Soil Mech. 2014, 35, 2479–2485. [Google Scholar]
  8. Nguyen, B.P.; Kim, Y.T. An analytical solution for consolidation of PVD-installed deposit considering nonlinear distribution of hydraulic conductivity and compressibility. Eng. Comput. 2019, 36, 707–730. [Google Scholar] [CrossRef]
  9. Geng, X.Y.; Yu, H.S. A large-strain radial consolidation theory for soft clays improved by vertical drains. Geotechnique 2017, 67, 1020–1028. [Google Scholar] [CrossRef]
  10. Lee, D.; Anm, Y.; Kwak, T.; Lee, T.; Choi, H. Nonlinear finite-strain self-weight consolidation of dredged material with radial drainage using Carrillo’s formula. J. Waterw. Port Coast. Ocean Eng. 2016, 142, 06016002. [Google Scholar] [CrossRef]
  11. Romero, E. A microstructural insight into compacted clayey soils and their hydraulic properties. Eng. Geol. 2013, 165, 3–19. [Google Scholar] [CrossRef]
  12. Han, Y.; Wang, Q.; Xia, W.T.; Liu, J.; Wang, J.Q.; Chen, Y.T.; Shen, J.J. Experimental study on the hydraulic conductivity of un-saturated dispersive soil with different salinities subjected to freeze-thaw. J. Hydrol. 2020, 583, 124297. [Google Scholar] [CrossRef]
  13. Zhang, X.D.; Wu, Y.J.; Zhai, E.C.; Ye, P. Coupling analysis of the heat-water dynamics and frozen depth in a seasonally frozen zone. J. Hydrol. 2021, 593, 125603. [Google Scholar] [CrossRef]
  14. Kong, L.W.; Li, X.M.; Tian, H.N. Effect of fines content on permeability coefficient of sand and its correlation with state pa-rameters. Rock Soil Mech. 2011, 32, 21–26. [Google Scholar]
  15. Zhang, M.X.; Zhu, X.W.; Yu, G.L.; Yan, J.M.; Wang, X.B.; Chen, M.L.; Wang, W.M. Permeability of muddy clay and settlement simulation. Ocean Eng. 2015, 104, 521–529. [Google Scholar] [CrossRef]
  16. Levy, G.J.; Eisenberg, H.; Shainberg, I. Clay dispersion as related to soil properties and water permea-bility. Soil Sci. 1993, 155, 15–22. [Google Scholar] [CrossRef]
  17. Xu, P.P.; Zhang, Q.Y.; Qian, H.; Qu, W.G.; Li, M.N. Microstructure and permeability evolution of remolded loess with different dry densities under saturated seepage. Eng. Geol. 2021, 282, 105875. [Google Scholar] [CrossRef]
  18. Chapuis, R.P. Predicting the saturated hydraulic conductivity of soils: A review. Bull. Eng. Geol. Environ. 2012, 71, 401–434. [Google Scholar] [CrossRef]
  19. Zhang, X.D.; Zhai, E.C.; Wu, Y.J.; Sun, D.A.; Lu, Y.T. Theoretical and Numerical Analyses on Hydro–Thermal–Salt–Mechanical Interaction of Unsaturated Salinized Soil Subjected to Typical Unidirectional Freezing Process. Int. J. Geomech. 2021, 21, 04021104. [Google Scholar] [CrossRef]
  20. Liu, L.; Li, Z.W.; Xiao, H.B.; Wang, B.; Nie, X.D.; Liu, C.; Ni, L.S.; Wang, D.Y. The transport of aggregates associated with soil organic carbon under the rain-induced overland flow on the Chinese Loess Plateau. Earth Surf. Process. Landf. 2019, 44, 1895–1909. [Google Scholar] [CrossRef]
  21. Shan, X.Z.; Wei, Y.Q.; Yan, H.J.; Liu, J.F.; Zhang, Y. Influence of organic matter content on soil hydrodynamic parameters. Acta Pedol. Sin. 1998, 3, 1–9. [Google Scholar]
  22. Dong, Z.L.; Chen, P.S.; Mo, H.H.; Zhang, G.X. Effects of permeability coefficients on consolidation of soft clay under by vacuum preloading. Rock Soil Mech. 2010, 31, 1452–1456. [Google Scholar]
  23. Tang, Y.Q.; Yan, J.J. Effect of freeze–thaw on hydraulic conductivity and microstructure of soft soil in Shanghai area. Environ. Earth Sci. 2015, 73, 7679–7690. [Google Scholar] [CrossRef]
  24. Ren, X.W.; Santamarina, J.C. The hydraulic conductivity of sediments: A pore size perspective. Eng. Geol. 2018, 233, 48–54. [Google Scholar] [CrossRef] [Green Version]
  25. Chen, J.; Fang, Y.; Gu, R.; Shu, H.; Ba, L.; Li, W. Study on pore size effect of low permeability clay seepage. Arab. J. Geosci. 2019, 12, 238. [Google Scholar] [CrossRef]
  26. Zhou, J.; Luo, L.H.; Yu, L.G.; Nangulama, H. Experimental study about the influence of cyclic load on the hydraulic conduc-tivity of clay. Acta Geotech. 2020, 15, 3357–3370. [Google Scholar] [CrossRef]
  27. Wang, H.L.; Sun, H.; Huang, Z.X.; Ge, X.R. A microstructural investigation on hydraulic conductivity of soft clay. Bull. Eng. Geol. Environ. 2021, 80, 4067–4078. [Google Scholar] [CrossRef]
  28. Zhao, J.L.; Sun, M.D.; Pan, Z.J.; Liu, B.; Ostadhassan, M.; Hu, Q.H. Effects of pore connectivity and water saturation on matrix permeability of deep gas shale. Adv. Geo-Energy Res. 2022, 6, 54–68. [Google Scholar] [CrossRef]
  29. Lu, H.J.; Wang, C.F.; Li, D.G.; Li, J.X.; Wan, Y. Permeability, Pore, and Structural Parameters of Undisturbed Silty Clay Presented in Landfill Leachate. Water Air Soil Pollut. 2020, 231, 190. [Google Scholar] [CrossRef]
  30. Zha, F.S.; Liu, C.M.; Kang, B.; Yang, X.H.; Zhou, Y.; Yang, C.B. Acid rain leaching behavior of Zn-contaminated soils solidi-fied/stabilized using cement–soda residue. Chemosphere 2021, 281, 130916. [Google Scholar] [CrossRef]
  31. Bedrikovetsky, P.; Siqueira, F.D.; Furtado, C.A.; Souza, A.L.S. Modified Particle Detachment Model for Colloidal Transport in Porous Media. Transp. Transp. Porous Media 2011, 86, 353–383. [Google Scholar] [CrossRef]
  32. Touch, N.; Hibino, T.; Nakashita, S. Permeability Reduction by Sediment Retention in Saturated Sand Columns. Transp. Transp. Porous Media 2013, 98, 615–630. [Google Scholar] [CrossRef]
  33. Khilar, K.C.; Fogler, H.S. Migration of Fines in Porous Media; Kluwer Academic Publishers: Amsterdam, The Netherlands, 1998. [Google Scholar]
  34. Civan, F. Non-isothermal Permeability Impairment by Fines Migration and Deposition in Porous Media including Dispersive Transport. Transp. Porous Media 2010, 85, 233–258. [Google Scholar] [CrossRef]
  35. Horikoshi, K.; Takahashi, A. Suffusion-induced change in spatial distribution of fine fractions in embankment subjected to seepage flow. Soils Found. 2015, 55, 1293–1304. [Google Scholar] [CrossRef] [Green Version]
  36. Chang, F.F.; Civan, F. Predictability of Formation Damage by Modeling Chemical and Mechanical Processes. In Proceedings of the SPE Formation Damage Control Symposium, Lafayette, LA, USA, 26–27 February 1992. [Google Scholar] [CrossRef]
  37. Zhou, J.; Qiu, L.X.; Lin, G.Q.; Yan, X.J.; Chen, X.L.; Pang, H.L. Chemical mechanism of flocculation and deposition of clay colloids in coastal aquifers. J. Ocean Univ. 2016, 15, 847–852. [Google Scholar] [CrossRef]
  38. Yang, M.S.; Yang, T.L.; Zhang, L.; Lin, J.X.; Qin, X.Q.; Liao, M.S. Spatio-Temporal Characterization of a Reclamation Settlement in the Shanghai Coastal Area with Time Series Analyses of X-, C-, and L-Band SAR Datasets. Remote Sens. 2018, 10, 329. [Google Scholar] [CrossRef] [Green Version]
  39. Xu, Y.S.; Wu, H.N.; Wang, B.Z.F.; Yang, T.L. Dewatering induced subsidence during excavation in a Shanghai soft deposit. Environ. Earth Sci. 2017, 76, 351. [Google Scholar] [CrossRef]
  40. Ye, G.L.; Lin, N.; Bao, X.H.; Gu, L.L.; Yadav, S.K. Effect of Quaternary transgression and regression on the engineering properties of Shanghai soft clays. Eng. Geol. 2018, 239, 321–329. [Google Scholar] [CrossRef]
  41. Dong, J.Q.; Wang, B.X.; Yan, X.X.; Xu, X.C.; Xiao, G.P.; Yu, Q.B.; Yao, M.; Wang, Q. Prediction of Undisturbed Clay Rebound Index Based on Soil Microstructure Parameters and PSO-SVM Model. KSCE J. Civ. Eng. 2022, 26, 2097–2111. [Google Scholar] [CrossRef]
  42. Yu, Q.B.; Yan, X.X.; Wang, Q.; Yang, T.L.; Lu, W.X.; Yao, M.; Dong, J.Q.; Zhan, J.W.; Huang, X.L.; Niu, C.C.; et al. A Spatial-Scale Evaluation of Soil Consolidation Concerning Land Subsidence and Integrated Mechanism Analysis at Macro-, and Micro-Scale: A Case Study in Chongming East Shoal Reclamation Area, Shanghai, China. Remote Sens. 2021, 13, 2418. [Google Scholar] [CrossRef]
  43. Tanaka, H.; Shiwakoti, D.R.; Omukai, N.; Rito, F.; Locat, J.; Tanaka, M. Pore Size Distribution of Clayey Soils Measured by Mercury Intrusion Porosimetry and its Relation to Hydraulic Conductivity. Soils Found. 2003, 43, 63–73. [Google Scholar] [CrossRef] [PubMed] [Green Version]
  44. Deng, Y.F.; Yue, X.B.; Liu, S.Y.; Chen, Y.G.; Zhang, D.W. Hydraulic conductivity of cement-stabilized marine clay with metakaolin and its correlation with pore size distribution. Eng. Geol. 2015, 193, 146–152. [Google Scholar] [CrossRef]
  45. Wang, J.Q.; Wang, Q.; Kong, Y.Y.; Han, Y.; Cheng, S.K. Analysis of the pore structure characteristics of freeze-thawed saline soil with different salinities based on mercury intrusion porosimetry. Environ. Earth Sci. 2020, 79, 161. [Google Scholar] [CrossRef]
  46. Chen, H.E.; Li, H.; Jiang, Y.L.; Yu, Q.B.; Yao, M.; Shan, W.C. Feasibility study on artificial preparation of structured loess. Geosci. Lett. 2022, 9, 21. [Google Scholar] [CrossRef]
  47. Lv, F.; Liu, X.; Liu, Q. A Comparative Study on the Correlation Degrees of Seven Grey Systems. J. Wuhan Univ. Tech. 2000, 2, 41–43. [Google Scholar]
  48. Liu, Q.; Zhao, B.D.; Santamarina, J.C. Particle migration and clogging in porous media: A convergent flow microfluidics study. J. Geophys. Res. Solid Earth 2019, 124, 9495–9504. [Google Scholar] [CrossRef] [Green Version]
  49. Liu, Y.W.; Zheng, W.L.; Wang, Q.; Cao, C.J.; Chang, M.S.; Rocchi, I. Evaluating sulfur-free lignin as a sustainable additive for soil improvement against frost resistance. J. Clean Prod. 2020, 251, 119504. [Google Scholar] [CrossRef]
  50. Romero, E.; Simms, P.H. Microstructure Investigation in Unsaturated Soils: A Review with Special Attention to Contribu-tion of Mercury Intrusion Porosimetry and Environmental Scanning Electron Microscopy. Geotech. Geol. Eng. 2008, 26, 705–727. [Google Scholar] [CrossRef]
  51. Hu, Y.Y.; Zhou, W.H.; Cai, Y.Q. Large-strain elastic viscoplastic consolidation analysis of very soft clay layers with vertical drains under preloading. Can. Geotech. J. 2014, 51, 144–157. [Google Scholar] [CrossRef]
  52. Zhang, B.Q.; Li, S.F. Determination of the Surface Fractal Dimension for Porous Media by Mercury Porosimetry. Ind. Eng. Chem. Res. 1995, 34, 1383–1386. [Google Scholar] [CrossRef]
  53. Zhou, J.; Tang, Y.Q. Experimental inference on dual-porosity aggravation of soft clay after freeze-thaw by fractal and probability analysis. Cold Reg. Sci. Technol. 2018, 153, 181–196. [Google Scholar] [CrossRef]
  54. Jiao, W.C.; Zhou, D.; Wang, Y.T. Effects of Clay Content on Pore Structure Characteristics of Marine Soft Soil. Water 2021, 13, 1160. [Google Scholar] [CrossRef]
  55. Feng, S.X.; Xu, Z.G.; Chai, J.R.; Li, Y.L. Using pore size distribution and porosity to estimate particle size distribution by nuclear magnetic resonance. Soils Found. 2020, 60, 1011–1019. [Google Scholar] [CrossRef]
  56. Zhang, X.D.; Shu, C.J.; Wu, Y.J.; Ye, P.; Du, D.W. Advances of coupled water-heat-salt theory and test techniques for soils in cold and arid regions: A review. Geoderma 2023, 432, 116378. [Google Scholar] [CrossRef]
  57. Zhang, Y.T. Study on the Influence of Temperature on the Permeability of Remolded Malan Loess. Master’s Thesis, Chang’an University, Xi’an, China, 2019. [Google Scholar]
Figure 1. An overview of the study area: (a) Shanghai city and the northeastern study area; (b) hydraulic reclamation; (c) expansion map of Chongming East Shoal.
Water 15 00968 g001
Figure 2. (a) Sampling points (A–E) at different phases; (b) sample photos of representative soil layers; (c) geological section map of borehole profiles based on field investigations.
Water 15 00968 g002
Figure 3. Material composition of natural soil: (a) grain size distribution (S1–S5); (b) mineral composition.
Water 15 00968 g003
Figure 4. Evolution and statistics (per 1000 s) of permeability coefficients. (ae) corresponding soil sample S1–S5.
Water 15 00968 g004
Figure 5. Average value and coefficient of variation of S1–S5 permeability coefficient (per 1000 s).
Water 15 00968 g005
Figure 6. Initial value of permeability coefficient during different cycles of soil samples.
Water 15 00968 g006
Figure 7. Attenuation rate of permeability coefficient during seepage (initial value–relatively stable value).
Water 15 00968 g007
Figure 8. MIP results (a) cumulative pore volume curves; (b) pore size density function; (c) dominant pore peak variation.
Water 15 00968 g008
Figure 9. Variation of pore content at all levels of soil samples in different reclamation areas.
Water 15 00968 g009
Figure 10. Comparison between porosity (MIP) and calculated porosity.
Water 15 00968 g010
Figure 11. (a,b) Micropore parameters of soil samples in different reclamation areas; (c) overall change pattern of PC and other variables.
Water 15 00968 g011
Figure 12. S1–S5 fractal dimension calculation results.
Water 15 00968 g012
Figure 13. Fractal dimension contribution factors of different grades of pores.
Water 15 00968 g013
Figure 14. (ae) Original SEM images of soil sample S1-S5; (f) Conceptual model of clay microstructure in late reclamation area and early reclamation area.
Water 15 00968 g014
Figure 15. Correlation between permeability characteristic parameters and pore characteristic parameters. Note: PC, permeability coefficient; AR(PC), attenuation rate of permeability coefficient; CV, coefficient of variation; ACT, average cycle time; n, porosity (MIP); SMA, small pores content; MES, mesopores content; MAC, macropores content; D50, medium entrance pore diameter; Dave, average pore diameter; FD, fractal dimension. Significance levels are * <0.05 and ** < 0.01.
Water 15 00968 g015
Figure 16. Grey relation entropy between PC and micropore parameters.
Water 15 00968 g016
Figure 17. Grey relation entropy between PC attenuation rate and other parameters.
Water 15 00968 g017
Figure 18. (a) Variation of water head of sample S1 with time in permeability test; (b) Variation of water head of sample S5 with time in permeability test.
Water 15 00968 g018
Figure 19. (a) Contribution of different micro parameters to coefficient of variation; (b) contribution of different micro parameters to average cycle time.
Water 15 00968 g019
Figure 20. (a) Seepage direction of soil samples in ring cutter; (b) Microstructure characteristics of soil samples above and below the ring cutter after permeability.
Water 15 00968 g020
Figure 21. Pore distribution for different reclamation samples before and after seepage. (ae) S1–S5 microscopic image before seepage; (fj) S1–S5 microscopic image after seepage.
Water 15 00968 g021
Figure 22. Changes in the proportion of pore areas at all levels before and after seepage of different soil samples.
Water 15 00968 g022
Table 1. Basic properties of natural soil.
Sampling HoleABCDE
SampleS1S2S3S4S5
Natural density (g/cm3)1.821.841.771.761.78
Natural water content ω (%)38.138.437.148.4149.14
Porosity (%)51.1950.7652.1856.0855.80
Sand (%)1.060.860.520.640.38
Silt (%)73.768.2269.6766.0965.71
Clay (%)25.2430.9229.8133.2733.91
Liquid limit (%)47.6943.0445.3252.458.87
Plasticity limit (%)18.5124.4628.0230.3325.8
Plasticity index 29.1818.5817.322.0733.07
Organic matter (%)0.230.440.670.180.26
Table 2. Cyclic variation characteristics of permeability coefficients of different soil samples.
SampleS1S2S3S4S5
Average cycle amplitude (cm/s)6.64 × 10−86.93 × 10−87.43 × 10−87.48 × 10−81.97 × 10⁻⁷
Average cycle time (s)226253247268371
Note: cycle amplitude = peak value–valley value (Figure 4a).
Disclaimer/Publisher’s Note: The statements, opinions and data contained in all publications are solely those of the individual author(s) and contributor(s) and not of MDPI and/or the editor(s). MDPI and/or the editor(s) disclaim responsibility for any injury to people or property resulting from any ideas, methods, instructions or products referred to in the content.

