
Application of Drifted Pumice Stone as a Sand-Capping Material

1
Marine Environment Control System Department, Port and Airport Research Institute, 3-1-1 Nagase, Yokosuka 239-0826, Japan
2
Estuary Research Center, Shimane University, 1060 Nishikawatsu, Matsue 690-8504, Japan
*
Author to whom correspondence should be addressed.
Water 2023, 15(5), 942; https://doi.org/10.3390/w15050942
Submission received: 22 January 2023
/
Revised: 27 February 2023
/
Accepted: 27 February 2023
/
Published: 1 March 2023
(This article belongs to the Special Issue Material Cycling’s around the Sediment-Water Interface: Implications for Understanding, Assessment, Remediation of Eutrophicated and Contaminated Sediment)
Abstract
:Large amounts of pumice stone generated by the submarine volcanic eruption at Fukutoku Okanoba on 13 August 2021 drifted ashore, affecting ship navigation and fishery operations and posing challenges for disposal and a risk to benthic sea-life. As a new approach to managing ejected pumice from submarine eruptions, we investigated the possibility of using pumice as a sand-capping material for eutrophic sediments through laboratory experiments. Crushed pumice as a sand cover material effectively reduced the sedimentary oxygen consumption rate. Nutrient release from sediment showed a similar trend, with ~25% and 82% reductions in NH4-N and PO4-P release rates, respectively. Furthermore, bivalve exposure experiments using crushed pumice suspended in seawater showed no adverse effects specific to pumice and lowered bivalve mortality to a greater extent than did using kaolin at the same concentration. This could be related to the differences in gill accumulation and blockage owing to the particle size variation of suspended particles. These results suggest that crushed pumice is effective for sand-capping and suitably suppresses oxygen consumption and nutrient release from sediments.
1. Introduction
A submarine volcanic eruption at Fukutoku Okanoba, Ogasawara Islands, Japan, occurred from 13–15 August 2021, producing a 300-km2 pumice raft that was dispersed by ocean currents more than 1000 km west of the volcano [1]. The pumice drifted into the sea at various locations on the Pacific side of Japan, affecting coastal infrastructures, ship navigation, and fishery operations [1,2]. As a result, the disposal of enormous amounts of drifted pumice stone has become problematic.
Previous studies have investigated the formation of pumice rafts by submarine volcanoes and their driftage [3,4,5,6] and showed that similar events reoccur on a 10- to 20-year basis in the seas around Japan. The large-scale formation and driftage of pumice rafts have also been reported in the Kermadec Arc, New Zealand [7], the South Sandwich Islands [8], and at Home Reef Volcano, Tonga [9]. Considering that a similar event is likely to occur in the future, it is necessary to study effective ways to manage pumice that has been ejected into the sea.
Pumice is a glassy volcanic rock fragment with a high vesicularity of 50–80% [2], and its properties vary depending on the conditions of its formation, including melt viscosity, temperature, and the duration of pressure drop [10]. Although pumice is porous and has a low apparent specific gravity, it generally settles out in seawater when crushed to a diameter of 0.5 mm or less. However, it still has a lower specific gravity than the particles of seabed sediments; therefore, the risk of pumice burrowing into the sediments is relatively low. These properties allow its potential use as a sand-capping material. In addition, a high adsorption capacity can be expected owing to its porous nature, thereby allowing the suppression (adsorption) of the release of nutrients from the sediment. Thus, pumice stone is a promising material for sand-capping. However, regarding the on-site application, it is necessary to consider that the resuspension of pumice may adversely affect surrounding organisms.
To the best of our knowledge, no previous research has studied the utility of pumice stone as a sand-capping material. Therefore, in this study, we examined the efficacy and potential application of pumice as a sand-capping material for eutrophic sediments. Laboratory experiments were conducted using drifted pumice to investigate the reduction of oxygen consumption and nutrient release from eutrophic sediments. In addition, phosphorus and nitrogen adsorption experiments were conducted to examine the usefulness of pumice as a sand-capping material. Finally, exposure experiments using bivalves were conducted to examine the effects of crushed pumice on living organisms. The results of this study provide insight into the current problem of the disposal of drifting pumice, as well as effective utilization methods for the material, helping us to consider how to deal with pumice ejected by submarine volcanoes in the future.
2. Materials and Methods
2.1. Pumice Stone Crushing
Approximately 20 kg of pumice was collected from Yasuda Port (26°44.49′ N, 128°19.12′ E), located northeast of the main island of Okinawa, Japan. The collected pumice was transported to the laboratory and crushed using a crusher (20-KP-7919, Labonect Corporation, Osaka, Japan) at 30,000 rpm for 3 min, visually confirmed to have a particle size of 0.5 mm or less, and used in subsequent experiments.
2.2. Sedimentary Oxygen Demand Laboratory Experiment
An incubation experiment using sediment cores was conducted to assess the effect of using crushed pumice as a sand-capping material to suppress sediment oxygen consumption. Dredged muddy sediment collected from the navigation channel (depth: 16 m) of Osaka Port (34°29.56′ N, 135°21.80′ E) was used in the experiment. The sediment comprised organic silt with a dark olive-gray color and had the pungent odor of rotten eggs characteristic of hydrogen sulfide.
Three cylindrical acrylic pipes (Item No. 6-628, As One Corporation, Osaka, Japan) with an inner diameter of 10 cm and a height of 50 cm were packed with the sediment and overlying water such that the sediment height was approximately 28 cm (hereafter, CORE1, CORE2, and CORE3). The pipes were stored at room temperature (22–24 °C) for 2 days and allowed to settle at the surface by means of consolidation. Subsequently, CORE1, CORE2, and CORE3 were prepared with 0%, 46%, and 100% pumice by weight, as follows. For CORE1, 49.07 g (wet weight) of the same sediment was collected and placed uniformly on the surface. For CORE2, 23.03 g (wet weight) of crushed pumice and 26.97 g (wet weight) of sediment were well mixed and placed uniformly on the surface. For CORE3, 49.38 g (wet weight) of crushed pumice was placed uniformly on the surface.
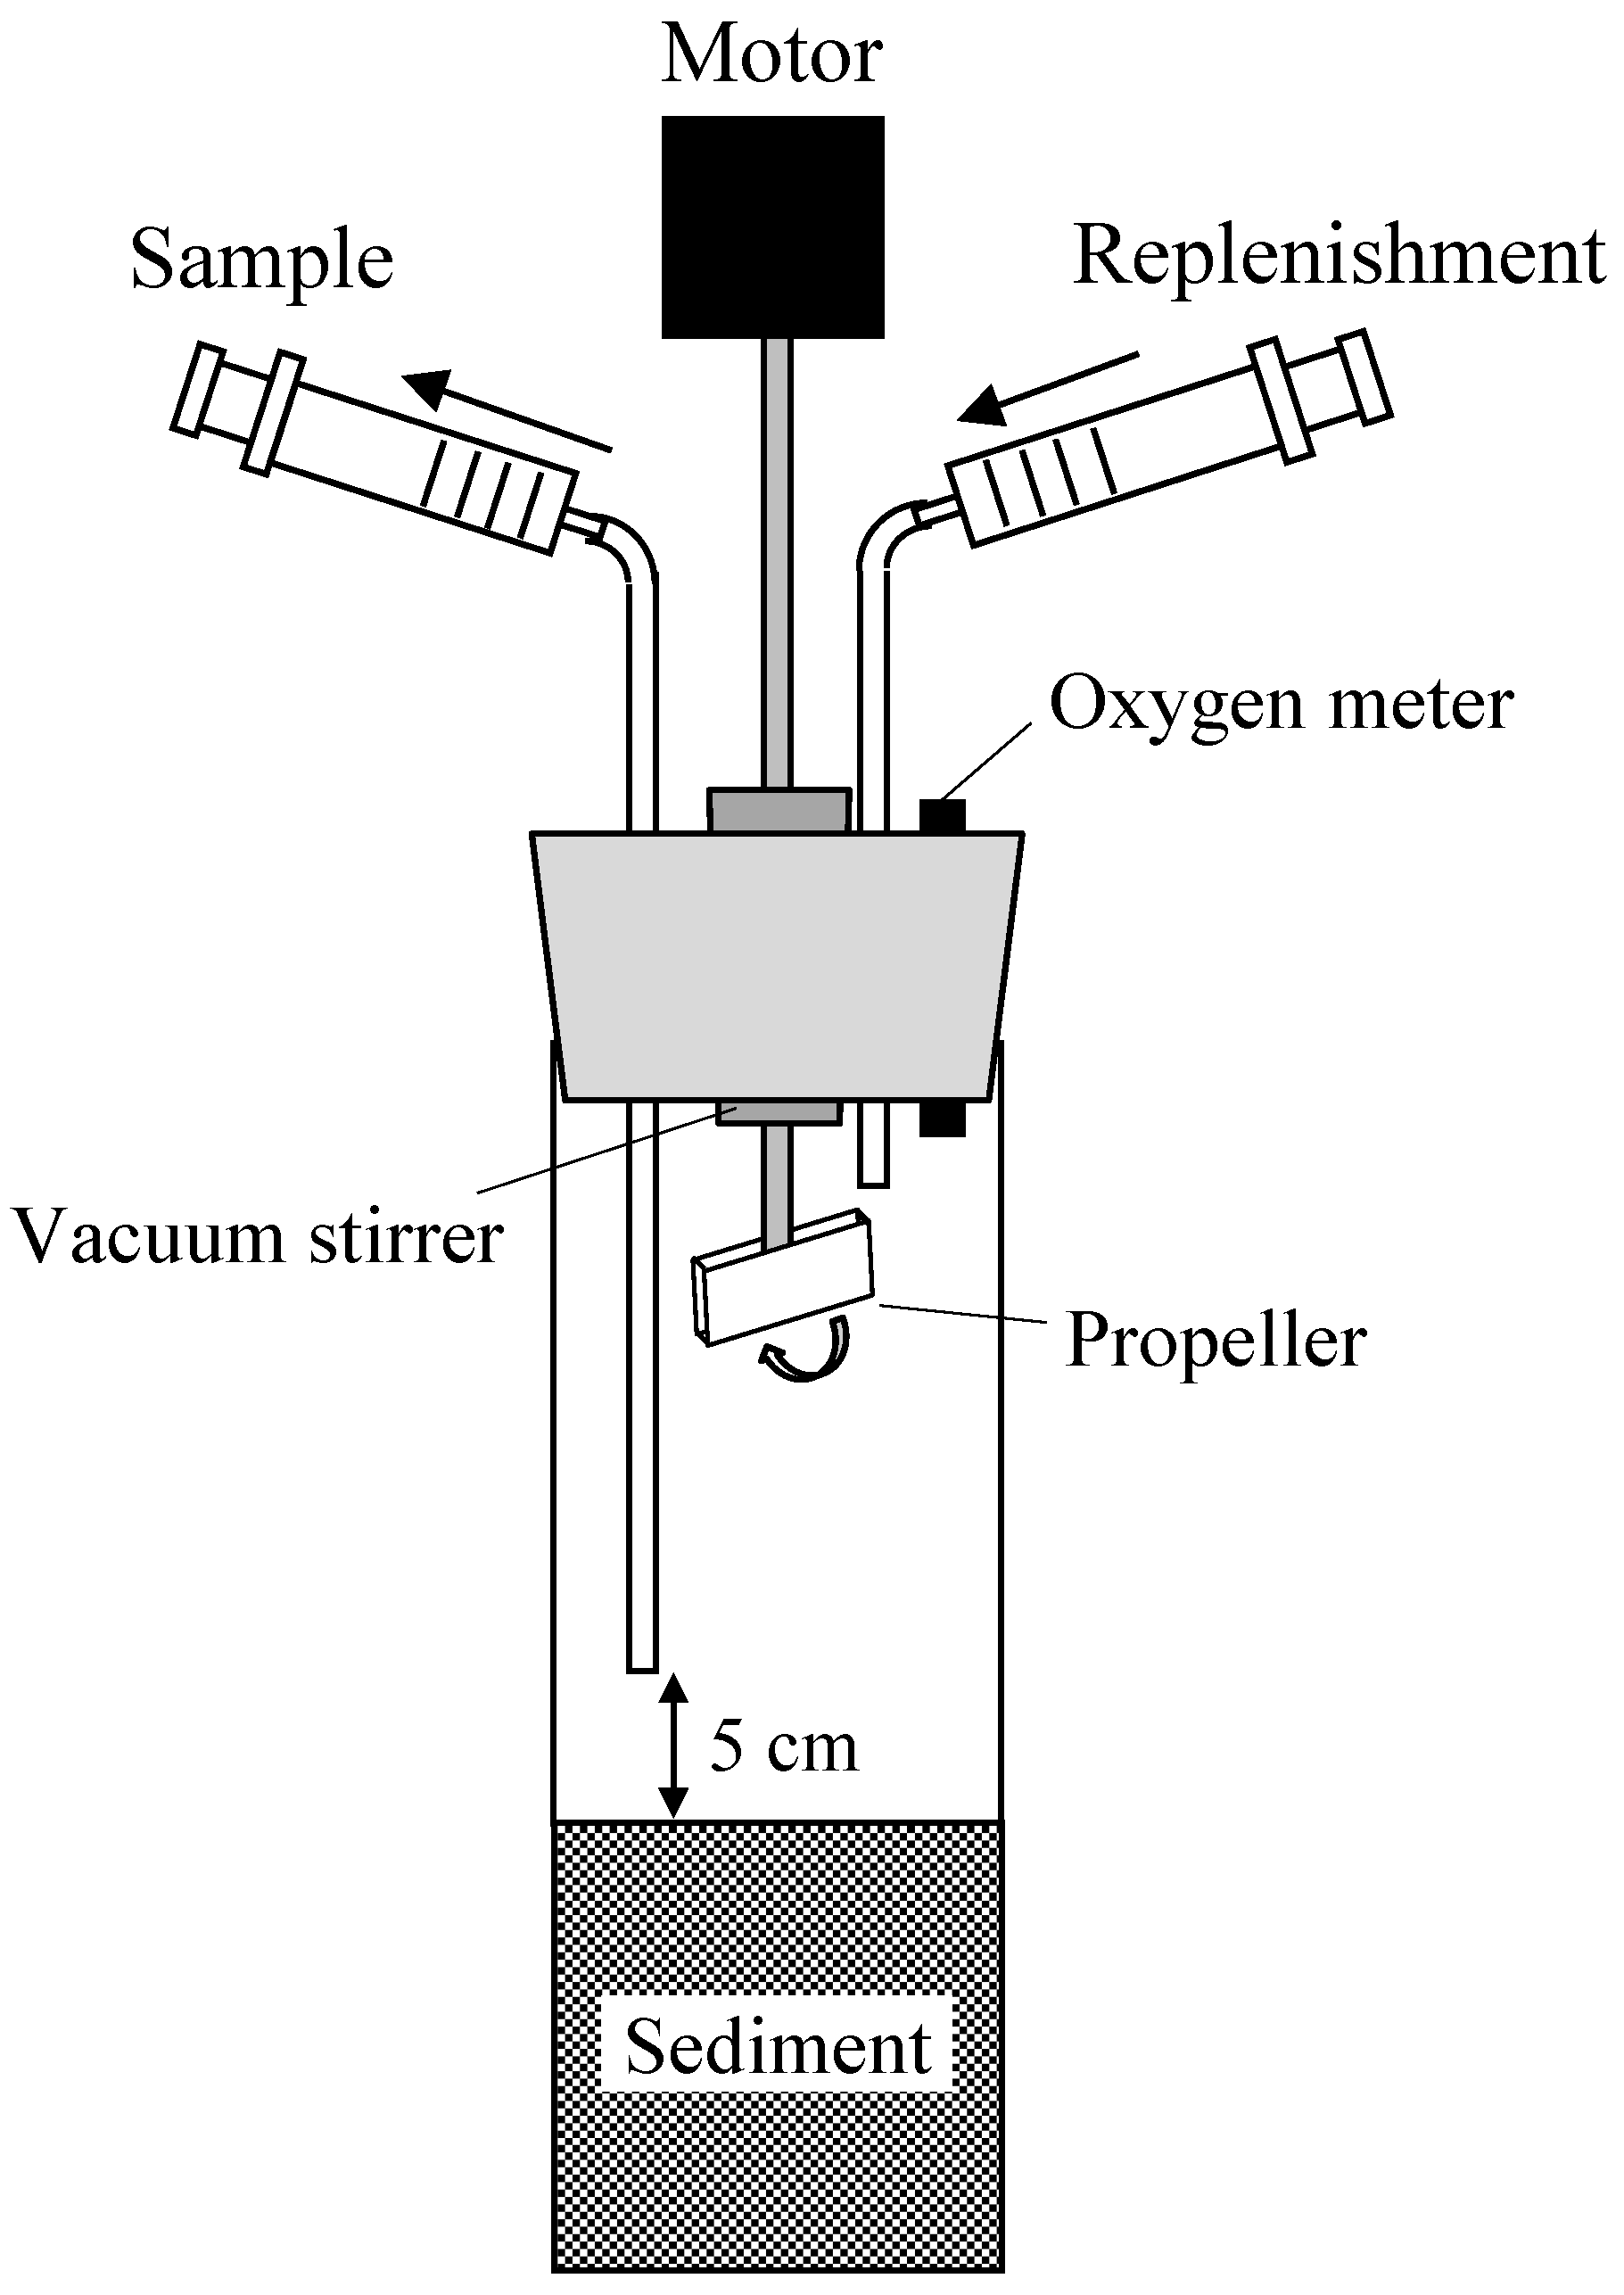
Artificial seawater (Marine Art SF-1, Osaka Yakken, Osaka, Japan; equivalent to 35 psu) was gently injected on top of the material to avoid sediment suspension. Subsequently, the core was sealed with a silicon plug, ensuring that no air bubbles were left in the core, and placed in a water bath where the water temperature was maintained at 23 °C. The silicone plug was equipped with a fluoroplastic propeller (model no. FLSPI, PTFE straight blade, As One Corporation) and brushless motor (BMU230A-15-2, Oriental Motor Corporation, Tokyo, Japan), and a magnetic drive vacuum agitator (Model No. F-24/40, PTFE magnet-type, As One Corporation) was installed. Using these devices, the overlying water could be agitated at any rotation speed in sealed conditions without exposure to the outside air. As a result, the overlying water in the core could be sufficiently mixed, and the flow conditions in the core could be controlled [11]. In addition, the silicon plug was equipped with a dissolved oxygen (DO) meter probe (WA-2017SD, FUSO Inc., Tokyo, Japan) to continuously measure the DO concentration of the overlying water at 10-min intervals [12] (Figure 1).
The propeller rotation speed was set to 20 rpm, and DO monitoring began after approximately one-half day of acclimation. The cores were shaded with curtains during the experiment to prevent light exposure. DO concentration in the overlying water was measured every 10 min.
The rate of DO consumption by sediments (sedimentary oxygen demand, SOD) was calculated from the rate of decrease in the DO concentration in the overlying water [11] using the following equation:
where V is the volume of overlying water in the core, A is the cross-sectional area of the sediment core, CDO is the DO concentration in the overlying water, and t is the elapsed time.
2.3. Sedimentary Nutrient Release Rate Laboratory Experiment
The sediment nutrient release experiment was conducted using the sediment cores (Section 2.2), and incubation was continued for 6 days after anoxic conditions were established. The experimental conditions, such as water temperature and agitation speed, were the same as those described in Section 2.2.
Three water samples were collected during the experiment. First, the overlying water was sampled using a tube (4 mm, inner diameter; 6 mm, outer diameter; LMT-55, Saint-Gobain KK, Tokyo, Japan) with the inlet placed ~50 mm above the sediment surface (not exposed to the air, Figure 1), and the portion of sampled water was immediately filtered using a disposable filter (pore size 0.45 µm, Minisalt SM16555K, Sartorius Co., Göttingen, Germany). The filtered sample was poured into acid-washed polypropylene bottles and stored at −25 °C until further chemical analysis. The samples were analyzed using a continuous flow analyzer (QuAAtro 39, BLtech Corporation, Osaka, Japan), with ammonium nitrogen (NH4-N) measured using the indophenol blue-colored continuous flow analysis (CFA) and phosphate (PO4-P) measured using the molybdenum blue CFA method [13]. The nutrient release rate (NRR) from the sediment was calculated from the rate of increase in nutrient concentration in the overlying water based on the following equation [14]:
where Cnut is the NH4-N or PO4-P concentration in the overlying water.
After the nutrient release experiment was completed, a 1.0-cm thick surface sediment layer was collected for bottom-sediment analysis. This was placed in a 100-mL container and stored at −25 °C. The following were analyzed: ignition loss (600 °C ignition and gravimetric method), total organic carbon (after hydrochloric acid treatment, measured using CHN elemental analyzer (JMA1000HCN, J-Science, Hiroshima, Japan)), chemical oxygen demand (oxygen consumption by potassium permanganate), total sulfides (steam distillation-methylene blue method), total nitrogen (measured using CHN elemental analyzer), total phosphorus (nitric acid and sulfuric acid decomposition, molybdenum blue absorption spectrophotometry (SWAAT, BLtech Corporation, Osaka, Japan)), total iron (nitric acid and sulfuric acid decomposition-flame atomic absorption method (atomic absorption spectrometer, Z-2000, Hitachi, Tokyo, Japan)), and total manganese (nitric acid and sulfuric acid decomposition-flame atomic absorption method). The analytical results are presented in Appendix A.
2.4. Nutrient Adsorption
Three 1-L beakers were used, and NH4-N (ammoniacal nitrogen standard solution, NH4-N 1000, Kanto Chemical Co., Ltd., Tokyo, Japan) and PO4-P (phosphorus standard solution, PO4-P 1000, Kanto Chemical Co., Ltd.) were added to artificial seawater at a concentration of approximately 0.2 mg L−1 each. Two beakers were filled with 30 g of crushed pumice stone, with one beaker used for nutrient concentration measurements and the other for water temperature, pH, and oxidation-reduction potential (ORP) measurements. The other beaker was used as a control without pumice and only for nutrient measurements.
The artificial seawater in the beaker was continuously stirred during the experiment, and the crushed pumice was kept in suspension throughout the experiment. From the beaker for nutrient concentration measurements, 20 mL of water was collected before and immediately after, 1, 2, 5, 10, 20, and 30 min, and 1, 2, 3, and 6 h after the crushed pumice stone was added using a plastic syringe (Terumo Syringe 10 mL, Terumo, Tokyo, Japan). The sample was filtered (pore size: 0.45 µm, diameter: 30 mm; SupraPure Syringe Filter, PTFE-Hydrophilic, Recenttec, Tokyo, Japan), and the filtrate was collected in two 10-mL spitz tubes (Econospitz PS, 10 mL; Sanplatec Co., Osaka, Japan). The filtrate was stored, frozen, and analyzed using a continuous flow analyzer (QuAAtro 39, BLtech Corporation, Osaka, Japan) using the indophenol blue CFA method for NH4-N, naphthylethylenediamine CFA method for nitrite (NO2-N), naphthylethylenediamine CFA method after reduction with a copper-cadmium reduction column for nitrate (NO3-N), and molybdenum blue CFA method for PO4-P. Water temperature (digital thermometer, CT-410WR, Custom, Tokyo, Japan), pH (pH meter, HM-60S, DKK-TOA, Tokyo, Japan), and ORP (ion meter, IM-40S, DKK-TOA) were measured when water was collected from the beaker for nutrient measurement.
From the control beaker, 20 mL of water was collected, as described above, before and 1, 3, and 6 h after the start of the experiment, filtered through a syringe filter with a pore size of 0.45 µm, and collected in 10-mL spitz tubes. These were also frozen and stored, and NH4-N, NO2-N, NO3-N, and PO4-P levels were measured.
2.5. Exposure Experiment
Exposure experiments were conducted with crushed pumice in suspension to examine the effects of the resuspension of crushed pumice on bivalves. For comparison, bivalves were also exposed to kaolin in suspension. Before the experiment, healthy bivalves were carefully transported to the laboratory. All individuals were immediately checked for physical damage, and debilitated individuals were excluded. Furthermore, we excluded bivalves that could not open or close siphons or other soft parts of the body or shells before acclimation. Next, acclimation was conducted in several tanks, and the water was changed frequently. The bivalves were not fed in order to prevent them from excreting large amounts of feces and pseudofeces (urine) during acclimation. When selecting bivalves for the experiment, those from tanks where individuals had died during acclimation were excluded. Those with soft parts such as siphons and shells that were confirmed to be open and closed were selected for use.
Experiments were conducted in 1-L beakers filled with 1 L of artificial seawater. First, artificial seawater was prepared with five concentrations of each suspension (25, 100, 400, 1600, and 6400 mg L−1). We also prepared a control beaker with no suspended material added (Table 1). A healthy bivalve (Ruditapes philippinarum) with an undamaged shell and confirmed healthy siphons was installed in each beaker. During the experimental period, the seawater was agitated with a stirrer to keep the suspension concentration of crushed pumice and kaolin constant and aerated. The bivalves were placed on a pedestal made of plastic mesh so they would not be beaten by the rotating stirrer tip (Figure 2). Five beakers were prepared for each experimental condition.
Incubation was conducted at a water temperature of 20 °C for 168 h (7 days), and survival was checked twice daily. The water was changed once daily. During the experimental period, water temperature, pH, DO (oxygen meter, DO-21P, DKK-TOA), and turbidity were measured in all beakers twice daily. After water collection, absorbance was measured at a wavelength of 660 nm (DR-2800 spectrophotometer, HACH, CO, USA). For suspended solid (SS), NH4-N, NO2-N, NO3-N, and PO4-P analyses, water samples were collected from all beakers at the end of the experiment or when bivalves died. Two beakers were also prepared with two suspension concentrations (400 and 6400 mg L−1) and without bivalves to examine changes in water quality due to the addition of suspended materials. On day 1, water samples were collected from two beakers for total nitrogen, total phosphorus, fluorine, NH4-N, NO2-N, NO3-N, and PO4-P concentration analyses and one beaker to analyze the particle size distribution of suspended materials.
After the experiment, the shell length, shell width, shell height, and soft tissue weight of all individuals were measured, and the condition index was calculated using the following equation [15].
where CI is the condition index; STW is the soft tissue weight (g); SL, SW, and SH are the shell length, shell width, and shell height, respectively (cm).
Finally, the Kruskal–Wallis test was conducted to test for differences among experimental conditions.
3. Results
3.1. Oxygen Consumption Experiment
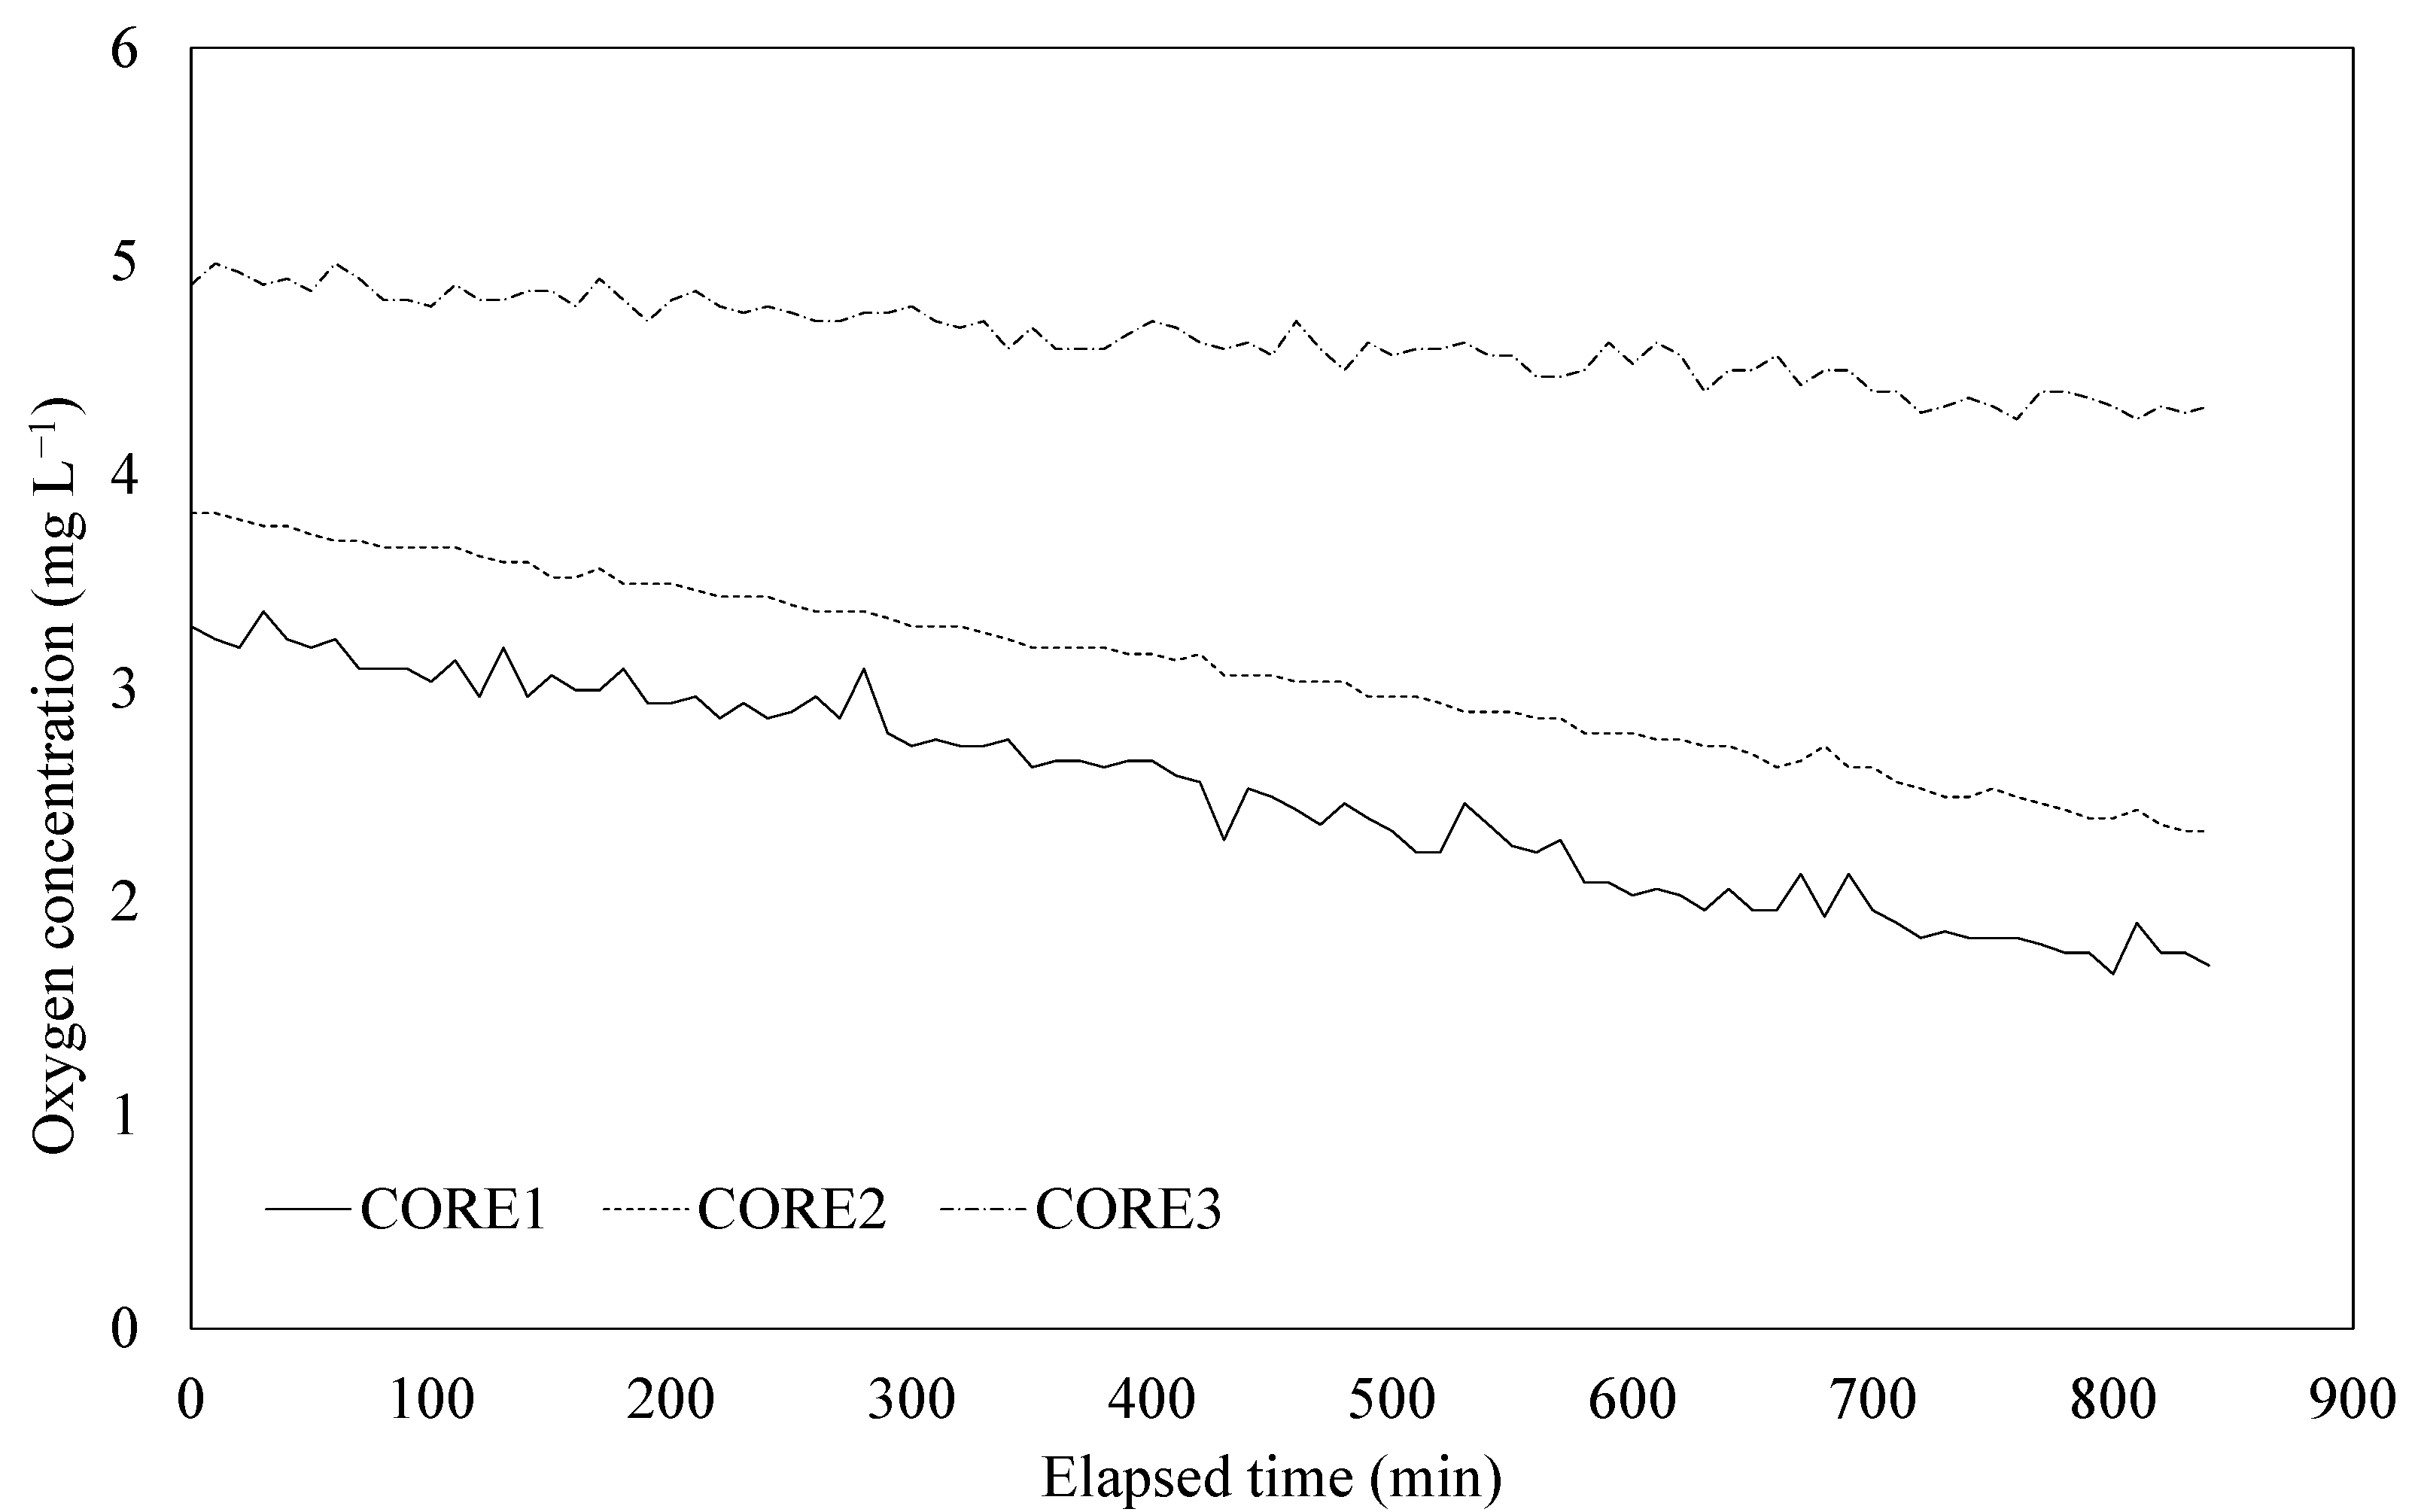
Visual inspection revealed no resuspension of sediment particles during the experiment. Figure 3 shows the temporal variations in the DO concentration in the overlying water during the oxygen consumption experiment. All three treatments showed a monotonous decrease due to the sedimentary DO consumption. However, each treatment showed a different decreasing rate reflecting the sand-capping effect for CORE2 and CORE3. The differences in initial DO concentrations among CORE1 (0% pumice weight ratio), CORE2 (46% pumice weight ratio), and CORE3 (100% pumice weight ratio) were due to DO consumption during the half-day acclimation period.
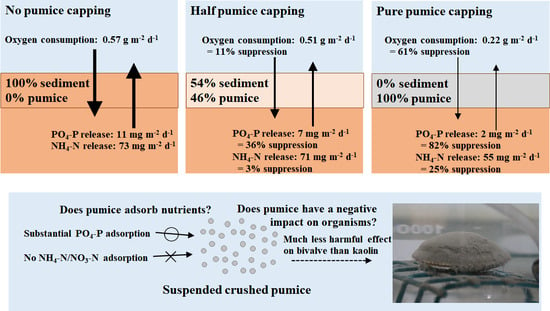
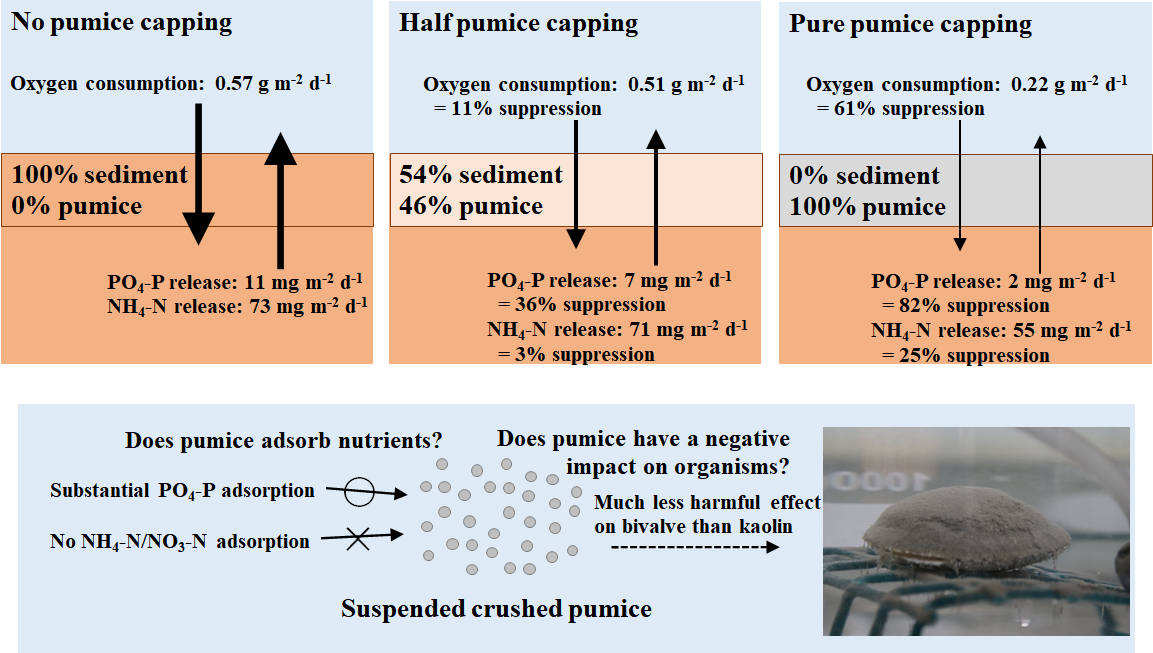
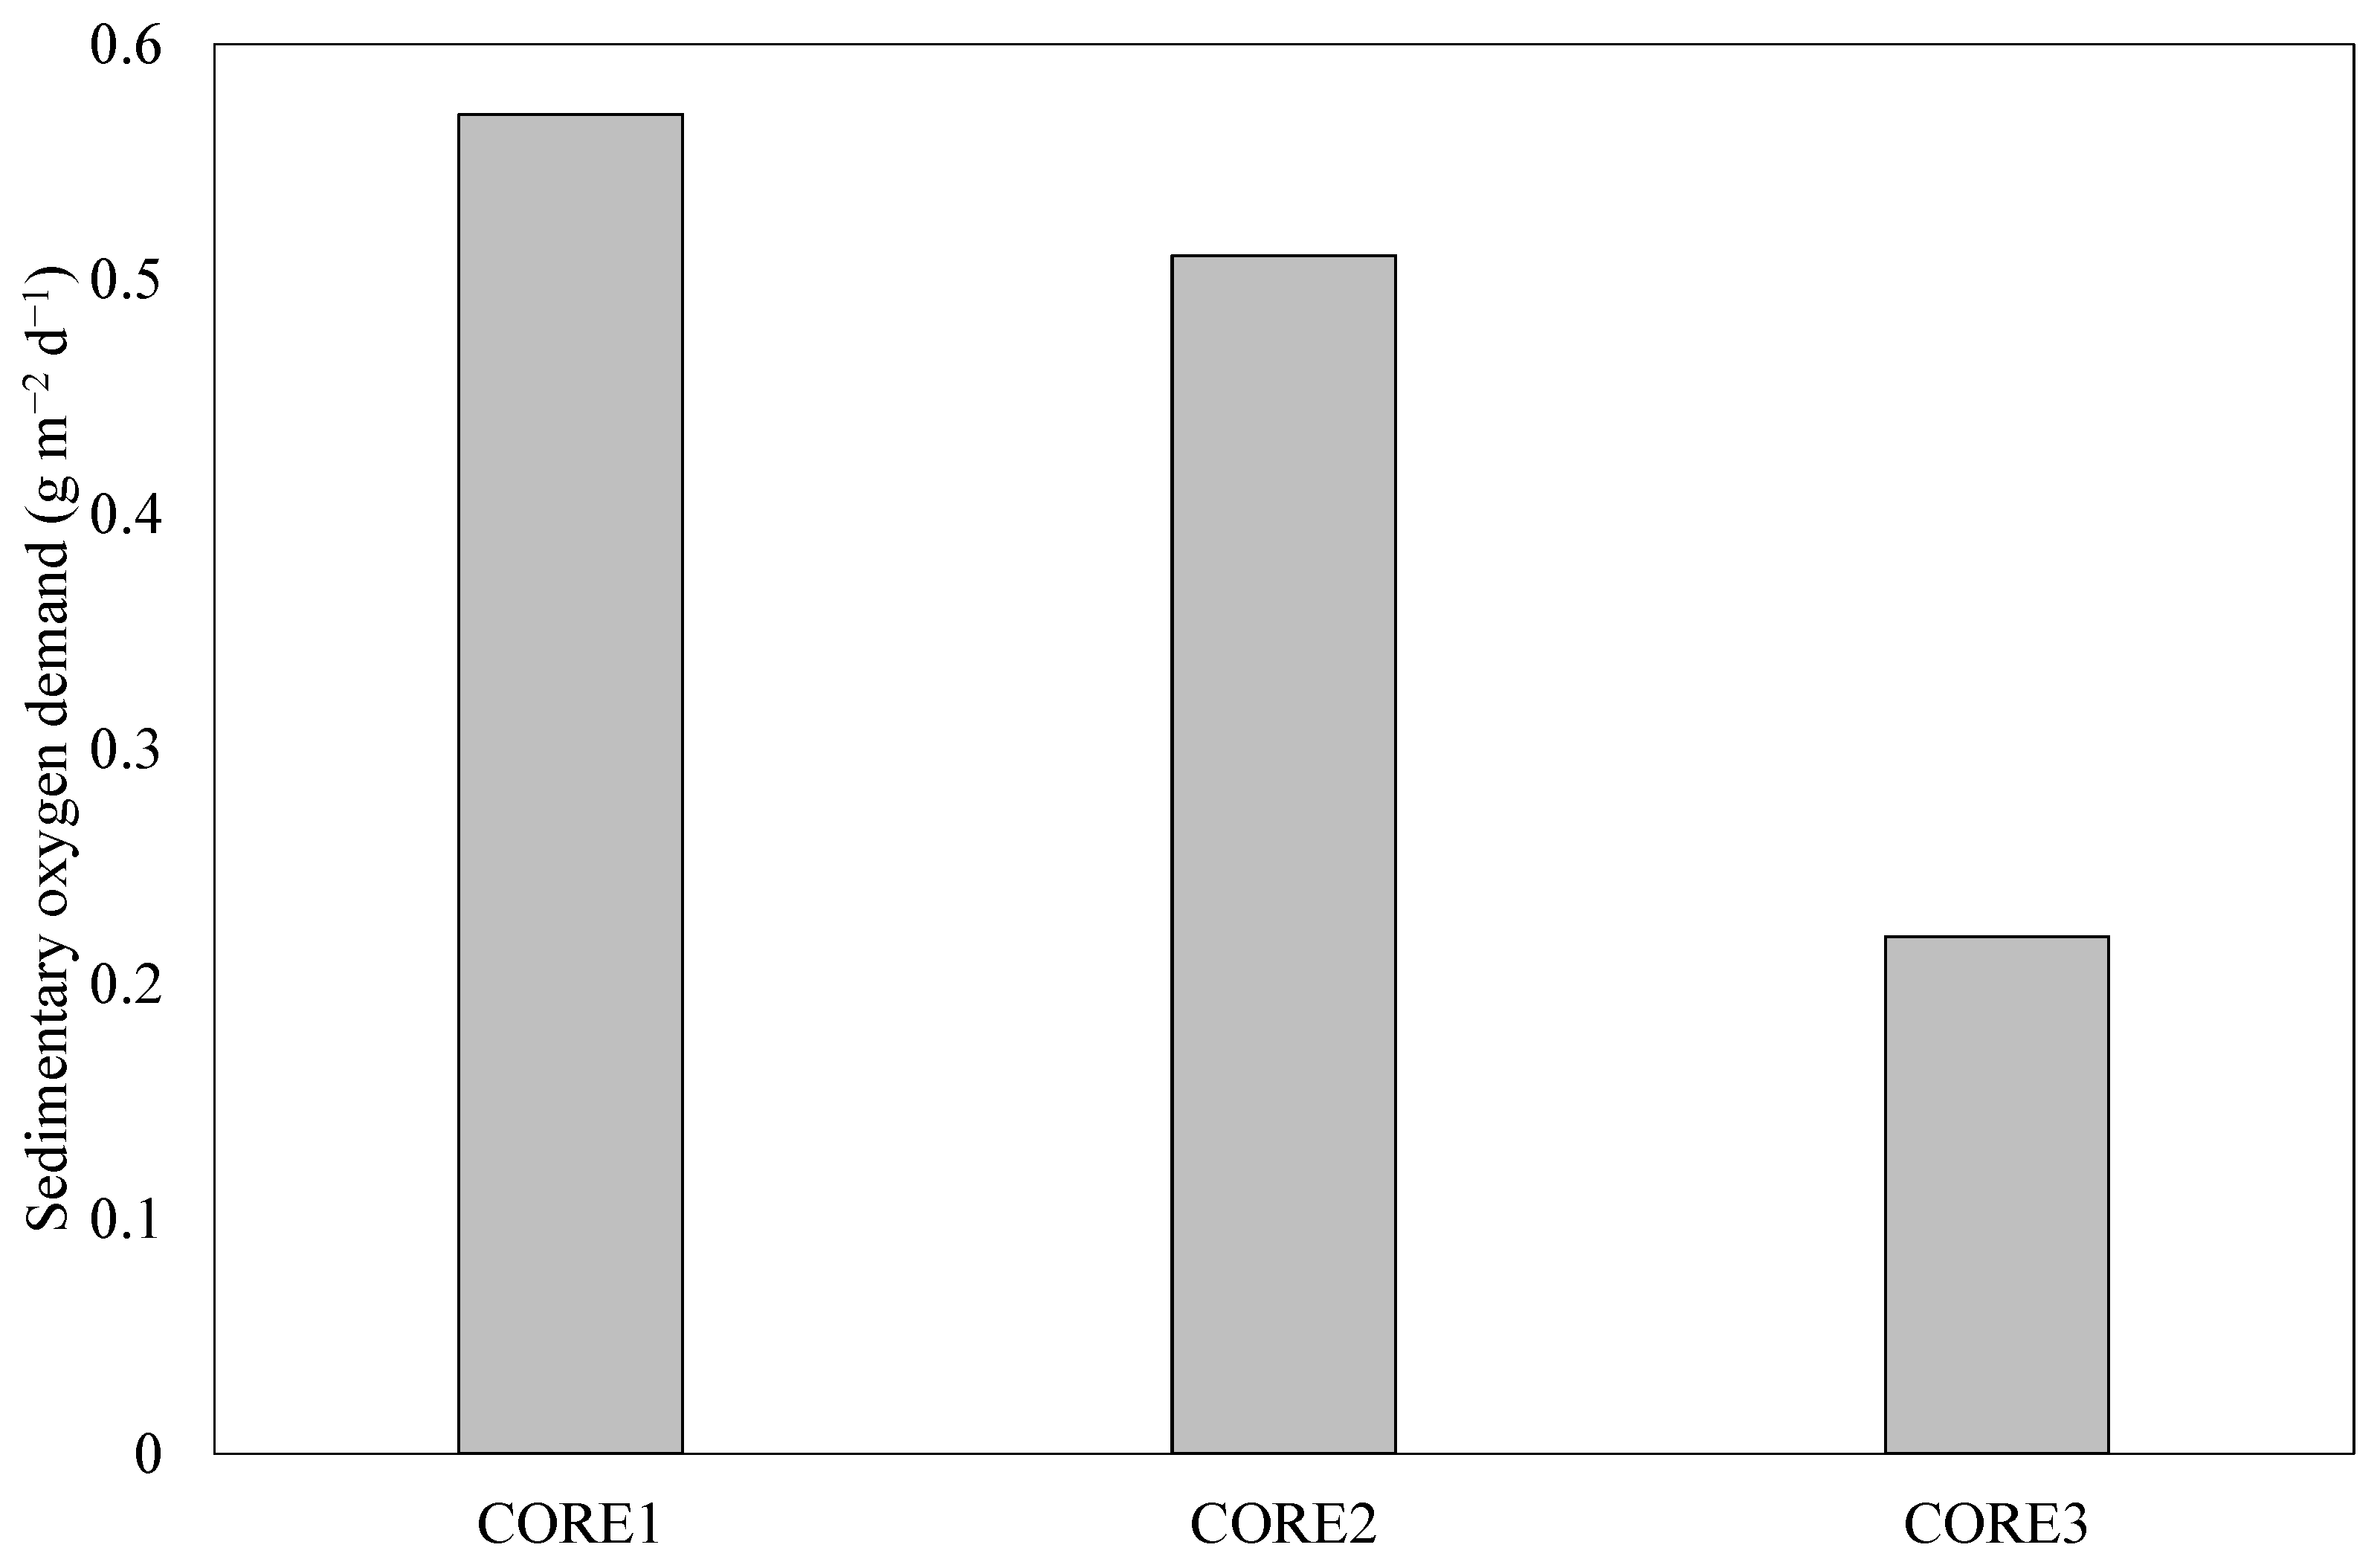
Based on these results, the SOD calculated using Equation (1) is shown in Figure 4. The SOD for CORE1 was 0.57 g m−2 d−1, and that for CORE2 was 0.51 g m−2 d−1, showing an 11% reduction compared with that of CORE1. Furthermore, the SOD of CORE3 was 0.22 g m−2 d−1, exhibiting a 61% reduction compared with that of CORE1. This reduction in SOD was attributed to the reduction in the volumetric organic matter content in the surface layer by placing crushed pumice. These results confirmed that applying crushed pumice to eutrophic sediment surfaces effectively reduces SOD activity.
3.2. Nutrient Release Experiments
Figure 5 shows the temporal variations in nutrient concentrations in the overlying water during the nutrient release experiment. The PO4-P and NH4-N concentrations in the overlying water monotonously increased as results of continuous release from the sediment. The differences in the initial NH4-N concentrations among CORE1, CORE2, and CORE3 were thought to be due to differences in their release rates during the experiment (Figure 5b).
From these results, the nutrient release rates calculated using Equation (2) are shown in Figure 6. The PO4-P release rate for CORE1 was 11 mg m−2 d−1, whereas that for CORE2 was 7 mg m−2 d−1, showing a 36% reduction compared with that of CORE1 (Figure 6a). Furthermore, the PO4-P release rate for CORE3 was 2 mg m−2 d−1, which was 82% lower than that of CORE1. This was thought to be due to an increase in PO4-P adsorption in the surface layer of the sediment by the placement of crushed pumice.
In contrast, the NH4-N release rate in CORE1 was 73 mg m−2 d−1, and that for CORE2 was 71 mg m−2 d−1, which was only 3% less than that of CORE1. Furthermore, the NH4-N release rate for CORE3 was 55 mg m−2 d−1, exhibiting a 25% reduction compared with that of CORE1 (Figure 6b). This may be because the NH4-N content in the surface layer was reduced by placing crushed pumice on the sediment surface, but as discussed below, pumice has no NH4-N adsorption capacity; therefore, this effect was negligible.
3.3. Nutrient Adsorption Experiment
During the experiment, the water temperature remained within the range of 18.6 °C to 20.6 °C because the beakers were kept at room temperature. The pH was 8.2 before the crushed pumice stone was added but decreased slightly to 8.0 after 6 h. The ORP was 391 mV before the crushed pumice stone was added but increased slightly to 400 mV after 2 h and decreased to 391 mV 6 h after the addition. The water temperature, pH, and ORP fluctuated slightly but were not considered to have changed enough to affect nutrient adsorption and desorption. No fluctuations in the NH4-N and PO4-P concentrations in the control beaker were observed.
The concentration of NH4-N was 0.207 mg L−1 before the pumice stone was added but increased to 0.228 mg L−1 immediately after; moreover, it changed to 0.271 mg L−1 1 min later but remained at approximately 0.26 mg L−1 after that (Figure 7a). NO3-N concentration was 0.009 mg L−1 before the pumice stone was added but increased to 0.011 mg L−1 immediately after the pumice stone was added, increased to 0.012 mg L−1 1 min later, and remained at approximately 0.012 mg L−1 after that (Figure 7b). For these reasons, it was considered that what was contained in the pumice stone returned to artificial seawater. However, the amount was not significant, and the release of nitrogen was not considered a vital process. NO2-N concentration was below the detection limit throughout the experiment. The concentration of PO4-P was 0.196 mg L−1 before pumice stone addition but reached 0.150 mg L−1 immediately and then decreased consistently to 0.071 mg L−1 after 6 h (Figure 7c). These results indicate that the crushed pumice stone shows an adsorption effect only on PO4-P.
3.4. Bivalve Exposure Experiment
The shell length of bivalves used in exposure experiments ranged from 38.45 to 41.24 mm (Table 2), with no significant difference among them (Kruskal–Wallis test, n = 5, p = 0.14). The wet weight of bivalves used in the exposure experiments ranged from 11.32 to 13.95 g. There were no significant differences among the groups (Kruskal–Wallis test, n = 5, p = 0.13) (Table 2). The condition index of bivalves used in the exposure experiments ranged from 30.44 to 33.80, and there was no significant difference between the groups (Kruskal–Wallis test, n = 5, p = 0.07). All individuals were healthy adults.
3.5. Exposure Experiments Using Crushed Pumice
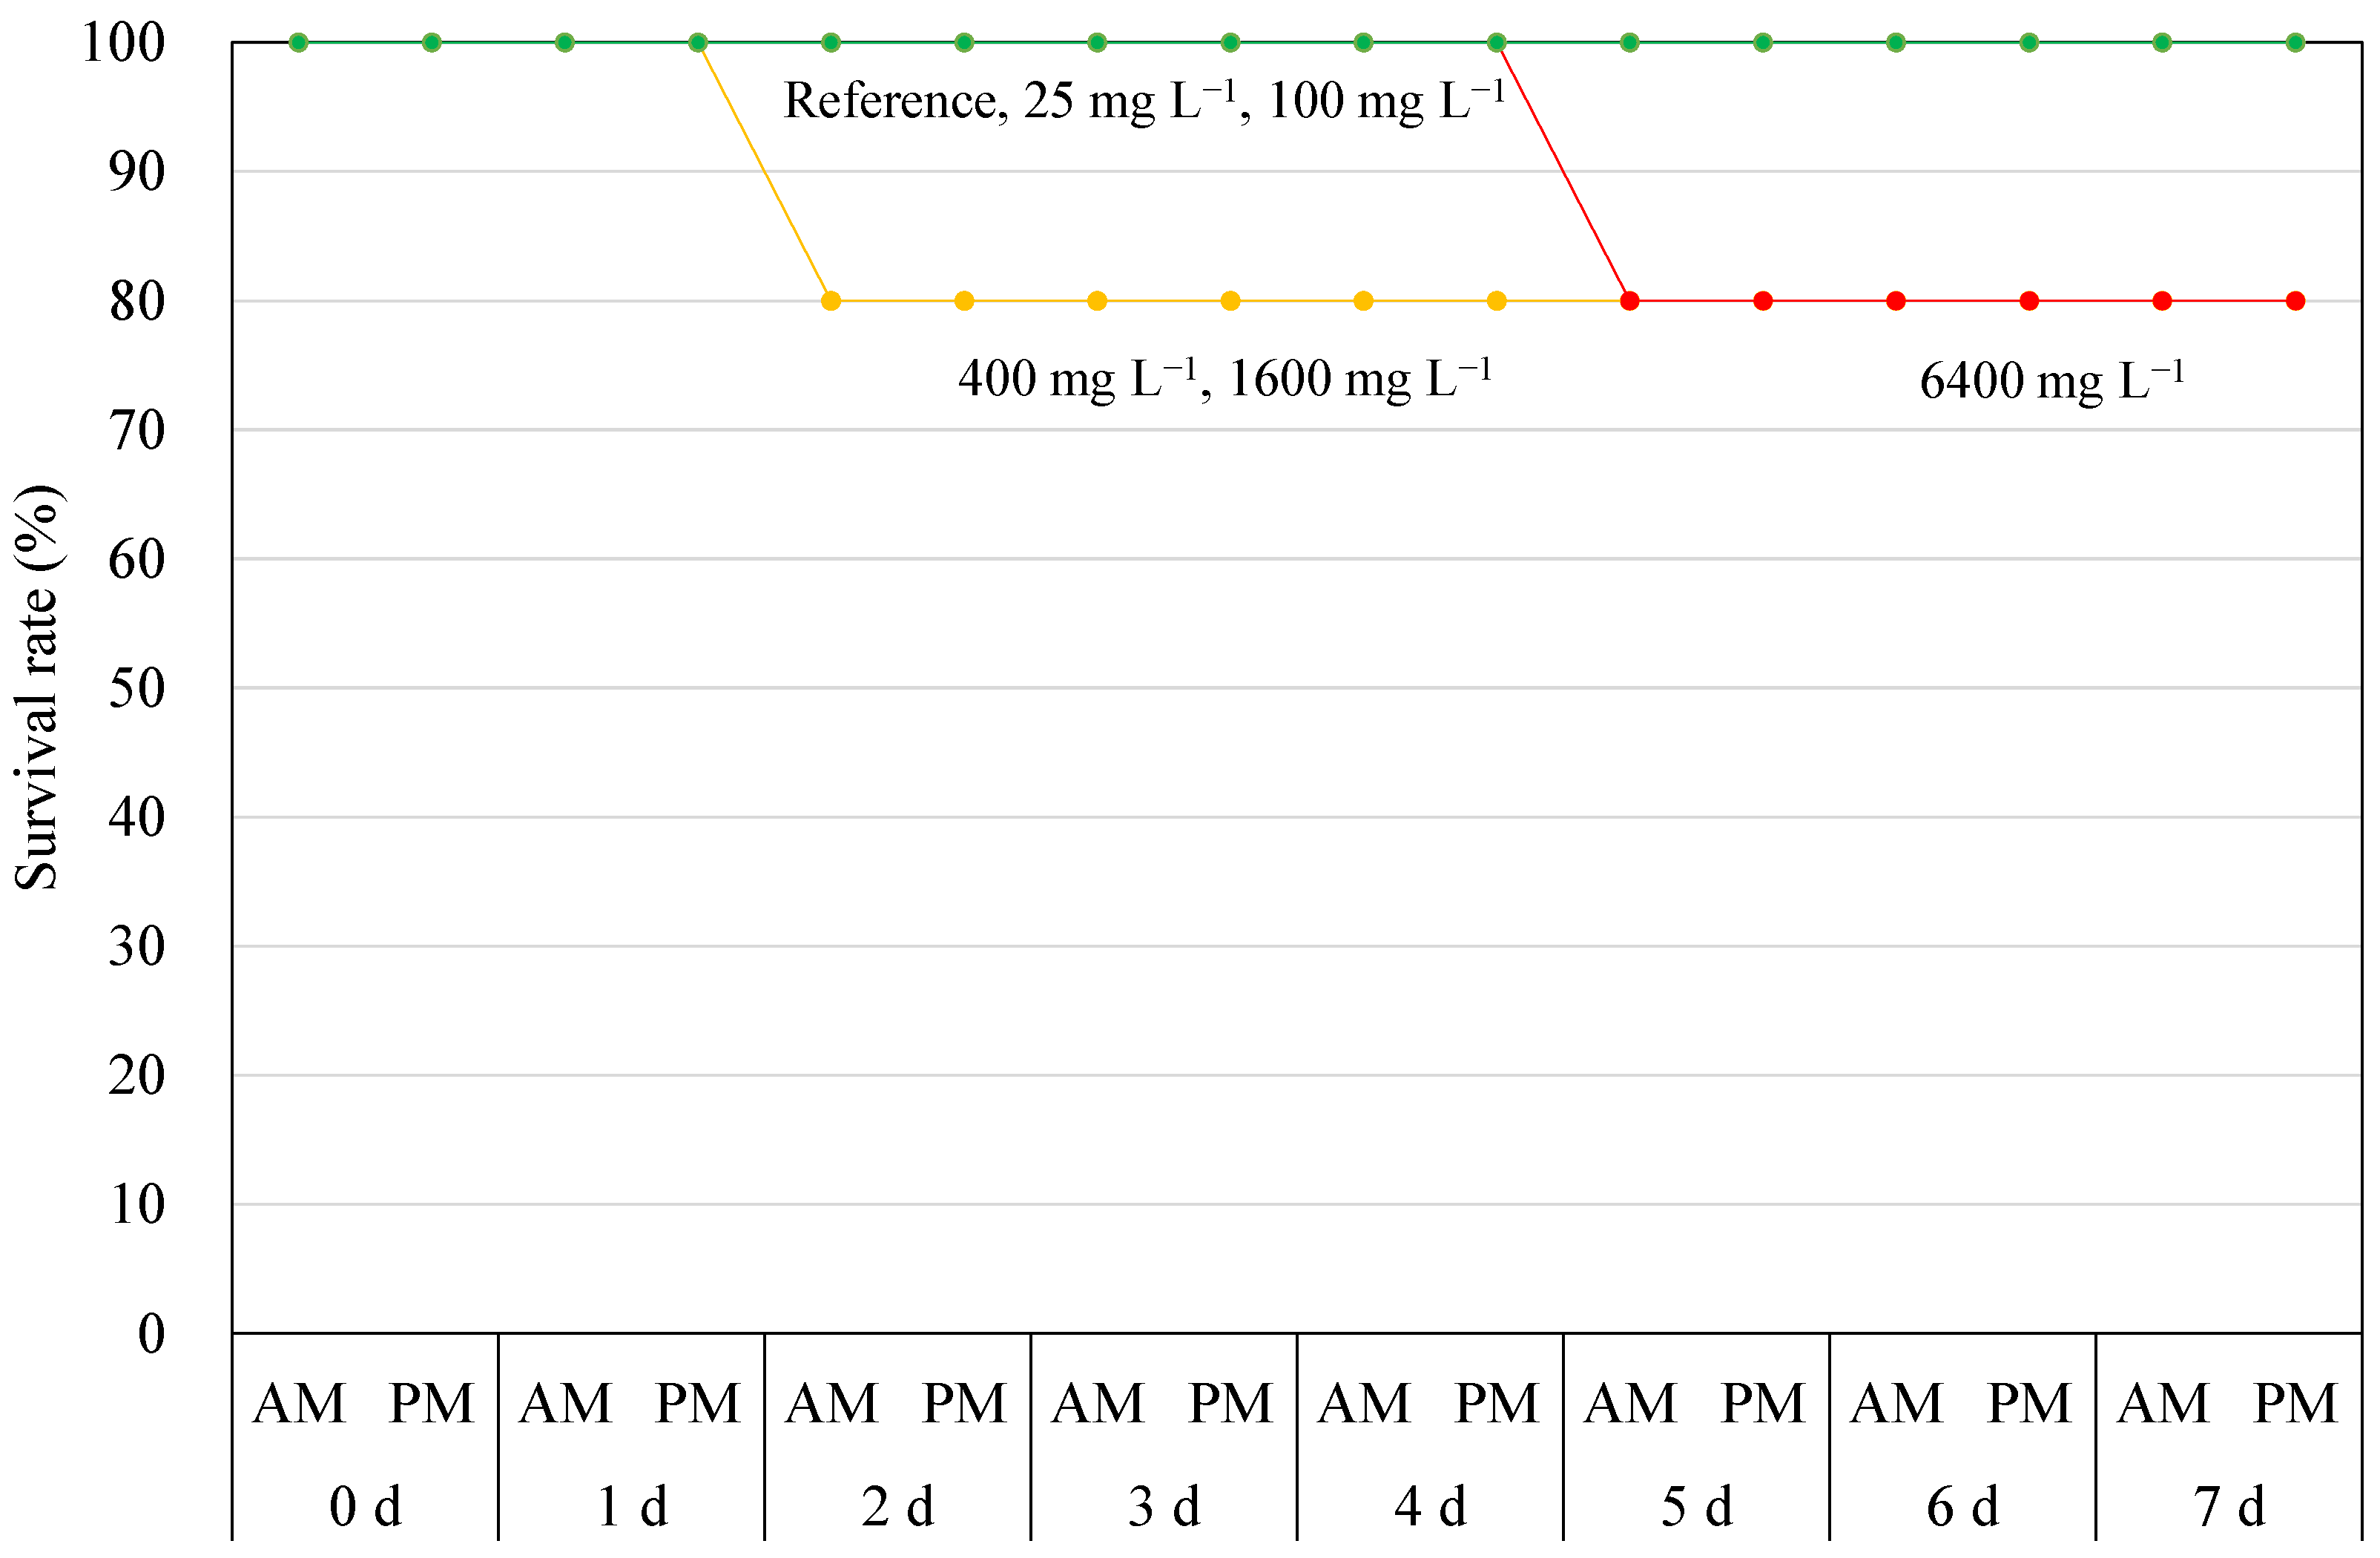
The results of the incubation experiment showed that the survival rate remained 100% until day 7 (end of the experiment) at 25 and 100 mg L−1 concentrations. At 400 and 1600 mg L−1 concentrations, one individual died on day 2 of the experiment, and the survival rate on day 7 was 80%. At 6400 mg L−1, one individual died on day 5 of the experiment, and the survival rate on day 7 was 80%. In contrast, in the control experiment, the survival rate remained at 100% until day 7 (Figure 8).
Water quality analysis showed little difference in water temperature (19.8–20.0 °C), pH (7.97–8.00), and DO (6.9–7.0 mg L−1) in any of the experimental beakers, compared with the control beaker containing the artificial seawater. In the systems where bivalves survived, NH4-N concentration ranged from 0.109 to 0.439 mg L−1, NO2-N concentration ranged from 0.004 to 0.013 mg L−1, NO3-N concentration ranged from the limit of quantification (0.005 mg L−1) to 0.021 mg L−1, and PO4-P concentration ranged from the limit of quantification (0.003 mg L−1) to 0.016 mg L−1. However, in the system in which the bivalves died, NH4-N and PO4-P concentrations increased to 2.29 and 0.142 mg L−1, respectively. The fluorine concentration was 1.3 mg L−1 at both 400 and 6400 mg L−1, which was higher than the lower limit of quantification (0.1 mg L−1). The particle size composition at 400 mg L−1 ranged from 0.564 to 159 μm, with a median particle size of 25.2 μm.
3.6. Exposure Experiments with Kaolin
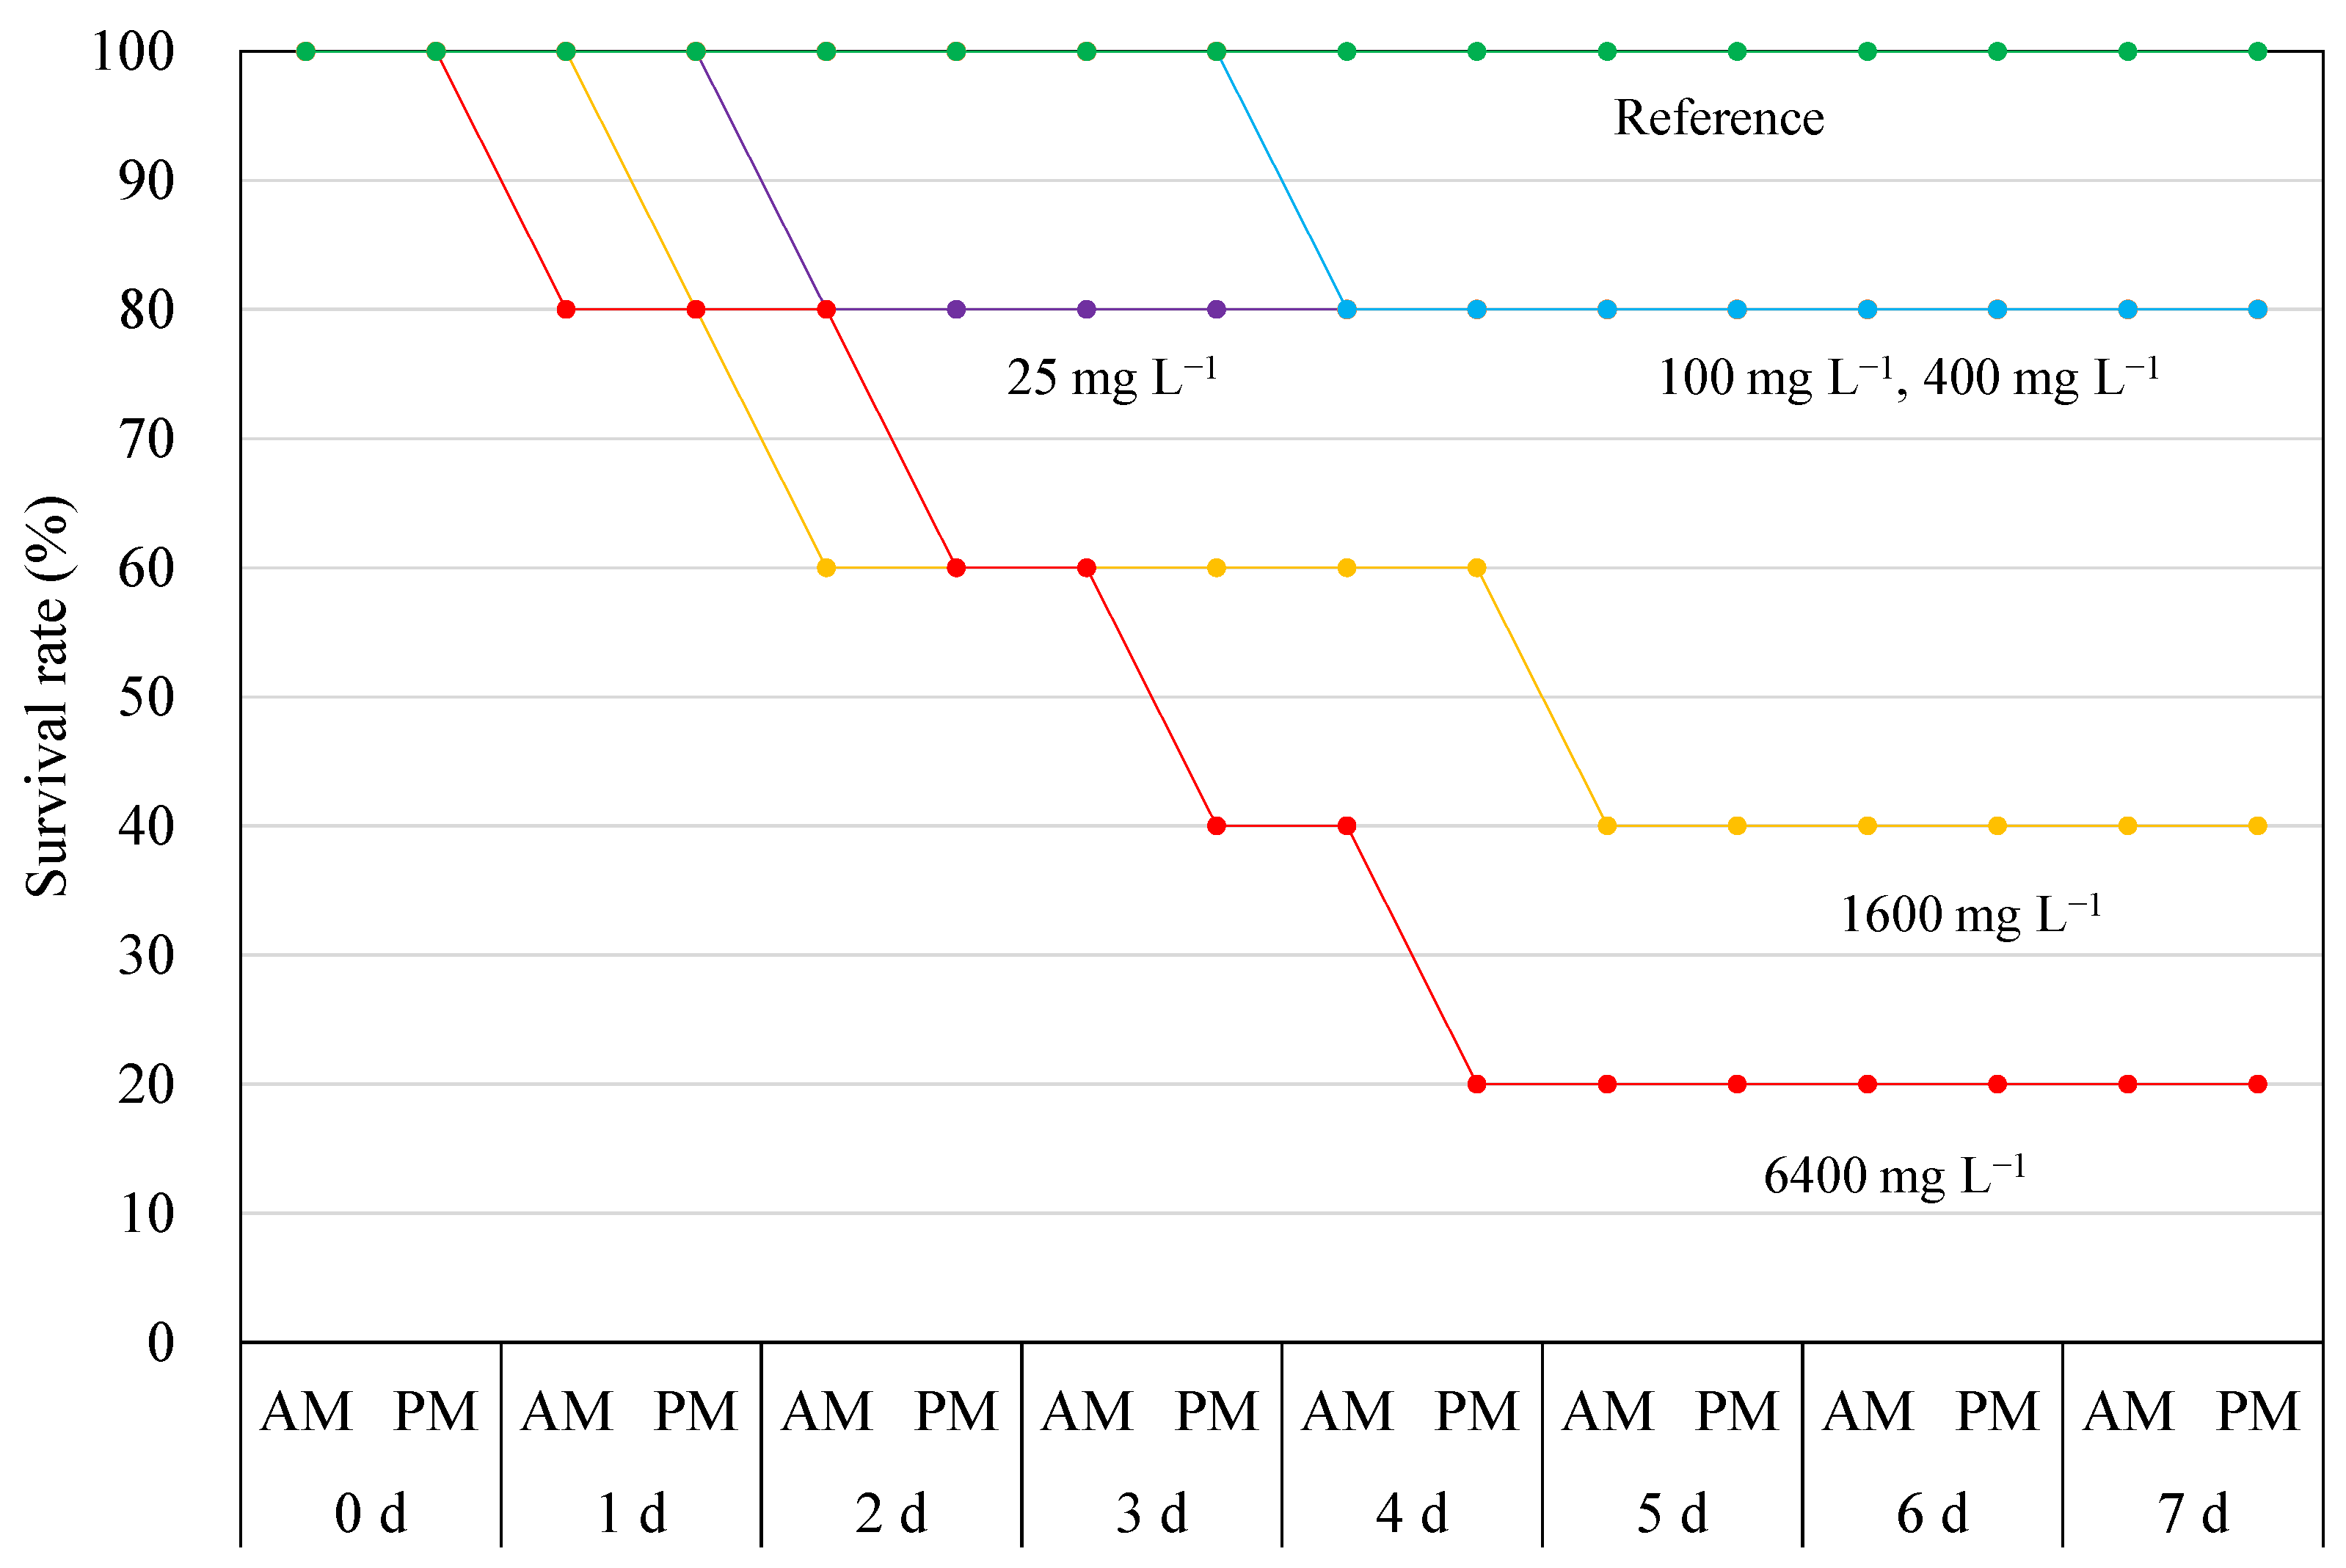
The results of the kaolin incubation experiment showed that one individual died on day 2 of incubation in the 25 mg L−1 experiment. One died on day 4 of incubation in the 100 and 400 mg L−1 experiments (Figure 9). At 1600 and 6400 mg L−1, death was confirmed on days 1 and 7; therefore, these bivalves had a survival rate of 40% and 20%, respectively.
Water quality analysis showed little difference in the water temperature (19.8–20.1 °C), pH (7.94–8.00), and DO (6.9–7.1 mg L−1) for all experimental beakers compared with that of the control beaker containing the artificial seawater. For the systems in which bivalves survived, NH4-N concentration ranged from 0.042 to 0.410 mg L−1, and concentrations of NO2-N, NO3-N, and PO4-P ranged from the limits of quantification (0.001, 0.005, and 0.003 mg L−1, respectively) to 0.013, 0.020, and 0.305 mg L−1, respectively. However, for the system in which the bivalves died, NH4-N and PO4-P concentrations increased to 5.78 and 0.397 mg L−1, respectively. In addition, fluorine concentration was elevated to 1.3 mg L−1 at 400 and 6400 mg L−1. Particle size composition ranged from 0.356 to 31.7 μm at 400 mg L−1, with a median particle size of 5.83 μm.
4. Discussion
4.1. Pumice Adsorption Rate Coefficient
The mechanism of PO4-P adsorption by pumice is discussed using the following two models. First, the adsorption rate of PO4-P by pumice stone is assumed to be a linear function of the PO4-P concentration; here, we refer to it as the single-layer model [16], and it is expressed by the following equation:
where V is the volume of the solvent used in the adsorption experiment (L), C is the PO4-P concentration (mg L−1), t is the elapsed time (min), k is the adsorption rate constant (L g−1 min−1), Ceq is the PO4-P concentration at equilibrium (mg L−1), and M is the amount of pumice (g) used in the experiment. Considering Cini as the PO4-P concentration at the beginning of the experiment, the time series of the PO4-P concentration is expressed as follows:
Figure 10 compares the results of the adsorption experiments with the values calculated using Equation (5), assuming Ceq = 0.060 (mg L−1) and k = 2.0 × 10⁻³ (L g−1 min−1), which was estimated by the decreasing rate of PO4-P concentration at the beginning of the experiment. The results from the single-layer model did not reasonably reproduce the experiment, and the experimental results showed a slower but continuous decrease in the PO4-P concentration.
Froelich (1988) interpreted adsorption kinetics as a two-step interaction. The first stage was the fast adsorption of PO4-P on the surface of the outer adsorbent, and the second stage was the slow diffusion of the adsorbed PO4-P into the inner adsorbent. As a second consideration, the adsorption phase is assumed to be composed of two layers, each of which conducts mass transfer between adjacent layers. The mass transfer in each layer is assumed to follow the given equations (hereinafter referred to as the double-layer model):
where k0 and k1 are the adsorption rate constants from the solvent layer to the first layer and from the first layer to the second layer, respectively (L min−1); C1 and C2 are the PO4-P concentrations in the first and second layers, respectively (mg L−1); and v1 and v2 are the relative and virtual PO4-P adsorption capacities in the first and second layers relative to the solvent layer, respectively (L).
Here, the sum of the squared deviations of the PO4-P concentration C in the solvent obtained from the experiment and model calculations was used as the evaluation function. The following values were obtained as parameters to minimize it: k0 = 2.22 × 10⁻² (L min−1), k1 = 2.66 × 10⁻³ (L min−1), v = 1.00 (L), v1 = 2.53 × 10⁻¹ (L), and v2 = 1.25 (L), as shown by the solid lines in Figure 10. Compared with that result from using the single-layer model, the double-layer model showed a significant improvement in the reproducibility of the experimental results. In the case of PO4-P adsorption by pumice, the adsorption reaction may have proceeded via a combination of two-step adsorption and diffusion processes, suggesting that this phenomenon is unique to porous media.
In the present case, the ratio of v1 to v2 was approximately 17:83, indicating that fast adsorption occurred on 17% of the pumice and that slow adsorption occurred on the remaining 83%, providing insight into the hypothetical internal structure of pumice adsorption. Moreover, these findings are essential for practical use because they are related to the time constants of adsorption kinetics.
4.2. Using Pumice Stone as a Sand-Capping Material
High-quality sand has been considered a material for controlling DO consumption and nutrient release from organic sediments. These materials have a higher density than organic sediments, making it challenging to cover the organic sediment surface with sand. However, the pumice stone studied here had a low density. Therefore, it was assumed to be easier to cover the sediment surface with pumice stone than with other capping materials during on-site construction. In the laboratory experiment, the crushed pumice was not buried in the organic sediment, and it was relatively easy to apply for covering the sediment surface.
4.3. Gill Fouling Conditions
Kaolin particles were one order of magnitude smaller than crushed pumice particles, and the survival rate of bivalves under suspended kaolin conditions was lower than that using crushed pumice (Figure 8 and Figure 9). After the experiment, the shells were peeled, and the soft body parts were observed. Visual inspection revealed that the status of gill fouling was different between surviving and dying individuals. This suggests that the death of bivalves was induced not by the chemical properties of crushed pumice and kaolin but by physical properties such as SS concentration and particle size. Based on these results, it is expected that a high concentration of SS, especially when the suspended particles are smaller, is likely to have adverse effects on benthic organisms, such as the adhesion of suspended particles to gills.
Sagara [17] (pp. 104–105) stated that “when the concentration of suspended sediment is 0.5%, no abnormalities appear after 2–3 months of exposure.” This is an SS level almost equivalent to the highest concentration (6400 mg L−1) in our experiment. However, the particle size of the “suspended soil” used in his experiment may have been larger than that of the particles used in our study. Chiba and Oshima [18] also determined filtration rates for bivalves and mussels using bentonite (particle size range 2–30 μm) at concentrations of up to 1000 mg L−1. However, mortality, particularly SS-level mortality, remained unexplored in previous investigations. According to Kishioka [19], the addition of kaolin promotes the growth of bivalves, at least in the initial period of bottoming. Thus, there are still many unanswered questions regarding the effects of suspended particles, which highlights the need for further experimental research.
4.4. Effects of Ammonia on Bivalve Exposure Experiments
In the exposure experiments, a control experiment was set up to study the effects of ammonia as a trigger for bivalve mortality. Through management, the experimental beakers with crushed pumice stones maintained levels of NH4-N below the aquaculture water standard (0.89 mg L−1; pH = 8.0; water temperature, 20 °C; and salinity, 30 psu), and little NO2-N and NO3-N were detected. Therefore, we concluded that NH4-N was not a trigger for bivalve mortality during the experiment, even when bivalves died in the presence of the suspension. Although 1.3 mg L−1 fluorine was detected, its adverse effects were considered negligible.
5. Conclusions
Owing to the challenges posed by ejected pumice into seawater from the August 2021 submarine volcanic eruption at Fukutoku Okanoba in the Ogasawara Islands, which generated enormous pumice rafts and seriously affected ship navigation and fishery operations, this study examined pumice for use as a sand-capping material and explored means of managing its disposal. It was shown that pumice could be effectively used as a sand-capping material by reducing its particle size and allowing it to sink to the seafloor. The chemical properties of the pumice used in this study were considered to have no adverse effects on organisms. However, given that some pumice stones are strongly acidic, further individual studies on their chemical properties are required to devise means of their efficient application. Moreover, it was found that abnormal suspension concentrations exceeding 1000 mg L−1 may cause gill contamination of benthic organisms; therefore, caution should be exercised when introducing pumice into the field. Our study results also suggested that sea-surface-bound drifting pumice stone may cause limited light penetration into the sea, thereby potentially affecting phytoplankton photosynthesis. Additionally, the results indicated that pumice would affect benthic organisms by its settlement and deposition on the seafloor as fine particles owing to long-term retention at the sea surface. This study presents important findings for the possible application and formulation of countermeasures against drifting pumice.
Author Contributions
Conceptualization, T.I.; methodology, T.I.; software, I.F.; validation, T.I. and I.F.; formal analysis, T.I.; investigation, T.I. and I.F.; resources, T.I. and I.F.; data curation, T.I.; writing—original draft preparation, T.I.; writing—review and editing, T.I.; visualization, I.F.; supervision, T.I.; project administration, T.I.; Conceptualization, Methodology, Investigation, Data curation, Writing—Original draft preparation, Writing—Reviewing and Editing, Visualization, Investigation, Supervision, Project administration, T.I.; Software, Visualization, Investigation, Validation, I.F. All authors have read and agreed to the published version of the manuscript.
Funding
This research received no external funding.
Data Availability Statement
All data in this manuscript have been uploaded to “Inoue, Tetsunori (2023), Laboratory experiments using crushed pumice, Mendeley Data, V1, doi: 10.17632/6xwtyt72tw.1.”
Acknowledgments
The authors are grateful to Yuki Hagino, Tsuyoshi Takafushi, and the staff of the Ministry of Land, Infrastructure, Transport, and Tourism, Japan, for their technical help.
Conflicts of Interest
The authors declare no conflict of interest.
Appendix A

Table A1.
Analytical results of sediment quality in the sedimentary oxygen demand and nutrient release experiment.
Table A1.
Analytical results of sediment quality in the sedimentary oxygen demand and nutrient release experiment.
| CORE | Ignition Loss (%) | Total Organic Carbon (mg g−1) | Chemical Oxygen Demand (mg g−1) | Total Sulfide (mg g−1) | Total Nitrogen (mg g−1) | Total Phosphorus (mg g−1) | Total Iron (mg g−1) | Total Manganese (mg g−1) |
|---|---|---|---|---|---|---|---|---|
| CORE1 | 15.5 | 18.2 | 10.6 | 0.42 | 2110 | 500 | 39,300 | 830 |
| CORE2 | 14.0 | 12.1 | 7.0 | 0.20 | 1480 | 400 | 26,800 | 560 |
| CORE3 | 14.3 | 1.97 | 2.1 | 0.04 | 470 | 240 | 9200 | 200 |
References
- Maeno, F.; Kaneko, T.; Ichihara, M.; Suzuki, Y.; Yasuda, A.; Nishida, K.; Ohminato, T. First Timeseries Record of a Large-Scale Silicic Shallow-Sea Phreatomagmatic Eruption; Research Square: Durham, NC, USA, 2022; pp. 1–15. [Google Scholar] [CrossRef]
- Ohno, Y.; Iguchi, A.; Ijima, M.; Yasumoto, K.; Suzuki, A. Coastal ecological impacts from pumice rafts. Sci. Rep. 2022, 12, 11187. [Google Scholar] [CrossRef] [PubMed]
- Honma, F. A geological account of Iriomote Island, Ryukyu Archipelago. Earth 1925, 4, 290–309. [Google Scholar]
- Suwa, A. Submarine eruption of Myojin Reef. Chigaku Zasshi 1953, 62, 100–110. [Google Scholar] [CrossRef] [PubMed]
- Kato, Y. Gray pumice drifted to the Ryukyu Islands from the site of Fukutokuoka. Volcanoes 1988, 2, 21–30. [Google Scholar]
- Nakano, T.; Kawabe, T. Pumice from Iriomote Island, Ryukyu Islands, 1991. Volcanoes 1992, 37, 95–98. [Google Scholar]
- Carey, R.; Soule, S.A.; Manga, M.; White, J.D.L.; McPhie, J.; Wysoczanski, R.; Jutzeler, M.; Tani, K.; Yoerger, D.; Fornari, D.; et al. The largest deep-ocean silicic volcanic eruption of the past century. Sci. Adv. 2018, 4, e1701121. [Google Scholar] [CrossRef] [PubMed] [Green Version]
- Risso, C.; Scasso, R.A.; Aparicio, A. Presence of large pumice blocks on Tierra del Fuego and South Shetland Islands shorelines, from 1962 South Sandwich Islands eruption. Marine Geol. 2022, 186, 413–422. [Google Scholar] [CrossRef]
- Bryan, S.E.; Cook, A.G.; Evans, J.P.; Hebden, K.; Hurrey, L.; Colls, P.; Jell, J.S.; Weatherley, D.; Firn, J. Rapid, long-distance dispersal by pumice rafting. PLoS ONE 2012, 7, e40583. [Google Scholar] [CrossRef] [PubMed] [Green Version]
- Thomas, N.; Jaupart, C.; Vergniolle, S. On the vesicularity of pumice. JGR Sol. Earth 1994, 99, 15633–15644. [Google Scholar] [CrossRef]
- Inoue, T.; Nakamura, Y. Effects of hydrodynamic conditions on sediment oxygen demand: Experimental study based on three methods. J. Environ. Eng. 2009, 135, 1161–1170. [Google Scholar] [CrossRef]
- Inoue, T.; Hagino, Y. Effects of three iron material treatments on hydrogen sulfide release from anoxic sediments. Wat. Sci. Tech. 2022, 85, 305–318. [Google Scholar] [CrossRef] [PubMed]
- Hydes, D.J.; Aoyama, M.; Aminot, A.; Bakker, K.; Becker, S.; Coverly, S.; Daniel, A.; Dickson, A.G.; Grosso, O.; Kerouel, R.; et al. Determination of dissolved nutrients (N, P, Si) in seawater with high precision and inter-comparability using gas-segmented continuous flow analysers. In The GO-SHIP Repeat Hydrography Manual: A Collection of Expert Reports and Guidelines; IOCCP Report No 14; ICPO Publication Series No. 134, version 1; UNESCO/IOC: Paris, France, 2010; Available online: https://archimer.ifremer.fr/doc/00020/13141/ (accessed on 28 February 2023).
- Inoue, T.; Nakamura, Y. Response of benthic soluble reactive phosphorus transfer rates to step changes in flow velocity. J. Soil. Sed. 2012, 12, 15591567. [Google Scholar] [CrossRef] [Green Version]
- Toba, M.; Miyama, Y. Gonadal development and spawning induction in artificially conditioned manila clams Ruditapes philippinarum. Nippon. Suisan Gakkaishi 1991, 57, 1269–1275. [Google Scholar] [CrossRef]
- Inoue, T.; Sugahara, S.; Seike, Y.; Kamiya, H.; Nakamura, Y. Short-term variation in benthic phosphorus transfer due to discontinuous aeration/oxygenation operation. Limnology 2017, 18, 195–207. [Google Scholar] [CrossRef] [Green Version]
- Sagara, J. Physiological ecology of the bivalve, Asari bivalve. Oceanog. Biol. 1981, 13, 102–105. [Google Scholar]
- Chiba, K.; Oshima, Y. Effect of turbidity on water filtration and feeding of marine bivalves, mainly bivalves. J. Jap. Soc. Fish. Sci. 1953, 23, 348–353. [Google Scholar] [CrossRef] [Green Version]
- Kishioka, M. Growth-promoting effect of kaolin in the benthic juveniles of the bivalve, Plecoglossus altivelis altivelis. Bull. Yamaguchi Prefect. Fish. Res. Cent. 2015, 12, 25–28. [Google Scholar]
Figure 1.
Schematic diagram of the dissolved oxygen consumption and nutrient release experiments.

Figure 2.
Exposure experiment setup with a healthy bivalve resting on a plastic mesh in the beaker.
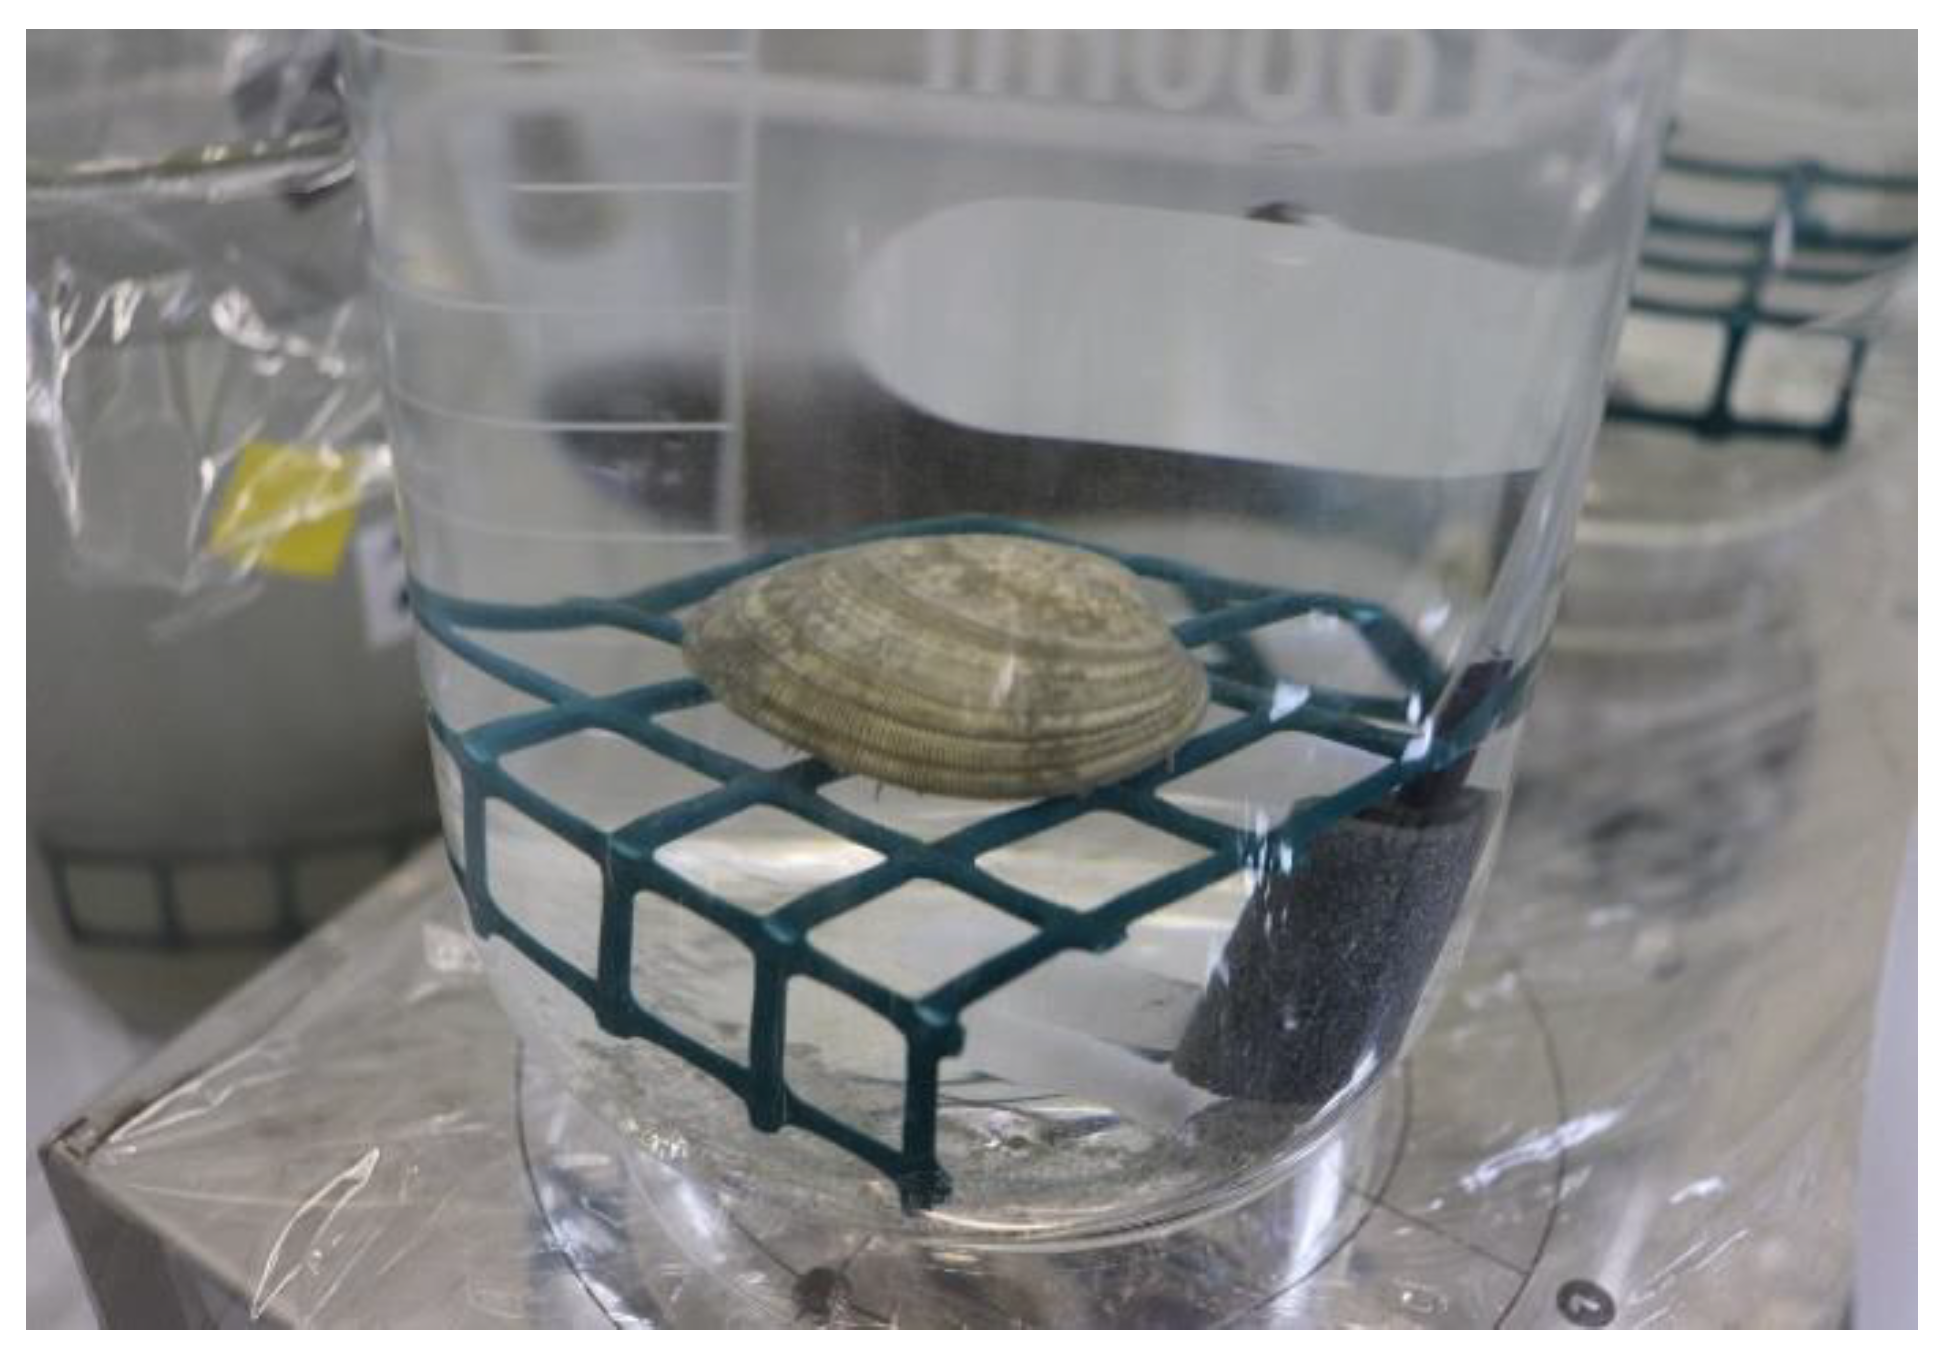
Figure 3.
Temporal variations in the dissolved oxygen concentration in the overlying water.

Figure 4.
Calculated sedimentary oxygen demand in oxygen consumption experiment.

Figure 5.
Temporal variations in nutrient concentrations in the overlying water: (a) PO4-P and (b) NH4-N.
Figure 5.
Temporal variations in nutrient concentrations in the overlying water: (a) PO4-P and (b) NH4-N.
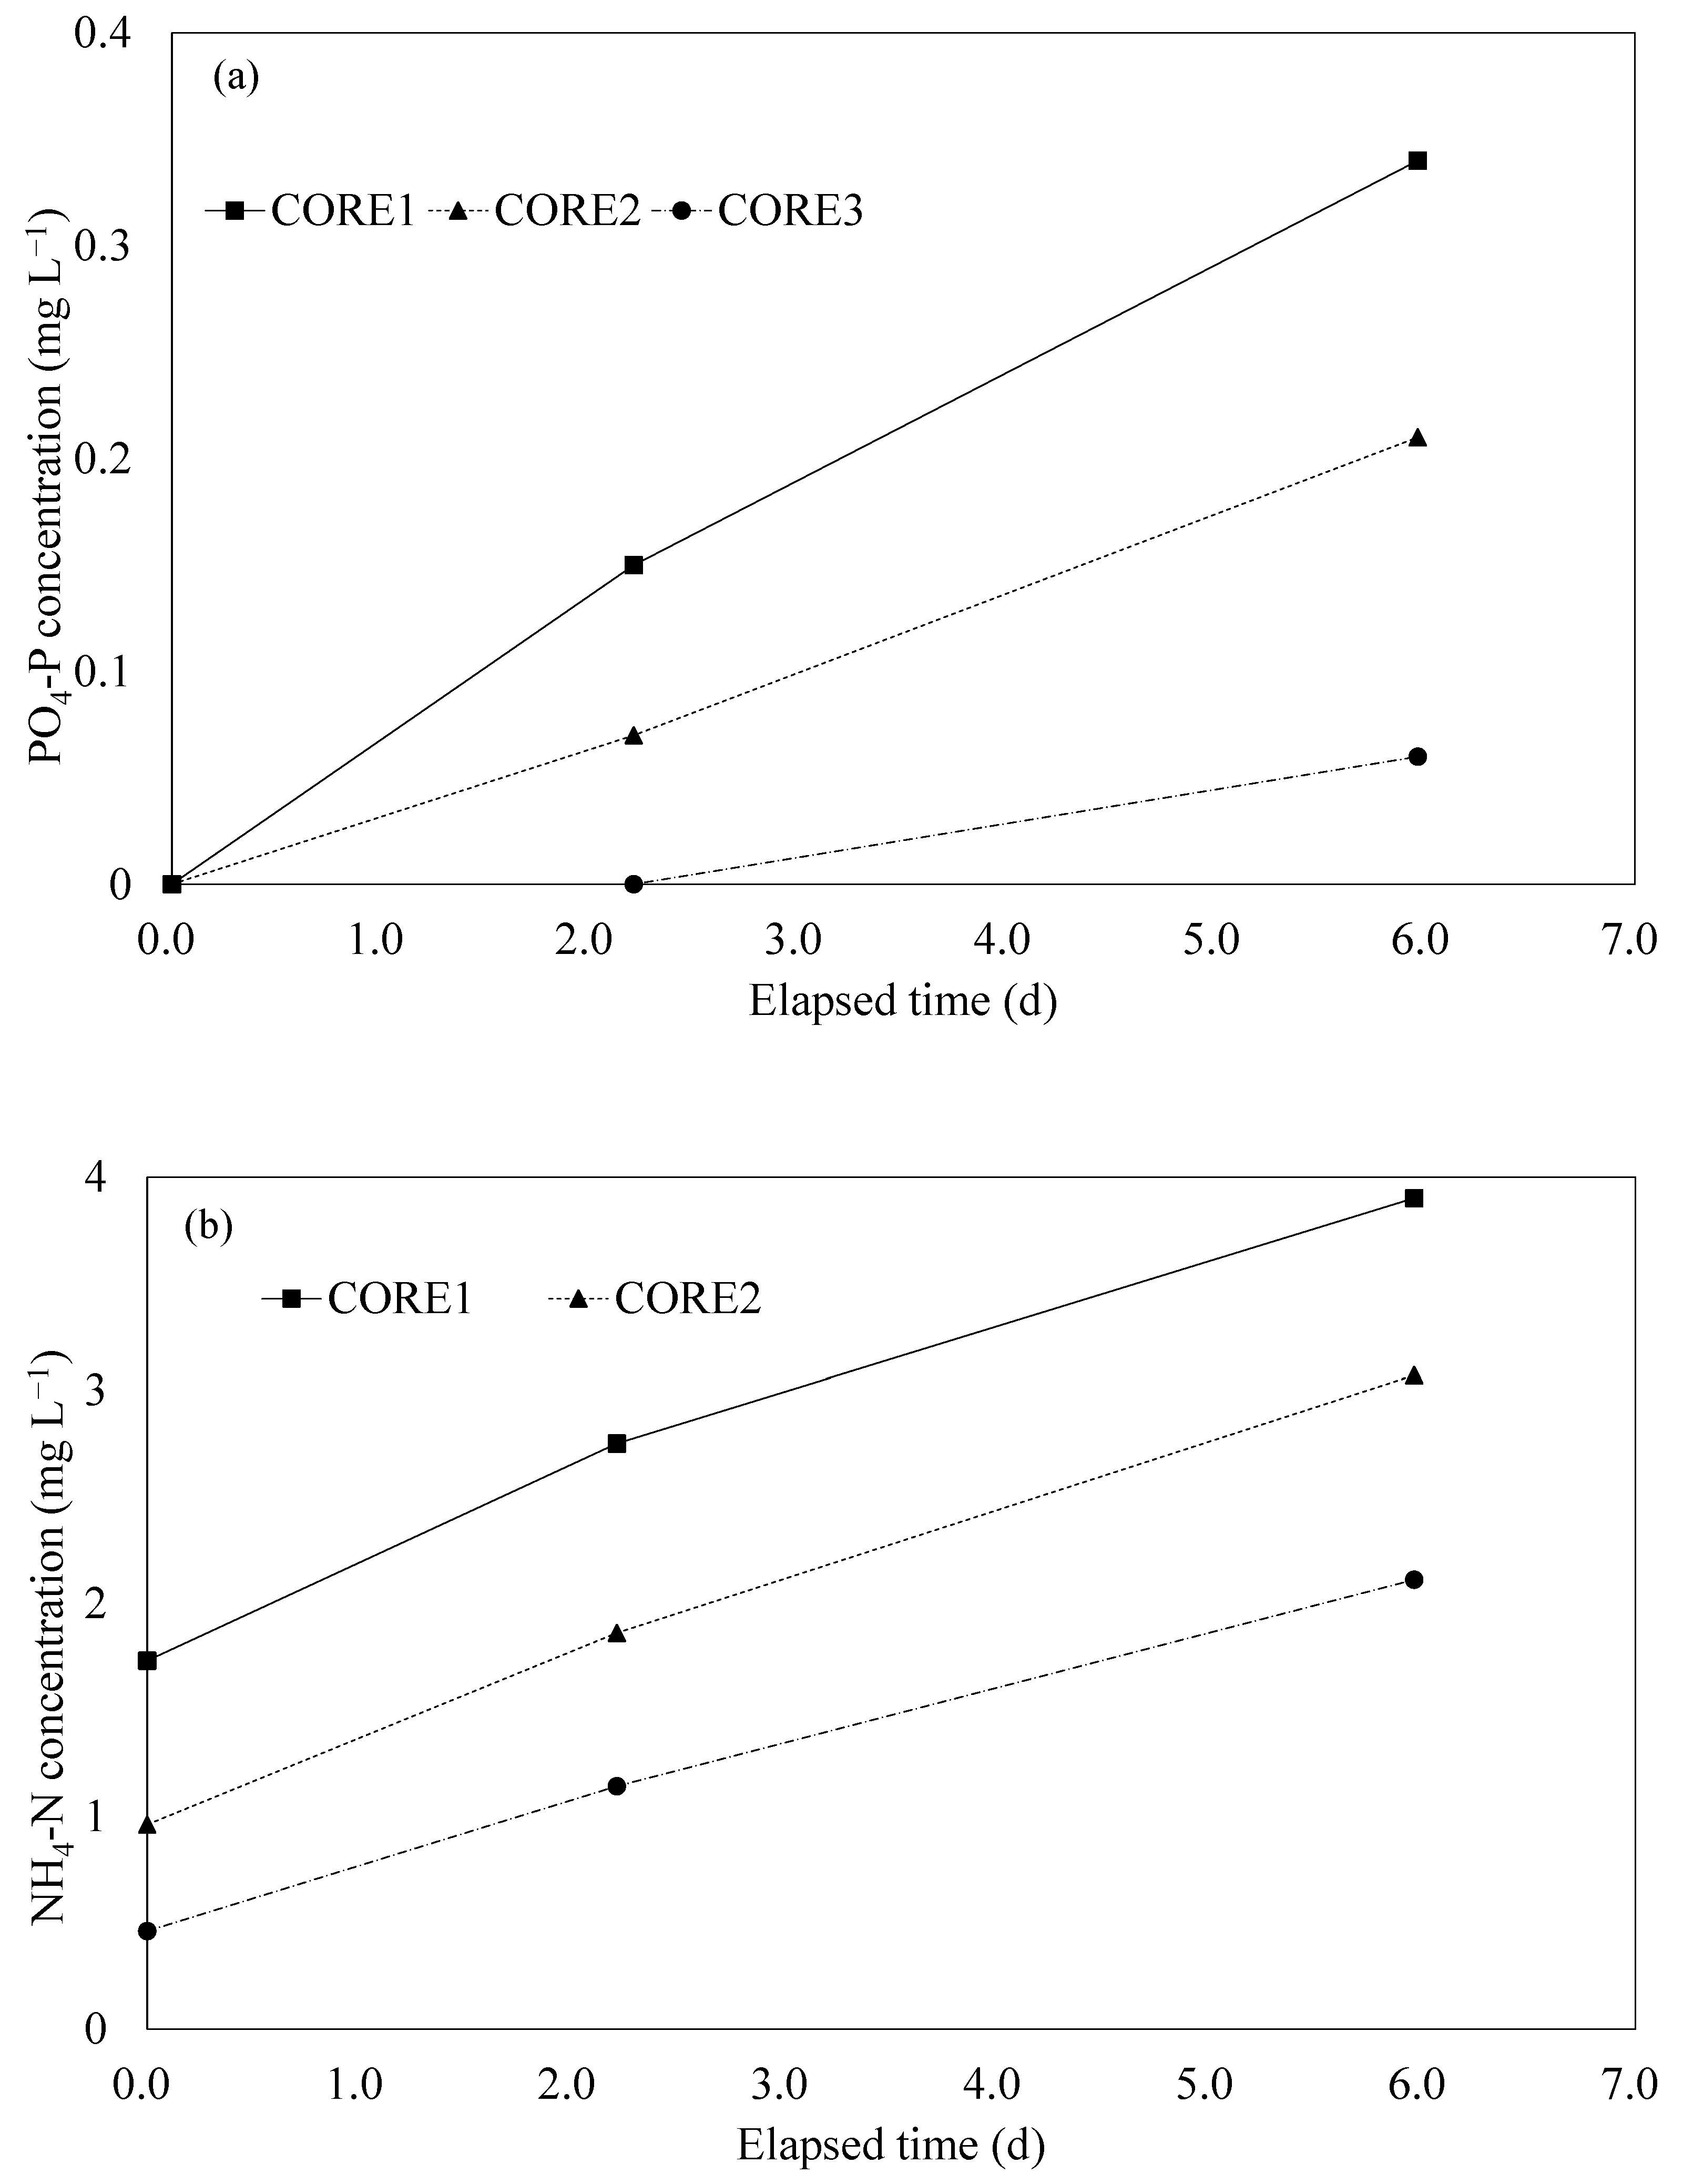
Figure 6.
Calculated nutrient release rate. (a) PO4-P. (b) NH4-N.
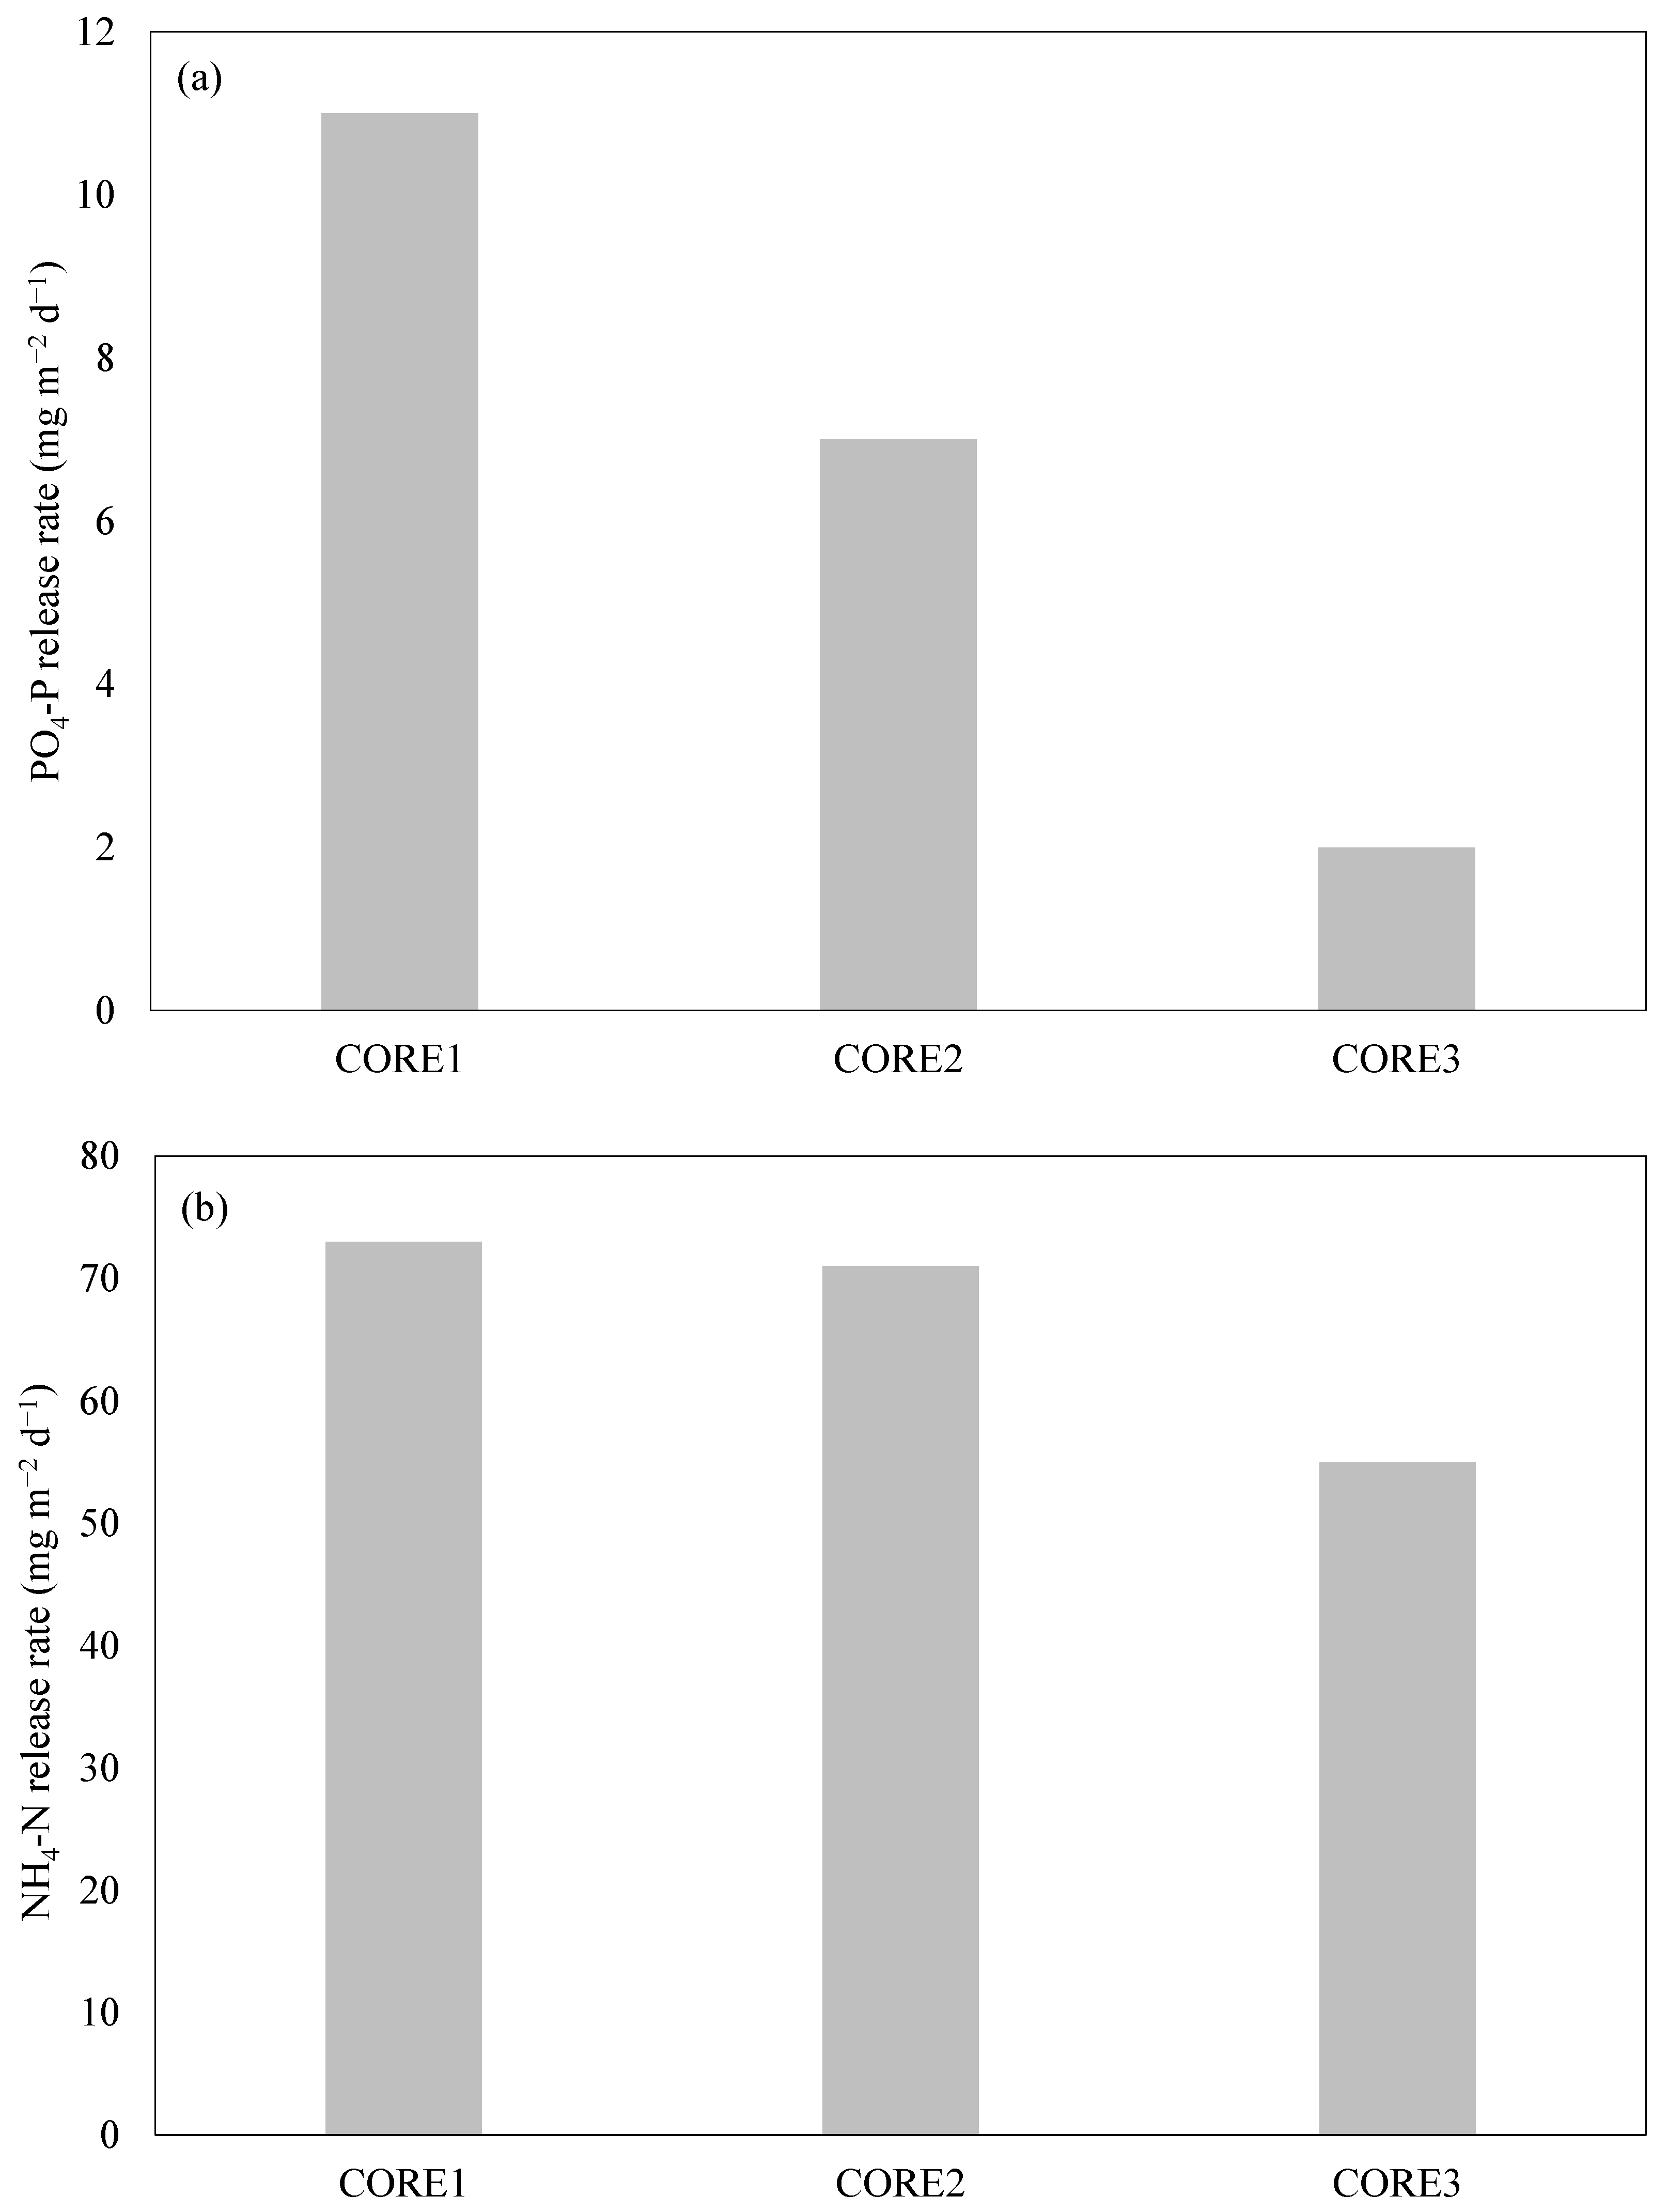
Figure 7.
Temporal variation in nutrient concentration during nutrient adsorption experiments.
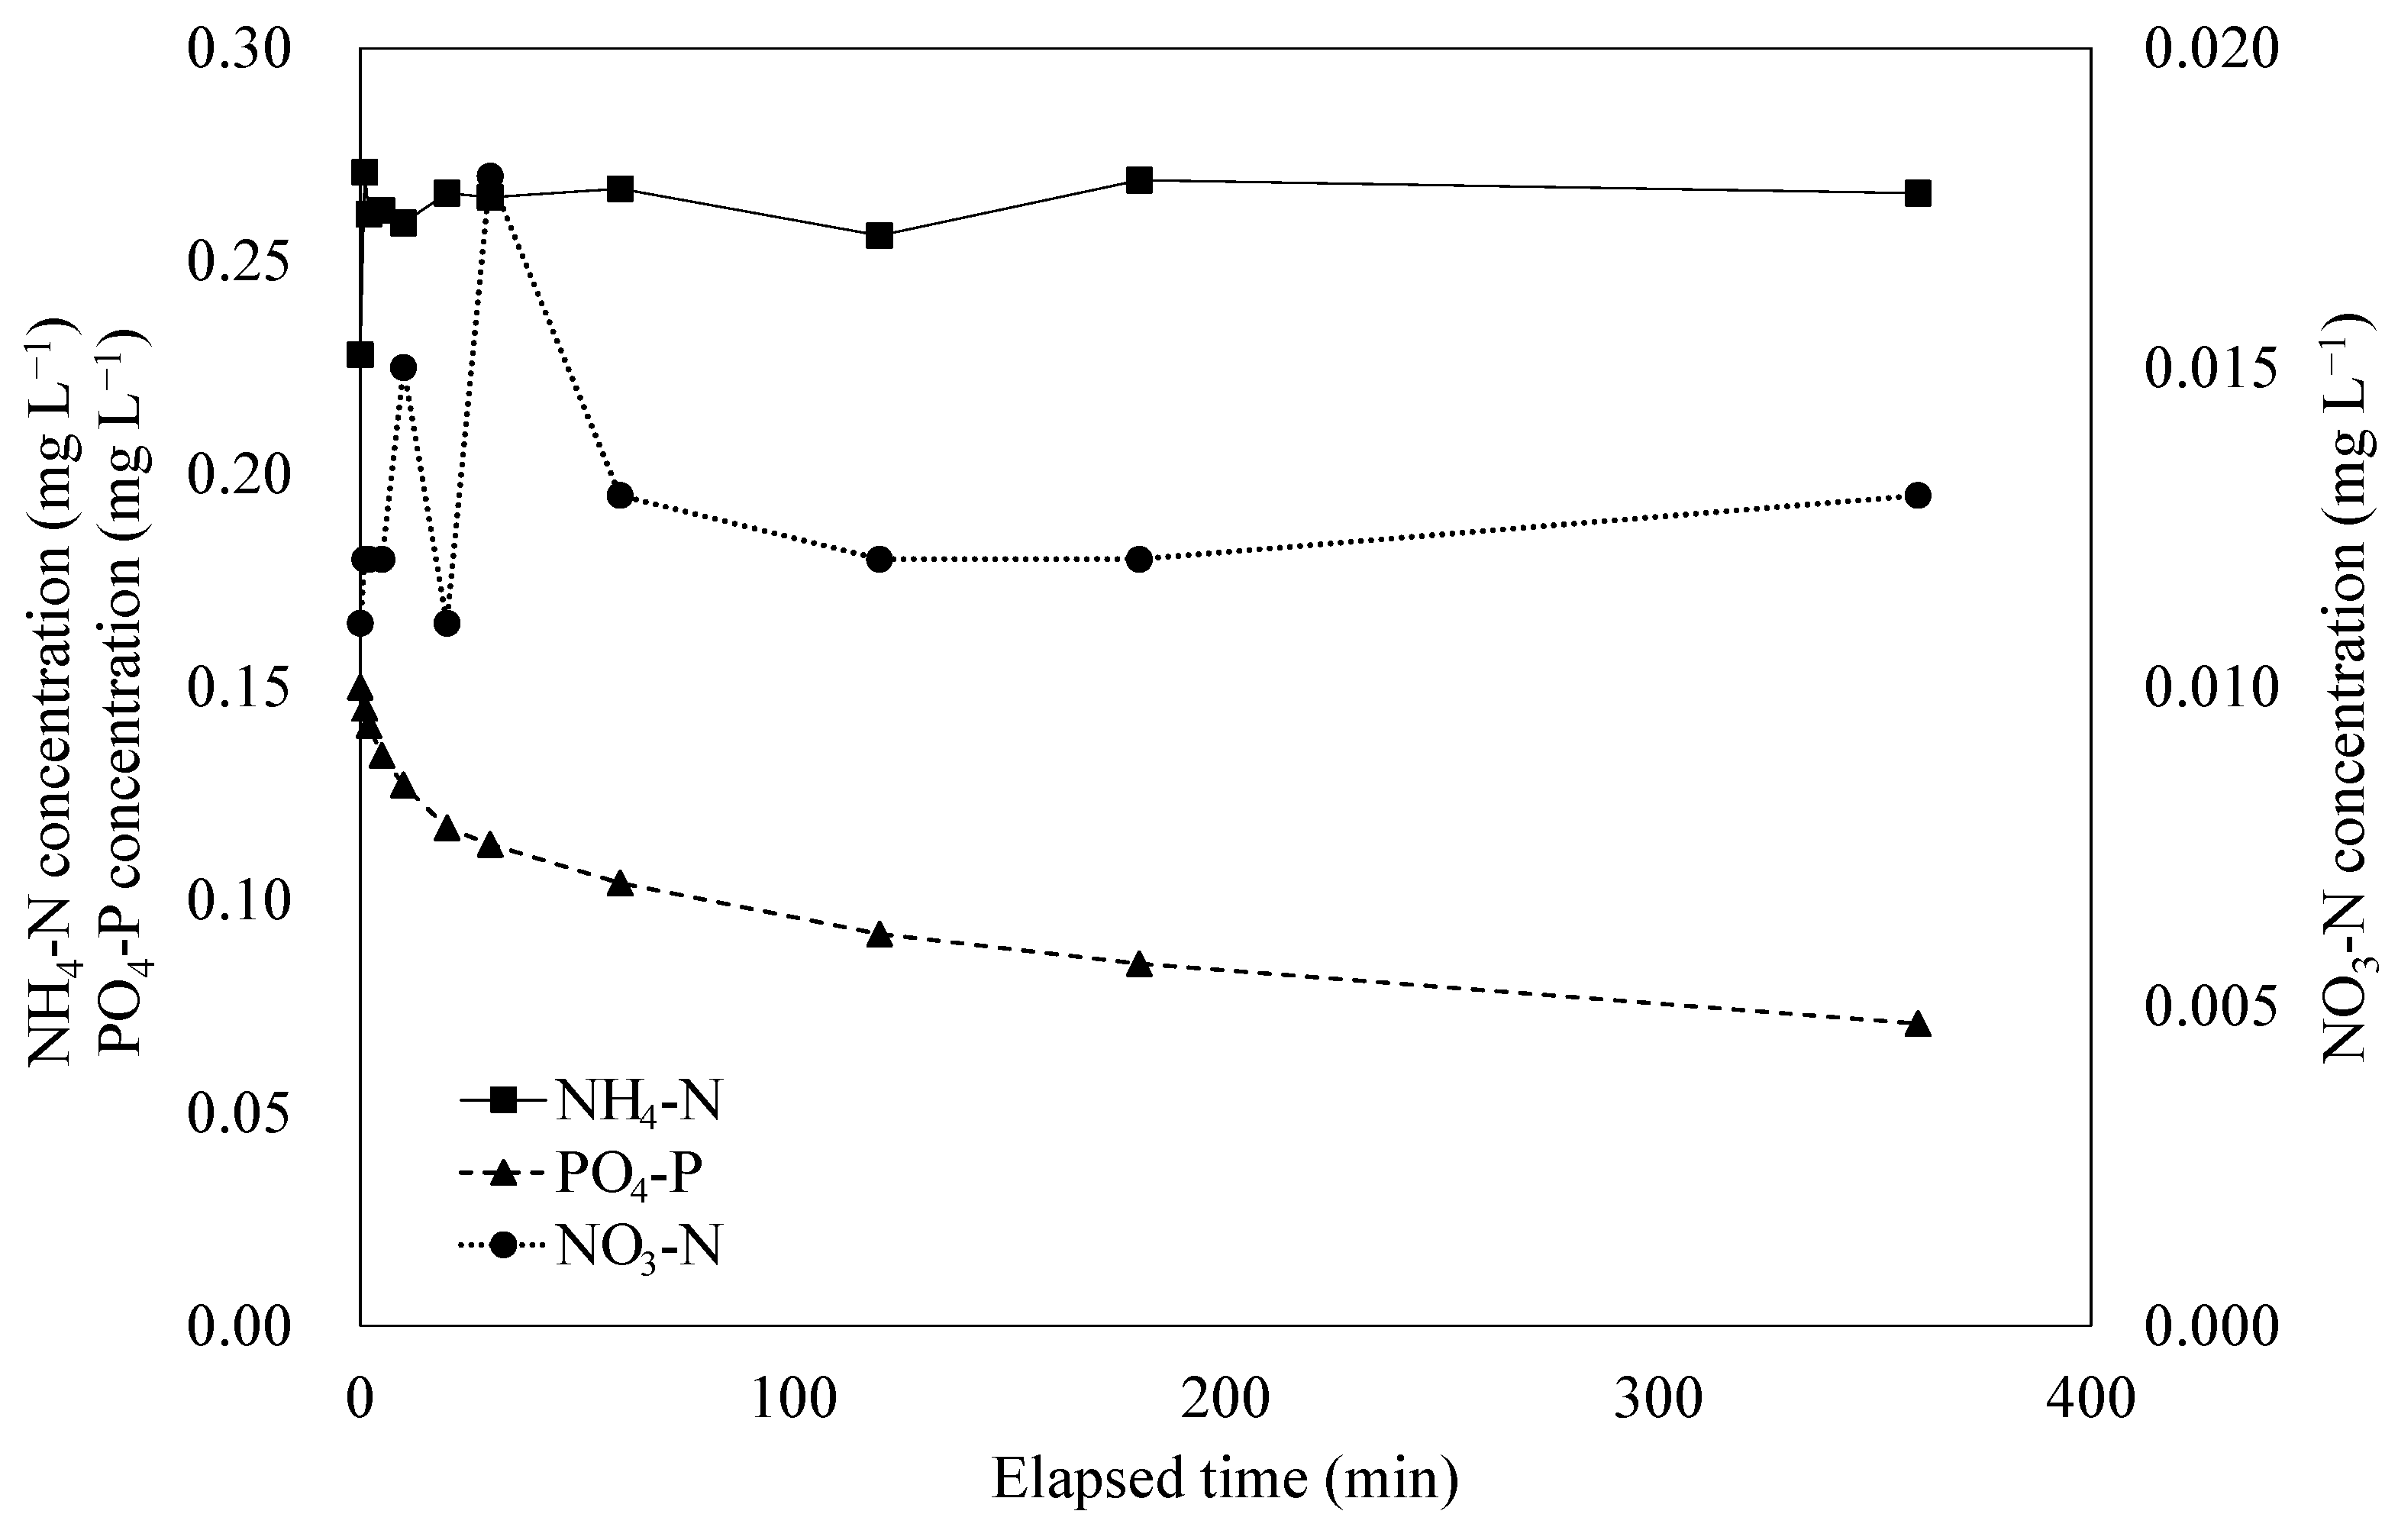
Figure 8.
Survival rate of bivalves in the exposure experiment. In all experiments, n = 5.

Figure 9.
Survival rate of bivalves in the exposure experiment using kaolin.

Figure 10.
Comparison of results of PO4-P adsorption experiments with predictions based on Equation (4) and (5)–(7).
Figure 10.
Comparison of results of PO4-P adsorption experiments with predictions based on Equation (4) and (5)–(7).
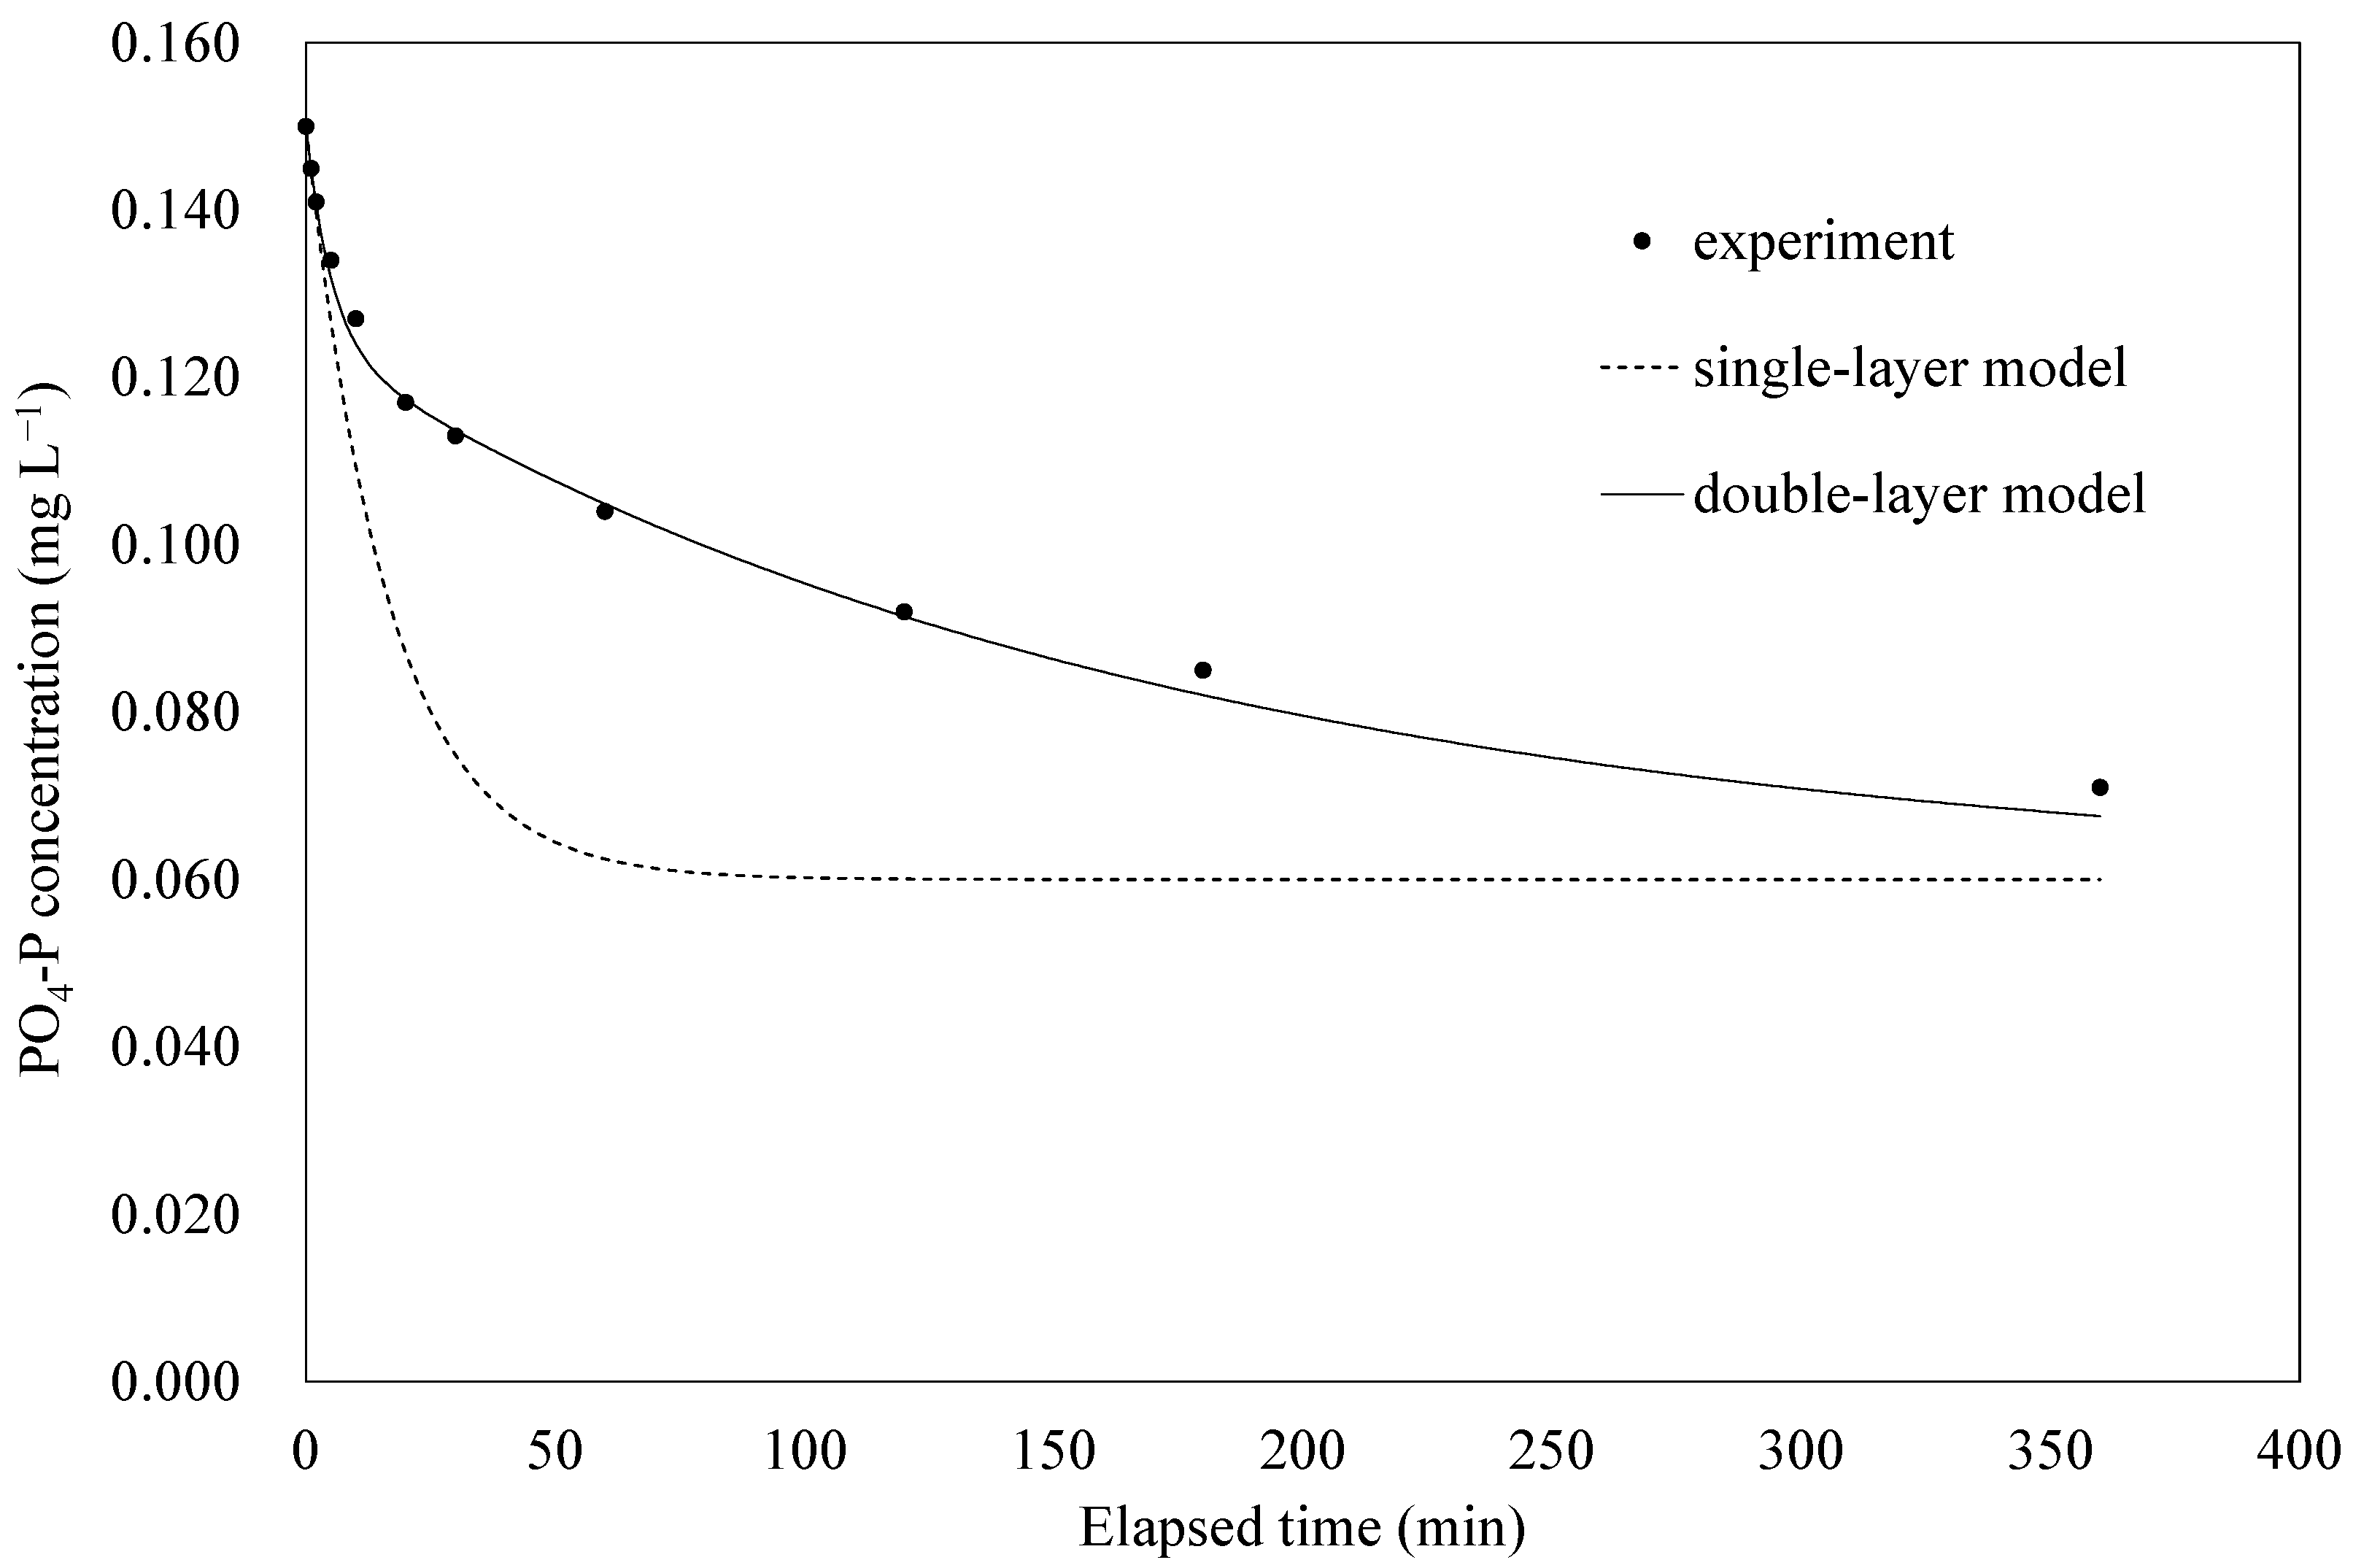
Table 1.
List of experimental conditions in the exposure experiment.
| Suspended Material | Number of Bivalves | Suspension Concentration (mg L−1) | Number of Beakers Prepared |
|---|---|---|---|
| Crushed pumice | 1 | 25 | 5 |
| 1 | 100 | 5 | |
| 1 | 400 | 5 | |
| 1 | 1600 | 5 | |
| 1 | 6400 | 5 | |
| 0 | 400 | 2 | |
| 0 | 6400 | 2 | |
| Kaolin | 1 | 25 | 5 |
| 1 | 100 | 5 | |
| 1 | 400 | 5 | |
| 1 | 1600 | 5 | |
| 1 | 6400 | 5 | |
| 0 | 400 | 2 | |
| 0 | 6400 | 2 | |
| Control | 1 | 0 | 5 |
Table 2.
Average shell length, wet weight, and condition index of bivalves used in the exposure experiment.
Table 2.
Average shell length, wet weight, and condition index of bivalves used in the exposure experiment.
| Suspended Material | Suspension Concentration (mg L−1) | Average Shell Length (mm) | Average Wet Weight (g) | Condition Index |
|---|---|---|---|---|
| Crushed pumice | 25 | 41.24 a | 13.95 a | 32.32 a |
| 100 | 39.69 a | 13.00 a | 33.33 a | |
| 400 | 39.28 a | 12.11 a | 30.94 a | |
| 1600 | 39.20 a | 12.18 a | 31.73 a | |
| 6400 | 39.98 a | 11.81 a | 30.44 a | |
| Kaolin | 25 | 39.60 a | 11.97 a | 33.56 a |
| 100 | 39.00 a | 11.85 a | 33.22 a | |
| 400 | 39.60 a | 11.97 a | 33.76 a | |
| 1600 | 39.67 a | 13.01 a | 33.80 a | |
| 6400 | 38.45 a | 11.32 a | 33.49 a | |
| Control | 0 | 39.15 a | 12.21 a | 32.51 a |
a Values in each column with different letters are significantly different (p < 0.05).
Disclaimer/Publisher’s Note: The statements, opinions and data contained in all publications are solely those of the individual author(s) and contributor(s) and not of MDPI and/or the editor(s). MDPI and/or the editor(s) disclaim responsibility for any injury to people or property resulting from any ideas, methods, instructions or products referred to in the content. |
© 2023 by the authors. Licensee MDPI, Basel, Switzerland. This article is an open access article distributed under the terms and conditions of the Creative Commons Attribution (CC BY) license (https://creativecommons.org/licenses/by/4.0/).
Share and Cite
MDPI and ACS Style
Inoue, T.; Fujita, I. Application of Drifted Pumice Stone as a Sand-Capping Material. Water 2023, 15, 942. https://doi.org/10.3390/w15050942
AMA Style
Inoue T, Fujita I. Application of Drifted Pumice Stone as a Sand-Capping Material. Water. 2023; 15(5):942. https://doi.org/10.3390/w15050942
Chicago/Turabian StyleInoue, Tetsunori, and Isamu Fujita. 2023. "Application of Drifted Pumice Stone as a Sand-Capping Material" Water 15, no. 5: 942. https://doi.org/10.3390/w15050942
Note that from the first issue of 2016, this journal uses article numbers instead of page numbers. See further details here.