1. Introduction
A submarine volcanic eruption at Fukutoku Okanoba, Ogasawara Islands, Japan, occurred from 13–15 August 2021, producing a 300-km
2 pumice raft that was dispersed by ocean currents more than 1000 km west of the volcano [
1]. The pumice drifted into the sea at various locations on the Pacific side of Japan, affecting coastal infrastructures, ship navigation, and fishery operations [
1,
2]. As a result, the disposal of enormous amounts of drifted pumice stone has become problematic.
Previous studies have investigated the formation of pumice rafts by submarine volcanoes and their driftage [
3,
4,
5,
6] and showed that similar events reoccur on a 10- to 20-year basis in the seas around Japan. The large-scale formation and driftage of pumice rafts have also been reported in the Kermadec Arc, New Zealand [
7], the South Sandwich Islands [
8], and at Home Reef Volcano, Tonga [
9]. Considering that a similar event is likely to occur in the future, it is necessary to study effective ways to manage pumice that has been ejected into the sea.
Pumice is a glassy volcanic rock fragment with a high vesicularity of 50–80% [
2], and its properties vary depending on the conditions of its formation, including melt viscosity, temperature, and the duration of pressure drop [
10]. Although pumice is porous and has a low apparent specific gravity, it generally settles out in seawater when crushed to a diameter of 0.5 mm or less. However, it still has a lower specific gravity than the particles of seabed sediments; therefore, the risk of pumice burrowing into the sediments is relatively low. These properties allow its potential use as a sand-capping material. In addition, a high adsorption capacity can be expected owing to its porous nature, thereby allowing the suppression (adsorption) of the release of nutrients from the sediment. Thus, pumice stone is a promising material for sand-capping. However, regarding the on-site application, it is necessary to consider that the resuspension of pumice may adversely affect surrounding organisms.
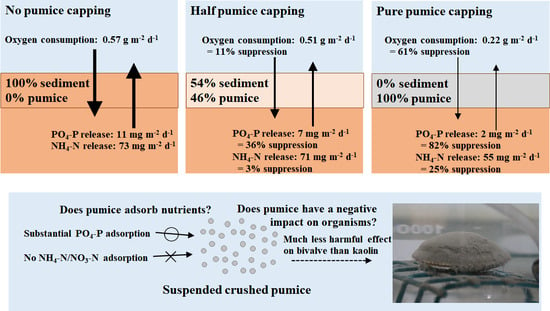
To the best of our knowledge, no previous research has studied the utility of pumice stone as a sand-capping material. Therefore, in this study, we examined the efficacy and potential application of pumice as a sand-capping material for eutrophic sediments. Laboratory experiments were conducted using drifted pumice to investigate the reduction of oxygen consumption and nutrient release from eutrophic sediments. In addition, phosphorus and nitrogen adsorption experiments were conducted to examine the usefulness of pumice as a sand-capping material. Finally, exposure experiments using bivalves were conducted to examine the effects of crushed pumice on living organisms. The results of this study provide insight into the current problem of the disposal of drifting pumice, as well as effective utilization methods for the material, helping us to consider how to deal with pumice ejected by submarine volcanoes in the future.
2. Materials and Methods
2.1. Pumice Stone Crushing
Approximately 20 kg of pumice was collected from Yasuda Port (26°44.49′ N, 128°19.12′ E), located northeast of the main island of Okinawa, Japan. The collected pumice was transported to the laboratory and crushed using a crusher (20-KP-7919, Labonect Corporation, Osaka, Japan) at 30,000 rpm for 3 min, visually confirmed to have a particle size of 0.5 mm or less, and used in subsequent experiments.
2.2. Sedimentary Oxygen Demand Laboratory Experiment
An incubation experiment using sediment cores was conducted to assess the effect of using crushed pumice as a sand-capping material to suppress sediment oxygen consumption. Dredged muddy sediment collected from the navigation channel (depth: 16 m) of Osaka Port (34°29.56′ N, 135°21.80′ E) was used in the experiment. The sediment comprised organic silt with a dark olive-gray color and had the pungent odor of rotten eggs characteristic of hydrogen sulfide.
Three cylindrical acrylic pipes (Item No. 6-628, As One Corporation, Osaka, Japan) with an inner diameter of 10 cm and a height of 50 cm were packed with the sediment and overlying water such that the sediment height was approximately 28 cm (hereafter, CORE1, CORE2, and CORE3). The pipes were stored at room temperature (22–24 °C) for 2 days and allowed to settle at the surface by means of consolidation. Subsequently, CORE1, CORE2, and CORE3 were prepared with 0%, 46%, and 100% pumice by weight, as follows. For CORE1, 49.07 g (wet weight) of the same sediment was collected and placed uniformly on the surface. For CORE2, 23.03 g (wet weight) of crushed pumice and 26.97 g (wet weight) of sediment were well mixed and placed uniformly on the surface. For CORE3, 49.38 g (wet weight) of crushed pumice was placed uniformly on the surface.
Artificial seawater (Marine Art SF-1, Osaka Yakken, Osaka, Japan; equivalent to 35 psu) was gently injected on top of the material to avoid sediment suspension. Subsequently, the core was sealed with a silicon plug, ensuring that no air bubbles were left in the core, and placed in a water bath where the water temperature was maintained at 23 °C. The silicone plug was equipped with a fluoroplastic propeller (model no. FLSPI, PTFE straight blade, As One Corporation) and brushless motor (BMU230A-15-2, Oriental Motor Corporation, Tokyo, Japan), and a magnetic drive vacuum agitator (Model No. F-24/40, PTFE magnet-type, As One Corporation) was installed. Using these devices, the overlying water could be agitated at any rotation speed in sealed conditions without exposure to the outside air. As a result, the overlying water in the core could be sufficiently mixed, and the flow conditions in the core could be controlled [
11]. In addition, the silicon plug was equipped with a dissolved oxygen (DO) meter probe (WA-2017SD, FUSO Inc., Tokyo, Japan) to continuously measure the DO concentration of the overlying water at 10-min intervals [
12] (
Figure 1).
The propeller rotation speed was set to 20 rpm, and DO monitoring began after approximately one-half day of acclimation. The cores were shaded with curtains during the experiment to prevent light exposure. DO concentration in the overlying water was measured every 10 min.
The rate of DO consumption by sediments (sedimentary oxygen demand, SOD) was calculated from the rate of decrease in the DO concentration in the overlying water [
11] using the following equation:
where
V is the volume of overlying water in the core,
A is the cross-sectional area of the sediment core,
CDO is the DO concentration in the overlying water, and
t is the elapsed time.
2.3. Sedimentary Nutrient Release Rate Laboratory Experiment
The sediment nutrient release experiment was conducted using the sediment cores (
Section 2.2), and incubation was continued for 6 days after anoxic conditions were established. The experimental conditions, such as water temperature and agitation speed, were the same as those described in
Section 2.2.
Three water samples were collected during the experiment. First, the overlying water was sampled using a tube (4 mm, inner diameter; 6 mm, outer diameter; LMT-55, Saint-Gobain KK, Tokyo, Japan) with the inlet placed ~50 mm above the sediment surface (not exposed to the air,
Figure 1), and the portion of sampled water was immediately filtered using a disposable filter (pore size 0.45 µm, Minisalt SM16555K, Sartorius Co., Göttingen, Germany). The filtered sample was poured into acid-washed polypropylene bottles and stored at −25 °C until further chemical analysis. The samples were analyzed using a continuous flow analyzer (QuAAtro 39, BLtech Corporation, Osaka, Japan), with ammonium nitrogen (NH
4-N) measured using the indophenol blue-colored continuous flow analysis (CFA) and phosphate (PO
4-P) measured using the molybdenum blue CFA method [
13]. The nutrient release rate (NRR) from the sediment was calculated from the rate of increase in nutrient concentration in the overlying water based on the following equation [
14]:
where
Cnut is the NH
4-N or PO
4-P concentration in the overlying water.
After the nutrient release experiment was completed, a 1.0-cm thick surface sediment layer was collected for bottom-sediment analysis. This was placed in a 100-mL container and stored at −25 °C. The following were analyzed: ignition loss (600 °C ignition and gravimetric method), total organic carbon (after hydrochloric acid treatment, measured using CHN elemental analyzer (JMA1000HCN, J-Science, Hiroshima, Japan)), chemical oxygen demand (oxygen consumption by potassium permanganate), total sulfides (steam distillation-methylene blue method), total nitrogen (measured using CHN elemental analyzer), total phosphorus (nitric acid and sulfuric acid decomposition, molybdenum blue absorption spectrophotometry (SWAAT, BLtech Corporation, Osaka, Japan)), total iron (nitric acid and sulfuric acid decomposition-flame atomic absorption method (atomic absorption spectrometer, Z-2000, Hitachi, Tokyo, Japan)), and total manganese (nitric acid and sulfuric acid decomposition-flame atomic absorption method). The analytical results are presented in
Appendix A.
2.4. Nutrient Adsorption
Three 1-L beakers were used, and NH4-N (ammoniacal nitrogen standard solution, NH4-N 1000, Kanto Chemical Co., Ltd., Tokyo, Japan) and PO4-P (phosphorus standard solution, PO4-P 1000, Kanto Chemical Co., Ltd.) were added to artificial seawater at a concentration of approximately 0.2 mg L−1 each. Two beakers were filled with 30 g of crushed pumice stone, with one beaker used for nutrient concentration measurements and the other for water temperature, pH, and oxidation-reduction potential (ORP) measurements. The other beaker was used as a control without pumice and only for nutrient measurements.
The artificial seawater in the beaker was continuously stirred during the experiment, and the crushed pumice was kept in suspension throughout the experiment. From the beaker for nutrient concentration measurements, 20 mL of water was collected before and immediately after, 1, 2, 5, 10, 20, and 30 min, and 1, 2, 3, and 6 h after the crushed pumice stone was added using a plastic syringe (Terumo Syringe 10 mL, Terumo, Tokyo, Japan). The sample was filtered (pore size: 0.45 µm, diameter: 30 mm; SupraPure Syringe Filter, PTFE-Hydrophilic, Recenttec, Tokyo, Japan), and the filtrate was collected in two 10-mL spitz tubes (Econospitz PS, 10 mL; Sanplatec Co., Osaka, Japan). The filtrate was stored, frozen, and analyzed using a continuous flow analyzer (QuAAtro 39, BLtech Corporation, Osaka, Japan) using the indophenol blue CFA method for NH4-N, naphthylethylenediamine CFA method for nitrite (NO2-N), naphthylethylenediamine CFA method after reduction with a copper-cadmium reduction column for nitrate (NO3-N), and molybdenum blue CFA method for PO4-P. Water temperature (digital thermometer, CT-410WR, Custom, Tokyo, Japan), pH (pH meter, HM-60S, DKK-TOA, Tokyo, Japan), and ORP (ion meter, IM-40S, DKK-TOA) were measured when water was collected from the beaker for nutrient measurement.
From the control beaker, 20 mL of water was collected, as described above, before and 1, 3, and 6 h after the start of the experiment, filtered through a syringe filter with a pore size of 0.45 µm, and collected in 10-mL spitz tubes. These were also frozen and stored, and NH4-N, NO2-N, NO3-N, and PO4-P levels were measured.
2.5. Exposure Experiment
Exposure experiments were conducted with crushed pumice in suspension to examine the effects of the resuspension of crushed pumice on bivalves. For comparison, bivalves were also exposed to kaolin in suspension. Before the experiment, healthy bivalves were carefully transported to the laboratory. All individuals were immediately checked for physical damage, and debilitated individuals were excluded. Furthermore, we excluded bivalves that could not open or close siphons or other soft parts of the body or shells before acclimation. Next, acclimation was conducted in several tanks, and the water was changed frequently. The bivalves were not fed in order to prevent them from excreting large amounts of feces and pseudofeces (urine) during acclimation. When selecting bivalves for the experiment, those from tanks where individuals had died during acclimation were excluded. Those with soft parts such as siphons and shells that were confirmed to be open and closed were selected for use.
Experiments were conducted in 1-L beakers filled with 1 L of artificial seawater. First, artificial seawater was prepared with five concentrations of each suspension (25, 100, 400, 1600, and 6400 mg L
−1). We also prepared a control beaker with no suspended material added (
Table 1). A healthy bivalve (
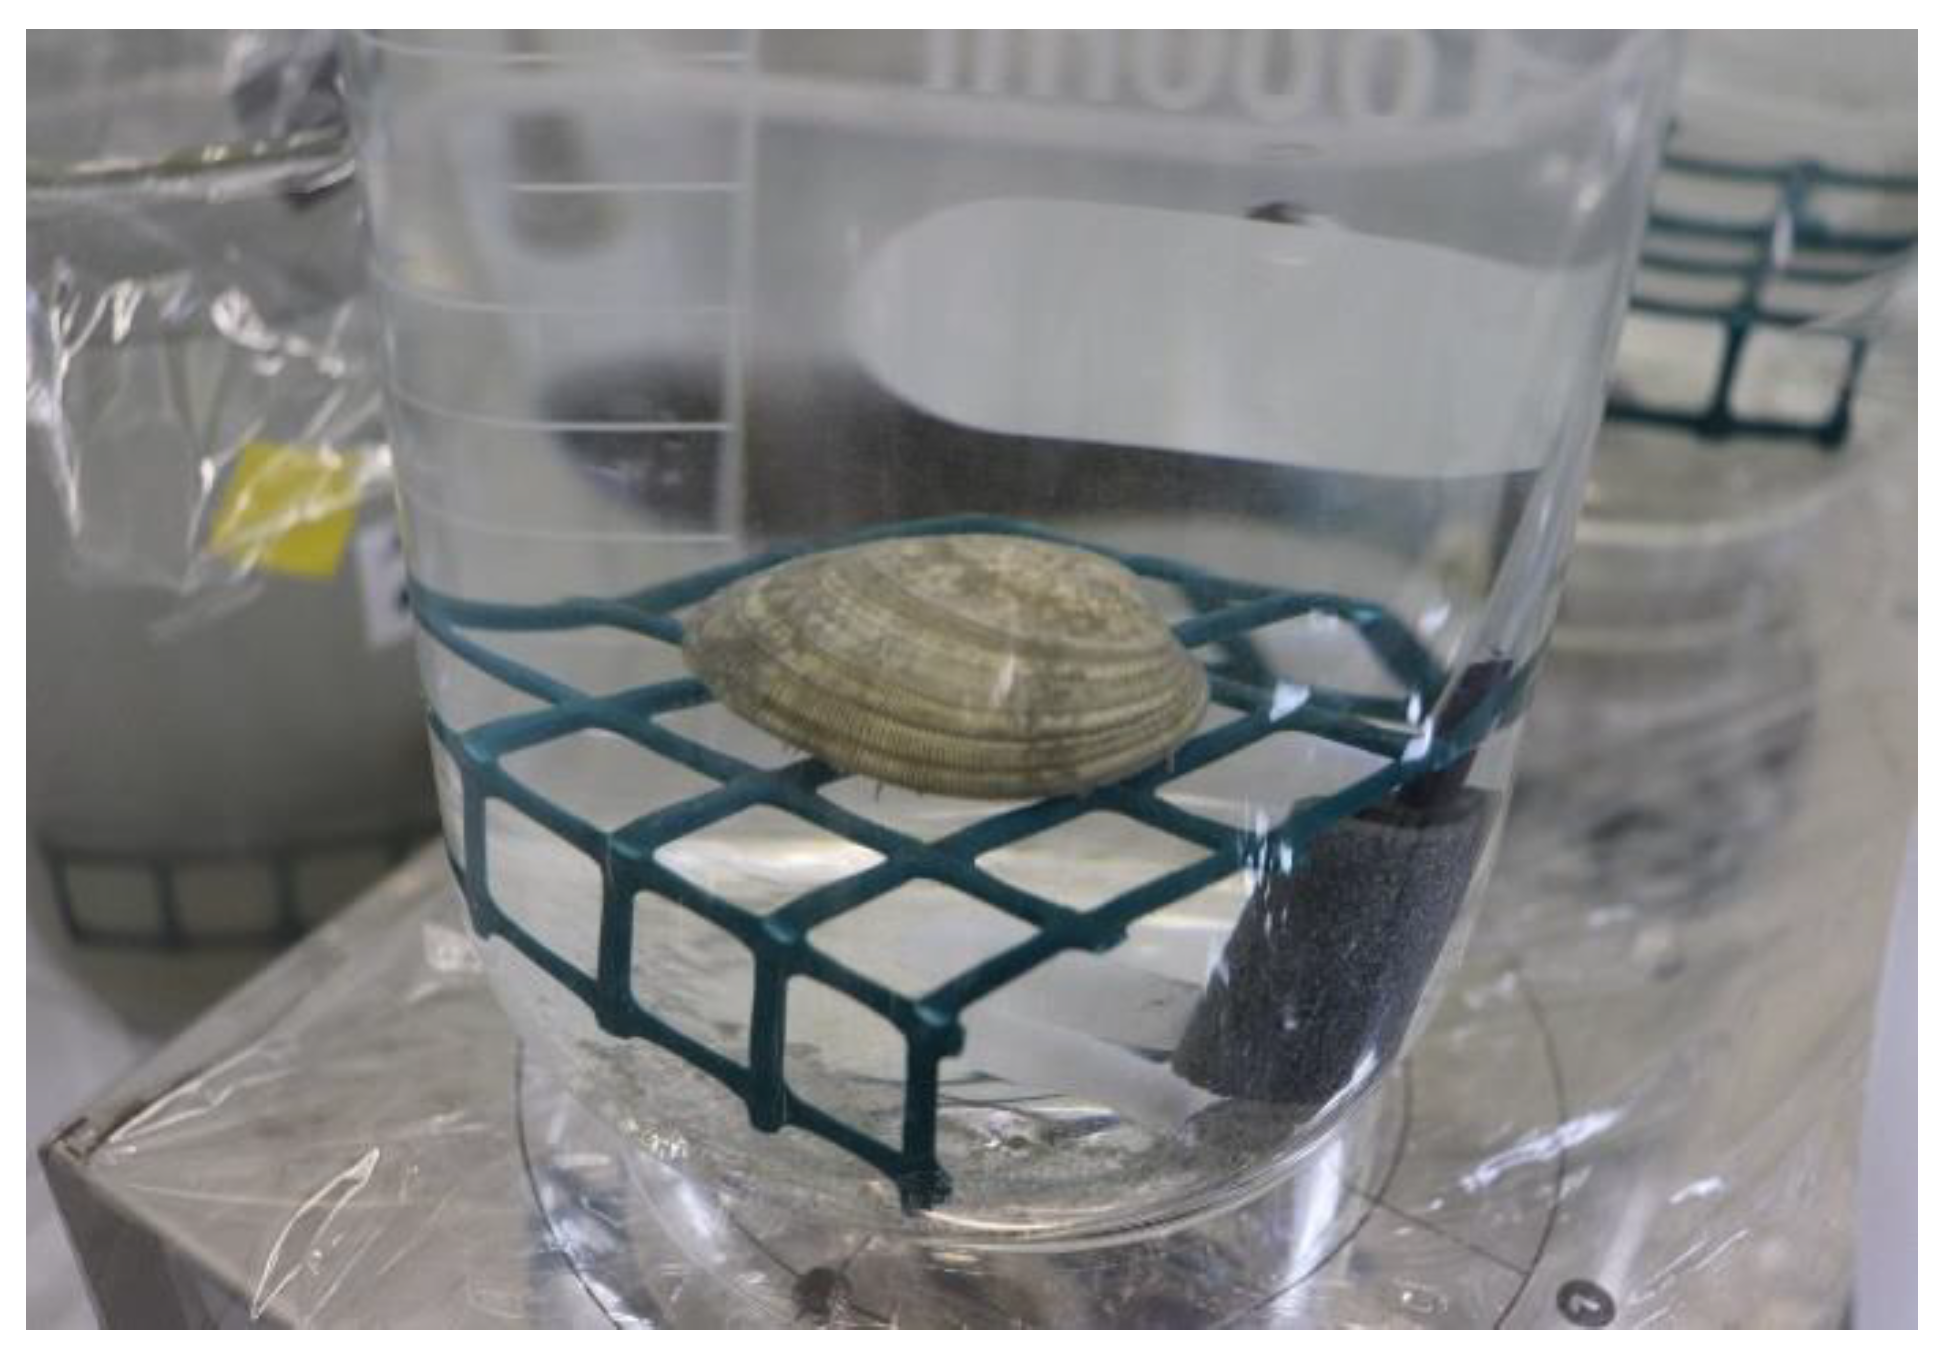
Ruditapes philippinarum) with an undamaged shell and confirmed healthy siphons was installed in each beaker. During the experimental period, the seawater was agitated with a stirrer to keep the suspension concentration of crushed pumice and kaolin constant and aerated. The bivalves were placed on a pedestal made of plastic mesh so they would not be beaten by the rotating stirrer tip (
Figure 2). Five beakers were prepared for each experimental condition.
Incubation was conducted at a water temperature of 20 °C for 168 h (7 days), and survival was checked twice daily. The water was changed once daily. During the experimental period, water temperature, pH, DO (oxygen meter, DO-21P, DKK-TOA), and turbidity were measured in all beakers twice daily. After water collection, absorbance was measured at a wavelength of 660 nm (DR-2800 spectrophotometer, HACH, CO, USA). For suspended solid (SS), NH4-N, NO2-N, NO3-N, and PO4-P analyses, water samples were collected from all beakers at the end of the experiment or when bivalves died. Two beakers were also prepared with two suspension concentrations (400 and 6400 mg L−1) and without bivalves to examine changes in water quality due to the addition of suspended materials. On day 1, water samples were collected from two beakers for total nitrogen, total phosphorus, fluorine, NH4-N, NO2-N, NO3-N, and PO4-P concentration analyses and one beaker to analyze the particle size distribution of suspended materials.
After the experiment, the shell length, shell width, shell height, and soft tissue weight of all individuals were measured, and the condition index was calculated using the following equation [
15].
where
CI is the condition index;
STW is the soft tissue weight (g);
SL,
SW, and
SH are the shell length, shell width, and shell height, respectively (cm).
Finally, the Kruskal–Wallis test was conducted to test for differences among experimental conditions.
3. Results
3.1. Oxygen Consumption Experiment
Visual inspection revealed no resuspension of sediment particles during the experiment.
Figure 3 shows the temporal variations in the DO concentration in the overlying water during the oxygen consumption experiment. All three treatments showed a monotonous decrease due to the sedimentary DO consumption. However, each treatment showed a different decreasing rate reflecting the sand-capping effect for CORE2 and CORE3. The differences in initial DO concentrations among CORE1 (0% pumice weight ratio), CORE2 (46% pumice weight ratio), and CORE3 (100% pumice weight ratio) were due to DO consumption during the half-day acclimation period.
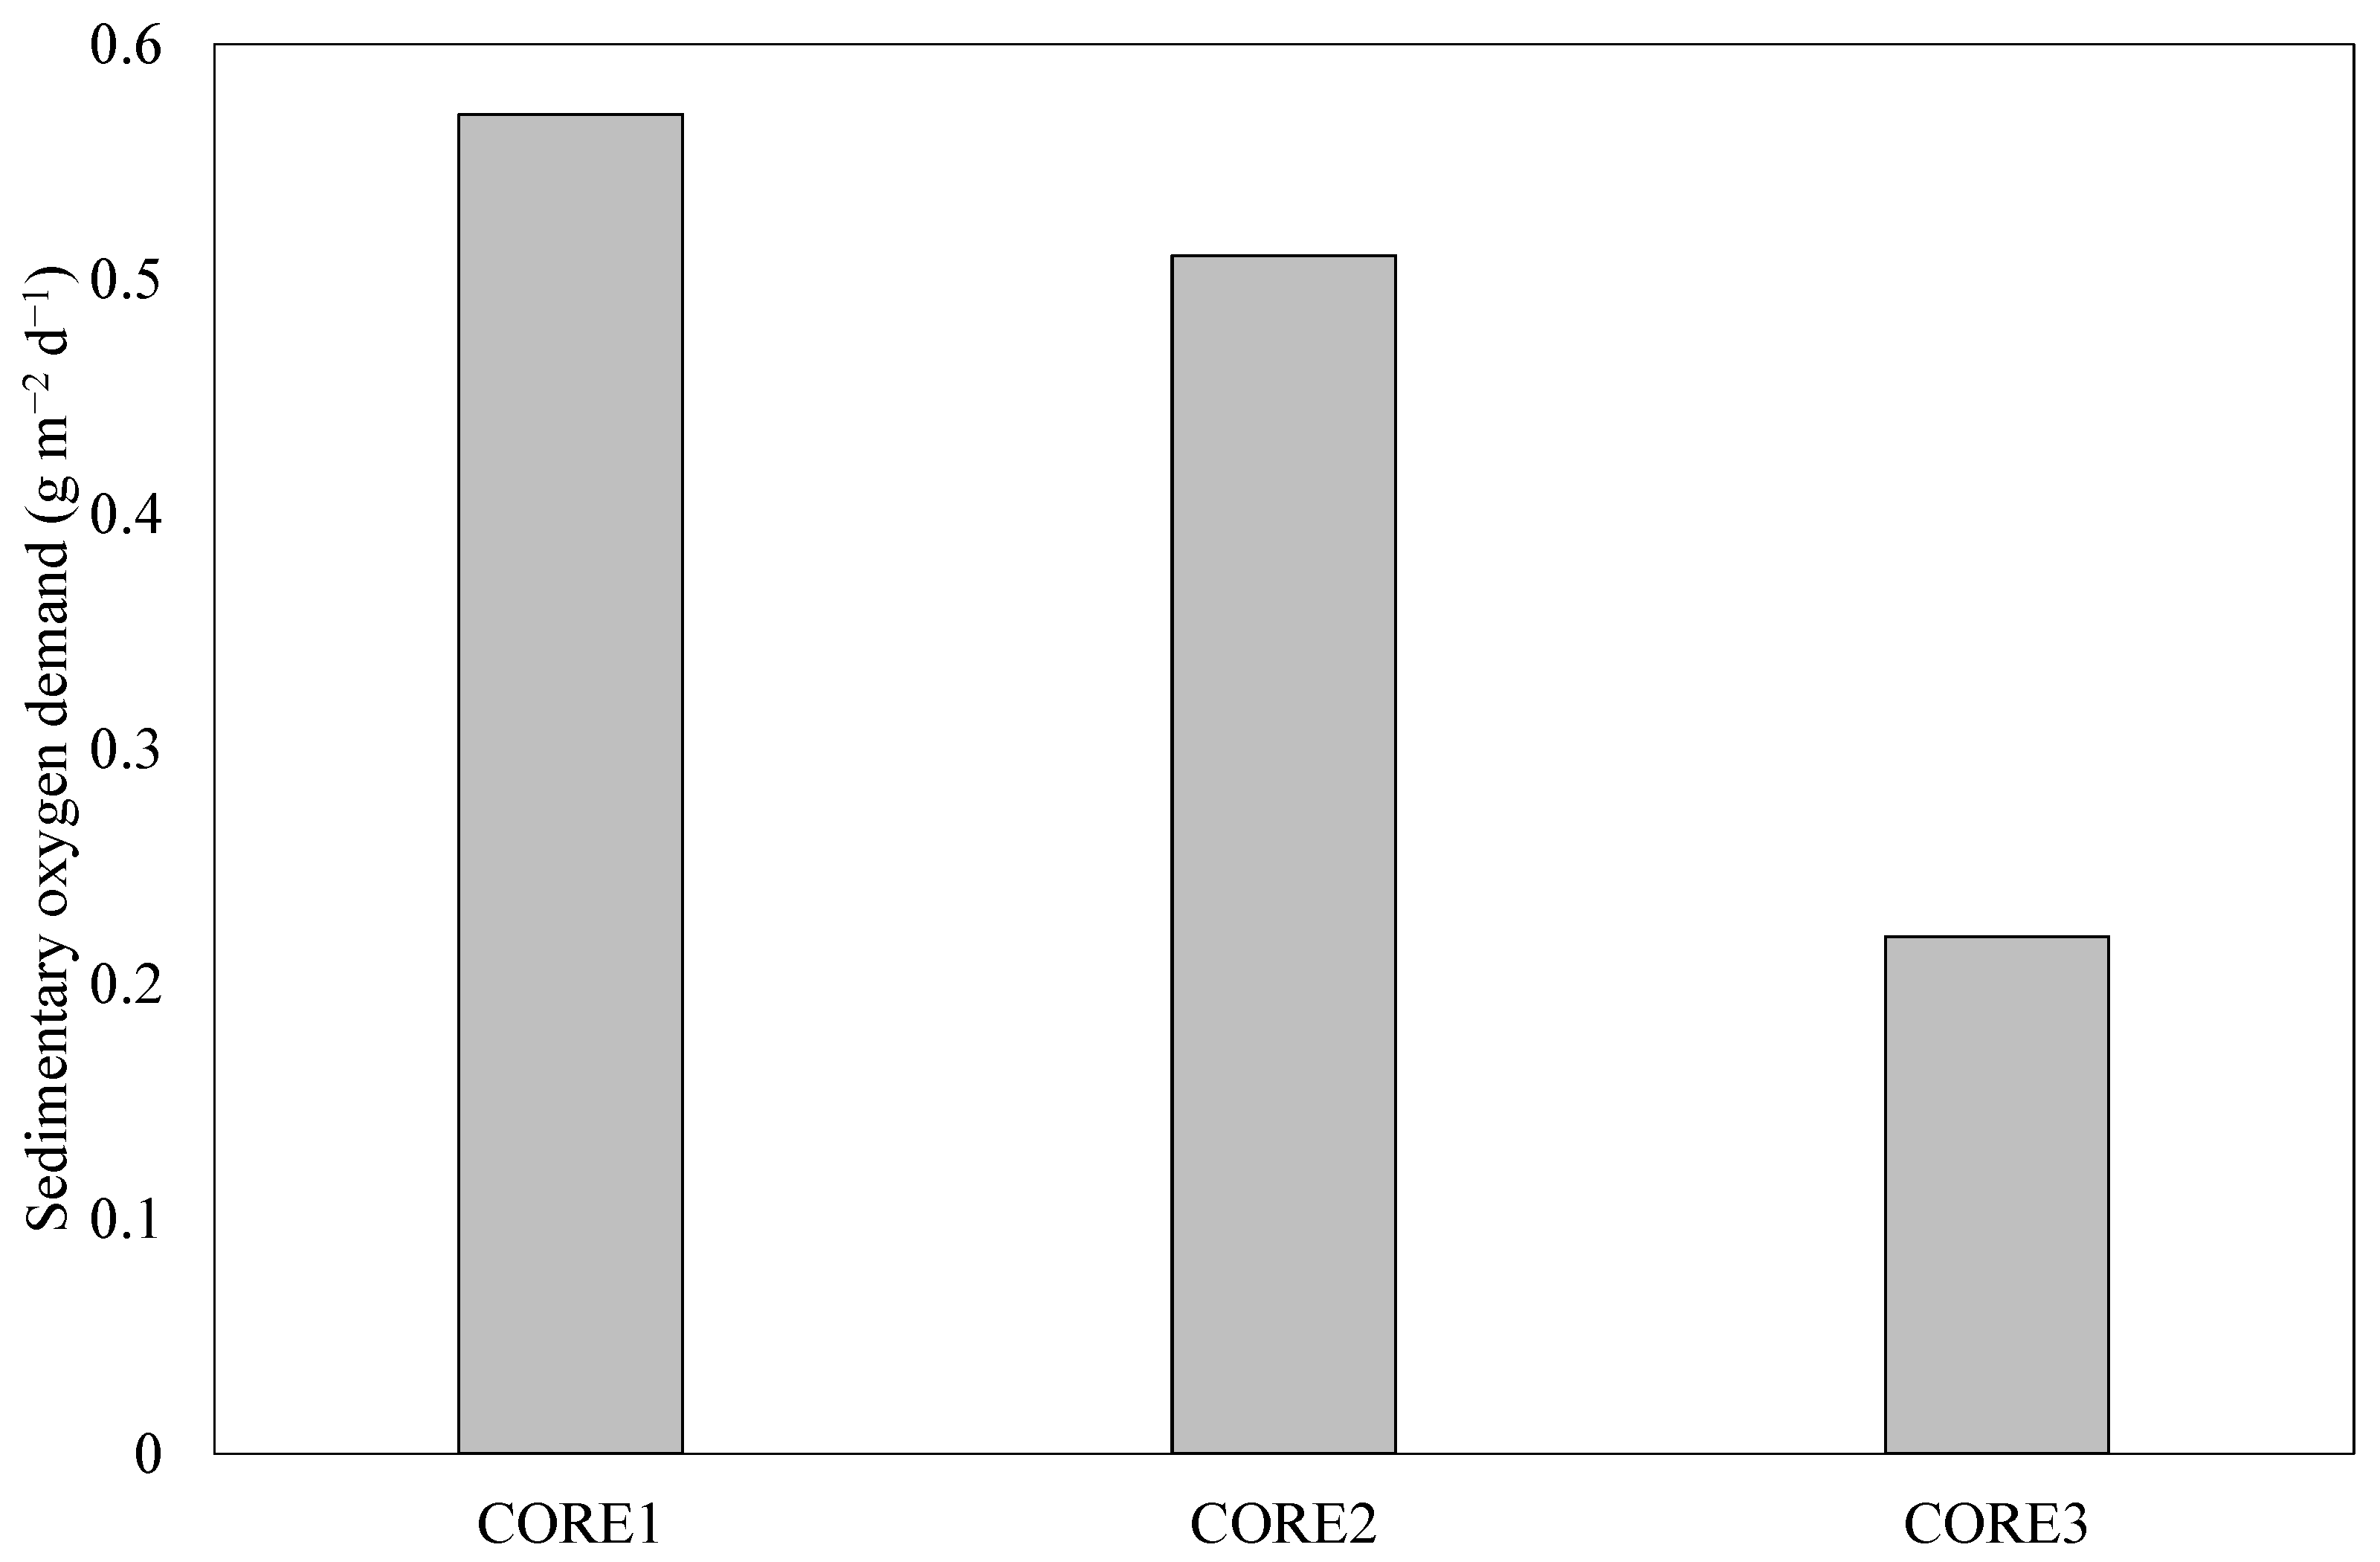
Based on these results, the SOD calculated using Equation (1) is shown in
Figure 4. The SOD for CORE1 was 0.57 g m
−2 d
−1, and that for CORE2 was 0.51 g m
−2 d
−1, showing an 11% reduction compared with that of CORE1. Furthermore, the SOD of CORE3 was 0.22 g m
−2 d
−1, exhibiting a 61% reduction compared with that of CORE1. This reduction in SOD was attributed to the reduction in the volumetric organic matter content in the surface layer by placing crushed pumice. These results confirmed that applying crushed pumice to eutrophic sediment surfaces effectively reduces SOD activity.
3.2. Nutrient Release Experiments
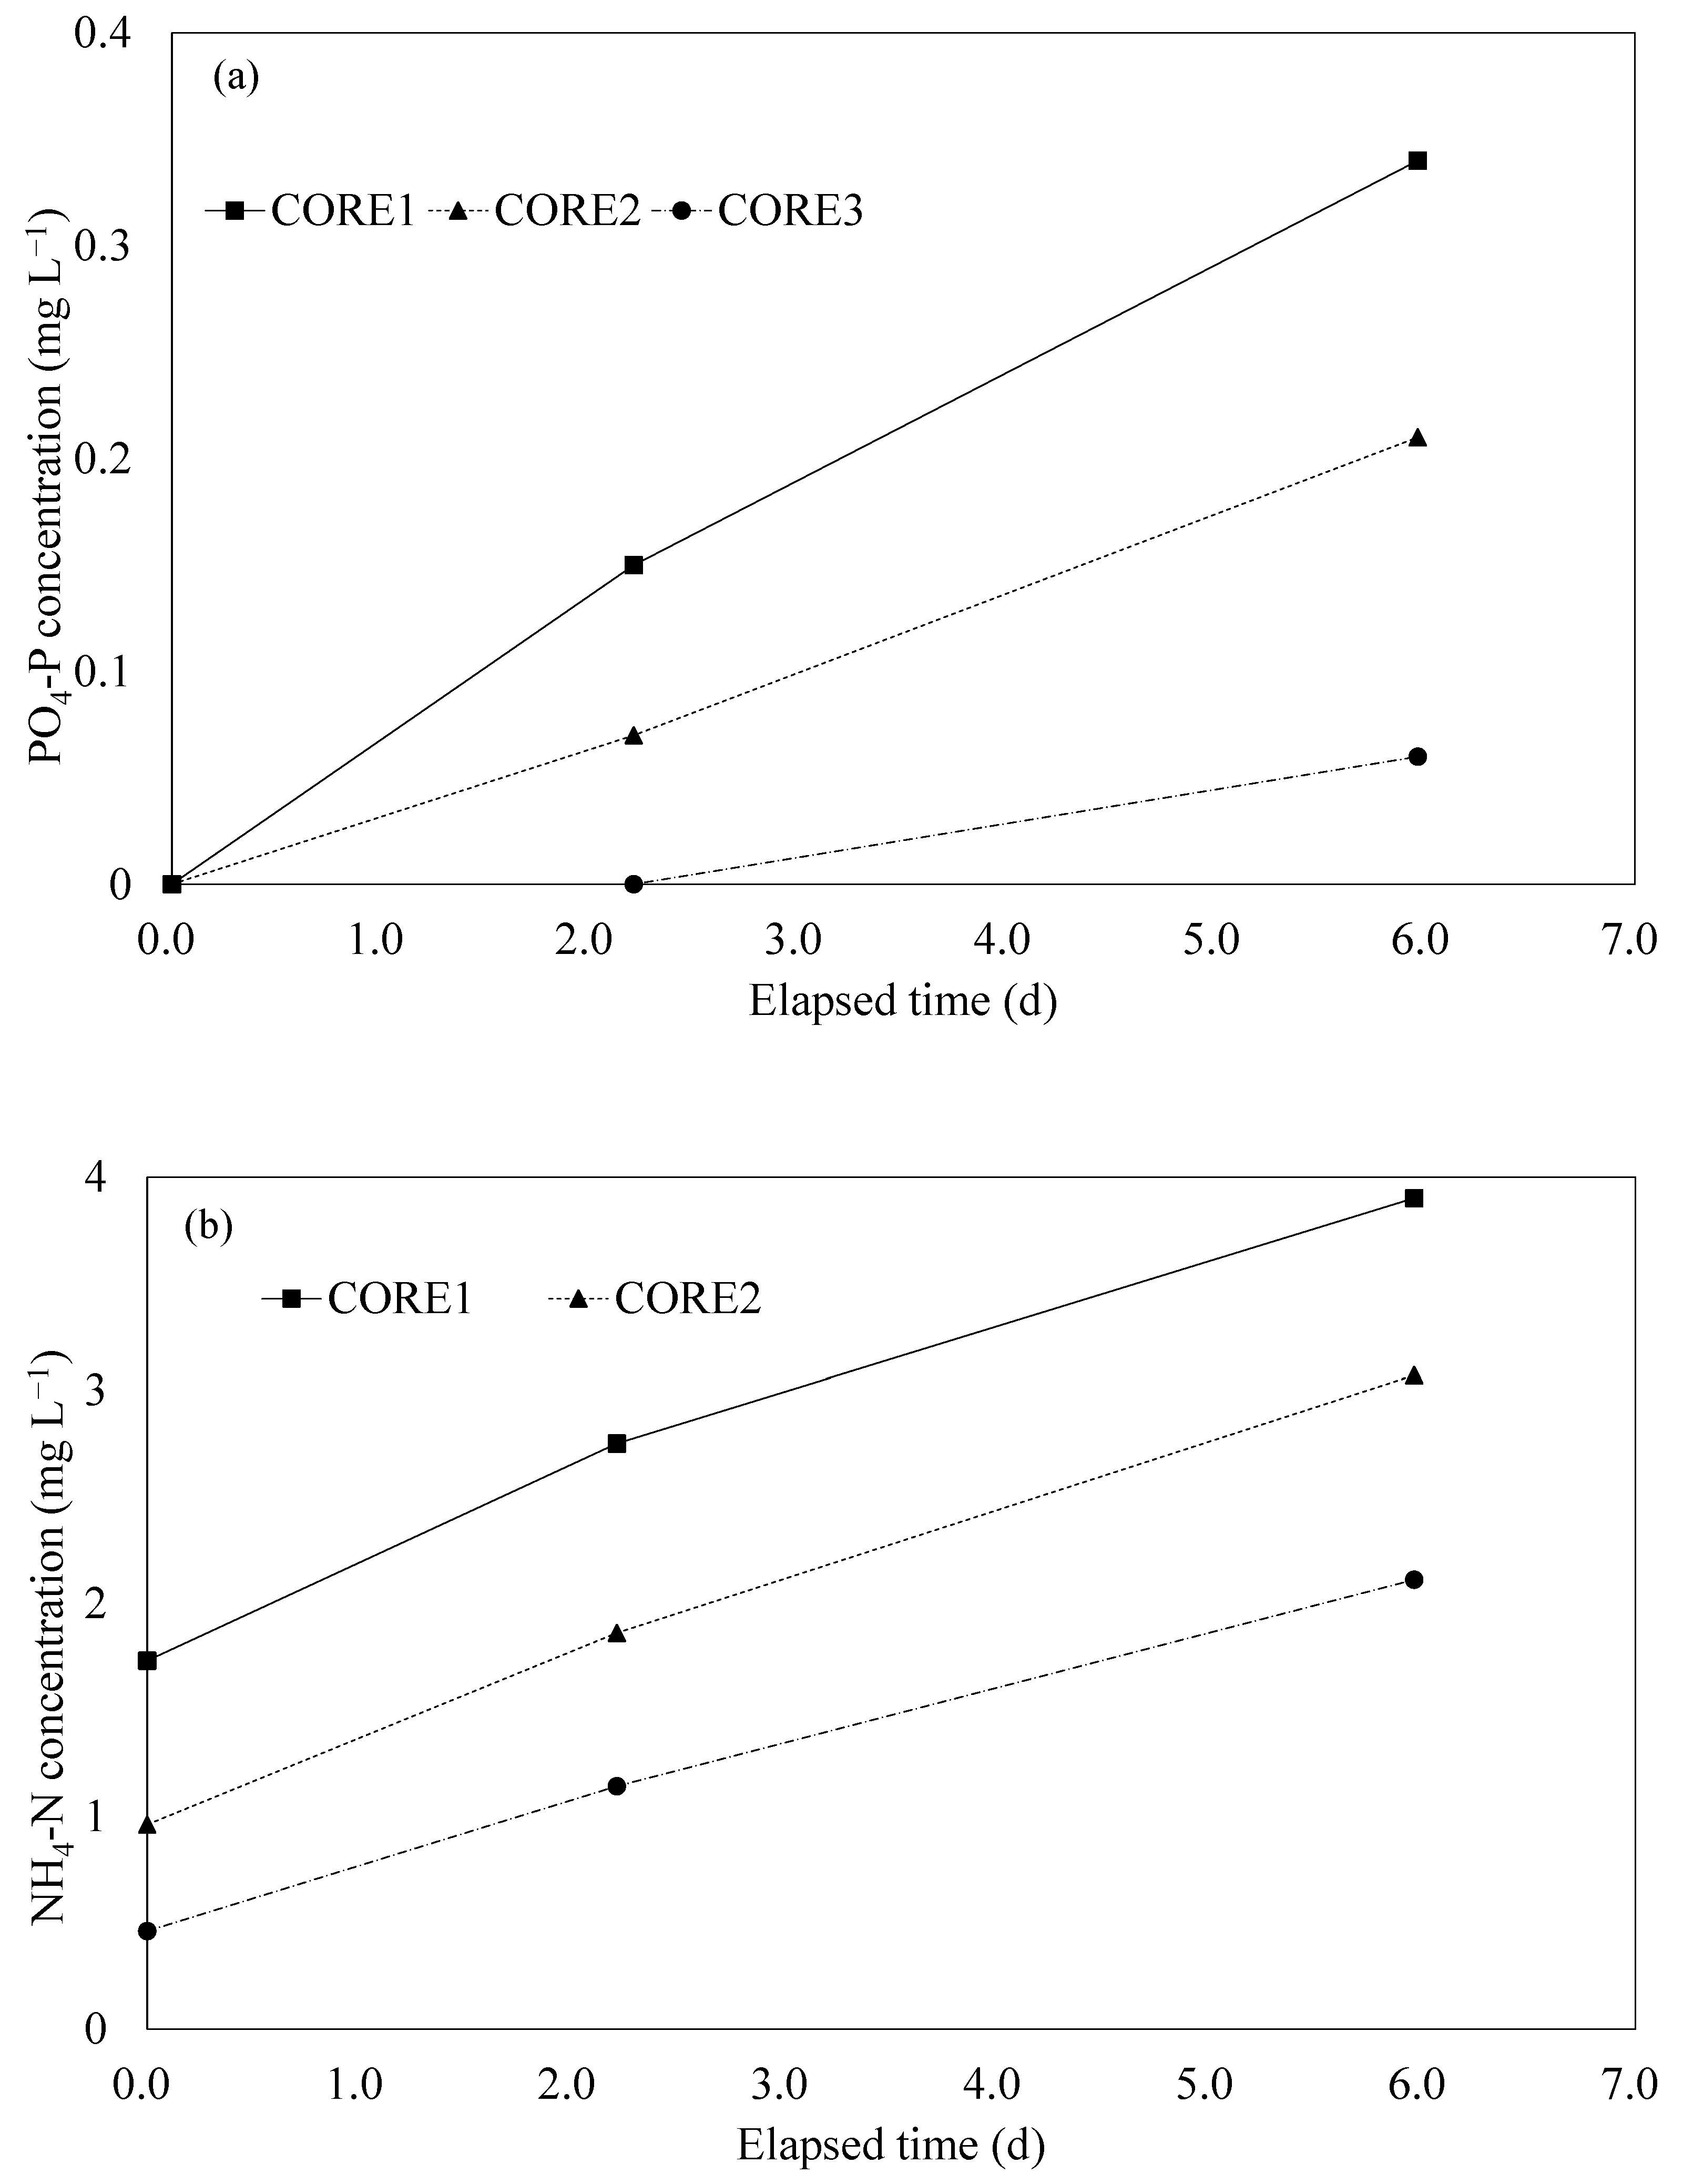
Figure 5 shows the temporal variations in nutrient concentrations in the overlying water during the nutrient release experiment. The PO
4-P and NH
4-N concentrations in the overlying water monotonously increased as results of continuous release from the sediment. The differences in the initial NH
4-N concentrations among CORE1, CORE2, and CORE3 were thought to be due to differences in their release rates during the experiment (
Figure 5b).
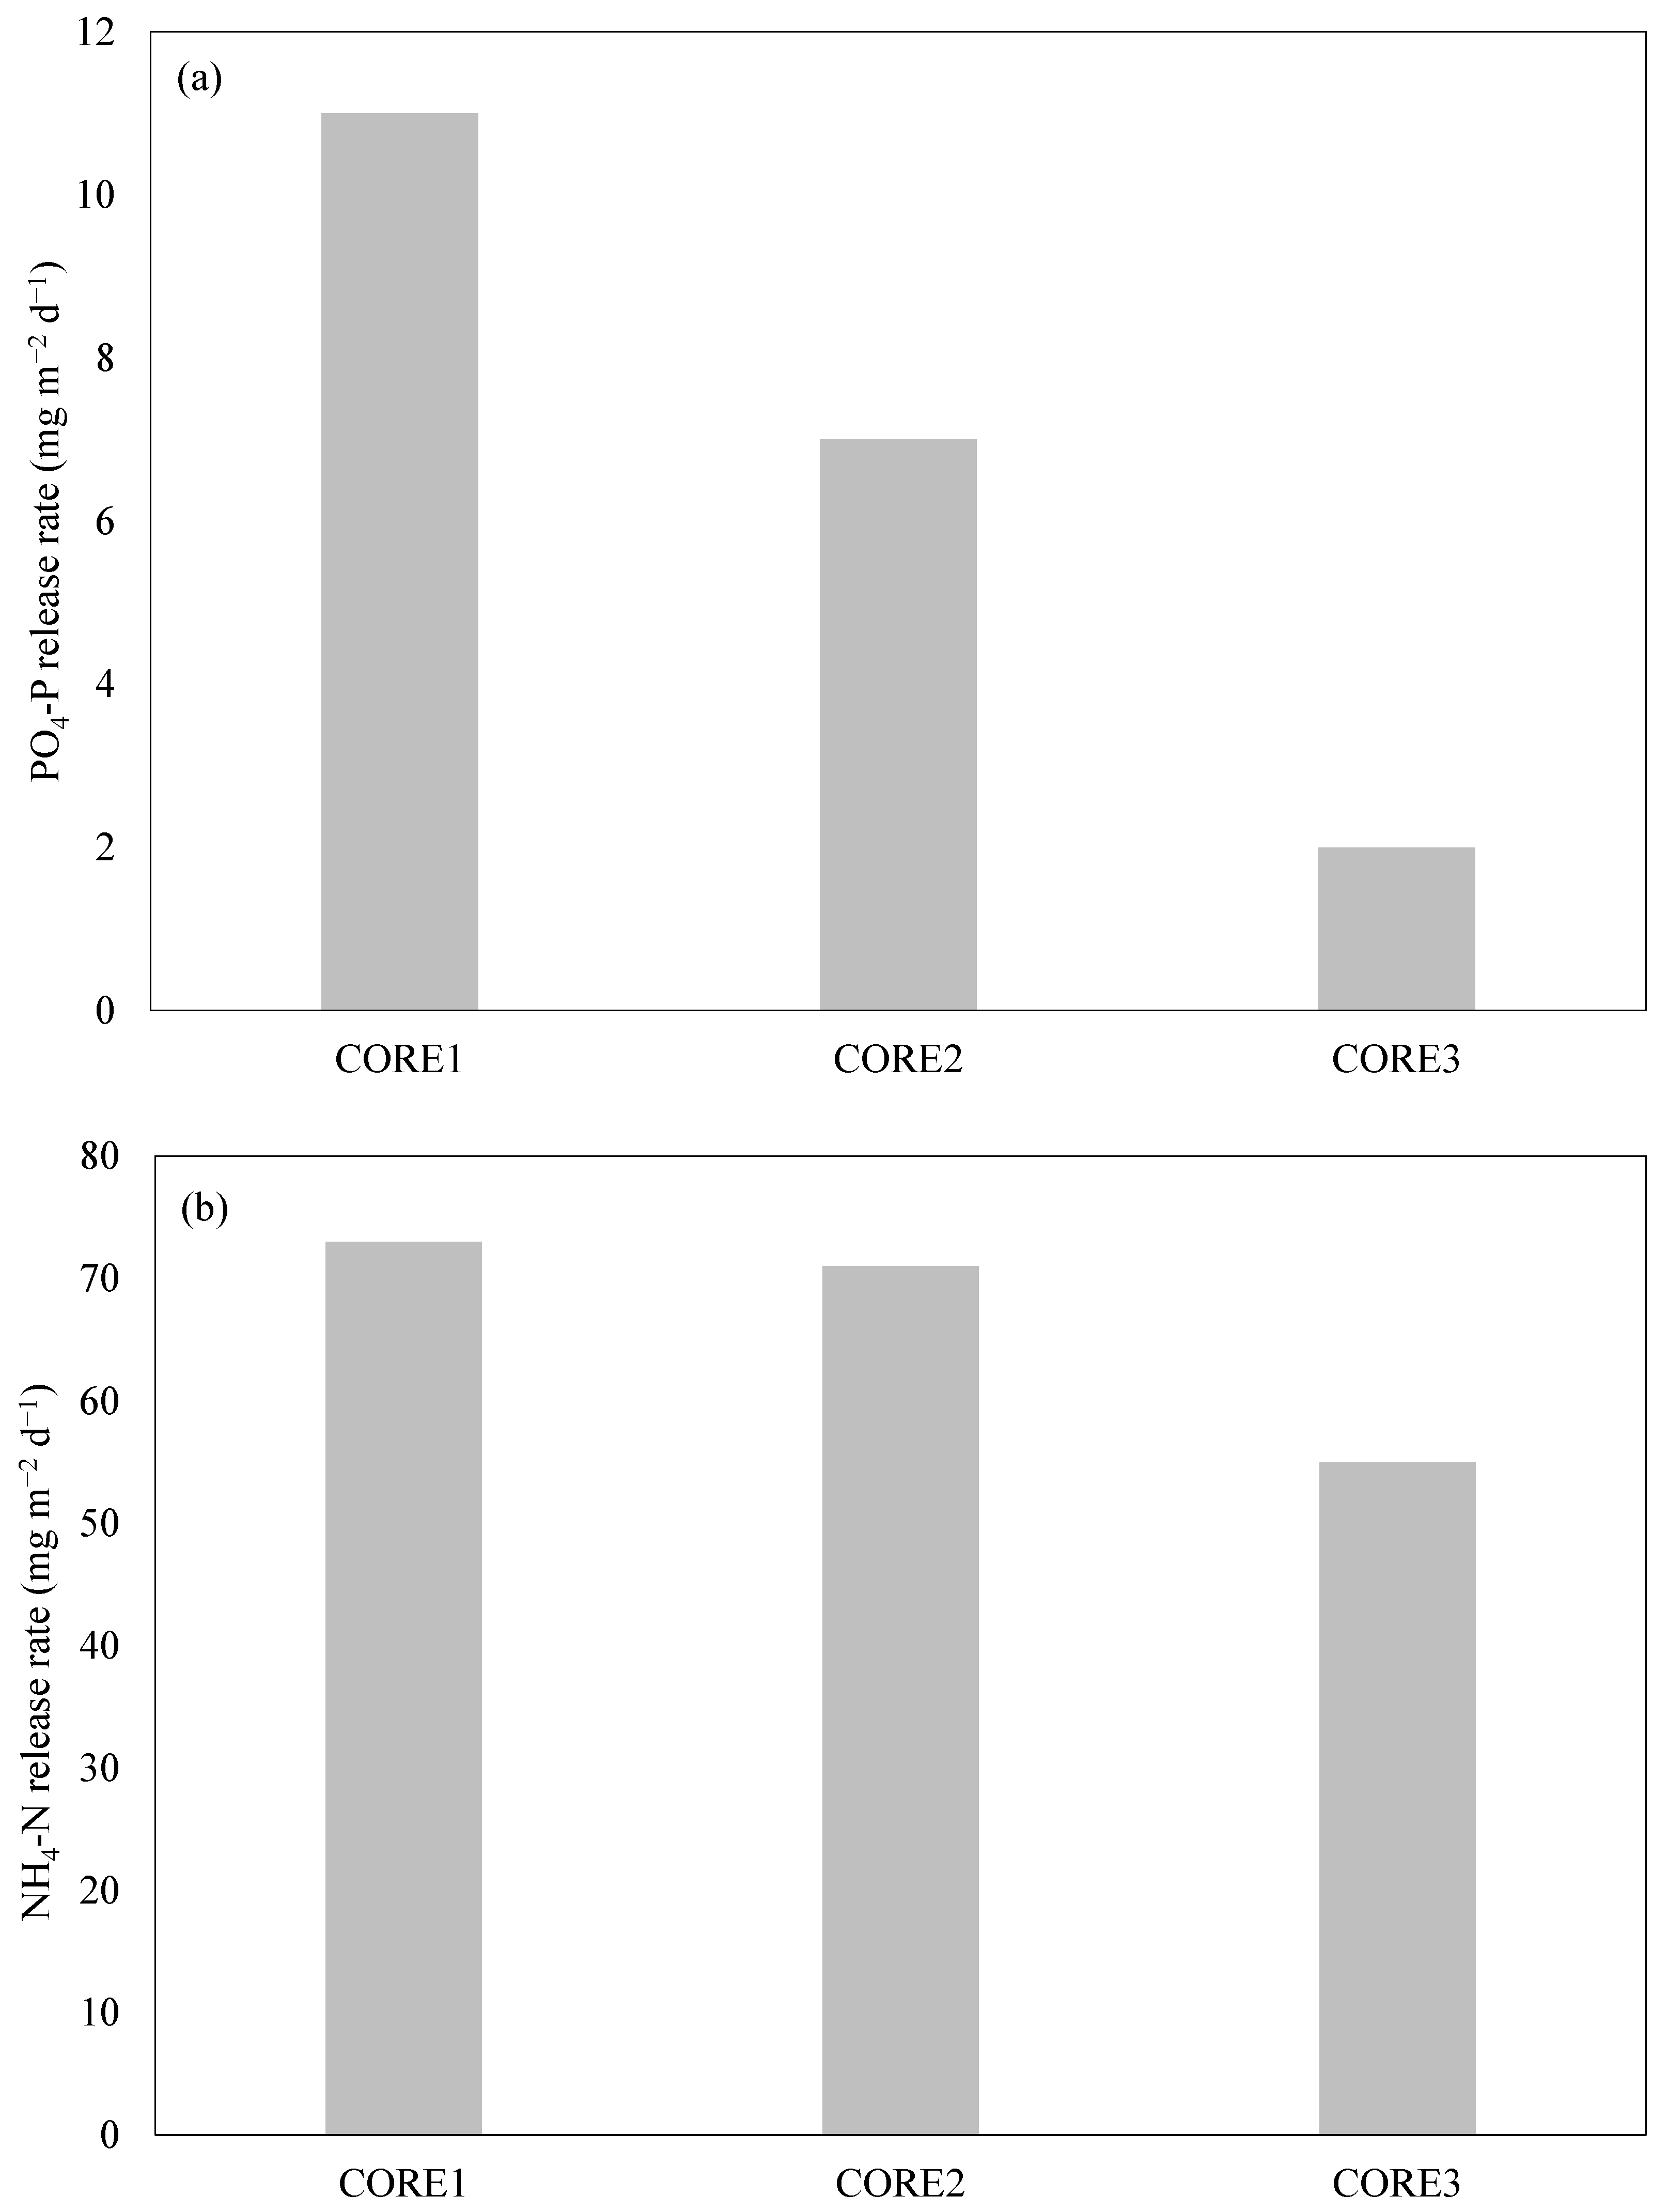
From these results, the nutrient release rates calculated using Equation (2) are shown in
Figure 6. The PO
4-P release rate for CORE1 was 11 mg m
−2 d
−1, whereas that for CORE2 was 7 mg m
−2 d
−1, showing a 36% reduction compared with that of CORE1 (
Figure 6a). Furthermore, the PO
4-P release rate for CORE3 was 2 mg m
−2 d
−1, which was 82% lower than that of CORE1. This was thought to be due to an increase in PO
4-P adsorption in the surface layer of the sediment by the placement of crushed pumice.
In contrast, the NH
4-N release rate in CORE1 was 73 mg m
−2 d
−1, and that for CORE2 was 71 mg m
−2 d
−1, which was only 3% less than that of CORE1. Furthermore, the NH
4-N release rate for CORE3 was 55 mg m
−2 d
−1, exhibiting a 25% reduction compared with that of CORE1 (
Figure 6b). This may be because the NH
4-N content in the surface layer was reduced by placing crushed pumice on the sediment surface, but as discussed below, pumice has no NH
4-N adsorption capacity; therefore, this effect was negligible.
3.3. Nutrient Adsorption Experiment
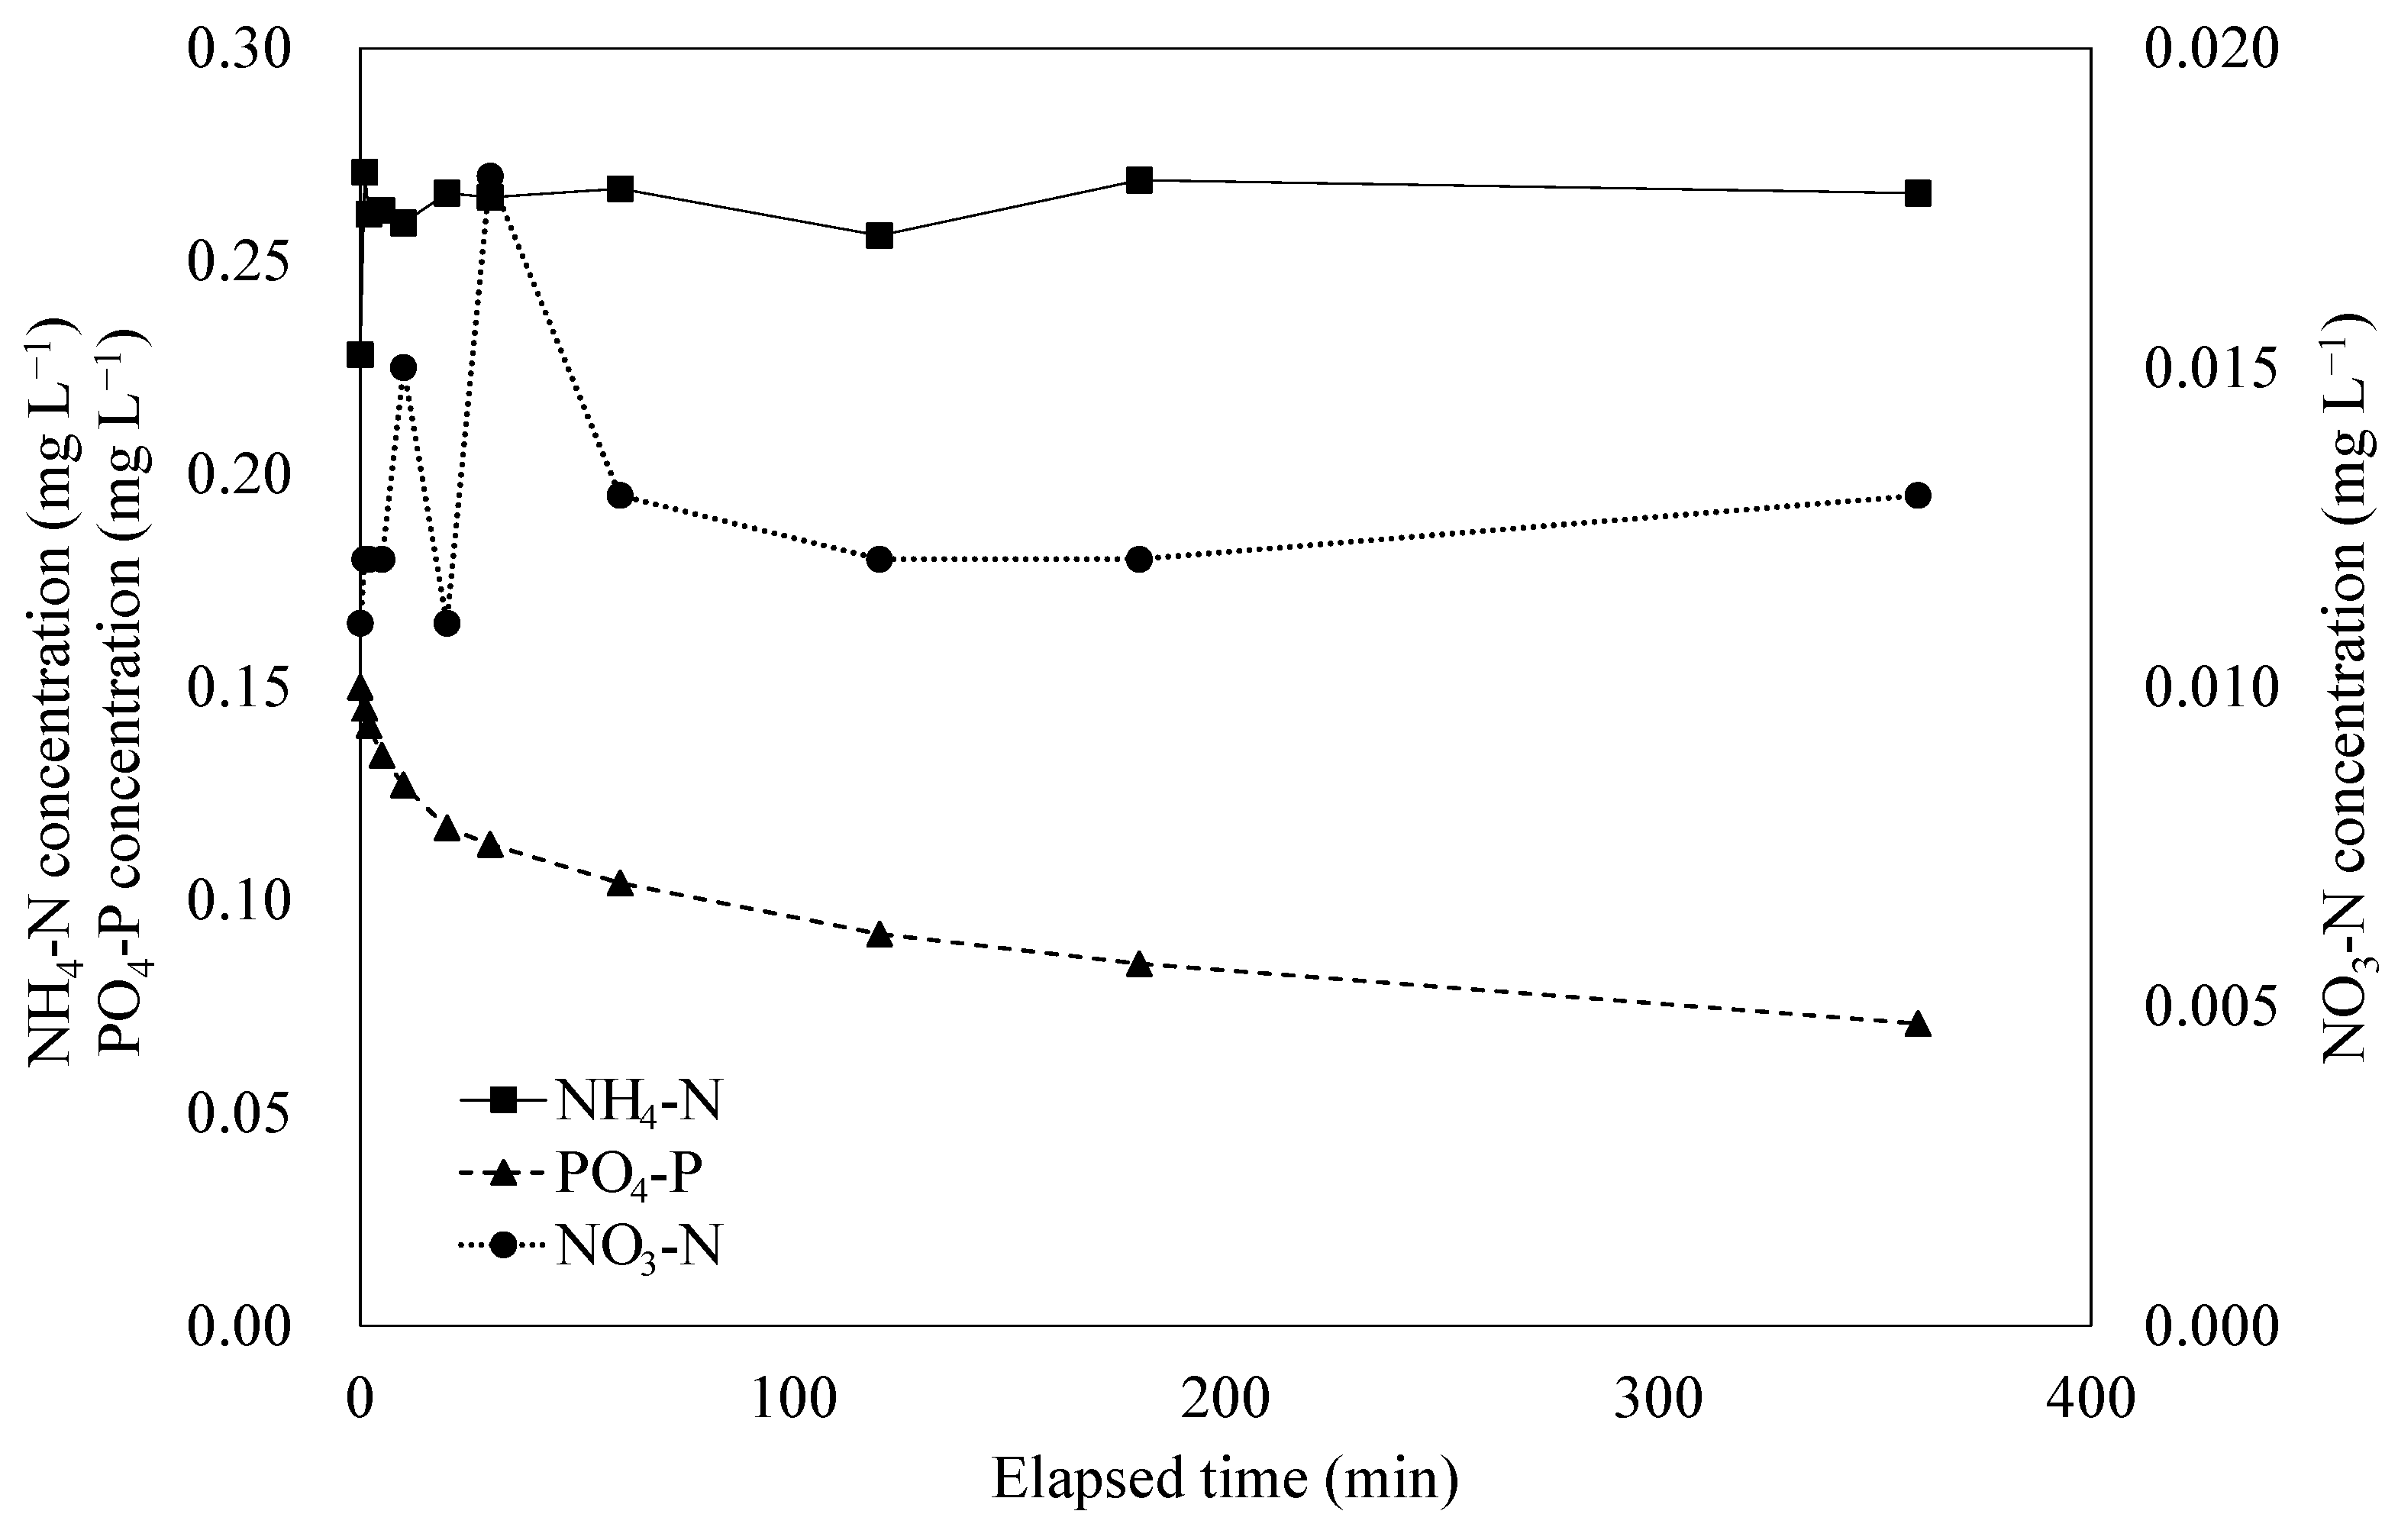
During the experiment, the water temperature remained within the range of 18.6 °C to 20.6 °C because the beakers were kept at room temperature. The pH was 8.2 before the crushed pumice stone was added but decreased slightly to 8.0 after 6 h. The ORP was 391 mV before the crushed pumice stone was added but increased slightly to 400 mV after 2 h and decreased to 391 mV 6 h after the addition. The water temperature, pH, and ORP fluctuated slightly but were not considered to have changed enough to affect nutrient adsorption and desorption. No fluctuations in the NH4-N and PO4-P concentrations in the control beaker were observed.
The concentration of NH
4-N was 0.207 mg L
−1 before the pumice stone was added but increased to 0.228 mg L
−1 immediately after; moreover, it changed to 0.271 mg L
−1 1 min later but remained at approximately 0.26 mg L
−1 after that (
Figure 7a). NO
3-N concentration was 0.009 mg L
−1 before the pumice stone was added but increased to 0.011 mg L
−1 immediately after the pumice stone was added, increased to 0.012 mg L
−1 1 min later, and remained at approximately 0.012 mg L
−1 after that (
Figure 7b). For these reasons, it was considered that what was contained in the pumice stone returned to artificial seawater. However, the amount was not significant, and the release of nitrogen was not considered a vital process. NO
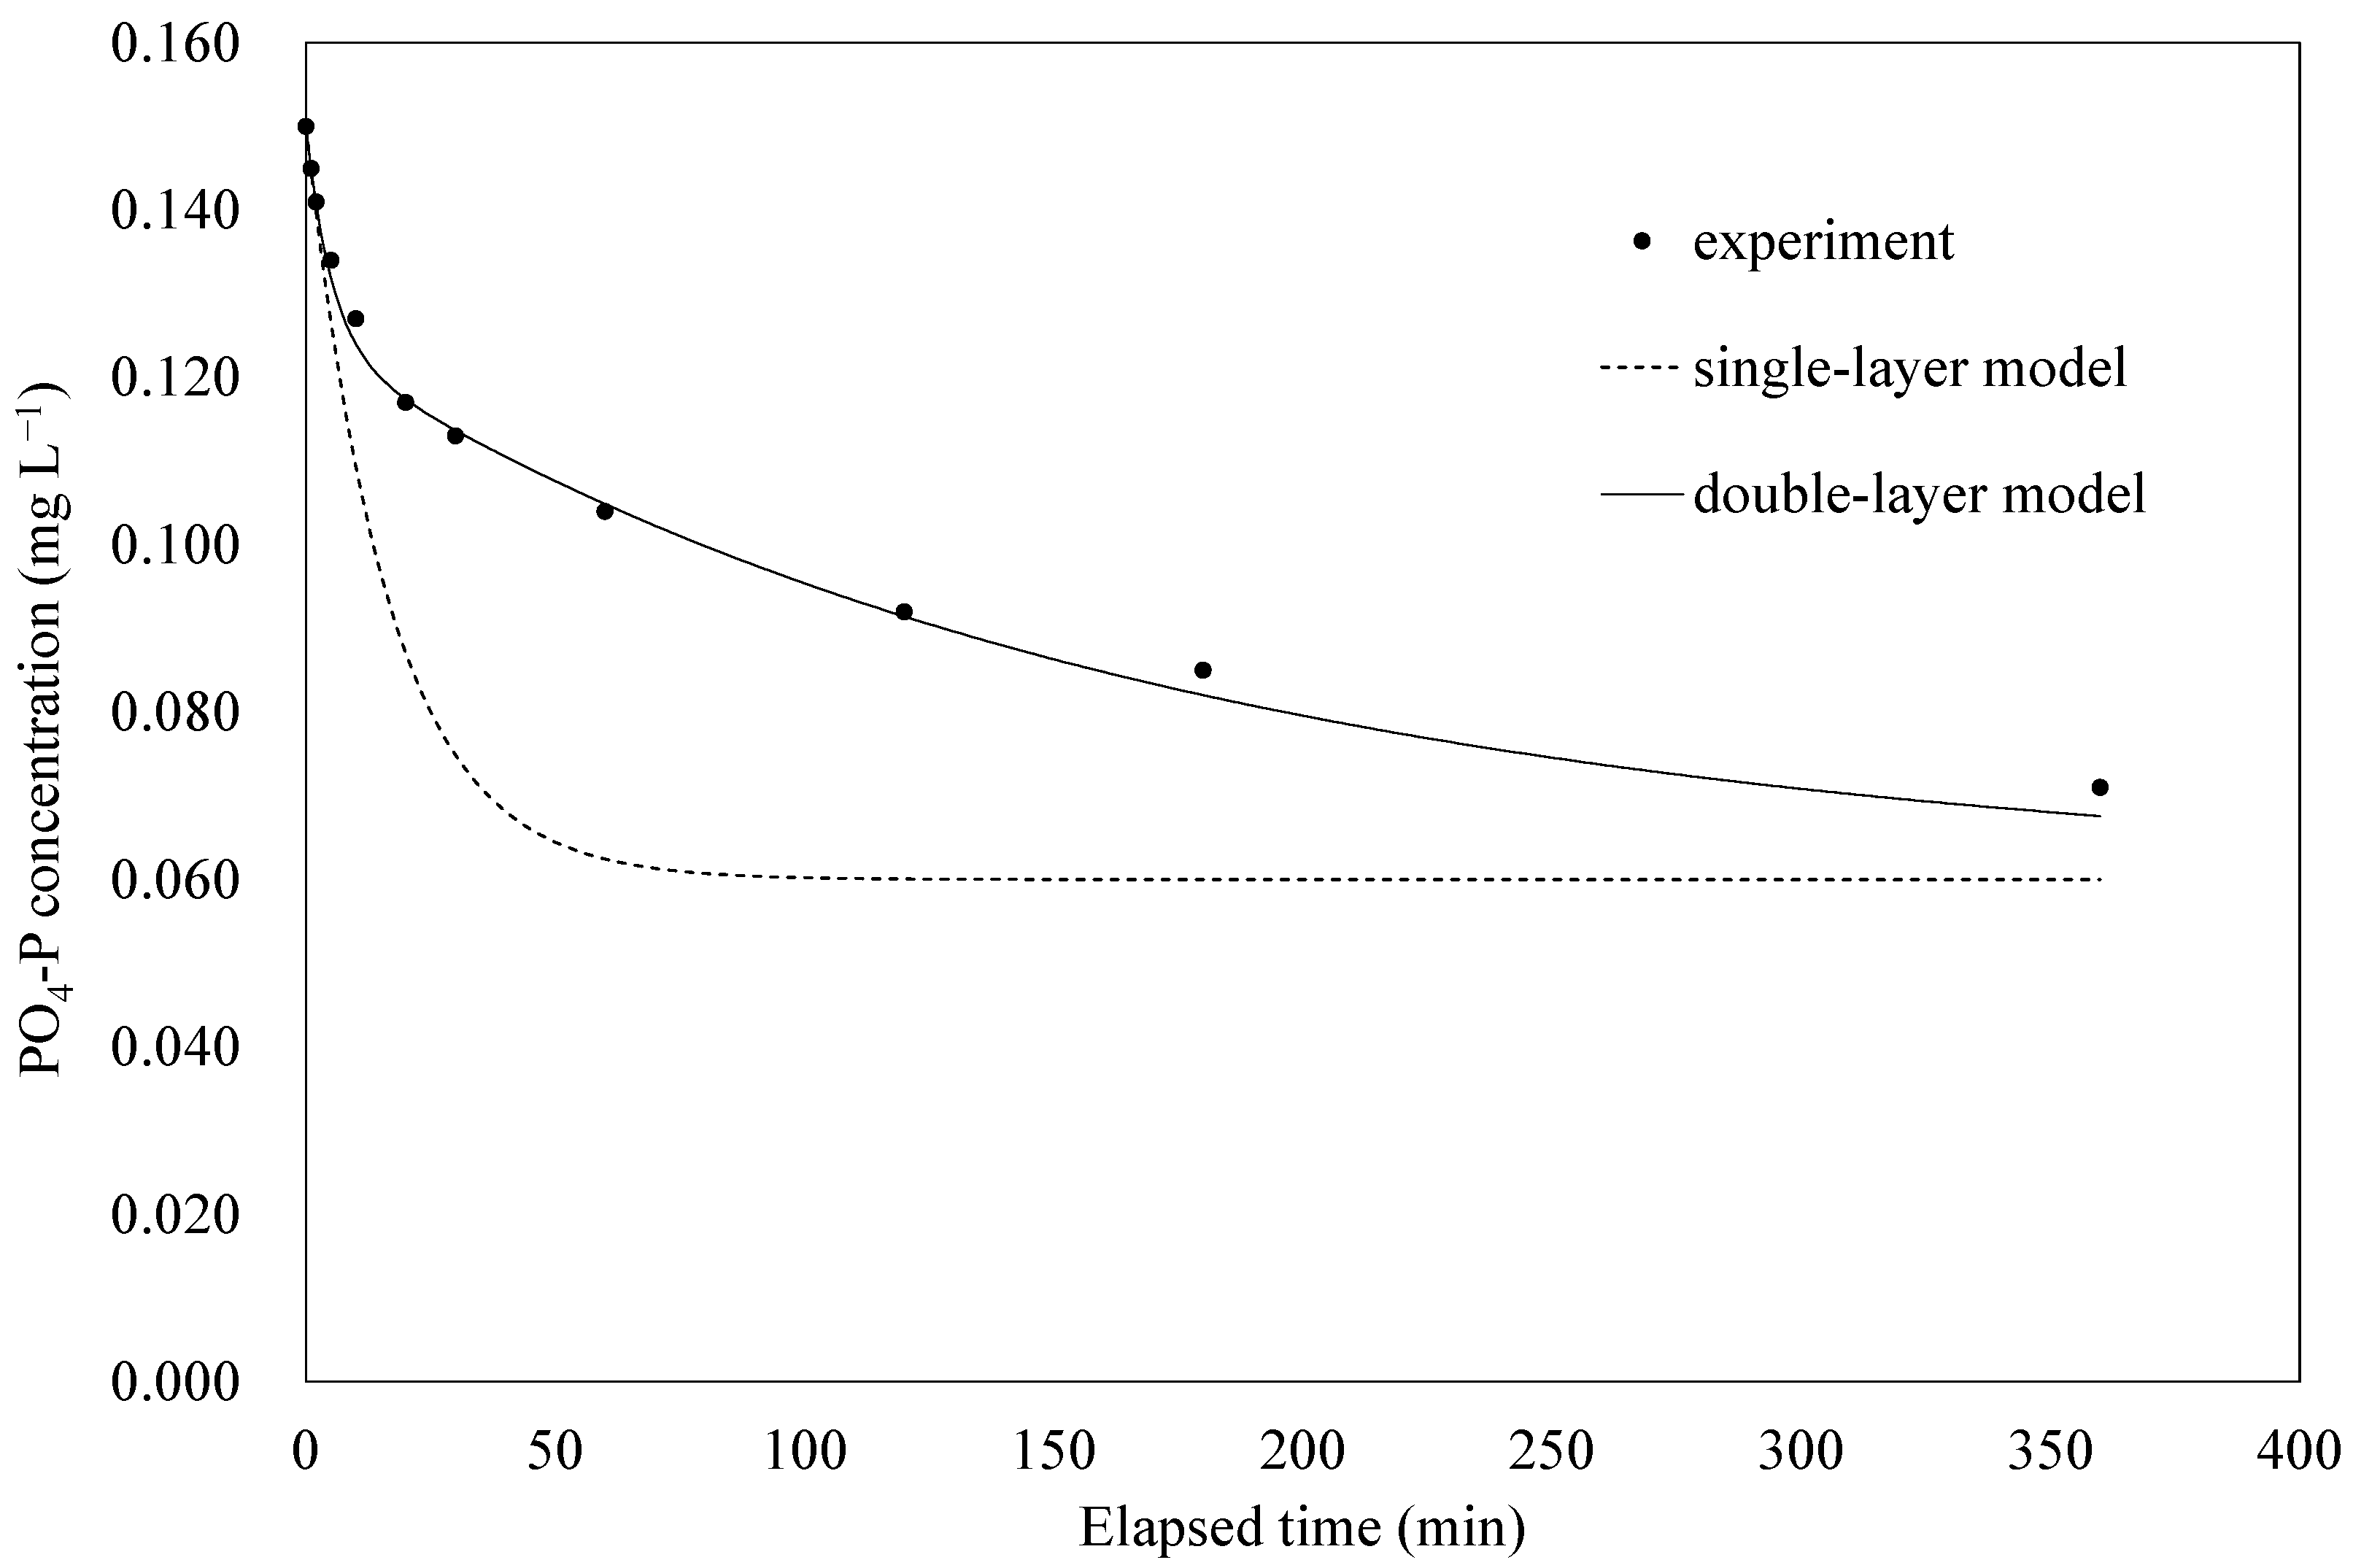
2-N concentration was below the detection limit throughout the experiment. The concentration of PO
4-P was 0.196 mg L
−1 before pumice stone addition but reached 0.150 mg L
−1 immediately and then decreased consistently to 0.071 mg L
−1 after 6 h (
Figure 7c). These results indicate that the crushed pumice stone shows an adsorption effect only on PO
4-P.
3.4. Bivalve Exposure Experiment
The shell length of bivalves used in exposure experiments ranged from 38.45 to 41.24 mm (
Table 2), with no significant difference among them (Kruskal–Wallis test,
n = 5,
p = 0.14). The wet weight of bivalves used in the exposure experiments ranged from 11.32 to 13.95 g. There were no significant differences among the groups (Kruskal–Wallis test,
n = 5,
p = 0.13) (
Table 2). The condition index of bivalves used in the exposure experiments ranged from 30.44 to 33.80, and there was no significant difference between the groups (Kruskal–Wallis test,
n = 5,
p = 0.07). All individuals were healthy adults.
3.5. Exposure Experiments Using Crushed Pumice
The results of the incubation experiment showed that the survival rate remained 100% until day 7 (end of the experiment) at 25 and 100 mg L
−1 concentrations. At 400 and 1600 mg L
−1 concentrations, one individual died on day 2 of the experiment, and the survival rate on day 7 was 80%. At 6400 mg L
−1, one individual died on day 5 of the experiment, and the survival rate on day 7 was 80%. In contrast, in the control experiment, the survival rate remained at 100% until day 7 (
Figure 8).
Water quality analysis showed little difference in water temperature (19.8–20.0 °C), pH (7.97–8.00), and DO (6.9–7.0 mg L−1) in any of the experimental beakers, compared with the control beaker containing the artificial seawater. In the systems where bivalves survived, NH4-N concentration ranged from 0.109 to 0.439 mg L−1, NO2-N concentration ranged from 0.004 to 0.013 mg L−1, NO3-N concentration ranged from the limit of quantification (0.005 mg L−1) to 0.021 mg L−1, and PO4-P concentration ranged from the limit of quantification (0.003 mg L−1) to 0.016 mg L−1. However, in the system in which the bivalves died, NH4-N and PO4-P concentrations increased to 2.29 and 0.142 mg L−1, respectively. The fluorine concentration was 1.3 mg L−1 at both 400 and 6400 mg L−1, which was higher than the lower limit of quantification (0.1 mg L−1). The particle size composition at 400 mg L−1 ranged from 0.564 to 159 μm, with a median particle size of 25.2 μm.
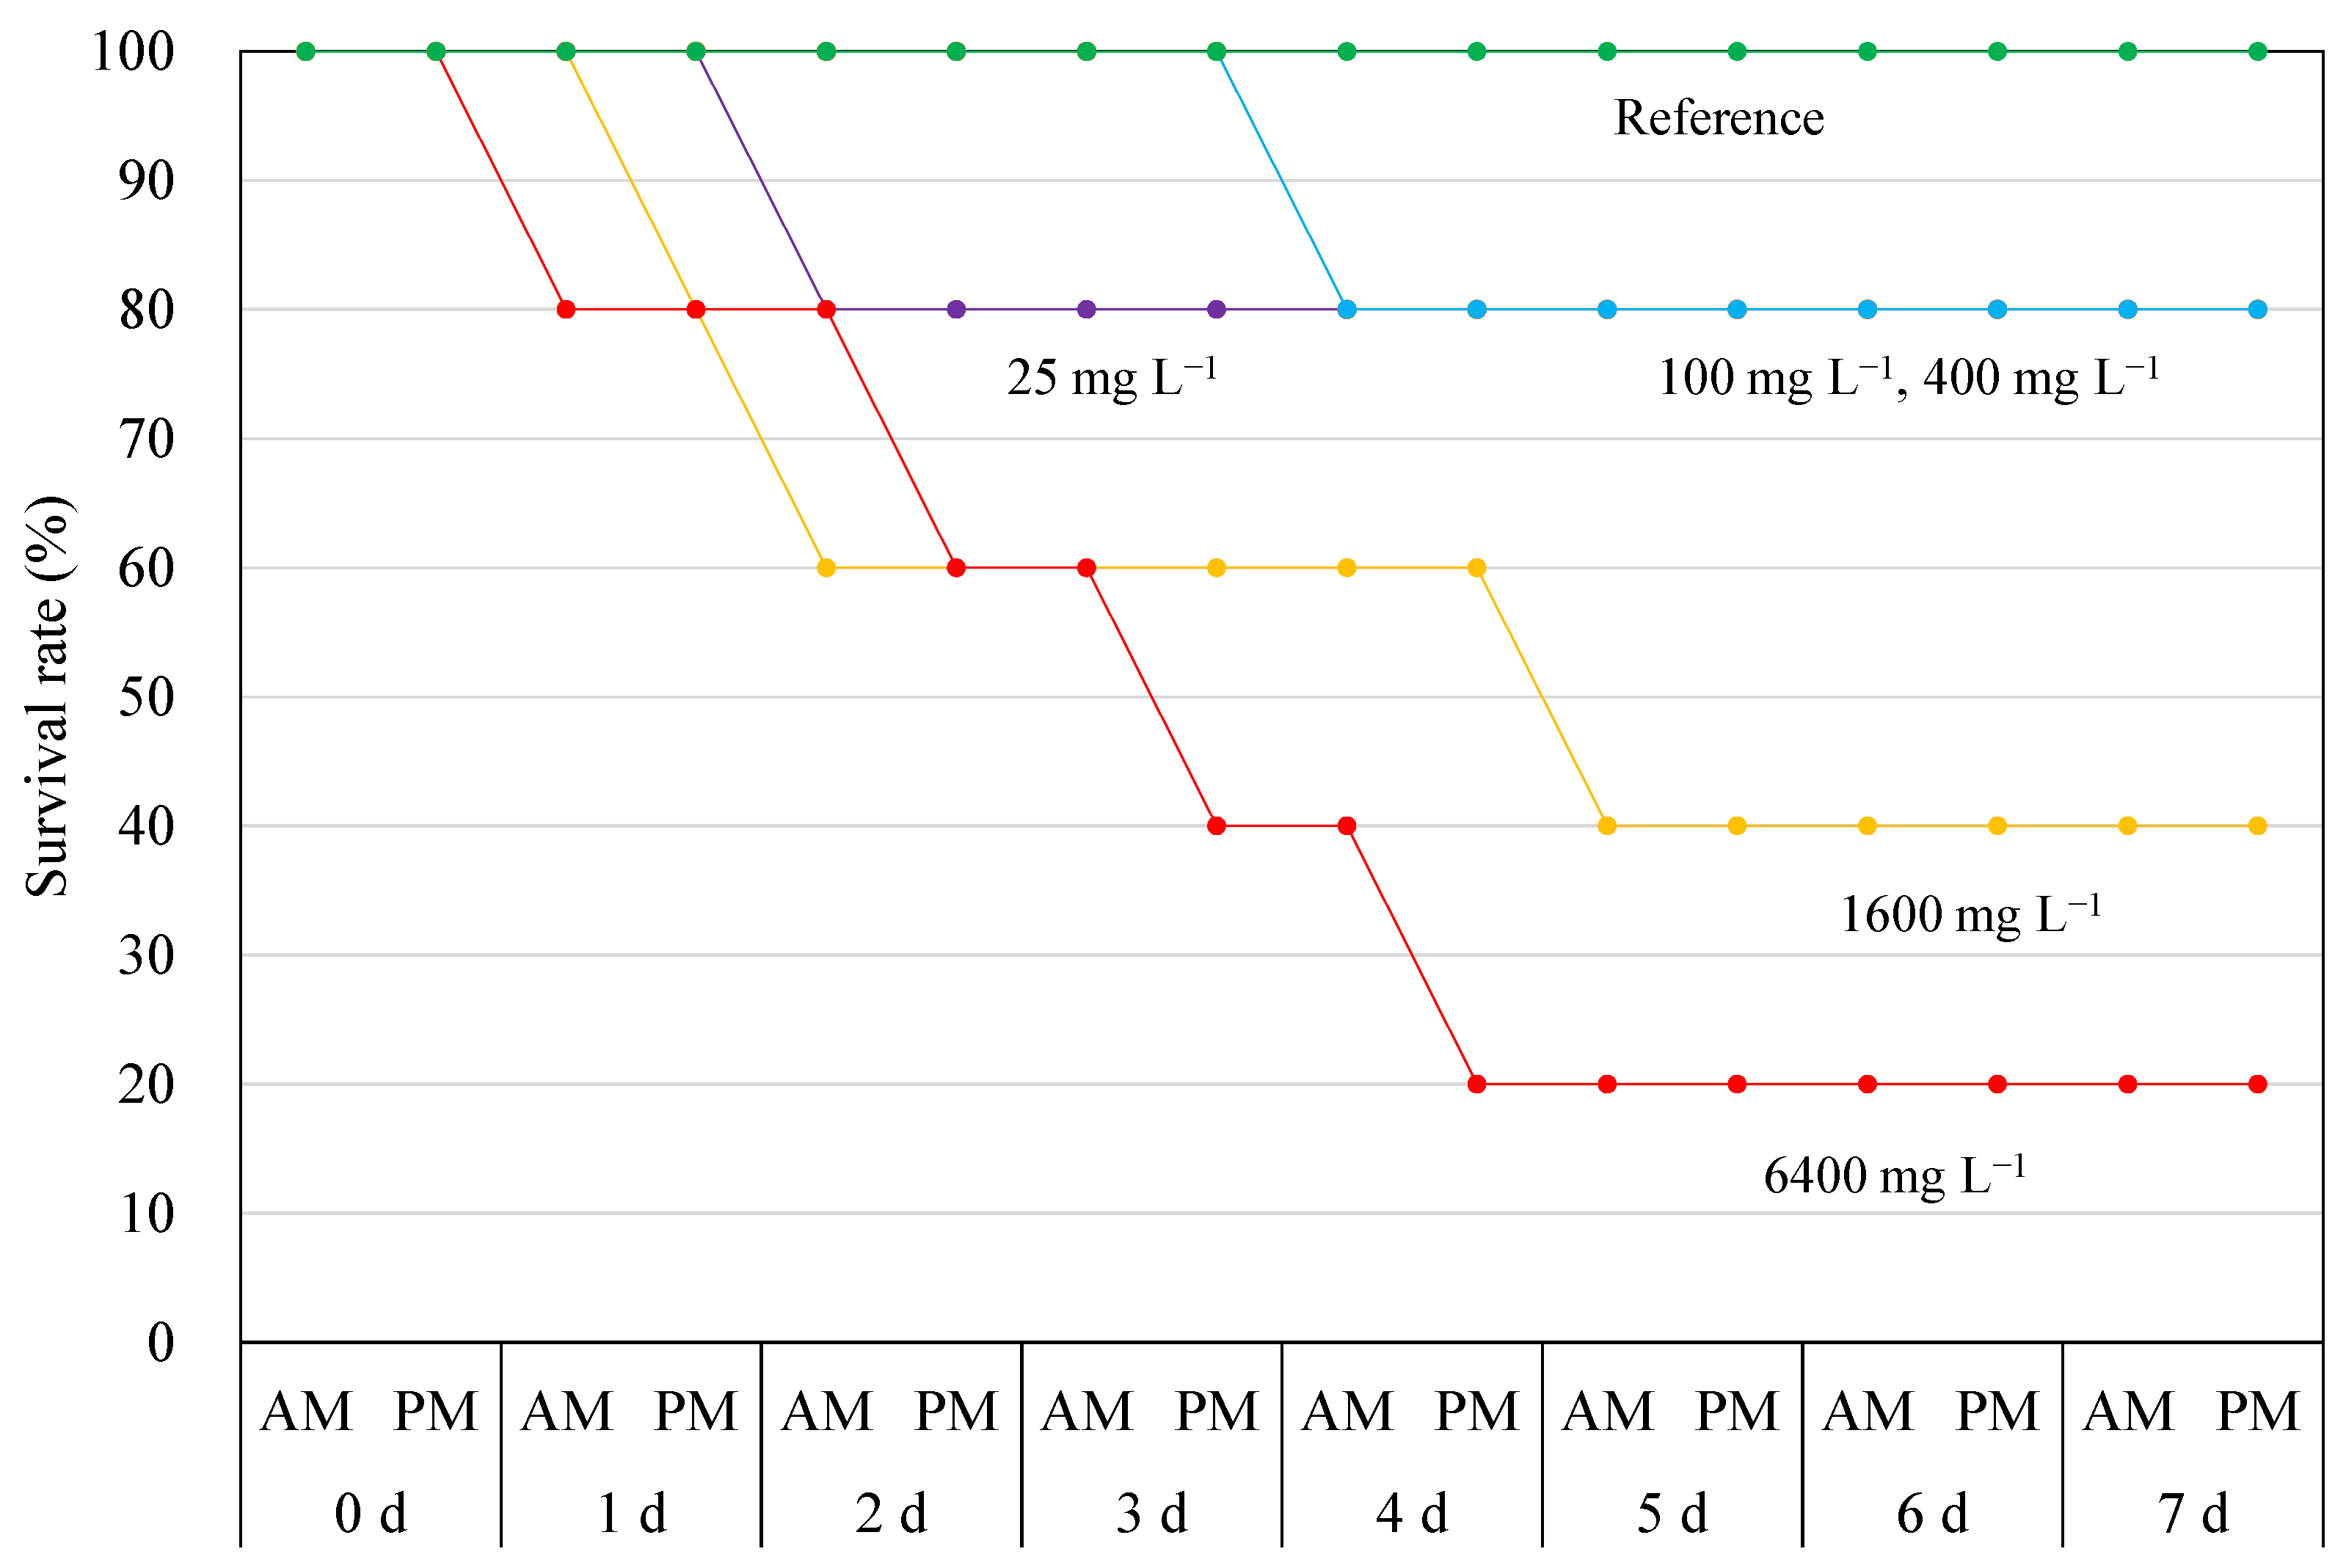
3.6. Exposure Experiments with Kaolin
The results of the kaolin incubation experiment showed that one individual died on day 2 of incubation in the 25 mg L
−1 experiment. One died on day 4 of incubation in the 100 and 400 mg L
−1 experiments (
Figure 9). At 1600 and 6400 mg L
−1, death was confirmed on days 1 and 7; therefore, these bivalves had a survival rate of 40% and 20%, respectively.
Water quality analysis showed little difference in the water temperature (19.8–20.1 °C), pH (7.94–8.00), and DO (6.9–7.1 mg L−1) for all experimental beakers compared with that of the control beaker containing the artificial seawater. For the systems in which bivalves survived, NH4-N concentration ranged from 0.042 to 0.410 mg L−1, and concentrations of NO2-N, NO3-N, and PO4-P ranged from the limits of quantification (0.001, 0.005, and 0.003 mg L−1, respectively) to 0.013, 0.020, and 0.305 mg L−1, respectively. However, for the system in which the bivalves died, NH4-N and PO4-P concentrations increased to 5.78 and 0.397 mg L−1, respectively. In addition, fluorine concentration was elevated to 1.3 mg L−1 at 400 and 6400 mg L−1. Particle size composition ranged from 0.356 to 31.7 μm at 400 mg L−1, with a median particle size of 5.83 μm.

