1. Introduction
Local scour is a phenomenon in which the sediments near the surface of the riverbed around piers, abutments, and other structures are rolled up and carried downstream. Local scour around the piers is caused by the clockwise horseshoe vortex formed near the bottom of the structure and the wake vortex formed in the separation area on both sides of the bridge pier [
1]. Many studies show that local scour is one of the main causes of bridge failure and collapse [
2,
3,
4,
5,
6]. The direct economic loss caused by bridge failure in the United States is up to USD 30 million annually [
7]. Therefore, the study of local scour reduction measures can reduce the number of bridge failures caused by local scour and provide an essential guarantee for the safety and stable operation of bridges.
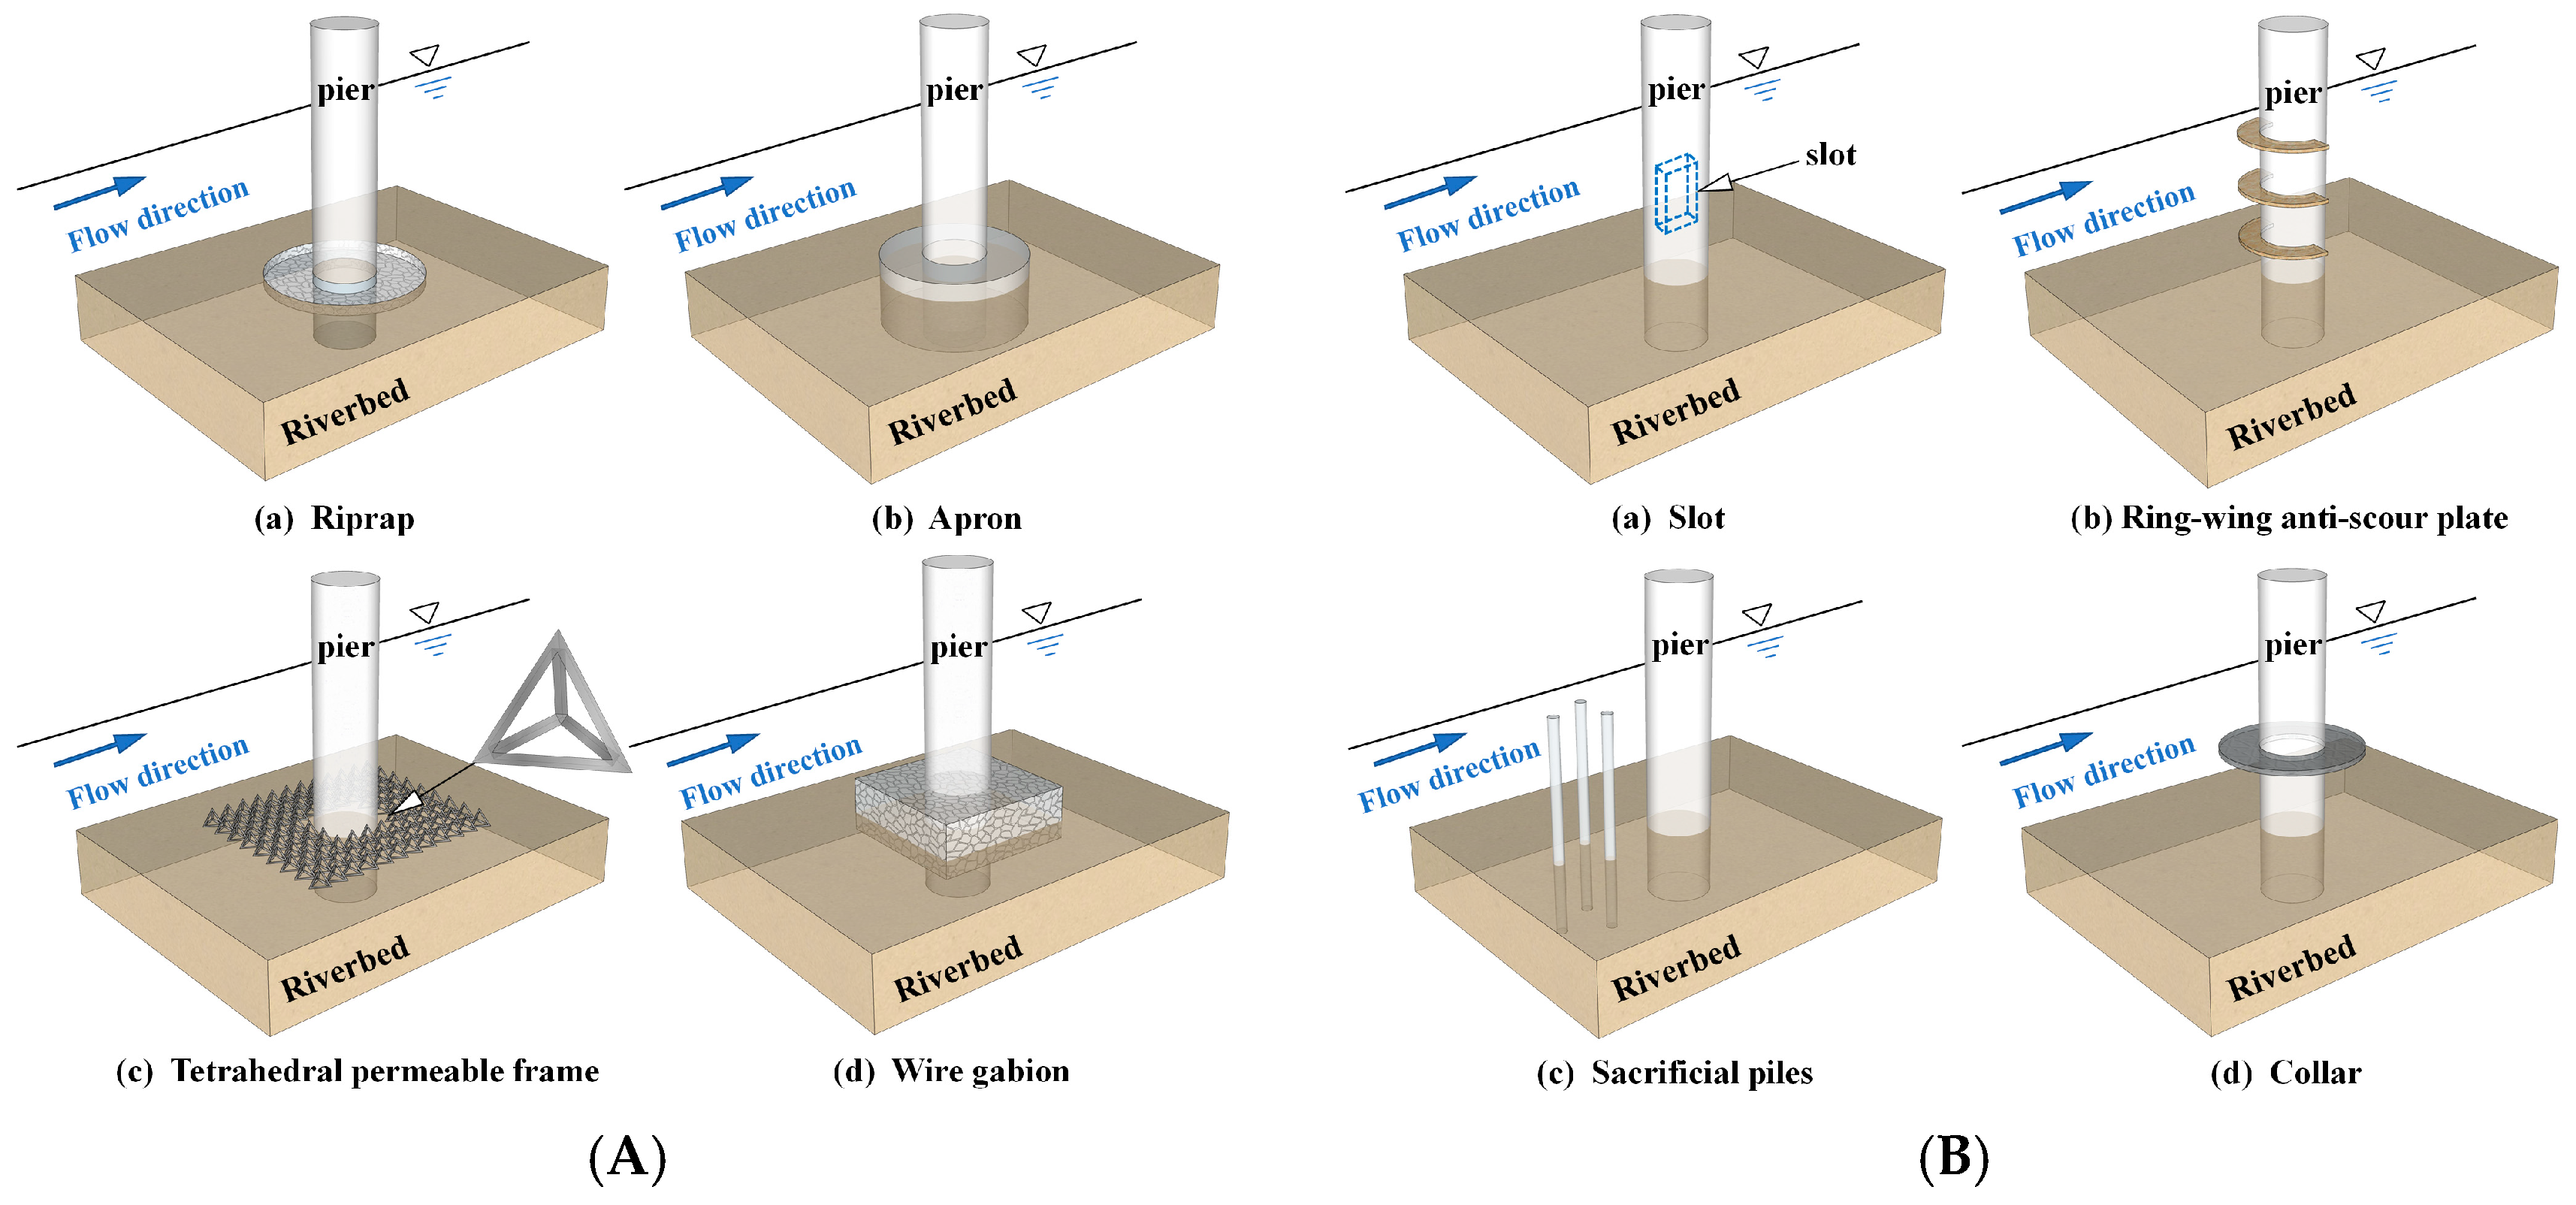
Common scour reduction measures can be divided into active measures and passive measures according to the mechanisms of different measures on the local scouring stifling, as shown in
Figure 1 [
8]. The passive measures are aimed at preventing the movement of the sediment river bed, and includes riprap [
9], apron [
10], tetrahedral permeable frame [
11], and wire gabion [
12]. The active measures are aimed at weakening the downward flow in front of the pier or the horseshoe vortex near the river bed to reduce the local scouring, these methods include slot [
13], ring-wing anti-scour plate [
14], sacrificial piles [
15,
16], and collar [
17].
The collar is a popular active measure due to its simple structure and significant effect. The sediment and pile foundation can be effectively protected from the downward flow and horseshoe vortex in front of the pile by using a collar around it [
18]. Fang et al. [
17,
19] concluded that the main factors affecting the reduction efficiency of the collar are the size, the installation height, and the shape of the collar. Pandey [
20] found that the collar size and installation height have the most significant influence on the local scour depth through sensitivity analysis. Ettema [
21] studied the influence of the collar’s size and installation height on the local scour. The results showed that the local scour reduction efficiency increases with the increase in the collar diameter and decreases with the increase in the collar installation height. Kumar [
22] concluded that the collar divides the flow into two parts, above the collar and below the collar. The collar can effectively resist the downward flow in front of the bridge pier and affect the horseshoe vortex in the area below. Besides the installation height of the collar and the diameter of the collar, Wang [
23] also studied the effect of the collar protection angle on the local scour depth, and the results showed that the best scour reduction effect was achieved when the collar protection angle was 360°. Regarding the shape of the collar, Dargahi [
24] concluded that the shape of the collar had no significant effect on the reduction efficiency. Al-Shukur [
25] compared the reduction efficiency of a circular and rectangular collar in different flow velocities (0.10 m/s, 0.08 m/s, and 0.07 m/s) at different sizes (2.0 D, 3.0 D), and the results showed that the reduction efficiency of the rectangular collar is slightly better than that of the circular collar. Jahangirzadeh [
26] investigated the reduction efficiency of the circular collar and rectangular collar at different installation heights, and the results indicated that the rectangular collar is more effective. Raeisi [
27] studied the scour reduction performance of an elliptical collar, and the results showed that it can effectively weaken the downstream vortex strength, which has better performance than the ordinary circular collar.
In addition, other scholars have studied the characteristics of local scour by changing the form of the collar. Chen [
28] studied the characteristics of local scour by using a new form of the collar, the hooked collar, and the results show that the maximum downward flow is highly reduced by the hook. Another study on the hooked collar also showed that the hooked collar can further reduce the maximum scour depth around the pier [
29]. Valela [
30] proposed a new collar based on an equilibrium scour hole, which is referred to as Collar Prototype Number 3 (CPN3). The results showed that CPN3 is an effective scour reduction measure, which can reduce the maximum scour depth downstream of bridge piers by 69.7%. Qi [
31] studied the reduction effect of circular collars with different tilt angles, and the results showed that the reduction effect is the best when the tilt angle of the collar is 0° (horizontal installation). With the increase in the tilt angle, the local scour depth increased gradually, and the reduction effect gradually weakened.
Above all, scholars all over the world have explored the mechanism of local scour reduction and the reduction effect of the solid collar, and achieved countless innovative results which can provide a vital reference for local scour reduction. However, the local scour around the piers often causes the collar to overhang, and the weight of the solid collar will cause deformation and even damage to the collar, which will lead to the loss of local scour reduction of the solid collar. To address the above shortcomings of the solid collar, a new form of permeable collar was proposed in this paper. Compared with the solid collar, the permeable collar is lighter using the same conditions of the design parameters (mainly the size), which has a smaller effect on the deformation when the collar is overhung above the river bed. So, the risk of further damage can be reduced. It is more beneficial to the safety of the collar itself and the bridge. Meanwhile, the permeable collar uses less material and is more economical. The local scour reduction effect of the permeable collar was studied using indoor experiments. The research results can provide a reference for local scour reduction of bridge piers.
2. Methodology
2.1. Experimental System
The experiments were carried out in the Key Laboratory for Special Area Highway Engineering of the Ministry of Education at Chang’an University. The experimental system consisted of a water supply and circulation system, a sharp-crested weir, and a test flume. The flume was 20.0 m long, 1.6 m wide, and 0.7 m high, as shown in
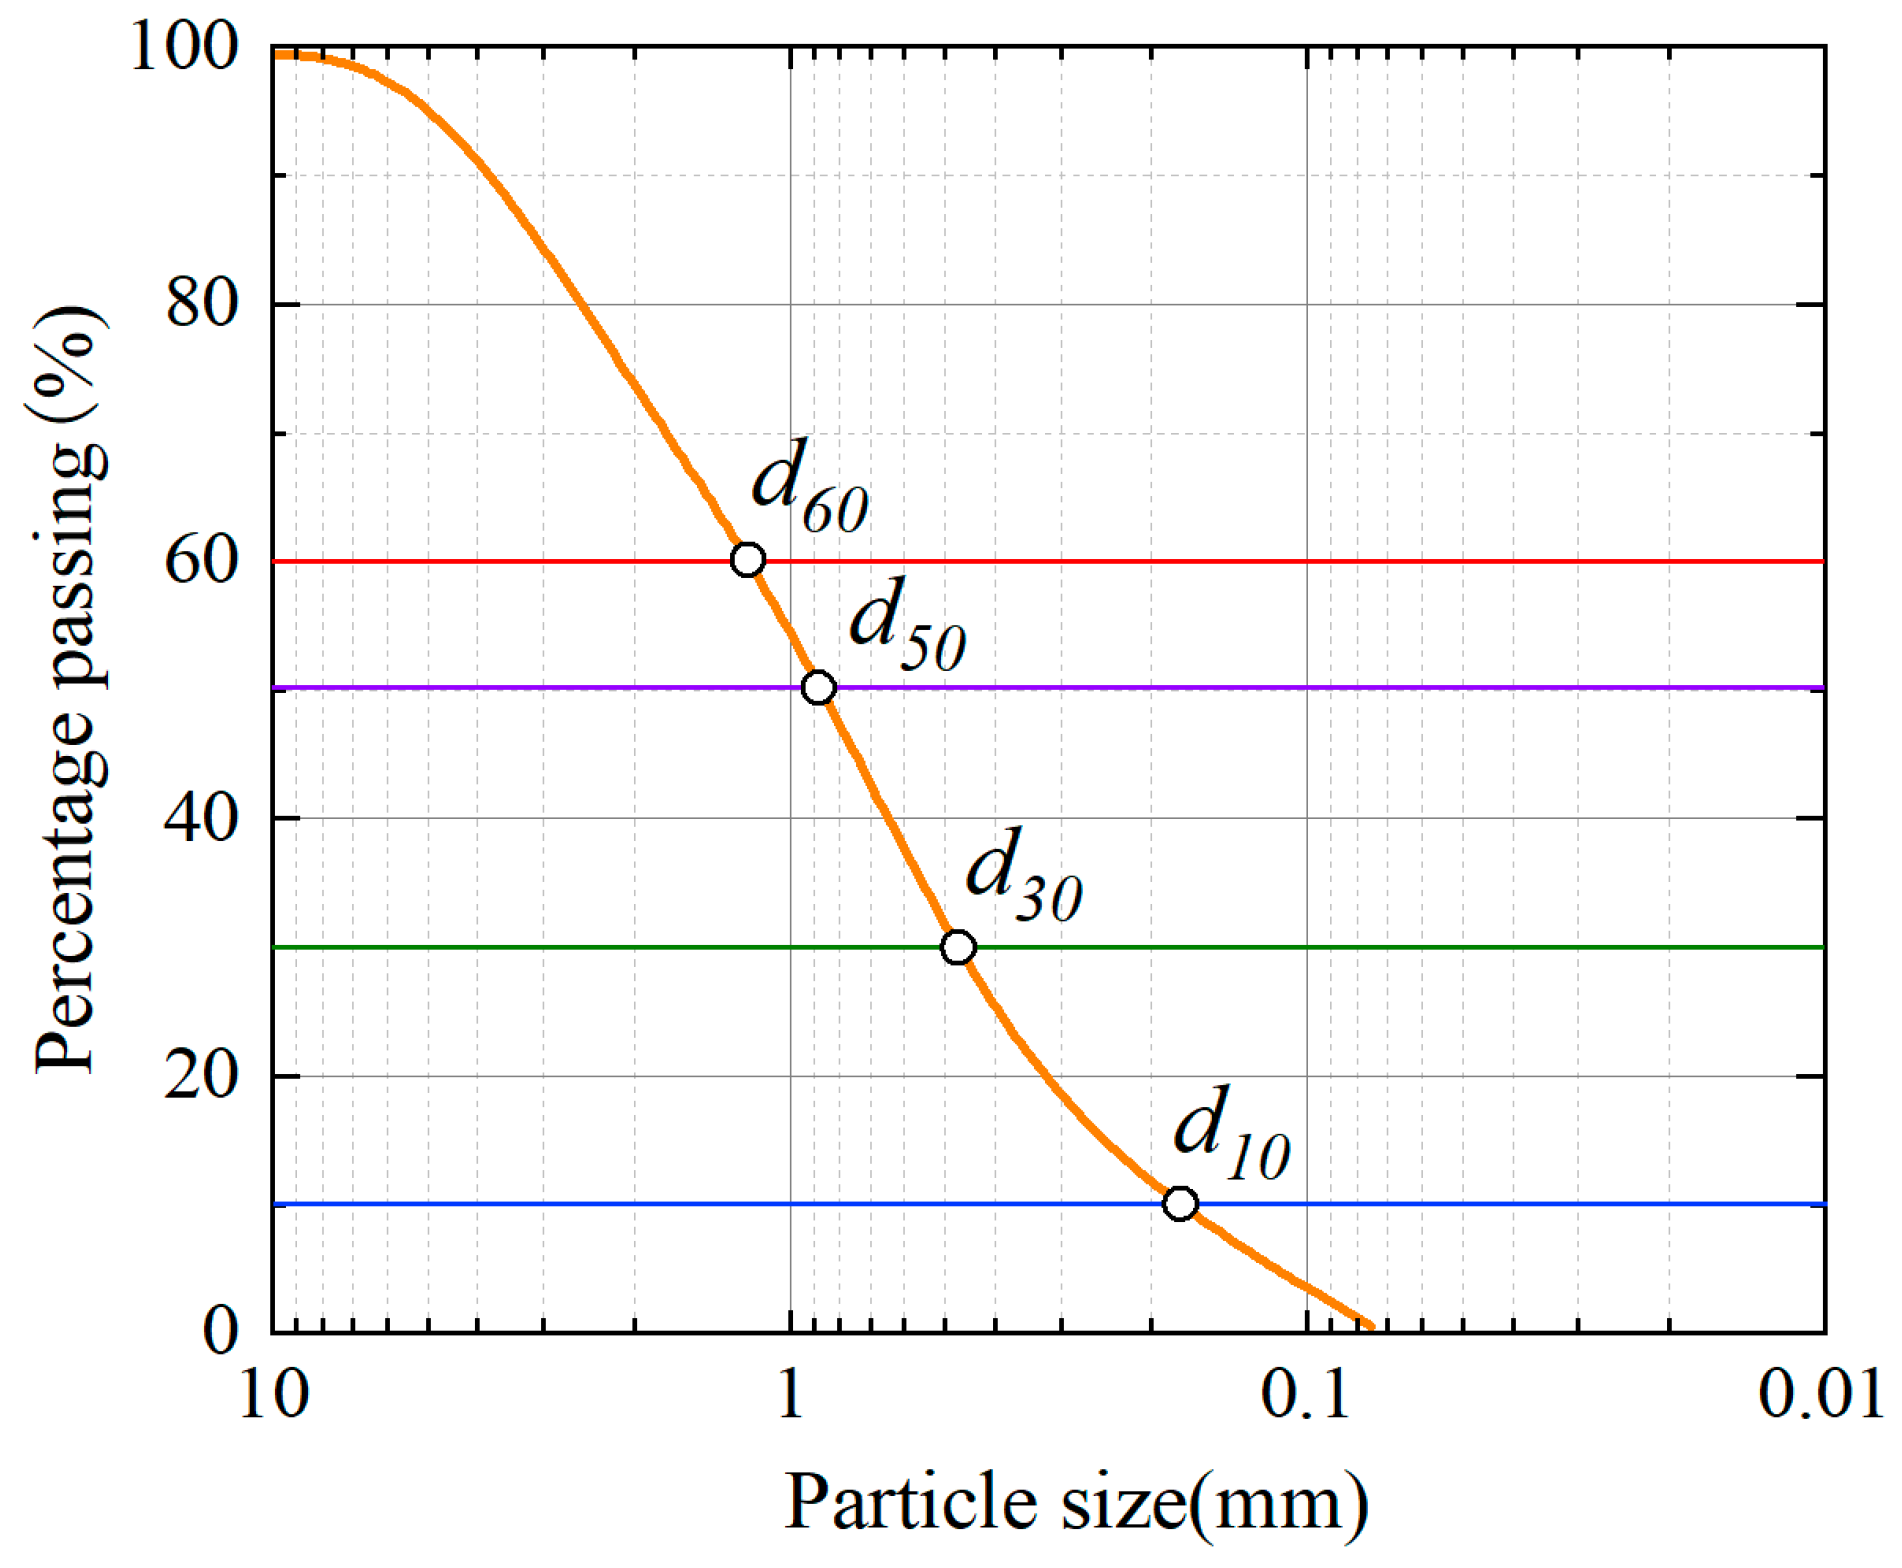
Figure 2. The side walls and bottom of the flume were plastered with cement mortar. The flume consisted of three parts: the steady flow section, the test section, and the outlet section. The steady flow section was located at the entrance of the test flume with a length of 7.0 m. It was used to make the water flow into the test section smoothly and uniformly. The test section was located in the middle of the test flume with a length of 7.0 m, the bottom of which was covered by sediment with a thickness of 0.15 m. The density of the sediment was 2.35 g·cm
−3, the median particle size
d50 was 0.89 mm, the uniformity coefficient was 7.16, and the curvature coefficient was 0.95. The sediment had a continuous gradation and met the test requirements; the gradation curve of the sediment is shown in
Figure 3. The outlet section was located downstream of the flume with a length of 6.0 m, including a sedimentation tank, baffle, and tailgate. The flow depth was 0.20 m, and the starting velocity of sediment was 0.349 m/s which was calculated using Zhang Ruijin’s formula [
32]:
where
V0 is the starting velocity of the sediment;
h is the flow depth;
d is the average particle size of the sediment. The average flow velocity is 0.325 m/s in this study, which is less than that of the starting velocity of the sediment. Therefore, the experiments carried out in this study were in clear water.
2.2. Factor Analysis
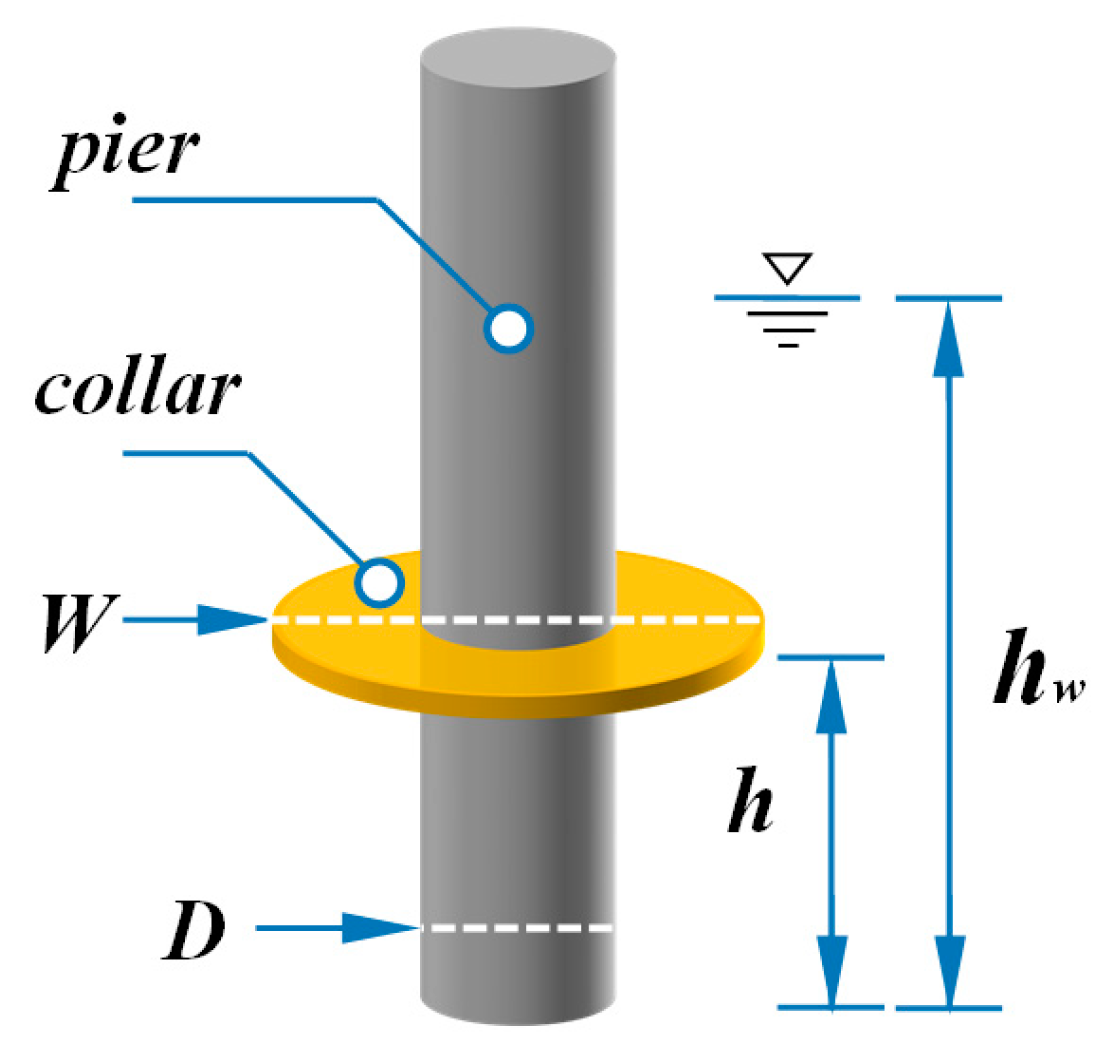
The summary of the previous research results shows that the main factors affecting the reduction efficiency of the solid collar are the diameter (
W), the installation height (
h/hw), and the shape, shown in
Figure 4. For the diameter of the collar, Fang [
19] considered that the collar size should be greater than or equal to 3.0 times the diameter of the bridge pier. Jahangirzadeh [
26] found that the scour reduction changed by only 1.7% when the collar diameter exceeded 3.5 times the diameter of the bridge pier. Therefore, Jahangirzadeh concluded that
W = 3~3.5 D is a more cost-effective range. For the installation height of the collar, the current research results all agree that the reduction efficiency is the best when the collar is installed near the riverbed (
h/hw = 0) [
24]. For the shape of the collar, the reduction effect of the rectangular collar is better than that of the circular collar in most cases. However, considering the problem of water incidence angle, the rectangular collar does not guarantee the same effect under any angle of the incoming flow. In contrast, the circular collar does not have that problem, although its reduction efficiency is slightly lower than that of the rectangular collar. Therefore, the circular collar was used in this paper.
2.3. Experimental Setup
According to the conclusion in
Section 2.2 [
19,
24,
26], the construction difficulties, the cost in practical applications, and the reduction effect of the porosity of the collar on local scour were studied in constant conditions with the collar installation height (
h/hw = 0), and the collar size (W = 3.0 D) at first. Then, the effects of the installation height, collar size, and thickness on the reduction efficiency were studied based on the optimal porosity. The experimental conditions are shown in
Table 1.
There were five groups of experiments in this study, named A, B, C, D, and E. Group A is for the local scour characteristics of bridge piers without permeable collars. There is one experiment labeled A, which is a control experiment. Group B studied the local scour characteristics around the bridge pier by using permeable collars with different porosities. There are eight experiments numbered B1–B8 in order. There are eight levels of collar porosity, γ, 0%, 12.5%, 25.0%, 37.5%, 50.0%, 62.5%, 75%, and 87.5%. Group C studied the local scour characteristics around the bridge pier using permeable collars installed at different heights (h/hw). There are three experiments numbered C1–C3 in order. There are three levels of installation height: 0.05, 0.10, and 0.15. Group D studied the local scour characteristics around the bridge pier by using permeable collars with different diameters (W/D). There are five experiments numbered D1–D5 in order. There are five levels of diameters: 2.0, 2.5, 3.5, 4.0, and 4.5. Group E studied the local scour characteristics around the bridge pier using permeable collars with different thicknesses (T/D). There are four experiments numbered E1–E3 in order. There are three levels of thickness: 0.30, 0.45, and 0.60.
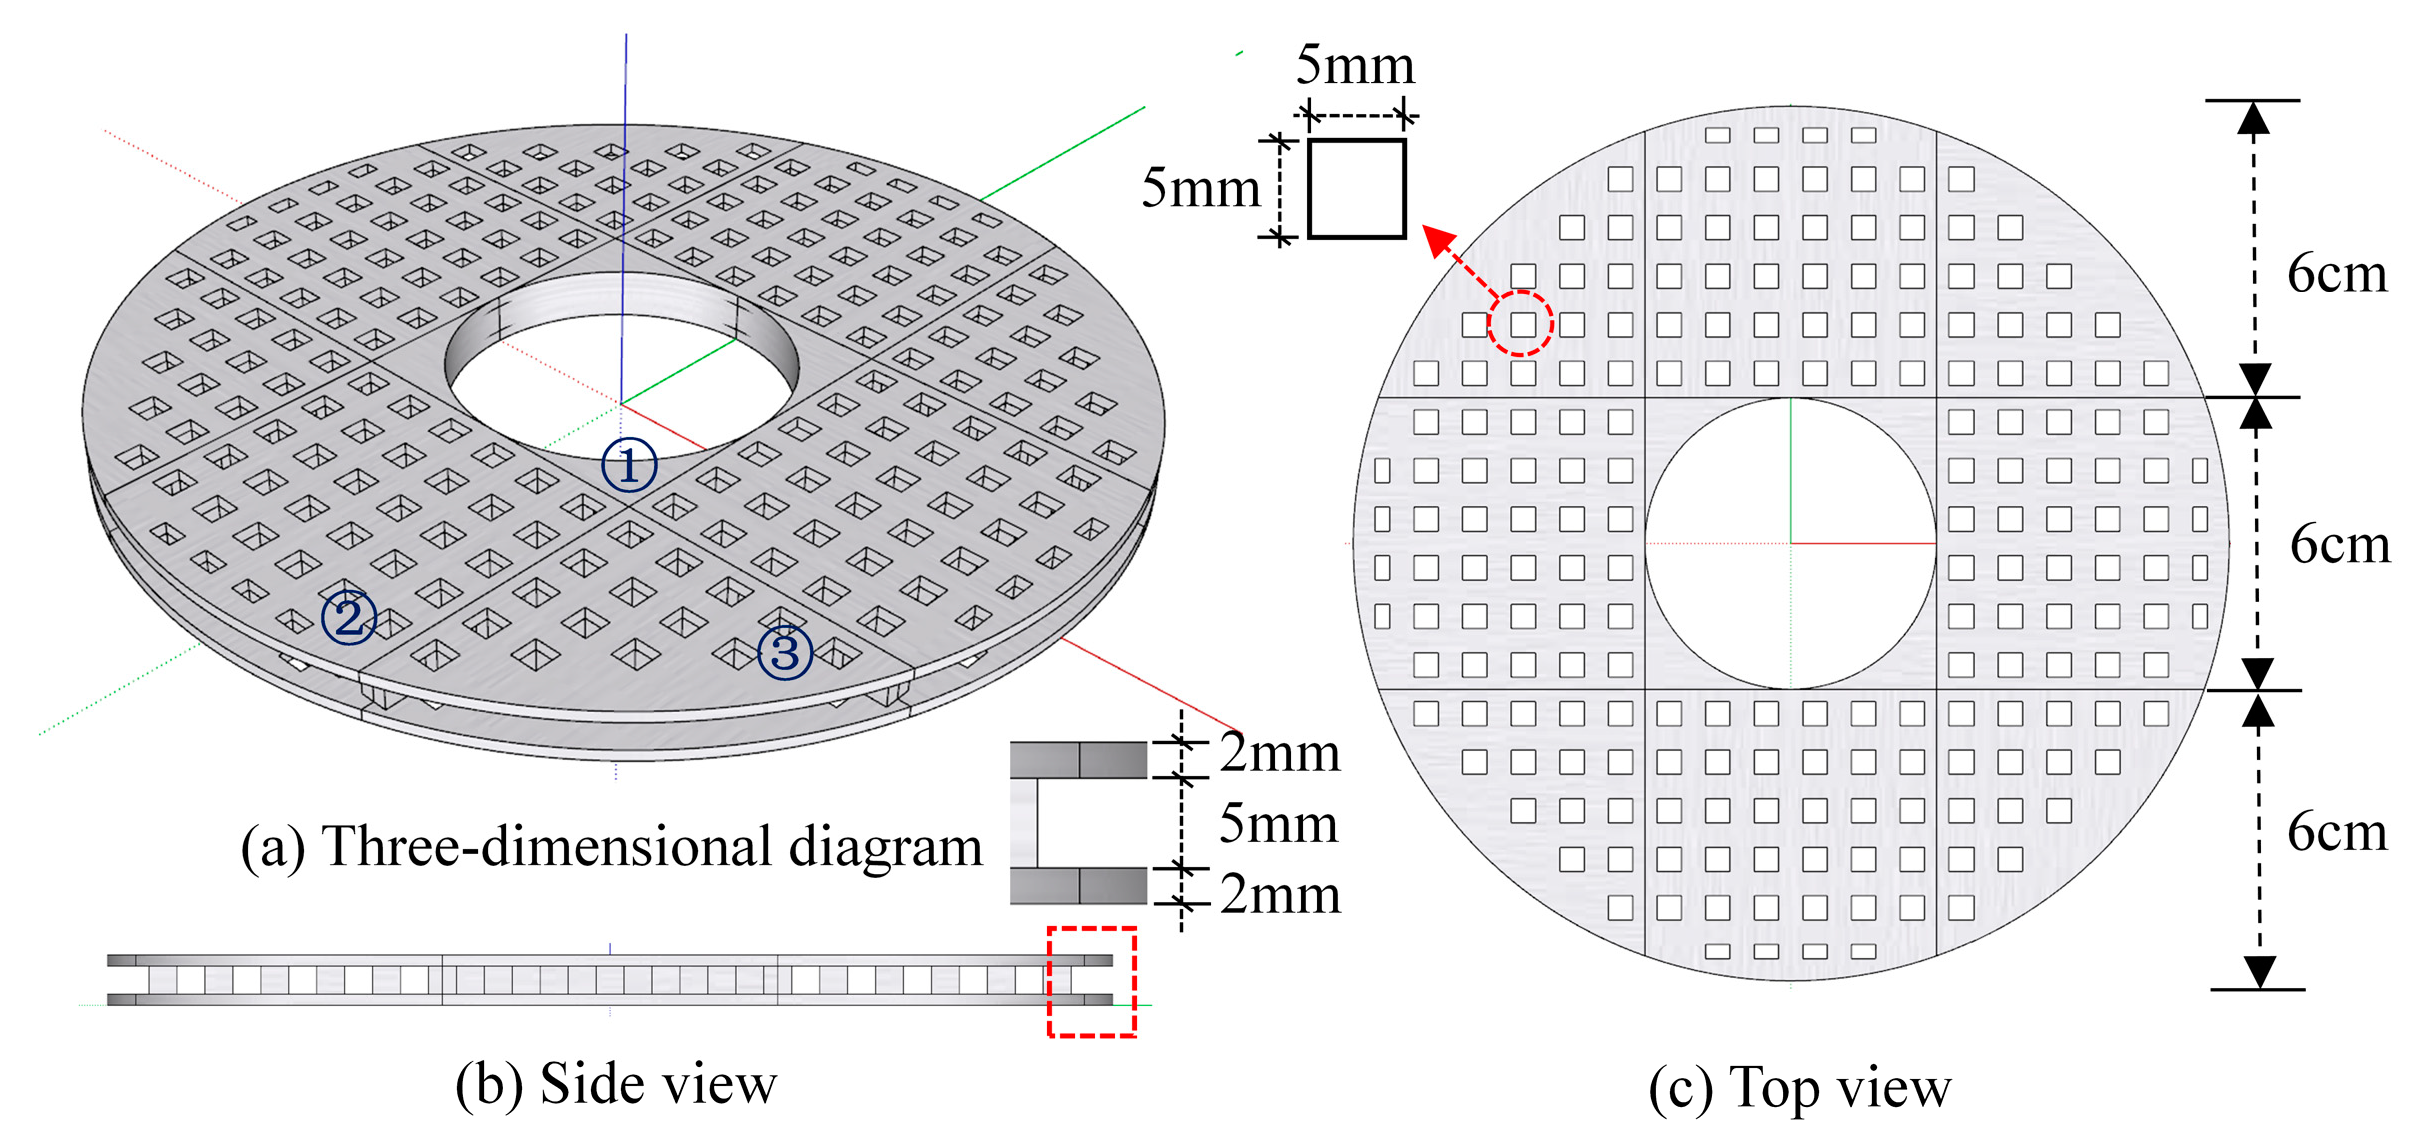
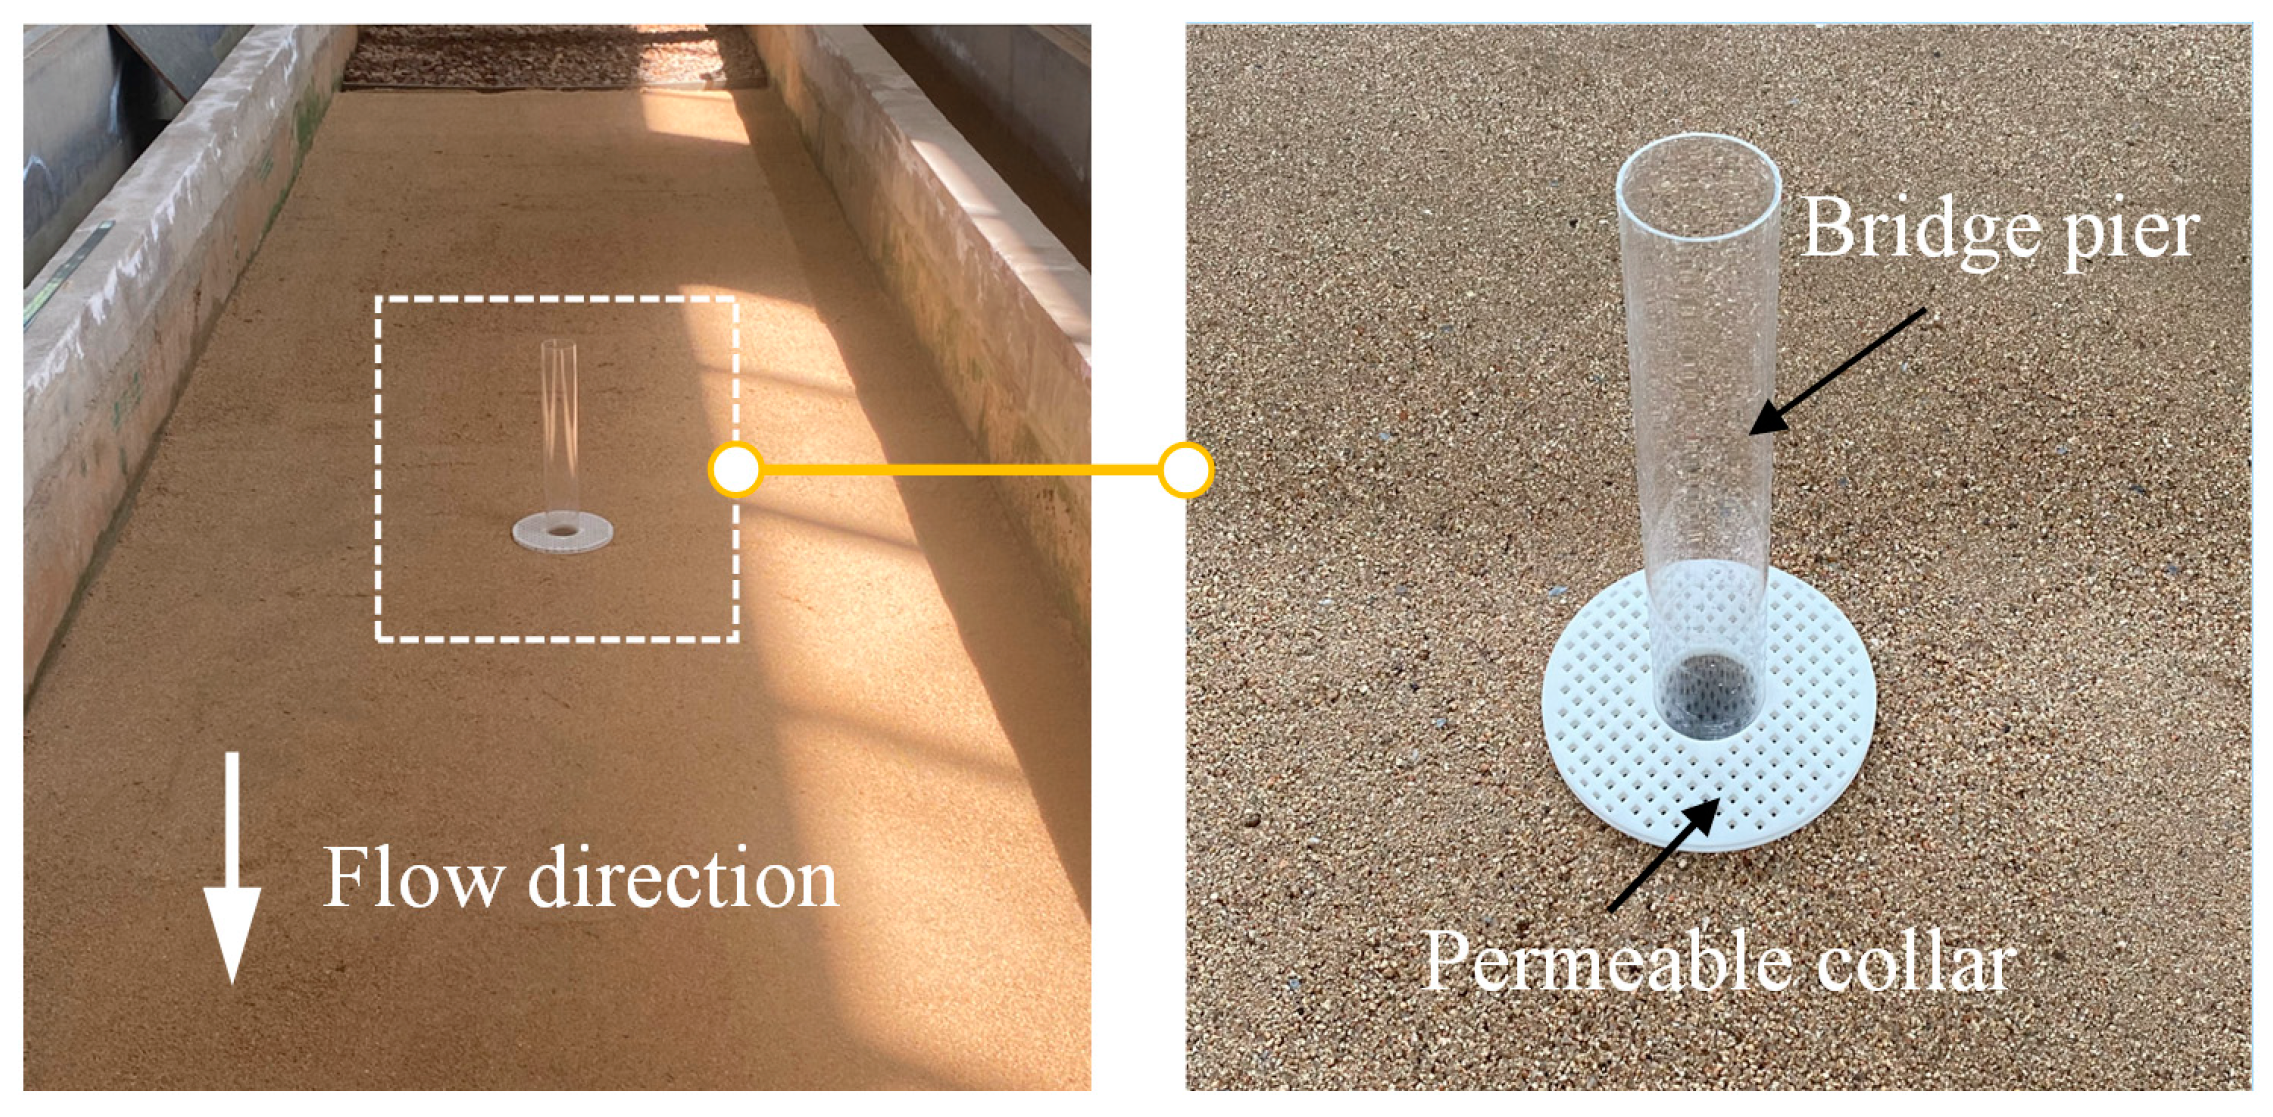
The bridge pier model used in this study was a PVC plastic pipe with a diameter and height of 0.06 m and 0.5 m, respectively. The permeable collar models used in this study were printed by a 3D printer with toughened photosensitive resins. The tensile strength, bending strength, elastic modulus, and hardness of resin materials were 47 MPa, 67 MPa, 2650 MP, and 79, respectively. A hollowed-out design was used for the collar model to make it permeable, as shown in
Figure 5. The bridge pier and the permeable collar model in the experiment are shown in
Figure 6.
2.4. Reduction Efficiency
The maximum local scour depth of an unprotected single pier generally occurs in front of the pier, which has been used to measure or evaluate the scour situation around the pier by scholars around the world. However, if the bridge pier is protected by local scour reduction measures, such as using permeable collars in this paper, the location of the maximum scour depth moves far away from the pier to downwards around the measures, the shape of the local scour pit changes greatly, and the scour depth around the pier is smaller. Therefore, it is one-sided to measure and evaluate the reduction efficiency of the preventative measure if only using the maximum local scour depth, and it cannot accurately measure the reduction efficiency of the collar.
To accurately measure the local scour reduction efficiency of the permeable collar, the local scour reduction efficiency,
EP, was defined as follows:
where
dse is the average scour depth of the region without preventative measures;
dsec is the average scour depth of the region in different conditions using the permeable collar.
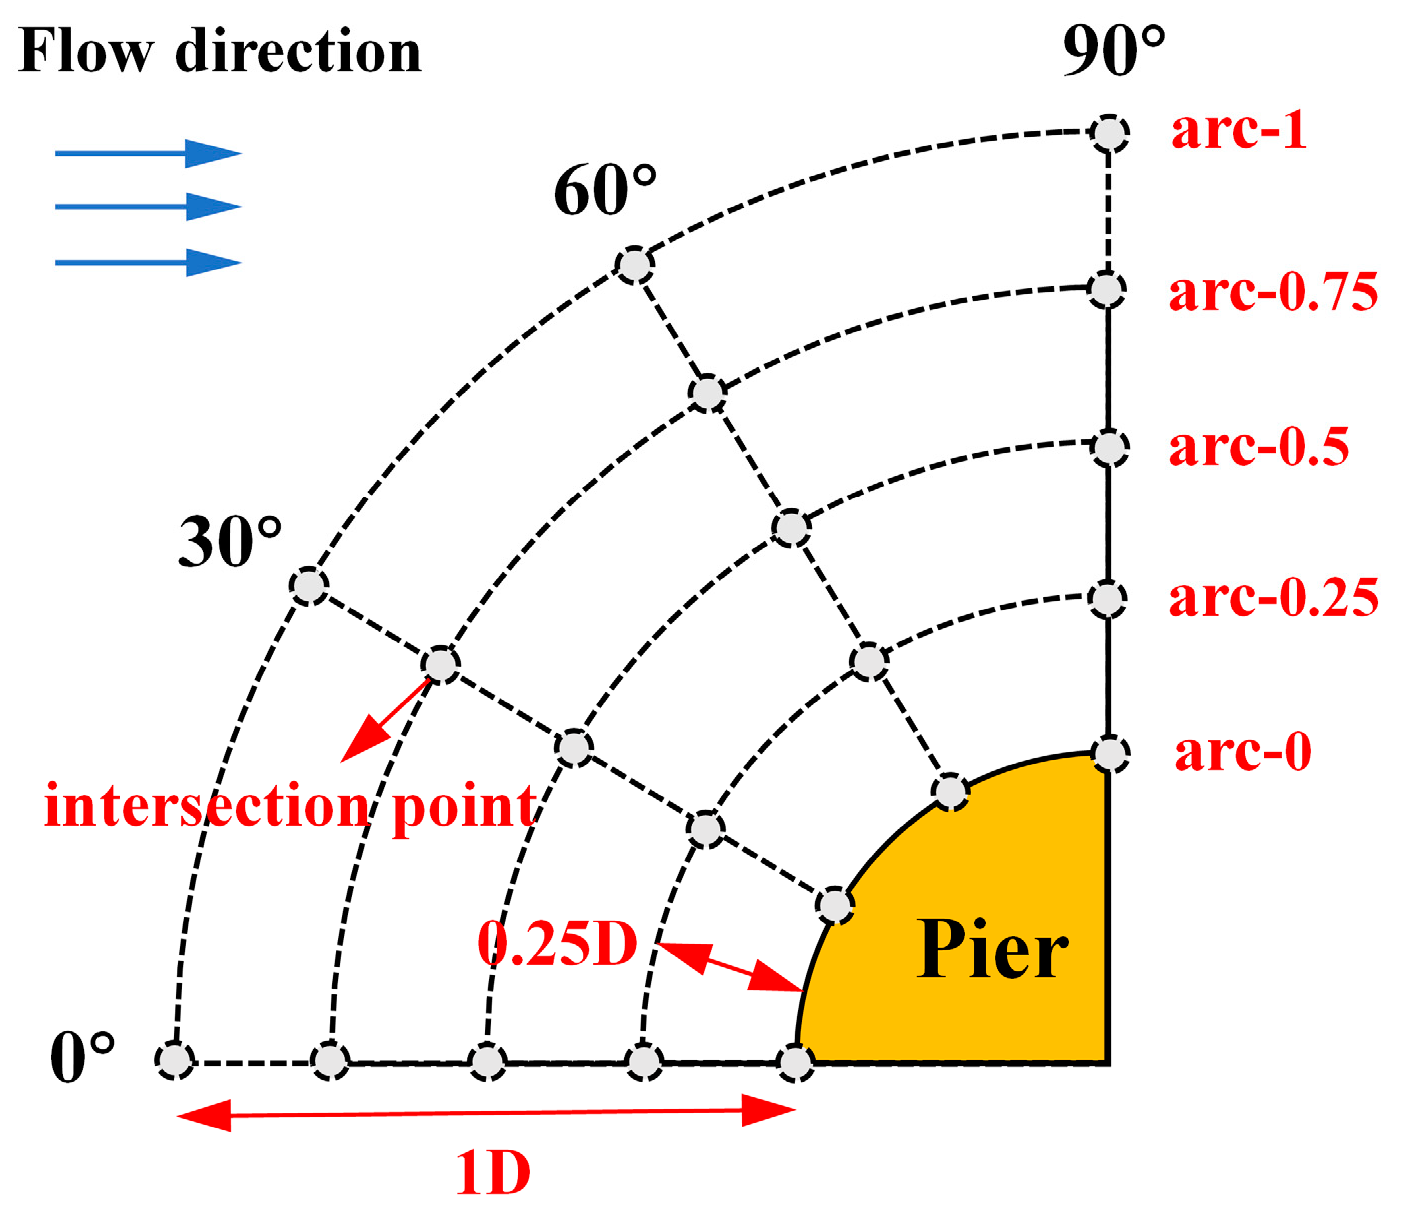
Local scour in the case of a single pier without preventative measures and with the permeable collar mainly occurred in the range of −90° to +90° (along the flow direction) around the pier, and the scour pit was symmetrical. Therefore, in this paper, the range of 0°~90° around the pier with a radius of 1.0 D was divided into 5 annular zones by a length of 0.25 D, and each arc was named arc-0, arc-0.25, arc-0.5, arc-0.75, and arc-1 in order from inside to outside. Meanwhile, each arc was divided into 3 equal parts, so there were 4 intersection points on each arc and a total of 20 intersection points in the range of 0~90°, as shown in
Figure 7. The average local scour depth of 4 intersections on each arc was taken as the scour depth of the arc, and the average local scour depth of all intersections (20 points) in the region was taken as the regional local scour depth which was used to calculate the reduction efficiency of the permeable collar.
3. Results and Discussion
3.1. Local Scour around a Single Pier without a Permeable Collar (Group A)
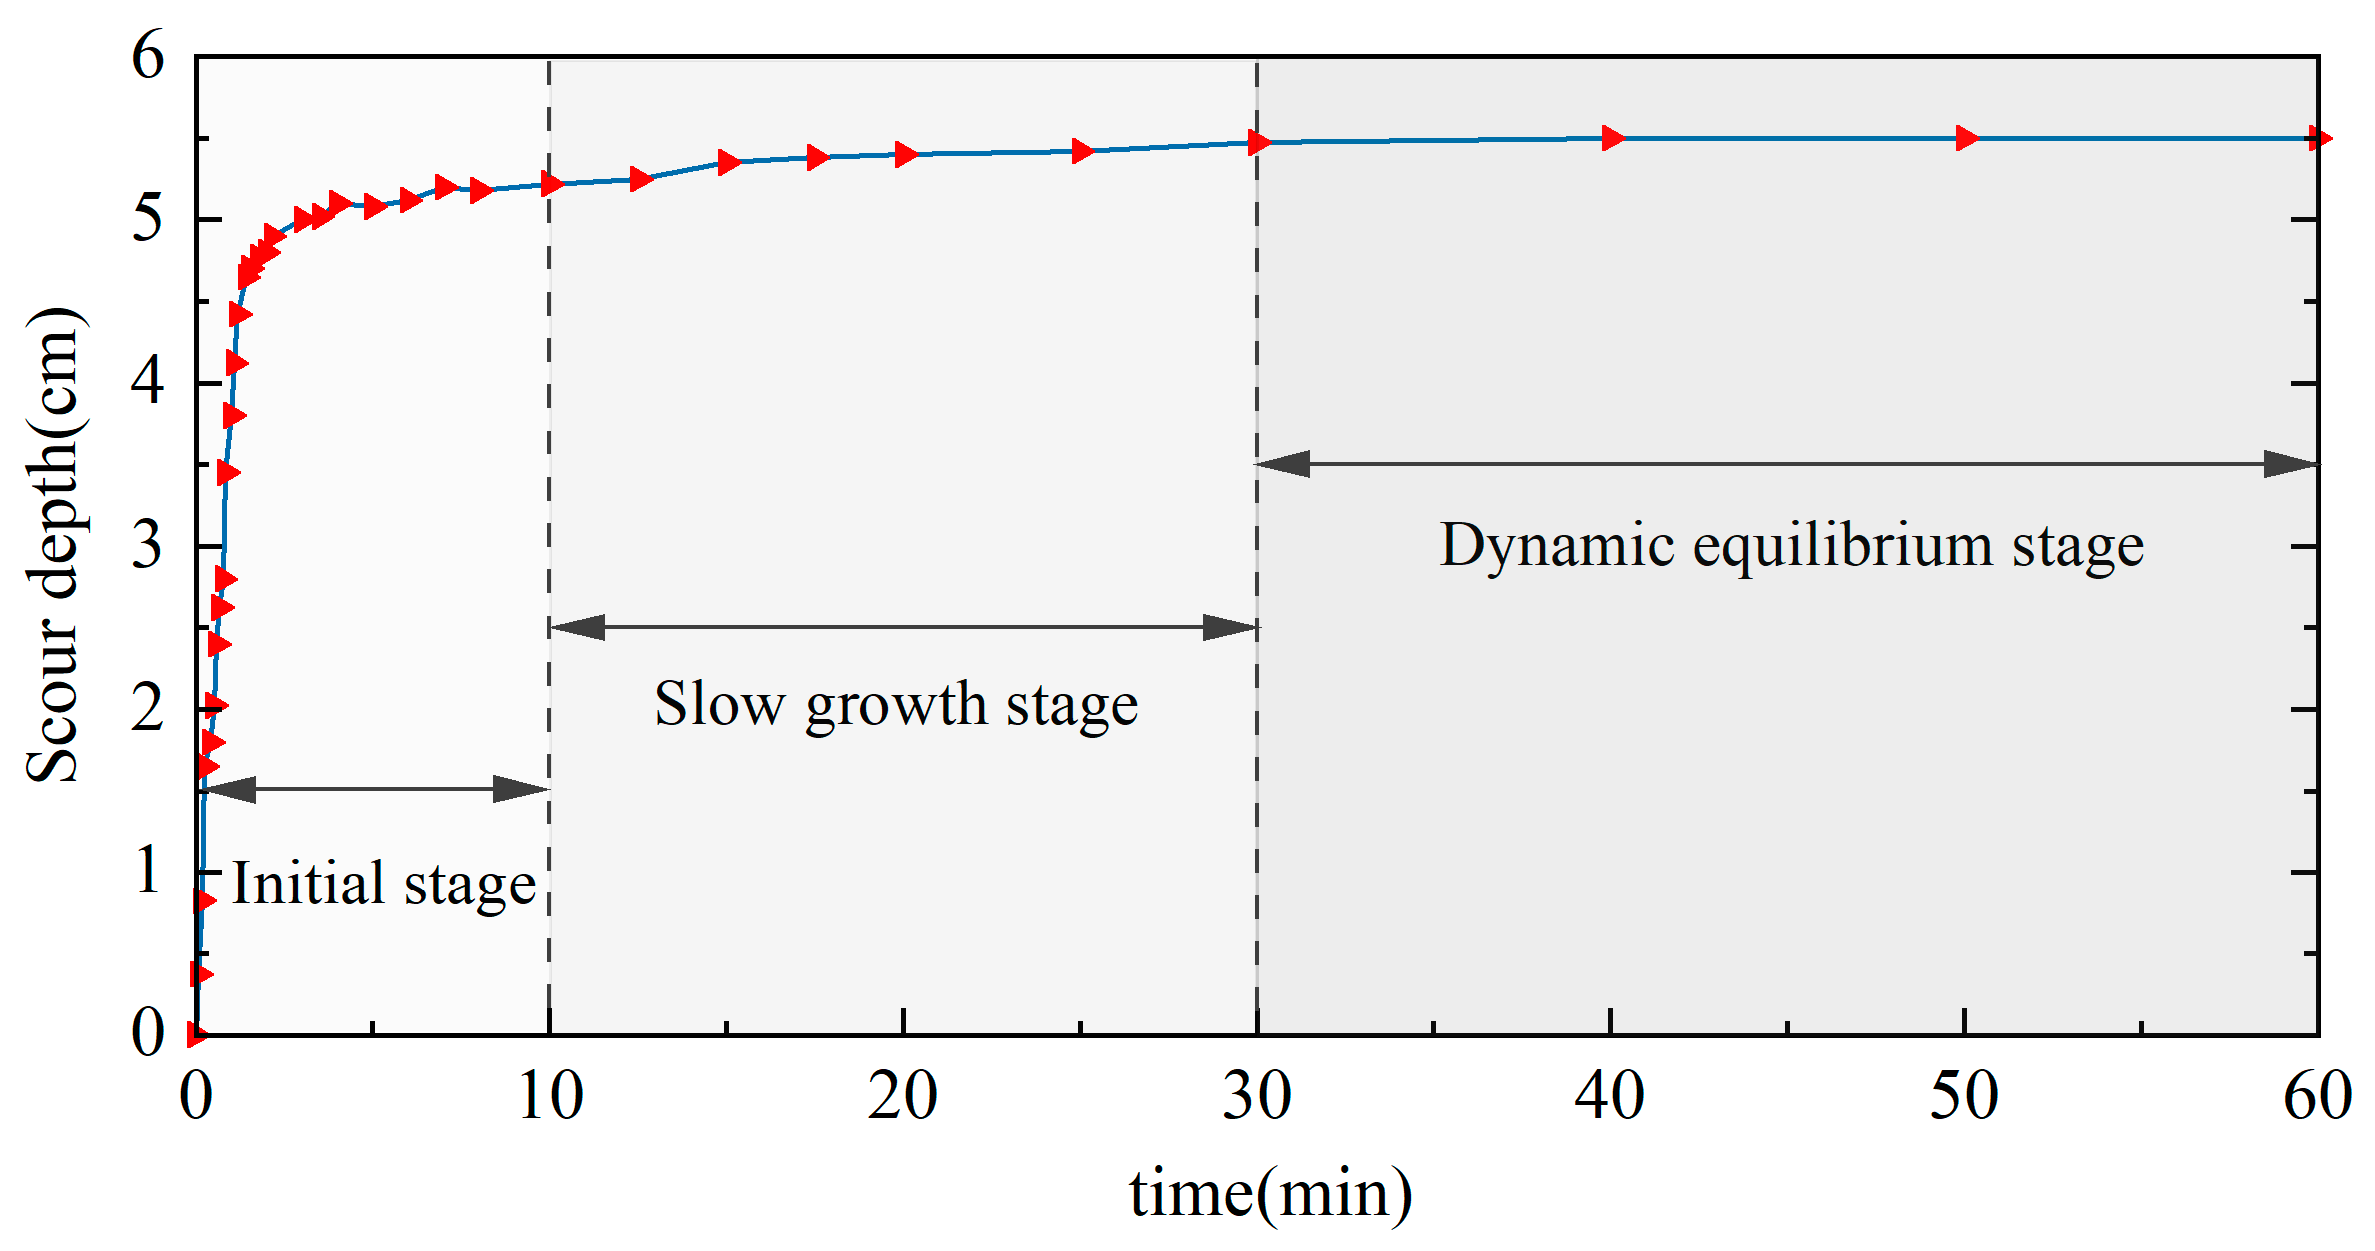
To compare and analyze the local scour reduction effect of the permeable collar, the local scour around a single pier without a permeable collar (test A) was studied experimentally first. An underwater camera was used to observe and measure the development of the scour pit around the pier during the experiment. The change in local scour depth in front of the pier over time is shown in
Figure 8. At the initial stage of local scour (0–10 min), the axial downward flow in front of the pier and the circumfluence flow around the pier formed a complex vortex system and horseshoe vortex near the riverbed, which sucked up the sediment near the riverbed around the pier due to the negative pressure, carried the sediment downstream, and the sediment deposited downstream behind the pier at last. In this stage, the local scour depth increased rapidly. With the expansion of the scour pit, the flow velocity around the pier decreased gradually, and the local scour depth increased slower, thus, the local scour entered a slow growth stage (10–30 min). Subsequently, the local scour reached the dynamic equilibrium stage (30–60 min), in which the sediment rolled from upstream into the scour pit and then was carried downstream by the flow, and the local scour depth did not increase significantly any longer. To ensure the test of local scour was in full development and reached the dynamic equilibrium stage, the duration of each experiment in this study was extended to 120 min.
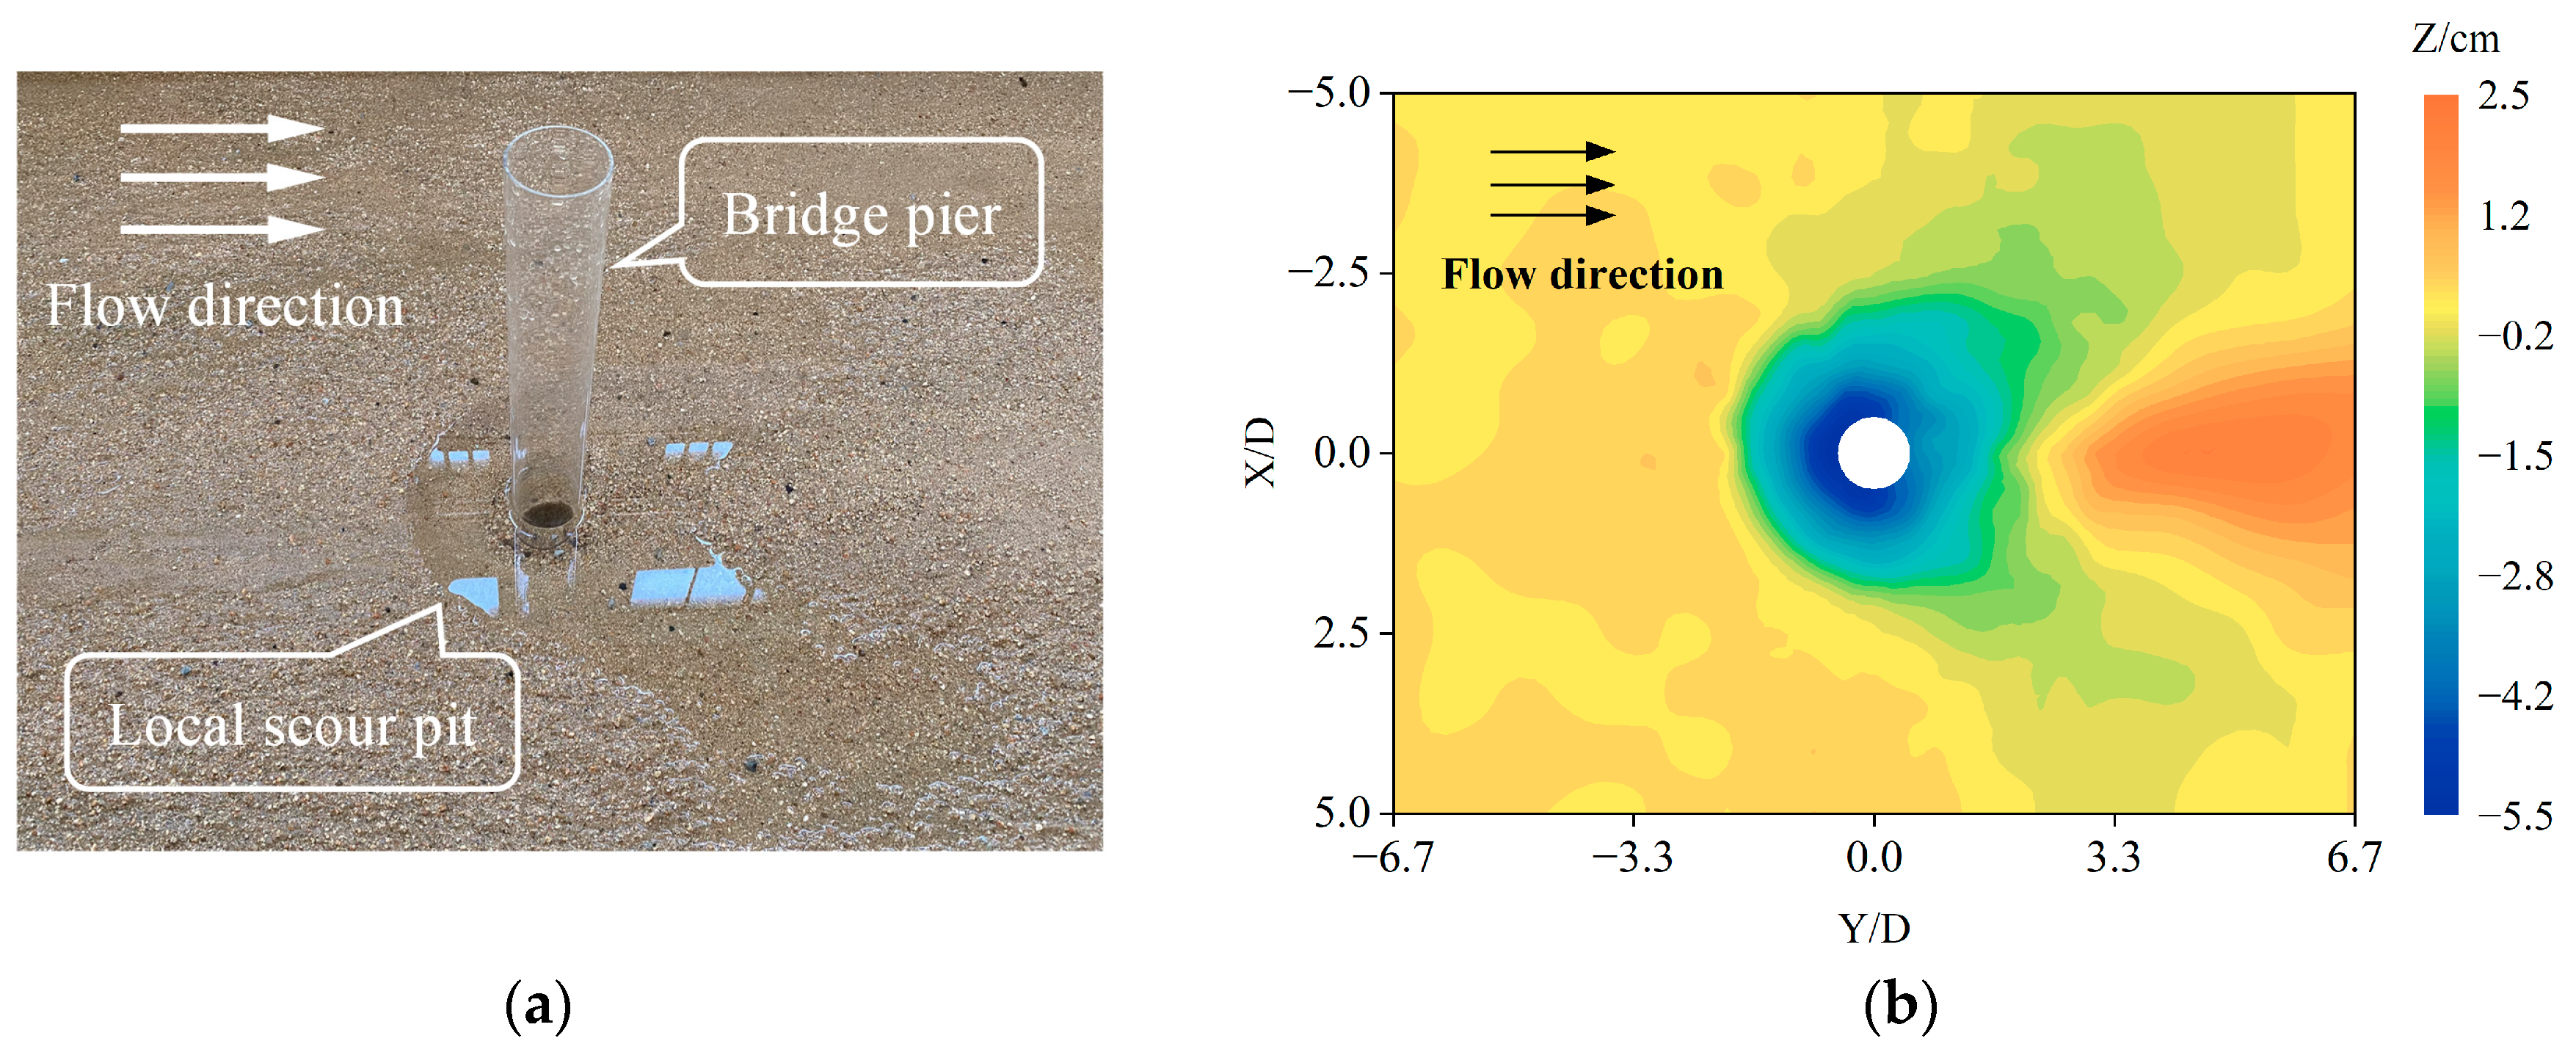
The maximum local scour depth around a single pier without a permeable collar was 5.5 cm in front of the pier when the dynamic equilibrium stage was achieved.
Figure 9 shows the local scour pit morphology of test A.
Figure 9b shows that the whole scour topography is symmetrical, the scour in front of the bridge pier and on both sides is more serious, the scour depth is relatively small behind the pier, and siltation occurs in a certain range downstream of the pier. The above phenomena are consistent with the existing research results, which indicates that the results of this study are correct and credible.
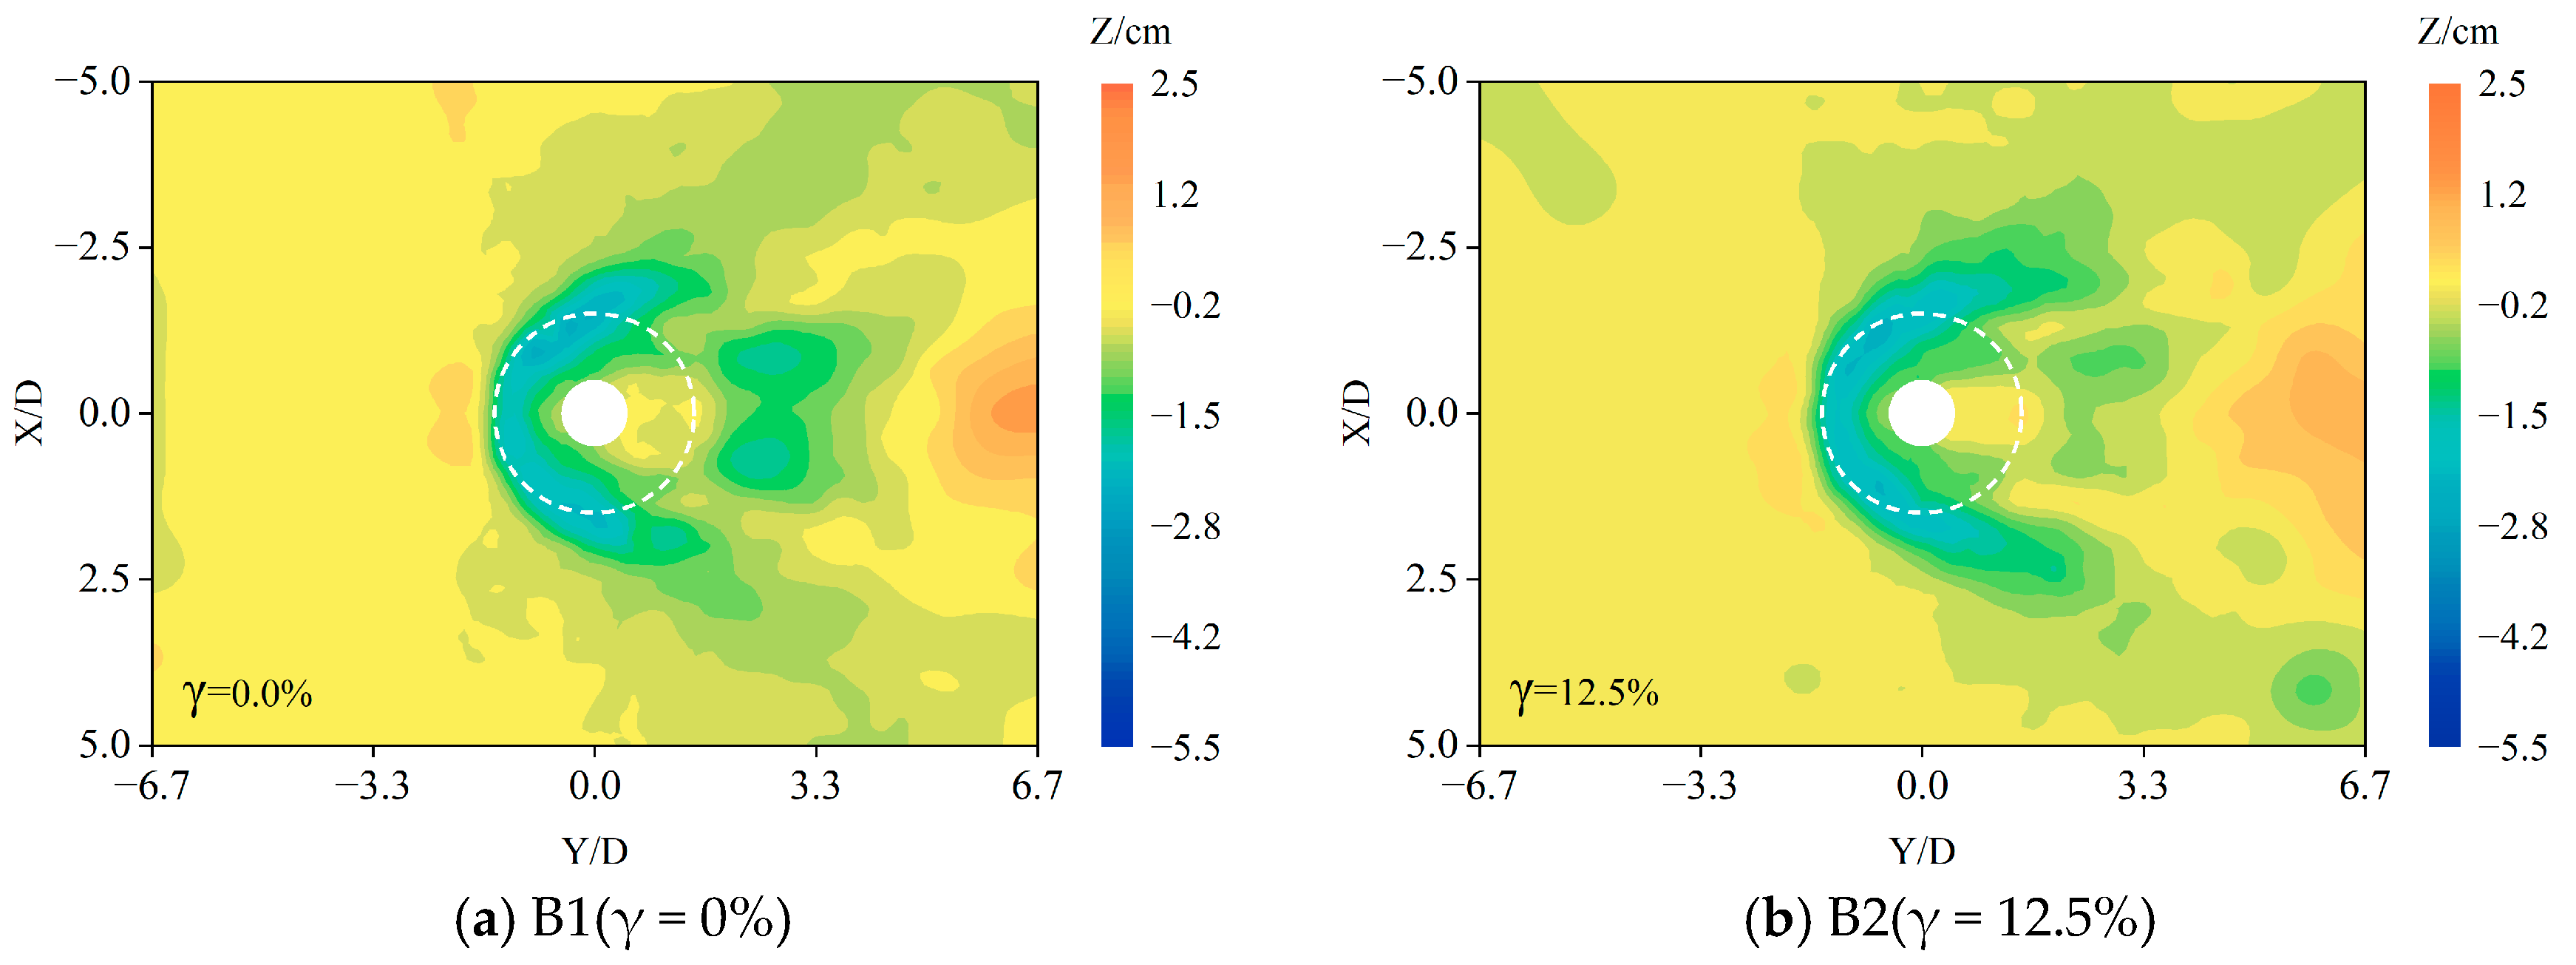
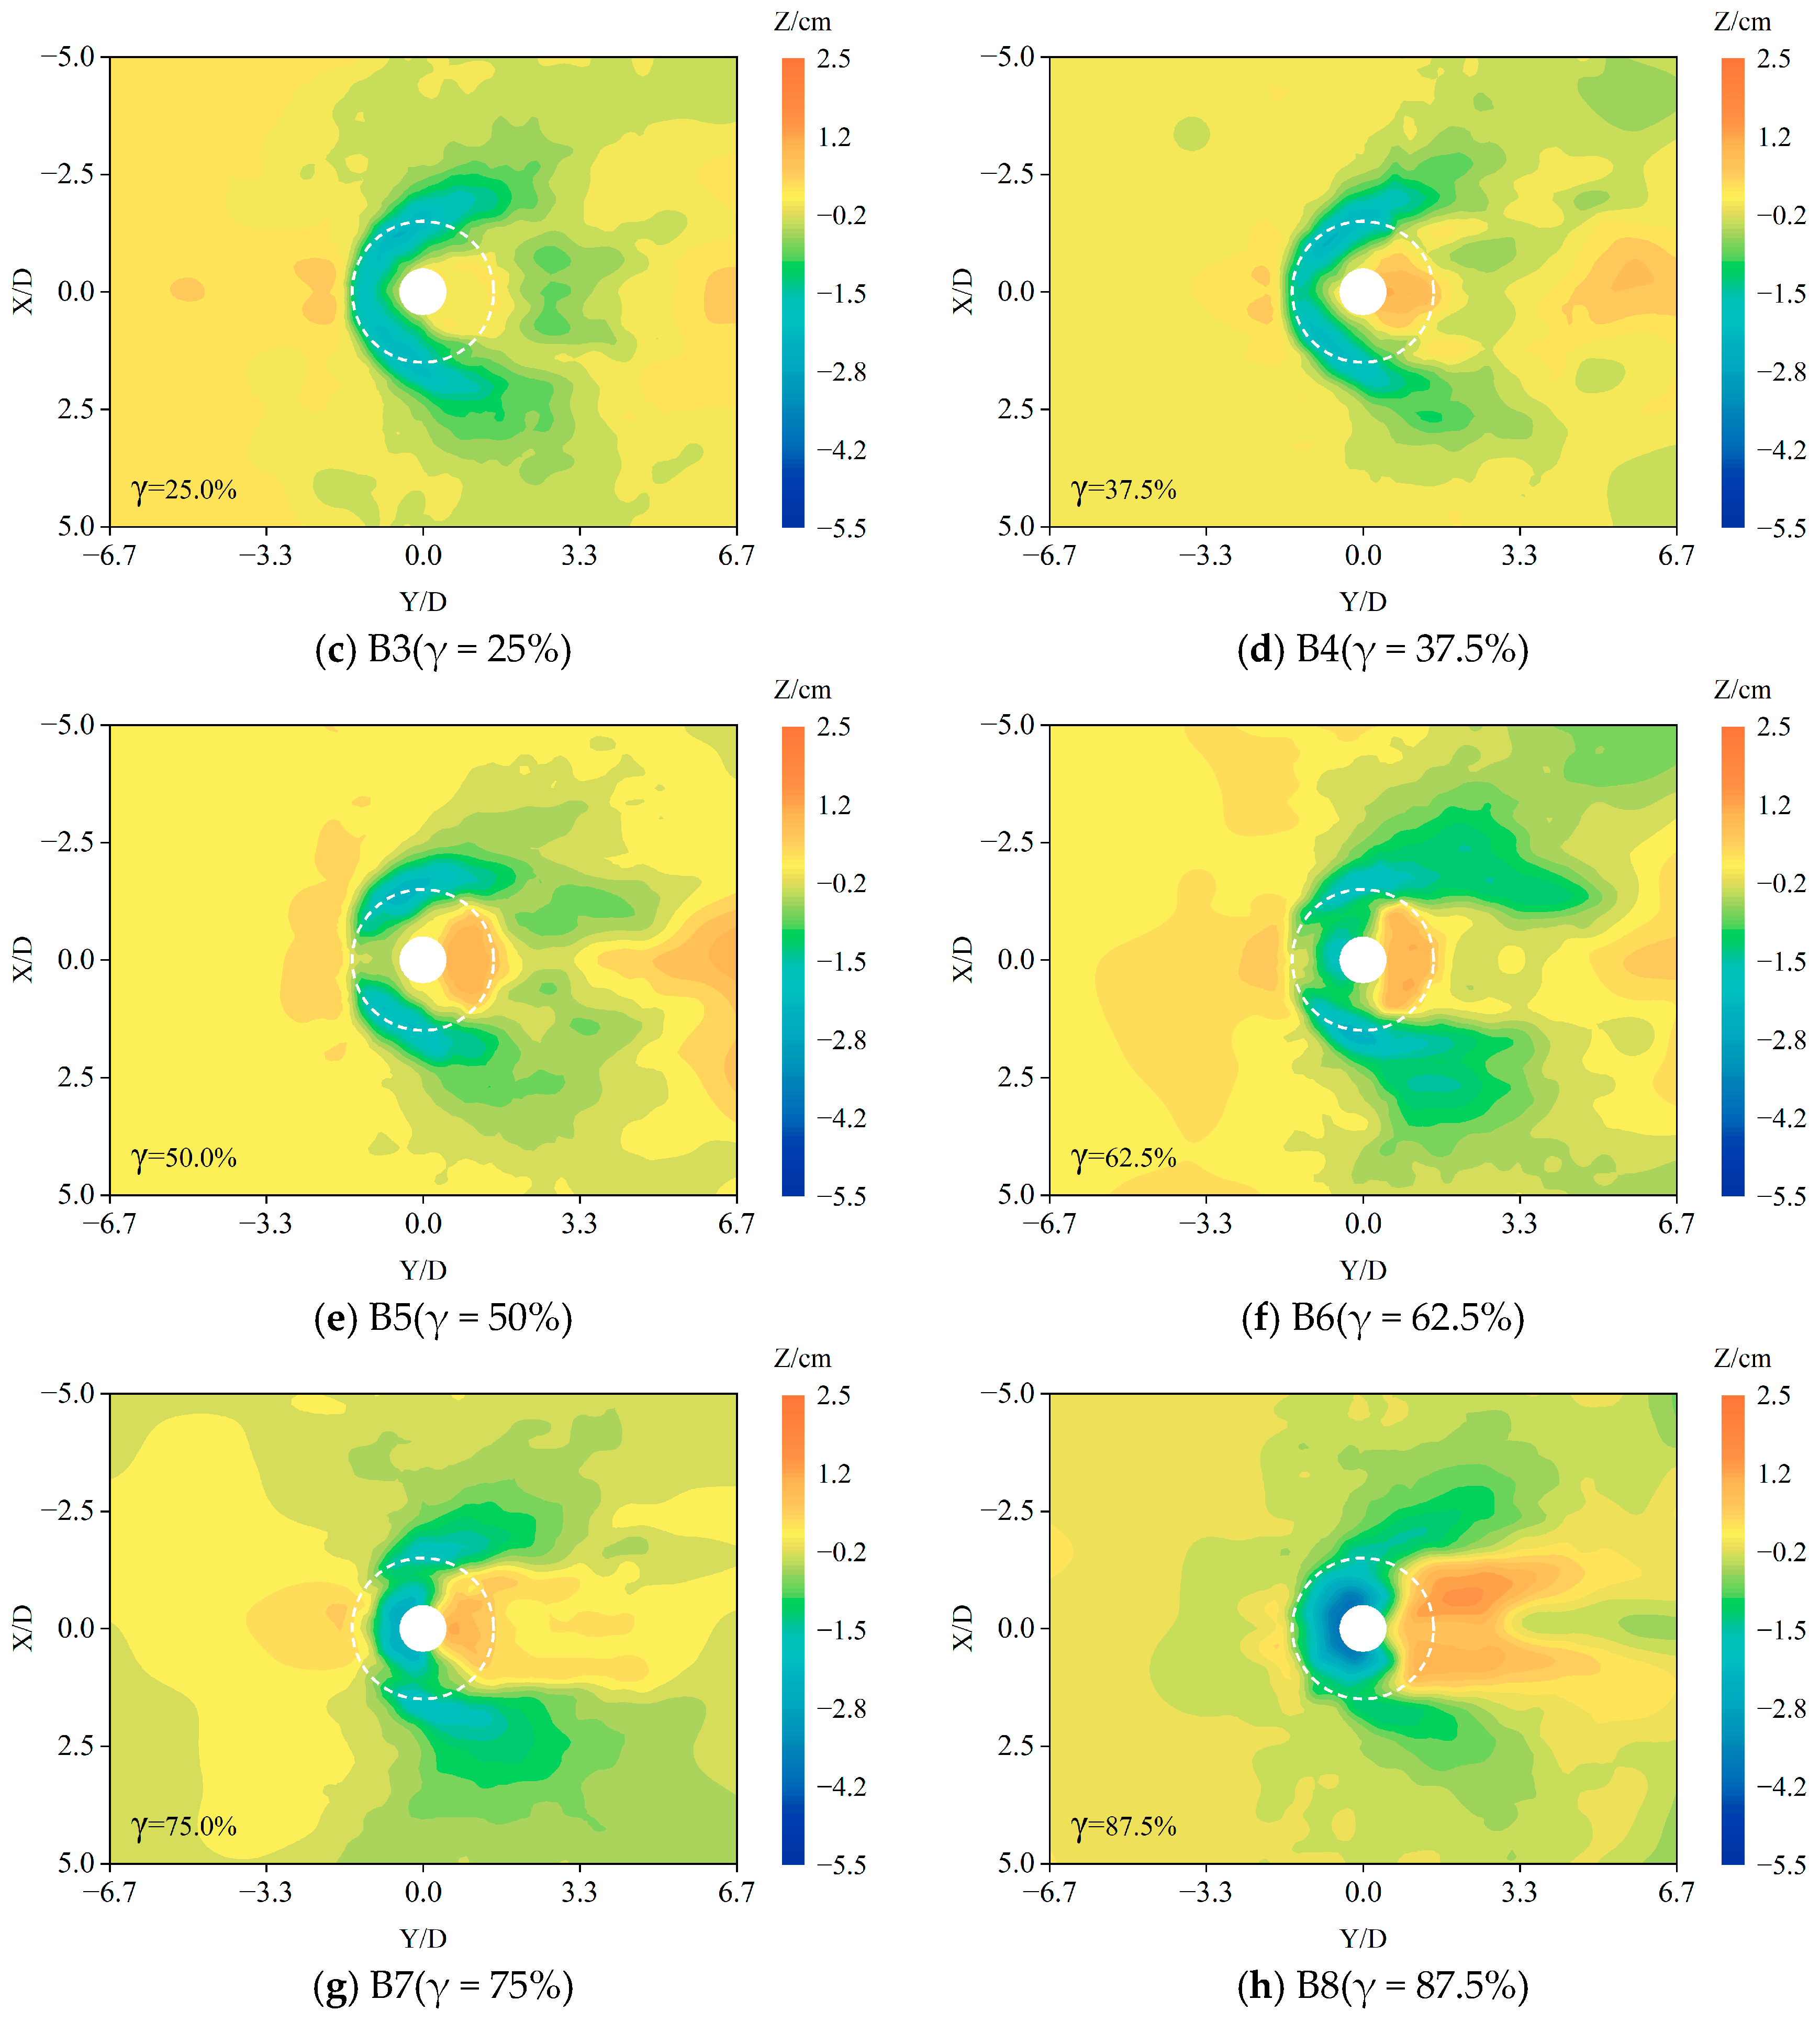
3.2. Influence of Porosity on the Reduction Efficiency of the Permeable Collar (Group B)
Figure 10 shows the local scour topography around the pier using the permeable collar with different porosities, and
Table 2 shows the maximum scour depth around the pier for each condition in Group B.
Figure 10 and
Table 2 show the following: (1) The local scour depth around the pier has been reduced to a certain extent by using the permeable collar with different porosity, and the outline of the local scour pit shape develops to both sides of the collar along the tangent direction of the collar edge. (2) Compared with a solid collar (γ = 0%), the reduction effect of the permeable collar is close to that of the solid collar when the collar porosity γ ≤ 75%. That means the permeable collar which uses less material can achieve the same reduction effect as that of the solid collar in the same conditions. (3) The maximum local scour depth is about 2.5 cm and is far away from the pier, which is generally located at ±45° along the flow direction from the edge of the collar, and the scour around the pier is light when the porosity of the collar is smaller (γ ≤ 50%). The reduction effect of the collar on local scour weakened gradually when γ > 50% and the scouring began to occur directly in front of the pier. With the increase in porosity, the effect of the collar on resisting the downward flow in front of the pier decreases. Thus, with the increase in porosity, the scour depth increases gradually, and the overall scour morphology tends to be that of a single pier without a permeable collar gradually. Especially when the porosity is 87.5%, the maximum local scour depth is up to 4.0 cm, and the reduction effect of the collar is weakened greatly.
The main reason for the above phenomenon is as follows: when a permeable collar is used for local scour reduction, the flow is divided into three parts by the collar, the flow above the collar, the flow inside the collar, and the flow below the collar. The existence of water with lower velocity inside the collar acts like a solid plane which can weaken the strength and the velocity of the downward flow in front of the pier and the flow around the collar, meaning the local scour at the edge of the collar was reduced effectively. However, with the increase in the porosity of the permeable collar, the resisting effect of the permeable collar on the downward flow decreases gradually, which causes a decrease in the reduction efficiency of the permeable collar gradually. On the other hand, the existence of the permeable collar also changes the pattern of the wake flow, with the increase of the porosity, the sedimentation behind the pier becomes more and more obvious, and the area of sedimentation becomes bigger.
From
Table 2, the maximum scour depth around the bridge pier is small when the porosity of the permeable collar is less than 75%. However,
Figure 10 shows that the local scour situation around the bridge pier is significantly better when γ is 50%. Therefore, only using the maximum scour depth cannot measure the reduction effect of the local scour reduction measures accurately, but the reduction efficiency
EP can be used.
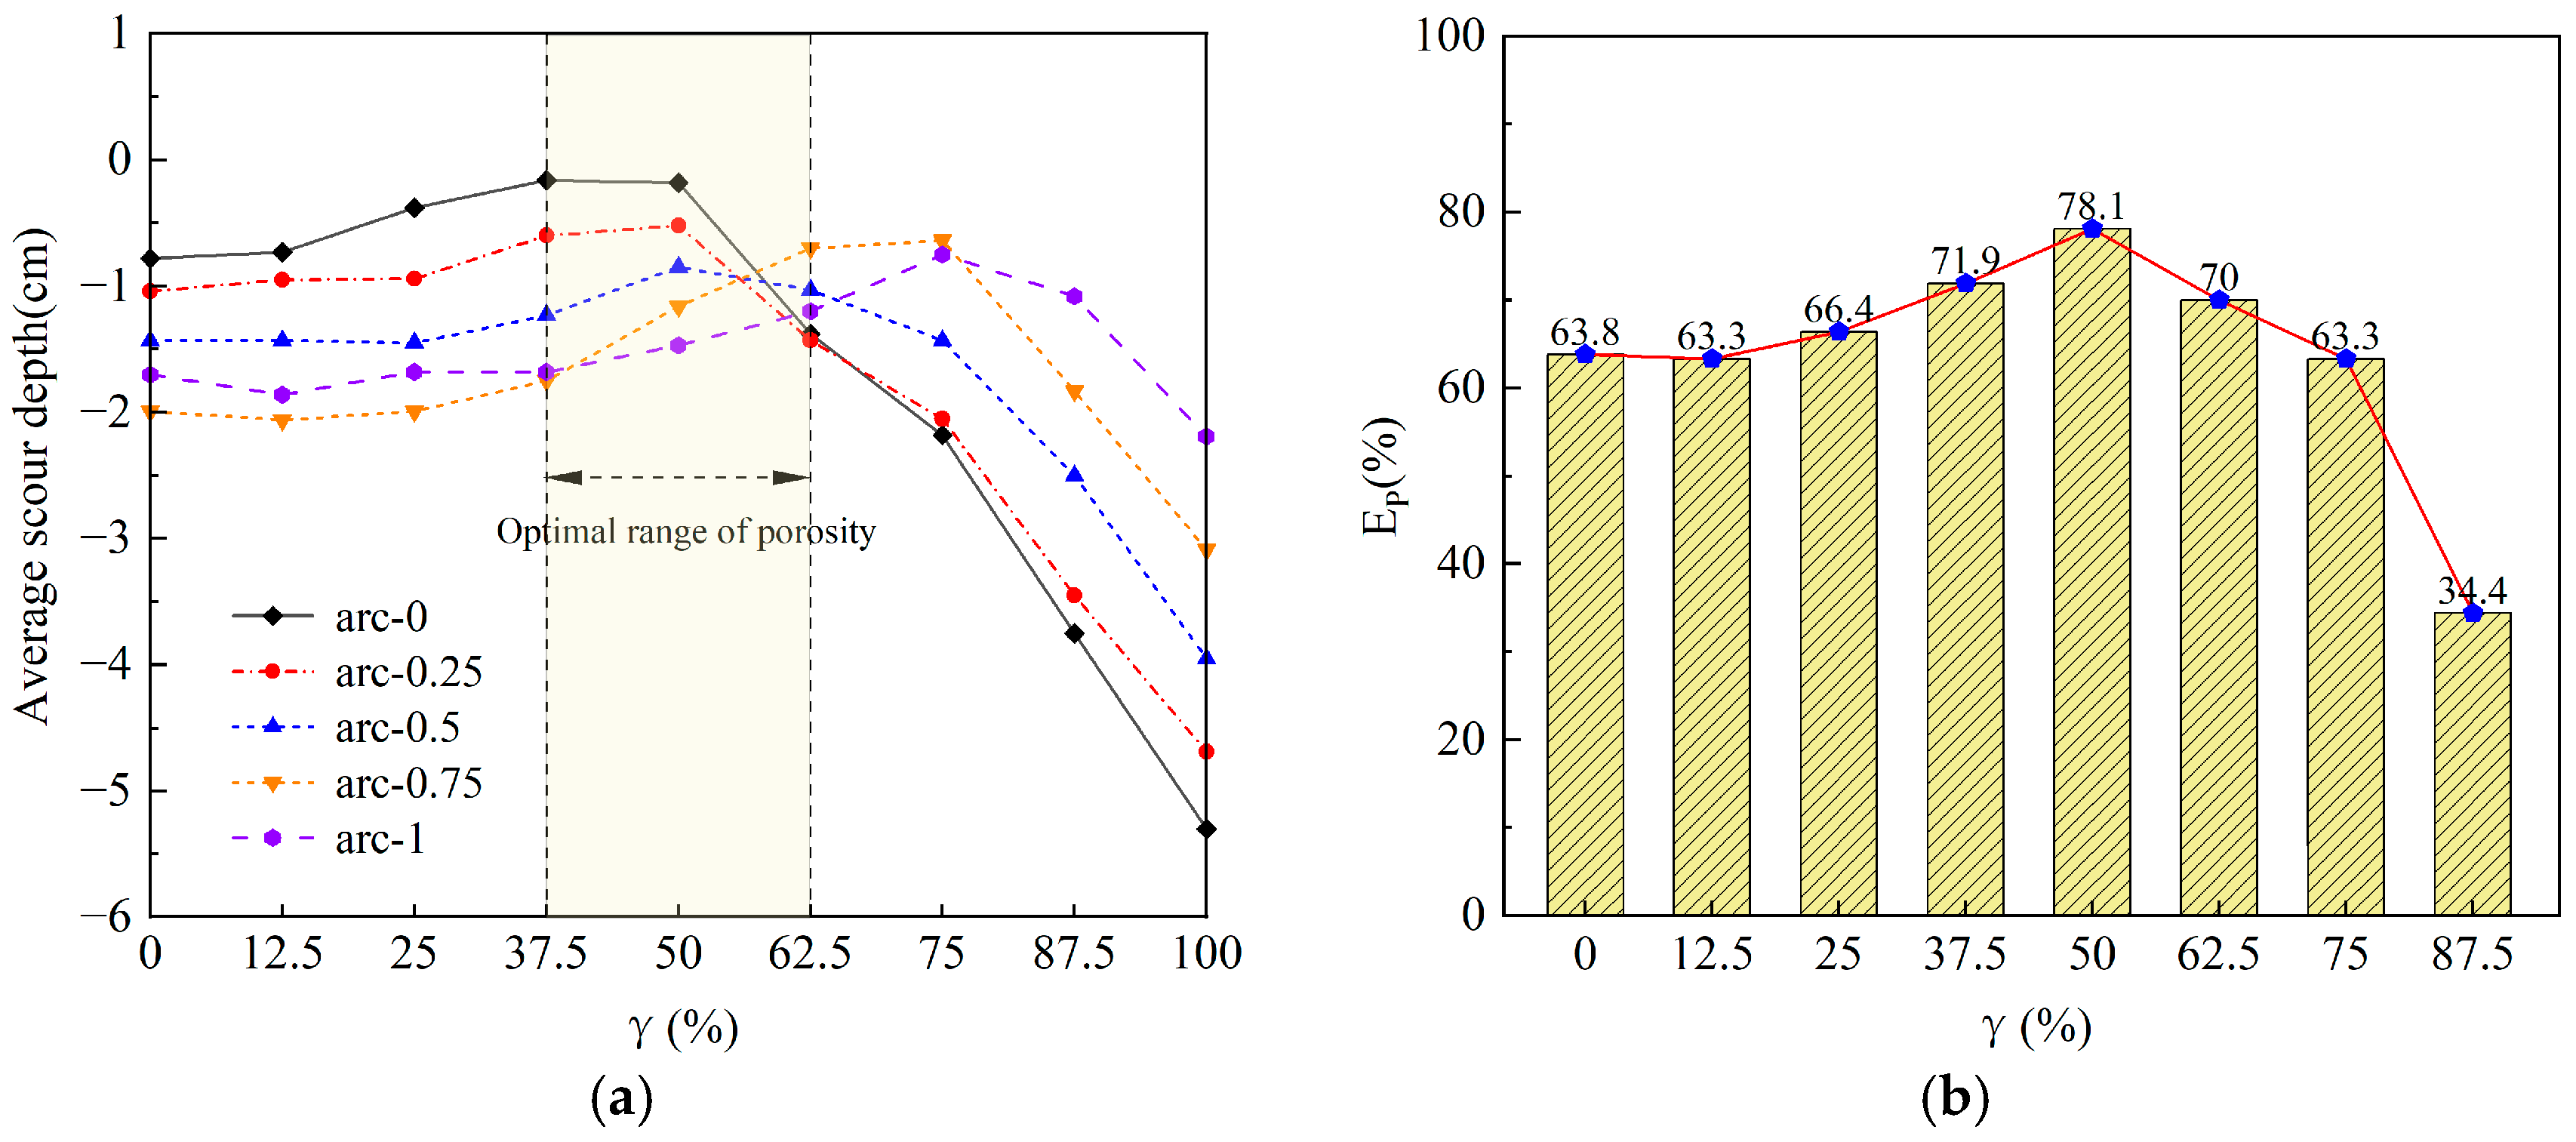
Figure 11a shows the variation relationship between the average scour depth of each arc around the pier and the porosity of the permeable collar, and all data are shown in
Table A1. When the porosity of the permeable collar is less than 50%, the average local scour depth at arc-0 is the smallest, and that at arc-0.75 is the largest, which indicates that the local scour close to the pier is relatively slight and the local scour mainly occurs at the edge of the collar. If the γ is 62.5%, the average scour depth at arc-0 increases sharply, which indicates that the scour near the pier began to intensify and follows the same variation rule of the local scour terrain in
Figure 10. When γ is larger than 62.5%, the average local scour depth at each arc increased rapidly, and the reduction effect of the permeable collar on local scour begins to weaken significantly. The reduction efficiency of the collar calculated according to Equation (2) is shown in
Figure 11b.
Figure 11b shows that when 37.5% ≤ γ ≤ 62.5%, the
EP is greater than 70%, especially when it is 50%, and the
EP even reaches up to 78.1%. Therefore, the optimal range of porosity of the permeable collars recommended is from 37.5% to 62.5%, and the porosity of the permeable collar is 50% in the subsequent tests in this study.
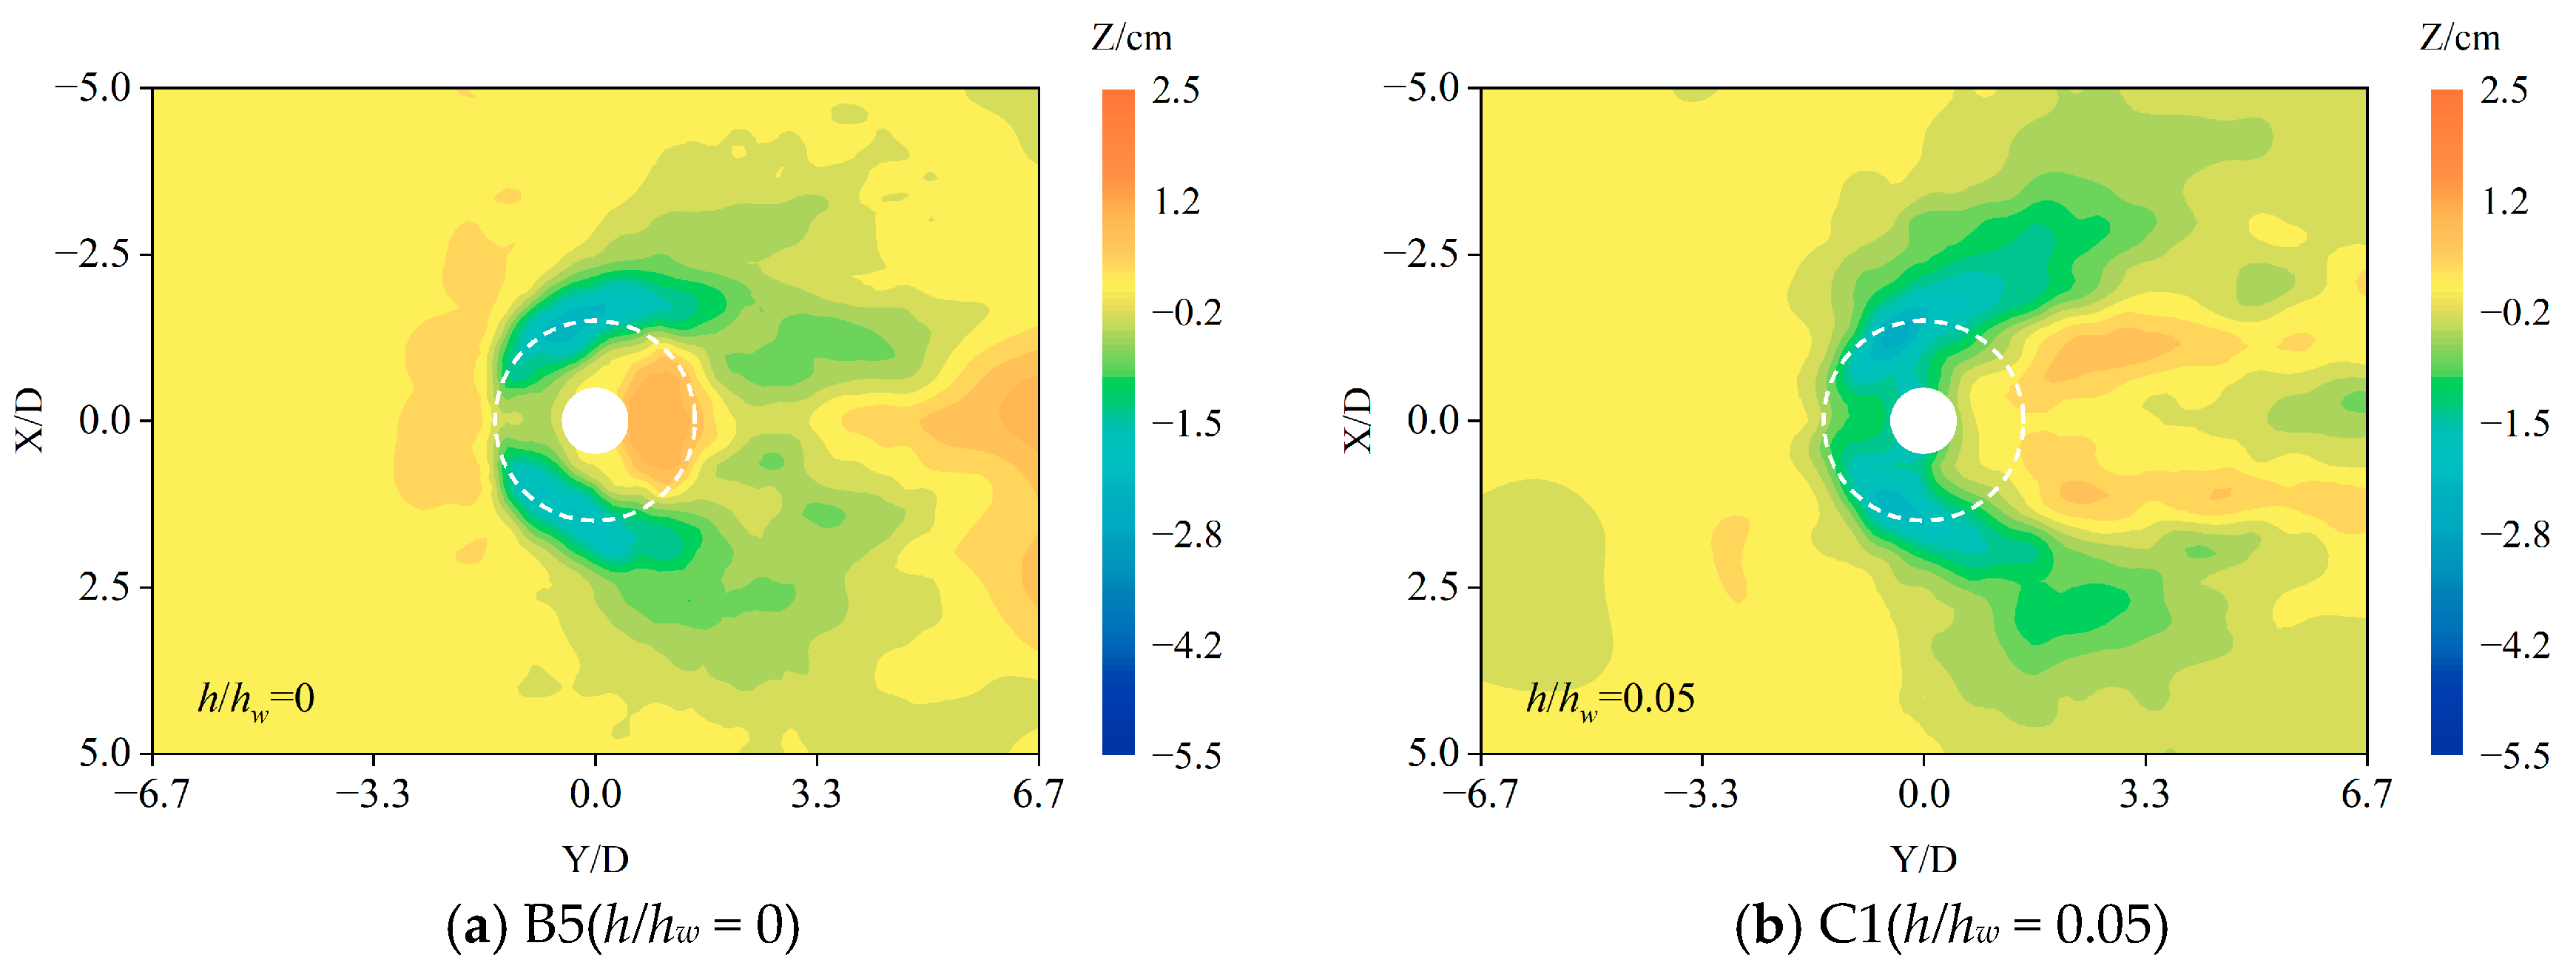
3.3. Influence of Installation Height on the Reduction Efficiency of the Permeable Collar (Group C)
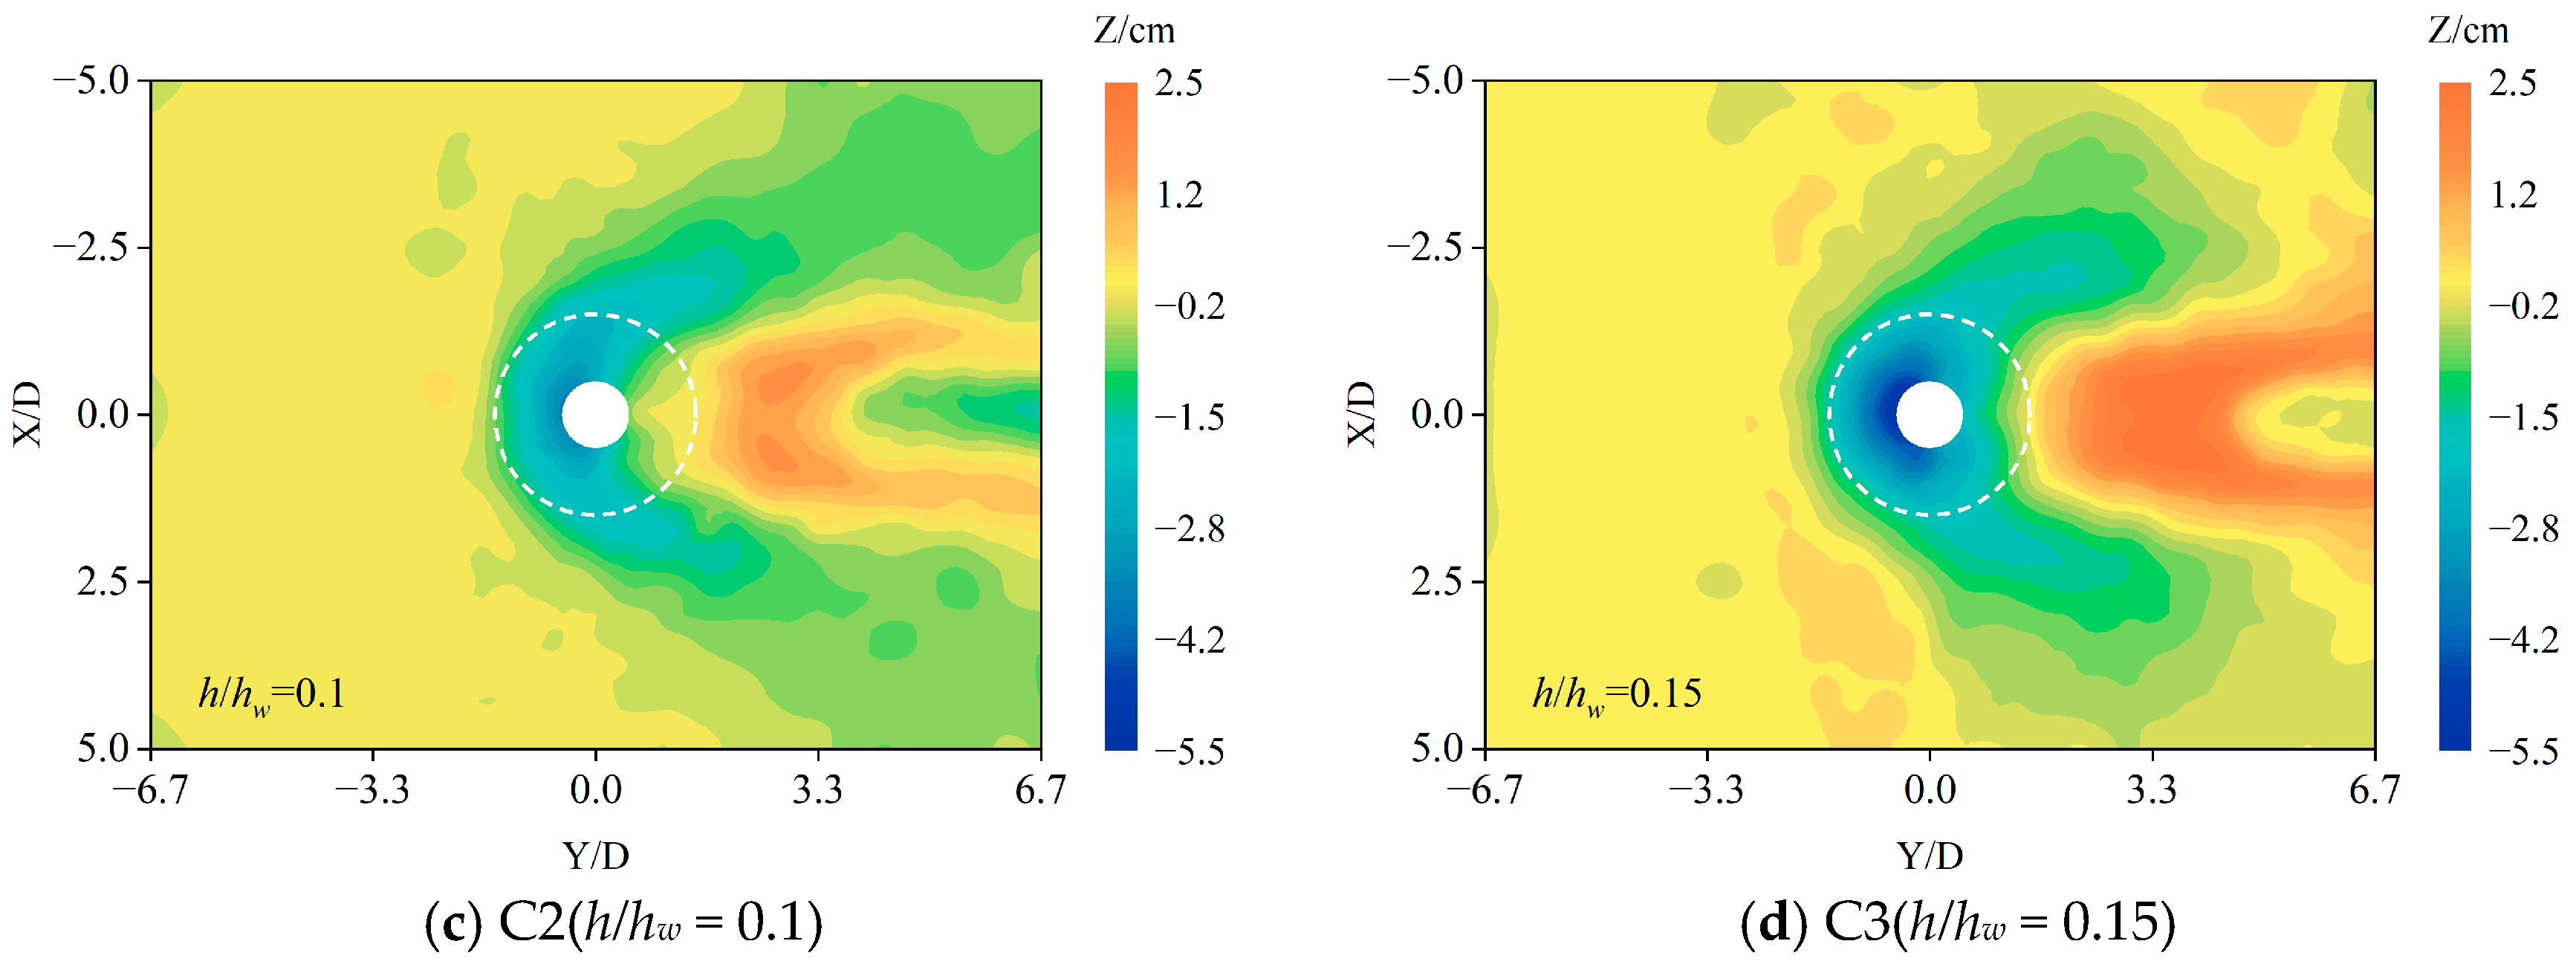
Figure 12 shows the topography of local scour around the pier using the permeable collar installed at different heights using the condition of optimal porosity, and
Table 3 shows the maximum scour depth around the pier for each condition in Group C.
Figure 12 and
Table 3 show the following: (1) When
h/hw is 0, which means the permeable collar is installed on the surface of the sediment, the local scour mainly occurred near the edges of the collar, no scour happened to the front or rear of the pier. Furthermore, the maximum local scour depth is the smallest. (2) With the increase in the installation height of the collar, the local scour depth around the pier increases gradually, and the location of the maximum local scour depth is moved from the sides of the collar to the front of the pier. The sedimentation near the rear of the pier increased rapidly and moved down from the pier. (3) When
h/hw increases to 0.15, the maximum local scour depth increases to 5.3 cm, which is very close to that in the condition without the permeable collar, and it indicates that the local scour reduction effect of the permeable collar is lost.
The main reasons for the above phenomena are as follows: with the increase of the installation height, the downward flow blocked by the collar decreases gradually and that below the collar increases, which leads to a sharp increase in the high-speed flow flowing around the pier on both sides and directly causing the local scour around the pier.
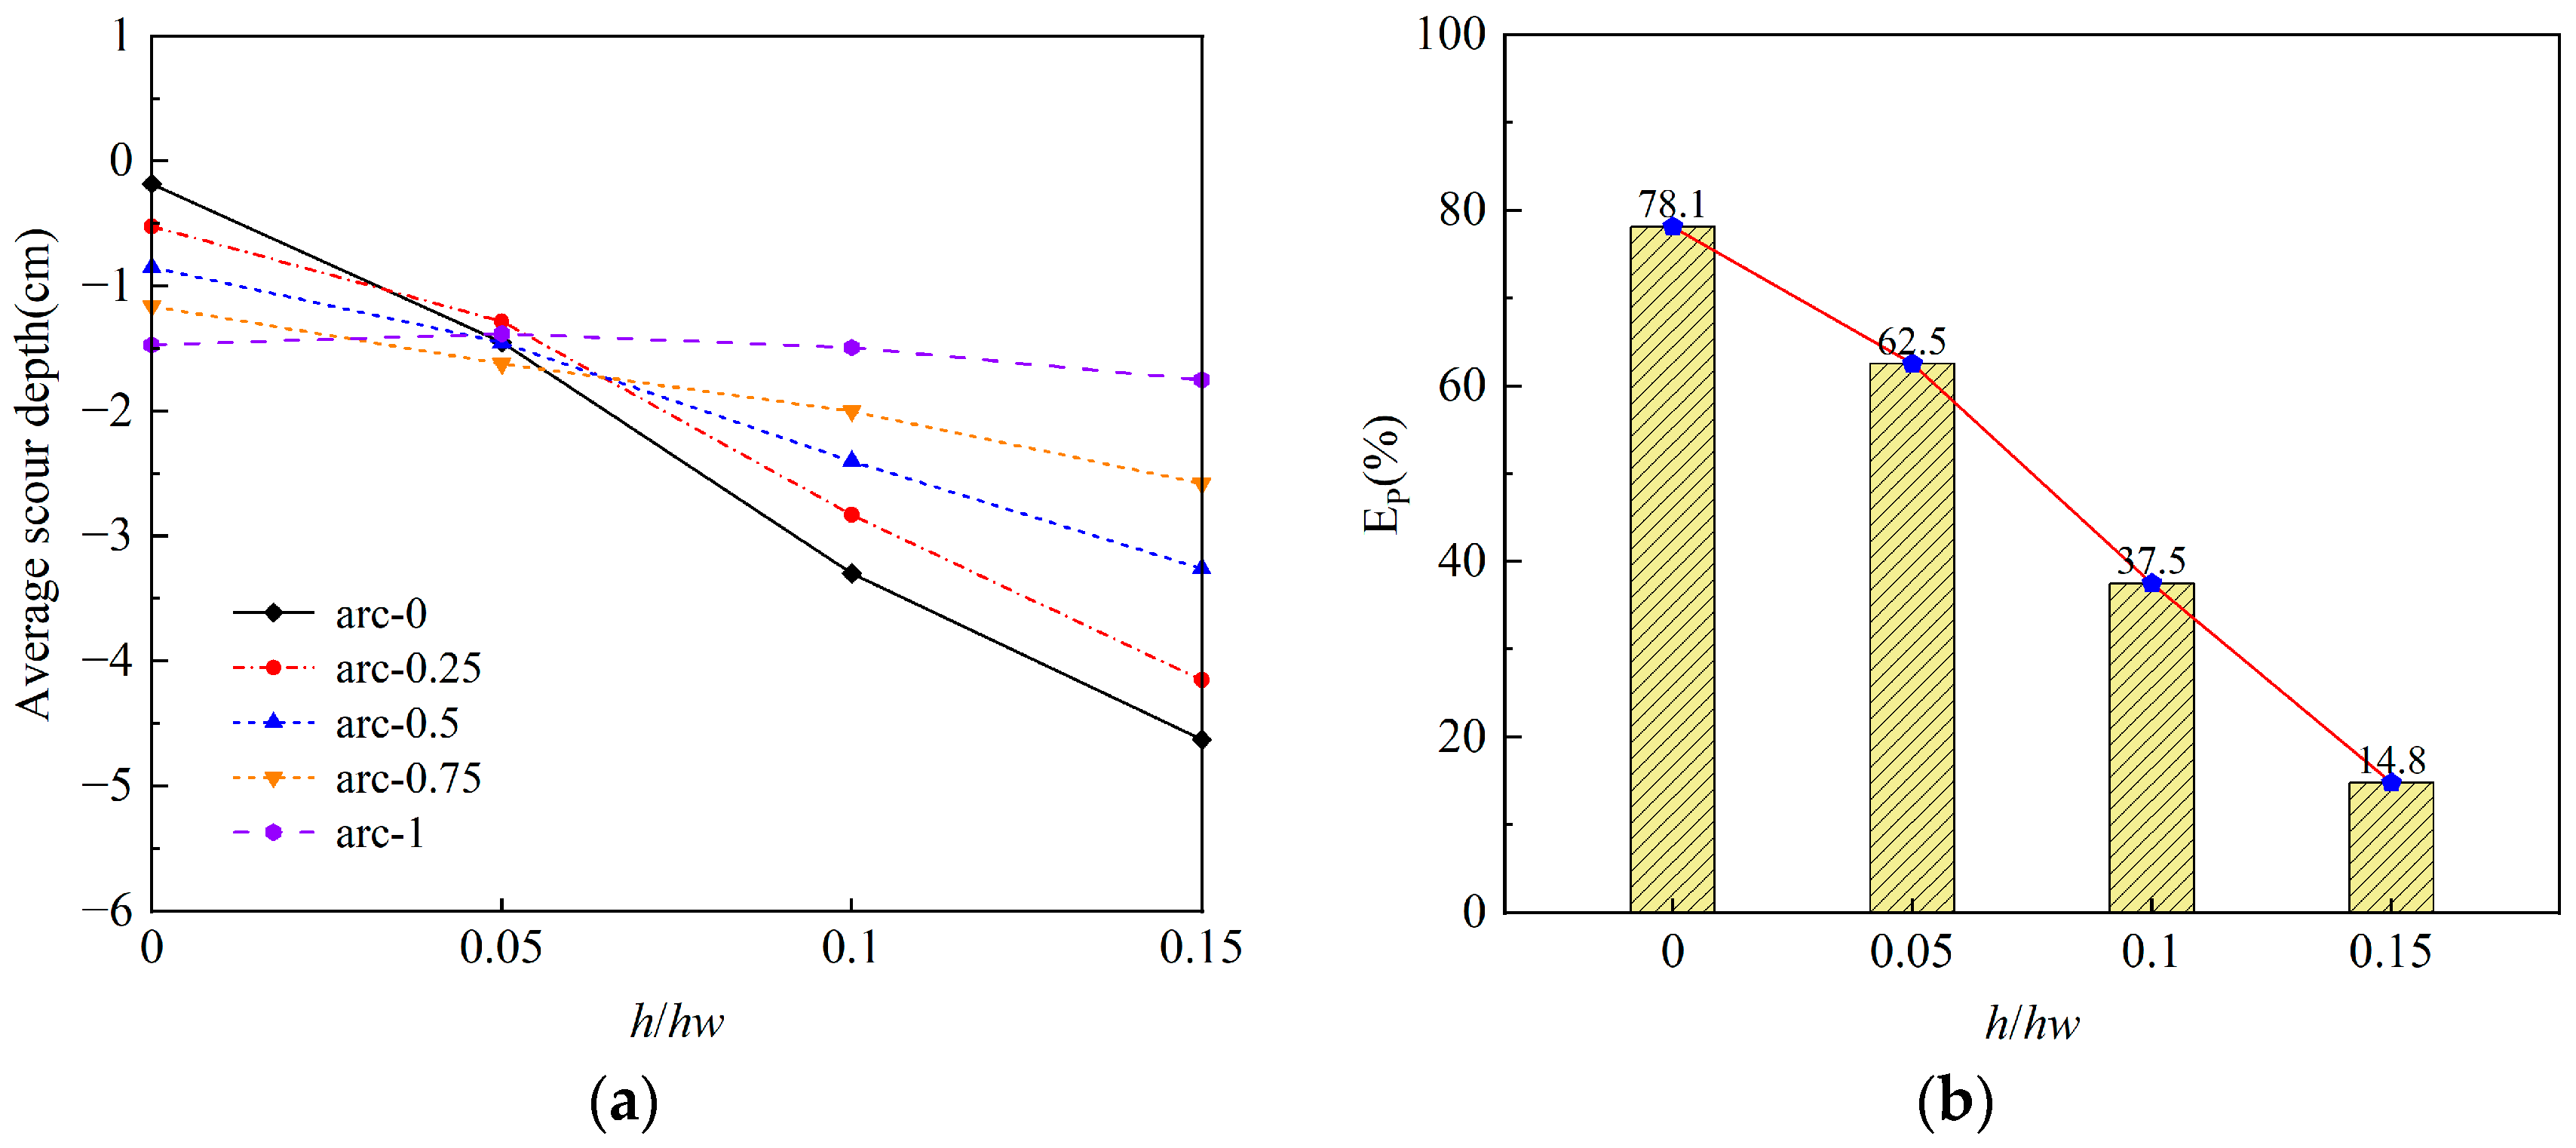
Figure 13a shows the variation relationship between the average local scour depth of each arc around the pier and the installation height of the permeable collar.
Figure 13a shows that when
h/hw is 0, the closer the location to the pier, the smaller the local scour is. When
h/hw is 0.05, the average local scour depth of each arc is close to each other and is concentrated around −1.0 cm. When
h/hw is larger than 0.1, the average local scour depth of each arc is exactly opposite to that when
h/hw is 0, and the larger the
h/hw is, the greater the local scour depth of each arc is.
Figure 13b shows the variation relationship between the collar reduction efficiency and the installation height.
Figure 13b shows that with the increase in
h/hw, the reduction efficiency of the permeable collar decreases rapidly. Therefore, whether it is a permeable collar or a solid collar, to achieve the best reduction efficiency, the collar must be installed close to the riverbed. In the subsequent tests in this study, the installation height of the permeable collar was set as
h/hw = 0.
3.4. Influence of Diameter on the Reduction Efficiency of the Permeable Collar (Group D)
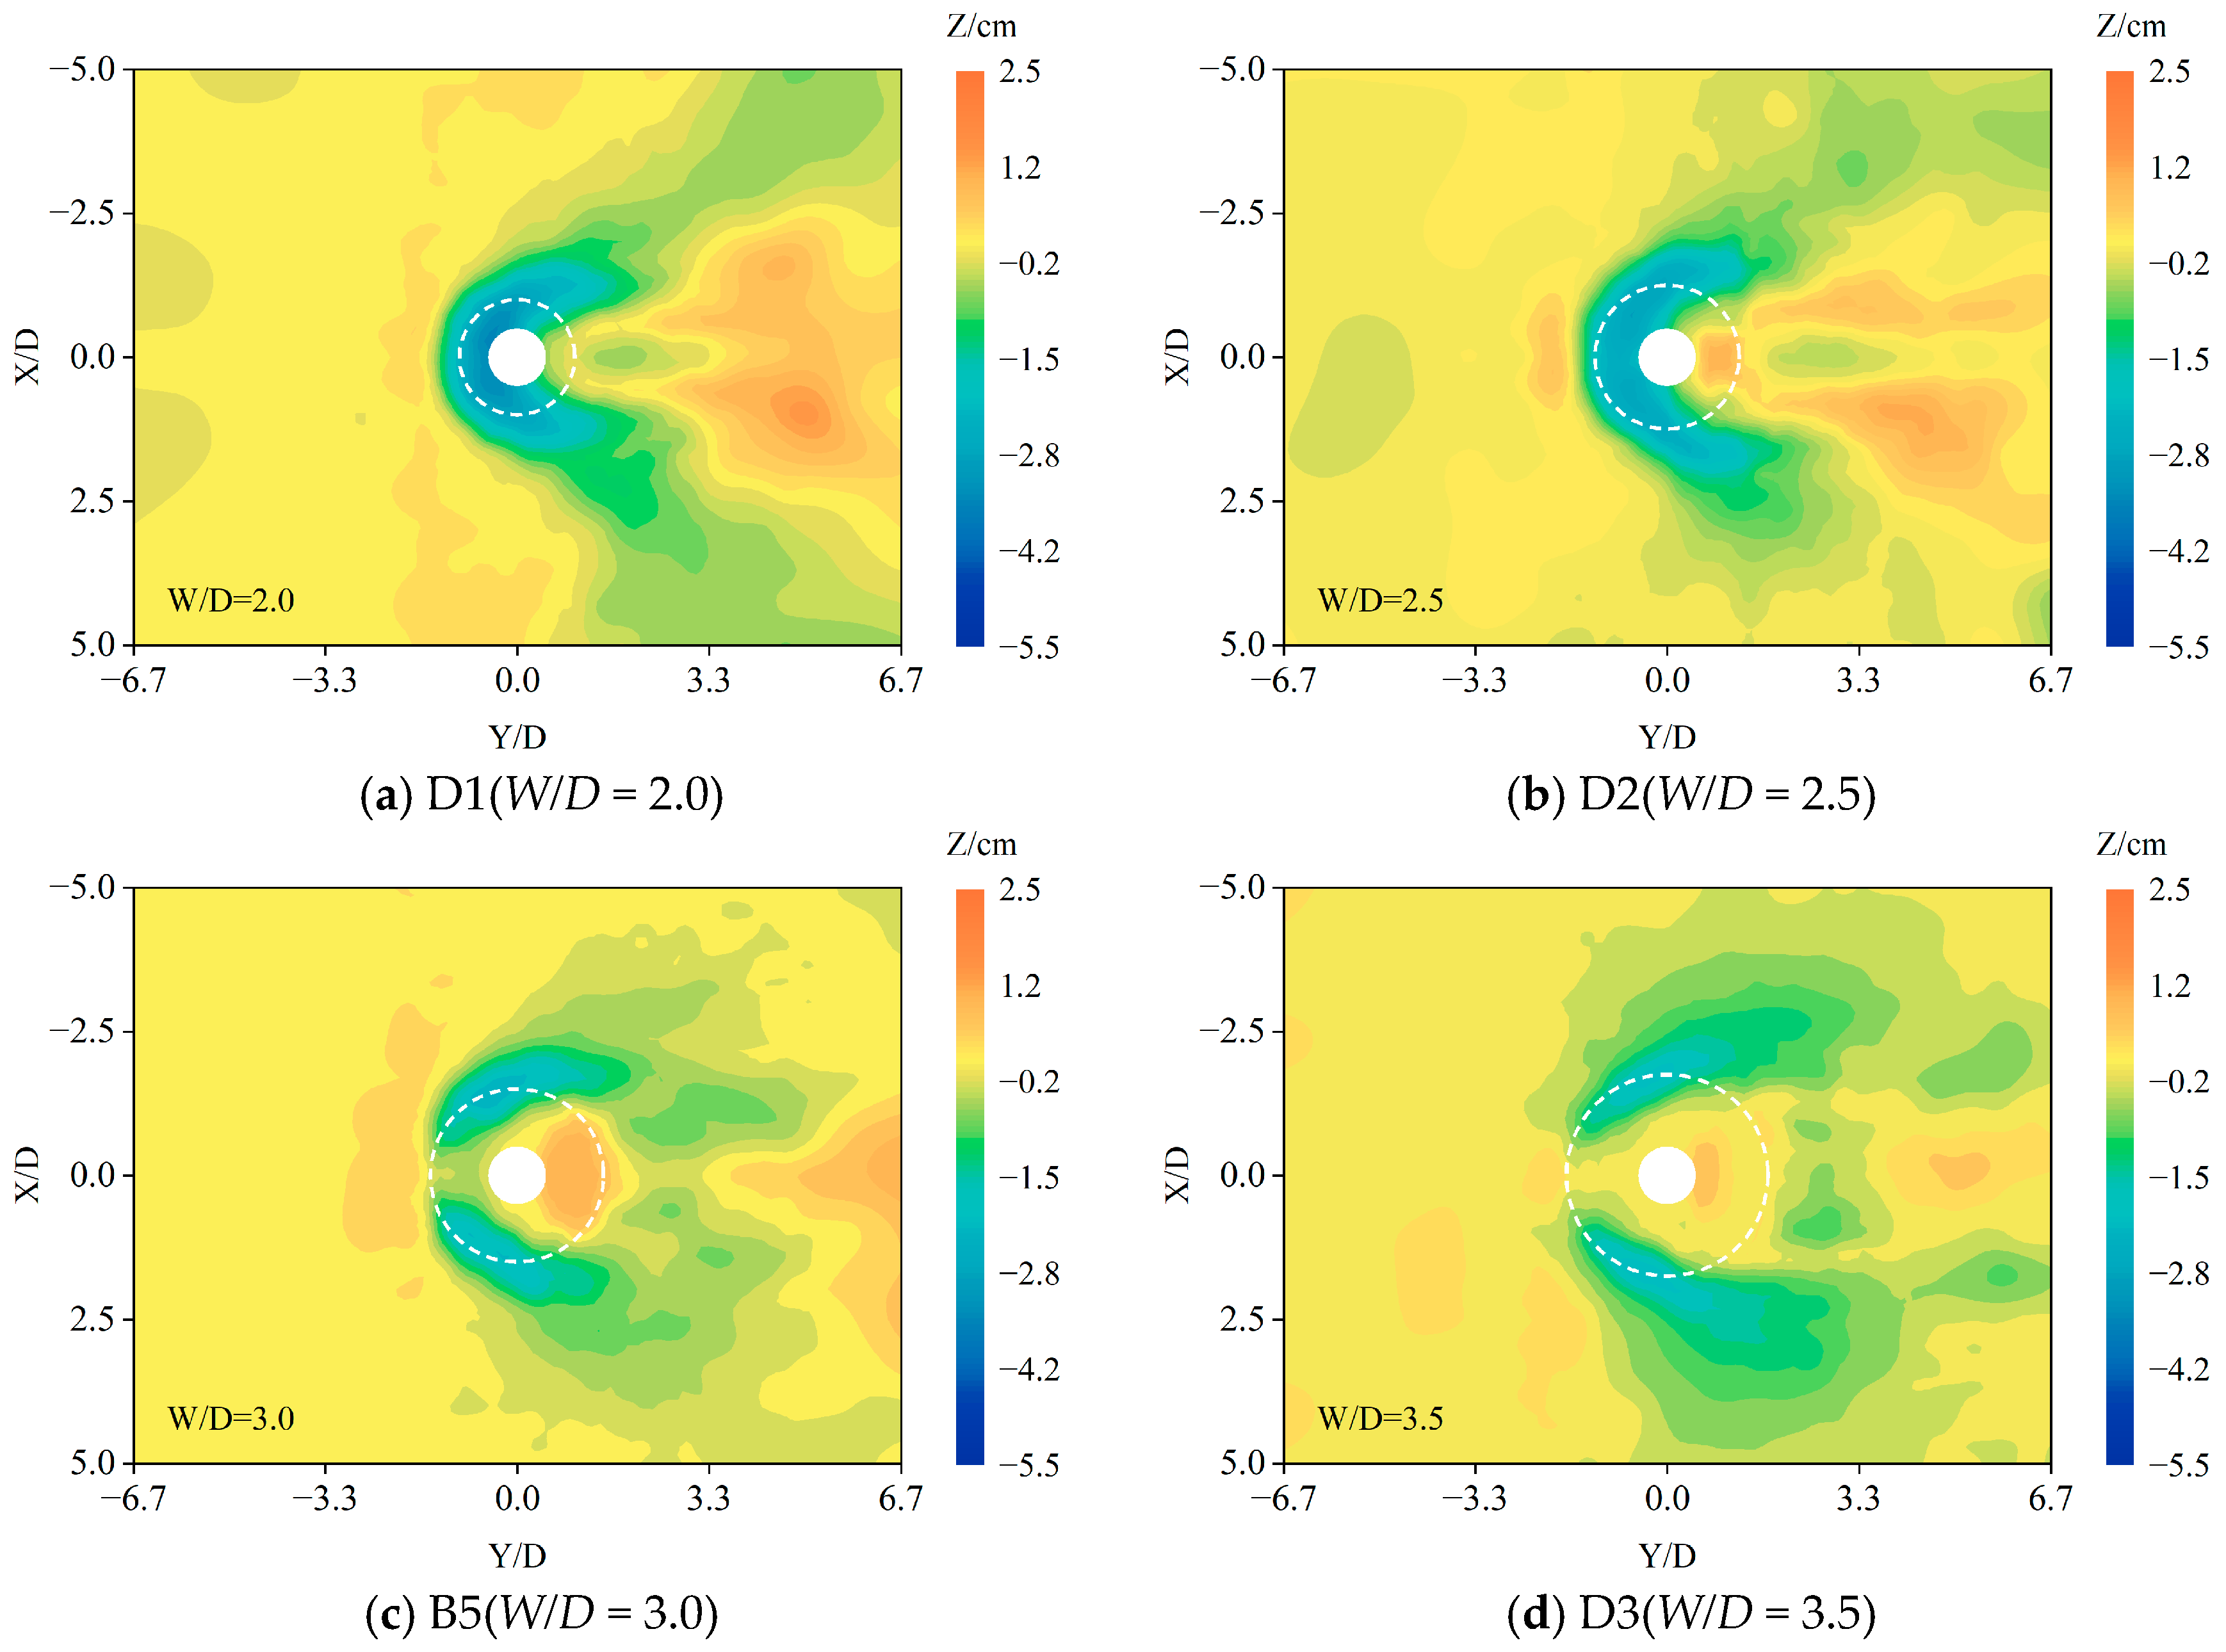
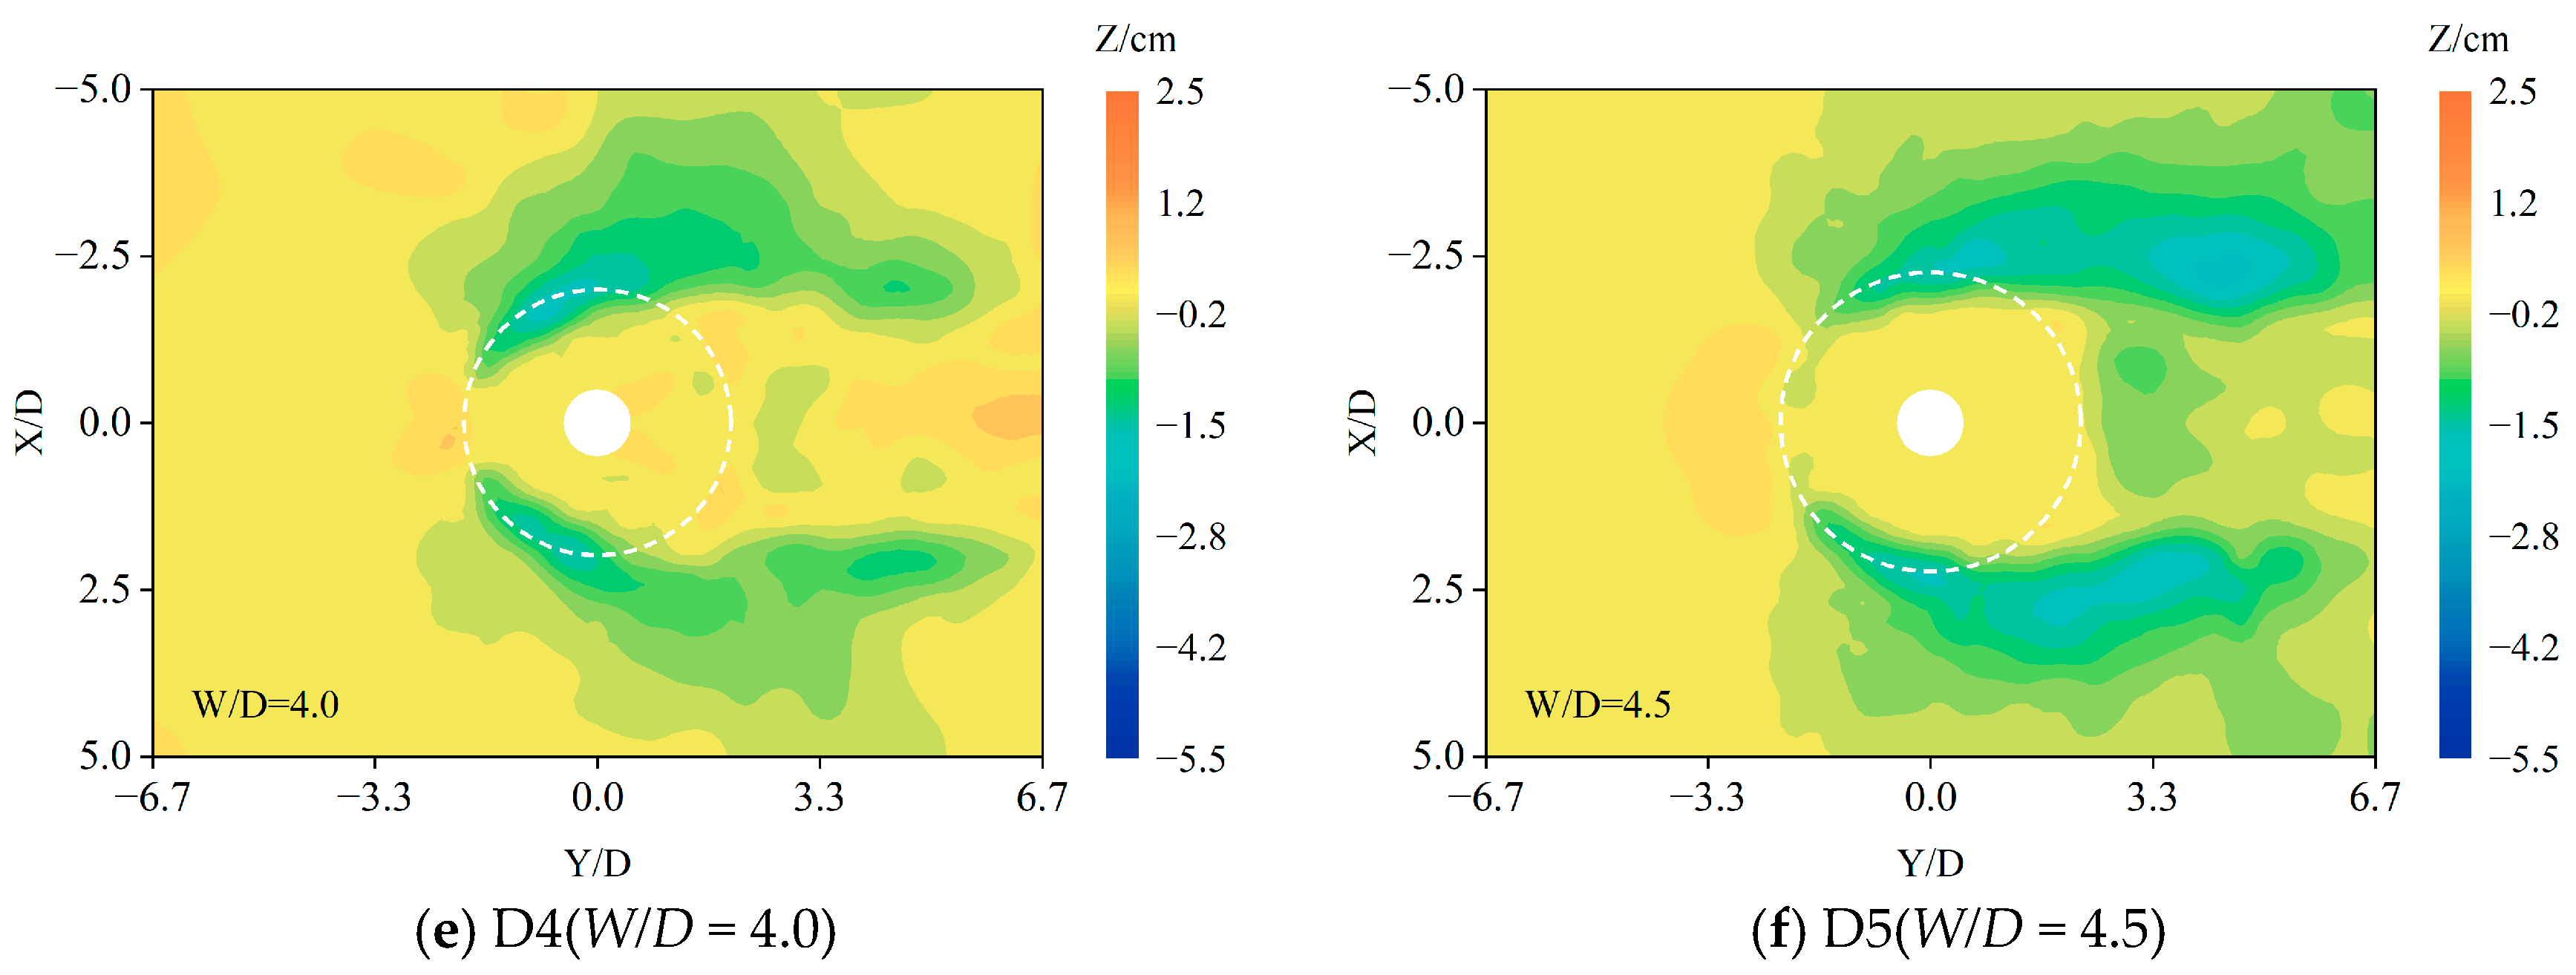
Figure 14 shows the local scour characteristics around the pier using a permeable collar with different diameters using the optimal conditions of porosity and installation height.
Table 4 shows the variation between the maximum local scour depth around the pier and the diameter of the permeable collar.
Figure 14 and
Table 4 show the following: (1) If the diameter of the collar is smaller than 2.5 D, the local scour around the pier is more serious. Meanwhile, the scour pit is larger than the protection range of the collar, and the reduction effect of the collar is weak. (2) With the increase in the collar diameter, the reduction effect of the collar improves gradually, and the maximum local scour depth decreases gradually, especially when W/D ≥ 3.5, and local scouring occurs only on both sides of the collar. The sedimentation behind the pier disappears gradually and the scouring gets more and more serious. The main reason for the above phenomenon is that the collar installed on the surface of the riverbed acts like a cover, and has an obvious effect on restricting the movement of sediment on the riverbed. The larger the diameter of the collar is, the larger the protection range is. On the other hand, with the increase in the collar diameter, the area barrier to the water caused by the collar increases, which causes the increased velocity of the bypass flow around the collar and intensifies the scouring downstream. The increase in the diameter of the collar makes the scouring range outside the protection range increase, and the maximum local scour depth moves downstream.
Figure 15a shows the variation relationship between the average scour depth of each arc around the pier and the diameter of the permeable collar.
Figure 15a shows that the smaller the diameter of the permeable collar is, the larger the average local scour depth is. When W/D is 2.0, the closer the arc to the pier, the larger the average local scour depth is. When W/D is larger than 3.0, the closer the arc to the pier, the smaller the average local scour depth is, especially when W/D is 4.5, where there is almost no scouring around the pier.
Figure 15b shows the variation relationship between the reduction efficiency and the diameter of the collar.
Figure 15b shows that the reduction efficiency increases with the increase in the diameter rapidly when W/D is less than 3.0, then increases slower and eventually stabilizes. When W/D is 4.5, the reduction efficiency is close to 100%, which means that the local scour around the pier can be effectively reduced by increasing the diameter of the collar. However, the diameter of the collar cannot be infinitely large in the actual project, and the construction conditions and the cost should be considered together to determine the diameter. Therefore, a cost-effective diameter for the permeable collar is particularly important. The recommended range of the permeable collar diameter in this paper is from 3.0 to 4.0, and the diameter is 3.5 D in the subsequent tests in this paper.
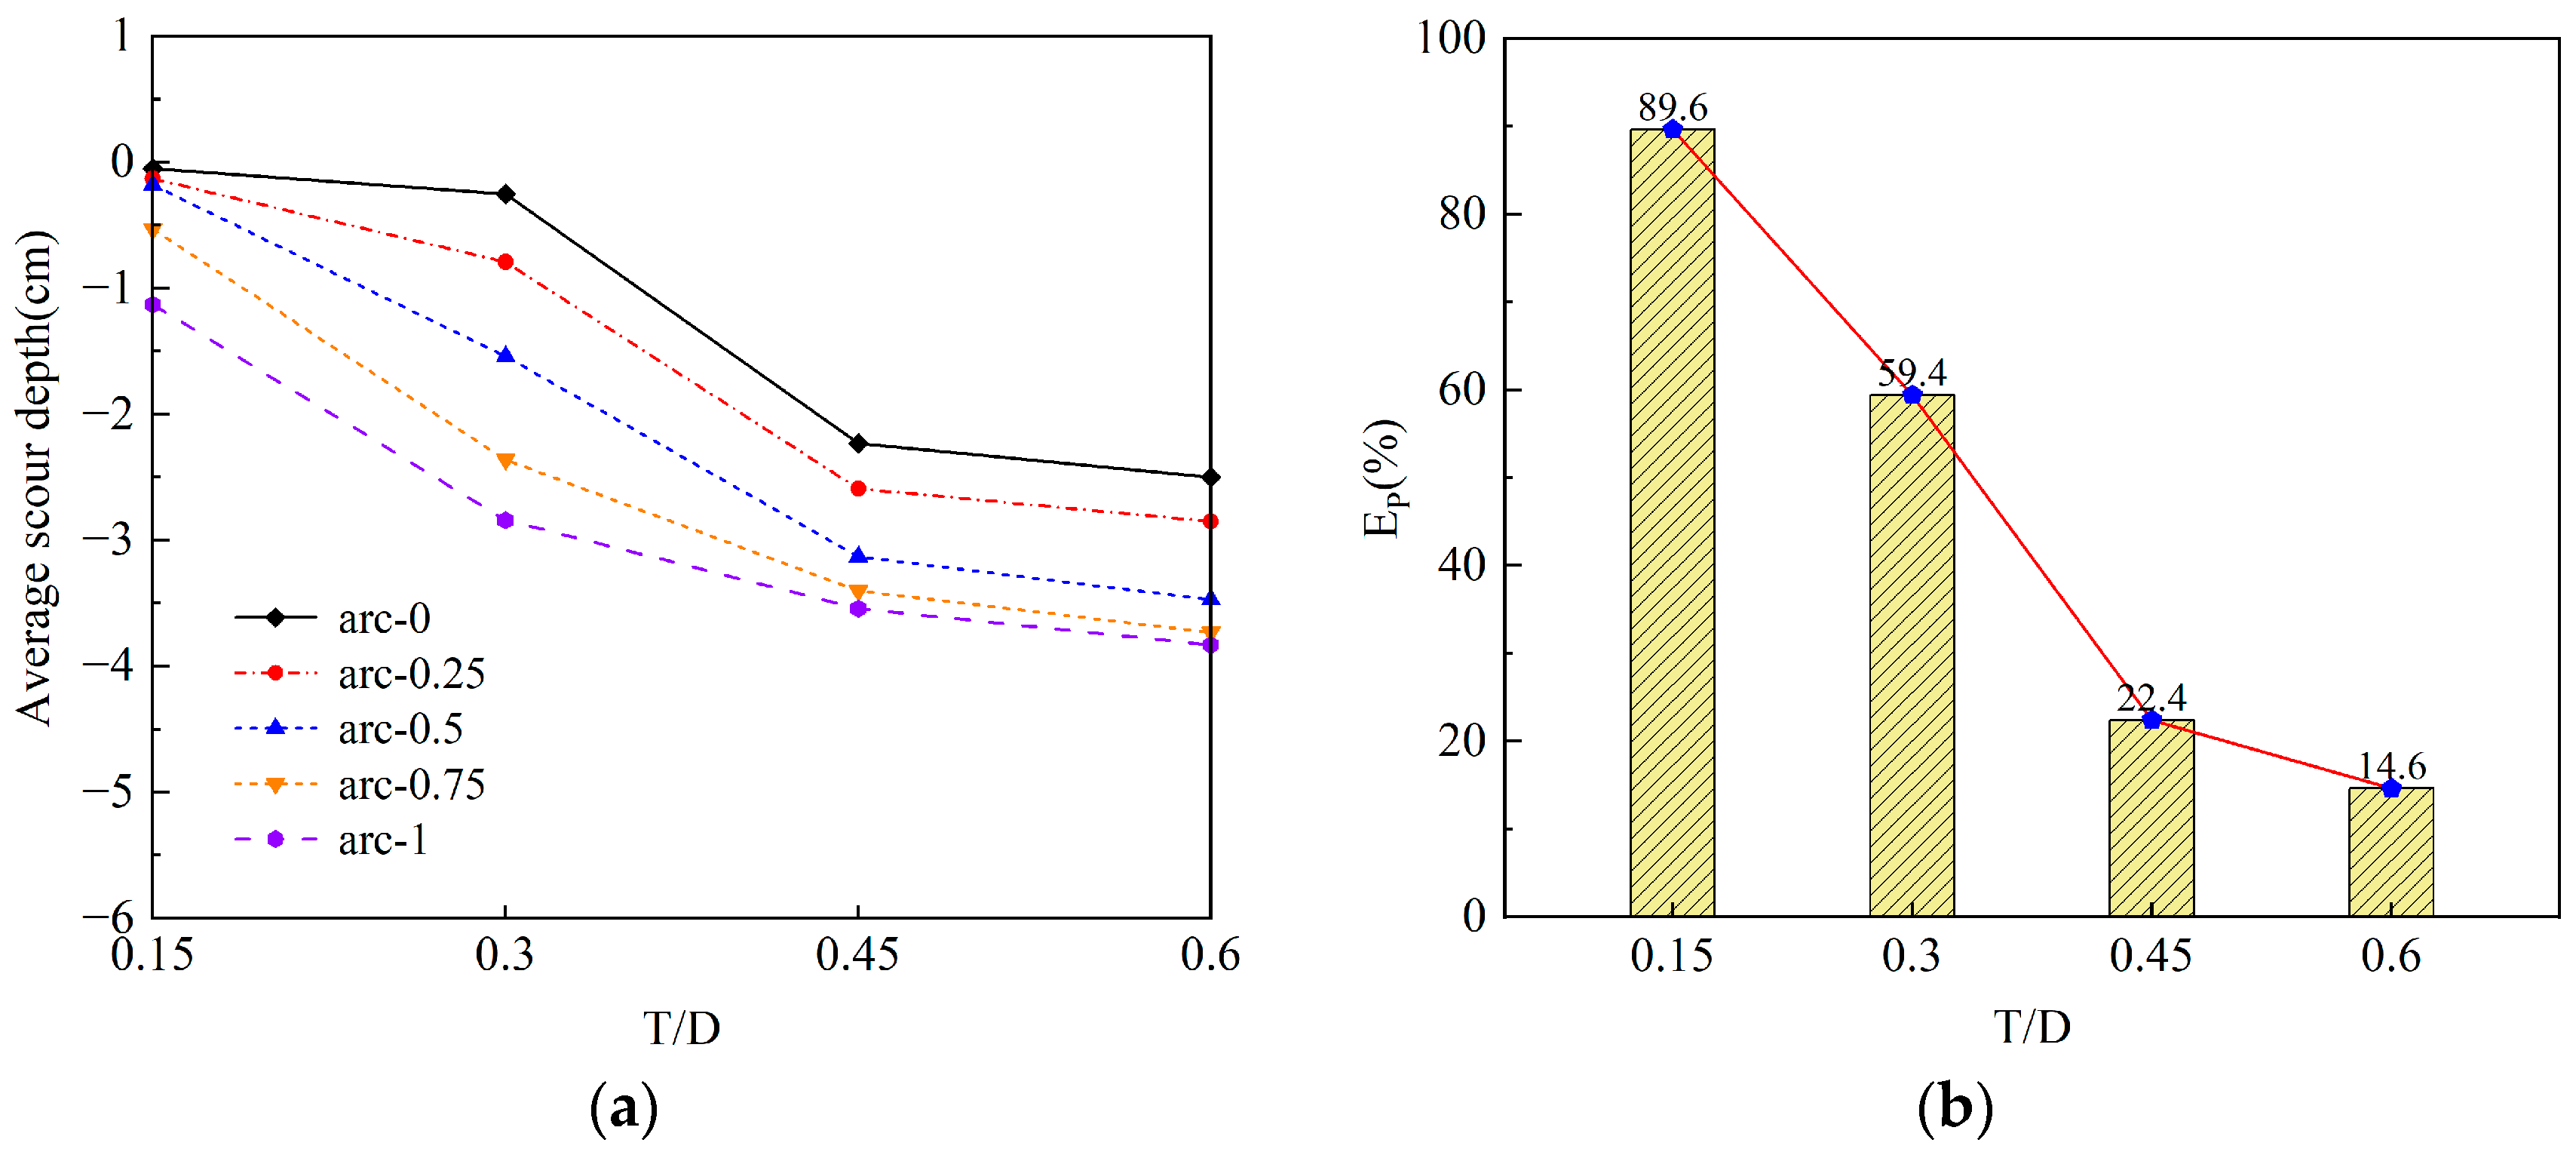
3.5. Influence of Thickness on the Reduction Efficiency of the Permeable Collar (Group E)
Figure 16 shows the local scour characteristics around the pier using a permeable collar with different thicknesses in the optimal conditions of porosity, installation height, and suitable collar diameter.
Table 5 shows the maximum local scour depth around the pier with different thicknesses of the collar.
Figure 16 and
Table 5 show that with the increase in collar thickness (T/D), the local scour depth in front of the pier and the sedimentation behind the pier increased rapidly. The main reason for the above phenomenon is that the increase in collar thickness leads to an increase in the water-blocking area, which causes an increase in the downward flow and results in an increase in turbulence intensity at the edge of the collar and the riverbed. It is similar to the expansion of the pier diameter.
Figure 17a shows the variation relationship between the average scour depth of each arc around the pier and the thickness of the permeable collar.
Figure 17a shows that with the increase in the thickness of the collar, the average local scour depth of each arc increases gradually.
Figure 17b shows the variation relationship between the reduction efficiency and the thickness of the collar.
Figure 17b shows that with the increase in the thickness, the reduction efficiency decreases rapidly. The smaller the thickness is, the greater the reduction efficiency is. Pearson’s correlation coefficient between the thickness of the collar and the reduction efficiency was calculated to be −0.973.
The local scour reduction of piers is a large and complex system, involving sediment characteristics, flow characteristics, structure characteristics, and preventative measure characteristics, which are too extensive to be studied all in one article. Therefore, only the influences of the characteristic parameters of the permeable collar on its local scour reduction effect have been studied in this paper, under the conditions that the structural characteristics, sediment characteristics, and flow characteristics remain unchanged. Although it is not very comprehensive, it can provide references for practical application in the following two aspects: First, the permeable collar can reduce the local scour around piers, and the reduction effect of the permeable collar is even close to that of the solid collar in the same conditions. That means solid collars can be replaced by permeable collars, saving materials and reducing investment. Second, the influence of the main factors (the porosity, the installation height, the diameter, and the thickness) on the reduction efficiency of the permeable collar have been studied, and the relationships between the reduction efficiency and the factors were obtained. Therefore, in practice, the dimensions of each factor of the permeable collar can be determined directly according to the results of this study if the flow and sediment conditions are close. Otherwise, additional studies need to be carried out to make necessary corrections to the results of this study before they can be applied, such as the influence of the sediment (the size and the gradation), the flow (the velocity and the depth of the water), and the structure (the shape) on the reduction efficiency of the permeable collar, which are also included in the content of our future research.


