Article

Matching Degree between Agricultural Water and Land Resources in the Xijiang River Basin under Changing Environment

1
College of Water Conservancy, Yunnan Agricultural University, Kunming 650201, China
2
College of Hydrology and Water Resources, Hohai University, Nanjing 210098, China
*
Author to whom correspondence should be addressed.
Water 2023, 15(4), 827; https://doi.org/10.3390/w15040827
Submission received: 29 December 2022 / Revised: 6 February 2023 / Accepted: 13 February 2023 / Published: 20 February 2023
(This article belongs to the Section Water, Agriculture and Aquaculture)

Abstract

:
The matching degree between agricultural water and land resources directly determines the sustainable development of regional agriculture. Based on climate data corrected by delta statistical downscaling from five global climate models (GCMs) in the Coupled Model Intercomparison Project Phase 6 (CMIP6) and a multi-model ensemble, this study simulated the runoff used by the Variable Infiltration Capacity (VIC-3L) model under four emission scenarios (SSP1-2.6, SSP2-4.5, SSP3-7.0, and SSP5-8.5) and analyzed the land use changing trend to obtain the matching degree between agricultural water and land resources. The results demonstrate that annual climate factors exhibit an increasing trend, and the average annual runoff was 2128.08–2247.73 × 108 m3, during 2015–2100 under the four scenarios. The area of farmland changed with an increased area of 4201 km2 from 1980 to 2020. The agricultural water and land resources would be well matched under the SSP1-2.6 and SSP2-4.5 scenarios in 2021–2100. However, the risks of mismatch would occur in the 2030–2040 and 2050–2060 periods under the SSP3-7.0 scenario, and the 2030–2040 and 2080–2090 periods under the SSP5-8.5 scenario. This study can provide insight into the scientific decision support for government departments to address the challenges of mismatching risks of agricultural water and land resources.

1. Introduction

Water resources directly affect the production and utilization of agricultural land, while the utilization of agricultural land also has an important impact on the development and application of water resources [1]. Therefore, the spatial–temporal matching degree between agricultural water and land resources directly determines the sustainable development of regional agriculture and the sustainable utilization of natural resources [2]. At the same time, the spatiotemporal matching pattern between agricultural water and land resources is also the premise and basis for the optimal allocation of regional water and land resources [3]. Thus, the spatiotemporal matching pattern between water and land resources has always been a primary focus for many scholars.
At present, climate change has become one of the most important environmental challenges in the world and has a significant effect on further aggravating the contradiction between water supply and demand [4,5]. Meanwhile, drastic human activities are constantly changing the land use type [6], thereby changing the matching degree of regional water and land resources. Studying the changing trends of water and land resources under the changing environment (mainly including two aspects, i.e., climate change and human activities) [7] and clarifying the matching coefficient between water and land resources are of great scientific significance, providing application value for rationally allocating regional water and land resources.
The spatiotemporal matching pattern of water and land resources is a prerequisite for agricultural production. Scholars have done a lot of studies on the matching patterns of water and land resources in the world. They have studied the matching pattern of water and land resources in specific regions by using the matching coefficient of water and land resources method, Gini coefficient method, data envelopment analysis (DEA) method, etc., and have made some achievements in China and other research areas [8,9,10,11]. In recent years, more new methods have been used to study the matching degree of agricultural water and soil resources. Liu et al. [12] used a model for measuring the matching index between the broadly-defined agricultural water resources and land resources (MIBAWRLR), to evaluate the degree of matching between agricultural water and land resources from 2001 to 2016. Du et al. [13] used the spatial mismatch index to investigate the spatial–temporal changes of matching characteristics between agricultural water and land resources in Ningxia from 2007 to 2017. Based on the conception of generalized water resources (including blue water and green water), Geng et al. [14] developed a holistic index (RSI), derived from resource equivalency analysis (REA), to examine the abundance or deficiency of agricultural water and land resources (AWLR) from 2010 to 2017. The matching coefficient of the water and land resources method is simple, and the application is mature, thus, it is most frequently used. Data in that previous studies are obtained from statistical yearbooks, which are usually discontinuous and also difficult to obtain. Furthermore, only matching degrees of past times are studied, and there are relatively few studies on the matching prediction of water and land resources for the future.
Research on matching the degree of agricultural water and soil resources in the future needs to be carried out from two aspects: the prediction of future water resources and the prediction of future land use. At present, based on the rapid development of the Coupled Model Intercomparison Project (CMIP) [15], many scholars will use the global climate models (GCMs) and combine hydrological models to explore the changes in water resources under different emission scenarios in the future. This will provide an important reference for research on water resource management and ecological protection [16,17,18]. However, direct outputs of GCMs with systematic deviations are applicated to research and will cause large errors in the results. Deviation correction is required when using the outputs of GCMs. Therefore, it is necessary to evaluate the downscaling results. Meanwhile, with the continuous development of remote sensing technology, the research on land use change has gradually changed from land evaluation research to land use model and prediction research, involving studies on land use patterns, ecological environments, dynamic mechanisms, and many other aspects [19,20,21]. The study of simulation and prediction of land use is mainly obtained by establishing mathematical models [22,23]. Research on the change process of land use is very important to predict the changes in land use type and to formulate the corresponding policies in the future. Thus, it is feasible that future land use and water resources under the changing environment can be obtained, which can lead to future studies on the matching degrees.
In the Xijiang River basin, China, due to the impact of climate change, drought disasters have occurred frequently in recent years, which can seriously affect the production of coastal residents and local economic development [24]. At the same time, human activities have a great impact on the natural form of the basin, while the land use type has been changing continuously [25]. However, the agricultural water supply security and the matching problem of agricultural water and land resources in the basin need to be urgently solved. Though, any relevant research on the Xijiang River basin currently primarily focuses on the hydrological simulation and drought [26,27,28], while there is no research on the matching degree between agricultural water and land resources in this region.
Thus, the purposes of this study were: (1) to investigate the characteristics of climate change for the future; (2) to predict the water resources of the Xijiang River basin by hydrological model simulation based on the data from GCMs; (3) to investigate the characteristics of the land use change; (4) to explore the regular pattern of matching degree between agricultural water and land resources in the Xijiang River basin under changing environment.

2. Materials and Methods

2.1. Study Area

The Xijiang River is the largest water system in the Pearl River. It originates from the eastern foot of Maxiong Mountain in Qujing City, Yunnan Province, on the Yunnan-Guizhou Plateau (Figure 1). The river flows from west to east through Yunnan, Guizhou, Guangxi, and Guangdong provinces, with a total length of 2075 km and an average slope drop of 0.58%. The catchment area is about 3.5 × 10⁵ km2, accounting for 77.83% of the total area of the Pearl River basin. There are many tributaries of the Xijiang River system. The primary tributaries with a catchment area of more than 1.0 × 10⁴ km2 include the Beipan River, Liujiang River, Yujiang River, Guijiang River, and Hejiang River. The Xijiang River is the most important water supply source in China. The Xijiang River basin belongs to the subtropical monsoon climate zone, with obvious changes in dry and wet seasons, and an uneven distribution of precipitation in the region, which leads to the uneven distribution of water resources in the basin.

2.2. Model and Data

At present, a total of 33 different scientific research institutions have participated in Coupled Model Intercomparison Project Phase 6 (CMIP6). The Scenario Model Intercomparison Project (ScenarioMIP), as the primary activity within CMIP6, is widely used in research fields such as the prediction and mechanism of future climate changes [29]. The ScenarioMIP emission pathways include four Shared Socioeconomic Pathways (SSPs), namely: SSP1-2.6, SSP2-4.5, SSP3-7.0, and SSP5-8.5. They indicate the representative concentration pathways, where radiative forcing will reach 2.6 W/m2 (low-forcing scenario, SSP1-2.6), 4.5 W/m2 (medium-forcing scenario, SSP2-4.5), 7.0 W/m2 (medium- to the high-forcing scenario, SSP3-7.0), and 8.5 W/m2 (high-forcing scenario, SSP5-8.5) near 2100, respectively [30].
In this study, five GCMs were selected from CMIP6 with complete datasets of daily precipitation, daily maximum temperature, daily minimum temperature, and daily wind speed, and the four Shared Socioeconomic Pathways, such as SSP1-2.6, SSP2-4.5, SSP3-7.0, and SSP5-8.5 were used (https://esgf-node.llnl.gov/search/cmip6/ (accessed on 6 December 2022)). The global climate model’s information is shown in Table 1. In addition, the multi-model ensemble mean (MME) is a better method to reduce the uncertainty of model simulation. Its simulation capability is better than that of a single model, and it is widely used in climate change simulations [31]. Therefore, this study also used it, named “Multi”.
Daily meteorological data of the 63 weather stations from 1961 to 2014, including precipitation, maximum temperature, minimum temperature, and wind speed were obtained from “Daily Data Set 2.0 of China’s Surface Climatic Data”, which was issued by the National Meteorological Science Data Center (http://data.cma.cn (accessed on 6 July 2022)). The data have been quality controlled, during which, it performed satisfactorily. The actual observed daily runoff data of the Gaoyao hydrologic station at the outlet of the Xijiang River basin were obtained from the “Hydrological Yearbook of the Pearl River Basin”.
The land use data, with a resolution of 30 m, were obtained from the Resource and Environmental Science Data Center of the Chinese Academy of Sciences (http://www.resdc.cn (accessed on 8 September 2022)). Digital elevation data (DEM), with a resolution of 30 m, were obtained from the National Aeronautics and Space Administration (https://www.nasa.gov/ (accessed on 3 February 2022)). All the above data were checked, and the data quality was good.

2.3. Method

2.3.1. Delta Statistical Downscaling

In this study, the inverse distance weighted (IDW) method was used to generate daily precipitation, daily maximum temperature, daily minimum temperature, and daily wind speed for the five GCMs and “Multi” from the 63 weather stations in the Xijiang River basin. The delta statistical downscaling method was used for bias correction. The method is a simple bias correction technique recommended by the U.S. Global Change Research Program, which is easy to operate, requires fewer factors, and is widely applied in a wide range of climate change studies [32,33]. For variables such as precipitation, temperature, or wind speed, the method is used to calculate the average deviation in each climate station between the historical observation data and the historical simulation data of each GCM. Then, the average deviation is applied to the simulation data in the future. The calculation equations are as follows [34]:
P g c m b i a s , d = P g c m , m , h i s P o b s , m , h i s P g c m , d
T g c m b i a s , d = T g c m , d + ( T o b s , m , h i s T g c m , m , h i s )
W g c m b i a s , d = W g c m , d + ( W o b s , m , h i s W g c m , m , h i s )
where Pgcm-bis,d, Tgcm-bis,d, and Wgcm-bis,d are daily data for precipitation, temperature, and wind speed, which have been reconstructed by the delta statistical downscaling method, respectively; Pgcm,d, Tgcm,d, and Wgcm,d are daily data for precipitation, temperature and wind speed of GCMs, respectively; Pgcm,m,his, Tgcm,m,his, and Wgcm,m,his are multi-year monthly average data for precipitation, temperature, and wind speed of GCMs, respectively; Pobs,m,his, Tobs,m,his, and Wobs,m,his are multi-year monthly average observed data for precipitation, temperature and wind speed, respectively.

2.3.2. VIC-3L Model Calibration and Evaluation

VIC-3L land surface model is a macroscale distributed hydrological model that is based on the water and energy balance. It has been widely applied for surface runoff generation [35,36]. This study used the VIC-3L to simulate the runoff under four different emission scenarios such as SSP1-2.6, SSP2-4.5, SSP3-7.0, and SSP5-8.5. The input parameters include land use data, soil data, and meteorological data (daily precipitation, daily maximum temperature, daily minimum temperature, and daily wind speed).
To evaluate the performance of simulation results provided by the model, statistical performance indicators, such as the Nash–Sutcliffe efficiency coefficient (NSE), ratio of root mean squared error to standard deviation (RSR), and percentage of bias (PBIAS) were used. Normally, when NSE > 0.5, RSR ≤ 0.7, and PBIAS < ± 25%, the modeling results of the runoff are considered to be satisfactory. Furthermore, the modeling results can be evaluated as good if 0.75 ≥ NSE > 0.65, 0.6 ≥ RSR > 0.5 and ± 15% ≥ PBIAS > ± 10%, and very good if 1.0 ≥ NSE > 0.75, 0.5 ≥ RSR, and ±10% ≥ PBIAS [37].

2.3.3. Calculation of Matching Coefficient of Agricultural Water and Land Resources

The matching coefficient [38,39] of agricultural water and land resources indicates the temporal suitable matching relationship between water resources and farmland resources available for agricultural production in a region. It is generally expressed by the number of water resources available per unit of farmland area. The coefficient is determined by the area of farmland, the number of water resources in a region, temporal distribution, and the utilization of the water resources, etc. The smaller the value, the lower the matching degree will be, which indicates there is more farmland and less water in the region.
In this study, the method of the matching coefficient was used to study the matching degree of agricultural water and land resources in the Xijiang River basin. The calculation equation is expressed as:
R k = α W k L k
where Rk is the matching coefficient of agricultural water and land resources in the basin in the kth year, α is the agricultural water use proportion coefficient, and is taken as 0.68 [40]; Wk is the total runoff of the basin in the kth year (108 m3), Lk is farmland area of the basin in the kth year (104 hm2).

3. Results

3.1. Climate Changing Trend

3.1.1. Climate Models Evaluation

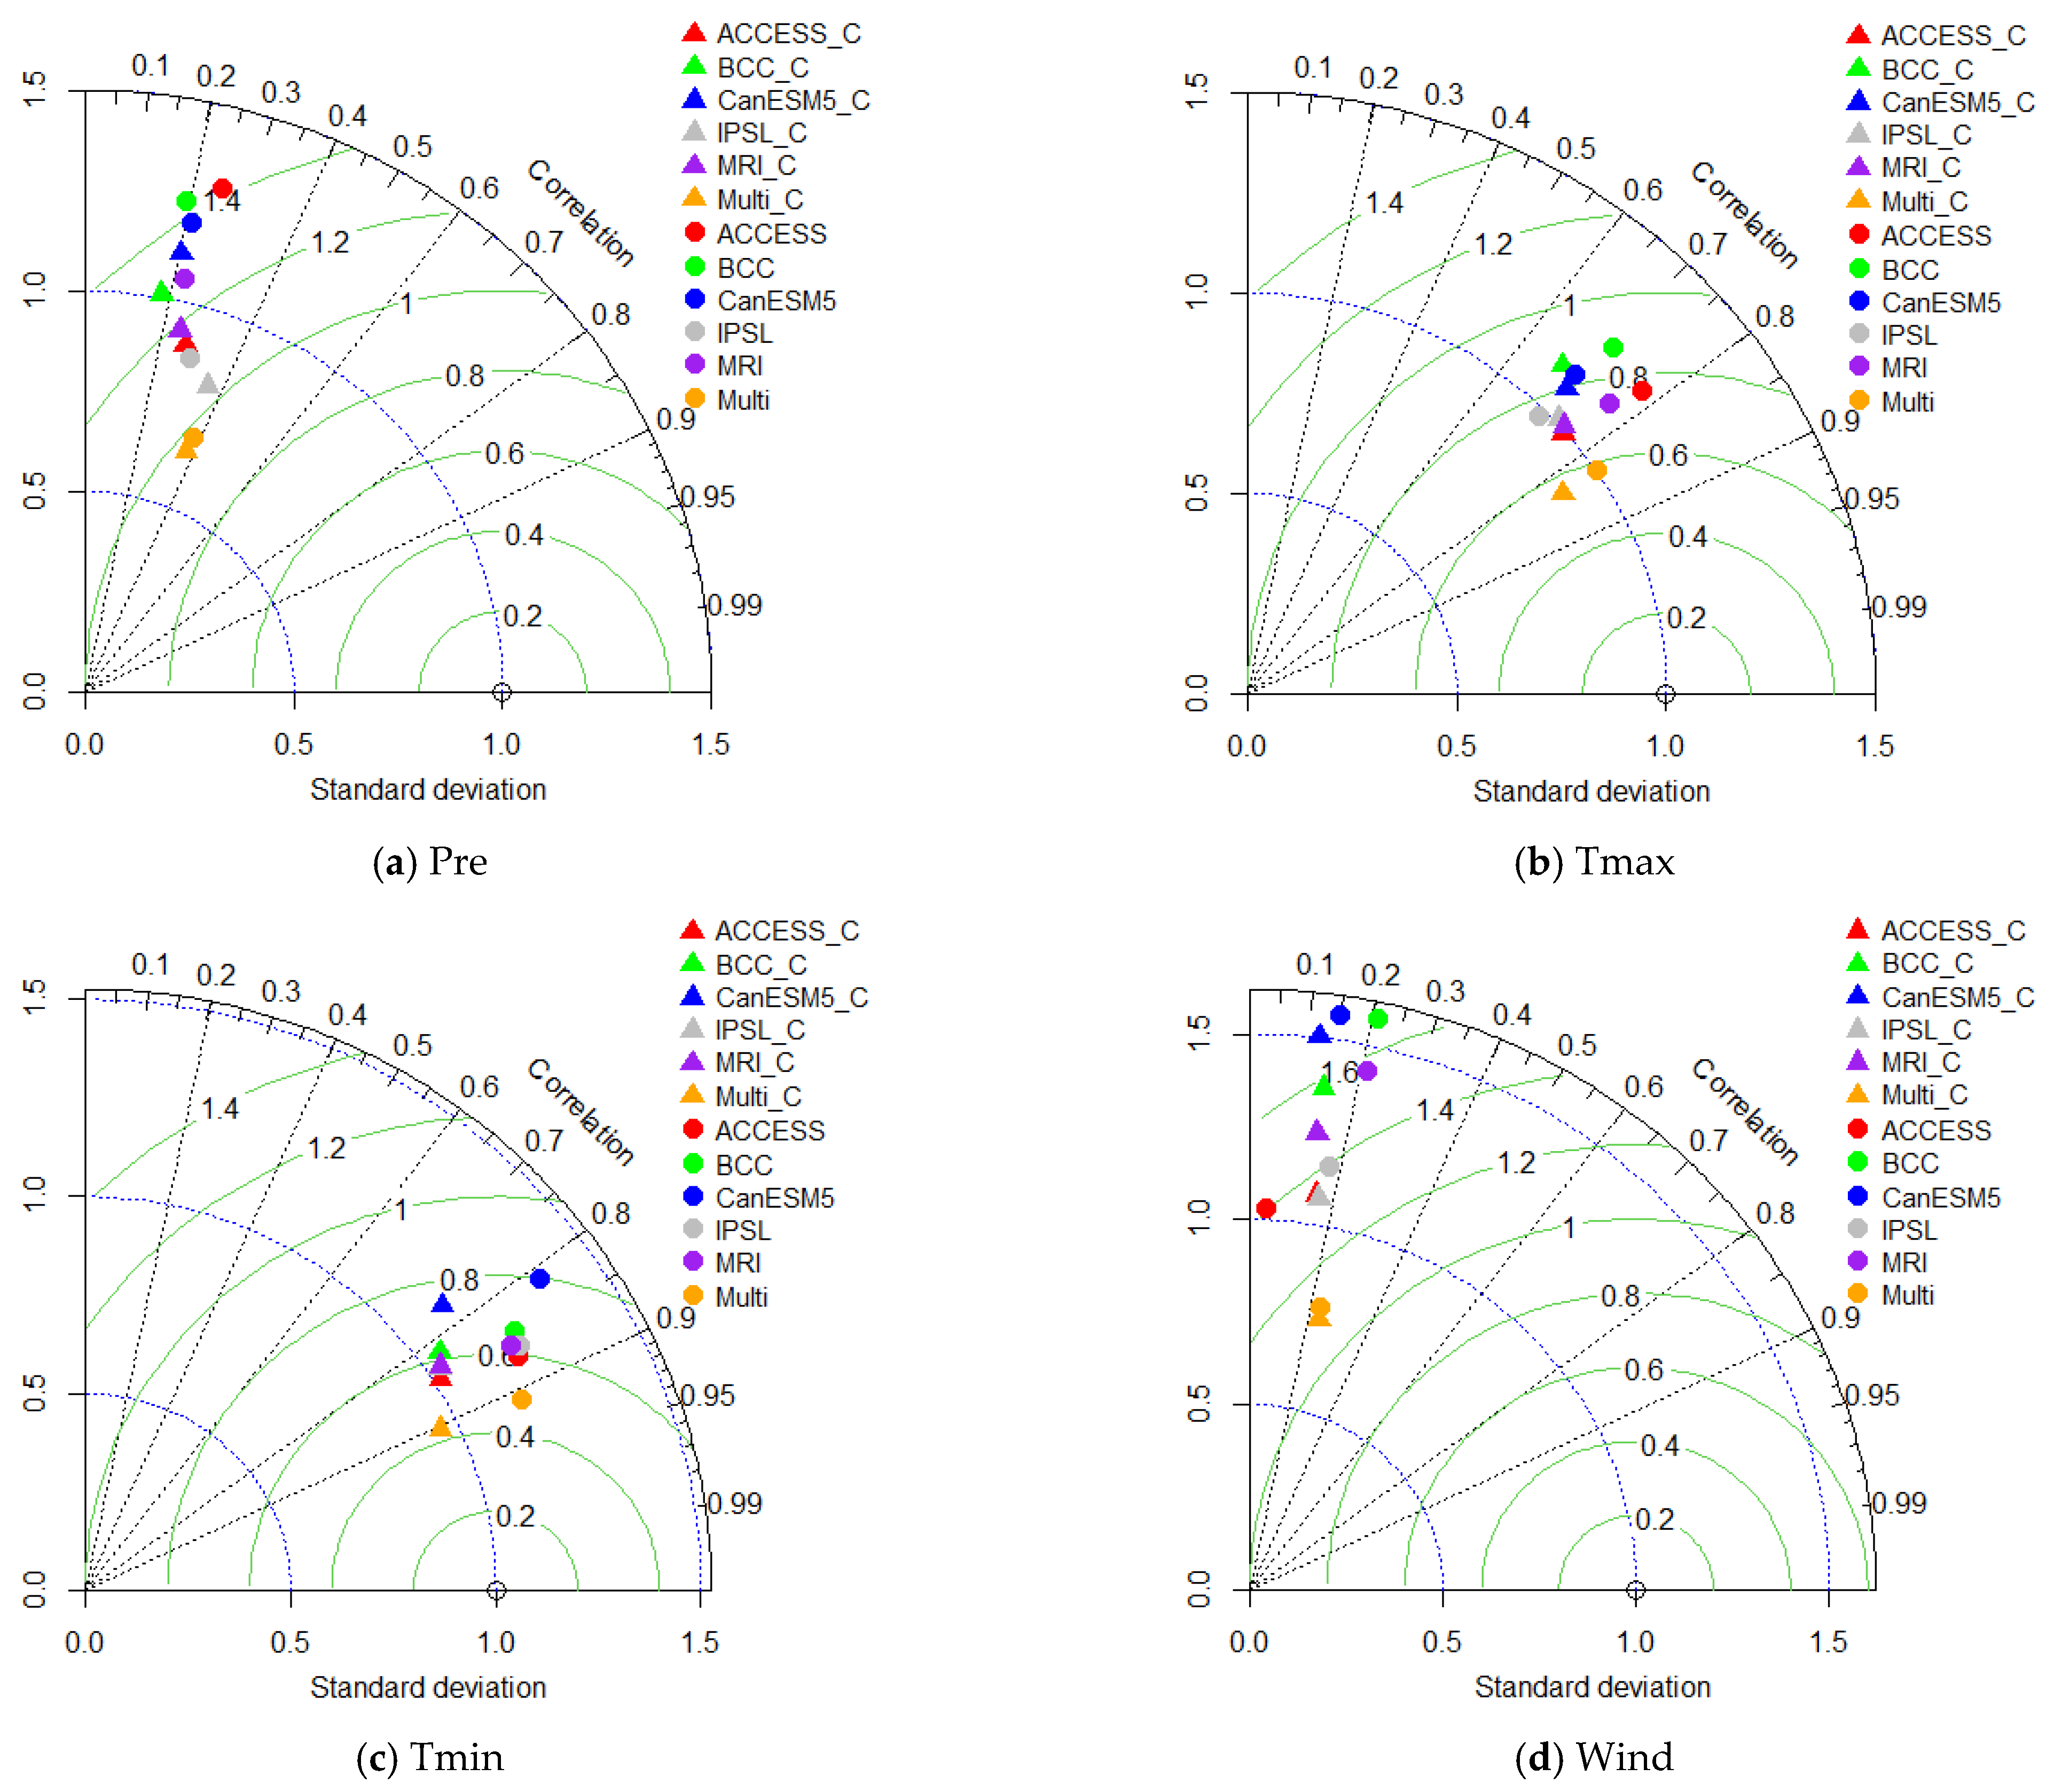
The simulation effectiveness of daily precipitation, daily maximum temperature, daily minimum temperature, and daily wind speed of the five climate models in the 1961–2014 period was evaluated by standard deviation, root mean squared error and correlation coefficient based on the observed values from the 63 ground-based meteorological stations. The results are shown in a Taylor chart (Figure 2). For daily precipitation corrected by delta statistical downscaling, IPSL-CM6A-LR was ranked high for each evaluation index. For the corrected daily maximum temperature, ACCESS-CM2 was ranked high for each evaluation index. For the corrected daily minimum temperature, ACCESS-CM2 was ranked high for each evaluation index. For the corrected daily wind speed, IPSL-CM6A-LR was ranked high for each evaluation index. The five climate models had different simulation effects on daily precipitation, daily maximum temperature, daily minimum temperature, and daily wind speed. Among them, IPSL-CM6A-LR had the best simulation performance on daily precipitation and daily wind speed, and ACCESS-CM2 had the best simulation on daily maximum temperature and daily minimum temperature.
Generally, the simulation effect of the daily maximum temperature and daily minimum temperature was better than the other two meteorological factors. In addition, it can also be seen from Figure 2 that the simulation accuracy of all four meteorological factors improved after the values were corrected.
The simulation effectiveness of the daily precipitation, daily maximum temperature, daily minimum temperature, and daily wind speed in the “Multi” model for the 1961–2014 period was also evaluated (Figure 2). Compared with the five climate models, all four meteorological factors in the “Multi” were better. This indicates that the “Multi” has a higher simulation accuracy and provides more reliable results.
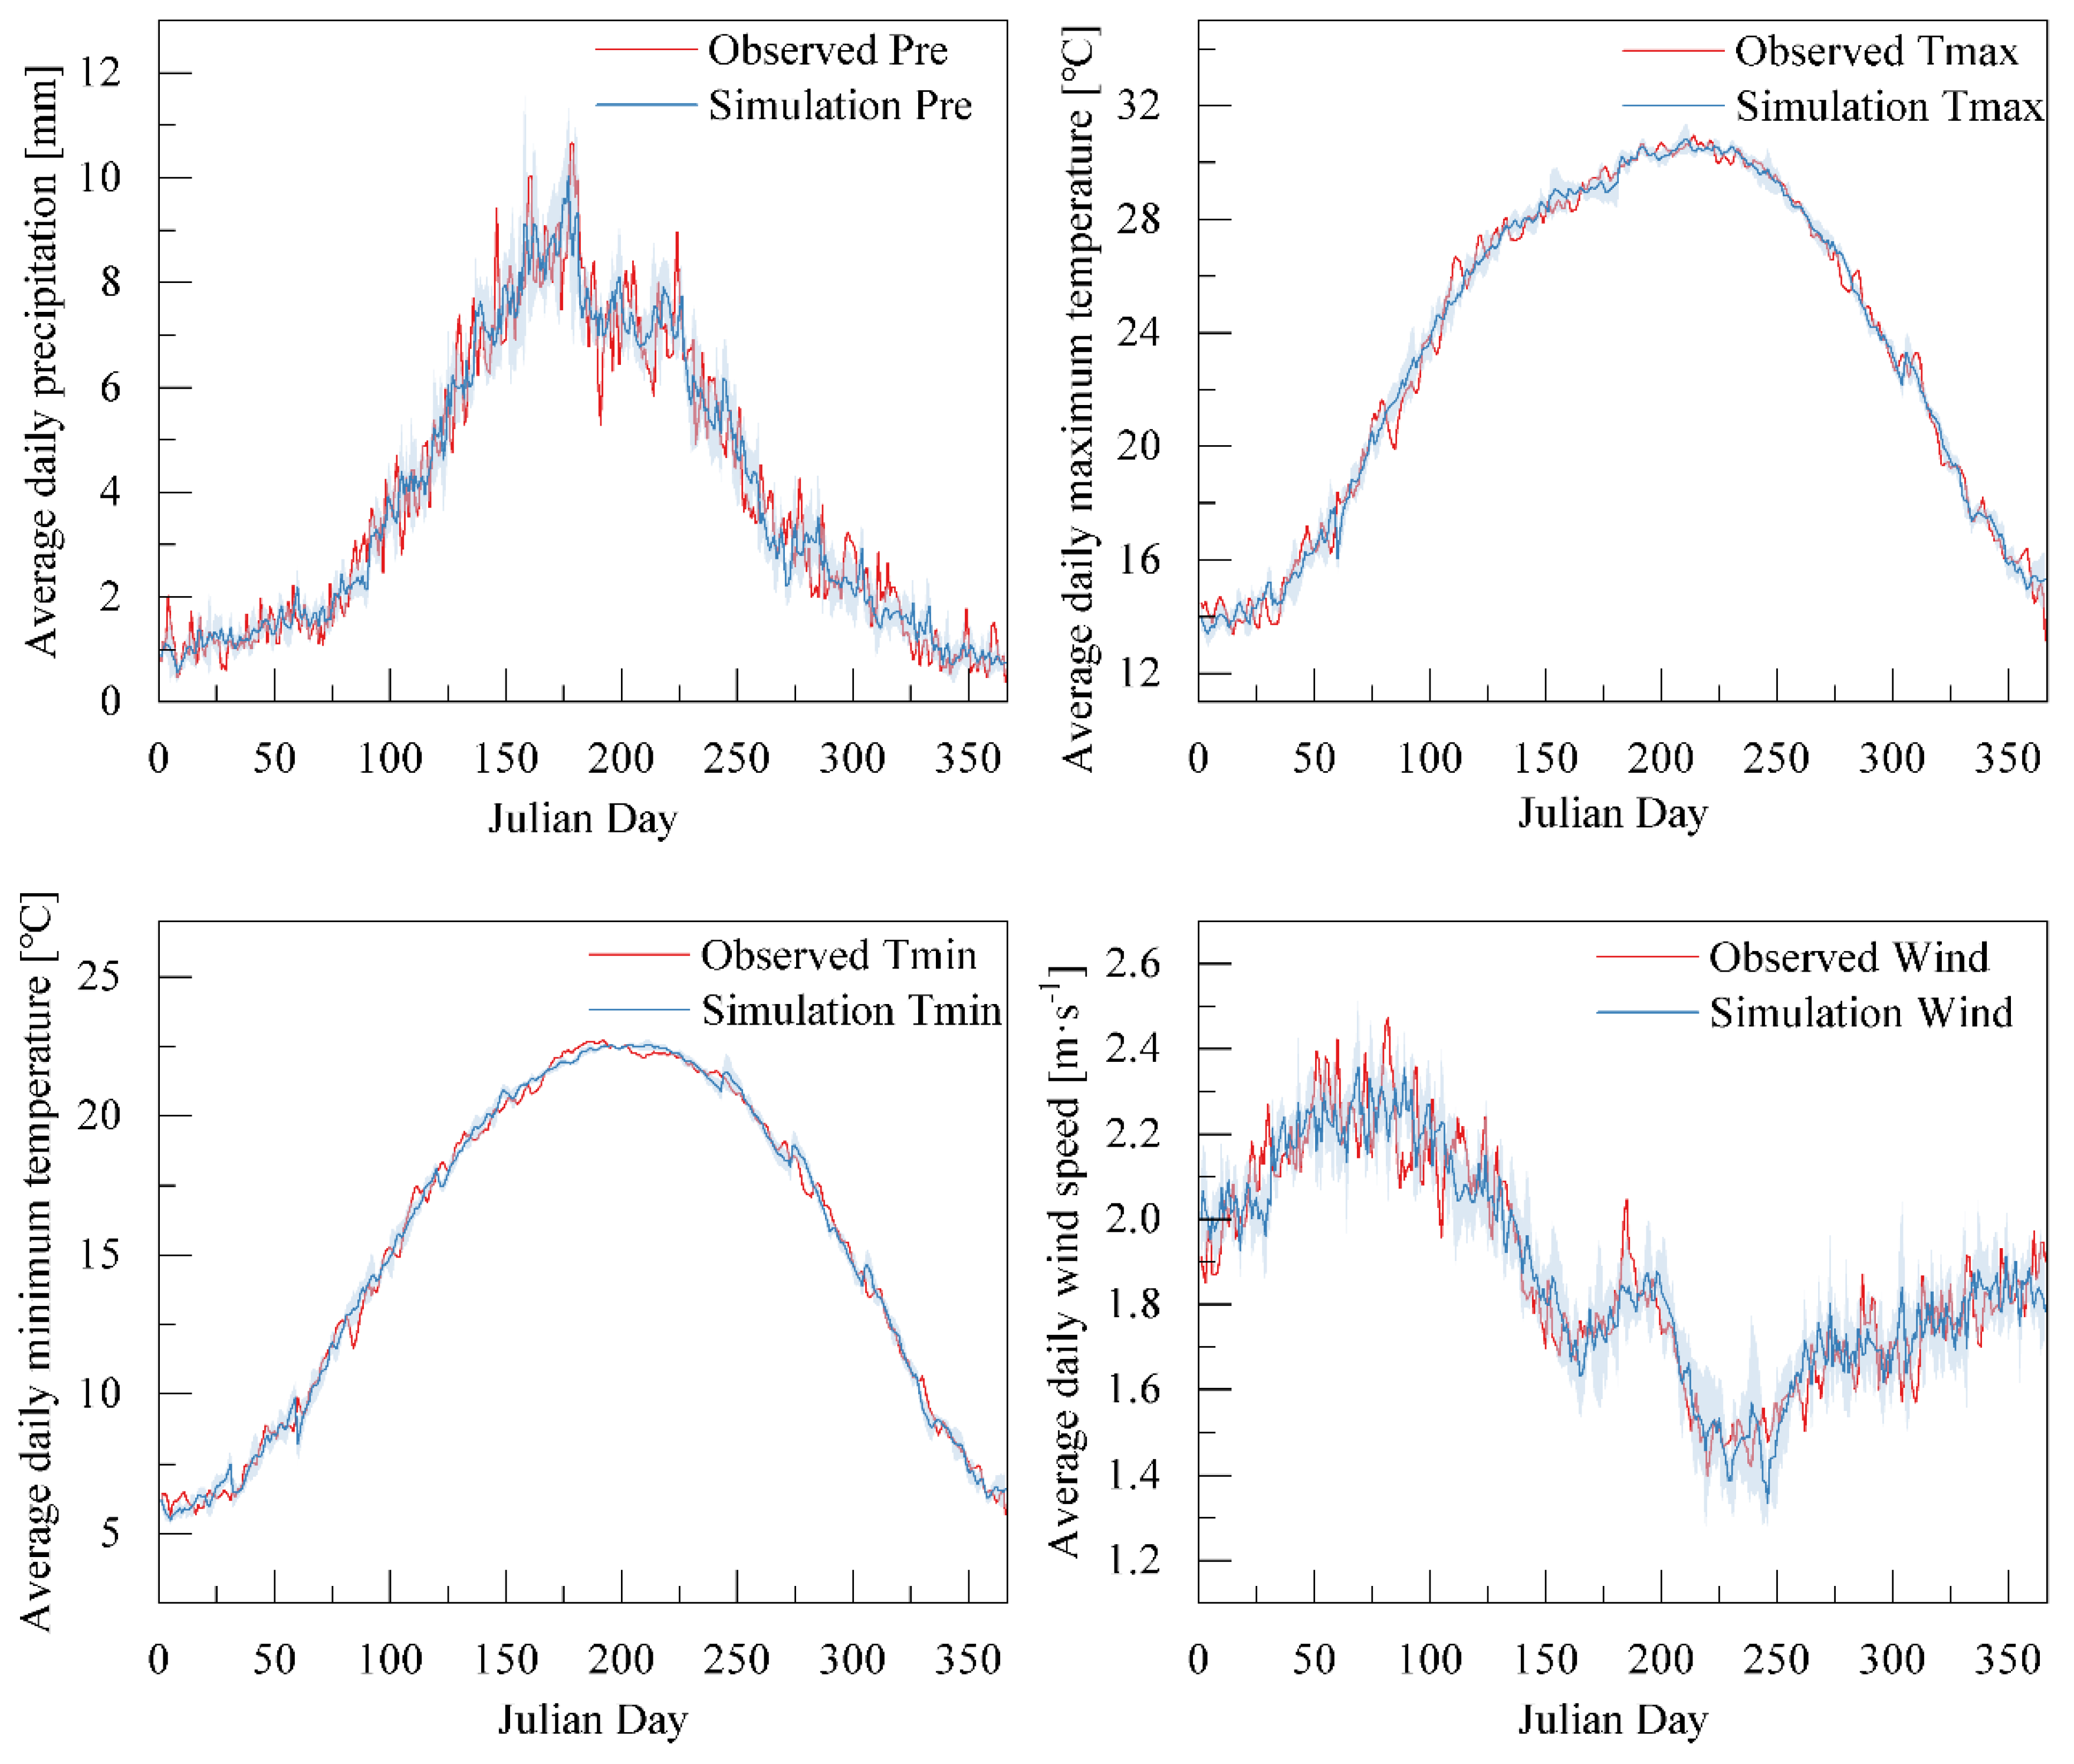
The distribution differences during a year between the multi-year daily average observation values and the “Multi” simulation values in the Xijiang River basin from 1961 to 2014 are shown in Figure 3. For distribution during a year of precipitation, temperature, and wind speed, the values for the “Multi” simulation were consistent with the observation of the changing trend and distribution characteristic. Meanwhile, the uncertainty values for the daily maximum temperature and daily minimum temperature for the “Multi” were small. While the uncertainty values of daily precipitation and daily wind speed for the “Multi” were a little large. Therefore, the “Multi” could be used to analyze the climate-changing trend and simulate the runoff in the Xijiang River basin.

3.1.2. Climate Change Characteristics

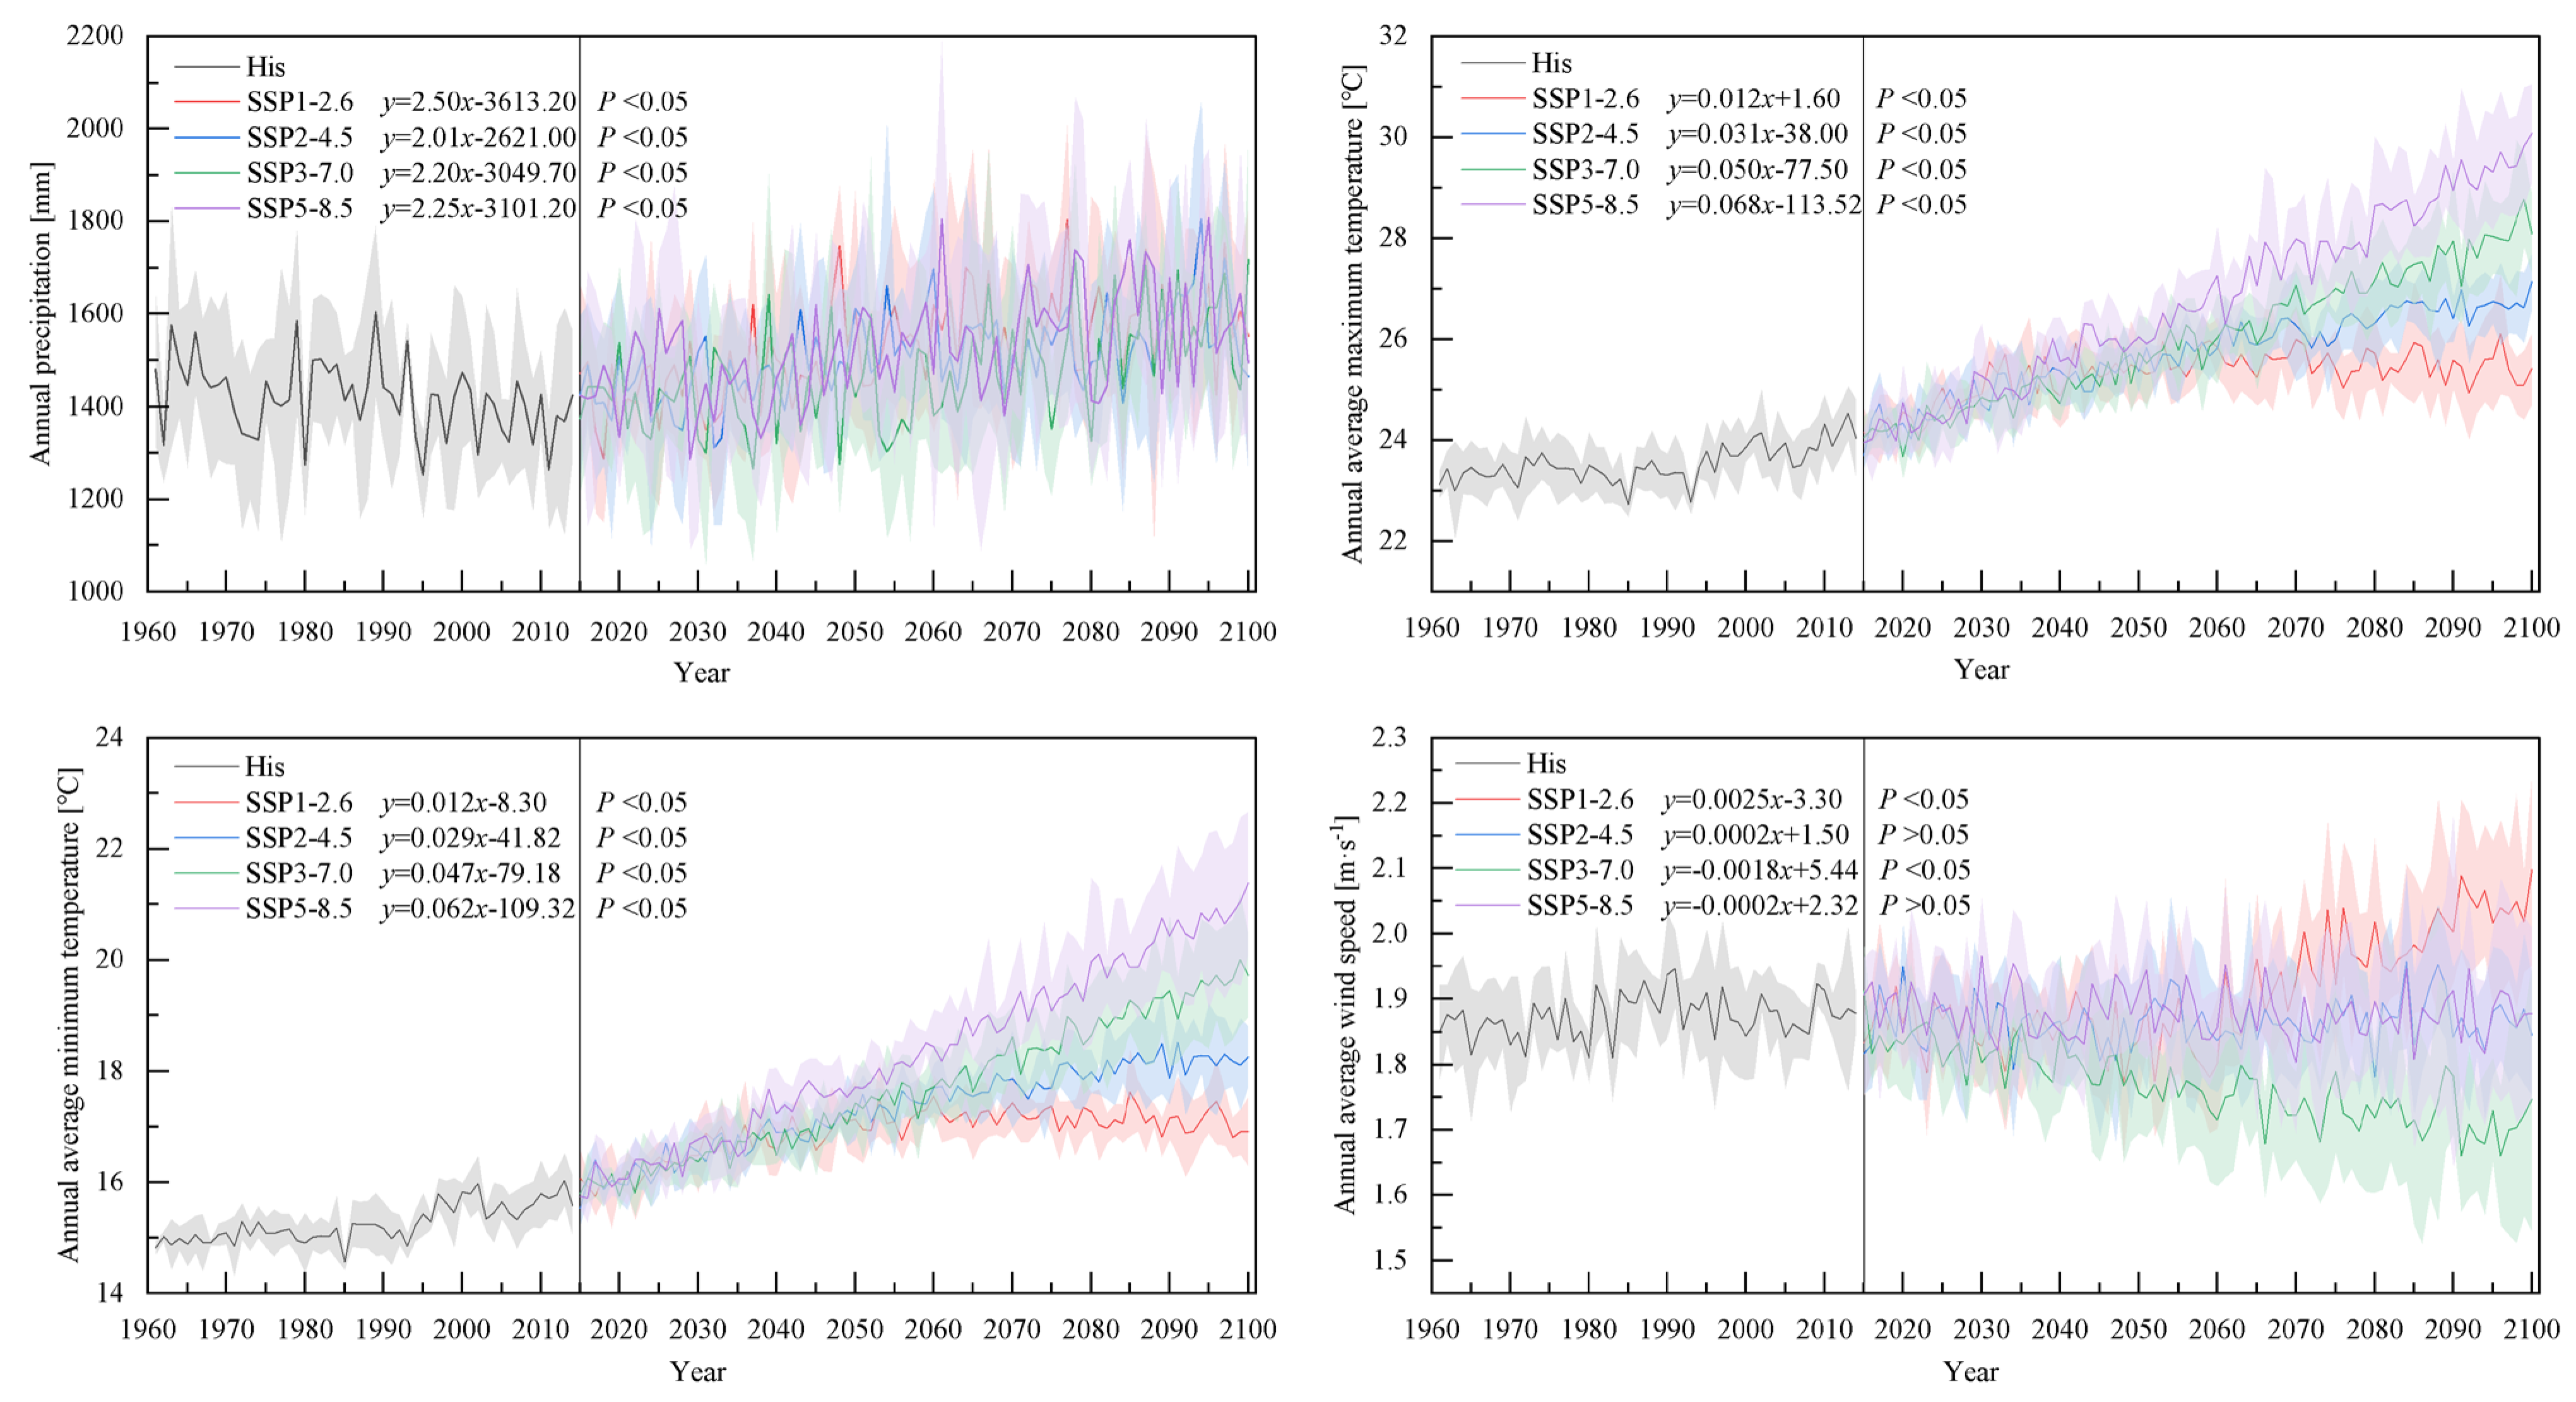
The changing trends in annual precipitation, annual average maximum temperature, annual average minimum temperature, and annual average wind speed in the Xijiang River basin from 2015 to 2100, under the scenarios of SSP1-2.6, SSP2-4.5, SSP3-7.0, and SSP5-8.5, are shown in Figure 4. Under all four scenarios, the annual precipitation in the basin from 2015 to 2100 showed a significant increasing trend, and all passed the 95% confidence test. Under the scenario of SSP1-2.6, the annual precipitation increase rate was the highest, whereas SSP2-4.5 was the lowest. The annual precipitation increase rates under all four scenarios were 25.00 mm/10a, 20.08 mm/10a, 21.99 mm/10a, and 22.49 mm/10a, respectively. Thus, the annual precipitation in the Xijiang River basin would decrease at first and then increase with the rising of the radiative forcing level in the 2015–2100 period.
From Figure 4, both the annual average maximum temperature and annual average minimum temperature in the basin from 2015 to 2100 showed a significant increasing trend, under the scenarios of SSP1-2.6, SSP2-4.5, SSP3-7.0, and SSP5-8.5, and all passed the 95% confidence test. Under the four scenarios, the annual average maximum temperature increase rates were 0.12 °C/10a, 0.31 °C/10a, 0.50 °C/10a, and 0.68 °C/10a, respectively, and the annual average minimum temperature increase rates were 0.12 °C/10a, 0.29 °C/10a, 0.47 °C/10a, and 0.62 °C/10a, respectively. It indicated that the annual maximum temperature and annual minimum temperature in the Xijiang River basin would increase with the rising of the radiation forcing level in the 2015–2100 period.
Annual average wind speed in the basin during 2015–2100 showed an increasing trend under the scenario of SSP1-2.6 and passed the 95% confidence test. It also showed an increasing trend under the scenario of SSP2-4.5, although didn’t pass the 95% confidence test. In addition, the annual average wind speed during 2015–2100 under the scenarios of SSP3-7.0 and SSP5-8.5 both showed a decreasing trend, while the value passed the 95% confidence test under the scenario of SSP3-7.0, yet did not pass the 95% confidence test under the scenario of SSP5-8.5.
In summary, annual precipitation, annual average maximum temperature, and annual average minimum temperature in the Xijiang River basin from 2015 to 2100 showed an increasing trend under the four scenarios, including SSP1-2.6, SSP2-4.5, SSP3-7.0, and SSP5-8.5. Furthermore, the annual average maximum temperature and annual average minimum temperature showed strong regularity, which increased with the rising of the radiative forcing level. However, the annual average wind speed from 2015 to 2100 showed an increasing trend under the scenarios of SSP1-2.6 and SSP2-4.5 and a decreasing trend under the scenarios of SSP3-7.0 and SSP5-8.5.

3.2. Water Resource Changing Trend

3.2.1. VIC-3L Model Calibration and Validation

In this study, the periods of 2006, 2007–2010, and 2011–2014 were taken as the warm-up period, calibration period, and validation period of the model, respectively. The daily runoff of Gaoyao Station at the outlet hydrometric station of the Xijiang River basin was simulated. A total of seven parameters needed to be calibrated for the VIC-3L model, including, the variable infiltration curve parameter (Binf), Dsmax fraction, where the nonlinear baseflow originates (Ds), the maximum velocity of baseflow (Dsmax), the fraction of maximum soil moisture, where the nonlinear baseflow occurs (Ws), the thickness of the topsoil layer (D1), the thickness of the second soil layer (D2), and the thickness of the third soil layer (D3). Generally, D1 did not need to be calibrated, and it is taken as 0.1 m directly. The remaining six parameters need to be calibrated, and the calibration results of the VIC-3L parameters are shown in Table 2.
The calibration and validation statistics for daily-scale runoff simulation by VIC-3L are shown in Table 3. The model simulation effect was “very good” during calibration and validation periods at the daily time step since both of the NSE values were greater than 0.75. Additionally, values for the RSR of 0.46 and 0.53 during the calibration and validation periods indicated that the simulation effect was “very good” and “good”, respectively. The model simulation effect was “very good” during the calibration and validation periods, while both of the PBIAS values were less than 10%. Overall, the VIC-3L model had a good simulation effect during the calibration periods and validation periods, at daily time steps in the Xijiang River basin.

3.2.2. Annual Total Runoff Changing Trend

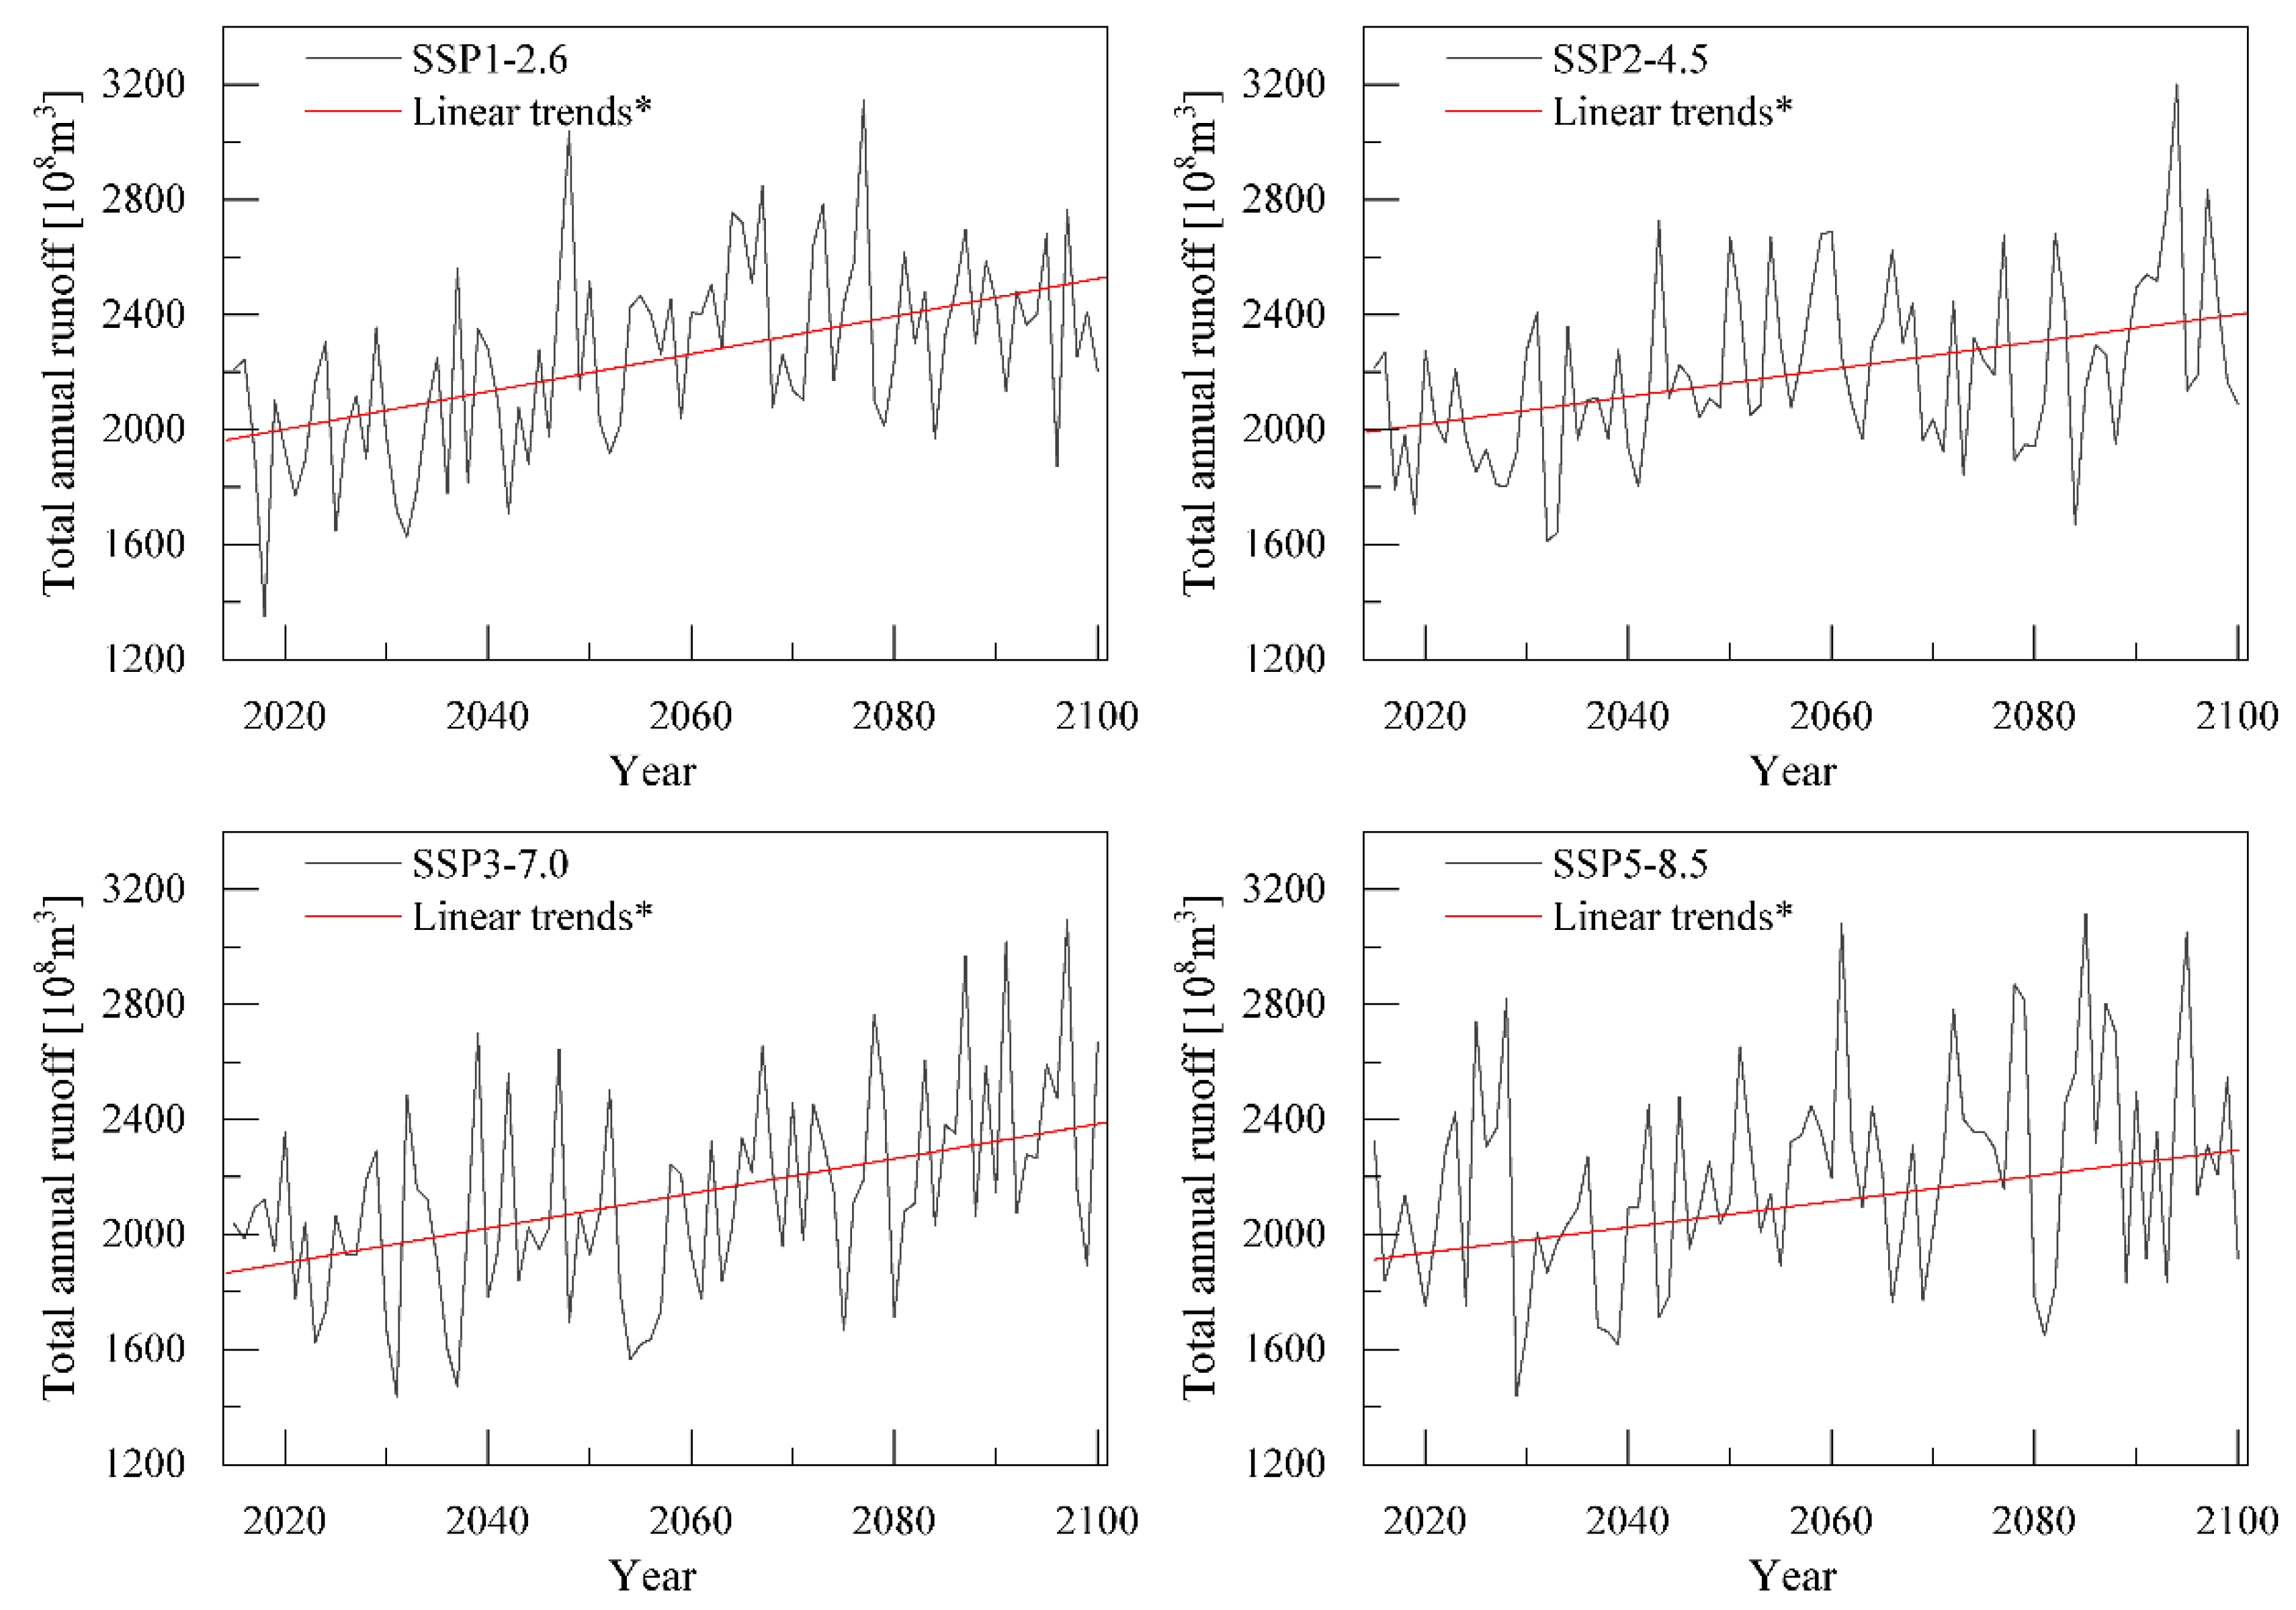
According to the meteorological data corrected by the delta statistical downscaling, the annual total runoff of the Xijiang River basin for 2015–2100, under the scenarios of SSP1-2.6, SSP2-4.5, SSP3-7.0, and SSP5-8.5, were obtained by using the VIC-3L model. Accordingly, the future annual runoff of the basin was determined by meteorological factors. From Figure 5, under the four scenarios, all of the annual total runoff of the Xijiang River basin for 2015–2100 showed a linear increasing trend and all passed the 95% confidence test. Daily precipitation, daily maximum temperature, and daily minimum temperature, all show increasing trends, except for daily wind speed. Thus, the change trends of the annual runoff in the four scenarios are consistent with those of the daily precipitation, daily maximum temperature, and daily minimum temperature.
The range of annual runoff under the scenarios of SSP1-2.6, SSP2-4.5, SSP3-7.0, and SSP5-8.5 were 1350.04 × 108 m3 to 3148.16 × 108 m3, 1614.16 × 108 m3 to 3202.38 × 108 m3, 1437.30 × 108 m3 to 3096.82 × 108 m3, 1440.75 × 108 m3 to 3114.54 × 108 m3, respectively. This shows that the variation range of a future annual runoff under each scenario is large. In addition, the average annual runoff for 2015–2100 was 2247.73 × 108 m3, 2199.60 × 108 m3, 2128.08 × 108 m3, and 2203.77 × 108 m3, respectively. This indicated that the future average annual runoff will decrease first and then increase with the rising of the radiation forcing level, although the change range was small for all four scenarios.

3.3. Land Use Changing Trend

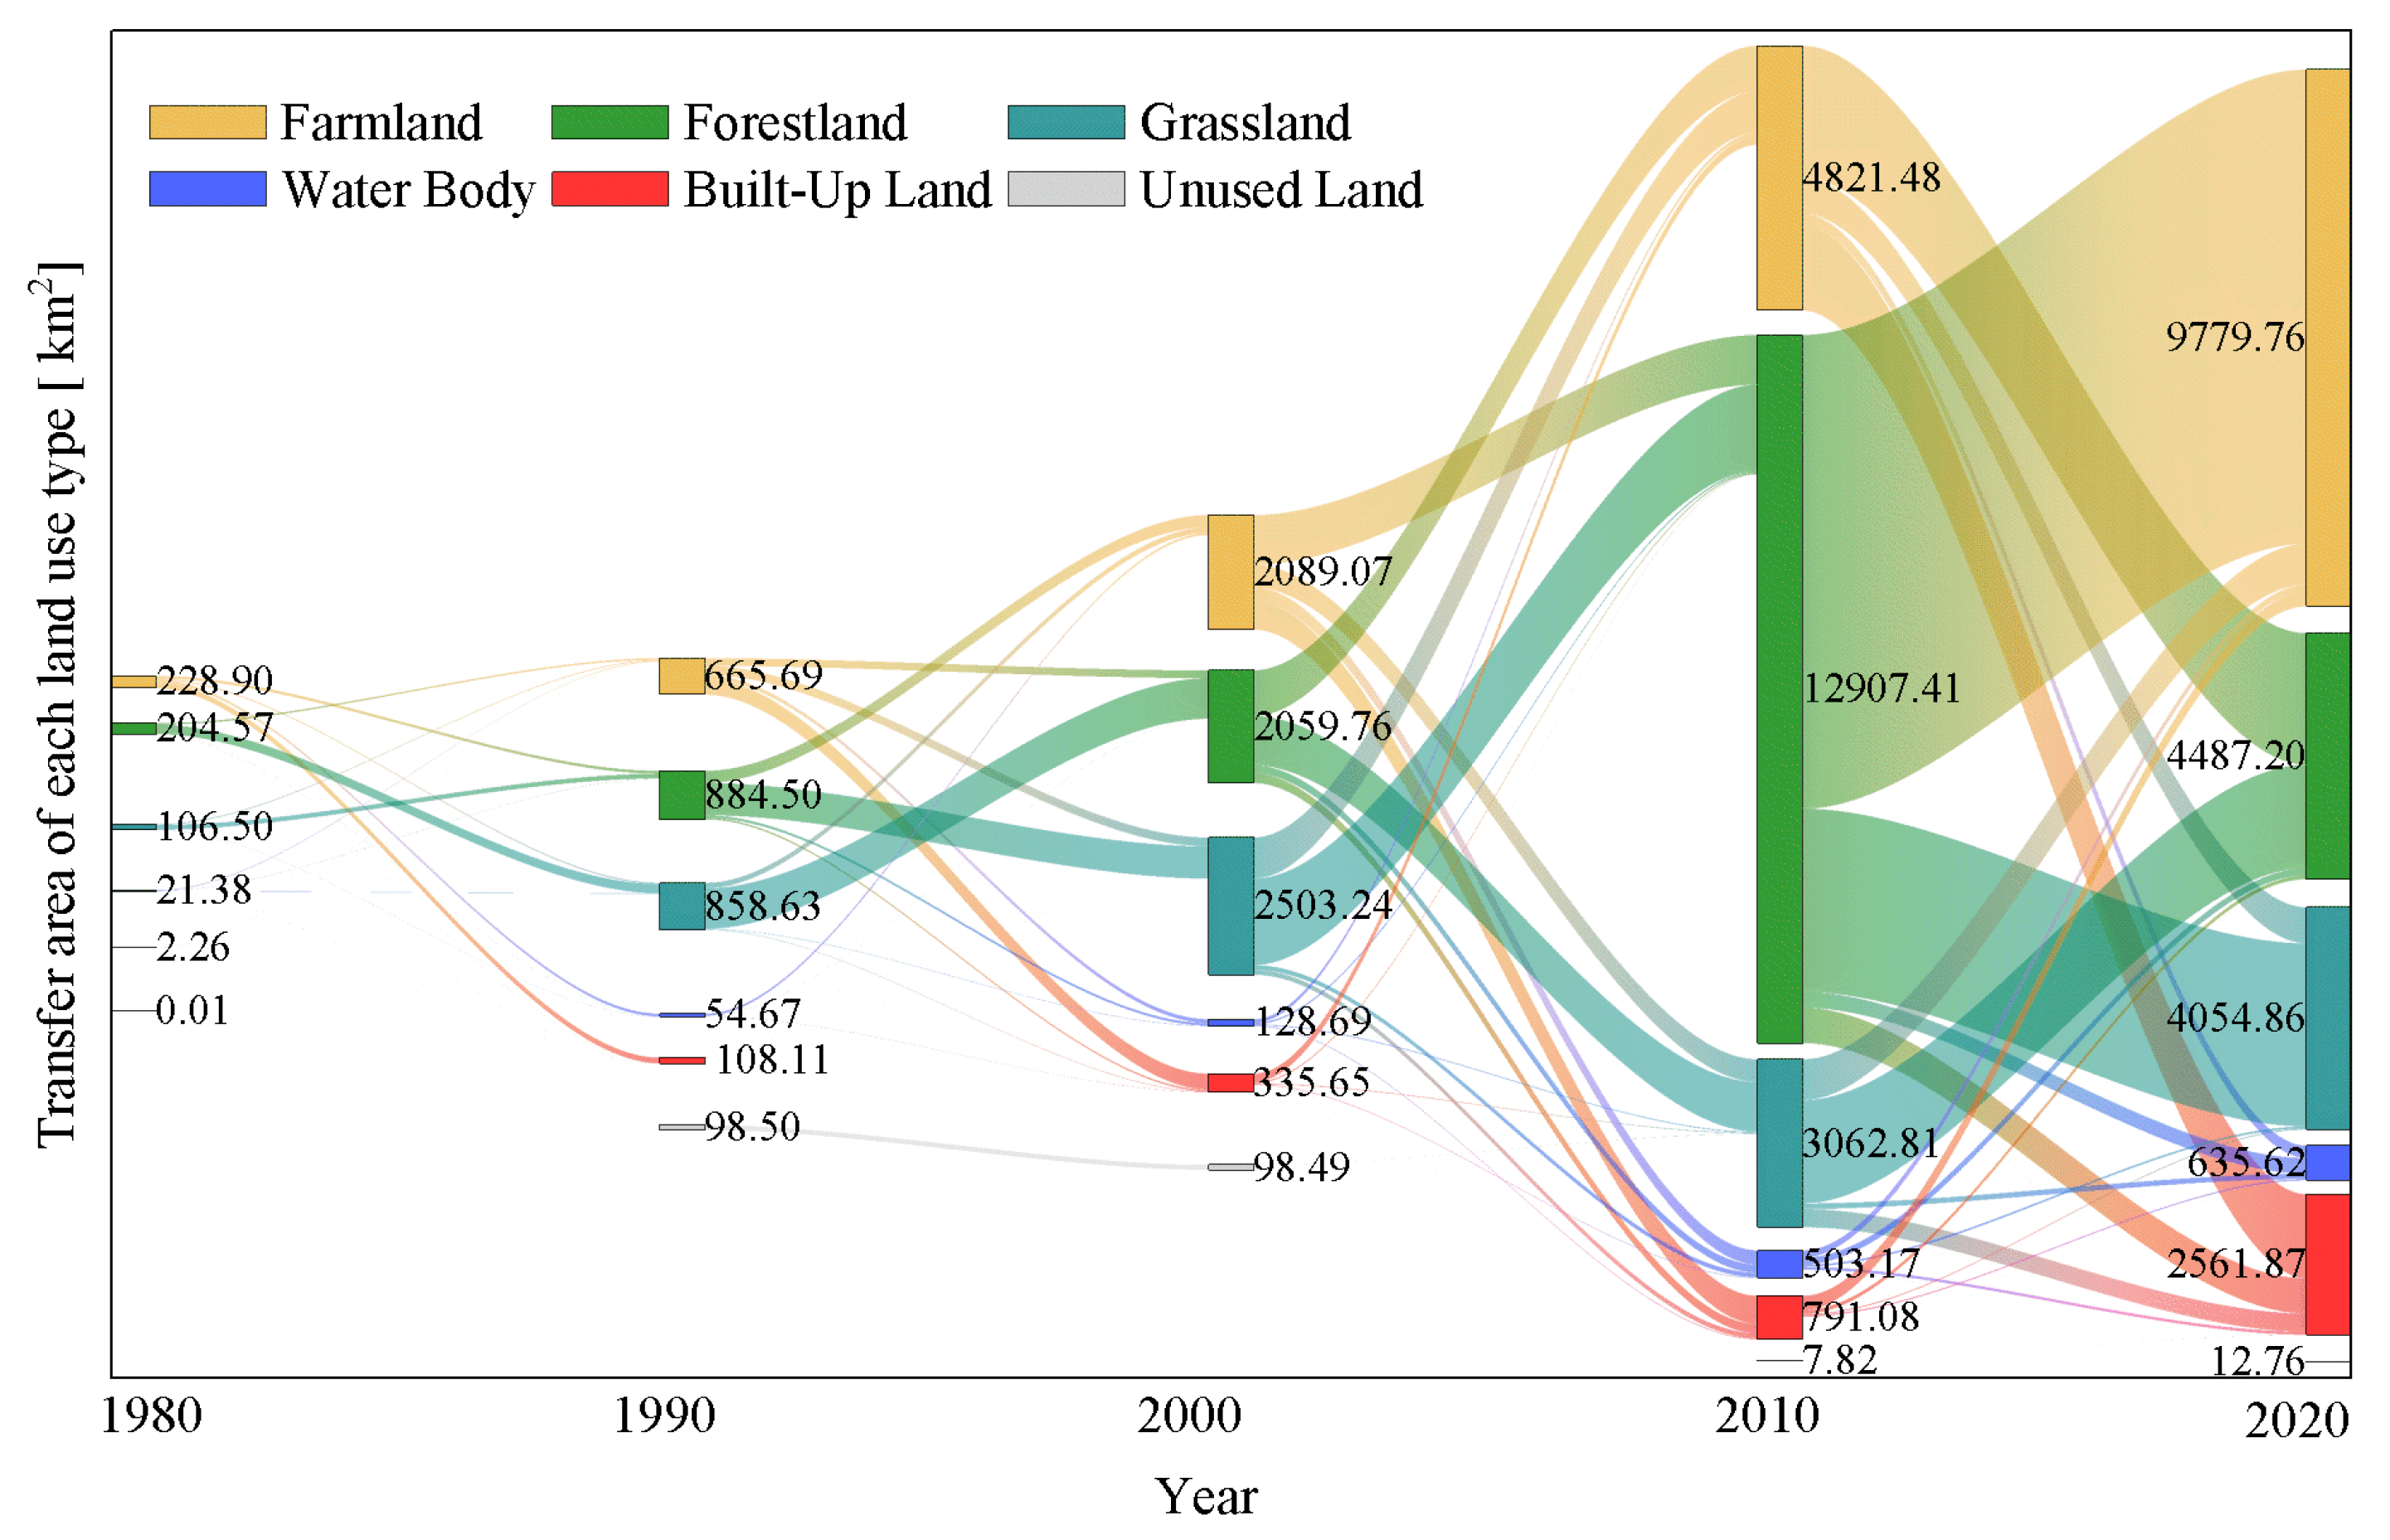
The result of the analysis of the land use area and its changes over the past 40 years from 1980 to 2020 in the Xijiang River Basin is shown in Table 4. The area of each land use type was constantly changing over the previous year. In all land use types, the area of forestland had changed the most, with a reduced area of 8025 km2, a total reduced rate of 3.81%, and an annual increase rate of 0.10%. In addition, the area of farmland had the second largest change, with an increased area of 4201 km2, a total increase rate of 5.65%, and an annual increase rate of 0.14%. In addition, the area of unused land had changed the least, by only 2 km2.
From Figure 6, the different land use types have been in the process of mutual transformation from 1980 to 2020 in the Xijiang River basin. During the past 40 years, the area of farmland transformed from the other five land types has increased. Furthermore, the increased farmland was mainly transformed from forestland and grassland, specifically, a large number of forestlands were transformed into farmland between 2010 and 2020. In addition, the areas of grassland, built-up land, and water body transformed from the other land types have also been increasing during the past 40 years, while the area of forestland, transformed from the other land types, initially increased before decreasing.

3.4. Matching Degree of Agricultural Water and Land Resources in the Xijiang River Basin

In this study, the area change rate of the farmland from 2021–2100 was assumed as being the same as that during 1980–2020. Then, the annual farmland area of the Xijiang River basin from 2021–2100 could be obtained from a simple linear regression model. The area of farmland will be 87951.59 km2 with an annual increase rate of 0.14% in 2100. Thus, according to the simulation results of water resources, the matching coefficient of agricultural water and land resources in the Xijiang River basin during 2021–2100, under the climate scenarios of SSP1-2.6, SSP2-4.5, SSP3-7.0, SSP5-8.5, has been calculated.
From Figure 7, the matching coefficient of agricultural water and land resources in the Xijiang River basin showed a linear increasing trend under the four scenarios from 2021 to 2100. The multi-year average matching coefficients of agricultural water and land resources were 1.63 × 10⁴ m3/hm2, 1.59 × 10⁴ m3/hm2, 1.54 × 10⁴ m3/hm2, and 1.60 × 10⁴ m3/hm2, respectively, indicating that the matching coefficient changed slightly with the rising of the radiation forcing level.
The minimum matching coefficient of agricultural water and land resources, in the past 40 years, was 1.20 × 10⁴ m3/hm2, which occurred in 1995. When using this as the minimum threshold for the matching coefficient, the agricultural water and land resources would be well matched under the two scenarios of SSP1-2.6 and SSP2-4.5 during 2021–2100, and there would be no risk of a mismatch. However, the matching degree of agricultural water and land resources under the SSP3-7.0 and SSP5-8.5 scenarios would not be well. Among them, the risk of mismatch would occur in the 2030–2040 and 2050–2060 periods, under the SSP3-7.0 scenario, while the risk of mismatch would occur in the 2030–2040 and 2080–2090 periods, under the SSP5-8.5 scenario.

4. Discussion

At present, the direct outputs of GCMs with systematic deviations, which are applicated to research, will cause large errors in the results. Therefore, deviation correction is required when using the outputs of GCMs [41]. There are many bias-corrected methods, such as the Statistical DownScaling Model, Artistic Neural Network model, and bias-corrected based on randomly moving points, etc. [42,43,44,45]. The accuracy of these bias-corrected methods has improved the outputs of GCMs. In this study, the delta statistical downscaling method was used to correct the outputs, and the daily outputs of each meteorological factor were verified after correcting for any bias. The results have shown that all the corrected outputs were improved. However, due to the strong randomness of meteorological factors on a daily scale, further studies will be needed to detail how to improve the bias-corrected accuracy of GCMs outputs.
The multi-year average annual runoff of the Xijiang River basin from 2015 to 2100 was 2103.77 × 108 m3 to 2247.73 × 108 m3, under the four scenarios of SSP1-2.6, SSP2-4.5, SSP3-7.0, and SSP5-8.5. According to the bulletin of Guangdong Xijiang River Basin Administration, the multi-year average annual runoff of Xijiang River Basin was 2215 × 108 m3, indicating that the annual runoff under the four scenarios in the future was generally consistent with those in the past. Previous research has shown that the increase in temperature and precipitation might promote an increase in runoff [46]. For rivers with precipitation as the main supply source, the response of runoff to precipitation is more obvious, while for rivers with glacial melt water as the main supply source, the response of runoff to temperature is more obvious [47]. In the four scenarios, the multi-year average annual runoff of the SSP3-7.0 was the minimum, and the multi-year average annual precipitation under this scenario was also the minimum, yet the multi-year average maximum and minimum temperatures were not the minimums. Meanwhile, the multi-year average annual runoff of the SSP1-2.6 was the maximum, and the multi-year average annual precipitation under this scenario was also the maximum, yet the multi-year average annual maximum and minimum temperatures were the minimums. Therefore, the runoff change was more consistent with the precipitation change than with the temperature and wind in the Xijiang River basin [48,49].
The land use type in the Xijiang River basin has been changing from 1980 to 2020, and the farmland area change has shown an increasing trend. A large number of forestlands have been transformed into farmland, especially from 2010 to 2020, which might be due to the implementation of the project of “returning forests to farmland” in China [50]. In the previous research on land use change simulation, the method of land use transfer probability matrix was used for the land use dynamic prediction model [51]. For the whole study area, the result of the dynamic prediction model of land use change is almost consistent with that of a linear regression model. The difference between the two methods is that the dynamic prediction model can simulate spatial distribution [52]. This study only evaluated the land use change of the whole basin, thus, a simple linear regression model used for assuming the future land use change seems rational.
The matching coefficient of agricultural water resources and land resources in the Xijiang River basin from 1980 to 2020 changed from 1.20 × 10⁴ m3/hm2 to 2.12 × 10⁴ m3/hm2. The matching coefficients were all at about 1.20 × 10⁴ m3/hm2 in 1995, 2002, and 2011. According to “China Meteorological Disaster Ceremony (Yunnan volume, Guangxi volume, Guizhou volume, and Comprehensive volume)” along with previous research [53,54], major droughts occurred, and damage to the crops happened in all the provinces in the study area during these years, while droughts in the other years were relatively light. Thus, 1.20 × 10⁴ m3/hm2 is used as the criterion of the matching coefficient in this area. In the case of the matching coefficient in the Xijiang River basin, it is lower than the future value of 1.20 × 10⁴ m3/hm2. Therefore, measures such as promoting the water-saving irrigation of farmland, adjusting the agricultural planting structure, and implementing water system connection projects will improve the structural water shortage caused by the mismatch of water and land resources. In addition, the matching coefficient of agricultural water and soil resources is affected by agricultural planting structures, farmland type, and the support of farmland water conservancy infrastructure, thus, there is no uniform optimal value at present. For some years in the Xijiang River basin, the matching coefficient of water and soil resources is higher than 1.65 × 10⁴ m3/hm2 (the matching coefficient from 1980 to 2020 is ranked from high to low, and the frequency of occurrence is calculated to be 25%), or even in the case of flooding, measures, such as the inter-basin water resource dispatching project, construction of reservoirs, and other water storage projects, can be implemented and a water quota for industry and domestic use can be moderately increased to improve the utilization rate of water resources.
The multi-year average matching coefficient of agricultural water and land resources in the Xijiang River basin was 1.54 × 10⁴ m3/hm2 to 1.63 × 10⁴ m3/hm2 under the future four scenarios. The matching degree in this study region was good compared with that in the northwest, northeast, and other regions of China [55]. Over the previous decades, a few studies have analyzed the agricultural water and land resources in the sub-basins of the Xijiang River basin, and the results showed that the matching degree of agricultural water and land resources in this region was also good [40,56]. In addition, this study has shown that there would be risks of a mismatch of agricultural water and land resources in the Xijiang River basin, in some years, under the scenarios of SSP3-7.0 and SSP5-8.5. Thus, the government department should do some work in planning the utilization of water and land resources [11], to achieve social–economic–ecological sustainable development in the Xijiang River basin. In changing environments, the government needs to strengthen the construction of a digital river basin in the Xijiang River basin and enhance its hydrological forecasting capacity. Moreover, the planning of farmland utilization in the basin should fully consider the carrying capacity of future water resources and continue to strengthen the construction of high-standard farmland water conservancy infrastructure and water-saving irrigation facilities, to improve agricultural disaster prevention capacity. Furthermore, although the matching coefficient in the basin is generally good, mismatches may occur in some intra-basin areas or in specific seasons. Therefore, it is necessary to study the spatial distribution of the matching pattern in the region in the future.

5. Conclusions

In this study, the water resource changing trends were obtained from 2015 to 2100 in the Xijiang River basin under four scenarios based on the bias-corrected climate factors of GCMs and the VIC-3L model. Meanwhile, the land use change was analyzed, and the matching degree between agricultural water and land resources was studied. The conclusions of this study are as follows:
Annual precipitation, annual average maximum temperature, and annual average minimum temperature in the Xijiang River basin from 2015 to 2100 have shown an increasing trend under SSP1-2.6, SSP2-4.5, SSP3-7.0, and SSP5-8.5. However, the annual average wind speed from 2015 to 2100 has shown an increasing trend under the scenarios of SSP1-2.6 and SSP2-4.5 and a decreasing trend under the scenarios of SSP3-7.0 and SSP5-8.5.
Under the four scenarios, the annual total runoff of the Xijiang River basin during 2015–2100 showed a linear increasing trend. The average annual runoffs during 2015–2100 were 2247.73 × 108 m3, 2199.60 × 108 m3, 2128.08 × 108 m3, 2203.77 × 108 m3, respectively.
The area of each land use type changed constantly between 1980 and 2020. The area of forestland changed the most, with a reduced area of 8025 km2. In addition, the area of farmland changed the second most, with an increased area of 4201 km2 and an annual increase rate of 0.14%, while it mainly transformed from forestland and grassland.
The matching coefficient of agricultural water and land resources in the Xijiang River basin will have an increasing trend under all four scenarios from 2021 to 2100. The multi-year average matching coefficients of agricultural water and land resources were 1.63 × 10⁴ m3/hm2, 1.59 × 10⁴ m3/hm2, 1.54 × 10⁴ m3/hm2, and 1.60 × 10⁴ m3/hm2, respectively. The agricultural water and land resources would be well matched under the scenarios of SSP1-2.6 and SSP2-4.5 during 2021–2100. However, the risk of mismatches would occur in the 2030–2040 period and the 2050–2060 period under the SSP3-7.0 scenario, while the risks of mismatches would occur during the 2030–2040 period and 2080–2090 period under the SSP5-8.5 scenario.

Author Contributions

Conceptualization, S.W. and L.W.; methodology, S.W.; software, S.W.; validation, L.W.; writing—original draft preparation, S.W.; writing—review and editing, L.W.; visualization, S.W.; project administration, S.W. and L.W.; funding acquisition, S.W. and L.W. All authors have read and agreed to the published version of the manuscript.

Funding

This work was funded by the Scientific Research Fund Project of the Yunnan Provincial Department of Education (Grant No. 2021J0128 & Grant No. 2021J0127), the Scientific Research Fund of Yunnan Agricultural University (Grant No. KY2019-32), and the Joint Special Project for Agriculture of Yunnan Province (Grant No. 202101BD070001-121).

Data Availability Statement

Not applicable.

Conflicts of Interest

The authors declare no conflict of interest.

References

  1. Yang, Y.; Zhang, W.; Feng, Z.; Liu, D. Land Use Change Induced Land and Water Resources Balance—A Case Study on the Xiliaohe Watershed. J. Nat. Resour. 2013, 28, 437–449. [Google Scholar]
  2. Cheng, K.; Fu, Q.; Chen, X.; Li, T.; Jiang, Q.; Ma, X.; Zhao, K. Adaptive Allocation Modeling for a Complex System of Regional Water and Land Resources Based on Information Entropy and Its Application. Water Resour. Manag. 2015, 29, 4977–4993. [Google Scholar] [CrossRef]
  3. Jiang, Q.; Fu, Q.; Wang, Z. Evaluation and Regional Differences of Water Resources Carrying Capacity in Sanjiang Plain. Trans. CSAE 2011, 27, 184–190. [Google Scholar]
  4. Uniyal, B.; Jha, M.K.; Verma, A.K. Assessing Climate Change Impact on Water Balance Components of a River Basin Using SWAT Model. Water Resour. Manag. 2015, 29, 4767–4785. [Google Scholar] [CrossRef]
  5. Shrestha, N.K.; Du, X.; Wang, J. Assessing Climate Change Impacts on Fresh Water Resources of the Athabasca River Basin, Canada. Sci. Total Environ. 2017, 601, 425–440. [Google Scholar] [CrossRef]
  6. Wang, S.; Ding, Y.; Ye, B.; Liao, J.; Xie, Z. A Land Use Analysis Based on the Influences of Climate Change and Human Activities—A Case Study in the Aksu River Basin Oasis. J. Glaciol. Geocryol. 2012, 34, 828–835. [Google Scholar]
  7. Jiang, C.; Xiong, L.; Wang, D.; Liu, P.; Guo, S.; Xu, C. Separating the Impacts of Climate Change and Human Activities on Runoff Using the Budyko-type Equations with Time-varying Parameters. J. Hydrol. 2015, 522, 326–338. [Google Scholar] [CrossRef]
  8. Gao, Y.; Qi, X.; Li, P.; Liang, Z.; Zhang, Y. Analysis on Spatial-temporal Matching Characteristics of Agricultural Water and Soil Resources in the Yellow River Basin. J. Irrig. Drain. 2021, 40, 113–118. [Google Scholar]
  9. Li, T.; Fu, Q.; Meng, F. Study on the Spatio-temporal Matching Patterns of Agricultural Water and Soil Resources in Heilongjiang Province. J. Northeast Agr. Univ. 2017, 48, 51–58. [Google Scholar]
  10. Xu, N.; Zhang, J.; Zhang, R.; Tian, F. Study on Matching Characteristics of Agricultural Water and Soil Resources Based on Dea-Take Gansu Province 5 Watersheds as an Example. China J. Agr. Resour. Reg. Plan. 2020, 41, 277–285. [Google Scholar]
  11. Zhang, Y.; Yan, Z.; Song, J.; Wei, A.; Sun, H.; Cheng, D. Analysis for Spatial-Temporal Matching Pattern Between Water and Land Resources in Central Asia. Hydrol. Res. 2020, 51, 994–1008. [Google Scholar] [CrossRef]
  12. Liu, D.; Liu, C.; Fu, Q.; Li, M.; Fu, Q.; Muhammad, A.; Muhammad, I.; Li, T.; Cui, S. Construction and application of a refined index for measuring the regional matching characteristics between water and land resources. Ecol. Indic. 2018, 91, 203–211. [Google Scholar] [CrossRef]
  13. Du, J.; Yang, Z.; Wang, H.; Yang, G.; Li, S. Spatial-Temporal Matching Characteristics between Agricultural Water and Land Resources in Ningxia, Northwest China. Water 2019, 11, 1460. [Google Scholar] [CrossRef] [Green Version]
  14. Geng, Q.; Liu, H.; He, X.; Tian, Z. Integrating Blue and Green Water to Identify Matching Characteristics of Agricultural Water and Land Resources in China. Water 2022, 14, 685. [Google Scholar] [CrossRef]
  15. Weng, Y.; Cai, W.; Wang, C. The Application and Future Directions of the Shared Socioeconomic Pathways (SSPs). Clim. Change Res. 2020, 16, 215–222. [Google Scholar]
  16. Sun, G.; Peng, F. Evaluation of Future Runoff Variations in the North–south Transect of Eastern China: Effects of Cmip5 Models Outputs Uncertainty. J. Water Clim. Change 2020, 11, 1355–1369. [Google Scholar] [CrossRef]
  17. Sun, J.; Yan, H.; Bao, Z.; Wang, G. Investigating Impacts of Climate Change on Runoff from the Qinhuai River by Using the SWAT Model and CMIP6 Scenarios. Water 2022, 14, 1778. [Google Scholar] [CrossRef]
  18. Zhao, J.; He, S.; Wang, H. Historical and Future Runoff Changes in the Yangtze River Basin from Cmip6 Models Constrained by a Weighting Strategy. Environ. Res. Lett. 2022, 17, 024015. [Google Scholar] [CrossRef]
  19. Hishe, S.; Bewket, W.; Nyssen, J.; Lyimo, J. Analysing Past Land Use Land Cover Change and Ca-markov-based Future Modelling in the Middle Suluh Valley, Northern Ethiopia. Geocarto Int. 2020, 35, 225–255. [Google Scholar] [CrossRef]
  20. Von Thaden, J.J.; Laborde, J.; Guevara, S.; Venegas-Barrera, C.S. Forest Cover Change in the Los Tuxtlas Biosphere Reserve and Its Future: The Contribution of the 1998 Protected Natural Area Decree. Land Use Policy 2018, 72, 443–450. [Google Scholar] [CrossRef]
  21. Tang, J.; Di, L. Past and Future Trajectories of Farmland Loss Due to Rapid Urbanization Using Landsat Imagery and the Markov-CA Model: A Case Study of Delhi, India. Remote Sens. 2019, 11, 180. [Google Scholar] [CrossRef] [Green Version]
  22. Vázquez-Quintero, G.; Solís-Moreno, R.; Pompa-García, M.; Villarreal-Guerrero, F.; Pinedo-Alvarez, C.; Pinedo-Alvarez, A. Detection and Projection of Forest Changes by Using the Markov Chain Model and Cellular Automata. Sustainability 2016, 8, 236. [Google Scholar] [CrossRef] [Green Version]
  23. Huang, Y.; Yang, B.; Wang, M.; Liu, B.; Yang, X. Analysis of the Future Land Cover Change in Beijing Using Ca-markov Chain Model. Geocarto Int. 2020, 79, 60. [Google Scholar] [CrossRef]
  24. Chen, L.; Liu, B. Hydro-meteorological Integrated Drought Evaluation of Xijiang River Basin. Water Resour. Power 2022, 40, 17–21. [Google Scholar]
  25. Zhang, Y.; Wu, T.; Song, C.; Hein, L.; Shi, F.; Han, M.; Ouyang, Z.Y. Influences of Climate Change and Land Use Change on the Interactions of Ecosystem Services in China’s Xijiang River Basin. Ecosyst. Ser. 2022, 58, 101489. [Google Scholar] [CrossRef]
  26. Touseef, M.; Chen, L.; Masud, T.; Khan, A.; Yang, K.; Shahzad, A.; Wajid Ijaz, M.; Wang, Y. Assessment of the Future Climate Change Projections on Streamflow Hydrology and Water Availability over Upper Xijiang River Basin, China. Appl. Sci. 2020, 10, 3671. [Google Scholar] [CrossRef]
  27. Liu, S.; Wang, J.; Wei, J.; Wang, H. Hydrological Simulation Evaluation with WRF-Hydro in a Large and Highly Complicated Watershed: The Xijiang River Basin. J. Hydrol. Reg. Stud. 2021, 38, 100943. [Google Scholar] [CrossRef]
  28. Lin, Q.; Wu, Z.; Liu, J.; Singh, V.P.; Zuo, Z. Hydrological Drought Dynamics and Its Teleconnections with Large-scale Climate Indices in the Xijiang River Basin, South China. Theor. Appl. Climatol. 2022, 150, 229–249. [Google Scholar] [CrossRef]
  29. Zhou, T.; Zou, L.; Chen, X. Commentary on the Coupled Model Intercomparison Project Phase 6 (CMIP6). Clim. Change Res. 2019, 15, 445–456. [Google Scholar]
  30. Zhang, L.; Chen, X.; Xin, X. Short Commentary on CMIP6 Scenario Model Intercomparison Project (ScenarioMIP). Clim. Change Res. 2019, 15, 519–525. [Google Scholar]
  31. Zhao, M.; Su, B.; Jiang, T.; Wang, A.; Tao, H. Simulation and Projection of Precipitation in the Upper Yellow River Basin by CMIP6 Multi-Model Ensemble. Plateau Meteorol. 2021, 40, 547–558. [Google Scholar]
  32. Hay, L.E.; Wilby, R.L.; Leavesley, G.H. A Comparison of Delta Change and Downscaled GCM Scenarios for Three Mountainous Basins in the United States. J. Am. Water Resour. Assoc. 2010, 36, 387–397. [Google Scholar] [CrossRef]
  33. Jian, S.; Wang, A.; Su, C.; Wang, K. Prediction of Future Spatial and Temporal Evolution Trends of Reference Evapotranspiration in the Yellow River Basin, China. Remote Sens. 2022, 14, 5674. [Google Scholar] [CrossRef]
  34. Hao, Z.; Li, L.; Xu, Y.; Ju, Q.; Yan, J.; Luo, J.; Wang, J.; Hao, J. Study on Delta-DCSID Downscaling Methond of GCM Outpu. J. Sichuan Univ. Eng. Sci 2009, 41, 1–7. [Google Scholar]
  35. Ray, R.L.; Jacobs, J.M.; Cosh, M.H. Landslide Susceptibility Mapping Using Downscaled Amsr-e Soil Moisture: A Case Study from Cleveland Corral, California, US. Remote Sens. Environ. 2010, 114, 2624–2636. [Google Scholar] [CrossRef]
  36. Jiang, S.; Ren, L.; Yong, B.; Fu, C.; Yang, X. Analyzing the Effects of Climate Variability and Human Activities on Runoff from the Laohahe Basin in Northern China. Hydrol. Res. 2012, 43, 3–13. [Google Scholar] [CrossRef]
  37. Dash, S.S.; Sahoo, B.; Raghuwanshi, N.S. How Reliable Are the Evapotranspiration Estimates by Soil and Water Assessment Tool (SWAT) and Variable Infiltration Capacity (VIC) Models for Catchment-scale Drought Assessment and Irrigation Planning? J. Hydrol. 2020, 592, 125838. [Google Scholar] [CrossRef]
  38. Liu, Y.; Gan, H.; Zhang, F. Analysis of the Matching Patterns of Land and Water Resources in Northeast China. Acta Geogr. Sin. 2006, 61, 847–854. [Google Scholar]
  39. Zhao, D.; Chen, X.; Han, Y.; Zhao, Y.; Men, X. Study on the Matching Method of Agricultural Water and Land Resources from the Perspective of Total Water Footprint. Water 2022, 14, 1120. [Google Scholar] [CrossRef]
  40. Wang, J.; Xin, L.; Dai, E. Spatio-temporal Variations of the Matching Patterns of Agricultural Land and Water Resources in Typical Mountainous Areas of China. Geogr. Res. 2020, 39, 1880–1890. [Google Scholar]
  41. Themessl, M.J.; Gobiet, A.; Leuprecht, A. Empirical-statistical Downscaling and Error Correction of Daily Precipitation from Regional Climate Models. Int. J. Climatol. 2011, 31, 1530–1544. [Google Scholar] [CrossRef]
  42. Zhang, Q.; Shen, Z.; Xu, C.; Sun, P.; Hu, P.; He, C. A New Statistical Downscaling Approach for Global Evaluation of the CMIP5 Precipitation Outputs: Model Development and Application. Sci. Total Environ. 2019, 690, 1048–1067. [Google Scholar] [CrossRef] [PubMed]
  43. Khan, M.S.; Coulibaly, P.; Dibike, Y. Uncertainty Analysis of Statistical Downscaling Methods. J. Hydrol. 2006, 319, 357–382. [Google Scholar] [CrossRef]
  44. Arfa, S.; Nasseri, M.; Tavakol-Davani, H. Comparing the Effects of Different Daily and Sub-Daily Downscaling Approaches on the Response of Urban Stormwater Collection Systems. Water Resour. Manag. 2021, 35, 505–533. [Google Scholar] [CrossRef]
  45. Karger, D.N.; Schmatz, D.R.; Dettling, G.; Zimmermann, N.E. High-resolution Monthly Precipitation and Temperature Time Series from 2006 to 2100. Sci. Data 2022, 9, 262. [Google Scholar] [CrossRef]
  46. Wang, S.; Jiao, X.; Wang, L.; Sang, H.; Salahou, M.K.; Maimaitiyiming, A. Assessing Climate Change Impacts on Water Resources of the Hotan Oasis Using SWAT Model, Northwest China. Fresen. Environ. Bull. 2019, 28, 1801–1810. [Google Scholar]
  47. Wang, X.; Liu, H.; Bao, A. A Simulation Analysis of the Impact of Climate Change on Runoff in the Manas River. J. Glaciol. Geocryol. 2012, 34, 1221–1228. [Google Scholar]
  48. Cao, C.; Sun, R.; Wu, Z.; Li, J. Responses of Streamflow to Climate Change in Upstream of Nandujiang River Basin on SWAT Model. Res. Soil Water Conserv. 2022, 29, 255–264. [Google Scholar]
  49. Jia, H.; Li, X.; Wen, J.; Chen, Y. Runoff Change Simulation and Future Trend Projection in the Source Area of the Yellow River. Resour. Sci. 2022, 44, 1292–1304. [Google Scholar] [CrossRef]
  50. Zhu, D. Quantitative Assessment of Impact of Land Use/Cover Change on Runoff Process in Xijiang River Basin Based on GEE. Water Resour. Power 2022, 40, 36–43. [Google Scholar]
  51. Durmusoglu, Z.O.; Tanriover, A.A. Modelling Land Use/Cover Change in Lake Mogan and Surroundings Using CA-Markov Chain Analysis. J. Environ. Biol. 2017, 38, 981–989. [Google Scholar] [CrossRef]
  52. Wang, S.; Jiao, X.; Wang, L.; Gong, A.; Sang, H.; Salahou, M.K.; Zhang, L. Integration of Boosted Regression Trees and Cellular Automata—Markov Model to Predict the Land Use Spatial Pattern in Hotan Oasis. Sustainability 2020, 12, 1396. [Google Scholar] [CrossRef] [Green Version]
  53. Zhou, R. Study on the Drought and Flood Disasters Formation Mechanism in Karst Area of Southwest China. Master’s Thesis, Guilin University of Technology, Guilin, China, 2014. [Google Scholar]
  54. Wu, Z.; Lin, Q. Analysis on spatial and temporal characteristics of hydrological drought in Xijiang River Basin. Water Resour. Prot. 2016, 32, 51–56. [Google Scholar]
  55. Li, X.; Hao, J.; Chen, A. Time-space Matching Pattern and Evaluation of Agricultural Water and Soil Resources in Shandong Province. J. China Agr. Univ. 2020, 25, 1–11. [Google Scholar]
  56. Wang, L.; Cui, W.; Liu, S.; Mu, H.; Lu, X. Spatial Temporal Matching Pattern of Agricultural Water and Land Resources in Guizhou Province. Water Resour. Power 2021, 39, 33–36. [Google Scholar]
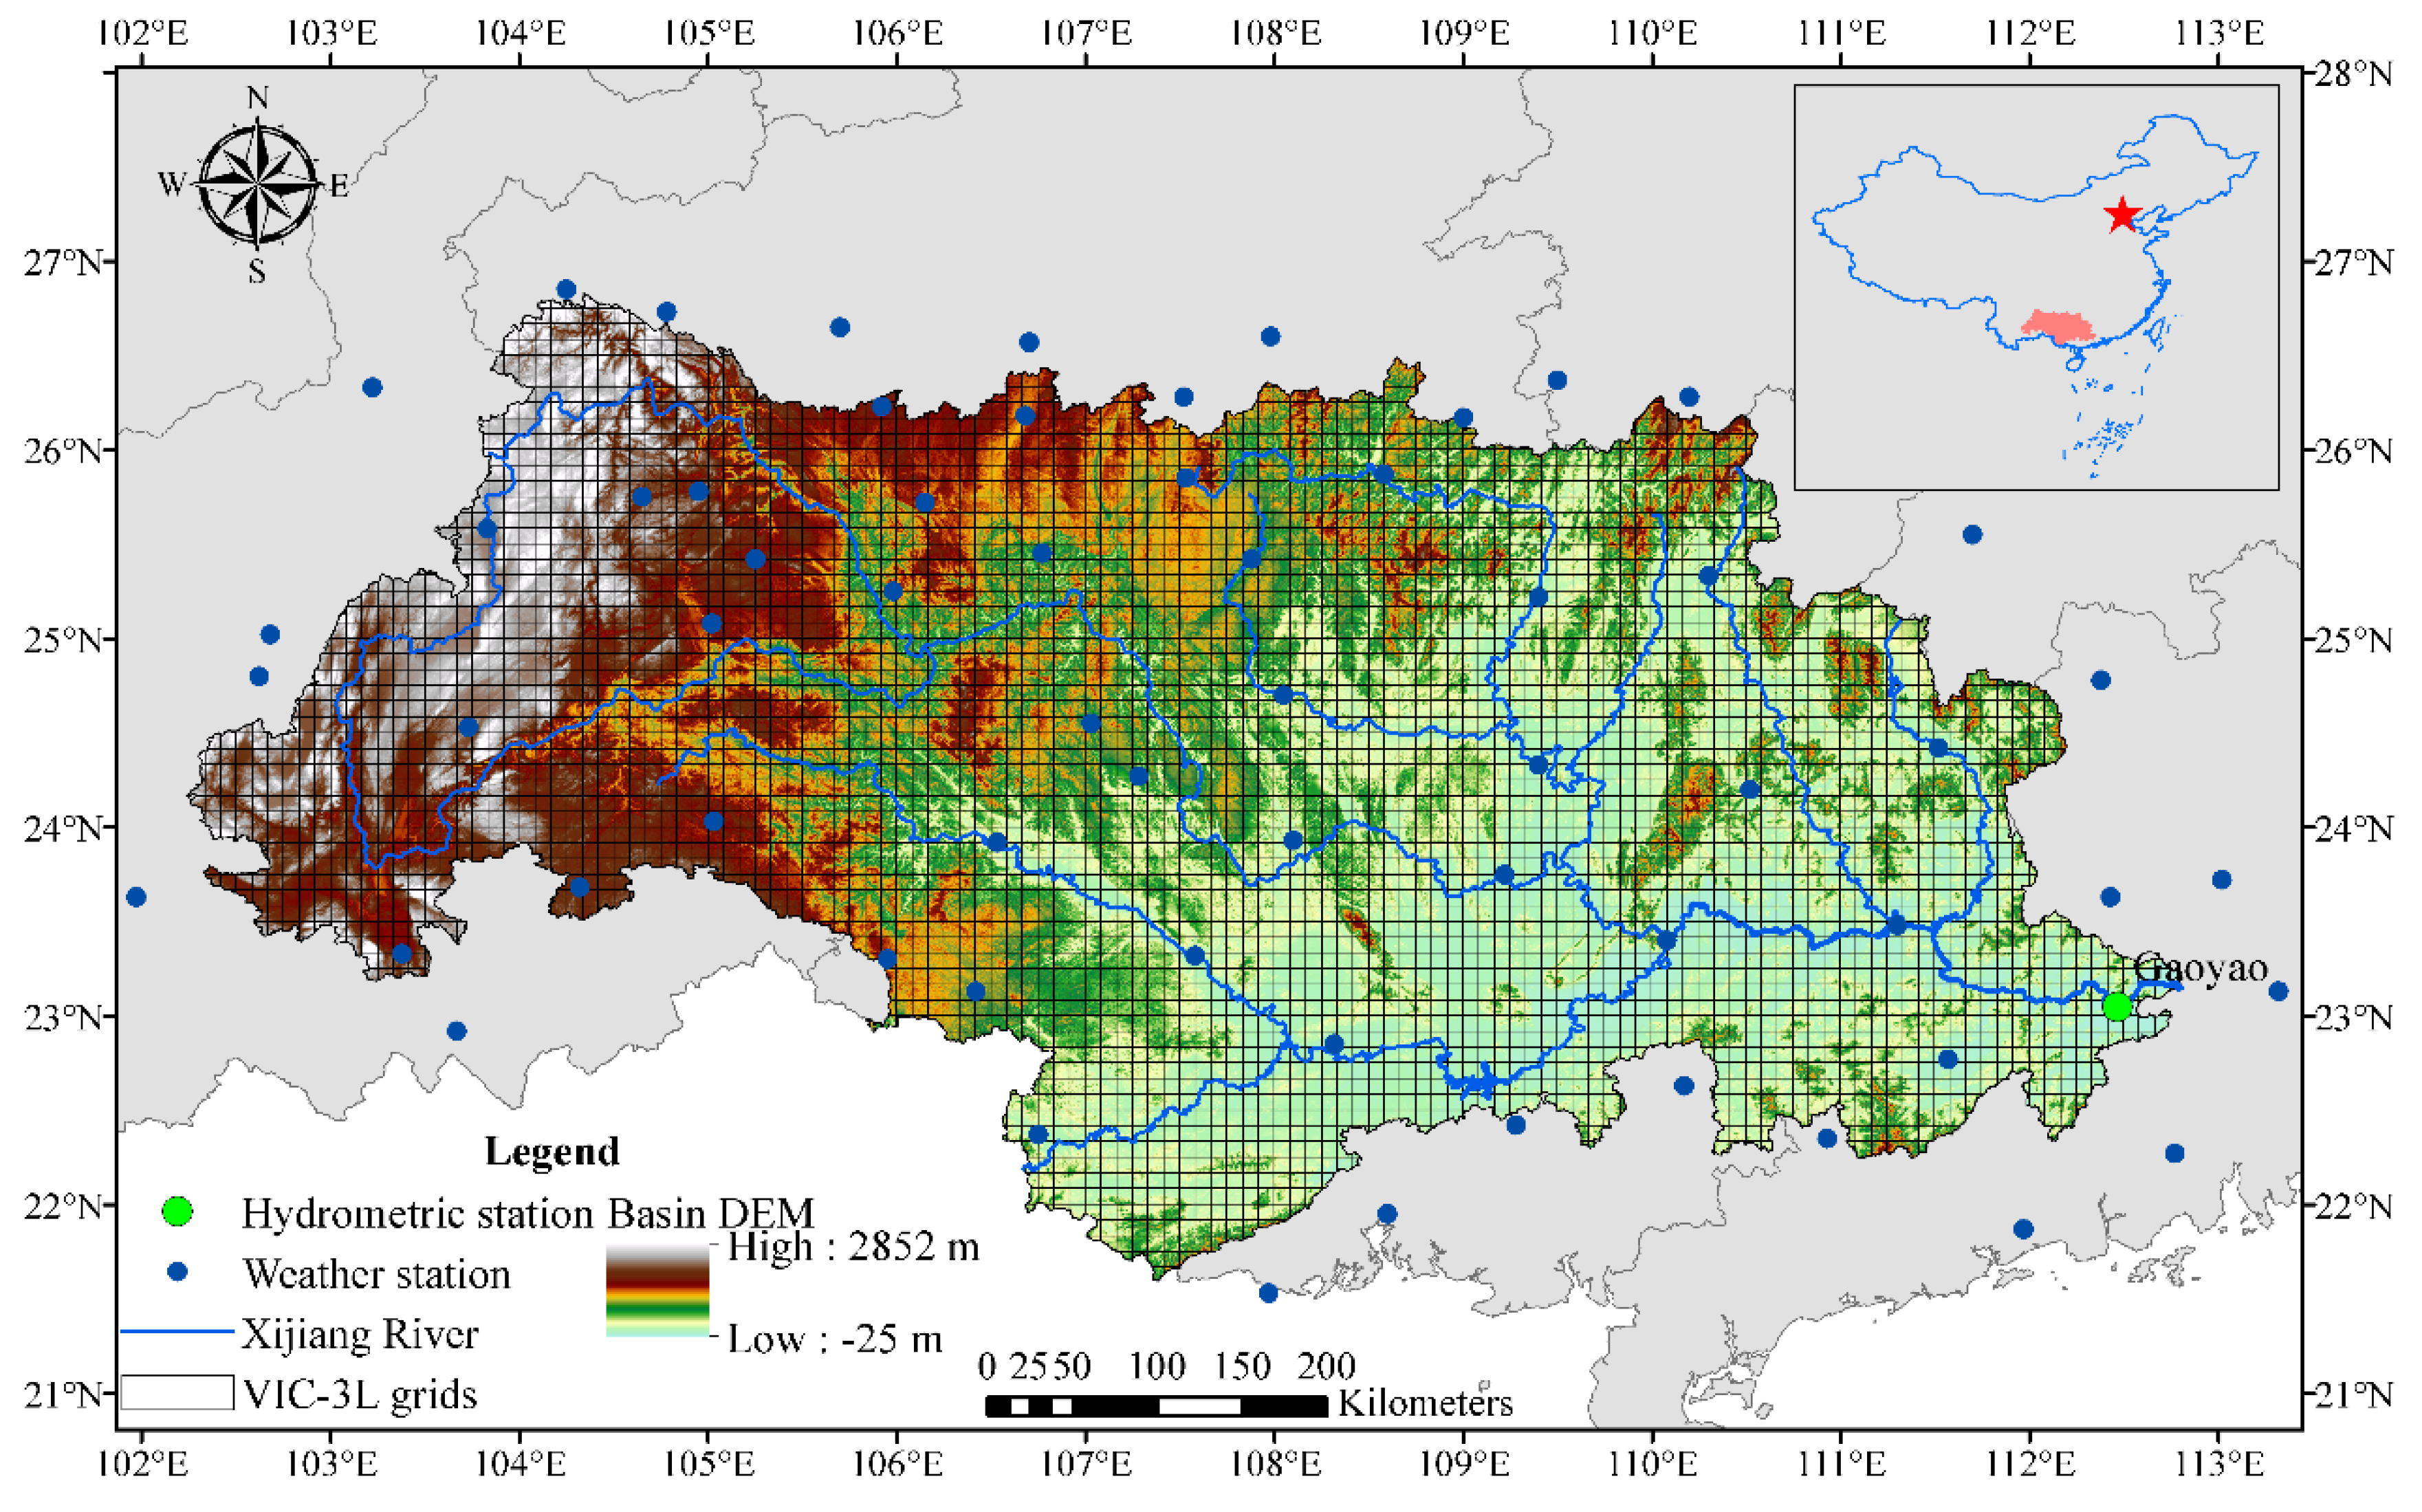
Figure 1. Location of the Xijiang River basin.
Water 15 00827 g001
Figure 2. Taylor chart of daily simulated and observed values of different climate models from 1961 to 2014. Note: “_c” means corrected values in the GCM models.
Water 15 00827 g002
Figure 3. Variation of multi-year average daily observations and multi-model simulations in the Xijiang River basin from 1961 to 2014. Note: shadows represent the simulation uncertainty in the model.
Water 15 00827 g003
Figure 4. Temporal variation of annual precipitation, annual average maximum temperature, annual average minimum temperature, and annual average wind speed in the Xijiang River basin under different climate scenarios, 2015–2100. Note: shadows represent the values range of the five climate models, the equation denotes the linear trend of each emission scenario, and P is an indicator of significance obtained by the F-test.
Water 15 00827 g004
Figure 5. Temporal variation of total annual runoff for the Xijiang River basin from 2015 to 2100 under different climate scenarios. Note: “*” means that the linear trend test at the α = 0.05 level of significance was passed.
Water 15 00827 g005
Figure 6. Transfer area of each land use type in the Xijiang River basin from 1980 to 2010.
Water 15 00827 g006
Figure 7. Temporal variation of matching coefficient in the Xijiang River basin from 1980 to 2100 under different climate scenarios. Note: “*” means that the linear trend test at the α = 0.05 level of significance was passed.
Water 15 00827 g007
Table 1. The global climate model’s information.
IndexModelSpatial ResolutionResearch Institution, Country
1BCC-CSM2-MR1.125° × 1.125°BBC, China
2CanESM52.8° × 2.8°CCCMA, Canada
3ACCESS-CM21.25° × 1.875°CSIRO-ARCCSS, Australia
4MRI-ESM2-01.125° × 1.125°MRI, Japan
5IPSL-CM6A-LR1.27° × 2.5°IPSL, France
Table 2. Sensitivity ranking and corresponding fitted values of the VIC-3L calibration parameters for daily-scale streamflow simulation.
ParameterDescriptionUnitValue RangeFitting
Value
BinfVariable infiltration curve parameter1[0, 1]0.35
DSDsmax fraction where nonlinear baseflow originates1[0, 1]0.17
DsmaxMaximum velocity of baseflowmm/d[0, 40]18
WsFraction of maximum soil moisture where nonlinear baseflow occurs1[0, 1]0.9
D1Thickness of top (first) soil layerm-0.1
D2Thickness of second soil layer m[0, 1]0.4
D3Thickness of third soil layer m[1, 2]0.7
Table 3. Calibration and validation statistics for daily-scale runoff simulation by VIC-3L.
PeriodIndexGaoyao
Calibration (2007–2010)NSE0.80
RSR0.46
PBIAS6.79%
Validation (2011–2013)NSE0.76
RSR0.53
PBIAS7.88%
Table 4. Land use type areas during 1980–2020 (km2).
Land Classification19801990200020102020Change of 1980 to 2020
Farmland74,36074,19373,89273,60578,5614201
Forestland210,470210,404210,401210,880202,444−8025
Grassland48,61948,70948,60247,45948,446−173
Water Body38133846392543004582769
Built-Up Land422943354669525674373208
Unused Land9998989297−2
Disclaimer/Publisher’s Note: The statements, opinions and data contained in all publications are solely those of the individual author(s) and contributor(s) and not of MDPI and/or the editor(s). MDPI and/or the editor(s) disclaim responsibility for any injury to people or property resulting from any ideas, methods, instructions or products referred to in the content.