1. Introduction
In recent years, human activities have affected many environmental problems around the world, such as sinkholes [
1], land subsidence [
2], and disequilibrium of water balance [
3]. Typically, in urban areas, the aboveground space is becoming increasingly crowded because of the development of the building industry [
4,
5,
6,
7,
8,
9]. The creation of underground space, such as the building of subways and tunnels, has emerged as a key strategy for reducing urban traffic congestion [
10,
11,
12,
13,
14,
15,
16]. As a result, many large excavations have appeared in urban areas, and the environmental deformation caused by dewatering and excavation has been a widespread concern [
17,
18,
19,
20,
21,
22]. Typically, three main causes account for environment deformation. First, dewatering before and during excavation causes groundwater seepage and soil consolidation, which leads to stratum settlement adjacent to the pit [
2,
23,
24,
25,
26,
27,
28,
29,
30]. Second, the unloading effect of excavation leads to soil rebound at the pit’s bottom followed by the uplift of the pit bottom [
31,
32]. Third, excavation changes the soil’s stress state on both sides of the excavation, and the original balance of soil pressure and pile–soil friction resistance of the enclosure structure is broken [
33,
34,
35]. Only after displacement can the supporting structure achieve a new balance, and the deflection of the supporting structure causes the soil around the enclosure structure to move [
36].
However, because of the blocking effect of the pre-existing underground building, the deformation induced by the dewatering and excavation differs from the deformations induced without an underground structure outside the excavation [
37,
38,
39]. Liao, Wei and Shen [
40] discovered that when there is an underground structure adjacent to the pit, the deformation transfer of the strata caused by excavation is interrupted, changing the soil displacement field. Through numerical simulation, Zeng, Liao, Xue, Long, Luo, Diao and Li [
39] discovered that adjacent underground buildings can block the development of stratum movement, and that the nearer the underground structure is to the foundation pit, the more apparent the barrier effect is. In addition to the barrier effect on strata movement, pre-existing underground buildings can also block the groundwater flow, causing the groundwater level distribution outside an excavation induced by dewatering to differ from distributions without an underground structure [
41]. Through laboratory testing and numerical simulation, Xu, Shen, Ma, Sun and Yin [
41] discovered that underground structures could change the seepage condition of groundwater, and aggravated the water level drop and ground settlement.
According to the findings of the previous research, adjacent underground structures have a blocking effect on the movement of the stratum and groundwater. However, there are currently still few studies on the effects of groundwater and stratum under the combined action of the dewatering and excavation under the blocking effect of adjacent underground structures. The purpose of this paper is to show how the barrier effect of adjacent underground structures affects groundwater flow and ground deformation caused by dewatering and excavation. This study, in particular, set a pre-existing pile foundation outside an excavation and created a series of two-dimensional numerical models to simulate dewatering and excavation with and without a pile foundation outside. The distance between the pile foundation and the excavation and the buried depth of the pile foundation were chosen as the main variables in the model. The results could provide a reference for engineers to evaluate groundwater drawdown and stratum deformation induced by dewatering and excavation in similar engineering environments.
2. Numerical Simulation
2.1. Engineering Background
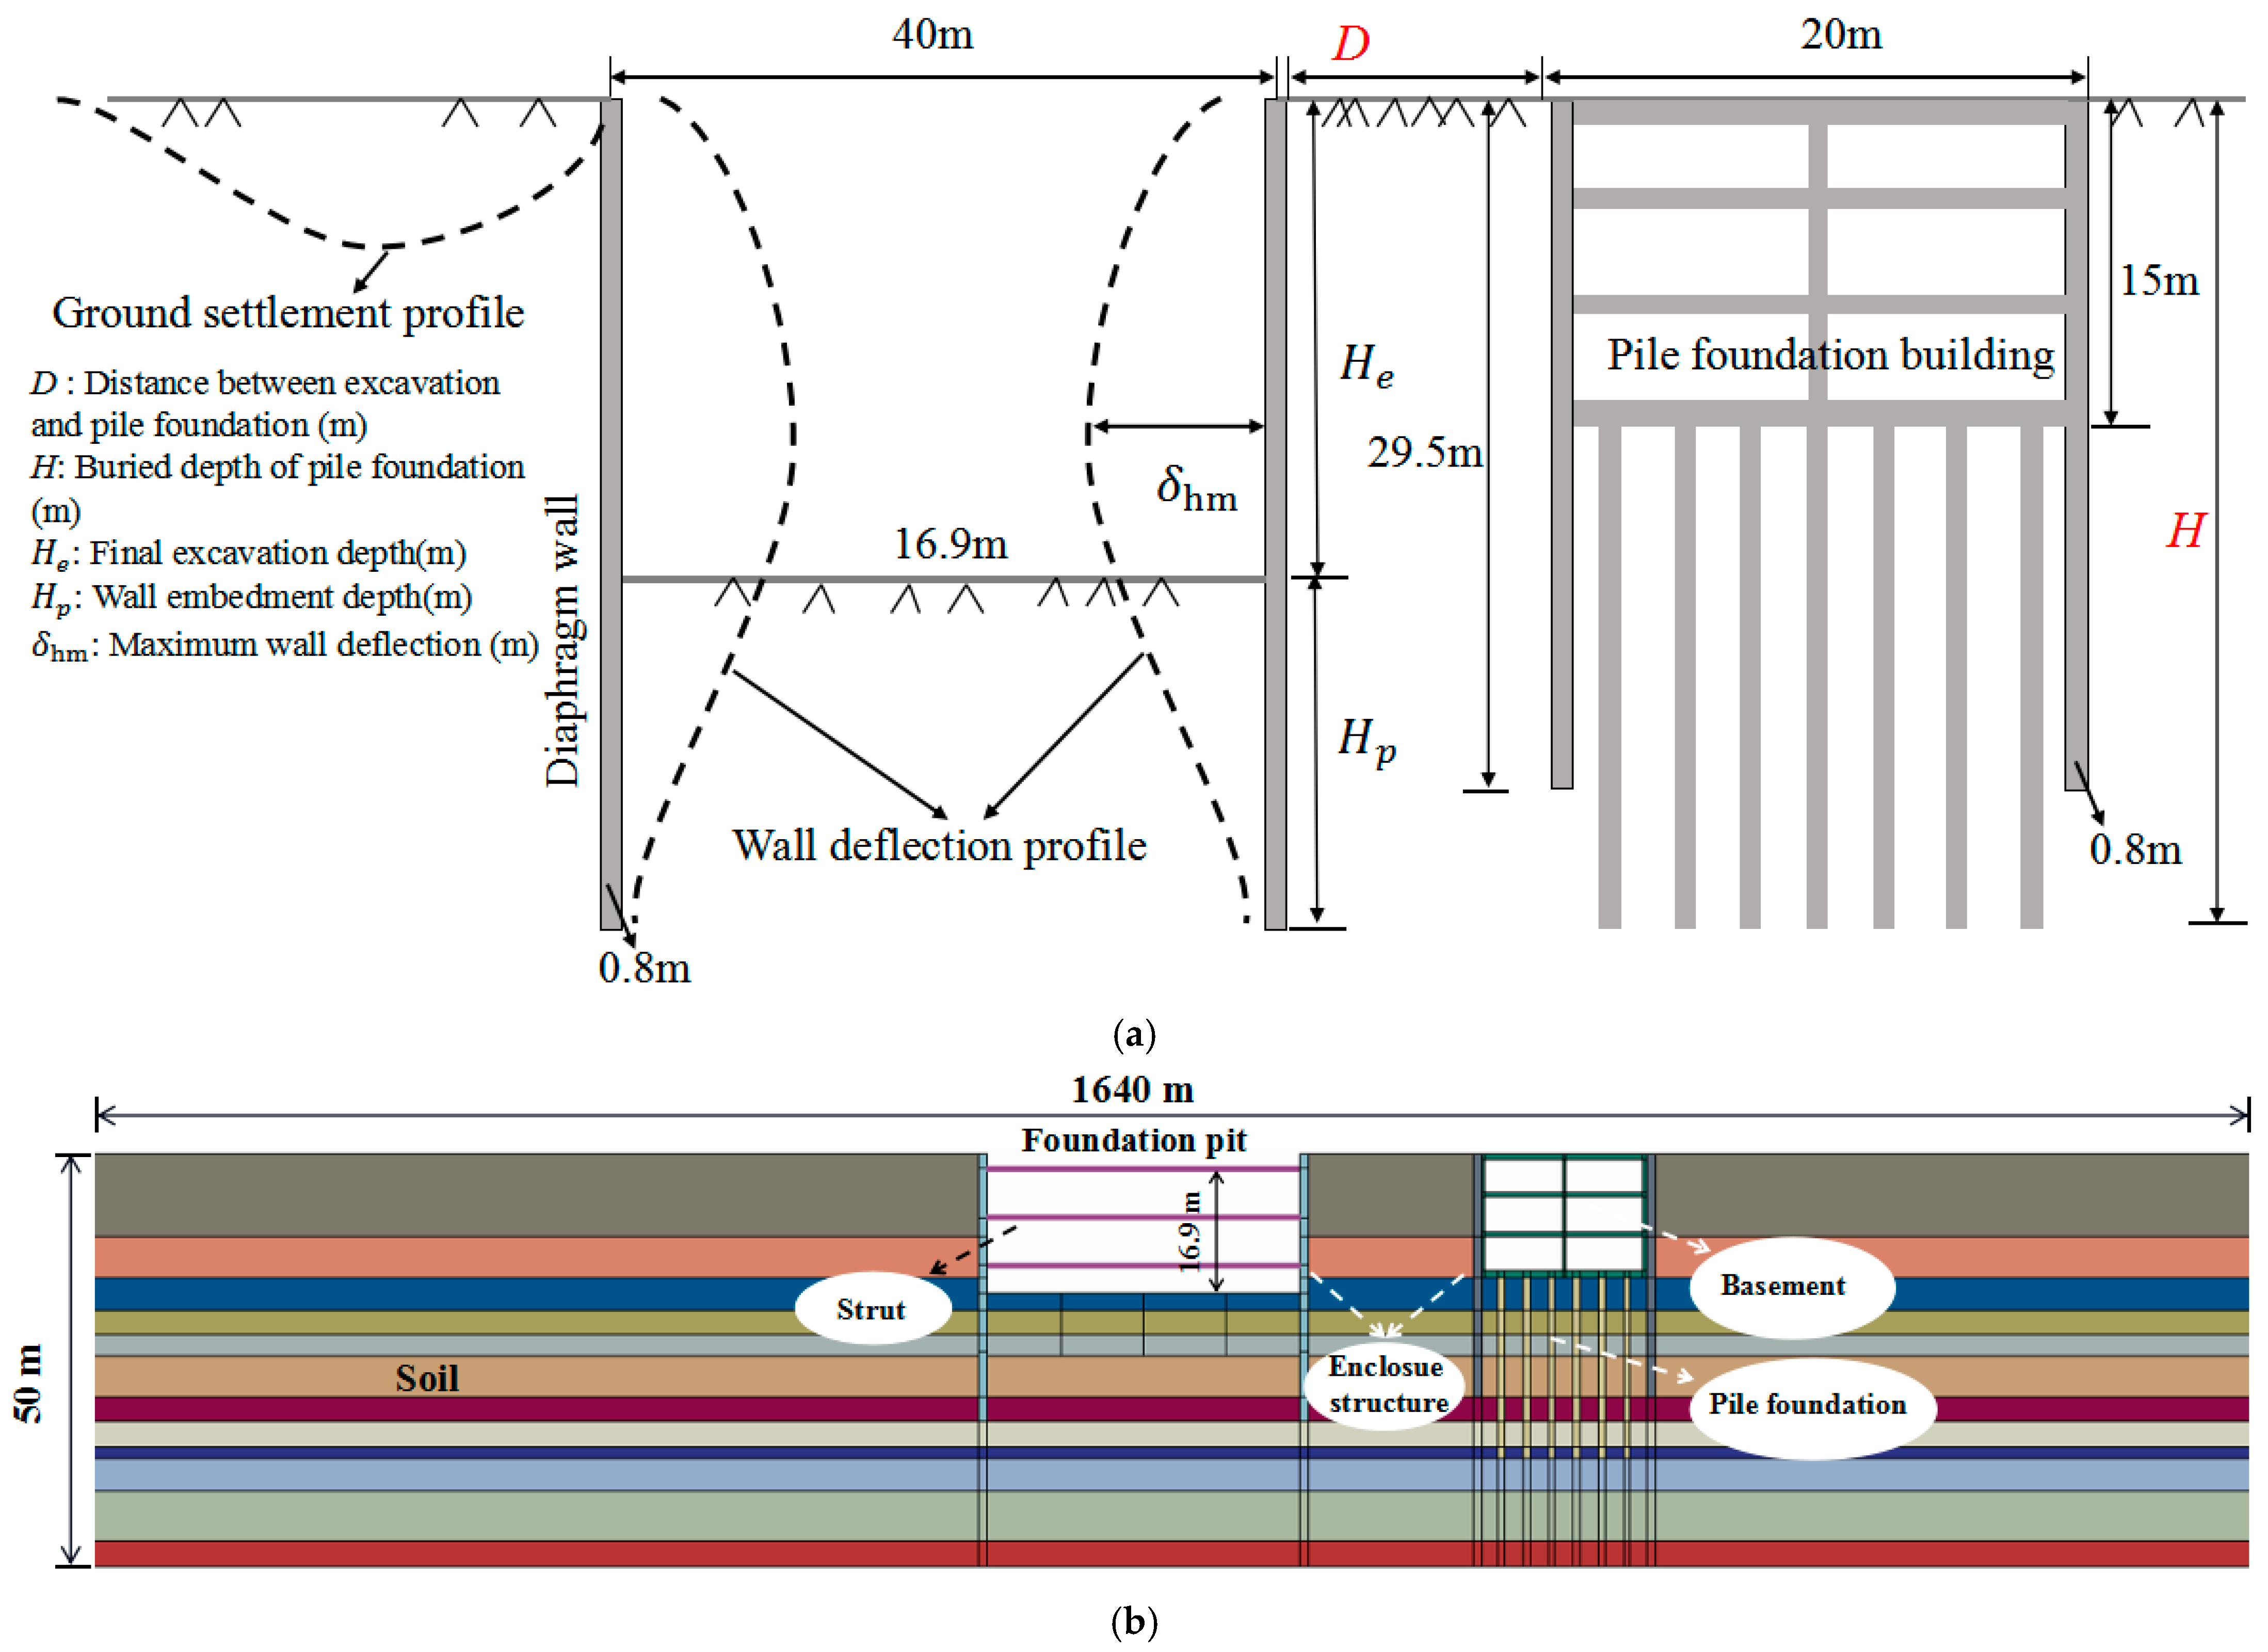
An excavation for a Tianjin subway station, which was roughly 155 m long, 40 m wide and 16.9 m deep, was selected as the engineering background [
6]. The depth of the diaphragm was 32.5 m and the thickness of the wall was 0.8 m. The foundation soil mainly consisted of silty clays and silts. Generally, the site included five aquifers and four alternating aquitards. There were two layers of silty clay (phreatic layer and aquitard) more than 15 m below the ground, followed by a layer of silt (the first aquifer), at a depth of 15 m–19 m below the ground. The next layer was silty clay (aquitard), at a depth of 19 m–22 m below the ground. Under this layer, the second aquifer existed which consisted of silt, silty clay and silty sand at a depth of 22 m–35.5 m below the ground, followed by a layer of silty clay at a depth of 35 m–37 m below the ground (aquitard). The next layer was silt at a depth of 37 m–41 m below the ground (the third aquifer), followed by a layer of silty clay (aquitard) at a depth of 41 m–47 m below the ground. The last layer was silty sand (the fourth aquifer) at a depth of 47 m–50 m.
Table 1 displays the introduction of the soil layer and typical parameters, which were obtained from laboratory tests. The introduction of the excavation can be seen in the work of Zeng, Liao, Xue, Long, Luo, Diao and Li [
39], who studied the blocking effect of pre-existing underground buildings on the ground response due to dewatering before soil excavation. In this paper, a fluid–solid coupling numerical model was used to further investigate the barrier effect of existing pile foundations during the combined actions of dewatering and soil excavation.
2.2. Model Establishment
Two types of numerical model were established. The model had a thickness of 50 m, which was divided into 12 layers based on the engineering background. It can be seen from
Figure 1 that the first model included a 40 m wide foundation pit and a pile foundation. The pit’s excavation depth was set to 16.9 m. The construction process included four stages, each with an excavation depth of 1.8 m, 6 m, 5.8 m and 3.3 m. According to the Sichardt formula [
39], the model boundary was 800 m after the retaining structure when taking the influence radius of dewatering into account (assuming the water level drawdown was 35.5 m under an extreme pumping condition).
D represents the distance between the foundation pit and the pile foundation building, and
H represents its buried depth. The enclosure structure of the pile foundation was also modeled with a depth of 29.5 m and a width of 0.8 m. The pile radius was set to 0.85 m, and its spacing was set to 3.05 m according to a typical excavation layout. The height and width of the basement above the pile were set to 15 m and 20 m, respectively. The bottom slab and roof were both 0.8 m thick, and the other plates were set to 0.4 m. The mass density of the pile foundation was 2.5 g/cm
3, and the Poisson’s ratio was 0.2. The pile’s equivalent permeability coefficient was set to 0.412 m/d according to the results of Yuan, Xu, Shen and Wang [
42]. The second model had no pile foundation outside the pit (i.e., the case with
D = ∞ and
H = 0), and the other parameters were consistent with the first model.
Because the soil layer in the actual project contained groundwater, the water level inside the pit must be lowered below the excavation surface. As a result, a dewatering simulation must be performed before the excavation to ensure that the simulation process was consistent with the actual project; the dewatering depth was set to 19 m. An elastic model was set for the dewatering well, foundation pit and pile foundation. The dewatering well’s elastic modulus was set to 2.1 × 10
8 kPa, while the elastic modulus of the excavation and the underground structure was set to 3 × 10
7 kPa [
39]. The soil mass was represented in the model by the C3D8P element, the diaphragm wall by the C3D8I element and the dewatering well by the S4 shell element. The soil behavior was simulated by the Mohr–Coulomb model according to Zeng, Liao, Xue, Long, Luo, Diao and Li [
39]. The key parameters of the model can be seen in
Table 2. According to the literature [
39], the friction coefficient was set to 0.3, which obeyed the Coulomb friction law.
A total of 16 models were developed in this study (one model without a pile foundation, and 15 models with a pile foundation outside the pit).
Table 3 displays the model calculation conditions in this study.
D = ∞ and
H = 0 represent that there are no underground structures outside the pit.
An invariable head boundary was used for the lateral surfaces of the model with the fixed head at the model surface. The model’s bottom was set to be impermeable. Both the lateral and bottom boundaries were not allowed to move. The pumping process was simulated by setting a zero-head hydraulic boundary on the soil–well interface within a specified depth (19 m in this study).
2.3. Model Validation
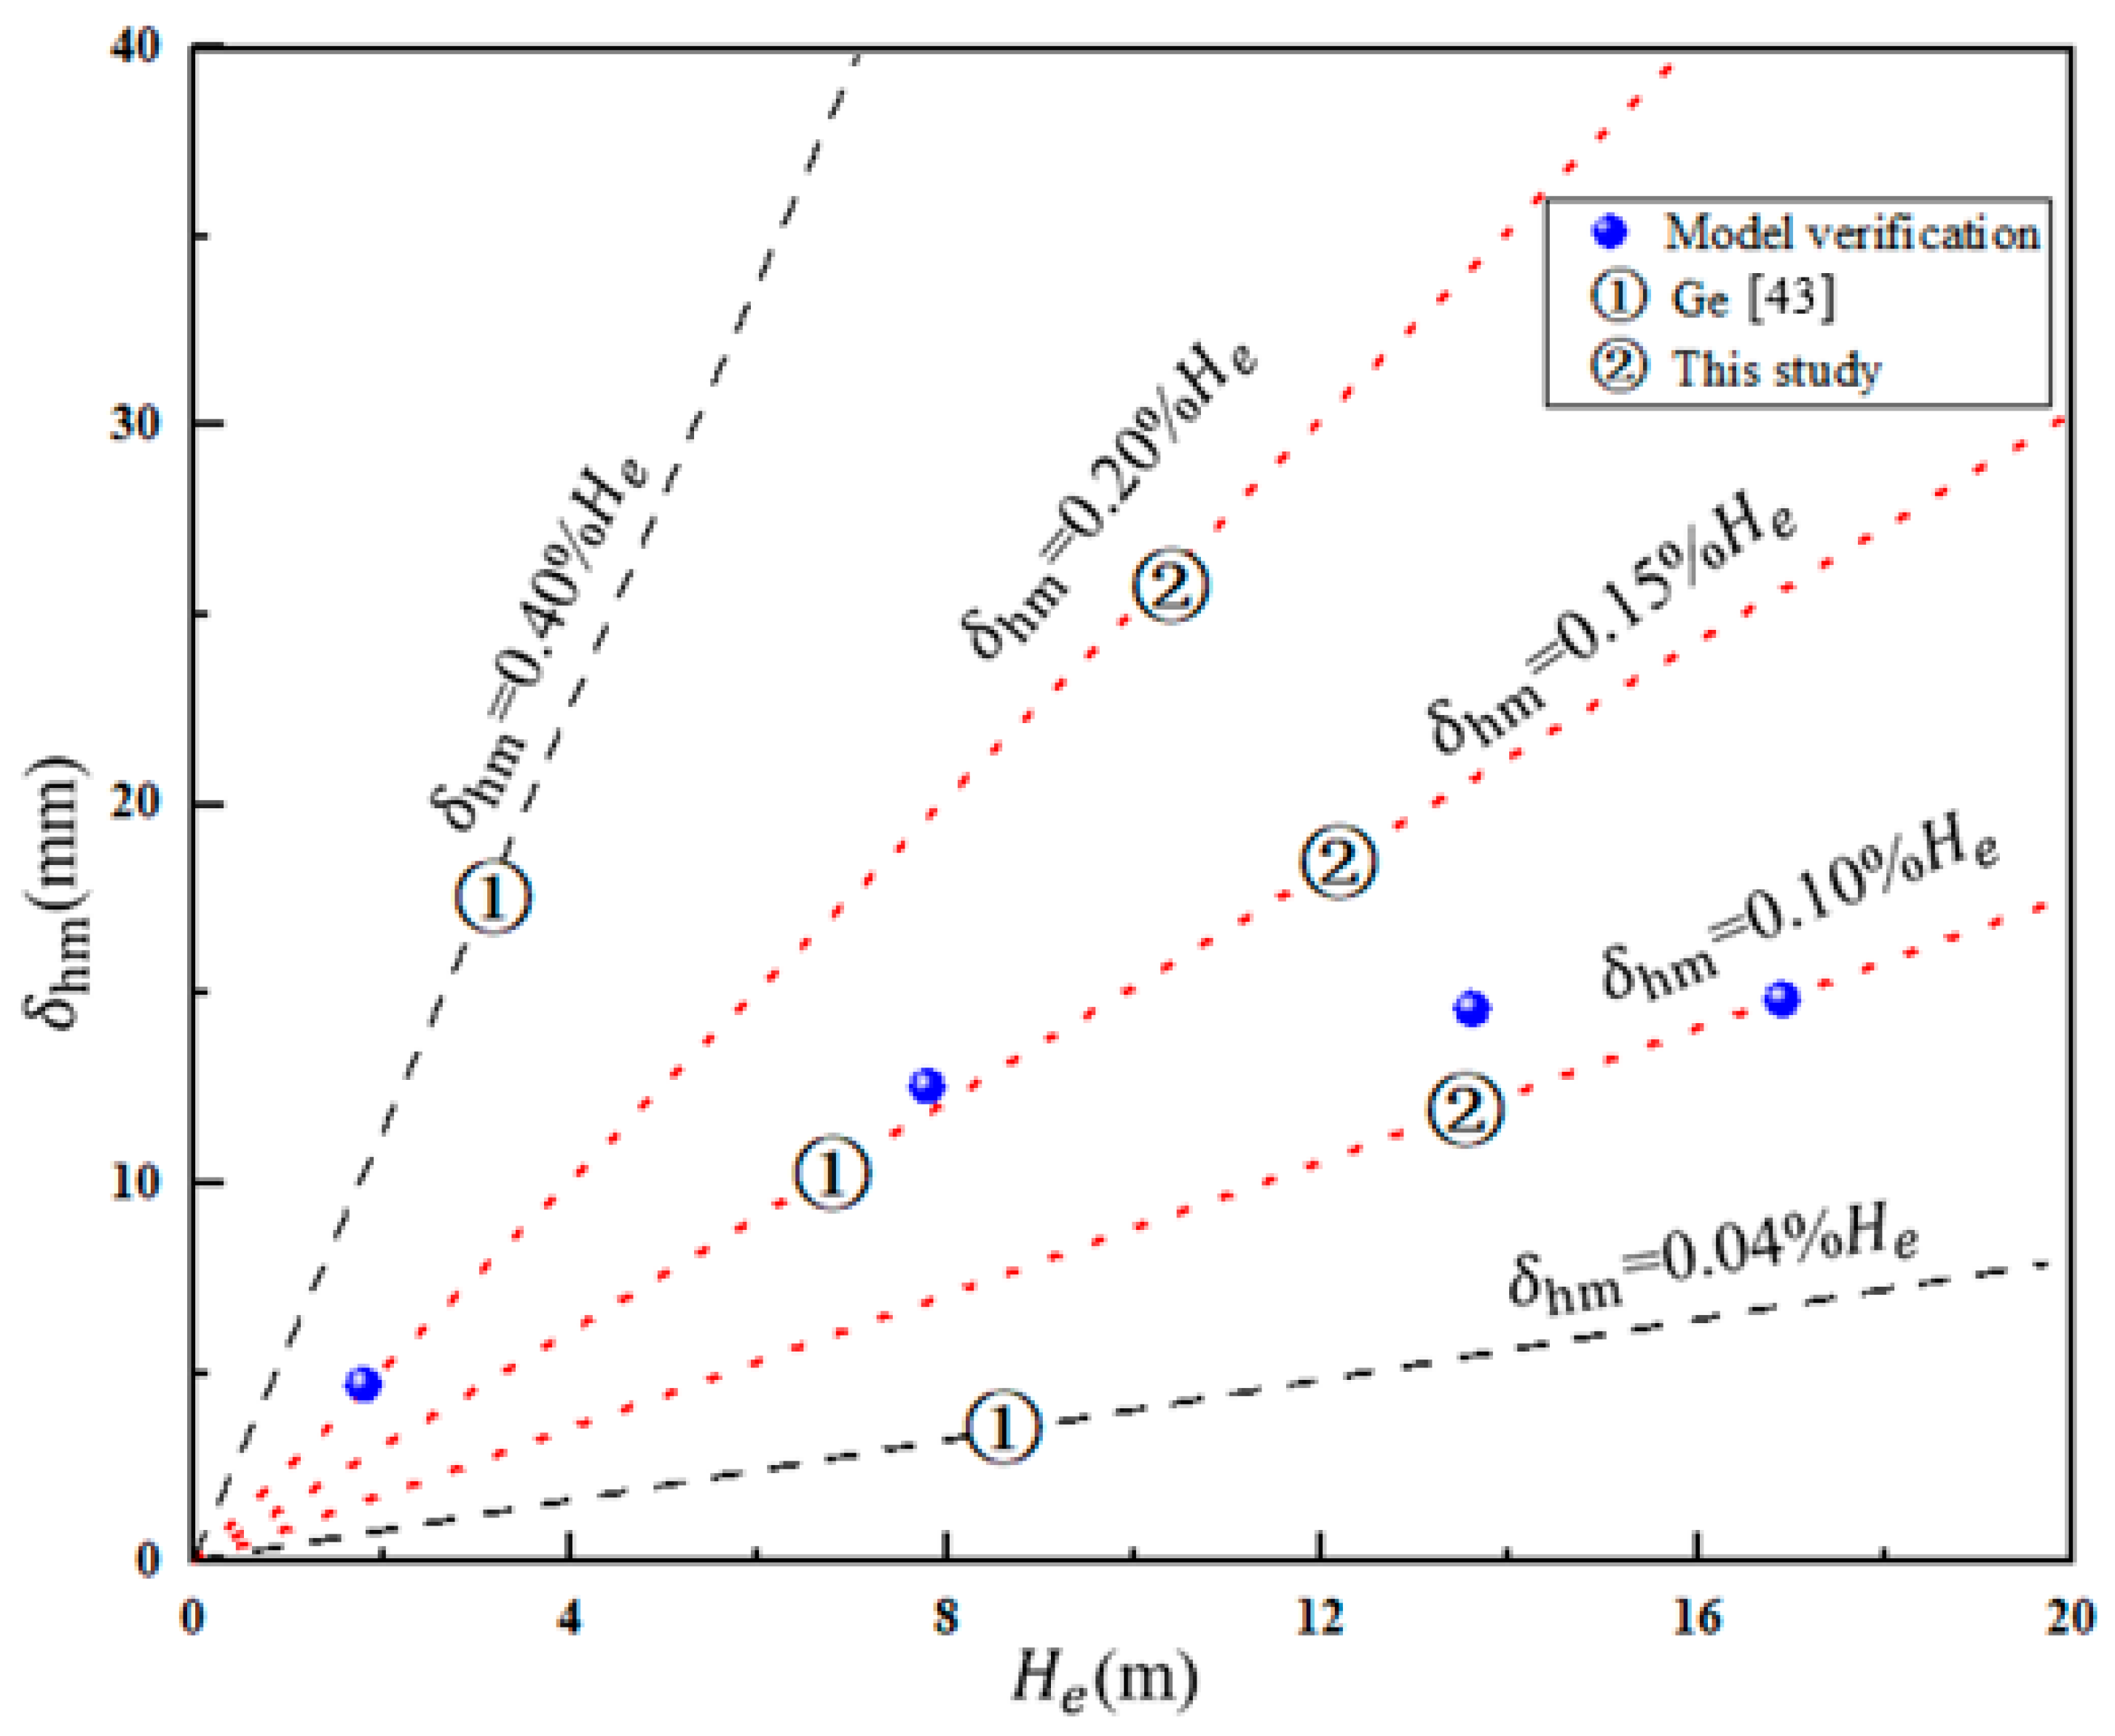
For model verification, the second type of model (i.e., no pile foundation outside the pit) was chosen, and the relations between the excavation depth
He and the maximum lateral wall deflection
δhm were obtained. These are shown in
Figure 2. The computed ratio
δhm/
He varied from 0.10% to 0.20%, with an average of 0.15%, which lay between the monitored results from the authors of [
43] who investigated the maximum wall deflection of the enclosure structure during the excavation construction of 32 metro stations in Tianjin, China. It is clear that the simulation results are reasonably consistent with the field measurement results in Tianjin.
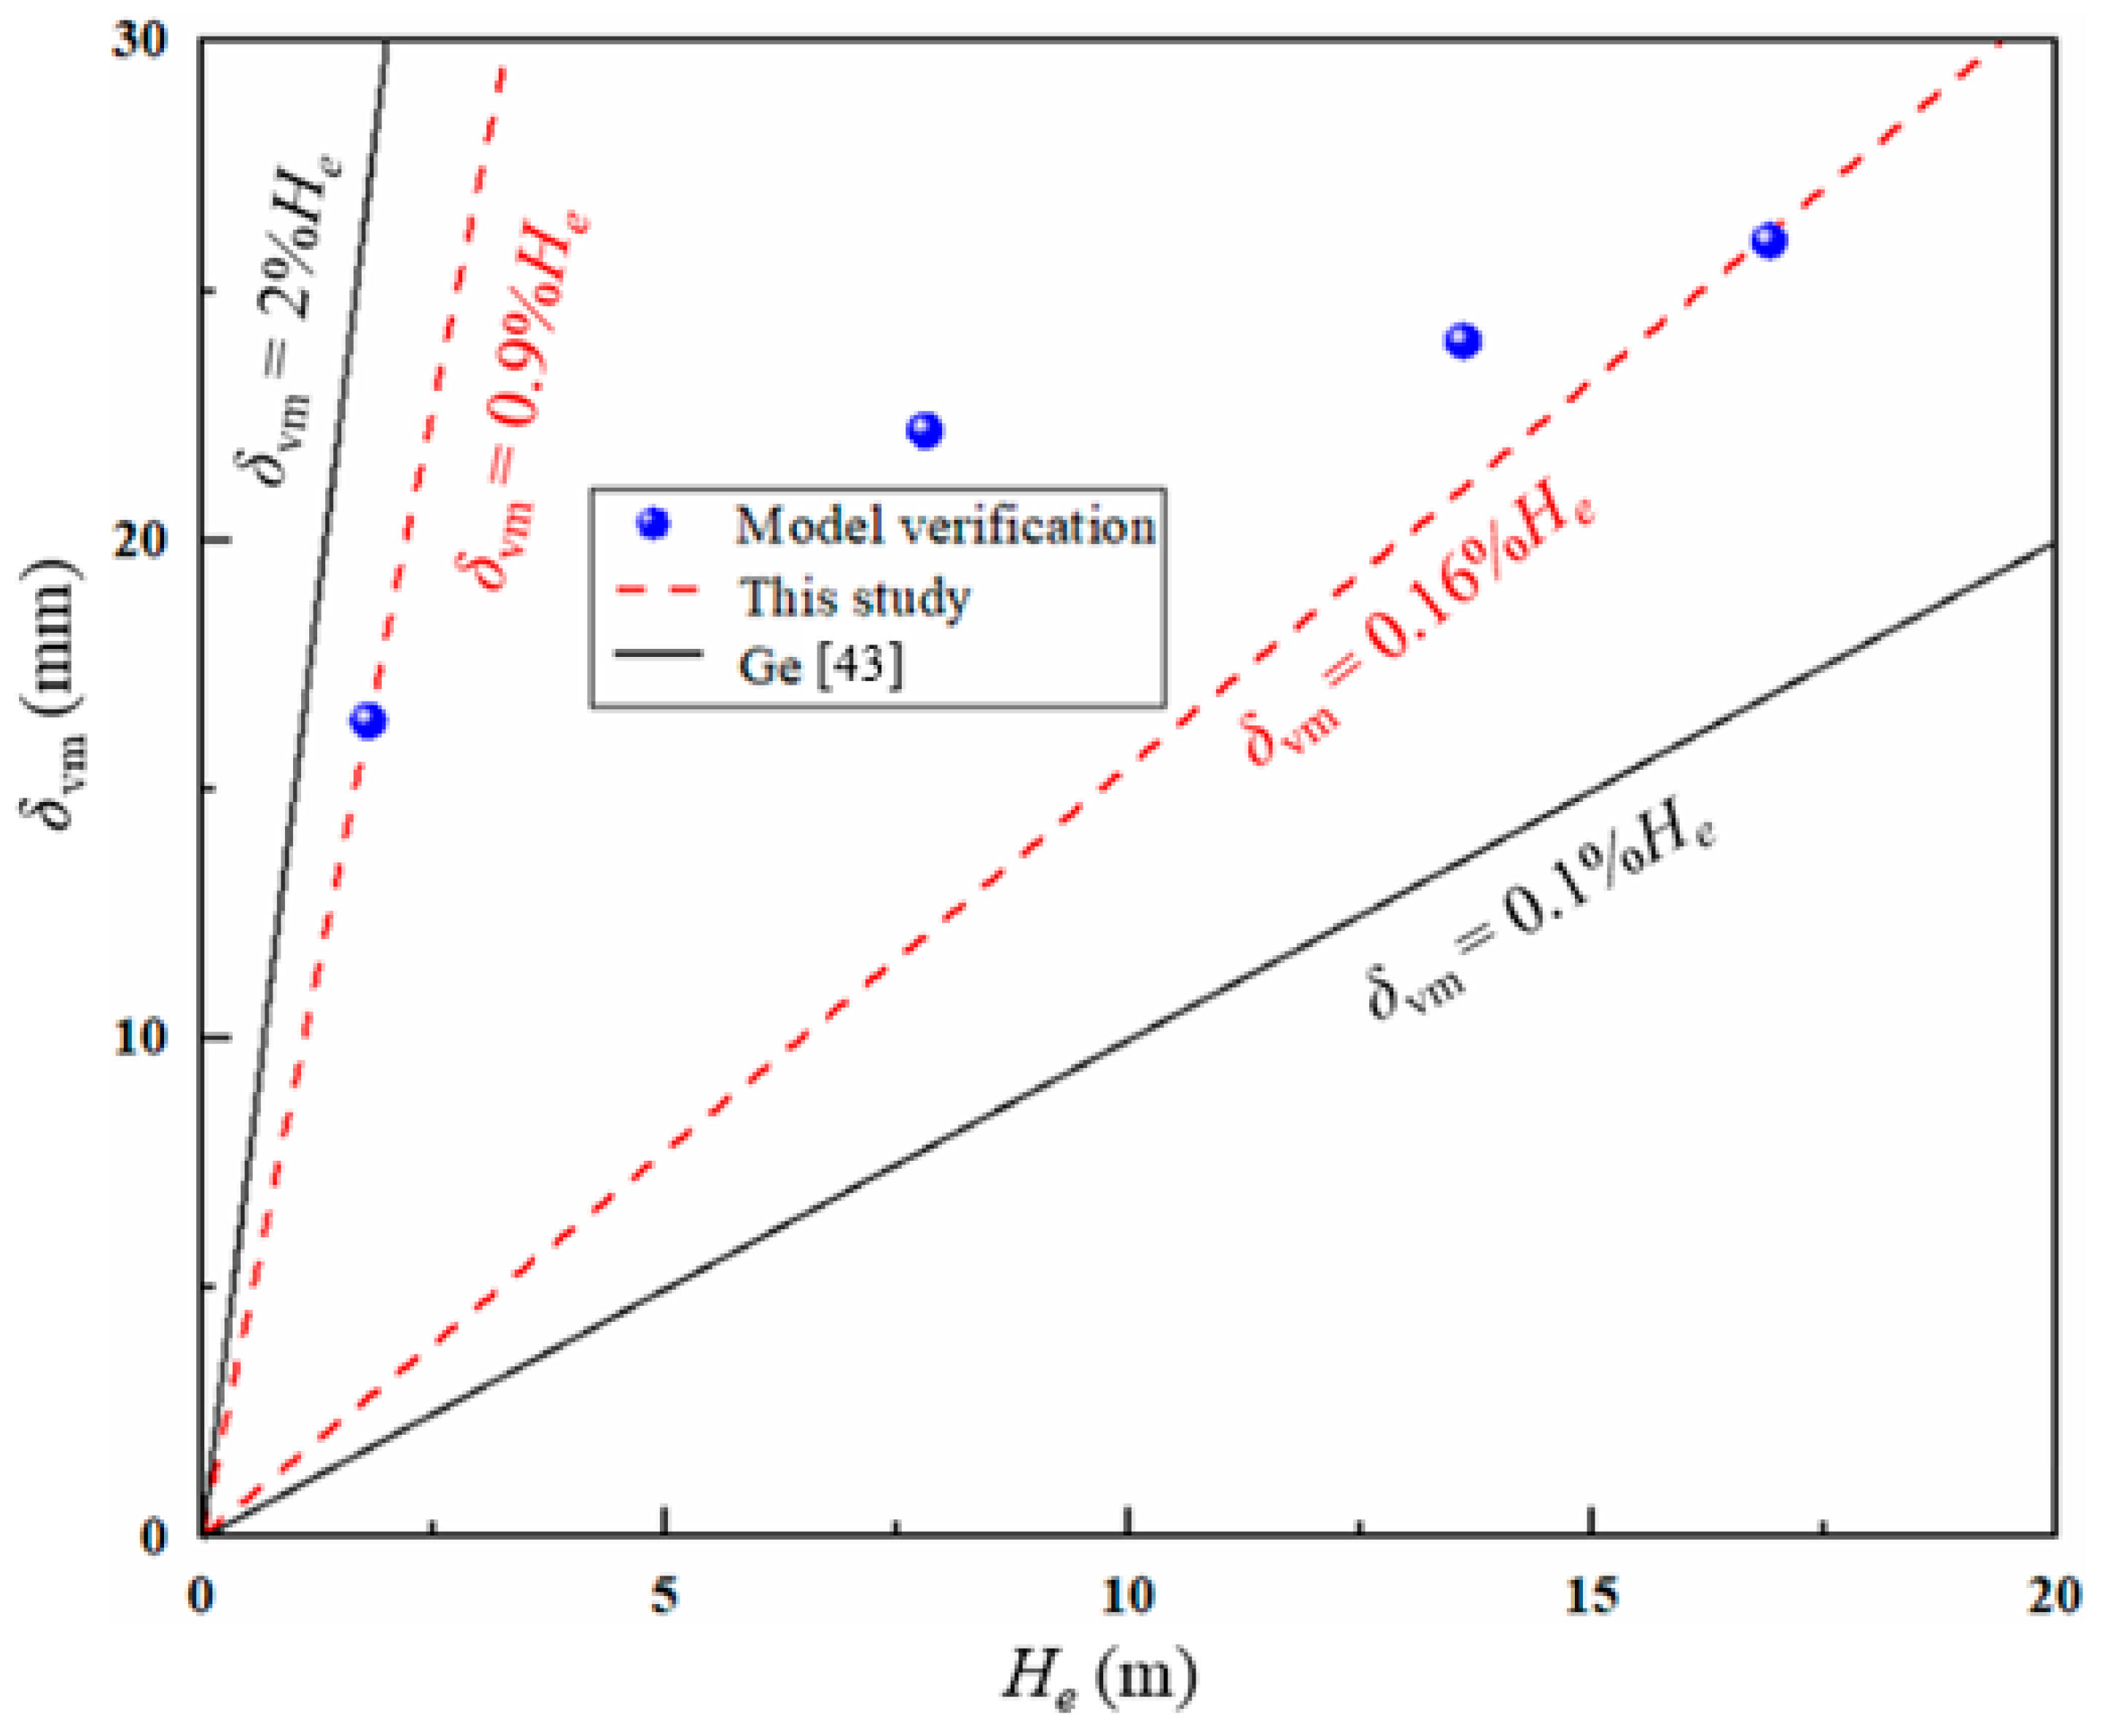
The relations between the excavation depth
He and the maximum ground settlement
δvm are shown in
Figure 3. The computed ratio
δvm/
He varied from 0.16% to 0.90%, which also lay between the monitored results from Ge [
43], showing that the model in this study is reasonable.
3. Analysis of Barrier Effect
3.1. Effect of D
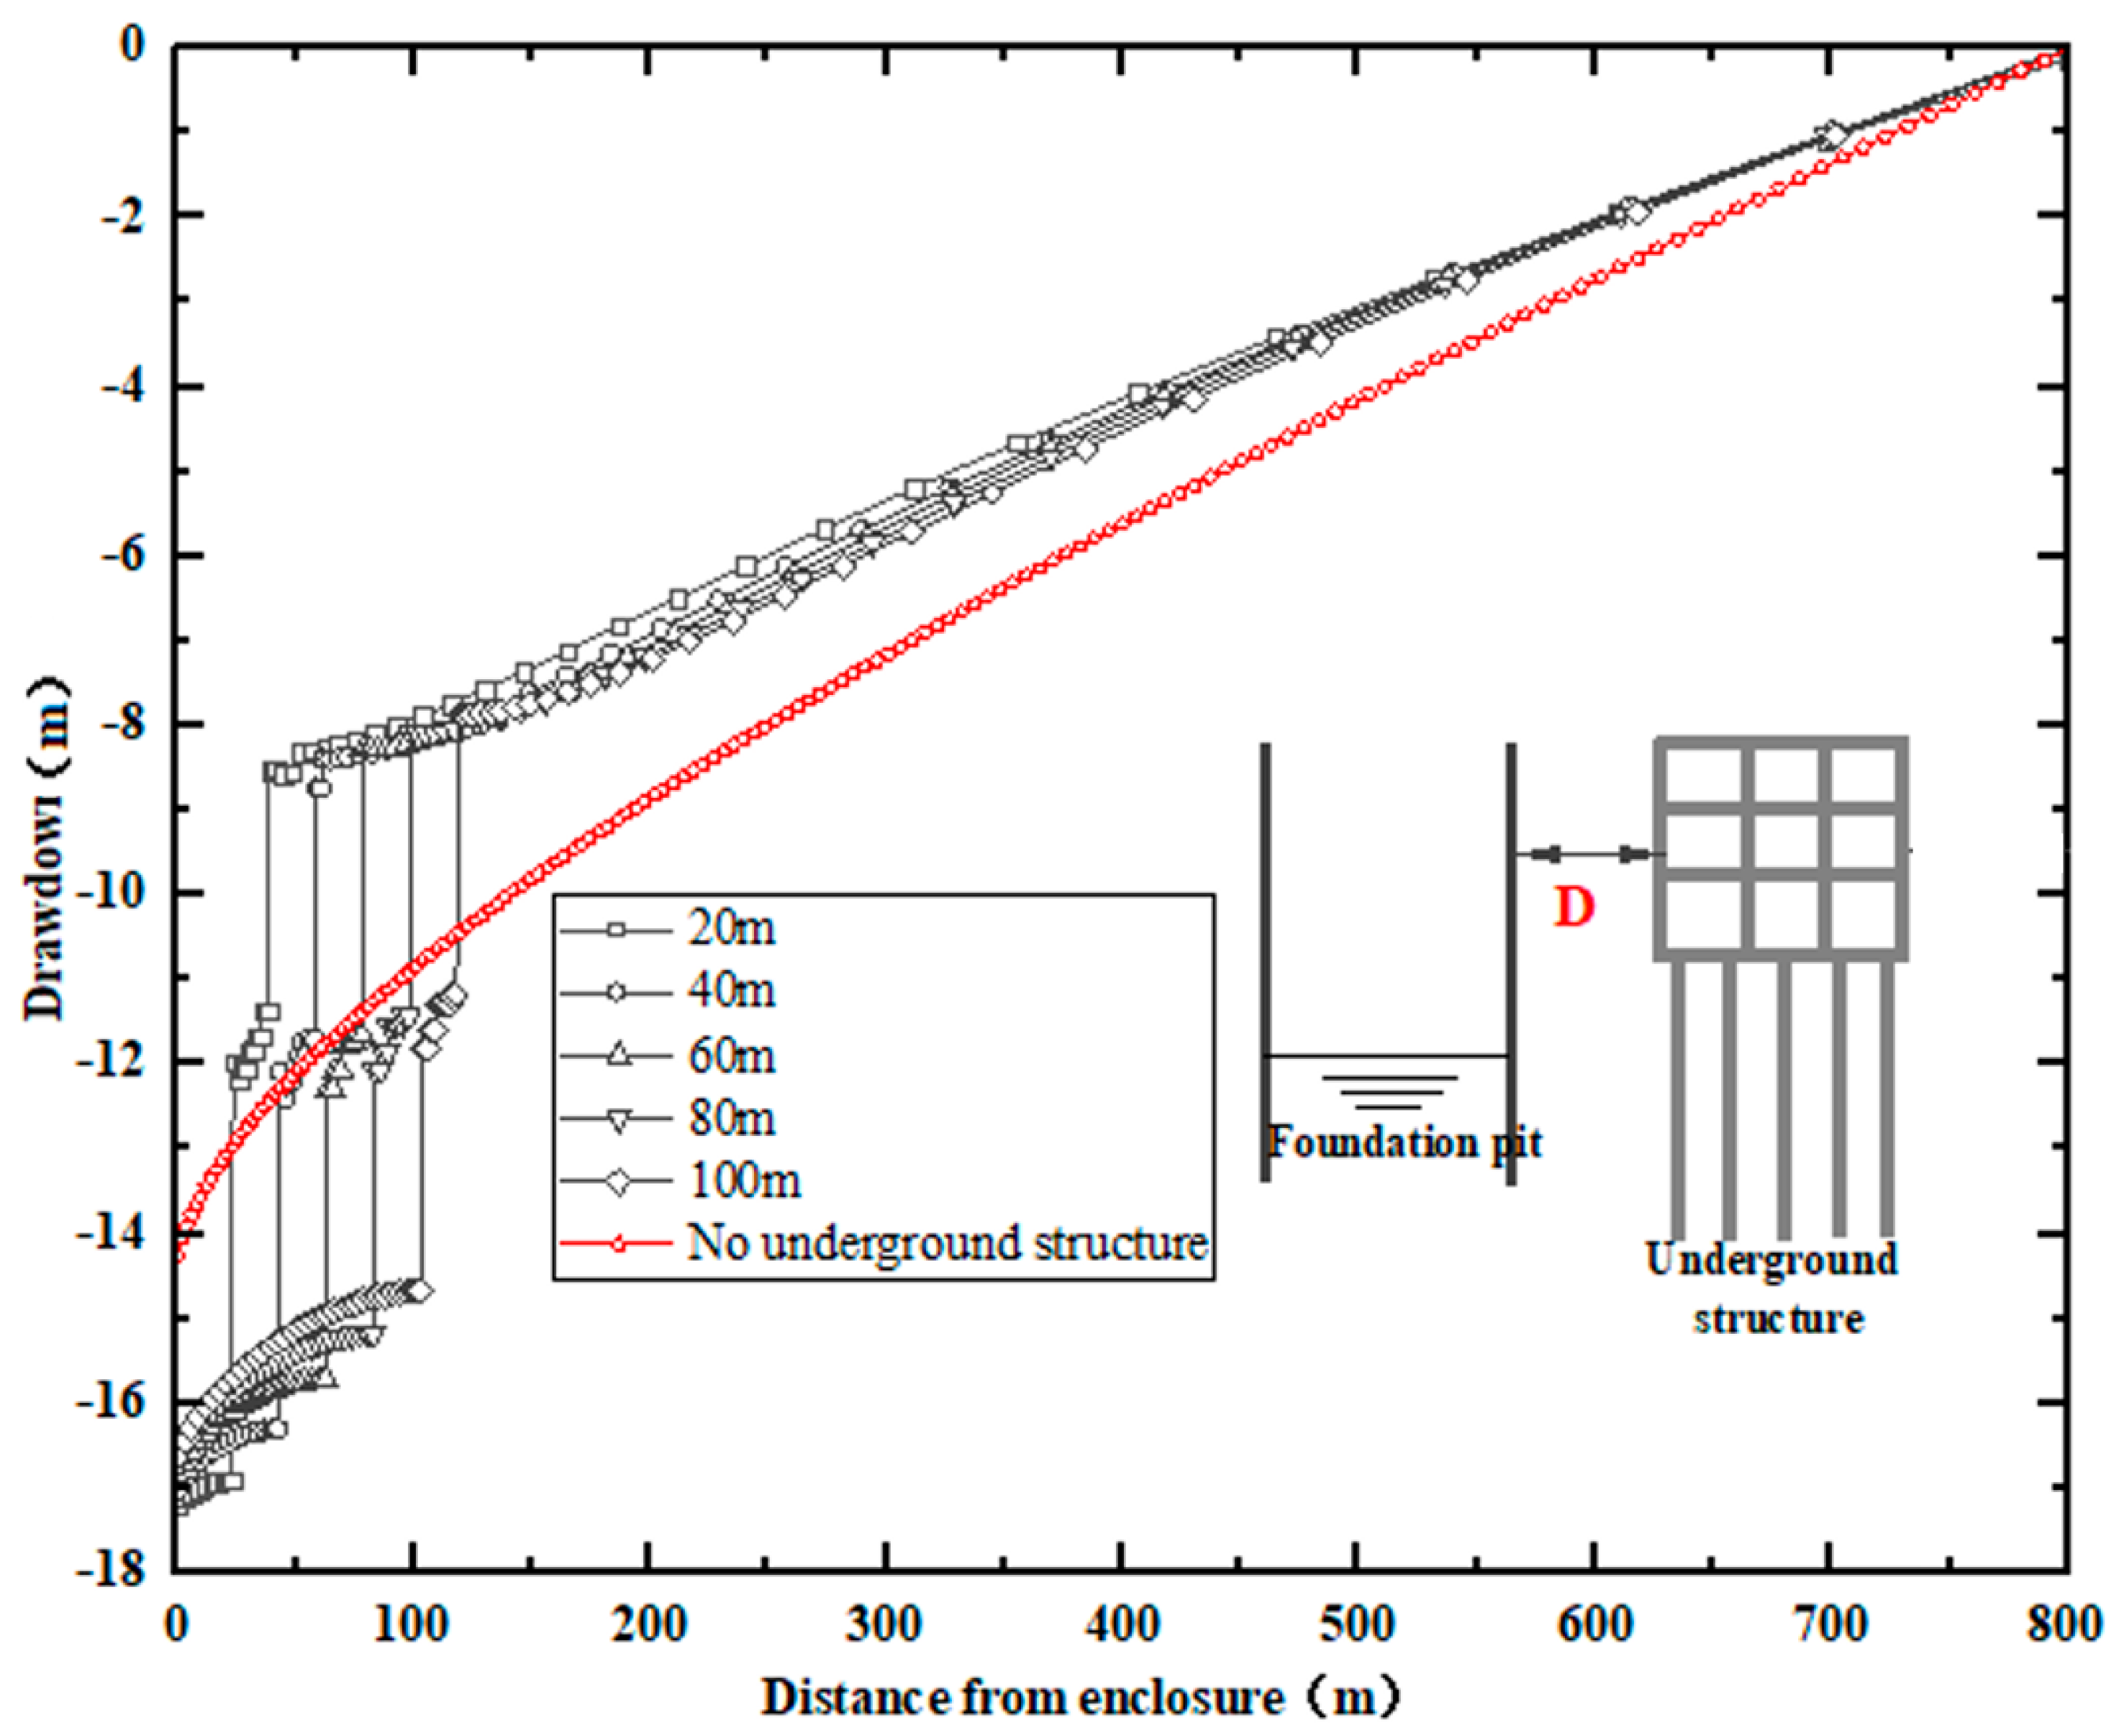
3.1.1. Water Level Decline
Using the condition with
H = 37 m as an example,
Figure 4 shows the distribution of water level decline outside the foundation pit. As to the cases without a pile foundation adjacent to the pit, the drawdown along the horizontal direction is a continuous curve that gradually declines as the distance from the enclosure increases. For the condition with a pile foundation near the pit, the continuous distribution of drawdown is interrupted into several sections because of the blocking effect of the pile foundation. The groundwater drawdown between the excavation and the pile foundation is more apparent compared to the case without a pile foundation, while the drawdown is relatively small for the section behind the pile foundation. This is because the pile foundation acts as a barrier to the movement of groundwater, thus the groundwater has to round the obstacle to flow to the pit, and the flow path is rotated and lengthened. In addition, the drawdown between the foundation pit and pile foundation declines as
D increases, showing that the blocking effect gradually weakens as
D increases.
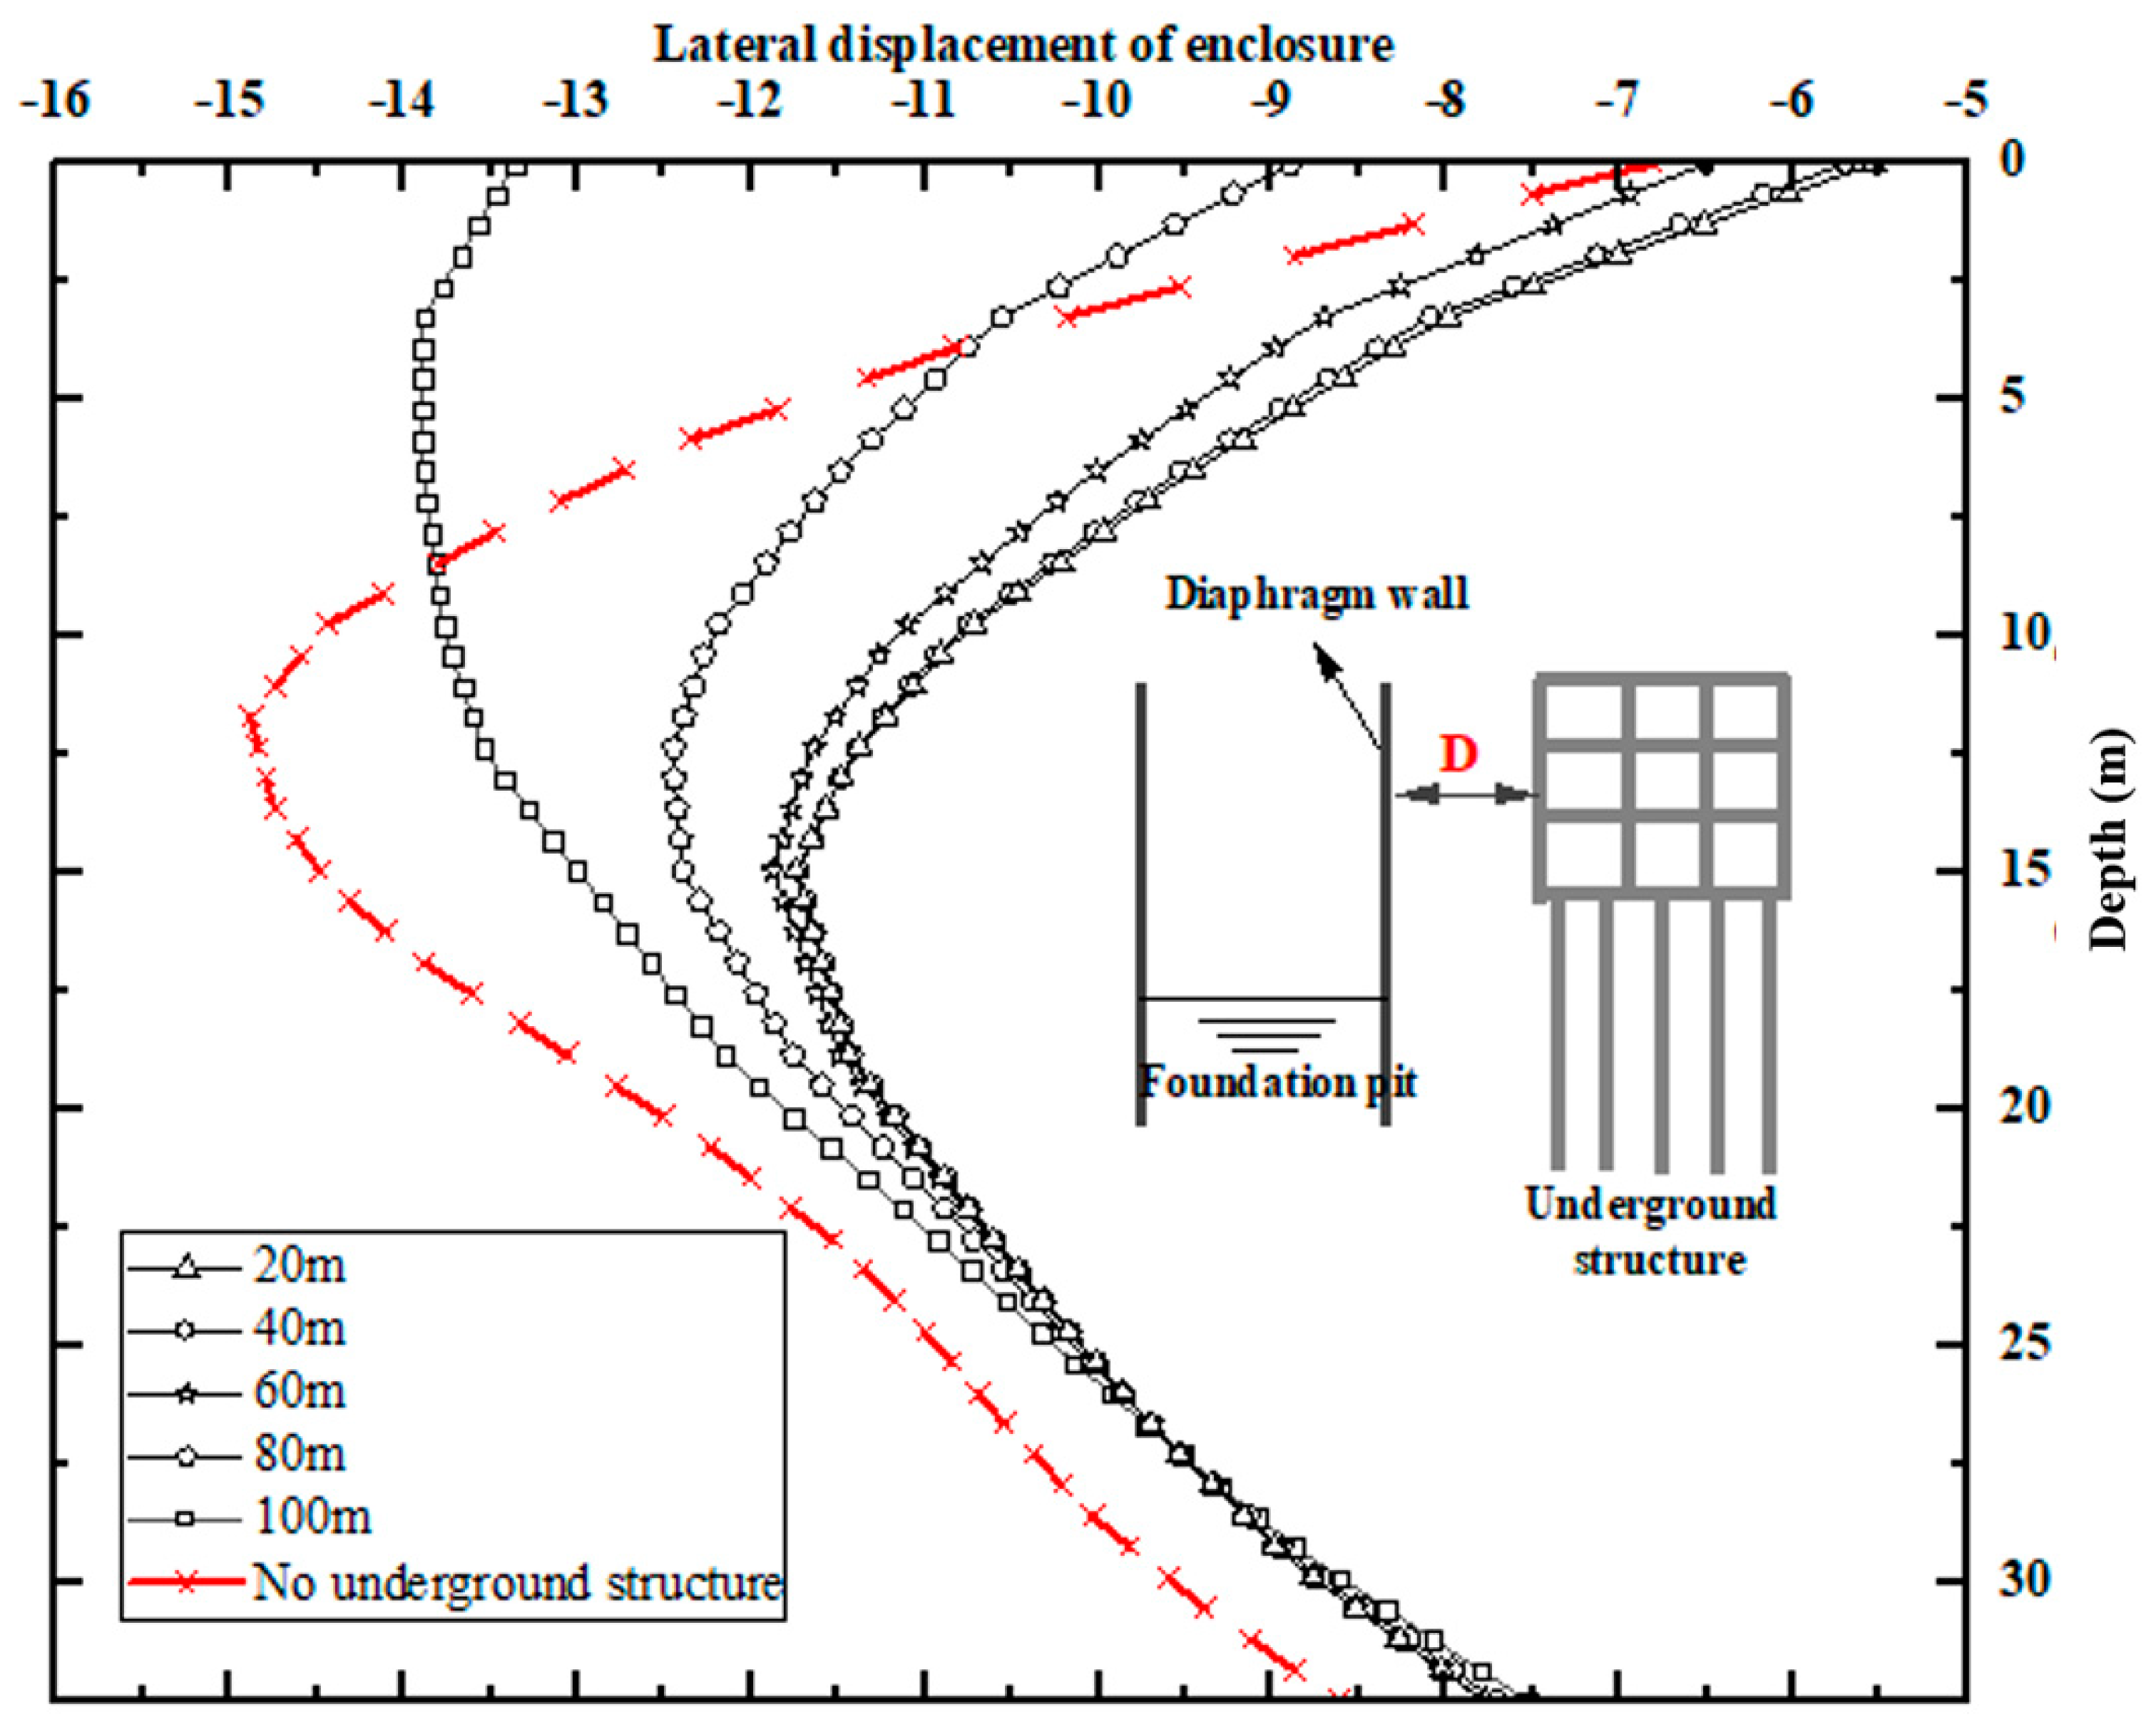
3.1.2. Lateral Displacement of Enclosure Structure
Using the condition with
H = 37 m as an example,
Figure 5 displays the deformation of the retaining structure with and without a pile foundation adjacent to the pit. Whether or not there is a pile foundation, the retaining structure shows a deep inward deflection. However, the maximum enclosure structure deflection is always smaller than the condition with a pile foundation. The reason is that the pile foundation as a barrier can block the soil movement behind it, thus possibly reducing the stress on the enclosure structure. Additionally, with the increase in
D, the maximum wall deflection becomes greater and gradually reaches the state without a pile foundation, showing that the barrier effect is gradually weakened.
3.1.3. Land Subsidence
Using the condition with
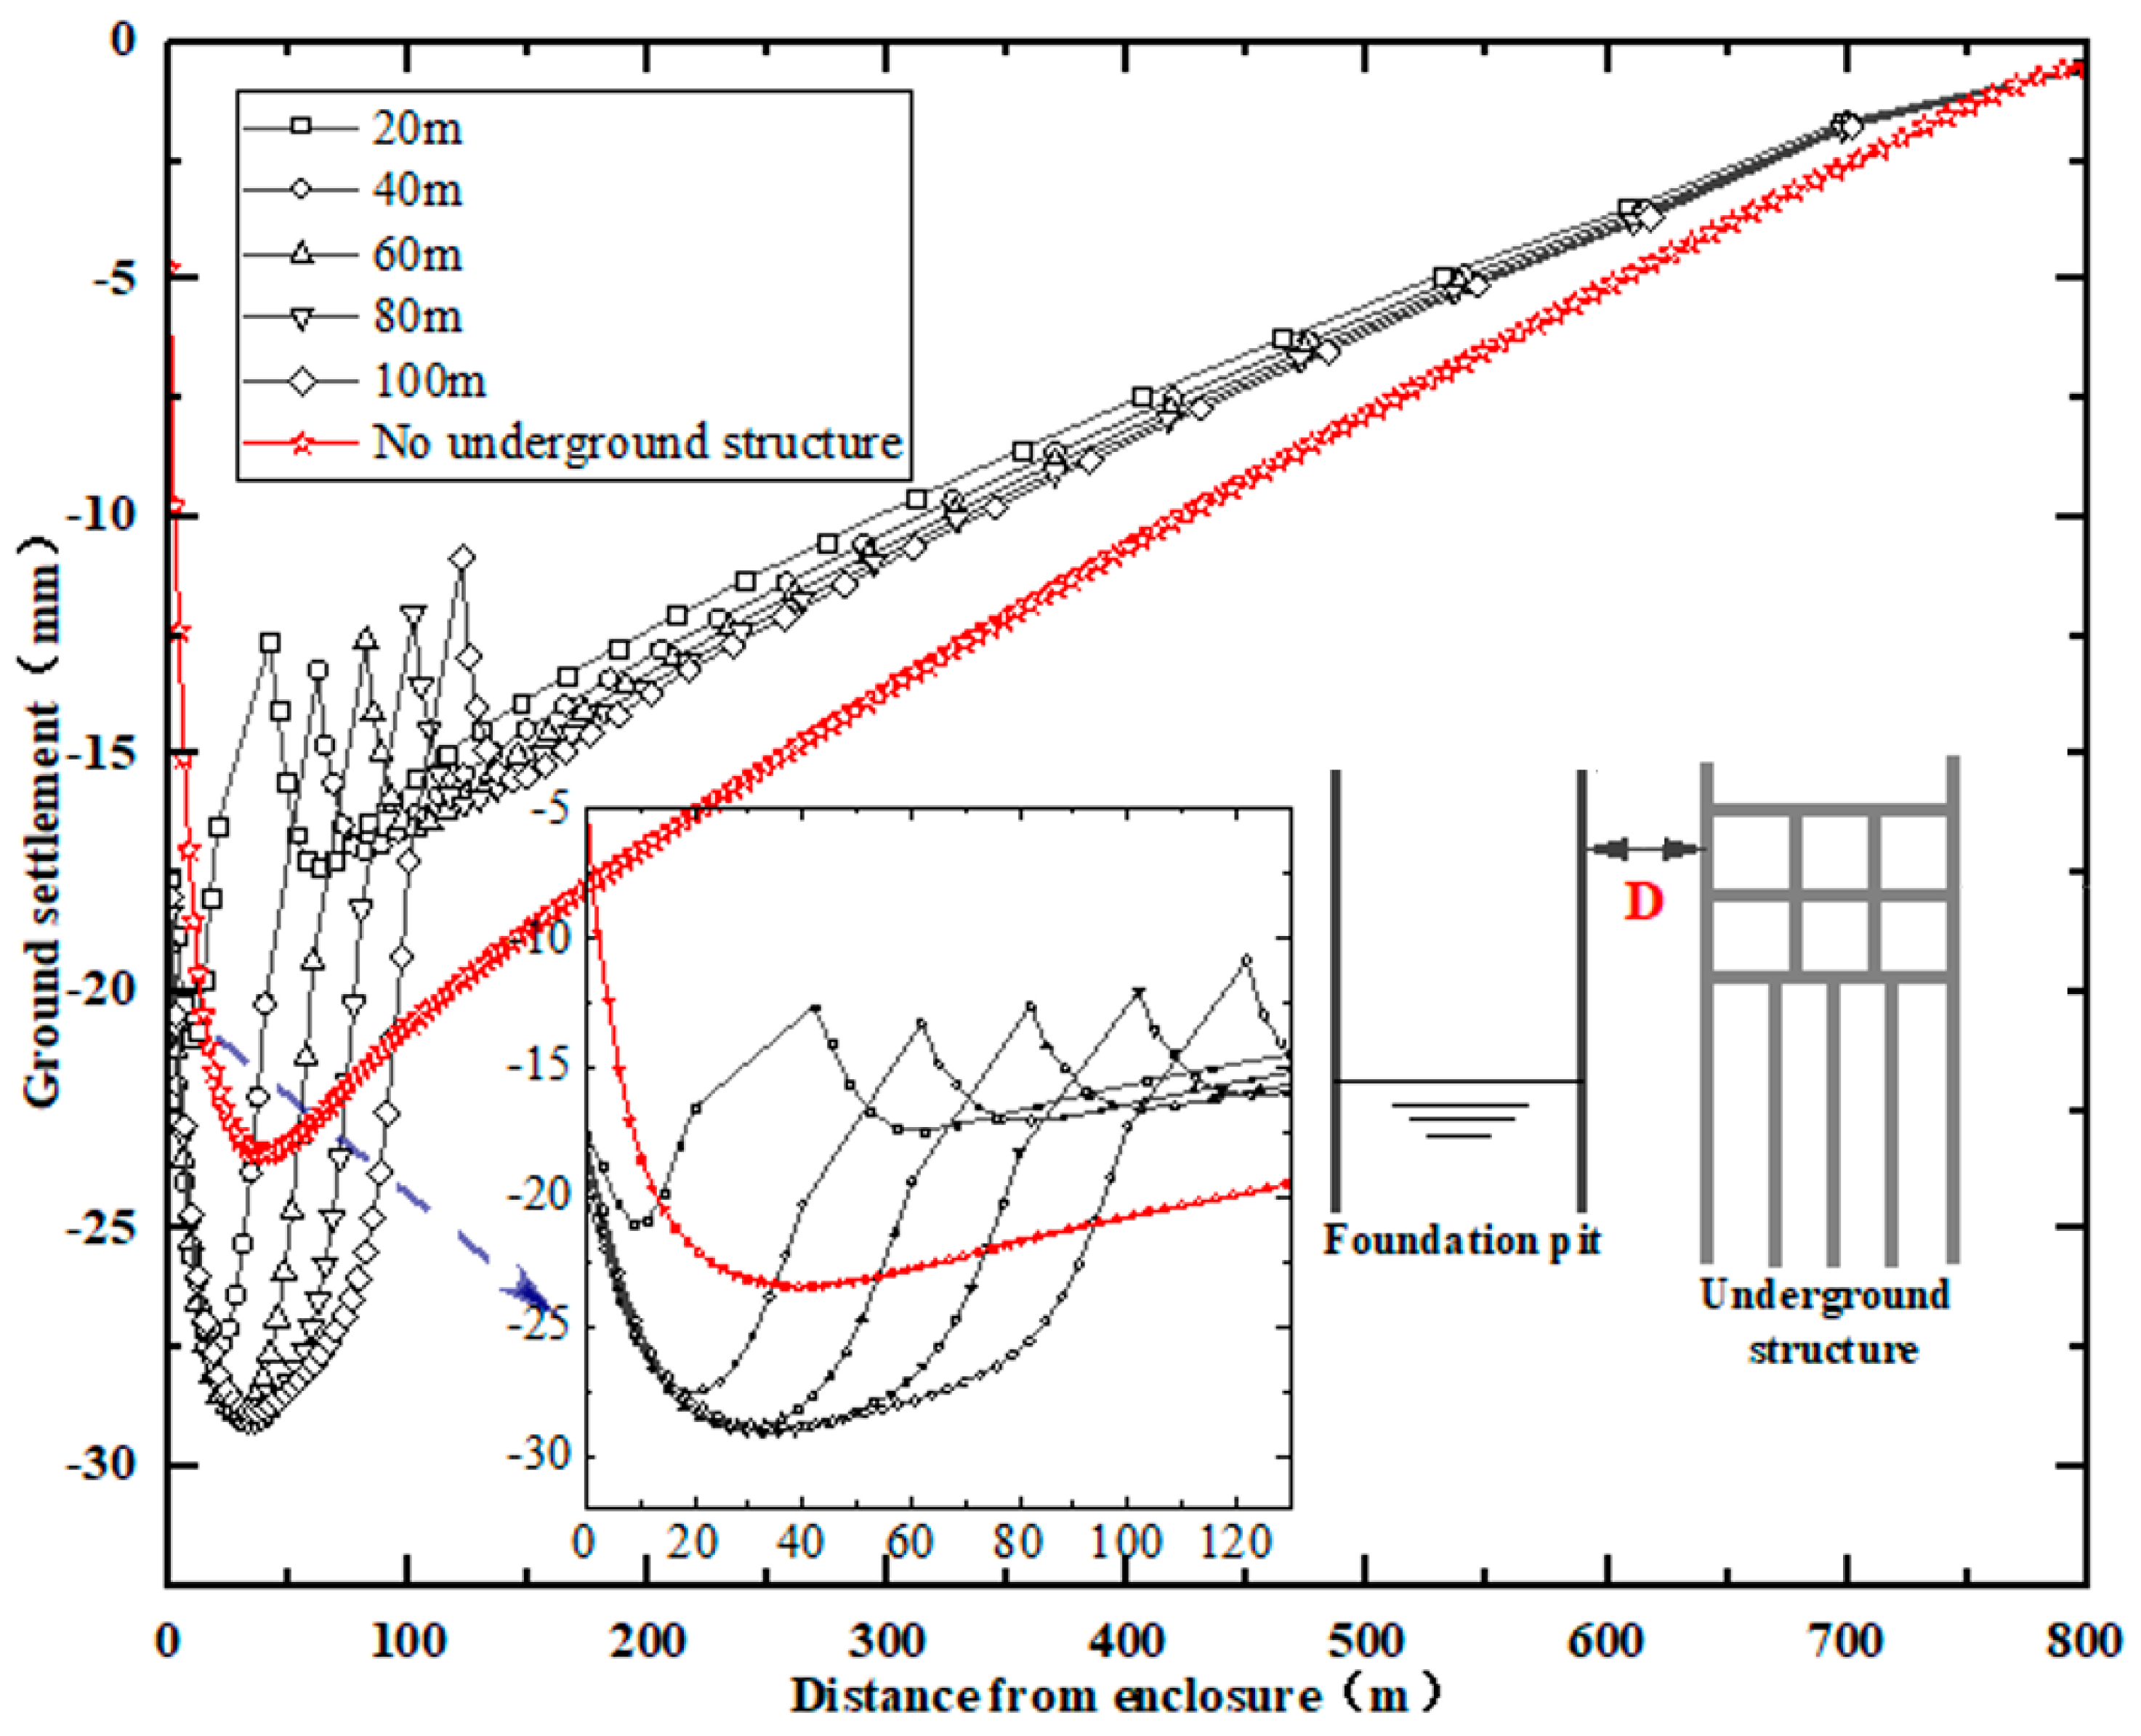
H = 37 m for cases,
Figure 6 shows the distribution of ground settlement outside the pit with different
D. The following points can be summarized:
(1) For the case without a pile foundation, the distribution of land subsidence is continuous, and a single settlement trough appears behind the retaining structure. When there is a pile foundation adjacent to the pit, the land subsidence curve is discontinuous with two troughs on both sides of the pile foundation. This is because the pile foundation as a barrier mainly prevents the movement of soil and the flow of groundwater behind it;
(2) As to the land subsidence between the pit and the pile foundation, the maximum ground settlement is less than that without a pile foundation when the distance is short (e.g., D = 20 m). As D increases, the subsidence between the pit and the pile foundation increases continuously, and is larger than the maximum settlement of the condition without a pile foundation. When D continues to increase (e.g., D > 60 m), the maximum subsidence increases slightly and tends to be the same. The reasons for the above settlement development can be summarized as follows. When D is small, the pile foundation as a barrier mainly prevents the movement of soil behind it towards the pit (i.e., the soil-blocking effect), reducing the ground settlement (compared to the no pile foundation outside the pit); when D increases, the pile foundation mainly prevents the flow of groundwater behind it (i.e., the water-blocking effect), increasing the ground settlement outside the pit (compared to no pile foundation outside the pit);
(3) The settlement behind the excavation is smaller than with no pile foundation, which is mainly due to the pulling action of the pile foundation when the structure moves to the pit induced by the dewatering and excavation. As
D increases, the ground settlement behind the pile foundation decreases gradually and tends to approach the condition of no pile foundation outside, which is consistent with the groundwater drawdown behind the pile foundation in
Figure 4.
3.2. Effect of H
The effect of
D on the groundwater flow and strata movement induced by dewatering and excavation is revealed in
Section 3.1. However, in actual projects, the surroundings of the excavation are varied, and the buried depth of each building is different. Therefore, the influence of the buried depth (
H) of the pile foundation on groundwater flow and strata movement is studied.
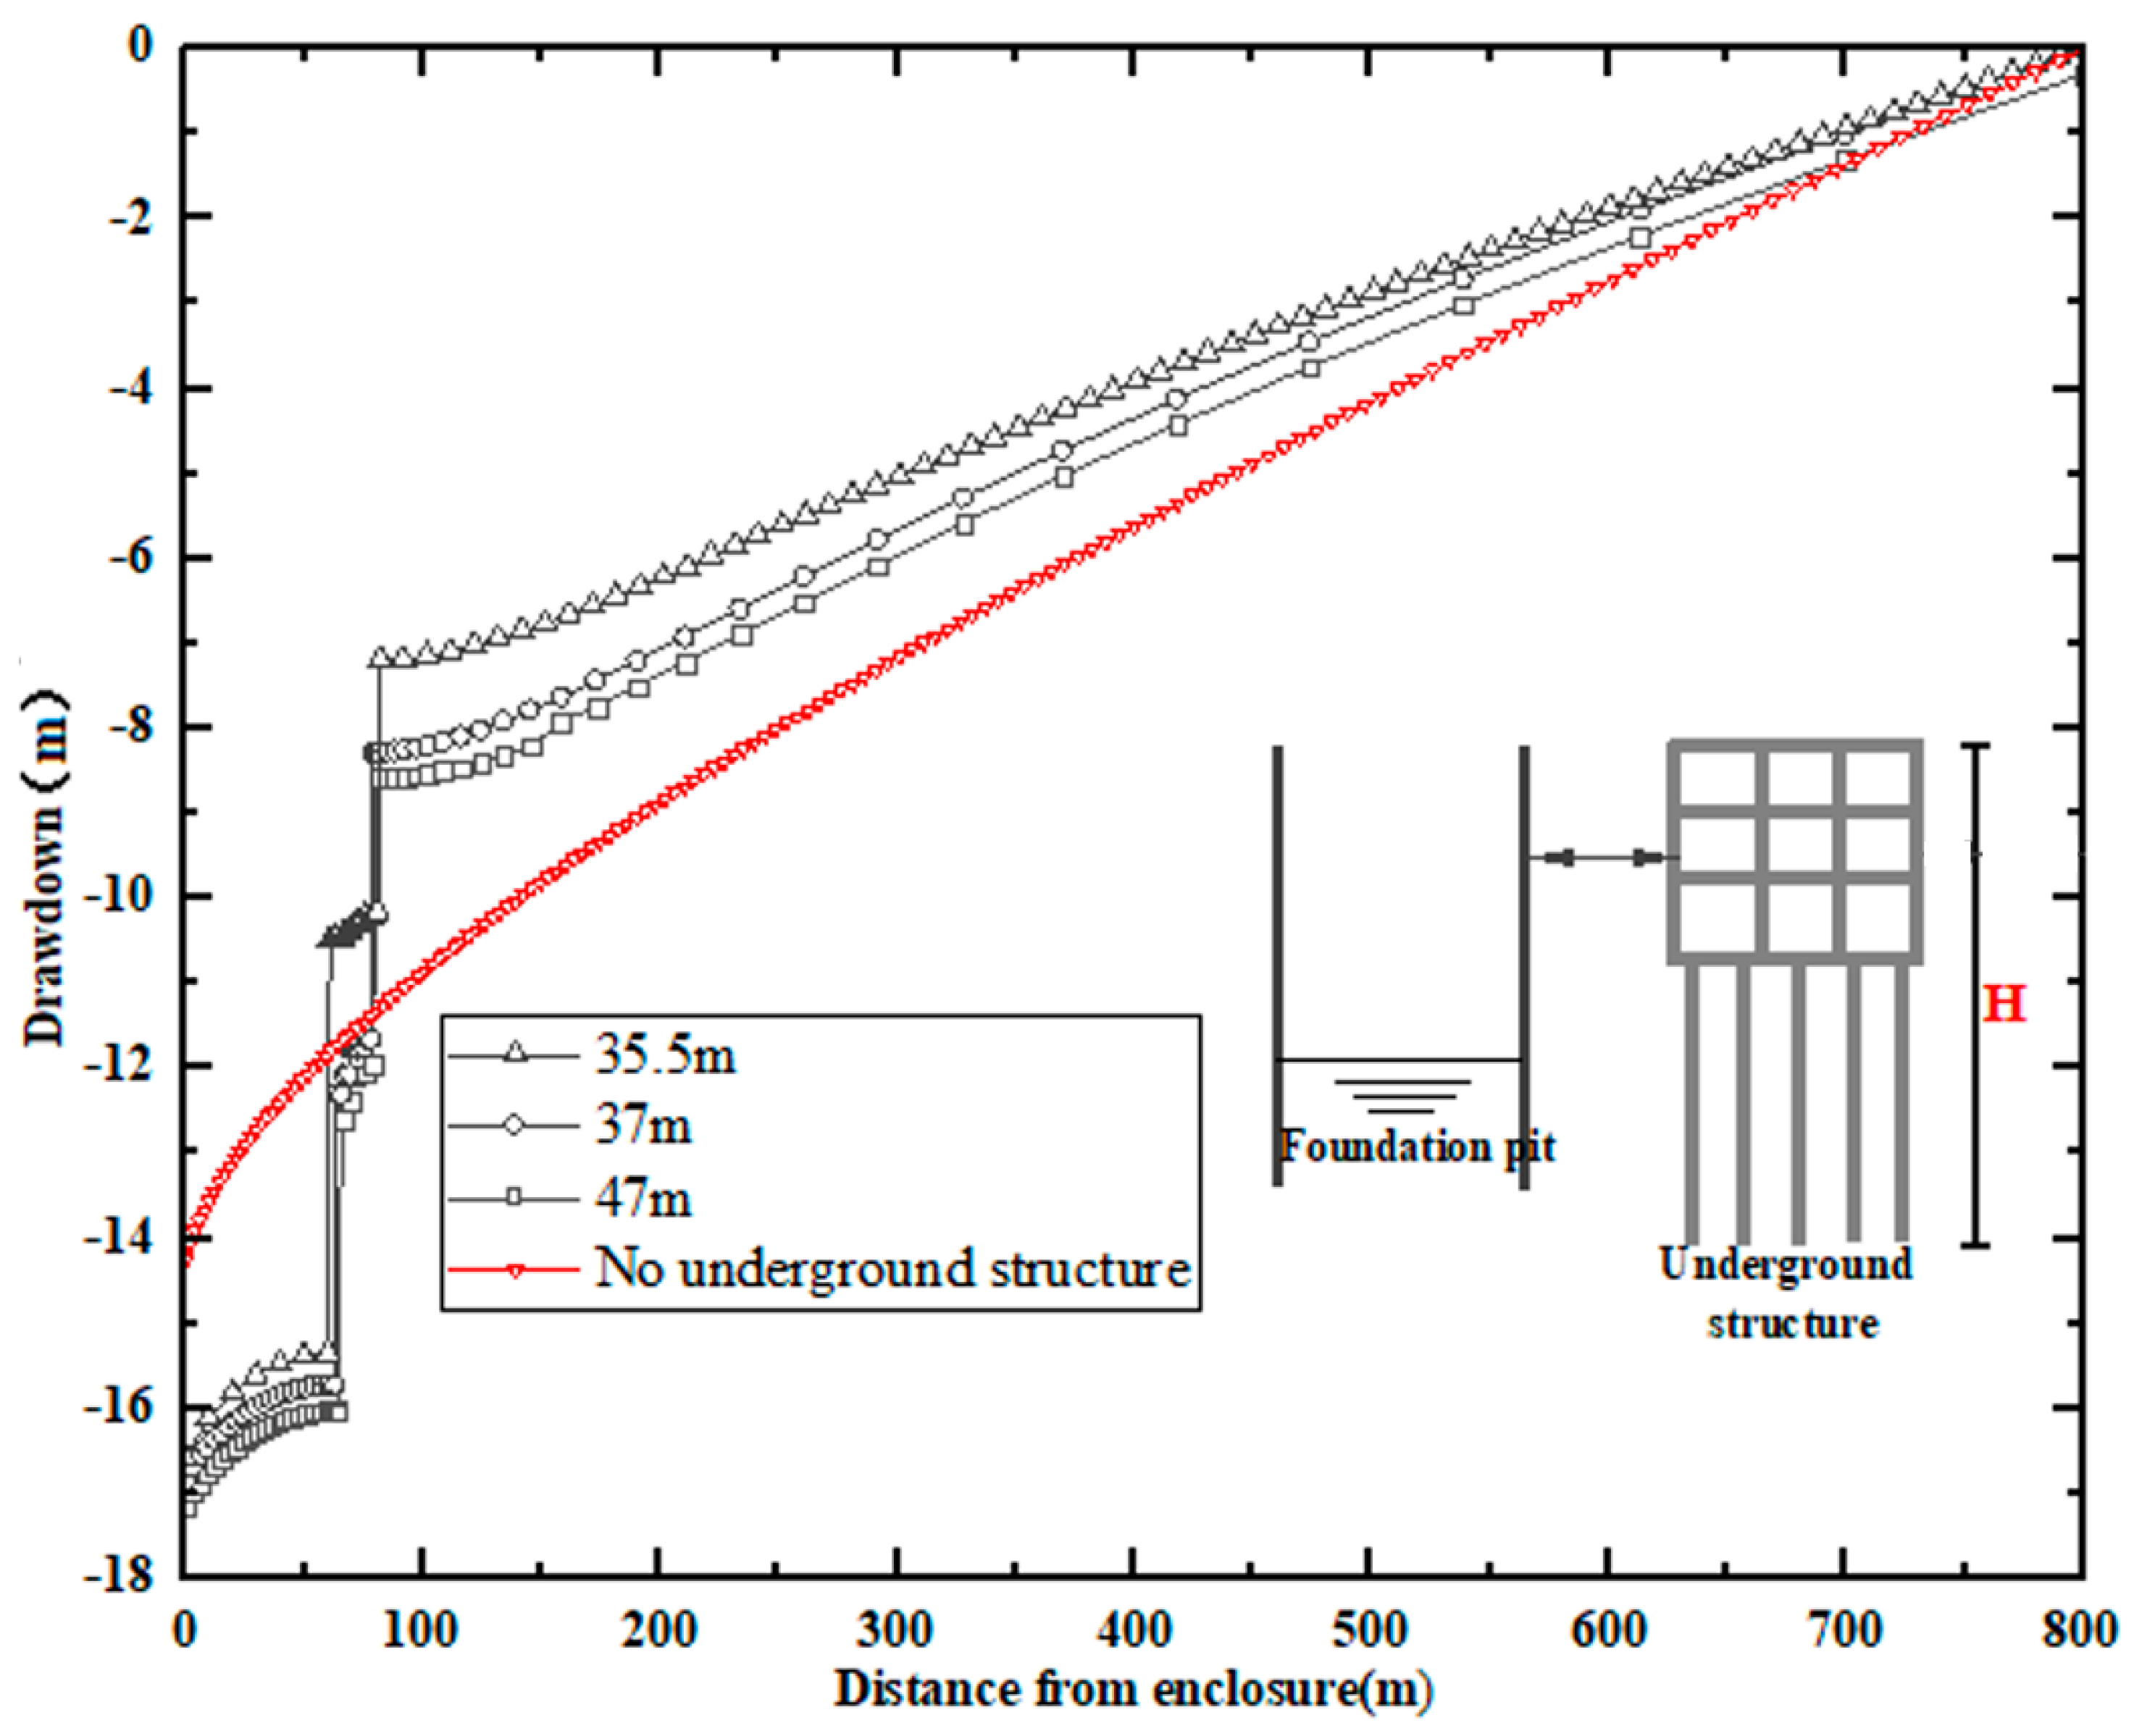
3.2.1. Water Level Decline
Using the condition with
D = 60 m for cases,
Figure 7 shows the distribution of water level decline under different
H. As to the condition with a pile foundation outside the pit, the groundwater drawdown before the pile foundation (i.e., the part between the excavation and pile foundation) is greater than that without the pile foundation, while the drawdown is smaller behind the pile foundation. The working mechanism is the same as
D in
Section 3.1.1. In addition, as
H increases, the groundwater drawdown between the pit and the pile foundation becomes larger. This is because the flow path of groundwater flowing to the pit extends as
H increases.
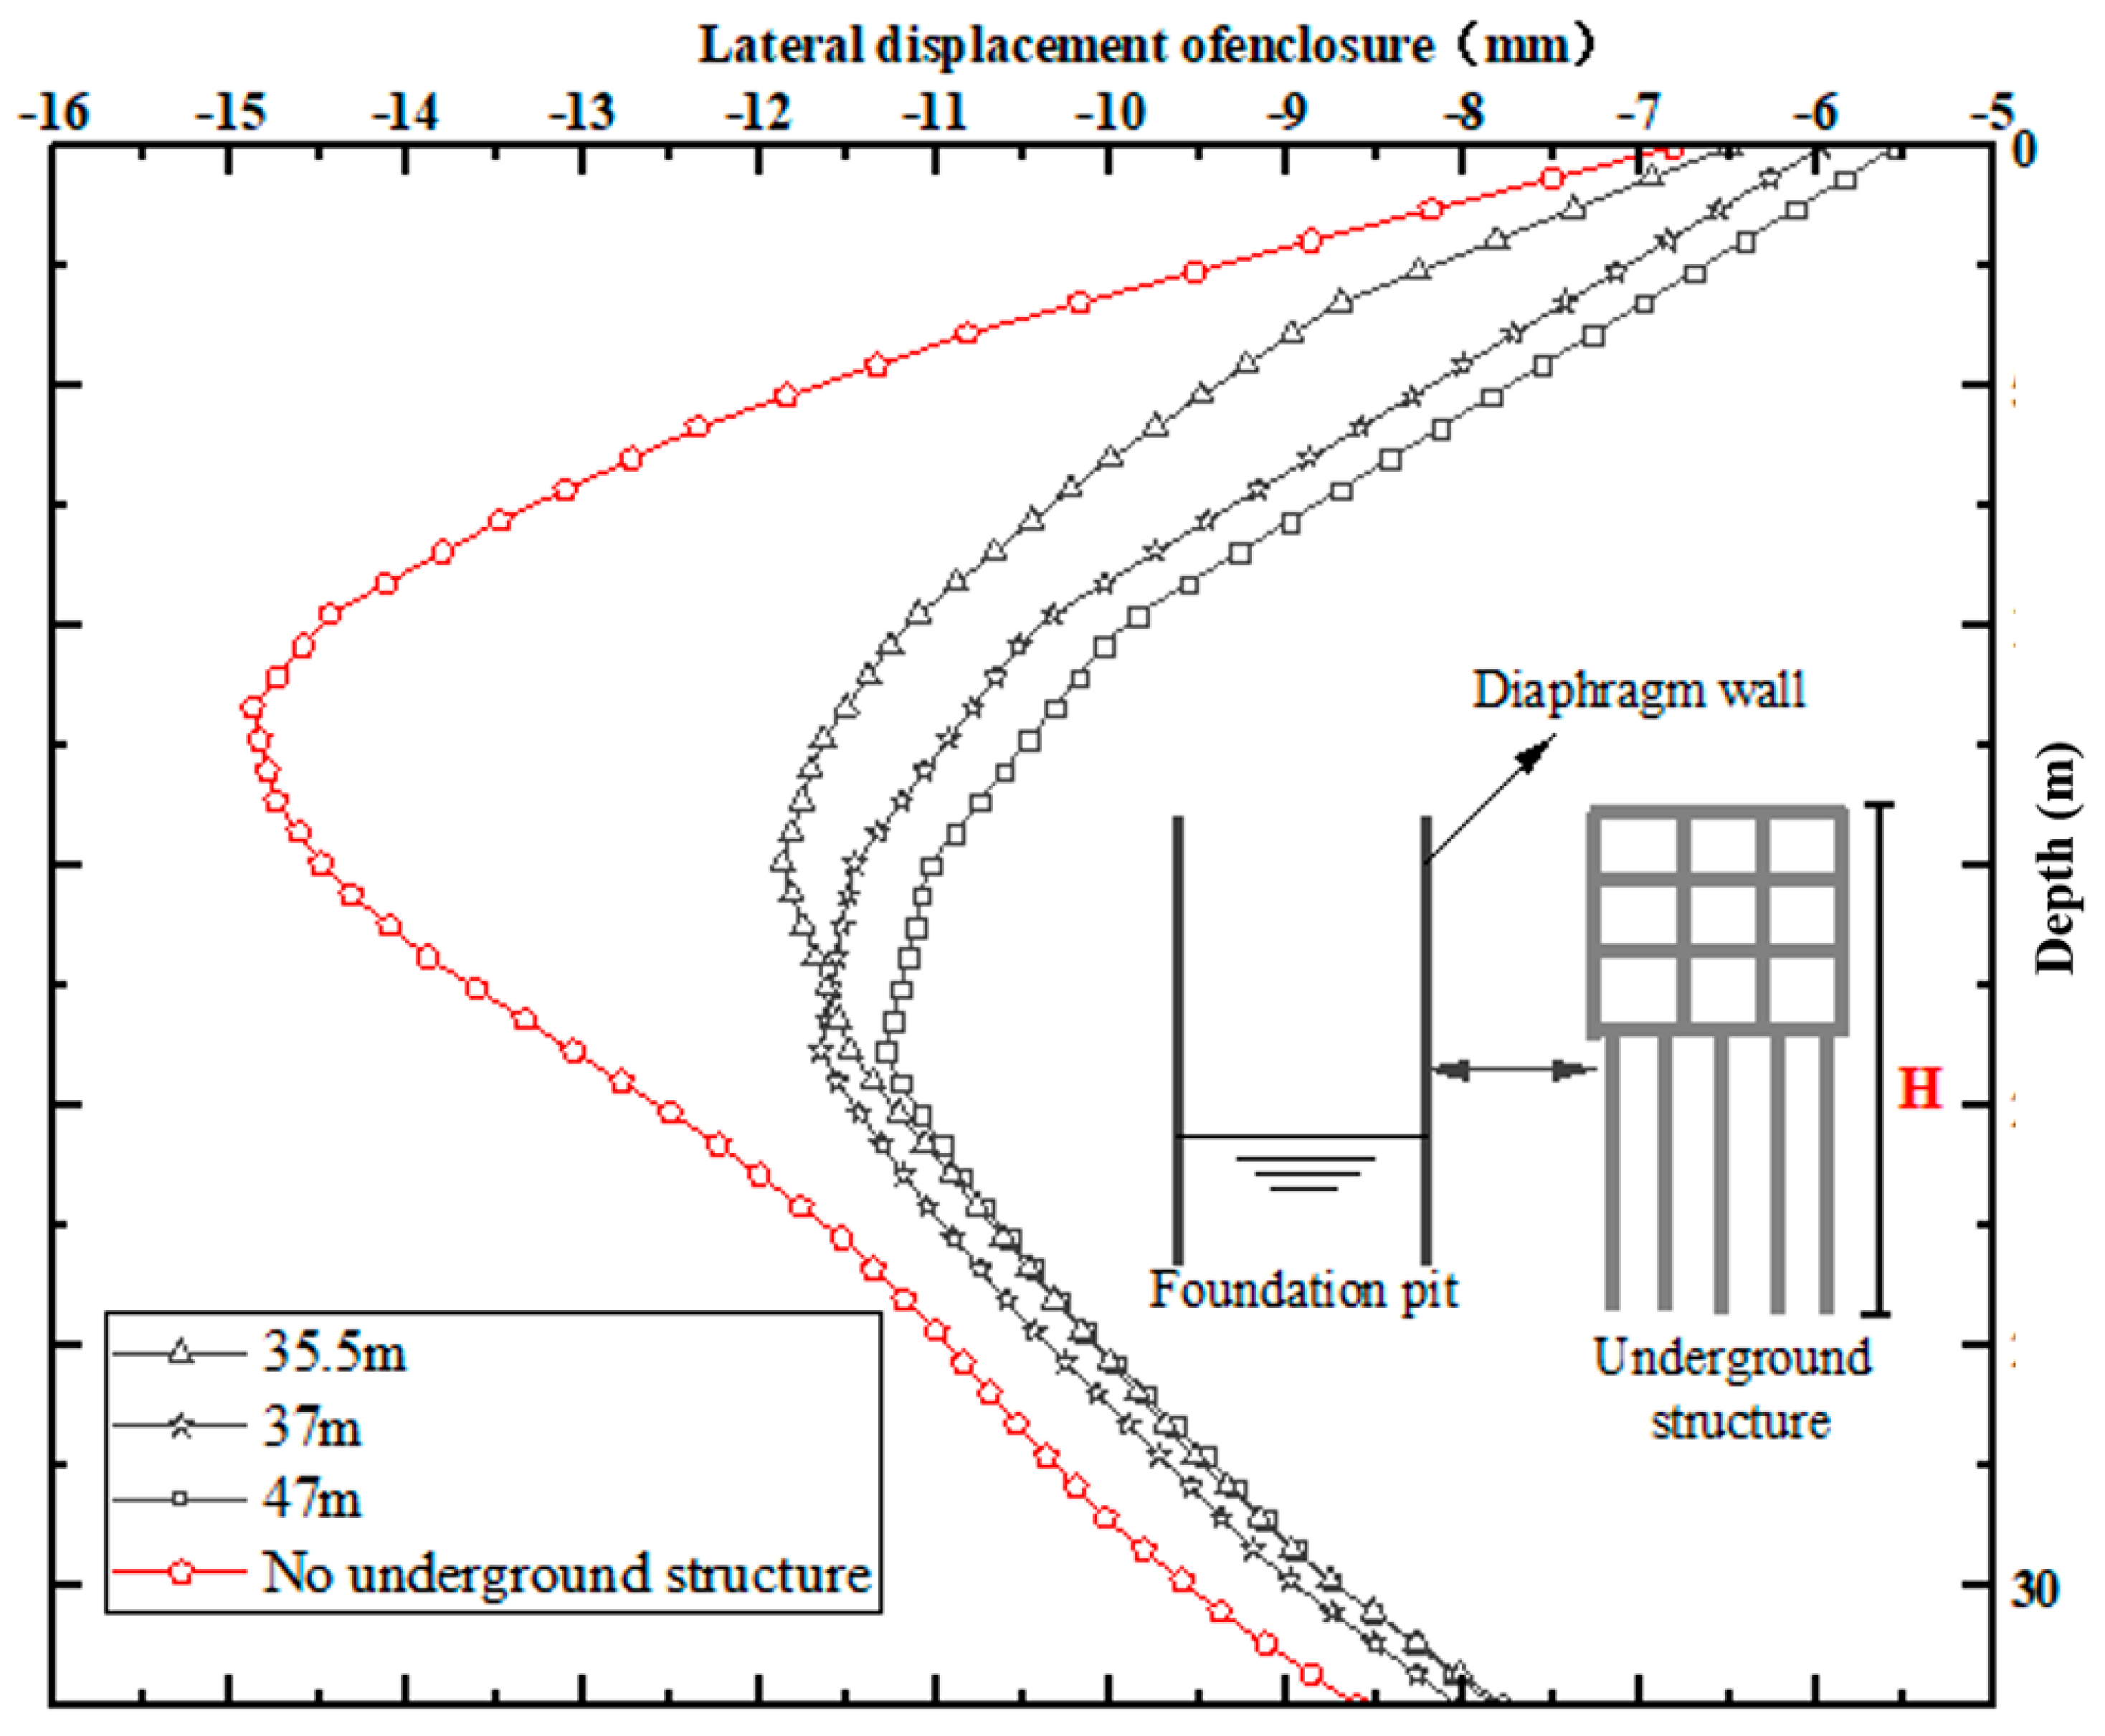
3.2.2. Lateral Displacement of Enclosure Structure
Using the condition with
D = 60 m for cases,
Figure 8 displays the distribution of the enclosure structure deflection. As to the condition with a pile foundation, the enclosure structure deflection is less obvious than that without a pile foundation. This is because the pile foundation as a barrier can block the movement of the soil behind it, thus possibly reducing the lateral pressure on the retaining structure. In addition, as
H increases, the maximum lateral displacement of the retaining wall becomes smaller. This is because the pile foundation as a barrier can block the movement of the soil behind it, and the soil-blocking effect would increase as
H increases, possibly reducing the stress on the retaining structure to a large extent.
3.2.3. Land Subsidence
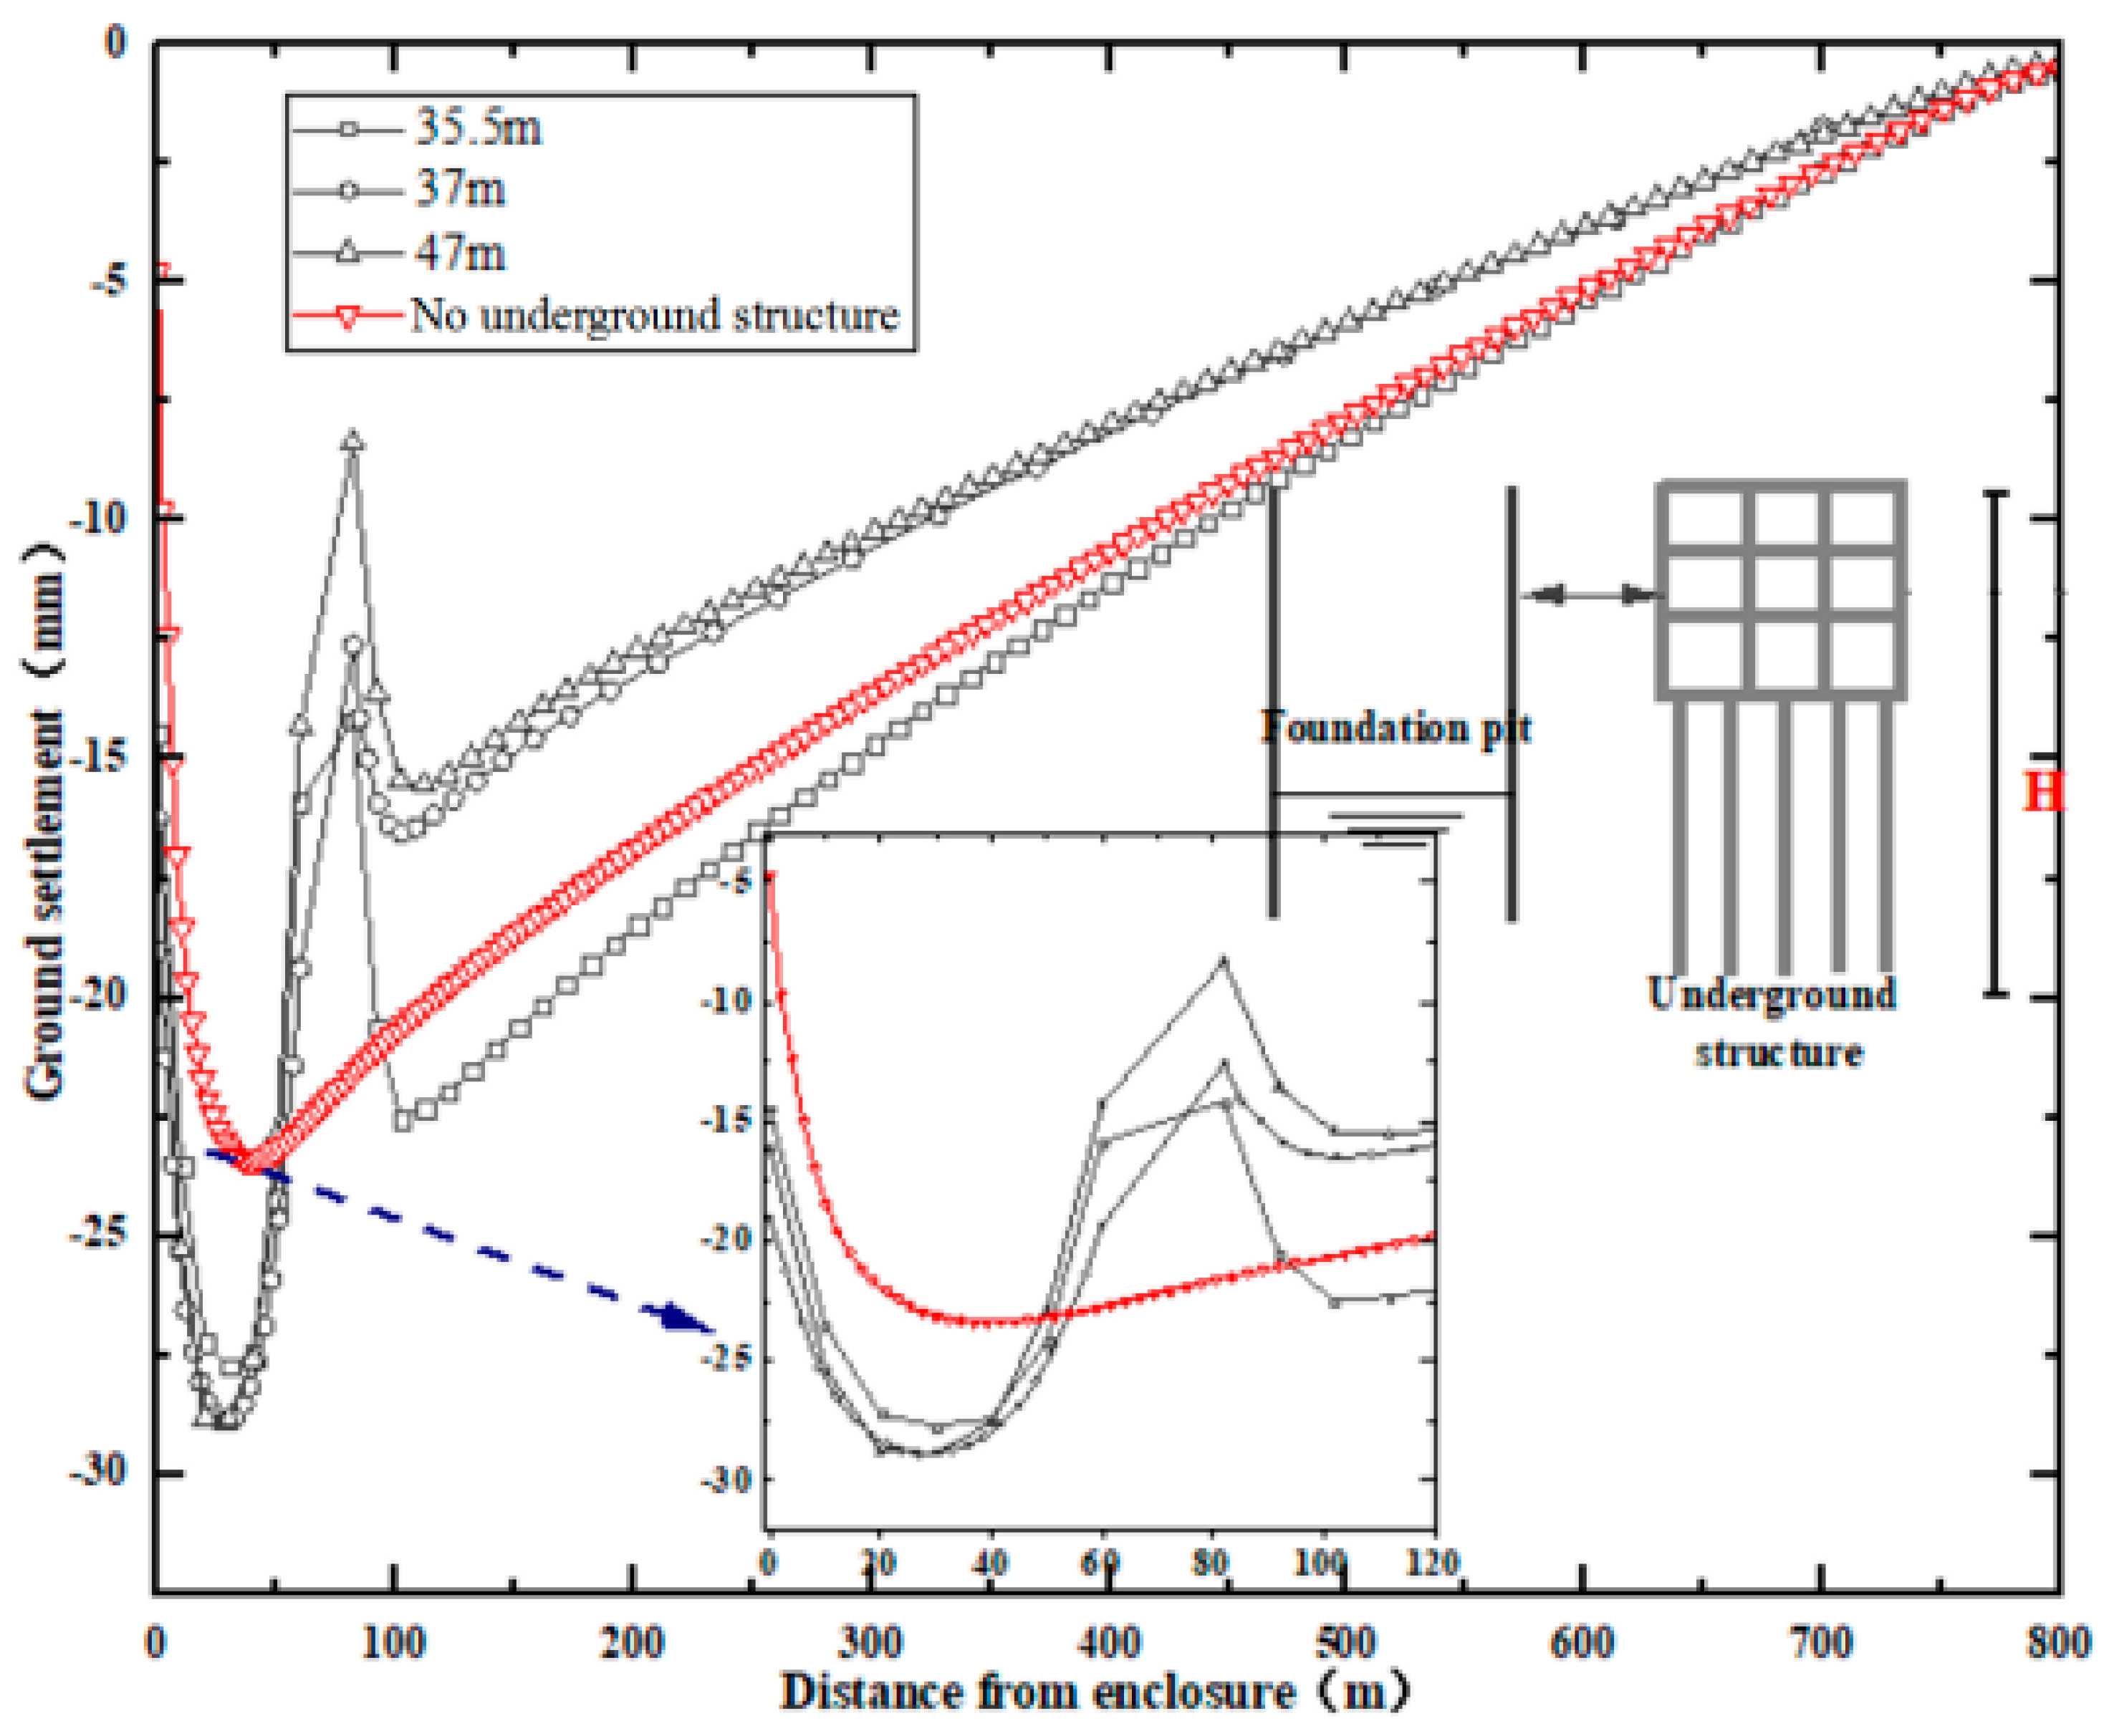
Using the condition
D = 60 m for cases,
Figure 9 shows the distribution of land subsidence with different
H. As to the section between the pit and the pile foundation condition, the ground settlement is greater than that without a pile foundation. As
H increases, the settlement in this section increases; however, after
H exceeds 35.5 m, the settlement outside the pit increases less and tends to be the same. This is because the blocking effect would be enhanced with the increase in
H, while the water-blocking effect enlarged more obviously. When
H increases to a certain extent, the growth rate of both effects becomes small. As a result, the maximum land subsidence outside the pit tends to be the same.
In addition, for the section behind the pile foundation, the ground settlement is also caused by the pulling effect and the barrier effect of groundwater flow. When H is small (e.g., H = 35.5 m), the settlement is larger than that without a pile foundation. This is because the pulling effect is strong when H is small, causing the increase in ground settlement behind the station compared to the case without a pile foundation adjacent to the pit. As H increases, the settlement increases continuously, and is greater than that without a pile foundation.
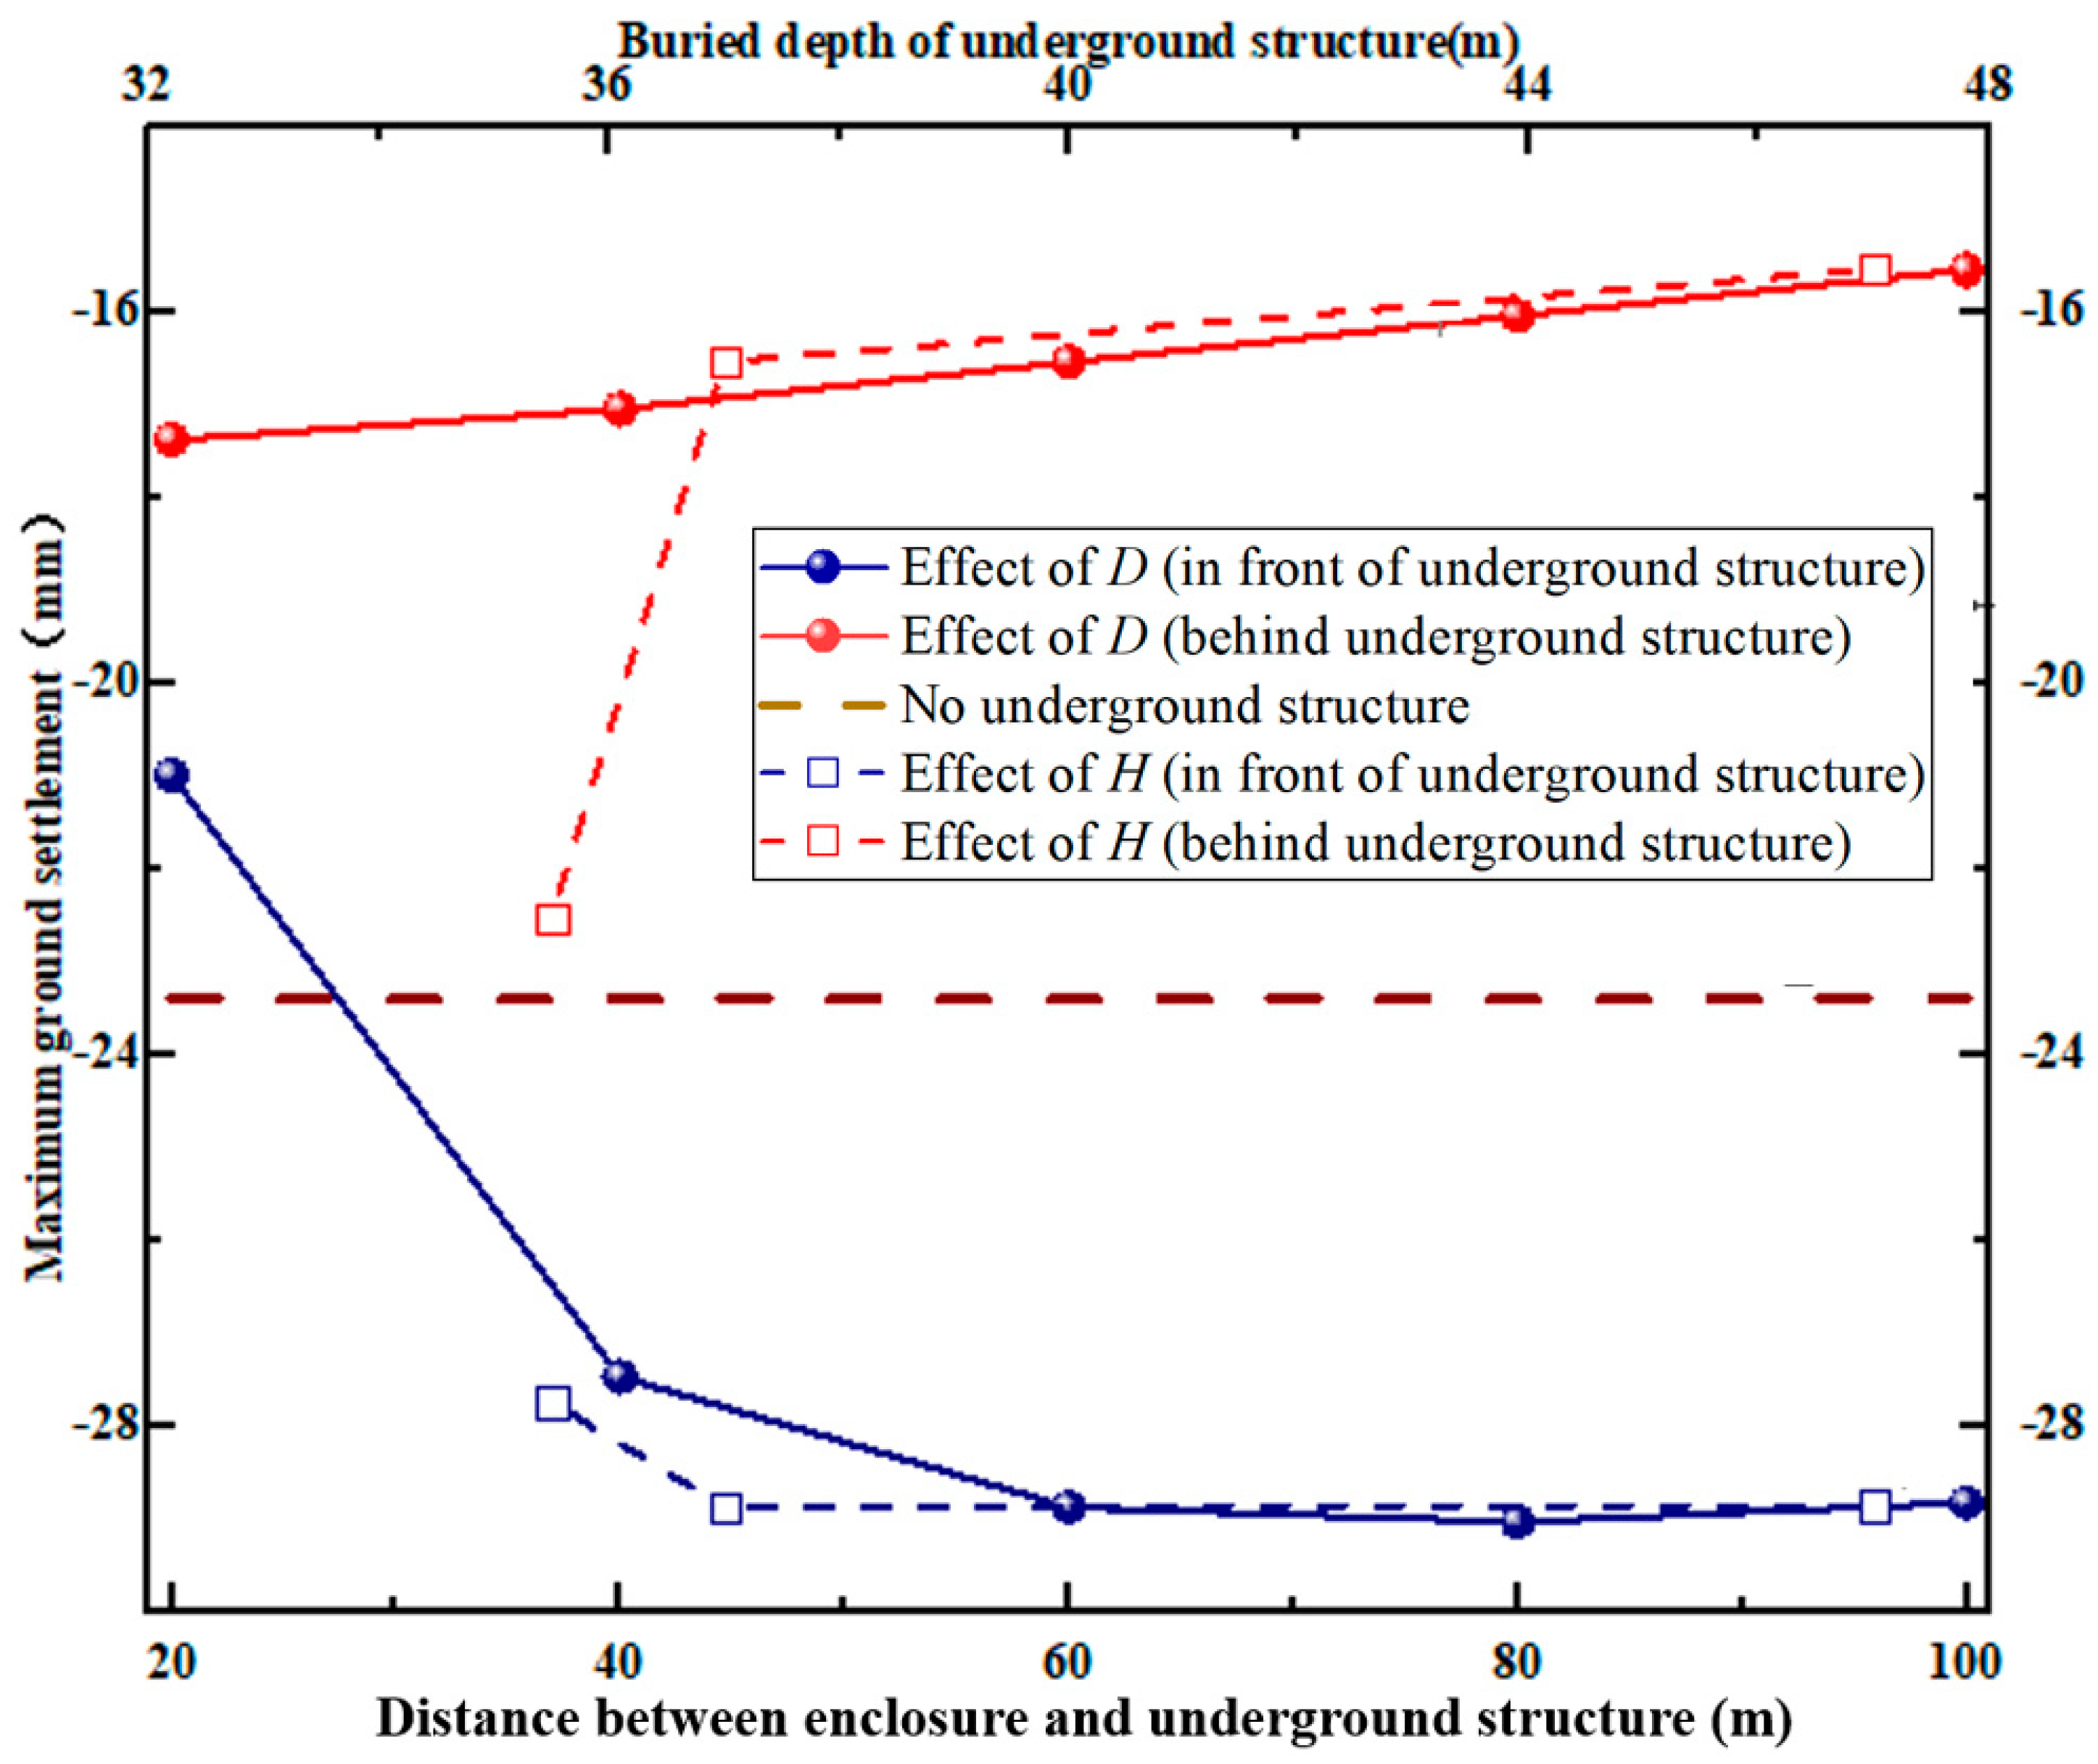
3.3. Combined Effects of D and H on Maximum Drawdown and Deformation
Figure 10 shows the relationships among
D,
H and maximum land subsidence on the sides of the pile foundation. The maximum land subsidence between the foundation pit and the pile foundation is greater than that without a pile foundation (except
D = 20 m), while for the section behind the pile foundation, the maximum land subsidence is smaller than that without a pile foundation. When
D changes from 100 m to 20 m, the maximum land subsidence between the excavation and the pile foundation decreases by 28%, and the settlement behind the pile foundation decreases by 11%. When
H changes from 35.5 m to 47 m, only 3% of the maximum settlement between the excavation and the pile foundation is reduced, while 31% of the maximum settlement behind the pile foundation is reduced. As a result,
D has a great influence on the land subsidence between the pit and the pile foundation, while
H has a great influence on the subsidence behind the excavation.
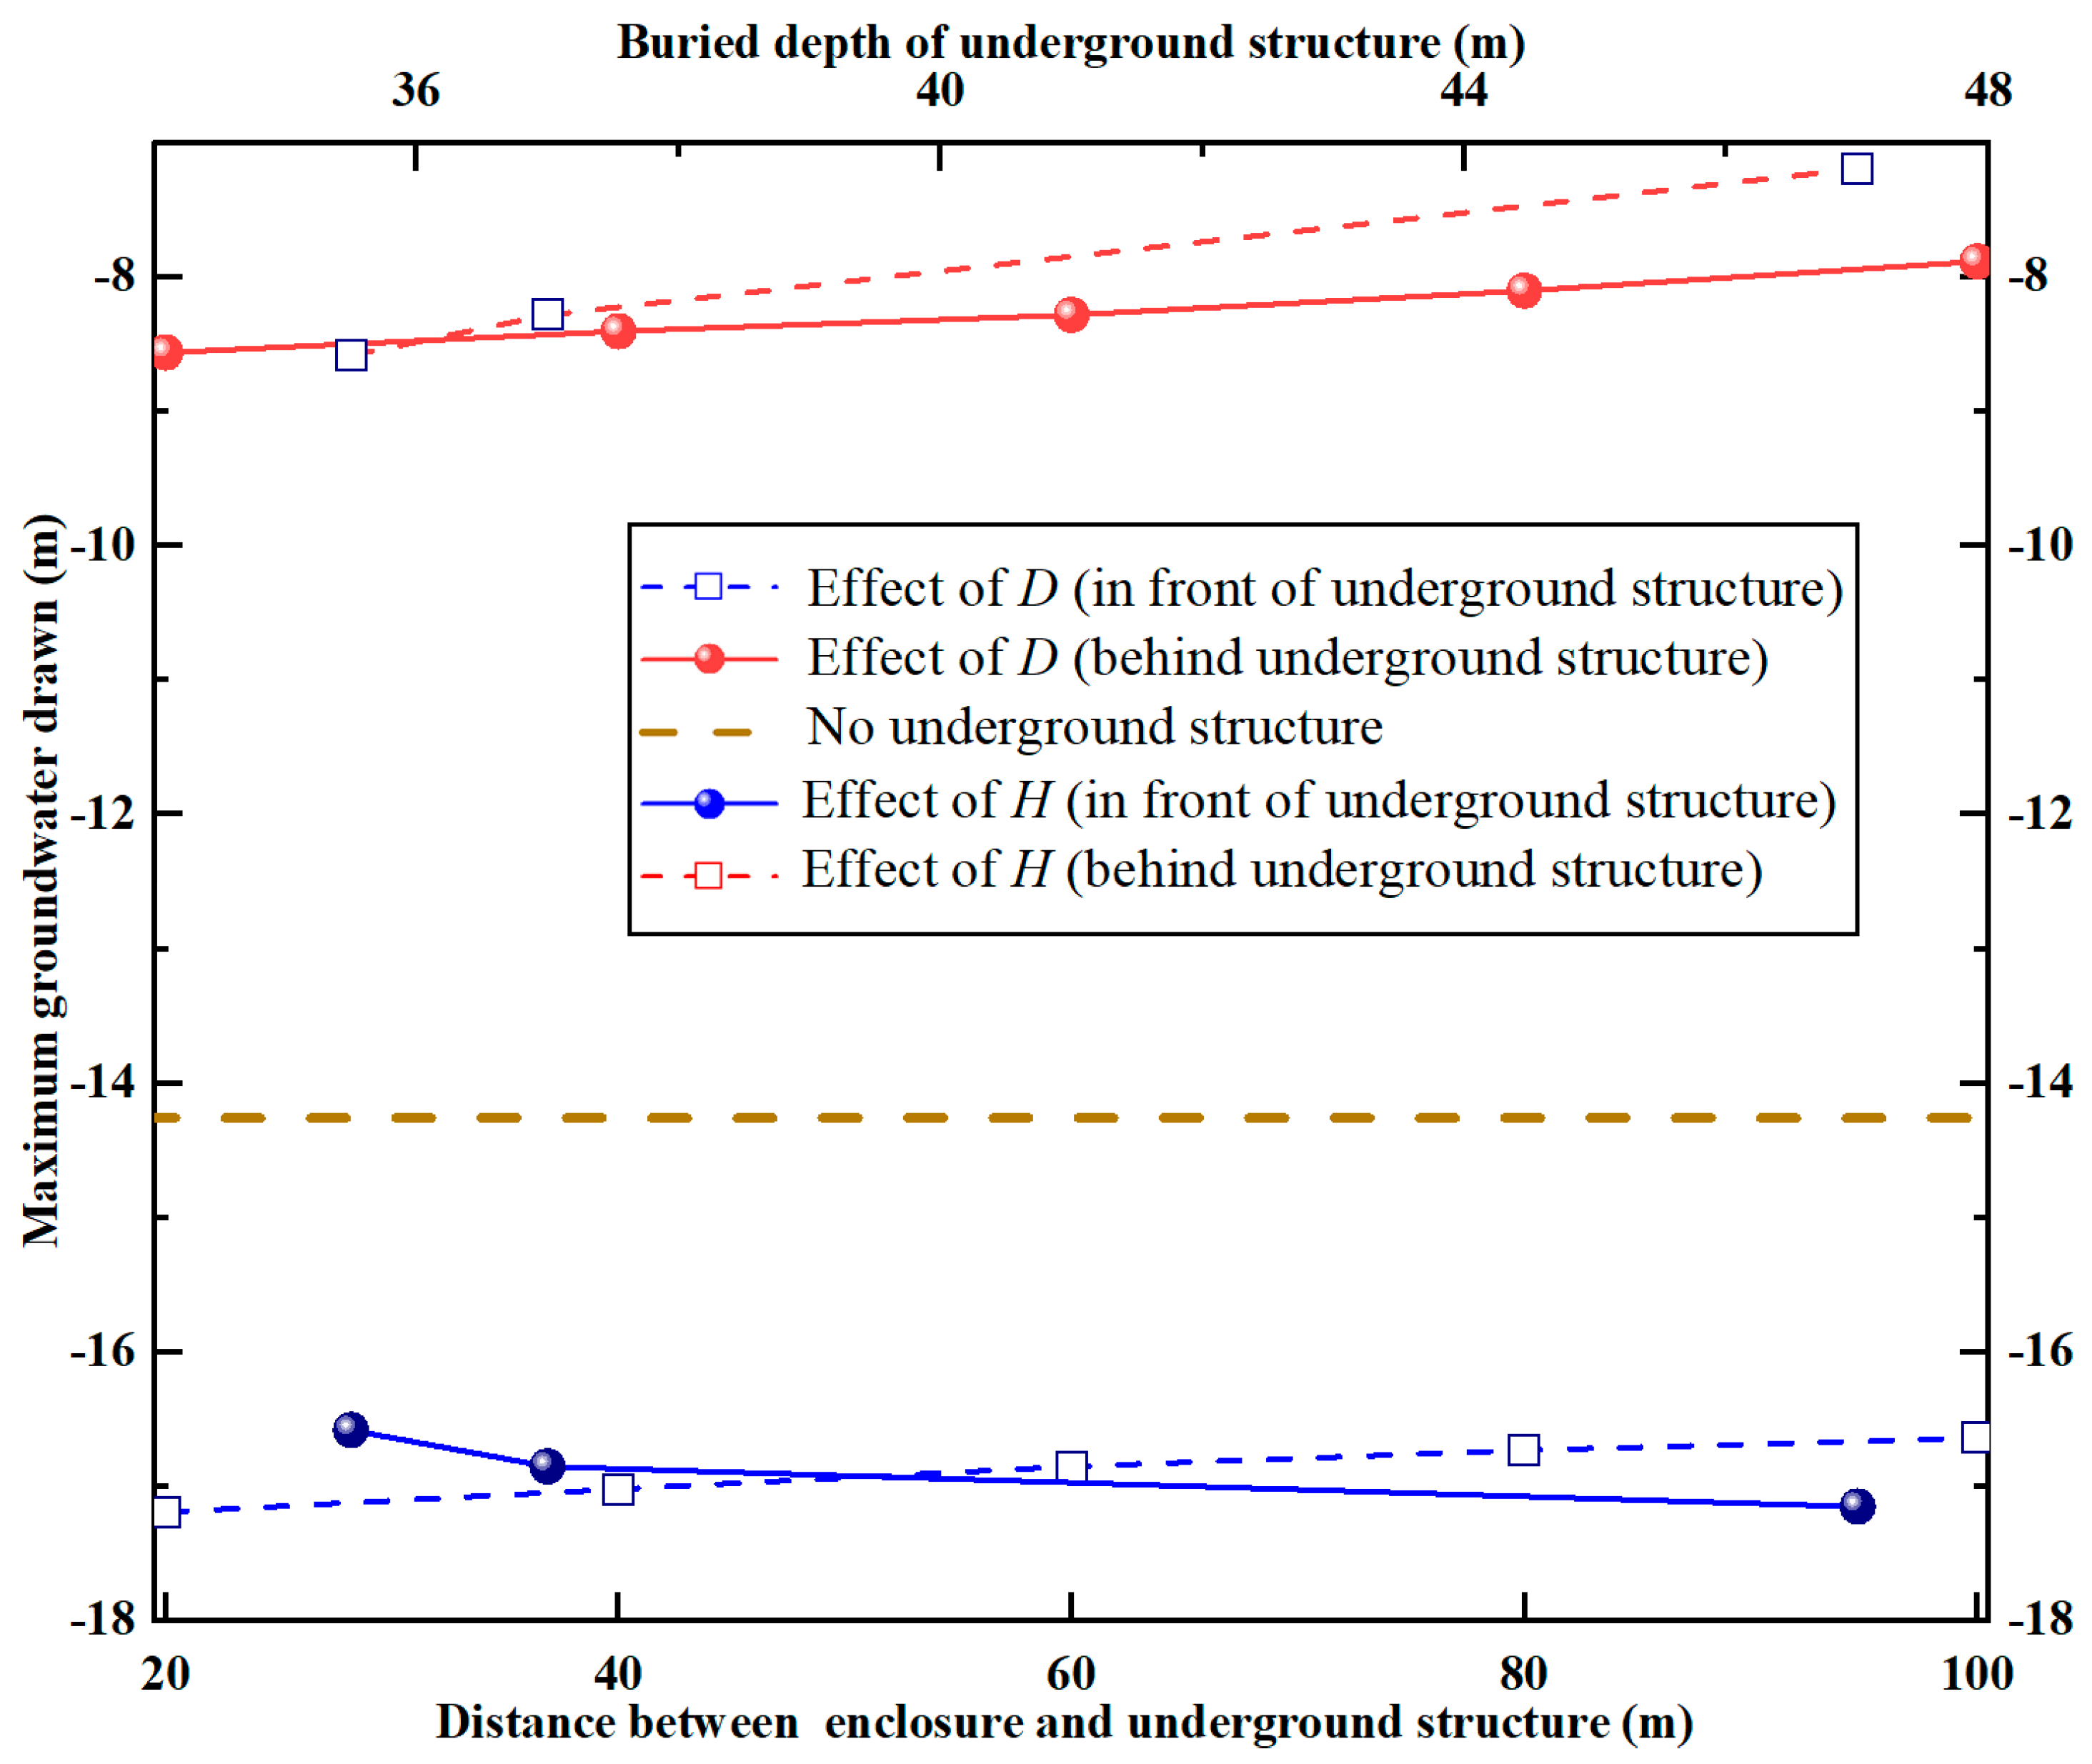
Figure 11 shows the relationships among the
D,
H and the maximum groundwater drawdown. As to the condition with a pile foundation, the maximum water level decline in front of the metro station is larger than the case without a pile foundation. Meanwhile, for the section behind the pile foundation, the maximum groundwater drawdown is smaller than is the case without a pile foundation. When
D changes from 20 m to 100 m, the maximum groundwater drawdown between the foundation pit and the pile foundation changed by 3%, while a 10% change was found behind the pile foundation. When
H changes from 35.5 m to 47 m, the maximum water level decline between the excavation and the pile foundation changed by 3%, while a 16% change was found behind the pile foundation. As a result, the effect of
D and
H on water level decline is basically close.
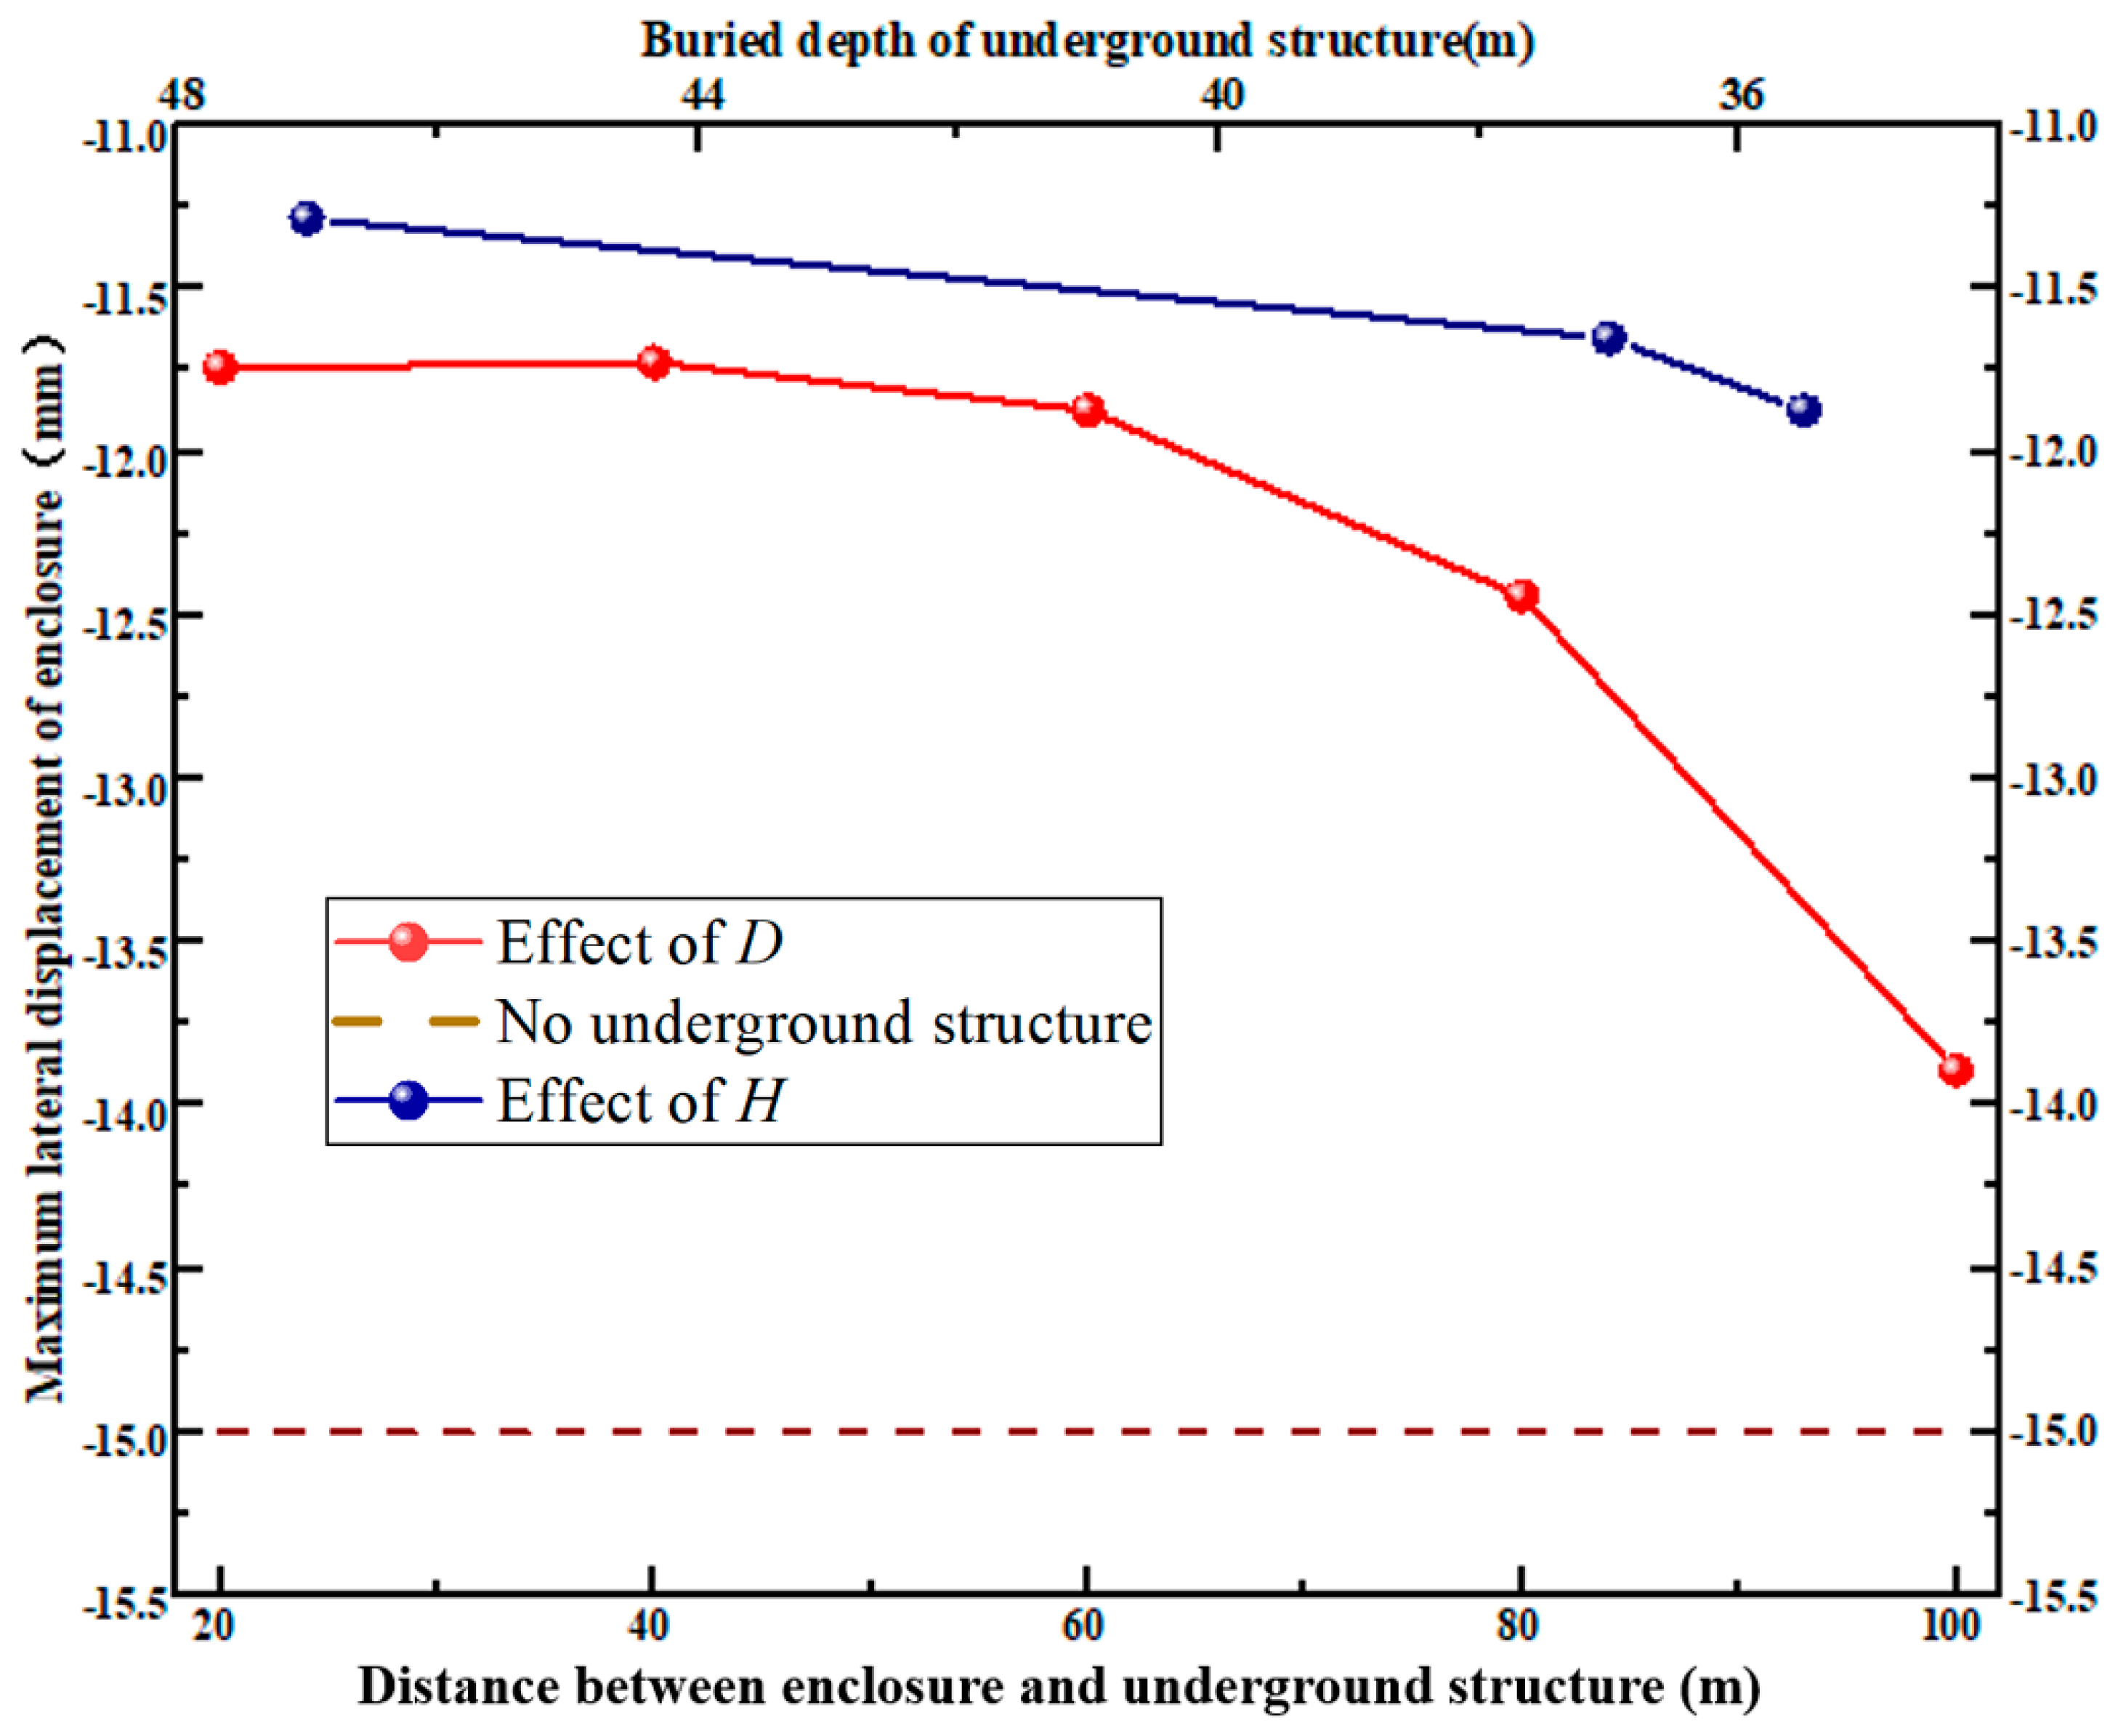
Figure 12 shows the relationships among the
D,
H and the maximum wall deflection. As to the condition with a pile foundation adjacent to the pit, the maximum enclosure structure deflection is smaller (compared to no pile foundation). The maximum enclosure structure deflection is reduced by 15% when
D varies from 100 m to 20 m; however, when
H varies from 35.5 m to 47 m, the maximum enclosure structure deflection is only reduced by 5%, indicating that
D may have a great effect on the enclosure structure deflection.
4. Discussion
This study used a two-dimensional model to investigate the barrier effect of pre-existing adjacent pile foundations. Compared with the three-dimensional model, the two-dimensional model has certain limitations which would enhance the barrier effect by completely blocking the flow of groundwater to the pit within the buried depth of the pile foundation. As a result, the equivalent permeability coefficient is used in both directions in this study. In the actual project, however, the pile foundation was a three-dimensional structure, and the groundwater seepage around the pile foundation would show a three-dimensional effect. As the permeability coefficient could be different in all directions, this assumption has some limitations. A complex three-dimensional numerical simulation of this issue should be conducted in the future.
5. Conclusions
In this paper, a finite element model numerical model was established to study the characteristics of groundwater flow and land movement induced by dewatering and excavation considering the blocking effect of pre-existing adjacent pile foundations. The main conclusions that we obtained are outlined below:
(1) Pre-existing underground structures have different effects on the groundwater flow and excavation deformation. Generally, the maximum groundwater drawdown could be enlarged by considering adjacent underground structures, while the retaining structure deflection would be reduced and the ground settlement could be either enlarged or reduced;
(2) As D decreases and H increases, a much greater groundwater drawdown and a much smaller retaining structure deflection appear, which together affect the ground behavior. On the one hand, greater groundwater drawdown leads to greater ground settlement by soil consolidation; on the other hand, smaller retaining structure deflection would lead to less ground settlement, and thus a complex development of ground settlement would appear. A specific analysis should be performed to assess that this is based in practice on a specific H and D;
(3) Generally, the influence of D and H on water level decline is basically close. D has a great effect on the ground settlement between the excavation and the underground structure as well as the wall deflection, while H has a great effect on the ground settlement behind the building basement.
Author Contributions
Methodology, T.X. and S.L. (Sichun Long); software, T.X. and C.Z.; validation, T.X., C.Z., X.X. and S.L. (Sichun Long); formal analysis, T.X.; writing—original draft preparation, X.X. and Q.C.; writing—review and editing, T.X. and C.Z.; resources, S.L. (Shide Lu). All authors have read and agreed to the published version of the manuscript.
Funding
This work was supported by the Research Foundation of Education Bureau of Hunan Province (grant number 22C0946), the National Natural Science Foundation of China (grant numbers 51978261 and 41877283), the Natural Science Foundation of Hunan Province (grant number 2022JJ20023) and the Science and Technology Innovation Program of Hunan Province (grant numbers 2022RC1172 and 2021RC4037).
Institutional Review Board Statement
Not applicable.
Informed Consent Statement
Not applicable.
Data Availability Statement
Data available on request due to privacy restrictions.
Conflicts of Interest
The authors declare no conflict of interest.
References
- Taheri, K.; Gutiérrez, F.; Mohseni, H.; Raeisi, E.; Taheri, M. Sinkhole susceptibility mapping using the analytical hierarchy process (AHP) and magnitude–frequency relationships: A case study in Hamadan province, Iran. Geomorphology 2015, 234, 64–79. [Google Scholar] [CrossRef]
- Zeng, C.F.; Zheng, G.; Xue, X.L.; Mei, G.X. Combined recharge: A method to prevent ground settlement induced by redevelopment of recharge wells. J. Hydrol. 2019, 568, 1–11. [Google Scholar] [CrossRef]
- Taheri, K.; Taheri, M.; Parise, M. Impact of intensive groundwater exploitation on an unprotected covered karst aquifer: A case study in Kermanshah Province, western Iran. Environ. Earth Sci. 2016, 75, 1221. [Google Scholar] [CrossRef]
- Li, M.-G.; Demeijer, O.; Chen, J.-J. Effectiveness of servo struts in controlling excavation-induced wall deflection and ground settlement. Acta Geotech. 2020, 15, 2575–2590. [Google Scholar] [CrossRef]
- Tan, Y.; Lu, Y.; Wang, D. Deep Excavation of the Gate of the Orient in Suzhou Stiff Clay: Composite Earth-Retaining Systems and Dewatering Plans. J. Geotech. Geoenviron. Eng. 2018, 144, 05017009. [Google Scholar] [CrossRef]
- Zeng, C.-F.; Wang, S.; Xue, X.-L.; Zheng, G.; Mei, G.-X. Characteristics of ground settlement due to combined actions of groundwater drawdown and enclosure wall movement. Acta Geotech. 2022, 17, 4095–4112. [Google Scholar] [CrossRef]
- Shen, S.-L.; Lyu, H.-M.; Zhou, A.; Lu, L.-H.; Li, G.; Hu, B.-B. Automatic control of groundwater balance to combat dewatering during construction of a metro system. Autom. Constr. 2021, 123, 103536. [Google Scholar] [CrossRef]
- Ha, D.; Zheng, G.; Zhou, H.; Zeng, C.; Zhang, H. Estimation of hydraulic parameters from pumping tests in a multiaquifer system. Undergr. Space 2020, 5, 210–222. [Google Scholar] [CrossRef]
- Wang, T.; Zeng, C.; Ruan, Z.; Wu, Z.; Mei, G. Shaking table test and numerical research on seismic response of a CFST arch bridge for different soil grounds. Transp. Geotech. 2022, 36, 100822. [Google Scholar] [CrossRef]
- Wu, H.-N.; Shen, S.-L.; Chen, R.-P.; Zhou, A. Three-dimensional numerical modelling on localised leakage in segmental lining of shield tunnels. Comput. Geotech. 2020, 122, 103549. [Google Scholar] [CrossRef]
- Liang, R.; Wu, W.; Yu, F.; Jiang, G.; Liu, J. Simplified method for evaluating shield tunnel deformation due to adjacent excavation. Tunn. Undergr. Space Technol. 2018, 71, 94–105. [Google Scholar] [CrossRef]
- Finno, R.J.; Kim, S.; Lewis, J.; Van Winkle, N. Observed Performance of a Sheetpile-Supported Excavation in Chicago Clays. J. Geotech. Geoenviron. Eng. 2019, 145, 05018005. [Google Scholar] [CrossRef]
- Zeng, C.-F.; Xue, X.-L.; Li, M.-K. Use of cross wall to restrict enclosure movement during dewatering inside a metro pit before soil excavation. Tunn. Undergr. Space Technol. 2021, 112, 103909. [Google Scholar] [CrossRef]
- Zheng, G.; Ha, D.; Zeng, C.; Cheng, X.; Zhou, H.; Cao, J. Influence of the opening timing of recharge wells on settlement caused by dewatering in excavations. J. Hydrol. 2019, 573, 534–545. [Google Scholar] [CrossRef]
- Zheng, G.; Yang, P.; Zhou, H.; Zeng, C.; Yang, X.; He, X.; Yu, X. Evaluation of the earthquake induced uplift displacement of tunnels using multivariate adaptive regression splines. Comput. Geotech. 2019, 113, 103099. [Google Scholar] [CrossRef]
- Zheng, G.; Dai, X.; Diao, Y.; Zeng, C.-F. Experimental and simplified model study of the development of ground settlement under hazards induced by loss of groundwater and sand. Nat. Hazards 2016, 82, 1869–1893. [Google Scholar] [CrossRef]
- Zeng, C.-F.; Song, W.-W.; Xue, X.-L.; Li, M.-K.; Bai, N.; Mei, G.-X. Construction dewatering in a metro station incorporating buttress retaining wall to limit ground settlement: Insights from experimental modelling. Tunn. Undergr. Space Technol. 2021, 116, 104124. [Google Scholar] [CrossRef]
- Tan, Y.; Zhu, H.; Peng, F.; Karlsrud, K.; Wei, B. Characterization of semi-top-down excavation for subway station in Shanghai soft ground. Tunn. Undergr. Space Technol. 2017, 68, 244–261. [Google Scholar] [CrossRef]
- Goh, A.T.C.; Zhang, R.H.; Wang, W.; Wang, L.; Liu, H.L.; Zhang, W.G. Numerical study of the effects of groundwater drawdown on ground settlement for excavation in residual soils. Acta Geotech. 2020, 15, 1259–1272. [Google Scholar] [CrossRef]
- Nejjar, K.; Dias, D.; Cuira, F.; Chapron, G.; Lebissonnais, H. Experimental study of the performance of a 32 m deep excavation in the suburbs of Paris. Géotechnique 2021, 1–11, Ahead of Print. [Google Scholar] [CrossRef]
- Lyu, H.-M.; Shen, S.-L.; Wu, Y.-X.; Zhou, A.-N. Calculation of groundwater head distribution with a close barrier during excavation dewatering in confined aquifer. Geosci. Front. 2021, 12, 791–803. [Google Scholar] [CrossRef]
- Zeng, C.-F.; Powrie, W.; Xue, X.-L.; Li, M.-K.; Mei, G.-X. Effectiveness of a buttress wall in reducing retaining wall movement during dewatering before bulk excavation. Acta Geotech. 2021, 16, 3253–3267. [Google Scholar] [CrossRef]
- Wu, Y.-X.; Lyu, H.-M.; Han, J.; Shen, S.-L. Dewatering-Induced Building Settlement around a Deep Excavation in Soft Deposit in Tianjin, China. J. Geotech. Geoenviron. Eng. 2019, 145, 05019003. [Google Scholar] [CrossRef]
- Xu, Y.-S.; Yan, X.-X.; Shen, S.-L.; Zhou, A.-N. Experimental investigation on the blocking of groundwater seepage from a waterproof curtain during pumped dewatering in an excavation. Hydrogeol. J. 2019, 27, 2659–2672. [Google Scholar] [CrossRef]
- Zeng, C.-F.; Wang, S.; Xue, X.-L.; Zheng, G.; Mei, G.-X. Evolution of deep ground settlement subject to groundwater drawdown during dewatering in a multi-layered aquifer-aquitard system: Insights from numerical modelling. J. Hydrol. 2021, 603, 127078. [Google Scholar] [CrossRef]
- Li, M.-G.; Chen, J.-J.; Xu, Y.-S.; Tong, D.-G.; Cao, W.-W.; Shi, Y.-J. Effects of groundwater exploitation and recharge on land subsidence and infrastructure settlement patterns in Shanghai. Eng. Geol. 2021, 282, 105995. [Google Scholar] [CrossRef]
- Zhang, W.; Zhang, R.; Wang, W.; Zhang, F.; Goh, A.T.C. A Multivariate Adaptive Regression Splines model for determining horizontal wall deflection envelope for braced excavations in clays. Tunn. Undergr. Space Technol. 2019, 84, 461–471. [Google Scholar] [CrossRef]
- Cao, J.; Li, Q.; Cheng, X.; Zheng, G.; Ha, D.; Zeng, C. Study on artificial recharge and well loss in confined aquifers using theoretical and back-analysis calculations of hydrogeological parameters from recharge and pumping tests. Bull. Eng. Geol. Environ. 2022, 81, 483. [Google Scholar] [CrossRef]
- Zheng, G.; Ha, D.; Loaiciga, H.; Zhou, H.; Zeng, C.; Zhang, H. Estimation of the hydraulic parameters of leaky aquifers based on pumping tests and coupled simulation/optimization: Verification using a layered aquifer in Tianjin, China. Hydrogeol. J. 2019, 27, 3081–3095. [Google Scholar] [CrossRef]
- Zeng, C.-F.; Zheng, G.; Xue, X.-L. Responses of deep soil layers to combined recharge in a leaky aquifer. Eng. Geol. 2019, 260, 105263. [Google Scholar]
- Houhou, M.N.; Emeriault, F.; Belounar, A. Three-dimensional numerical back-analysis of a monitored deep excavation retained by strutted diaphragm walls. Tunn. Undergr. Space Technol. 2019, 83, 153–164. [Google Scholar] [CrossRef]
- Tan, Y.; Wei, B. Observed Behaviors of a Long and Deep Excavation Constructed by Cut-and-Cover Technique in Shanghai Soft Clay. J. Geotech. Geoenviron. Eng. 2012, 138, 69–88. [Google Scholar] [CrossRef]
- Zeng, C.-F.; Xue, X.-L.; Zheng, G.; Xue, T.-Y.; Mei, G.-X. Responses of retaining wall and surrounding ground to pre-excavation dewatering in an alternated multi-aquifer-aquitard system. J. Hydrol. 2018, 559, 609–626. [Google Scholar] [CrossRef]
- Zeng, C.-F.; Zheng, G.; Zhou, X.-F.; Xue, X.-L.; Zhou, H.-Z. Behaviours of wall and soil during pre-excavation dewatering under different foundation pit widths. Comput. Geotech. 2019, 115, 103169. [Google Scholar] [CrossRef]
- Tan, Y.; Wang, D. Characteristics of a Large-Scale Deep Foundation Pit Excavated by the Central-Island Technique in Shanghai Soft Clay. I: Bottom-Up Construction of the Central Cylindrical Shaft. J. Geotech. Geoenviron. Eng. 2013, 139, 1875–1893. [Google Scholar] [CrossRef]
- Hsieh, P.G.; Ou, C.Y. Shape of ground surface settlement profiles caused by excavation. Can. Geotech. J. 1998, 35, 1004–1017. [Google Scholar] [CrossRef]
- De Caro, M.; Crosta, G.B.; Previati, A. Modelling the interference of underground structures with groundwater flow and remedial solutions in Milan. Eng. Geol. 2020, 272, 105652. [Google Scholar] [CrossRef]
- Pujades, E.; López, A.; Carrera, J.; Vázquez-Suñé, E.; Jurado, A. Barrier effect of underground structures on aquifers. Eng. Geol. 2012, 145–146, 41–49. [Google Scholar] [CrossRef]
- Zeng, C.-F.; Liao, H.; Xue, X.-L.; Long, S.-C.; Luo, G.-J.; Diao, Y.; Li, M.-G. Responses of groundwater and soil to dewatering considering the barrier effect of adjacent metro station on multi-aquifers. J. Hydrol. 2022, 612, 128117. [Google Scholar] [CrossRef]
- Liao, S.-M.; Wei, S.-F.; Shen, S.-L. Structural Responses of Existing Metro Stations to Adjacent Deep Excavations in Suzhou, China. J. Perform. Constr. Facil. 2016, 30, 04015089. [Google Scholar] [CrossRef]
- Xu, Y.-S.; Shen, S.-L.; Ma, L.; Sun, W.-J.; Yin, Z.-Y. Evaluation of the blocking effect of retaining walls on groundwater seepage in aquifers with different insertion depths. Eng. Geol. 2014, 183, 254–264. [Google Scholar] [CrossRef]
- Yuan, Y.; Xu, Y.-S.; Shen, J.S.; Wang, B.Z.-F. Hydraulic conductivity estimation by considering the existence of piles: A case study. Geomech. Eng. 2018, 14, 467–477. [Google Scholar]
- Ge, M. Study on Deformation Law and Influencing Factors of Foundation Pit Excavation in Soft Soil Area of Tianjin; Beijing Jiaotong University: Beijing, China, 2016. [Google Scholar]
| Disclaimer/Publisher’s Note: The statements, opinions and data contained in all publications are solely those of the individual author(s) and contributor(s) and not of MDPI and/or the editor(s). MDPI and/or the editor(s) disclaim responsibility for any injury to people or property resulting from any ideas, methods, instructions or products referred to in the content. |
© 2023 by the authors. Licensee MDPI, Basel, Switzerland. This article is an open access article distributed under the terms and conditions of the Creative Commons Attribution (CC BY) license (https://creativecommons.org/licenses/by/4.0/).


