

Agricultural Pressures on the Quality of Ground and Surface Waters in Catchments of Artificial Reservoirs


Abstract
:1. Introduction
2. Materials and Methods
2.1. Surface Waters
2.2. Groundwater
2.3. Catchments
2.4. Statistical Analyses
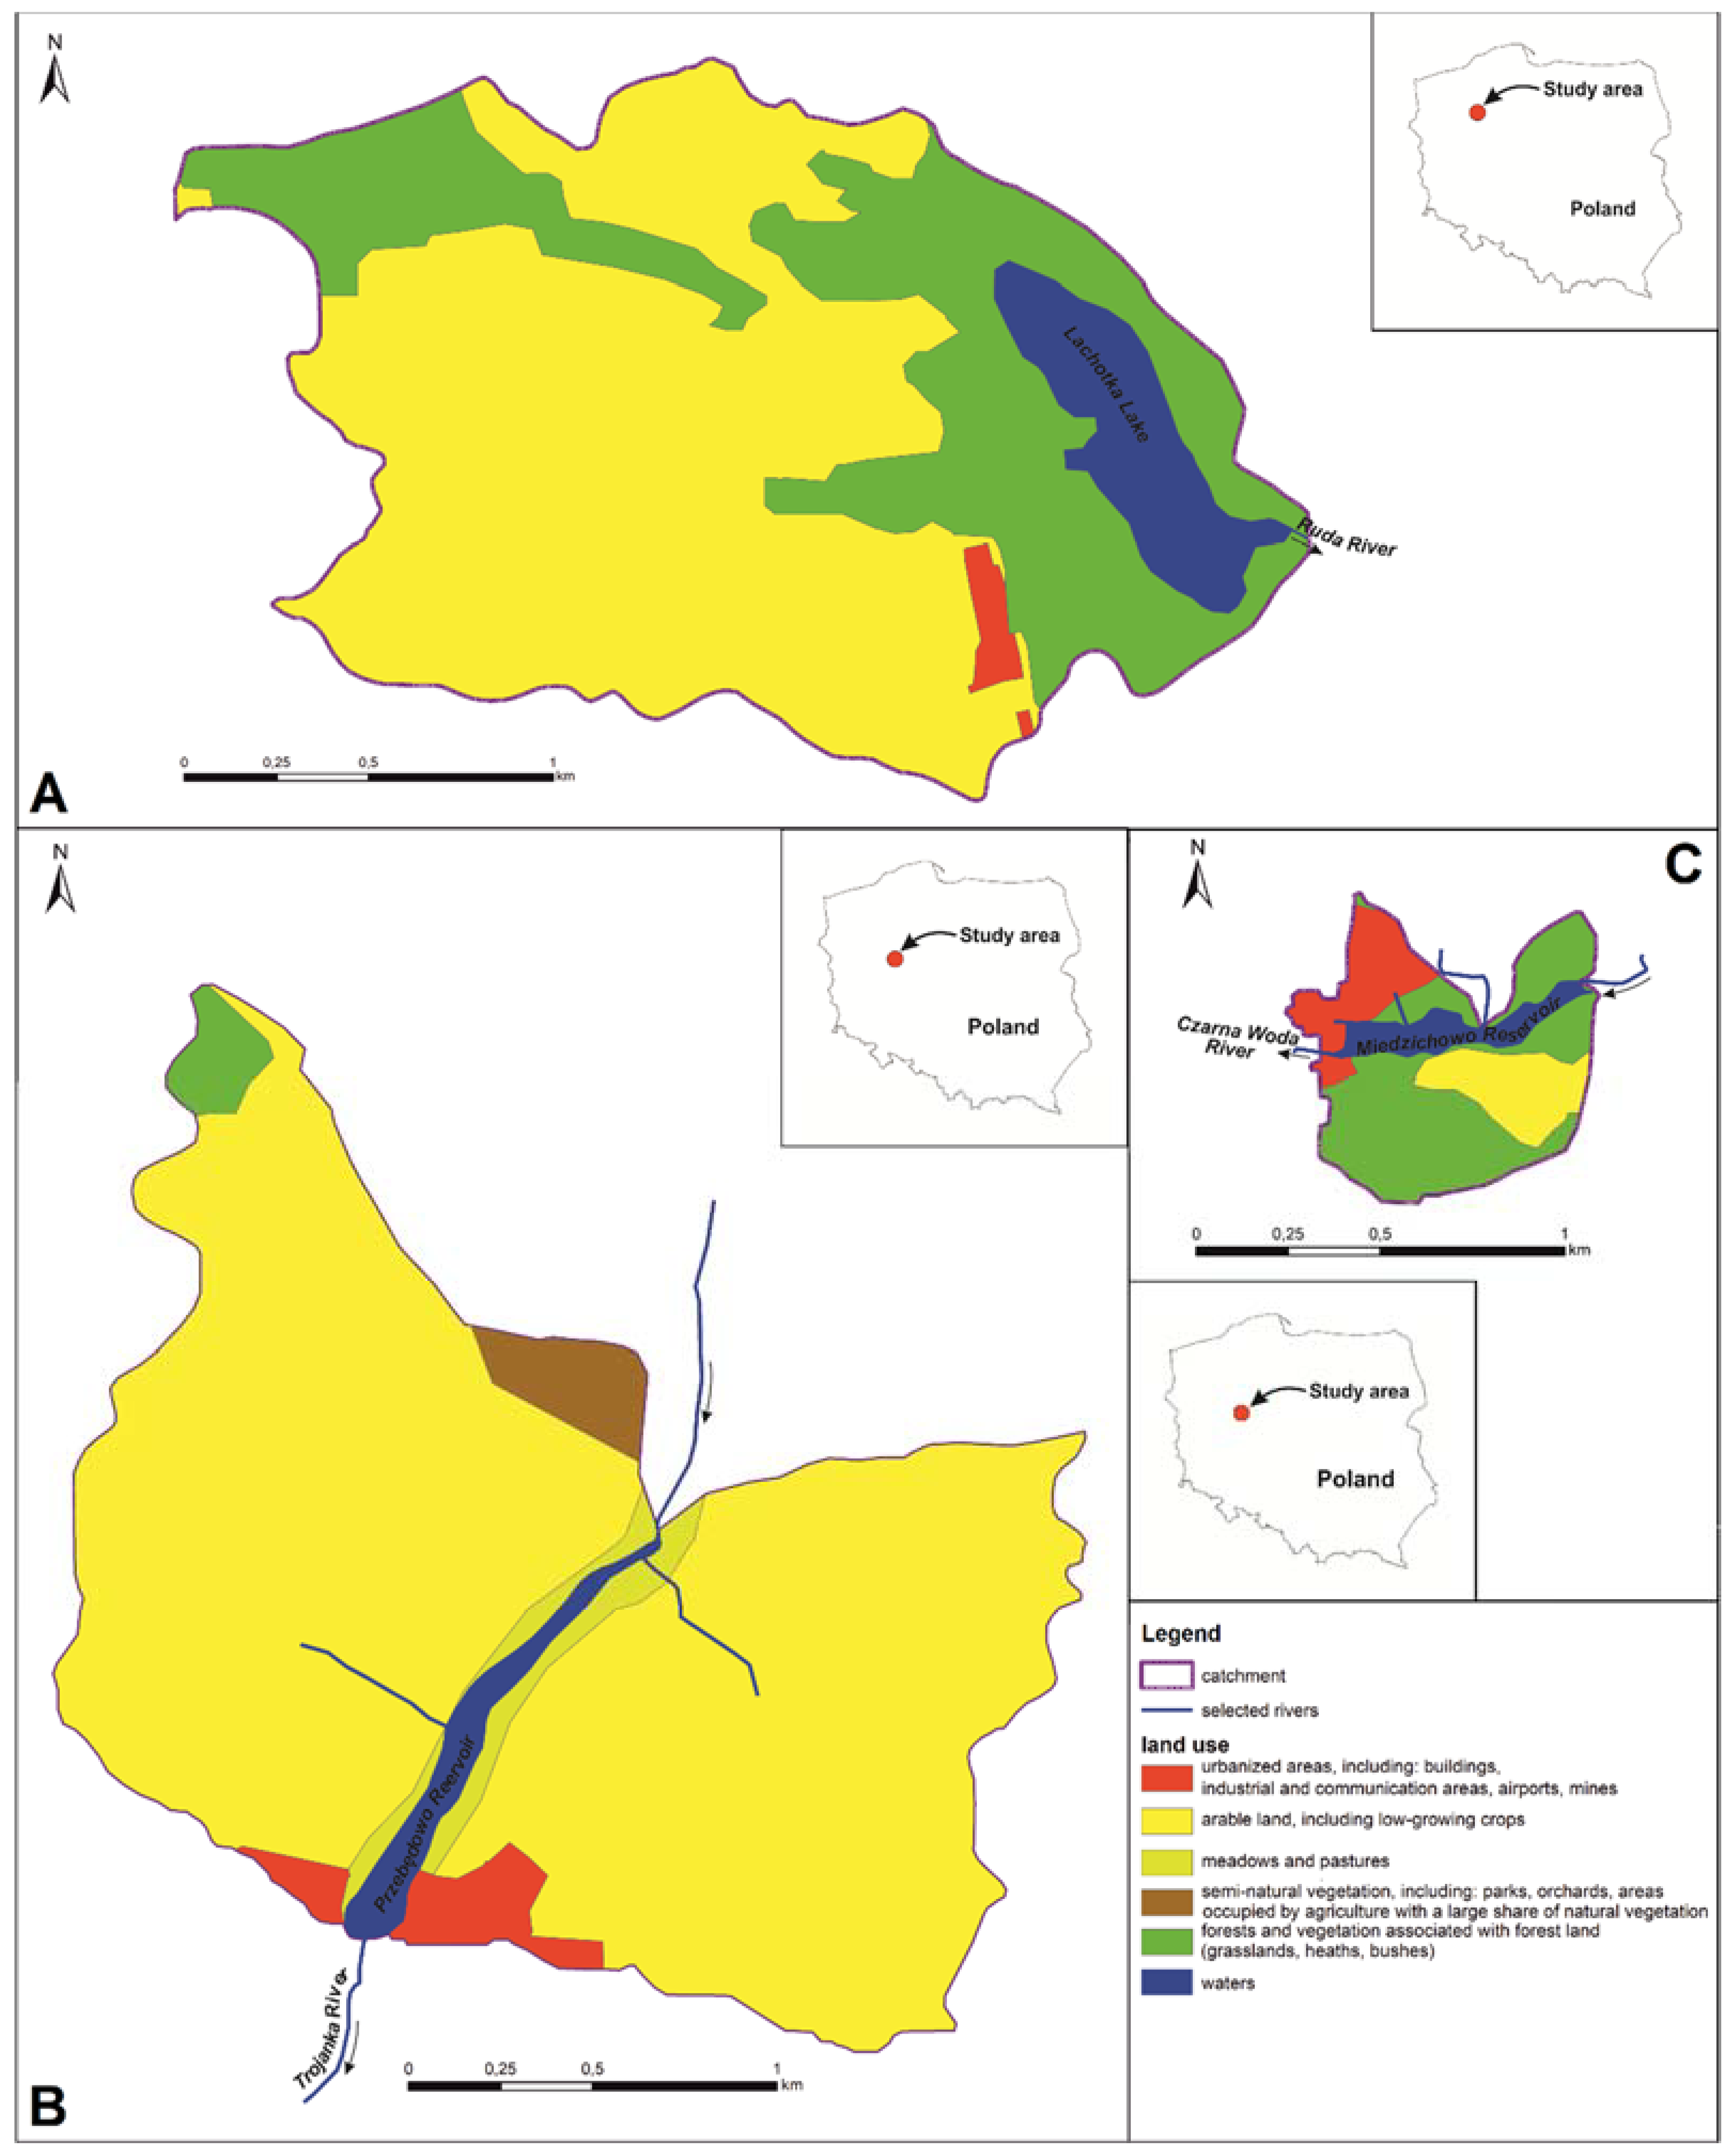
3. Study Sites
3.1. Lachotka Reservoir
3.2. Przebędowo Reservoir
3.3. Miedzichowo Reservoir
4. Results
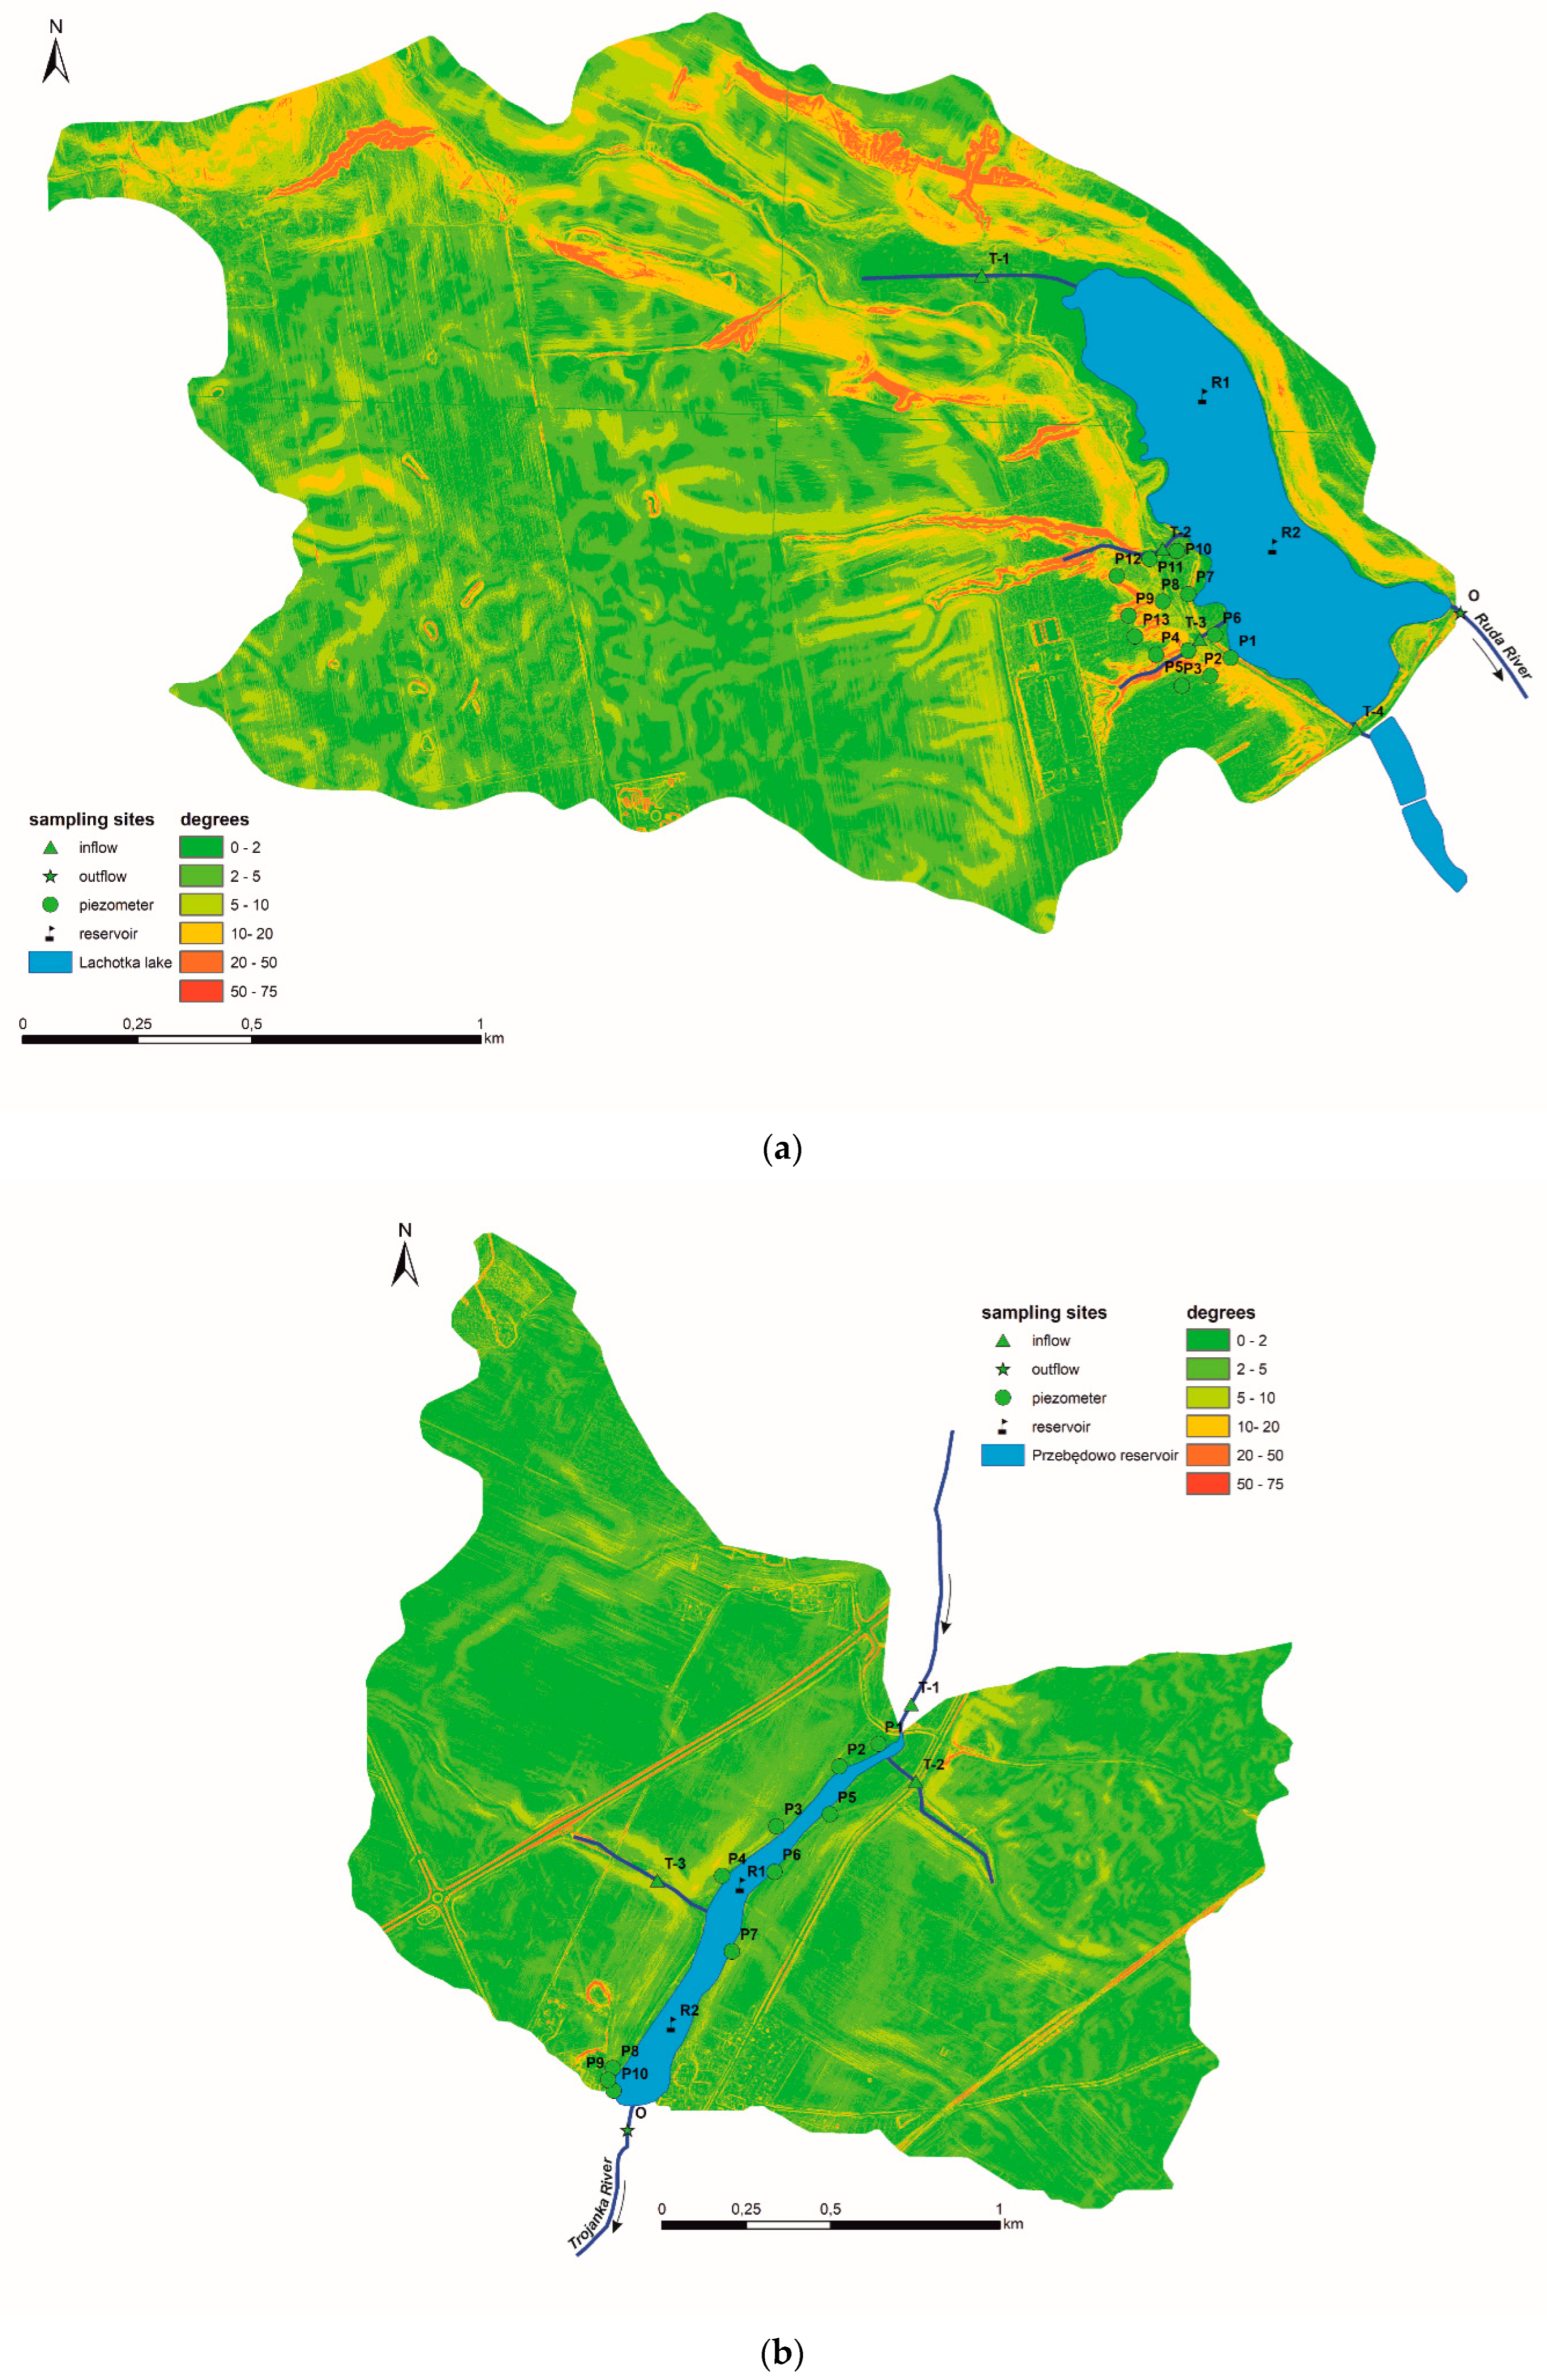
4.1. Catchments
4.1.1. Lachotka Reservoir
4.1.2. Przebędowo Reservoir
4.1.3. Miedzichowo Reservoir
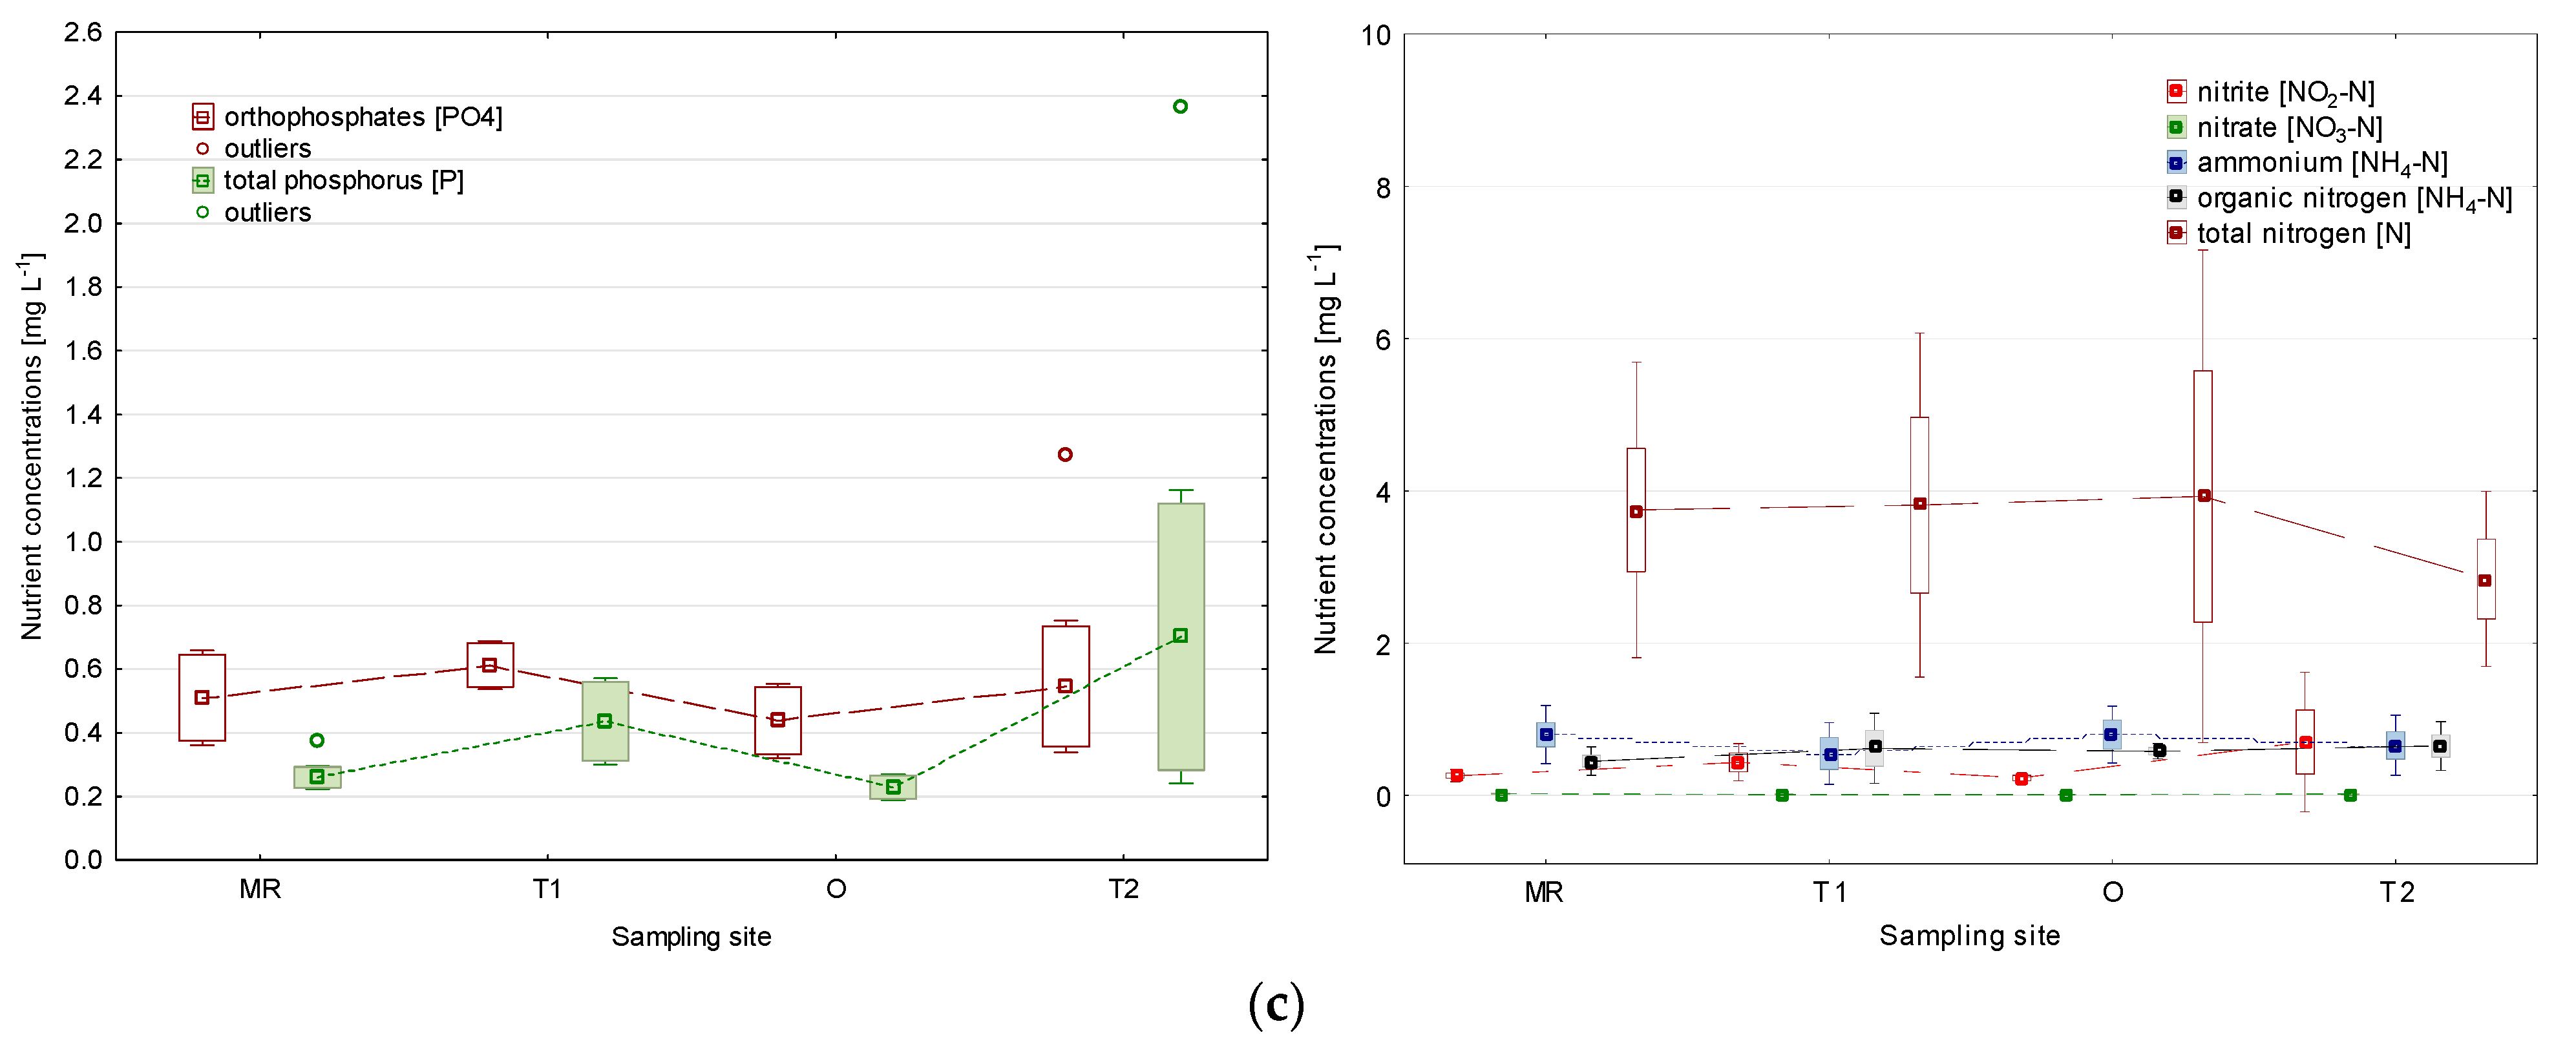
4.2. Water Quality in the Reservoirs
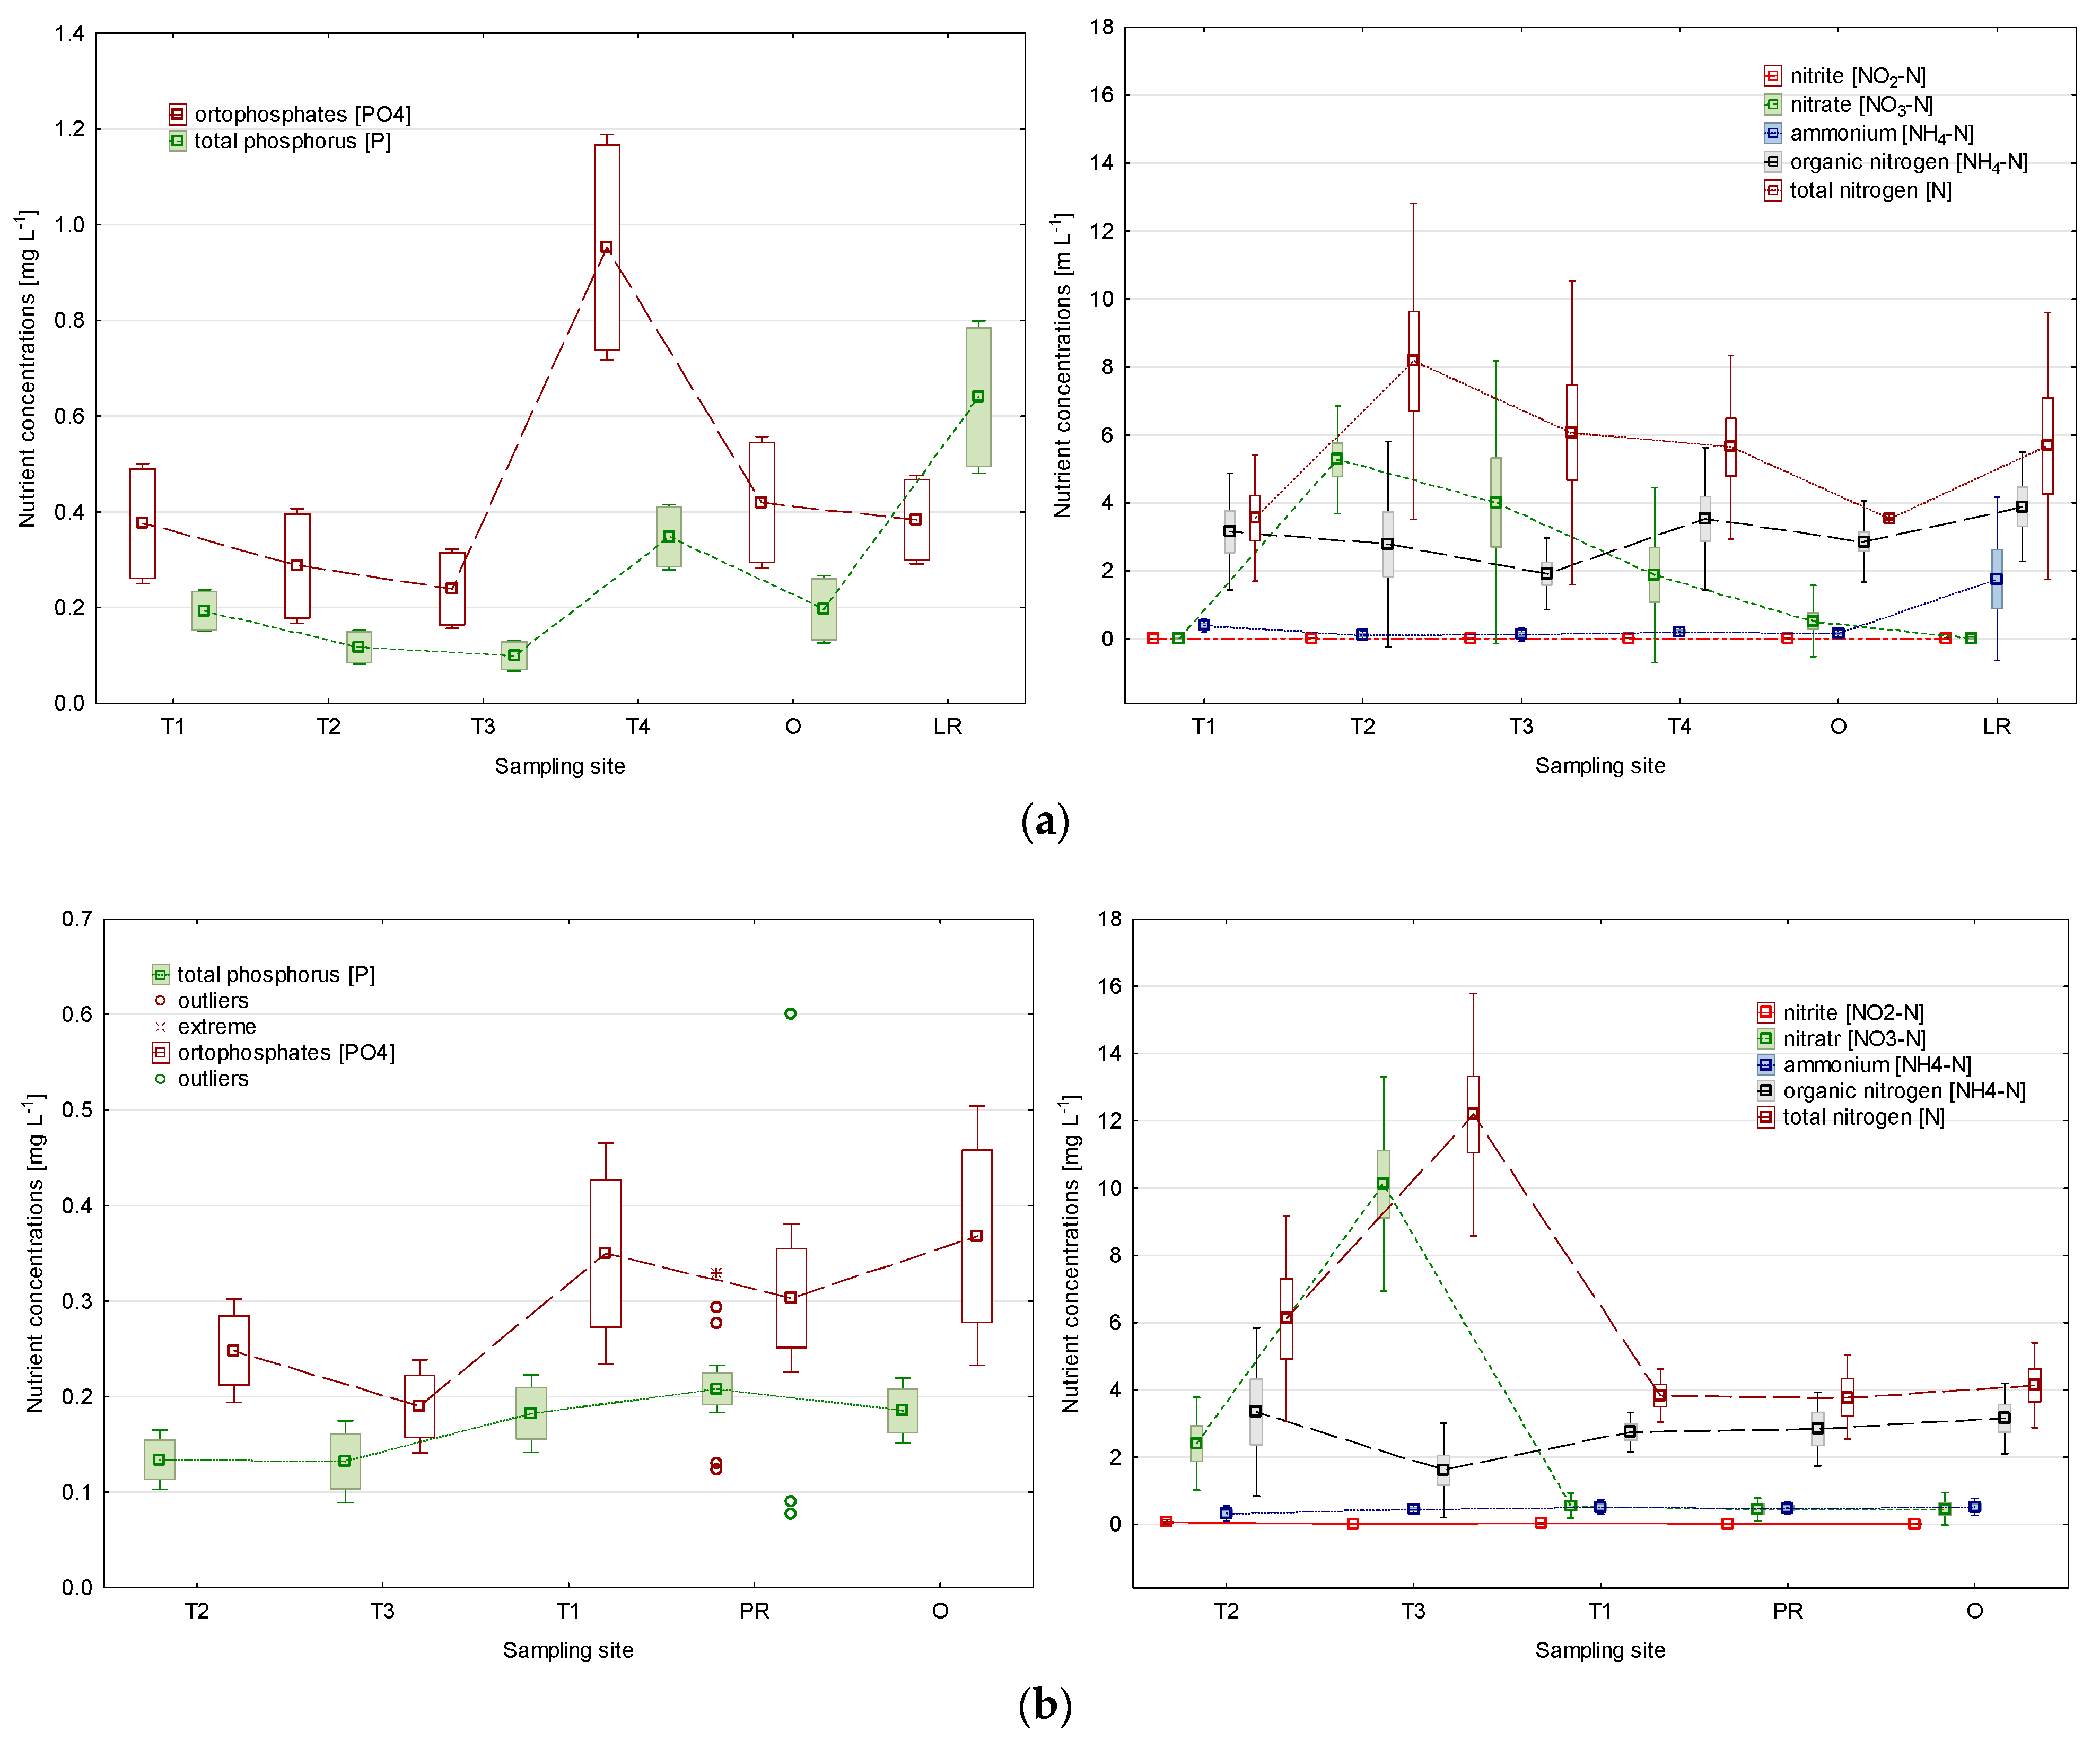
4.3. Running Waters
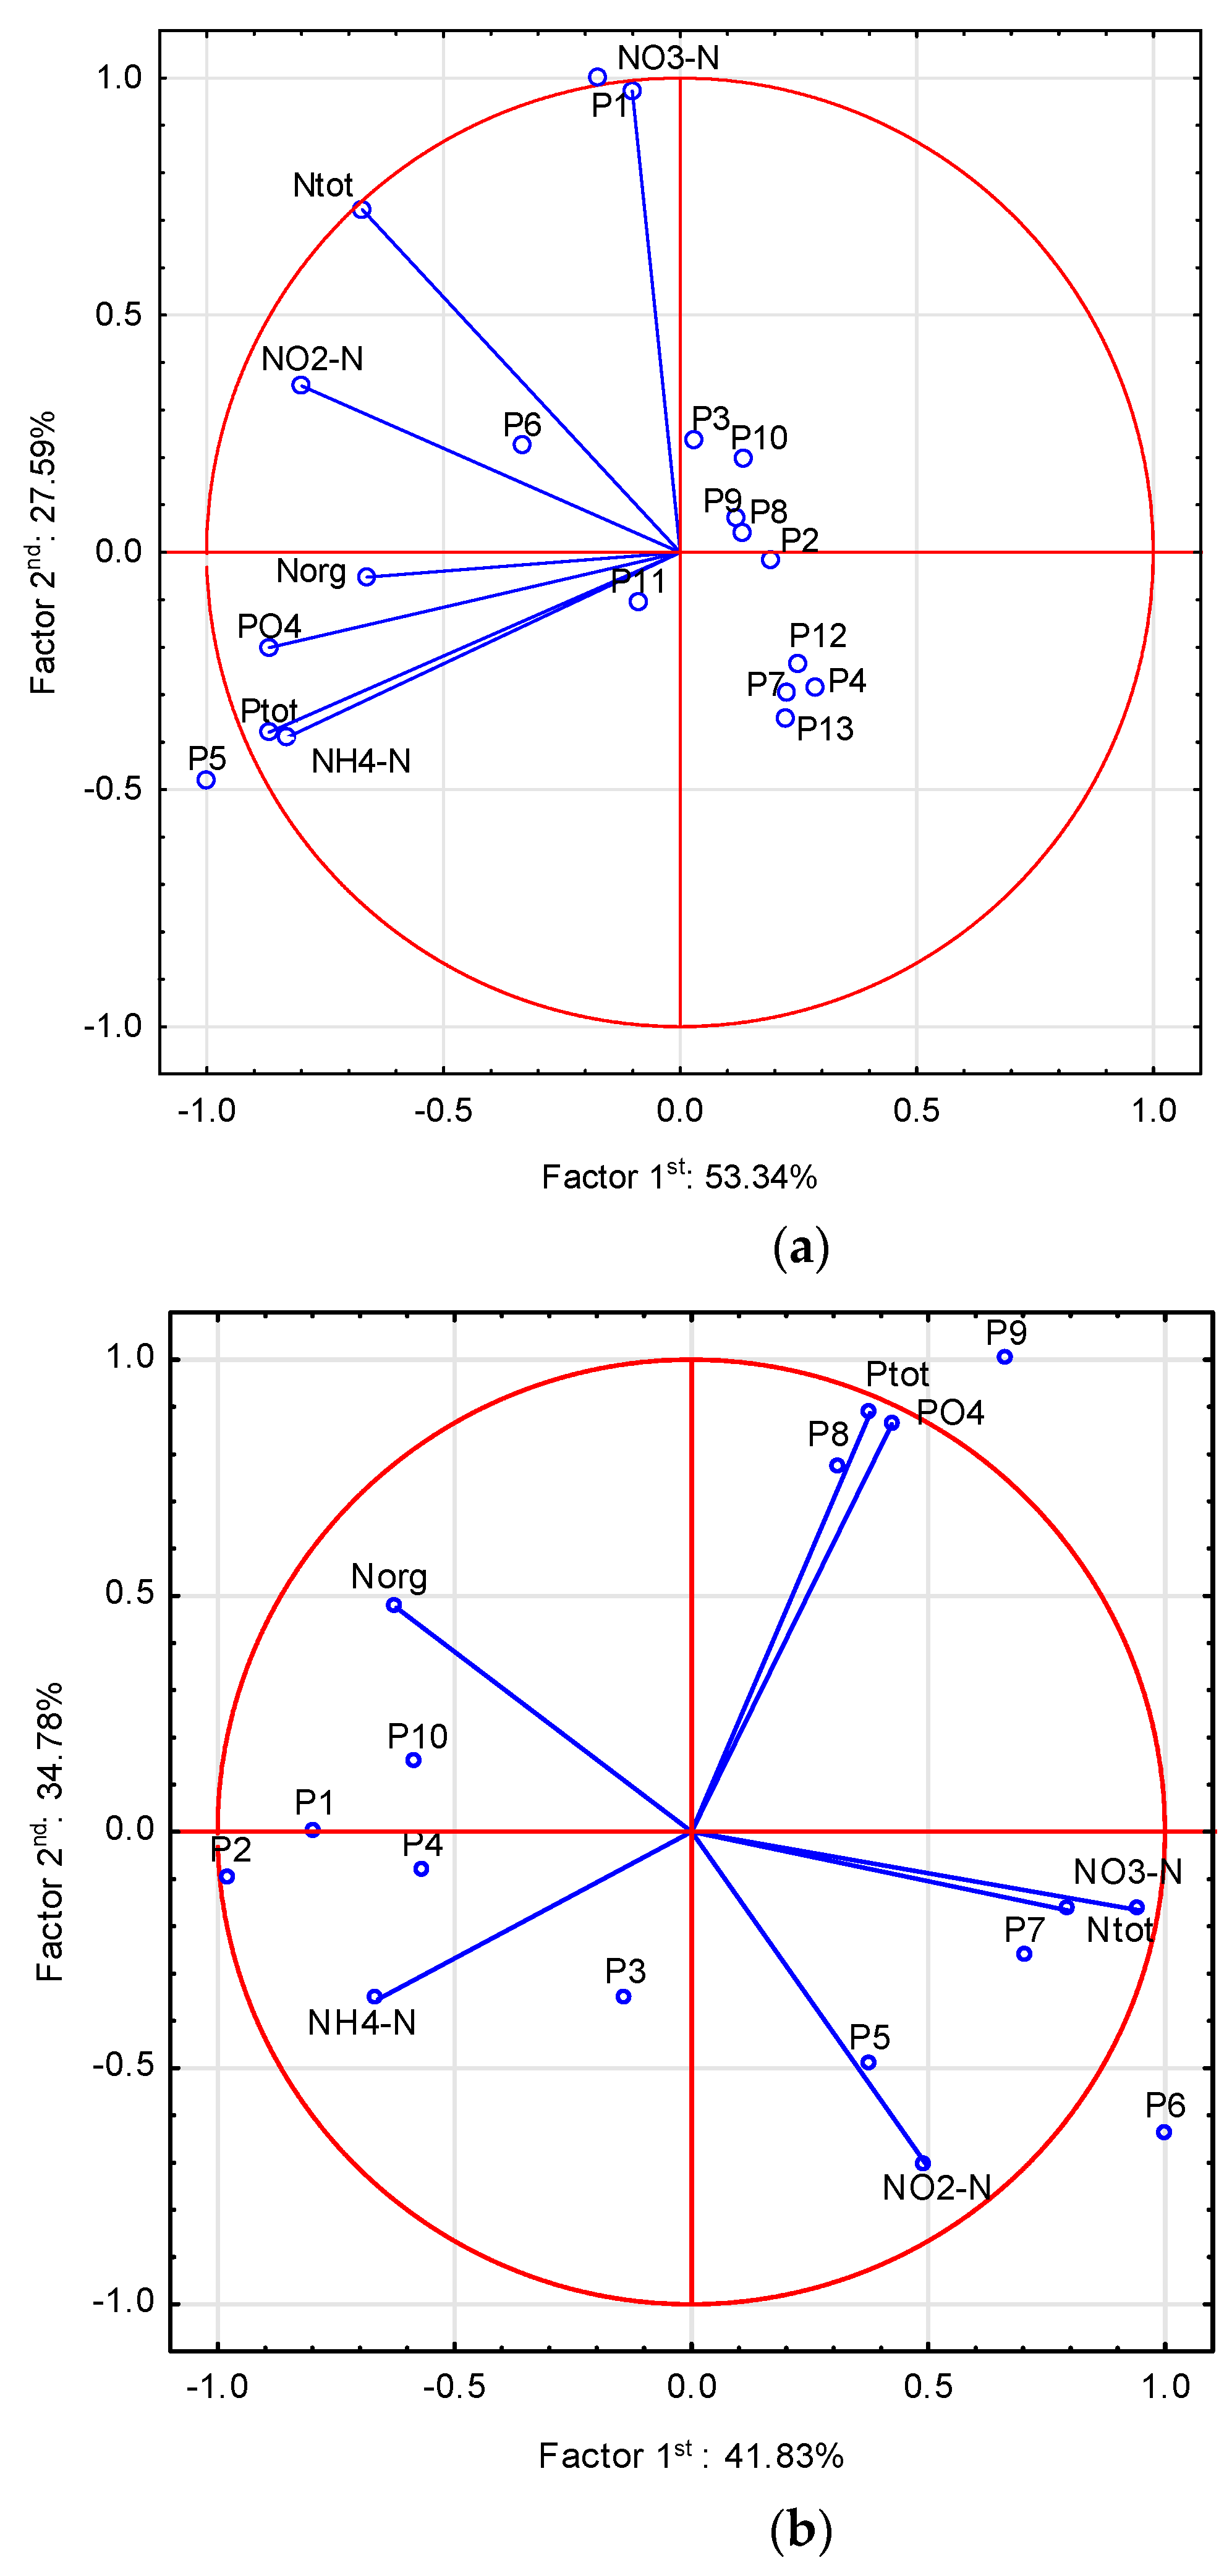
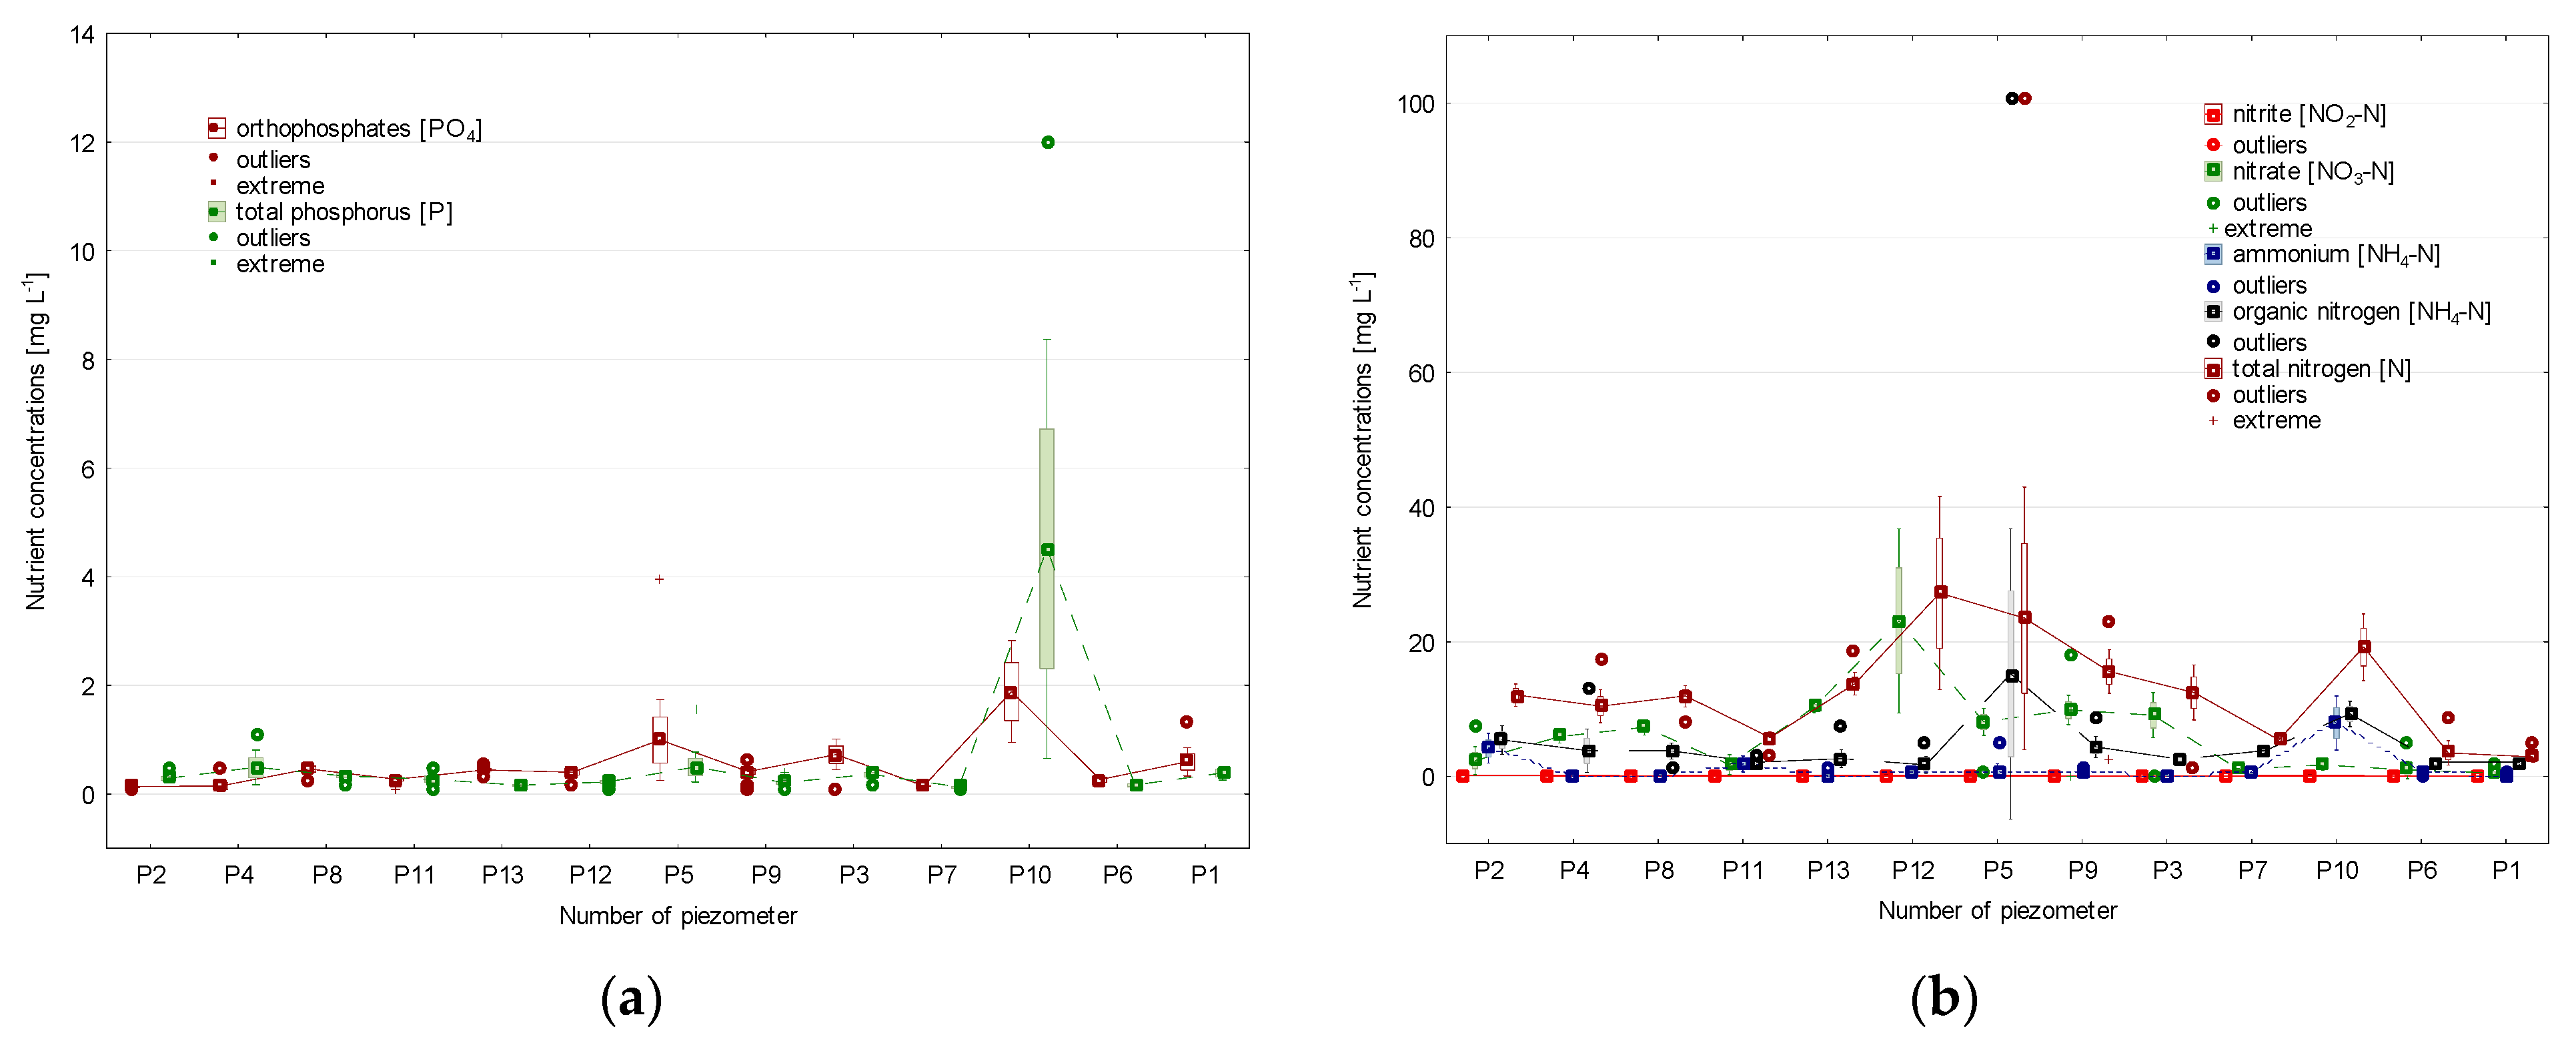
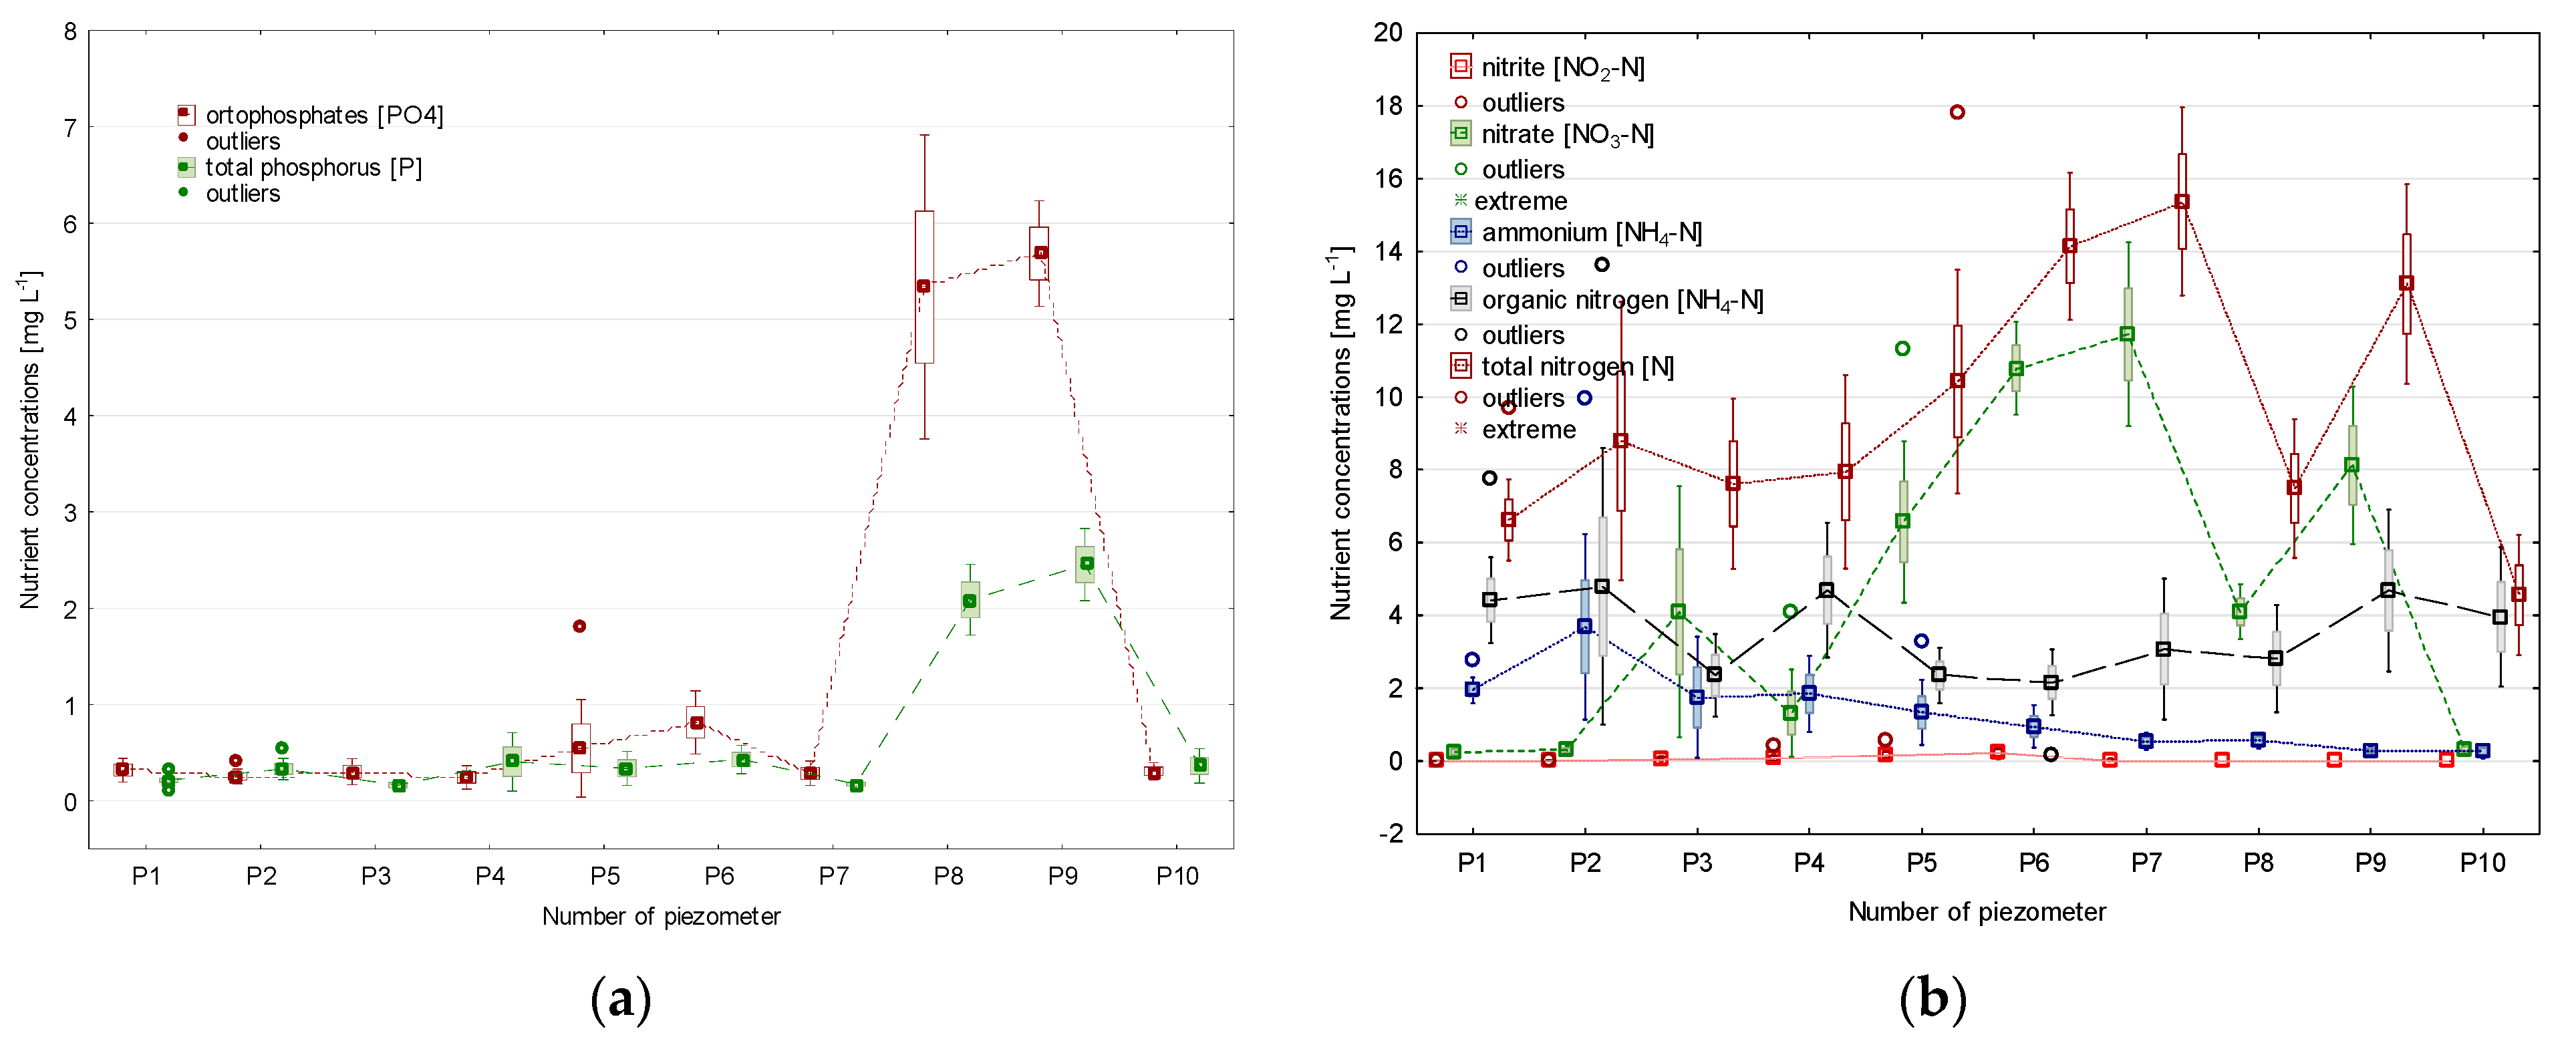
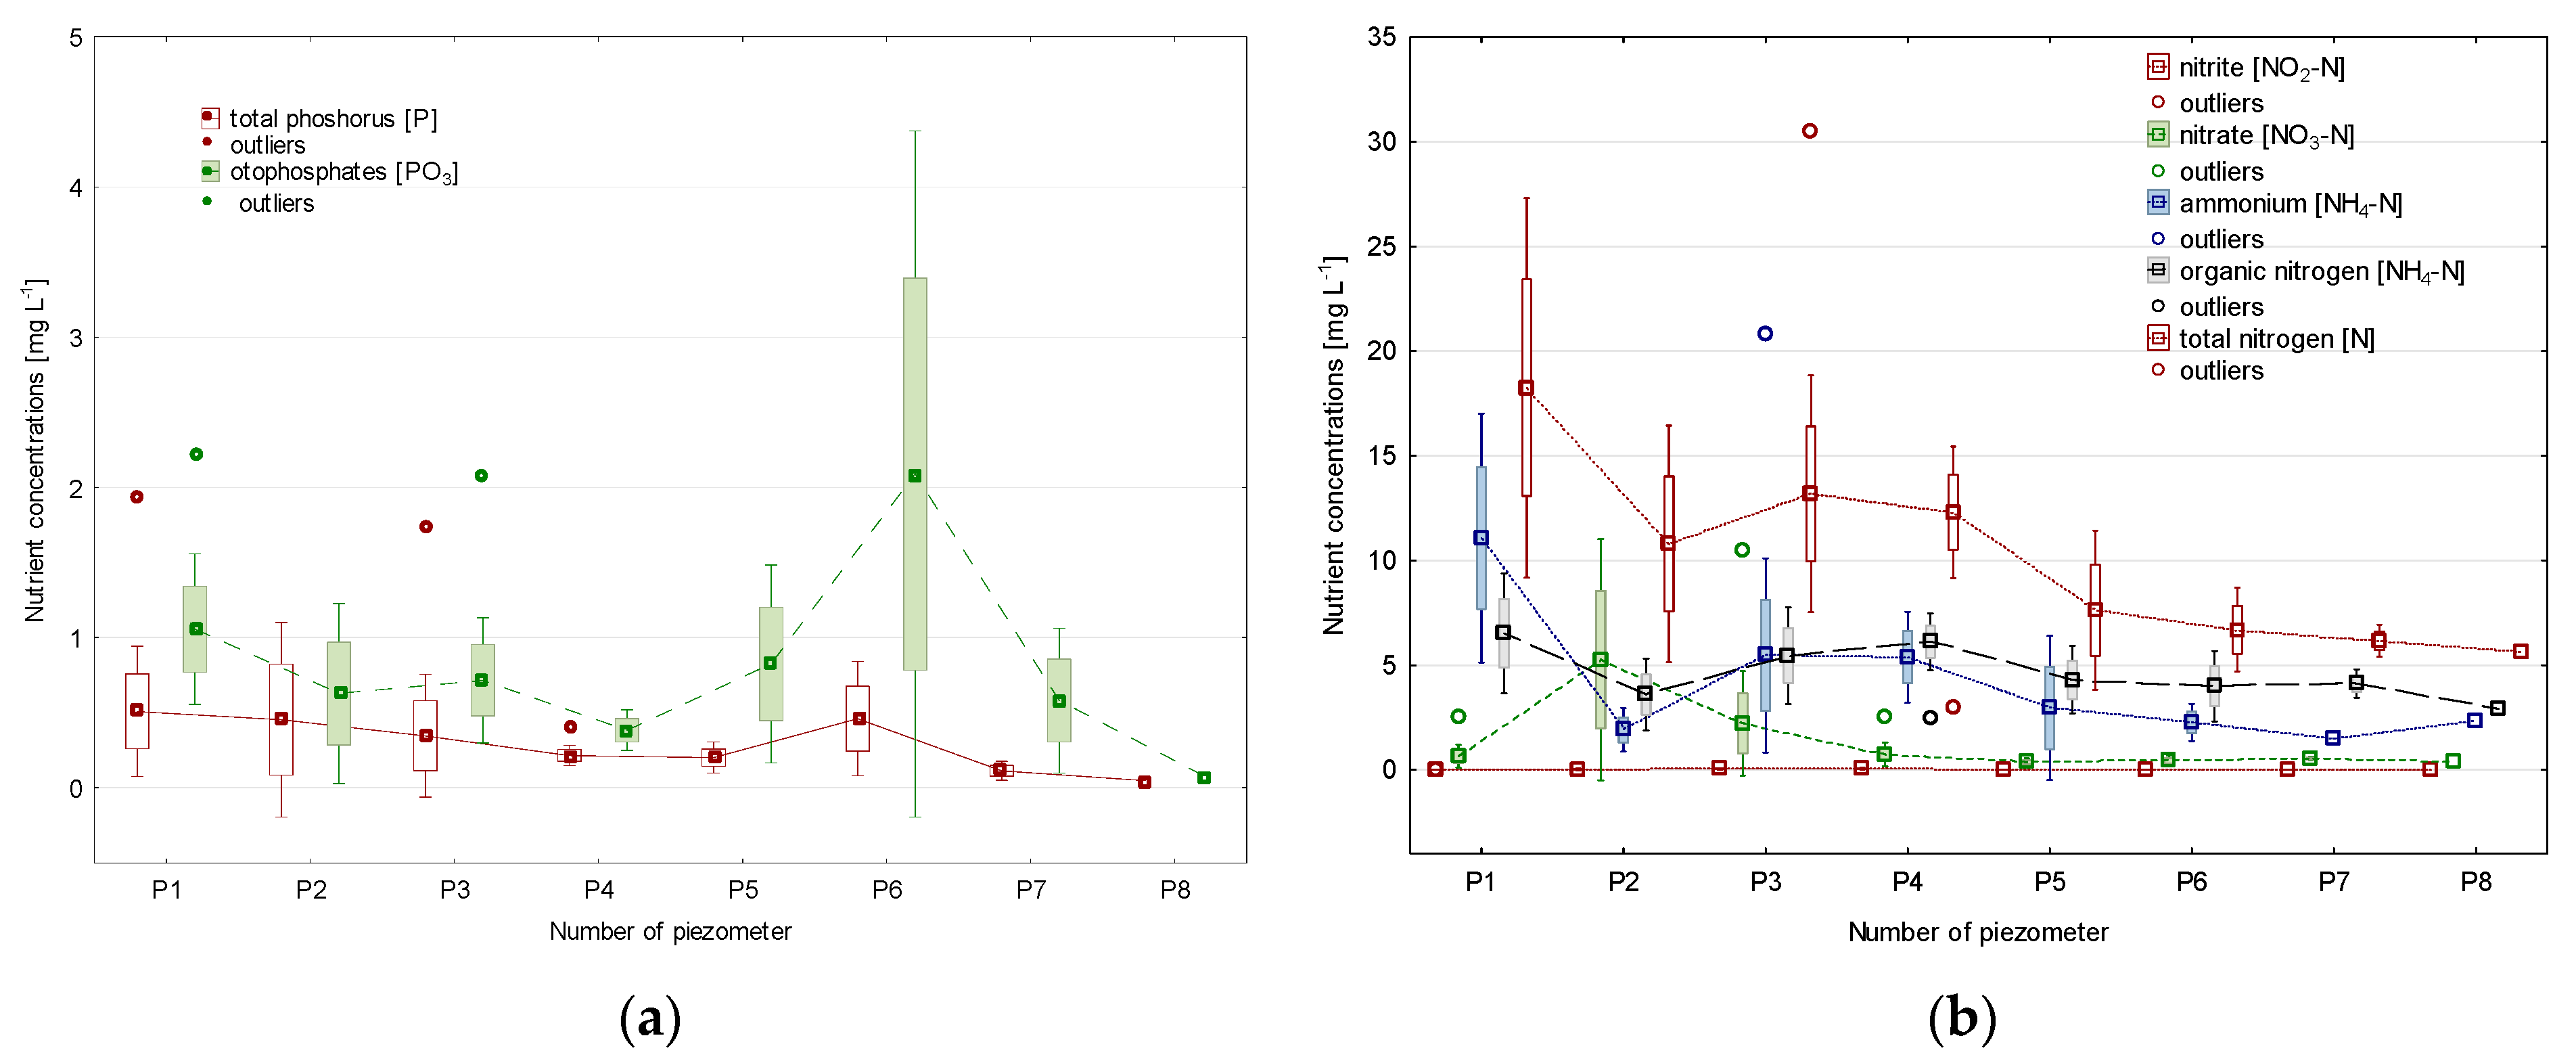
4.4. Groundwater Quality
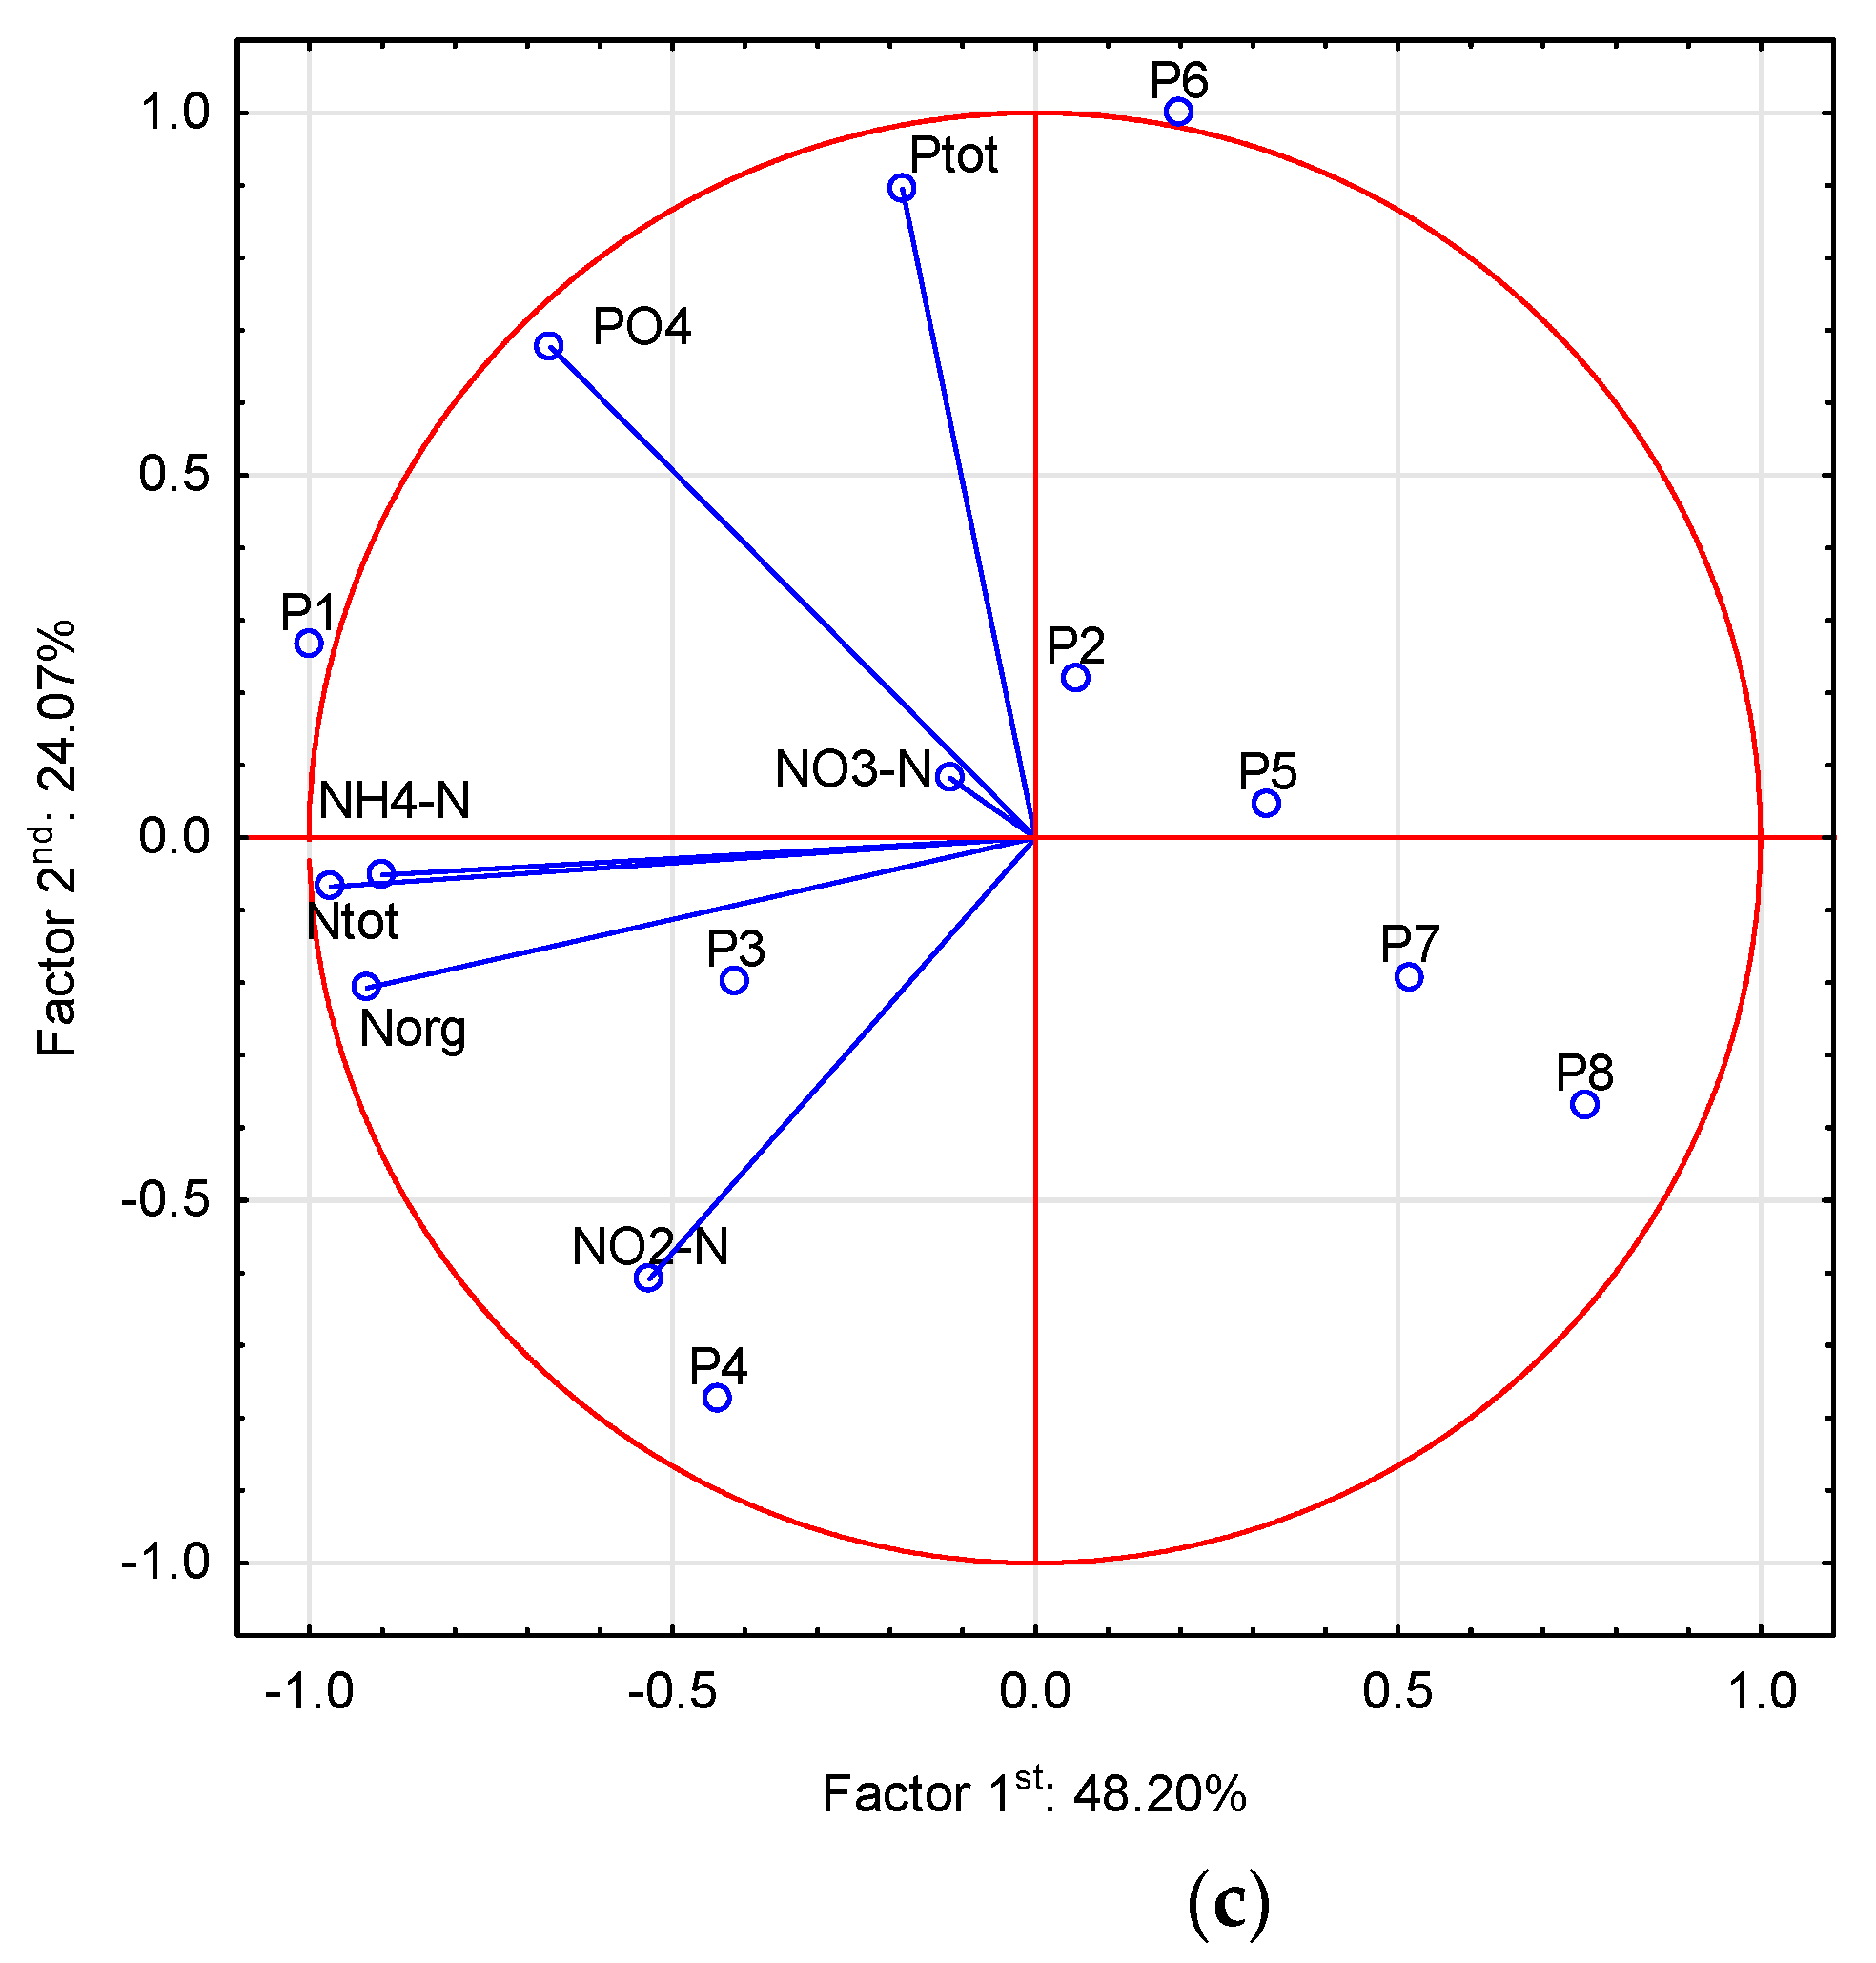
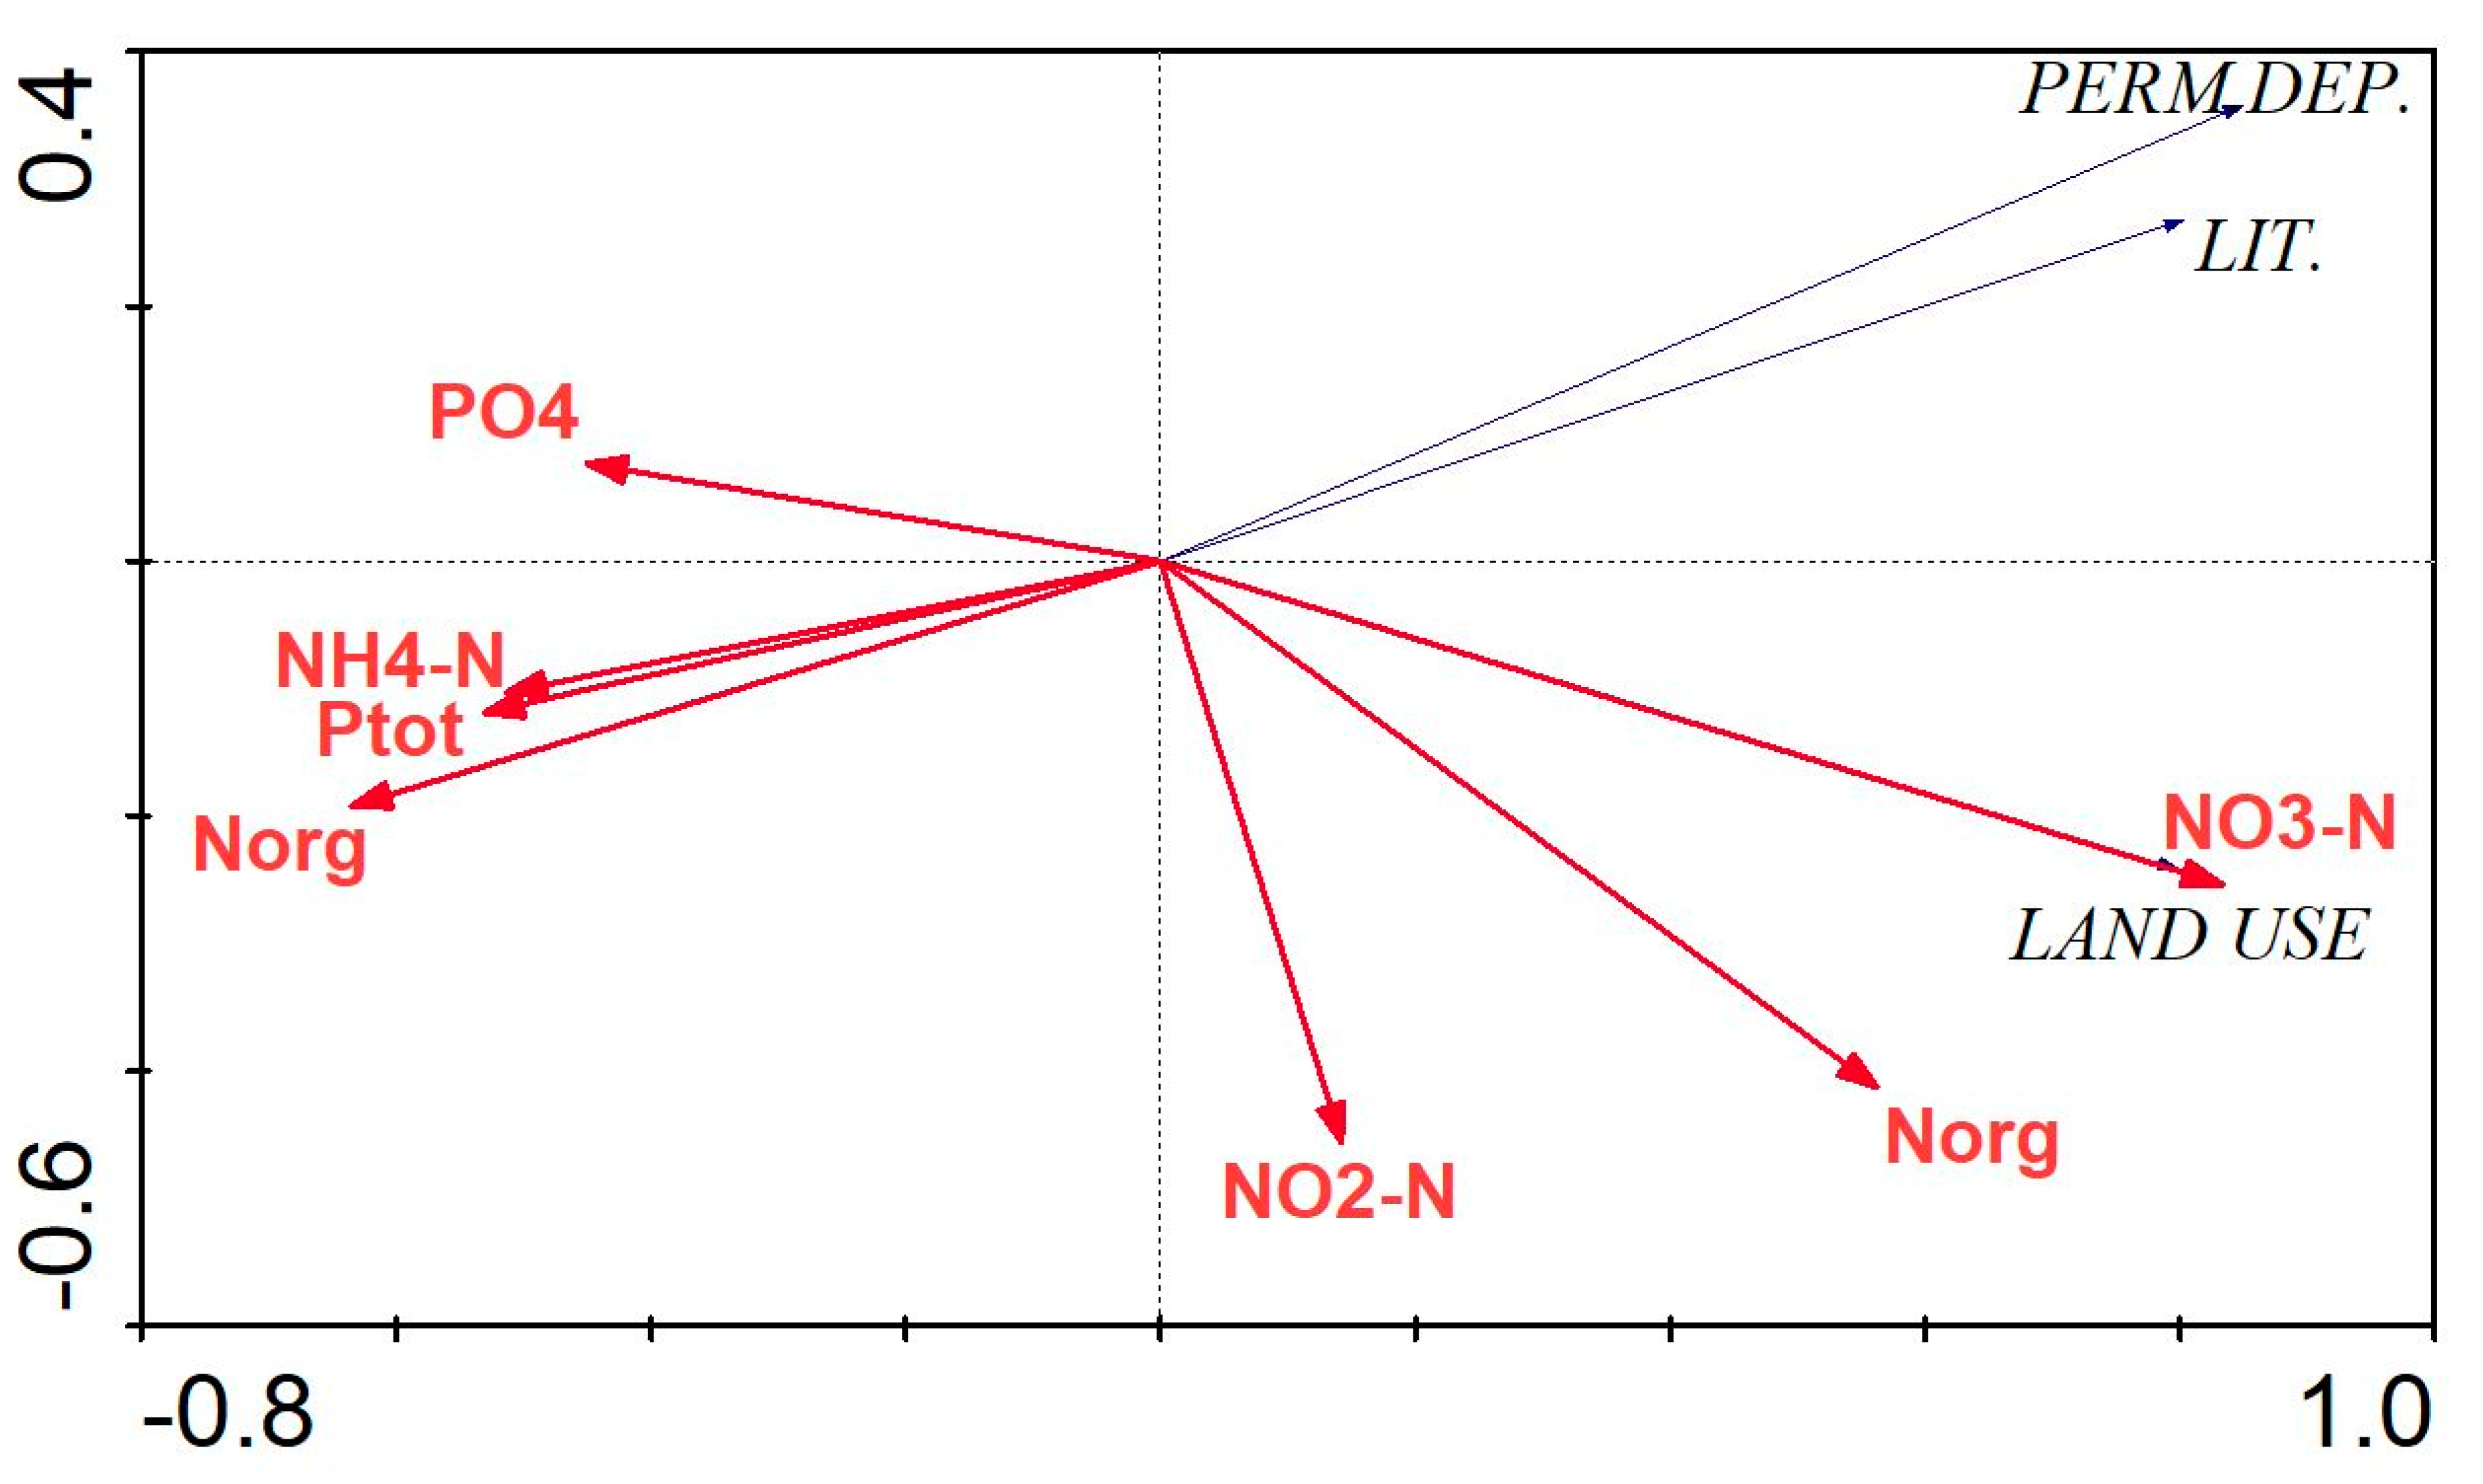
4.5. Impact of Soil Parameters and Land Use on Groundwater Quality
5. Discussion
6. Conclusions
Supplementary Materials
Author Contributions
Funding
Institutional Review Board Statement
Informed Consent Statement
Data Availability Statement
Acknowledgments
Conflicts of Interest
References
- Sánchez Pérez, J.M.; Antiguedad, I.; Arrate, I.; García-Linares, C.; Morell, I. The influence of nitrate leaching through unsaturated soil on groundwater pollution in an agricultural area of the Basque country: A case study. Sci. Total Environ. 2003, 317, 173–187. [Google Scholar] [CrossRef]
- Galloway, J.N.; Townsend, A.R.; Erisman, J.W.; Bekunda, M.; Cai, Z.; Freney, J.R.; Martinelli, L.A.; Seitzinger, S.P.; Sutton, M.A. Transformation of the Nitrogen Cycle: Recent Trends, Questions, and Potential Solutions. Science 2008, 320, 889–892. [Google Scholar] [CrossRef]
- OECD. Eutrophication of Waters. Monitoring, Assessment and Control; OECD: Paris, France, 1982. [Google Scholar]
- Lawniczak, A.E.; Zbierska, J.; Nowak, B.; Achtenberg, K.; Grześkowiak, A.; Kanas, K. Impact of agriculture and land use on nitrate contamination in groundwater and running waters in central-west Poland. Environ. Monit. Assess. 2016, 188, 172. [Google Scholar] [CrossRef]
- European Environment Agency. ‘Nitrates’ Directive; European Environment Agency: Copenhagen, Denmark, 2000; pp. 1–8. [Google Scholar]
- do Cameira, M.R.; Rolim, J.; Valente, F.; Mesquita, M.; Dragosits, U.; Cordovil, C.M.S. Translating the agricultural N surplus hazard into groundwater pollution risk: Implications for effectiveness of mitigation measures in nitrate vulnerable zones. Agric. Ecosyst. Environ. 2021, 306, 107204. [Google Scholar] [CrossRef]
- Wei, Z.; Yu, Y.; Yi, Y. Spatial distribution of nutrient loads and thresholds in large shallow lakes: The case of Chaohu Lake, China. J. Hydrol. 2022, 613, 128466. [Google Scholar] [CrossRef]
- Tong, Y.; Huang, Z.; Janssen AB, G.; Wishart, M.; He, W.; Wang, X.; Zhao, Y. Influence of social and environmental drivers on nutrient concentrations and ratios in lakes: A comparison between China and Europe. Water Res. 2022, 227, 119347. [Google Scholar] [CrossRef]
- WIOS. Available online: www.gios.gov.pl (accessed on 1 October 2022).
- Ciecierska, H.; Dynowska, M. Podręcznik Metodyczny Biologiczne Metody Oceny Stanu Środowiska Tom 2.Ekosystemy Wodne. (Methodological Manual. Biological Methods of Assessing the State of the Environment Volume 2. Water Ecosystems); Uniwersytet Warmińsko-Mazurski w Olsztynie: Olsztyn, Poland, 2013. [Google Scholar]
- Tarabih, O.; Dang, T.D.; Paudel, R.; Arias, M.E. Lake Operation Optimization of Nutrient Exports: Application of Phosphorus Control: Application of Phosphorus Control in the Largest Subtropical Lake in the Us. SSRN Electron. J. 2022, 160, 105603. [Google Scholar] [CrossRef]
- Dunalska, J.A.; Grochowska, J.; Wiśniewski, G.; Napiórkowska-Krzebietke, A. Can we restore badly degraded urban lakes? Ecol. Eng. 2015, 82, 432–441. [Google Scholar] [CrossRef]
- Fan, X.; Gao, S.; Zhang, Y.; Qin, B.; Xu, H.; Ding, S. Stimulation of high-concentration dissolved nitrogen and reactive phosphorus in Lake Taihu sediments on the initiation and maintenance of cyanobacterial blooms. Sci. Total Environ. 2022, 851, 158088. [Google Scholar] [CrossRef]
- Zhou, J.; Han, X.; Brookes, J.D.; Qin, B. High probability of nitrogen and phosphorus co-limitation occurring in eutrophic lakes. Environ. Pollut. 2022, 292, 118276. [Google Scholar] [CrossRef]
- Follett, J.R.; Follett, R.F. Chapter 4-Relationship of Environmental Nitrogen Metabolism to Human Health, 2nd ed.; Hatfield, J.L., Follett, R.F., Eds.; Academic Press: San Diego, CA, USA, 2008; pp. 71–104. ISBN 978-0-12-374347-3. [Google Scholar]
- Zhang, L.; Zhang, W.; Cui, Z.; Hu, Y.; Schmidhalter, U.; Chen, X. Environmental, human health, and ecosystem economic performance of long-term optimizing nitrogen management for wheat production. J. Clean. Prod. 2021, 311, 127620. [Google Scholar] [CrossRef]
- Jiang, M.; Nakano, S. The crucial influence of trophic status on the relative requirement of nitrogen to phosphorus for phytoplankton growth. Water Res. 2022, 222, 118868. [Google Scholar] [CrossRef] [PubMed]
- Kozak, A.; Celewicz-Gołdyn, S.; Kuczyńska-Kippen, N. Cyanobacteria in small water bodies: The effect of habitat and catchment area conditions. Sci. Total Environ. 2019, 646, 1578–1587. [Google Scholar] [CrossRef] [PubMed]
- Recknagel, F.; Park, H.-D.; Sukenik, A.; Zohary, T. Dissolved organic nitrogen, dinoflagellates and cyanobacteria in two eutrophic lakes: Analysis by inferential modelling. Harmful Algae 2022, 114, 102229. [Google Scholar] [CrossRef]
- Pinardi, M.; Soana, E.; Severini, E.; Racchetti, E.; Celico, F.; Bartoli, M. Agricultural practices regulate the seasonality of groundwater-river nitrogen exchanges. Agric. Water Manag. 2022, 273, 107904. [Google Scholar] [CrossRef]
- Gomes, E.; Antunes, I.M.H.R.; Leitão, B. Groundwater management: Effectiveness of mitigation measures in nitrate vulnerable zones–a Portuguese case study. Groundw. Sustain. Dev. 2023, 21, 100899. [Google Scholar] [CrossRef]
- Pol, W. Północny Wschód Europy pod względem natury. In Dzieła Prozą Wincentego Pola; Nakładem, F.H., Ed.; Richtera: Lwów, Poland, 1875; pp. 1–101. [Google Scholar]
- Quemada, M.; Lassaletta, L.; Jensen, L.S.; Godinot, O.; Brentrup, F.; Buckley, C.; Foray, S.; Hvid, S.K.; Oenema, J.; Richards, K.G.; et al. Exploring nitrogen indicators of farm performance among farm types across several European case studies. Agric. Syst. 2020, 177, 102689. [Google Scholar] [CrossRef]
- Perego, A.; Basile, A.; Bonfante, A.; De Mascellis, R.; Terribile, F.; Brenna, S.; Acutis, M. Nitrate leaching under maize cropping systems in Po Valley (Italy). Agric. Ecosyst. Environ. 2012, 147, 57–65. [Google Scholar] [CrossRef]
- Jarvie, H.P.; Neal, C.; Withers, P.J.A. Sewage-effluent phosphorus: A greater risk to river eutrophication than agricultural phosphorus? Sci. Total Environ. 2006, 360, 246–253. [Google Scholar] [CrossRef]
- Qiu, H.; Gui, H.; Xu, H.; Cui, L.; Li, Z.; Yu, H. Quantifying nitrate pollution sources of shallow groundwater and related health risks based on deterministic and Monte Carlo models: A study in Huaibei mining area, Huaibei coalfield, China. Ecotoxicol. Environ. Saf. 2023, 249, 114434. [Google Scholar] [CrossRef]
- Li, W.; Wu, J.; Bai, E.; Guan, D.; Wang, A.; Yuan, F.; Wang, S.; Jin, C. Response of terrestrial nitrogen dynamics to snow cover change: A meta-analysis of experimental manipulation. Soil Biol. Biochem. 2016, 100, 51–58. [Google Scholar] [CrossRef]
- Nowak, B.; Ptak, M. Potential use of lakes as a component of small retention in Wielkopolska. E3S Web Conf. 2018, 44, 1–8. [Google Scholar] [CrossRef]
- Raport of Ministry of Infrastructure. Program Przeciwdziałania Niedoborowi Wody; Ministry of Infrastructure: Warszawa, Poland, 2021.
- Sojka, M.; Jaskuła, J.; Wicher-Dysarz, J.; Dysarz, T. Analysis of Selected Reservoirs Functioning in the Wielkopolska Region. Acta Sci. Pol. Form. Circumiectus 2017, 4, 205–215. [Google Scholar] [CrossRef]
- Sjöberg, Y.; Dessirier, B.; Ghajarnia, N.; Jaramillo, F.; Jarsjö, J.; Panahi, D.M.; Xu, D.; Zou, L.; Manzoni, S. Scaling relations reveal global and regional differences in morphometry of reservoirs and natural lakes. Sci. Total Environ. 2022, 822, 153510. [Google Scholar] [CrossRef] [PubMed]
- Dodds, W.K.; Whiles, M.R. Chapter 3-Movement of Light, Heat, and Chemicals in Water. In Aquatic Ecology, 2nd ed.; Dodds, W.K., Whiles, M.R.B., Eds.; Academic Press: London, UK, 2010; pp. 45–64. ISBN 978-0-12-374724-2. [Google Scholar]
- Elbanowska, H.; Zerbe, J. Physicochemical Analyses of Water; PWN: Poznań, Poland, 1999. (In Polish) [Google Scholar]
- Hach Company. Water Analysis Handbook, 2nd ed.; Hach Company: Loveland, CO, USA, 1992; pp. 303, 669–3050. [Google Scholar]
- Carlson, R.E. A trophic state index for lakes. Limnol. Ocean. 1977, 22, 361–369. [Google Scholar] [CrossRef]
- Forsberg, C.; Ryding, S.O. Eutrophication Parameters and Trophic State Indices in 30 Swedish Waste-Receiving Lakes. Arch. Hydrobiol. 1980, 89, 189–207. [Google Scholar]
- Ministry of Marine Economy and Inland Navigation. Rozporządzenie Ministra Gospodarki Morskiej i Żeglugi Śródlądowej z Dnia 11 Października 2019 r. w Sprawie Kryteriów i Sposobu Oceny Stanu Jednolitych Części wód Podziemnych. [Regulation of the Minister of Marine Economy and Inland Navigation) of 11 October 2019; Ministry of Marine Economy and Inland Navigation: Warsaw, Poland, 2019. [Google Scholar]
- KZGW. The Map of the Hydrographic Division of Poland at a scale of 1:10,000; Krajowy Zarząd Gospodarki Wodnej: Warsaw, Poland, 2021. [Google Scholar]
- CLC. Available online: https://clc.gios.gov.pl/index.php/clc-2018/udostepnianie (accessed on 4 September 2022).
- Main Office of Geodesy and Cartography. Available online: https://www.gov.pl/web/gugik-en (accessed on 3 September 2022).
- Pazdro, Z. Hydrogeologia Ogólna (Genral Hydrogeology); Wydawnictwa Geologiczne: Warszawa, Poland, 1990. [Google Scholar]
- Wąsik, M. Zdolność infiltracyjna utworów przypowierzchniowych a zasilanie wód podziemnych (Infiltration capacity of near-surface formations and groundwater supply). Acta Univ. Wratislav. Ser. Hydrogeol. 2003, 2591, 90. [Google Scholar]
- Ter Braak, C.J.F.; Smilauer, P. CANOCO Reference Manual and CanoDraw for Windows User’s Guide Software for Canonical Community Ordination (Version 4.5) Biometris, Wageningen; Microcomputer Power: Ithaca, NY, USA, 2002. [Google Scholar]
- Nowak, B.; Brodzińska, B.; Gezella-Nowak, I. Natural and economic factors of shrinkage of lakes of the Wielkopolska Lakeland. Limnol. Rev. 2011, 11, 123–132. [Google Scholar] [CrossRef]
- Zhang, G.; Wu, Y.; Li, H.; Zhao, W.; Wang, F.; Chen, J.; Sivakumar, B.; Liu, S.; Qiu, L.; Wang, W. Assessment of water retention variation and risk warning under climate change in an inner headwater basin in the 21st century. J. Hydrol. 2022, 615, 128717. [Google Scholar] [CrossRef]
- Lawniczak-Malińska, A.; Ptak, M.; Celewicz, S.; Choiński, A. Impact of lake morphology and shallowing on the rate of overgrowth in hard-water eutrophic lakes. Water 2018, 10, 1827. [Google Scholar] [CrossRef]
- Choiński, A.; Ptak, M.; Ławniczak, A.E. Changes in water resources of Polish lakes as influenced by natural and anthropogenic factors. Polish J. Environ. Stud. 2016, 25, 1883–1890. [Google Scholar] [CrossRef]
- Neal, C.; Jarvie, H.P.; Neal, M.; Love, A.J.; Hill, L.; Wickham, H. Water quality of treated sewage effluent in a rural area of the upper Thames Basin, southern England, and the impacts of such effluents on riverine phosphorus concentrations. J. Hydrol. 2005, 304, 103–117. [Google Scholar] [CrossRef]
- Wang, L.; Yen, H.; Huang, C.H.; Wang, Y. Erosion and covered zones altered by surface coverage effects on soil nitrogen and carbon loss from an agricultural slope under laboratory-simulated rainfall events. Int. Soil Water Conserv. Res. 2022, 10, 382–392. [Google Scholar] [CrossRef]
- IUNG-PIB Puławy. Zbiór Zaleceń Dobrej Praktyki Rolniczej Mający na Celu Ochronę wód Przed Zanieczyszczeniem Azotanami Pochodzącymi ze Źródeł Rolniczych; IUNG-PIB Puławy: Warszawa, Poland, 2019. [Google Scholar]
- Kupiec, J.M.; Staniszewski, R.; Kayzer, D. Assessment of Water Quality Indicators in the Orla River Nitrate Vulnerable Zone in the Context of New Threats in Poland. Water 2022, 14, 2287. [Google Scholar] [CrossRef]
- Kupiec, J.; Zbierska, J. Comparison of Results Obtained from Different Types of Nitrogen Balance in the Scale of a Field and a Farm. Pol. J. Environ. Stud. 2012, 21, 1295–1304. [Google Scholar]
- Ali, B.; Shah, G.A.; Traore, B.; Shah, S.A.A.; Shah, S.-S.; Al-Solaimani, S.G.M.; Hussain, Q.; Ali, N.; Shahzad, K.; Shahzad, T.; et al. Manure storage operations mitigate nutrient losses and their products can sustain soil fertility and enhance wheat productivity. J. Environ. Manag. 2019, 241, 468–478. [Google Scholar] [CrossRef]
- Lawniczak-Malińska, A.E.; Achtenberg, K. On the use of macrophytes to maintain functionality of overgrown lowland lakes. Ecol. Eng. 2018, 113, 52–60. [Google Scholar] [CrossRef]
- Lawniczak-Malińska, A.E.; Achtenberg, K. Indicator values of emergent vegetation in overgrowing lakes in relation towater and sediment chemistry. Water 2018, 10, 498. [Google Scholar] [CrossRef]
- Fopp-Bayat, D.; Kaczmarczyk, D.; Szczepkowski, M. Genetic characteristics of Polish whitefish (Coregonus lavaretus maraena) broodstocks-Recommendations for the conservation management. Czech J. Anim. Sci. 2015, 60, 171–177. [Google Scholar] [CrossRef]
- Witkowski, A.; Kotusz Jan, P.M. 65:33–52, ryb—Stan 2009. C.’my P. O. Stopien zagrozenia słodkowodnej ichtiofauny Polski: Czerwona lista minogow i ryb-stan 2009. Chronmy Przyr. Ojczysta 2009, 65, 33–52. [Google Scholar]
- Bonansea, M.; Bazán, R.; Germán, A.; Ferral, A.; Beltramone, G.; Cossavella, A.; Pinotti, L. Assessing land use and land cover change in Los Molinos reservoir watershed and the effect on the reservoir water quality. J. S. Am. Earth Sci. 2021, 108, 103243. [Google Scholar] [CrossRef]
- Eekhout, J.P.C.; Boix-Fayos, C.; Pérez-Cutillas, P.; de Vente, J. The impact of reservoir construction and changes in land use and climate on ecosystem services in a large Mediterranean catchment. J. Hydrol. 2020, 590, 125208. [Google Scholar] [CrossRef]


| Parameter | Unit | Reservoir | |||
|---|---|---|---|---|---|
| Lachotka | Przebędowo | Miedzichowo | |||
| geographical coordinates | 53°15′10.85″ N 16°41′49.60″ E 53°14′43.96″ N 16°42′25.05″ E | 52°35′46.92″ 52°35′10.61″ N 17°1′37.34″ 17°0′54.71″ E | 52°22′26.41″ 52°22′21.01″ N 15°58′0.76″ E 15°57′27.16″ E | ||
| river—major tributaries | Ruda | Trojanka | Czarna Woda | ||
| km location of dam | app. 0 + 450 | 6 + 195 | 6 + 000 | ||
| water level | min. | m a. s.l. | 76.3 | 72.5 | 61.33 |
| water level | average | m a. s.l. | 76.8 | 71.5 | 61.2 |
| max. | m a. s.l. | 77.1 | 73 | 61.46 | |
| volume | at min. water level | M m3 | - | 0.049 | 0.071 |
| at average water level | M m3 | - | 0.075 | 0.098 | |
| at max. water level | M m3 | 3.5 | 0.229 | 0.101 | |
| depth | at average water level | m | 1.4 | 0.9 | 1.4 |
| at min. water level | m | 0.9 | 0.4 | 1.1 | |
| surface aerea | at average water level | ha | 39.6 | 15 | 5.5 |
| Type of Land Use | Catchment Area of Reservoir [km2] | ||
|---|---|---|---|
| Lachotka | Przebędowo | Miedzichowo | |
| arable land | 2.3 | 40.5 | 122.6 |
| forests | 1.2 | 47.7 | 133.0 |
| urban areas | 0.04 | 2.1 | 4.3 |
| meadows and pastures | 0.0 | 2.6 | 11.2 |
| water bodies and wetlands | 0.3 | 0.8 | 0.3 |
| mineral extraction sites | - | - | 0.4 |
| total | 3.8 | 93.7 | 271.8 |
| Lachotka | Przebędowo | Miedzichowo | ||||||||||
|---|---|---|---|---|---|---|---|---|---|---|---|---|
| Precipitation [mm] | Temperature [°C] | Precipitation [mm] | Temperature [°C] | Precipitation [mm] | Temperature [°C] | |||||||
| Month/ Year | 2016 | 2017 | 2016 | 2017 | 2016 | 2017 | 2016 | 2017 | 2016 | 2017 | 2016 | 2017 |
| 1 | 18.3 | 15.5 | −2.3 | −2.1 | 45.2 | 34.7 | −1.6 | −2.2 | 41.2 | 32.5 | −1.6 | −2.2 |
| 2 | 22.9 | 22.9 | 2.9 | 0.1 | 41.2 | 38.7 | 3.7 | 0.5 | 54.8 | 45.9 | 3.7 | 0.5 |
| 3 | 14.5 | 26.5 | 3.6 | 5.7 | 44.7 | 45.3 | 4.0 | 6.7 | 44.2 | 51.8 | 4.0 | 6.7 |
| 4 | 15.2 | 18.5 | 8.4 | 6.9 | 44.6 | 62.9 | 9.0 | 7.7 | 46.3 | 37.0 | 9.0 | 7.7 |
| 5 | 27.9 | 56.0 | 15.6 | 13.6 | 66.5 | 65.7 | 15.9 | 14.2 | 67.4 | 45.3 | 15.9 | 14.2 |
| 6 | 49.7 | 73.9 | 18.2 | 17.1 | 89.7 | 108.2 | 18.9 | 18.1 | 67.9 | 165.8 | 18.9 | 18.1 |
| 7 | 92.3 | 139.8 | 18.6 | 17.6 | 157.3 | 216.8 | 19.5 | 18.6 | 107.2 | 135.2 | 19.5 | 18.6 |
| 8 | 55.5 | 121.6 | 17.0 | 18.0 | 38.6 | 143.3 | 18.2 | 19.3 | 49.1 | 89.8 | 18.2 | 19.3 |
| 9 | 11.2 | 46.7 | 15.8 | 13.1 | 7.9 | 62.6 | 17.1 | 13.7 | 7.6 | 49.6 | 17.1 | 13.7 |
| 10 | 54.1 | 95.2 | 8.3 | 10.3 | 129 | 122.7 | 8.3 | 11.0 | 97.4 | 99.8 | 8.3 | 11.0 |
| 11 | 25.5 | 37.9 | 2.9 | 4.9 | 58.6 | 64.6 | 3.1 | 5.5 | 39.4 | 74.5 | 3.1 | 5.5 |
| 12 | 38.3 | 33.3 | 1.7 | 2.4 | 58.4 | 69.9 | 1.7 | 2.9 | 59.0 | 53.8 | 1.7 | 2.9 |
| total | 425.4 | 687.8 | - | - | 781.7 | 1035.4 | - | - | 681.5 | 881.0 | - | - |
| Slope Range | Lachotka | Przebędowo | Miedzichowo | |||
|---|---|---|---|---|---|---|
| [km2] | [%] | [km2] | [%] | [km2] | [%] | |
| 0–2% | 1.592 | 43.95 | 3.024 | 73.00 | 0.244 | 61.16 |
| 2–5% | 1.107 | 30.56 | 0.870 | 21.00 | 0.090 | 22.60 |
| 5–10% | 0.558 | 15.39 | 0.166 | 4.00 | 0.044 | 10.98 |
| 10–25% | 0.281 | 7.76 | 0.041 | 1.00 | 0.012 | 3.14 |
| 25–50% | 0.084 | 2.33 | 0.041 | 1.00 | 0.008 | 2.11 |
| 50–75% | 0.000 | 0.00 | 0.000 | 0.00 | 0.00004 | 0.01 |
| total | 3.623 | 100 | 4.143 | 100.00 | 0.398 | 100.00 |
| Parameter/Unit | Lake Lachotka | Lake Przebędowo | Lake Miedzichowo | ||||||
|---|---|---|---|---|---|---|---|---|---|
| Mean | Min. | Max. | Mean | Min. | Max. | Mean | Min. | Max. | |
| chlorophyll a [µg L−1] | 50.80 | 30.87 | 70.73 | 9.24 | 1.92 | 16.50 | 25.60 | 1.60 | 106.33 |
| oxygen [%] | 56.2 | 35.7 | 118.7 | 74.1 | 29.2 | 121.0 | 68.5 | 42.3 | 119.5 |
| conductivity [μS cm−1] | 581 | 476 | 642 | 601 | 417 | 994 | 434 | 278 | 538 |
| pH | 7.34 | 7.00 | 8.01 | 7.94 | 7.19 | 8.62 | 7.81 | 6.55 | 8.6 |
| orthophosphate [mg PO43− L−1] | 0.38 | 0.07 | 0.52 | 0.36 | 0.09 | 0.60 | 0.48 | 0.17 | 0.97 |
| total phosphorus [mg P L−1] | 0.64 | 0.09 | 0.88 | 0.22 | 0.13 | 0.33 | 0.25 | 0.18 | 0.37 |
| nitrite [mg N-NO2− L−1] | 0.01 | 0.002 | 0.013 | 0.013 | 0.004 | 0.038 | 0.020 | 0.003 | 0.053 |
| nitrate [mg N-NO3− L−1] | 0.02 | 0.01 | 0.07 | 0.44 | 0.01 | 1.80 | 0.75 | 0.20 | 1.30 |
| ammonium [mg N-NH4+ L−1] | 1.76 | 0.23 | 4.12 | 0.49 | 0.21 | 0.97 | 0.40 | 0.15 | 0.69 |
| organic nitrogen [mg N-NH4+ L−1] | 3.89 | 2.40 | 5.34 | 2.83 | 0.27 | 6.42 | 3.32 | 1.85 | 6.07 |
| TN [mg N L−1] | 5.68 | 3.11 | 9.48 | 3.78 | 1.05 | 8.61 | 4.49 | 2.33 | 8.07 |
| sulphates [mg SO42− L−1] | 53 | 40 | 64 | 59 | 42 | 84 | 51 | 36 | 62 |
| COD [mg O2 L−1] | 39.5 | 26.4 | 51.6 | 34.2 | 25.6 | 42.8 | 23.6 | 17.6 | 38.4 |
| visibility [m] | 0.69 | 0.48 | 1.00 | 0.6 | 0.8 | 2.2 | 1.6 | 0.9 | 2.3 |
| TSI (SD) | 68.0 | eutrophy | 67.4 | eutrophy | 57.4 | eutrophy | |||
| TSI (CHL) | 82.7 | hypertrophy | 54.2 | eutrophy | 53.2 | eutrophy | |||
| TSI (TP) | 74.0 | hypertrophy | 84.9 | hypertrophy | 87.6 | hypertrophy | |||
| TSI | 74.9 | hypertrophy | 68.8 | eutrophy | 66.1 | eutrophy | |||
| Month | Nitrite (mg NO2−-N L−1) | Nitrate (mg NO3−-N L−1) | Ammonium (NH4+-N L−1) | Organic Nitrogen (NH4+-N L−1) | Total Nitrogen (mg N L−1) | ||||||||||
|---|---|---|---|---|---|---|---|---|---|---|---|---|---|---|---|
| Mean | Min. | Max. | Mean | Min. | Max. | Mean | Min. | Max. | Mean | Min. | Max. | Mean | Min. | Max. | |
| 3 | 0.048 | 0.010 | 0.128 | 4.85 | 0.25 | 15.98 | 1.58 | 0.74 | 2.94 | 3.42 | 0.78 | 5.9 | 11.4 | 4.7 | 19.2 |
| 4 | 0.059 | 0.008 | 0.138 | 5.42 | 0.02 | 16.60 | 1.49 | 0.48 | 2.73 | 2.54 | 0.24 | 4.5 | 9.5 | 3.1 | 18.9 |
| 5 | 0.076 | 0.011 | 0.165 | 4.97 | 0.30 | 11.80 | 1.94 | 0.95 | 3.38 | 1.64 | 0.15 | 3.9 | 8.3 | 4.4 | 13.3 |
| 6 | 0.122 | 0.002 | 0.564 | 3.92 | 0.40 | 11.30 | 1.49 | 0.33 | 3.38 | 3.20 | 1.80 | 4.9 | 8.7 | 3.8 | 17.8 |
| 7 | 0.017 | 0.006 | 0.033 | 3.71 | 0.40 | 10.10 | 1.16 | 0.28 | 2.85 | 5.74 | 1.33 | 13.6 | 10.6 | 3.8 | 16.2 |
| 8 | 0.360 | 0.160 | 0.559 | 7.45 | 3.20 | 11.70 | 0.92 | 0.53 | 1.30 | 3.40 | 3.18 | 3.6 | 12.1 | 7.5 | 16.7 |
| 9 | 0.067 | 0.003 | 0.518 | 4.73 | 0.10 | 11.60 | 1.25 | 0.40 | 3.35 | 4.56 | 2.57 | 8.0 | 10.6 | 3.7 | 16.4 |
| 10 | 0.008 | 0.001 | 0.031 | 4.41 | 0.20 | 10.40 | 1.44 | 0.10 | 9.95 | 3.86 | 2.15 | 6.8 | 9.7 | 5.1 | 16.6 |
| 11 | 0.009 | 0.003 | 0.055 | 4.47 | 0.26 | 11.20 | 1.56 | 0.12 | 10.22 | 3.45 | 2.11 | 6.35 | 9.9 | 4.2 | 17.2 |
| Axes | 1 | 2 | 3 | 4 | Total Variance |
|---|---|---|---|---|---|
| Eigenvalues: | 0.661 | 0.078 | 0.01 | 0.18 | 1 |
| Water quality–environment correlations: | 0.923 | 0.613 | 0.825 | 0 | |
| Cumulative percentage variance | |||||
| of water quality data: | 66.1 | 73.9 | 75 | 93 | |
| of water quality–environment relation: | 88.1 | 98.6 | 100 | 0 | |
| Sum of all eigenvalues | 1 | ||||
| Sum of all canonical eigenvalues | 0.75 |
Disclaimer/Publisher’s Note: The statements, opinions and data contained in all publications are solely those of the individual author(s) and contributor(s) and not of MDPI and/or the editor(s). MDPI and/or the editor(s) disclaim responsibility for any injury to people or property resulting from any ideas, methods, instructions or products referred to in the content. |
© 2023 by the authors. Licensee MDPI, Basel, Switzerland. This article is an open access article distributed under the terms and conditions of the Creative Commons Attribution (CC BY) license (https://creativecommons.org/licenses/by/4.0/).
Share and Cite
Lawniczak-Malińska, A.; Nowak, B.; Pajewski, K. Agricultural Pressures on the Quality of Ground and Surface Waters in Catchments of Artificial Reservoirs. Water 2023, 15, 661. https://doi.org/10.3390/w15040661
Lawniczak-Malińska A, Nowak B, Pajewski K. Agricultural Pressures on the Quality of Ground and Surface Waters in Catchments of Artificial Reservoirs. Water. 2023; 15(4):661. https://doi.org/10.3390/w15040661
Chicago/Turabian StyleLawniczak-Malińska, Agnieszka, Bogumił Nowak, and Kamil Pajewski. 2023. "Agricultural Pressures on the Quality of Ground and Surface Waters in Catchments of Artificial Reservoirs" Water 15, no. 4: 661. https://doi.org/10.3390/w15040661
APA StyleLawniczak-Malińska, A., Nowak, B., & Pajewski, K. (2023). Agricultural Pressures on the Quality of Ground and Surface Waters in Catchments of Artificial Reservoirs. Water, 15(4), 661. https://doi.org/10.3390/w15040661