

Assessment of Aquatic Ecological Health Based on the Characteristics of the Fish Community Structures of the Hun River Basin, Northeastern China


Abstract
1. Introduction
2. Materials and Methods
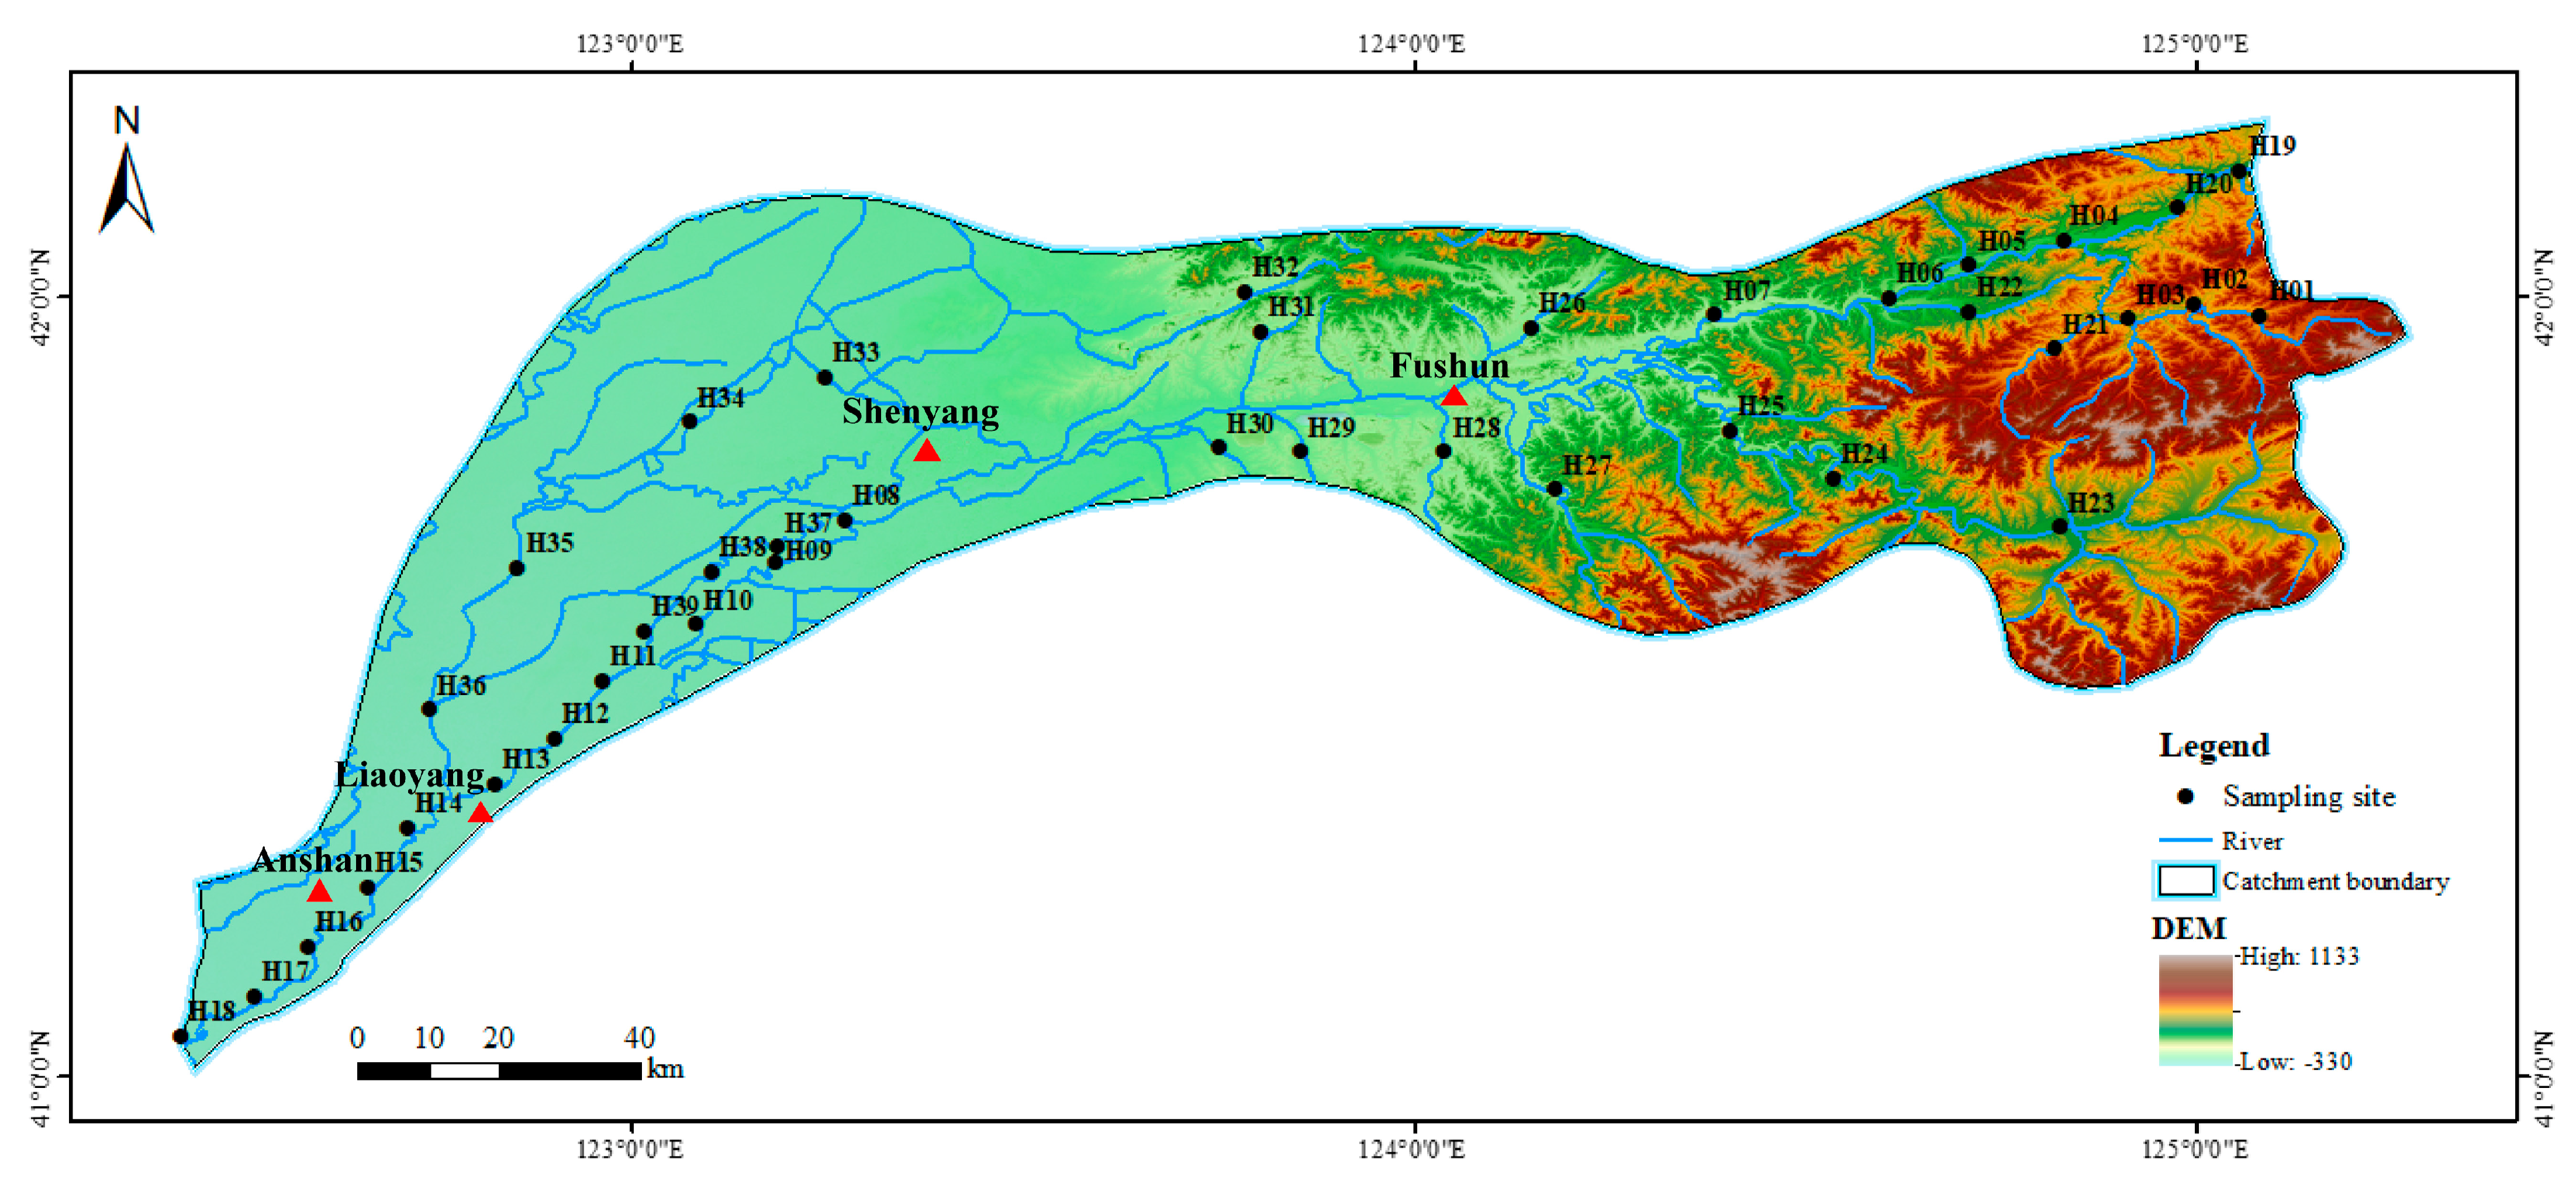
2.1. Study Area and Sampling Site
2.2. Data Collection
2.2.1. Fish Samples
2.2.2. Environmental Factors
2.3. Construction of the F-IBI
2.3.1. Selection of Reference Sites
2.3.2. Screening of Candidate Indicators
2.3.3. Calculation of the F-IBI
2.4. Data Analysis
3. Results
3.1. Composition of Fish Species
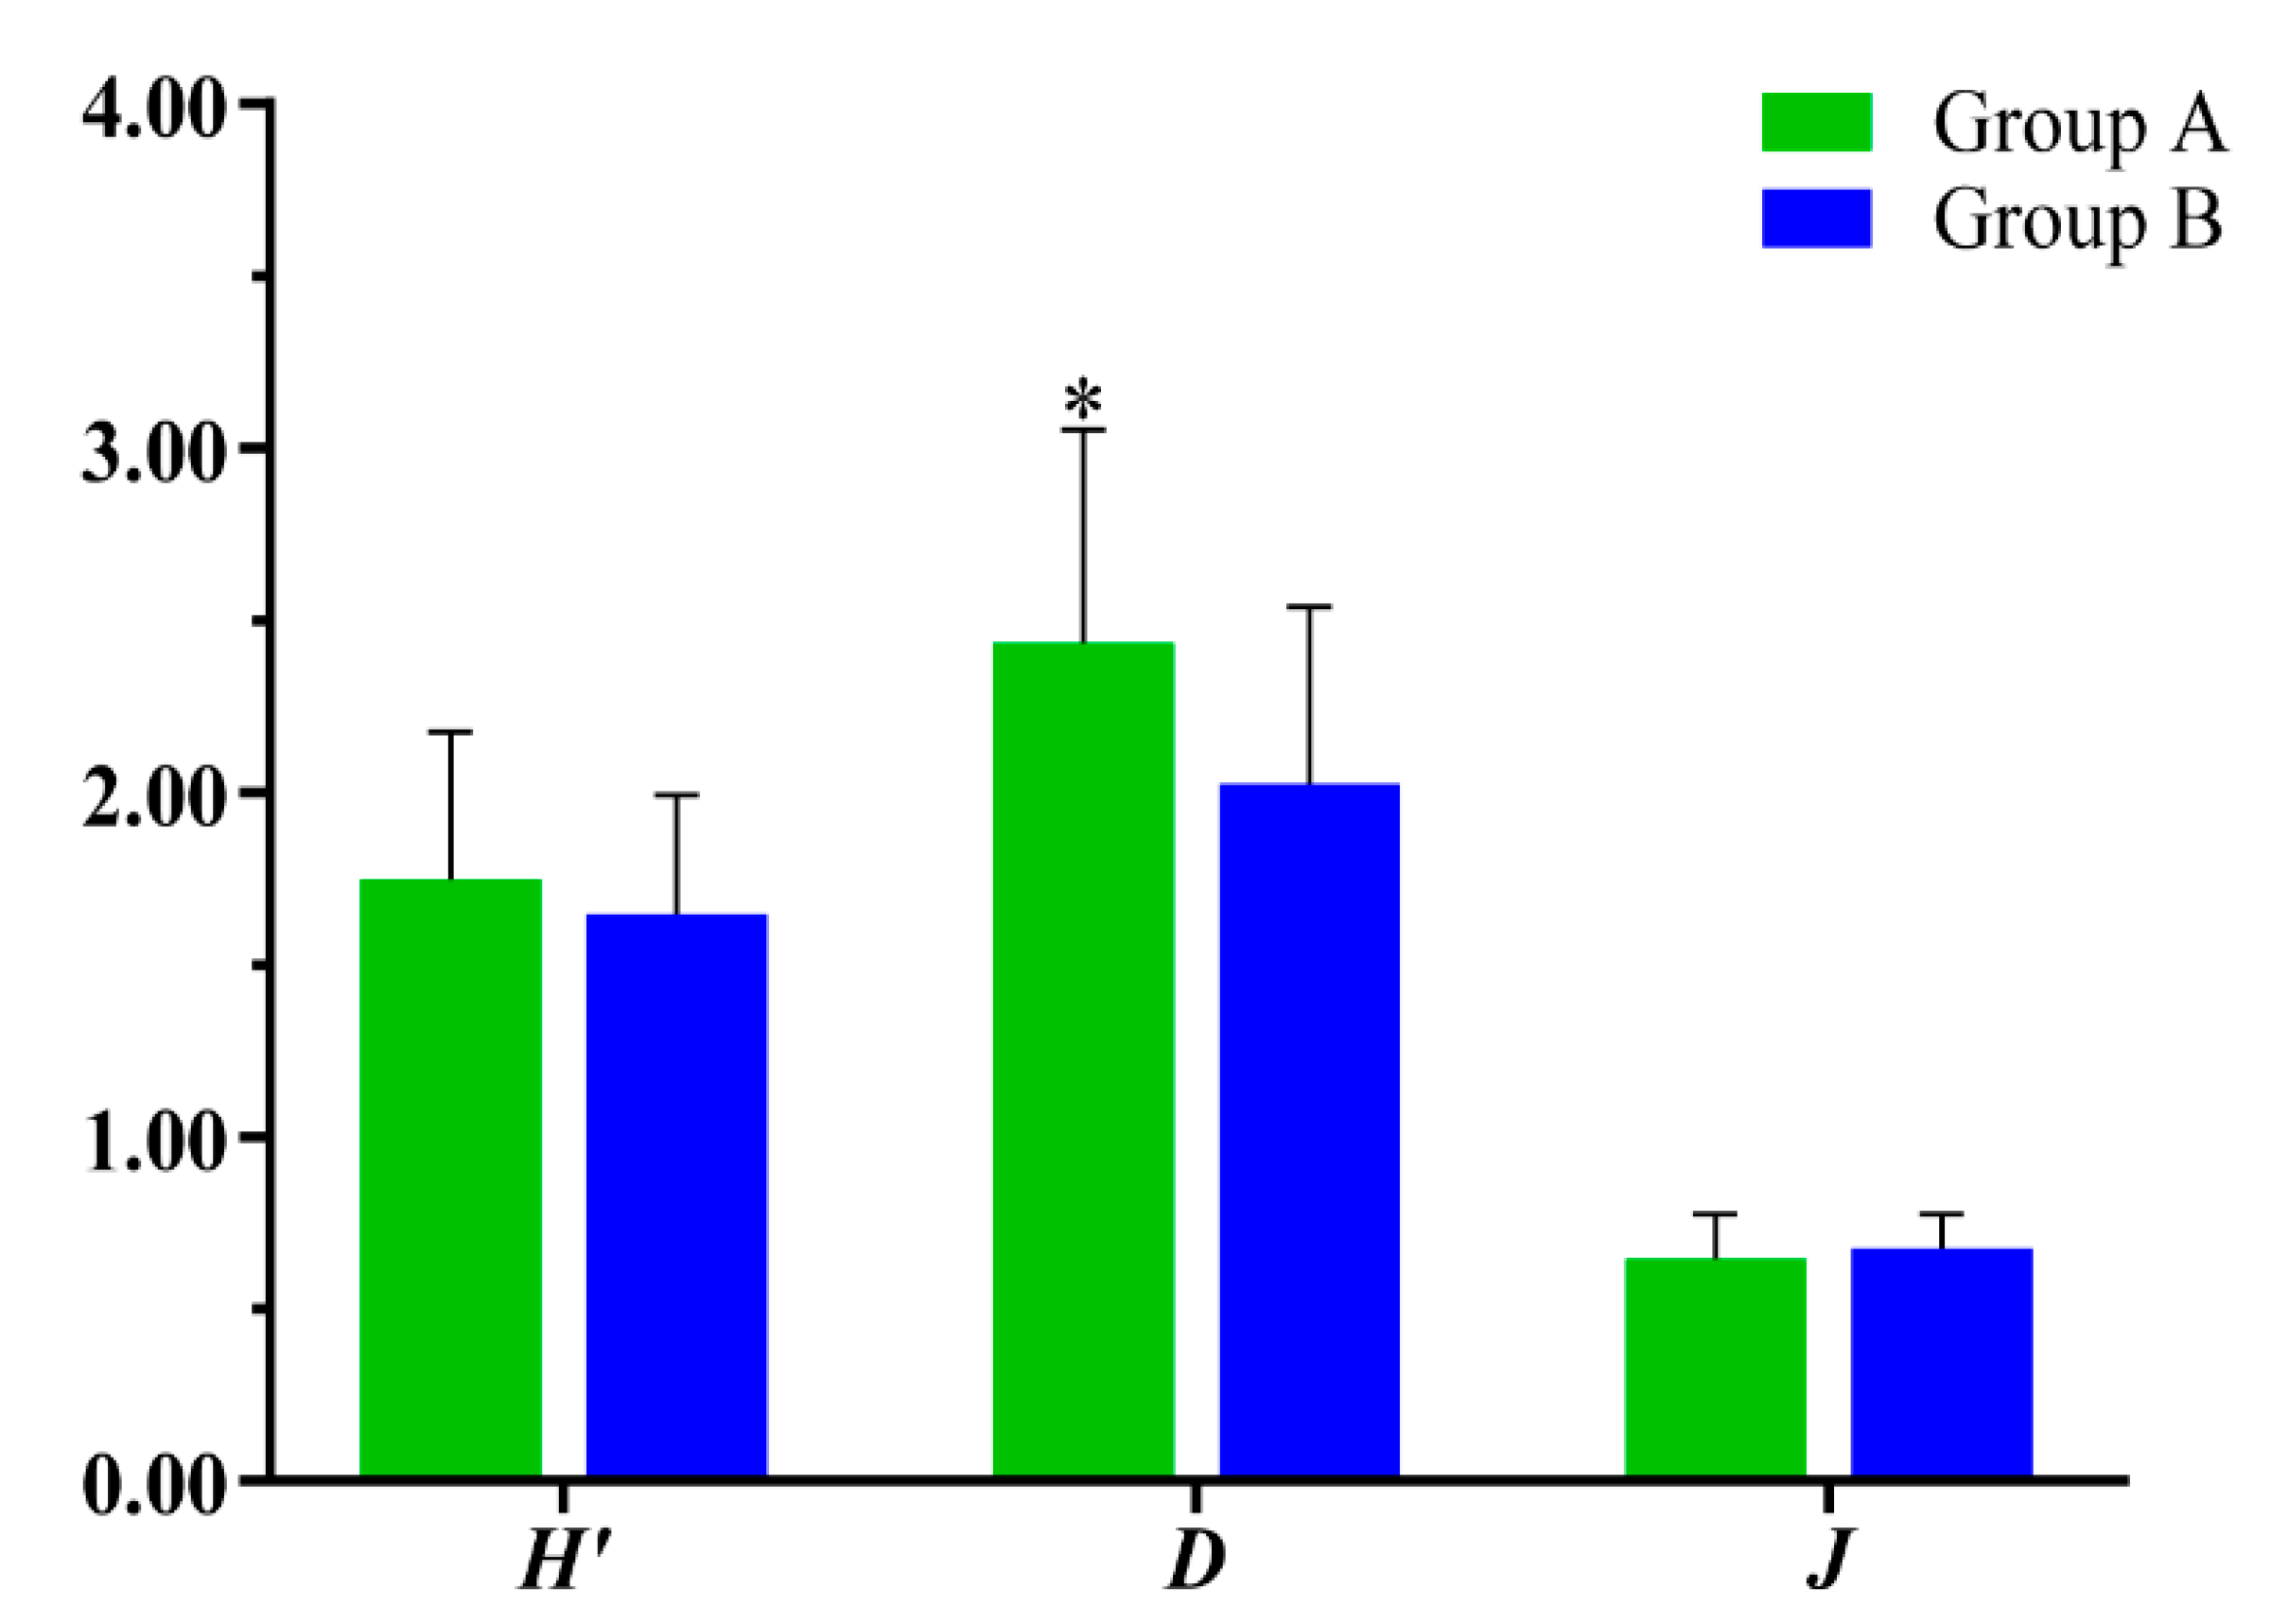
3.2. Spatial Distribution Patterns of Fish Communities
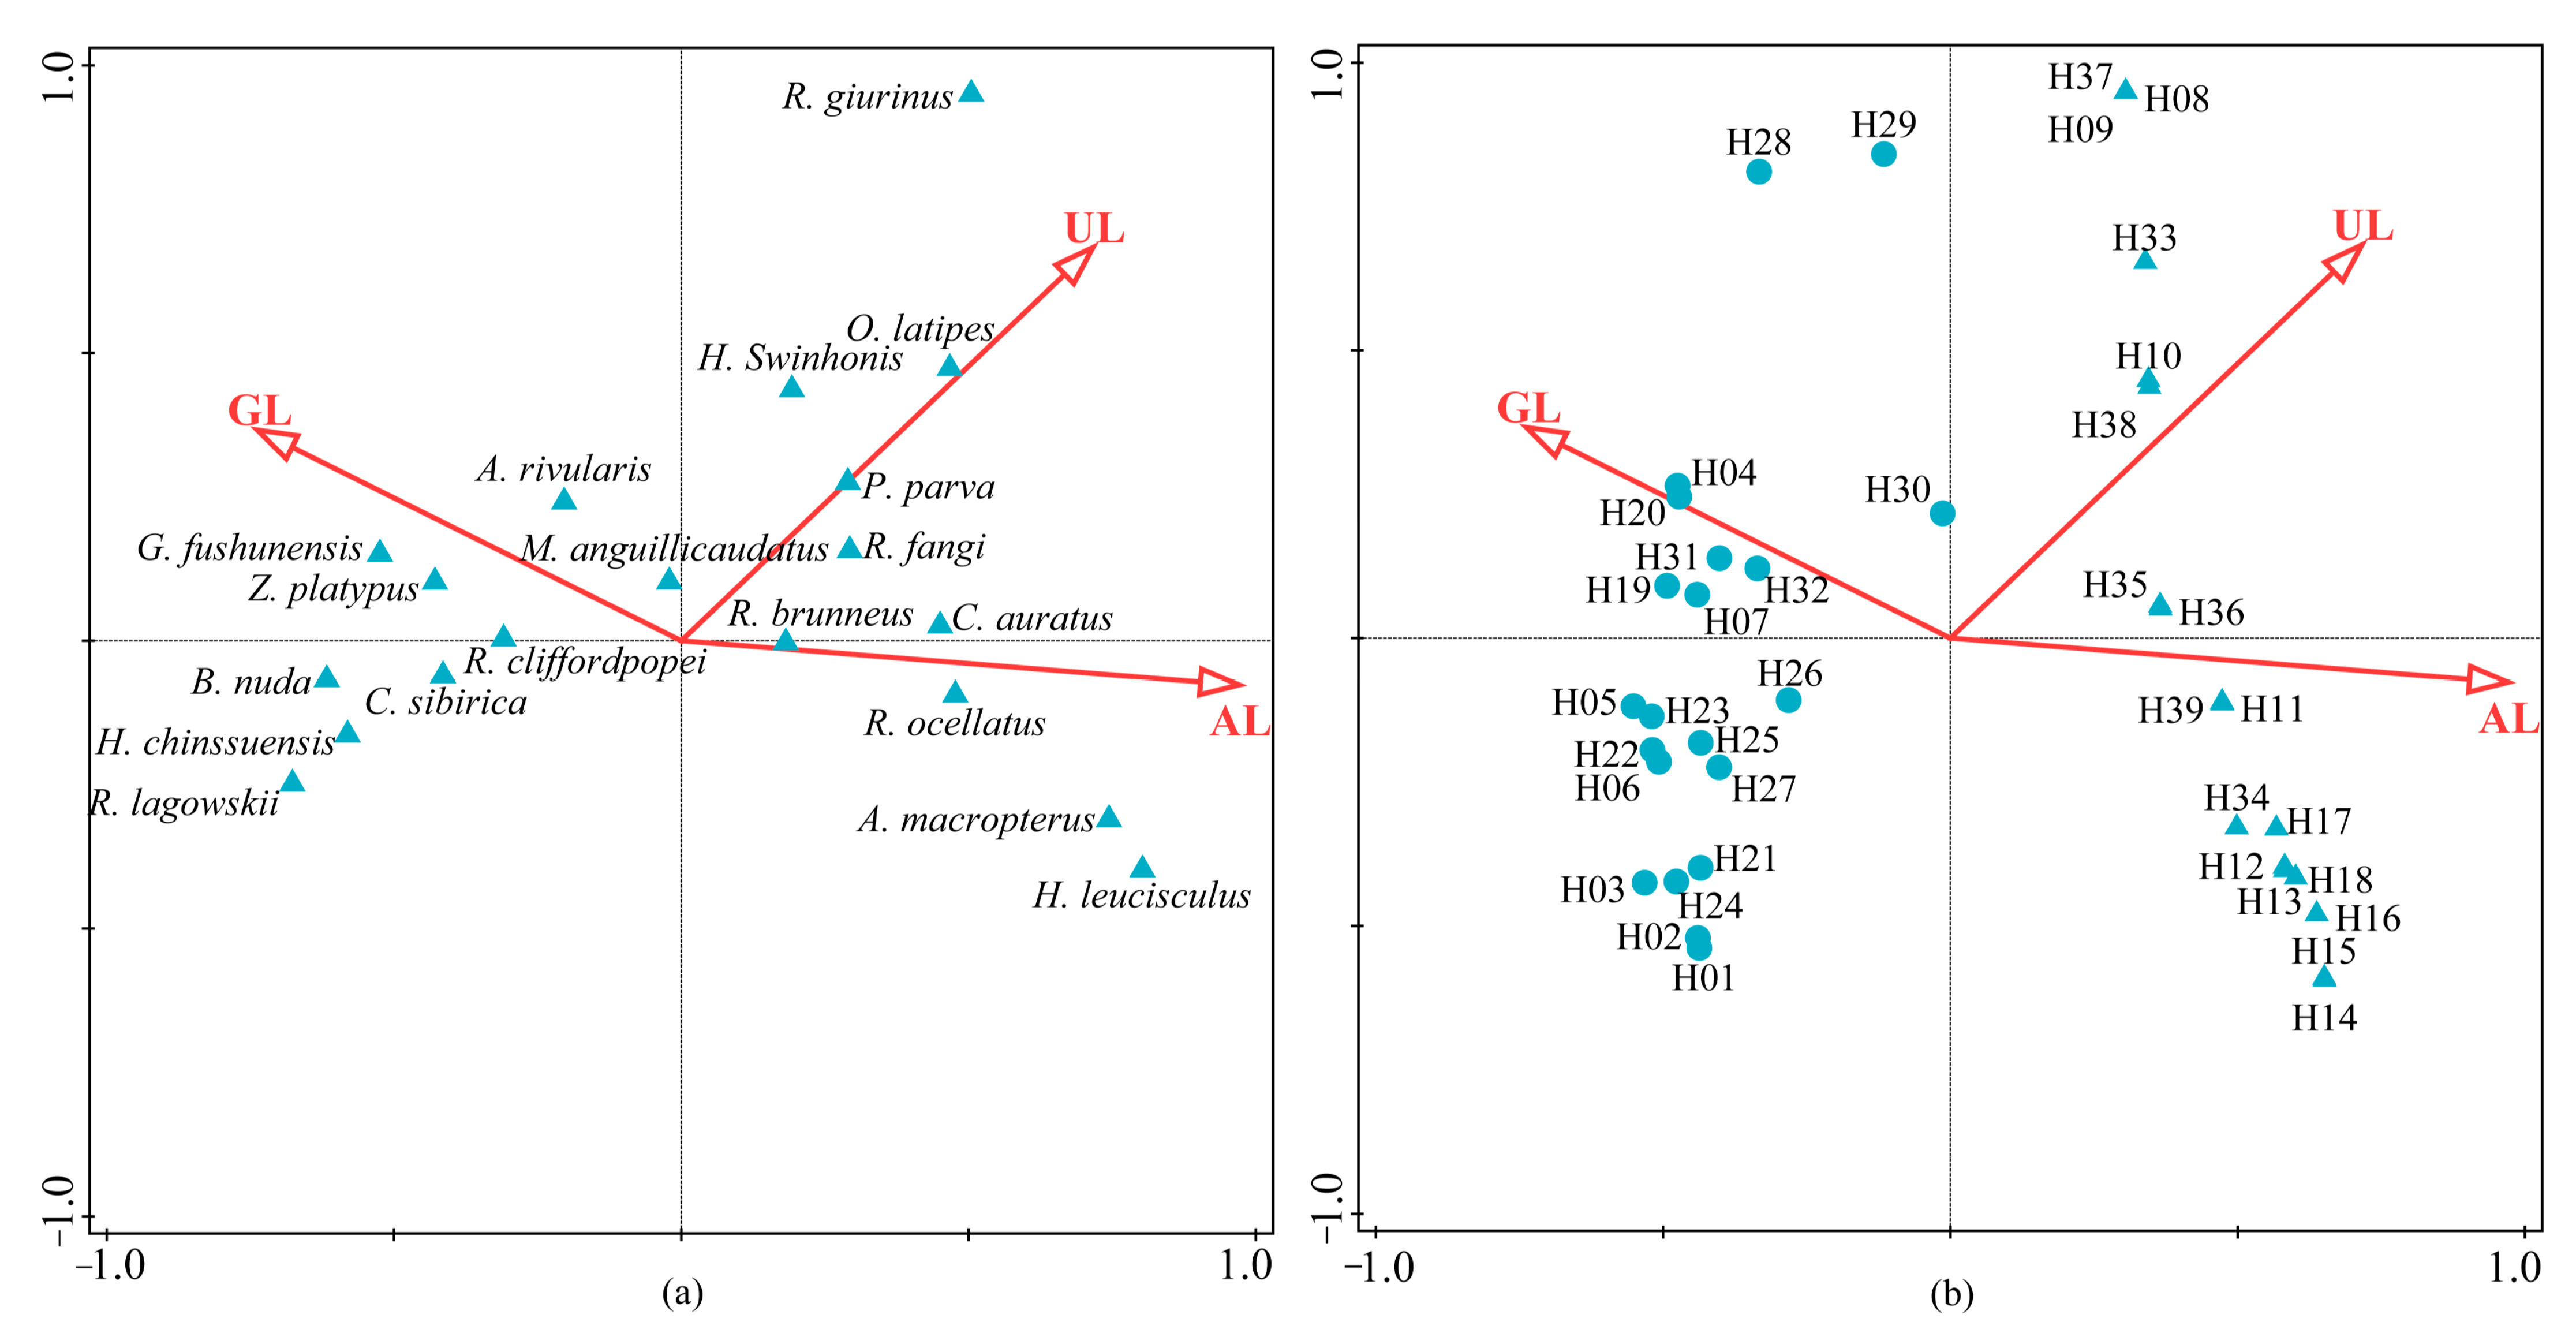
3.3. Relationships between Fish Communities and Environmental Parameters
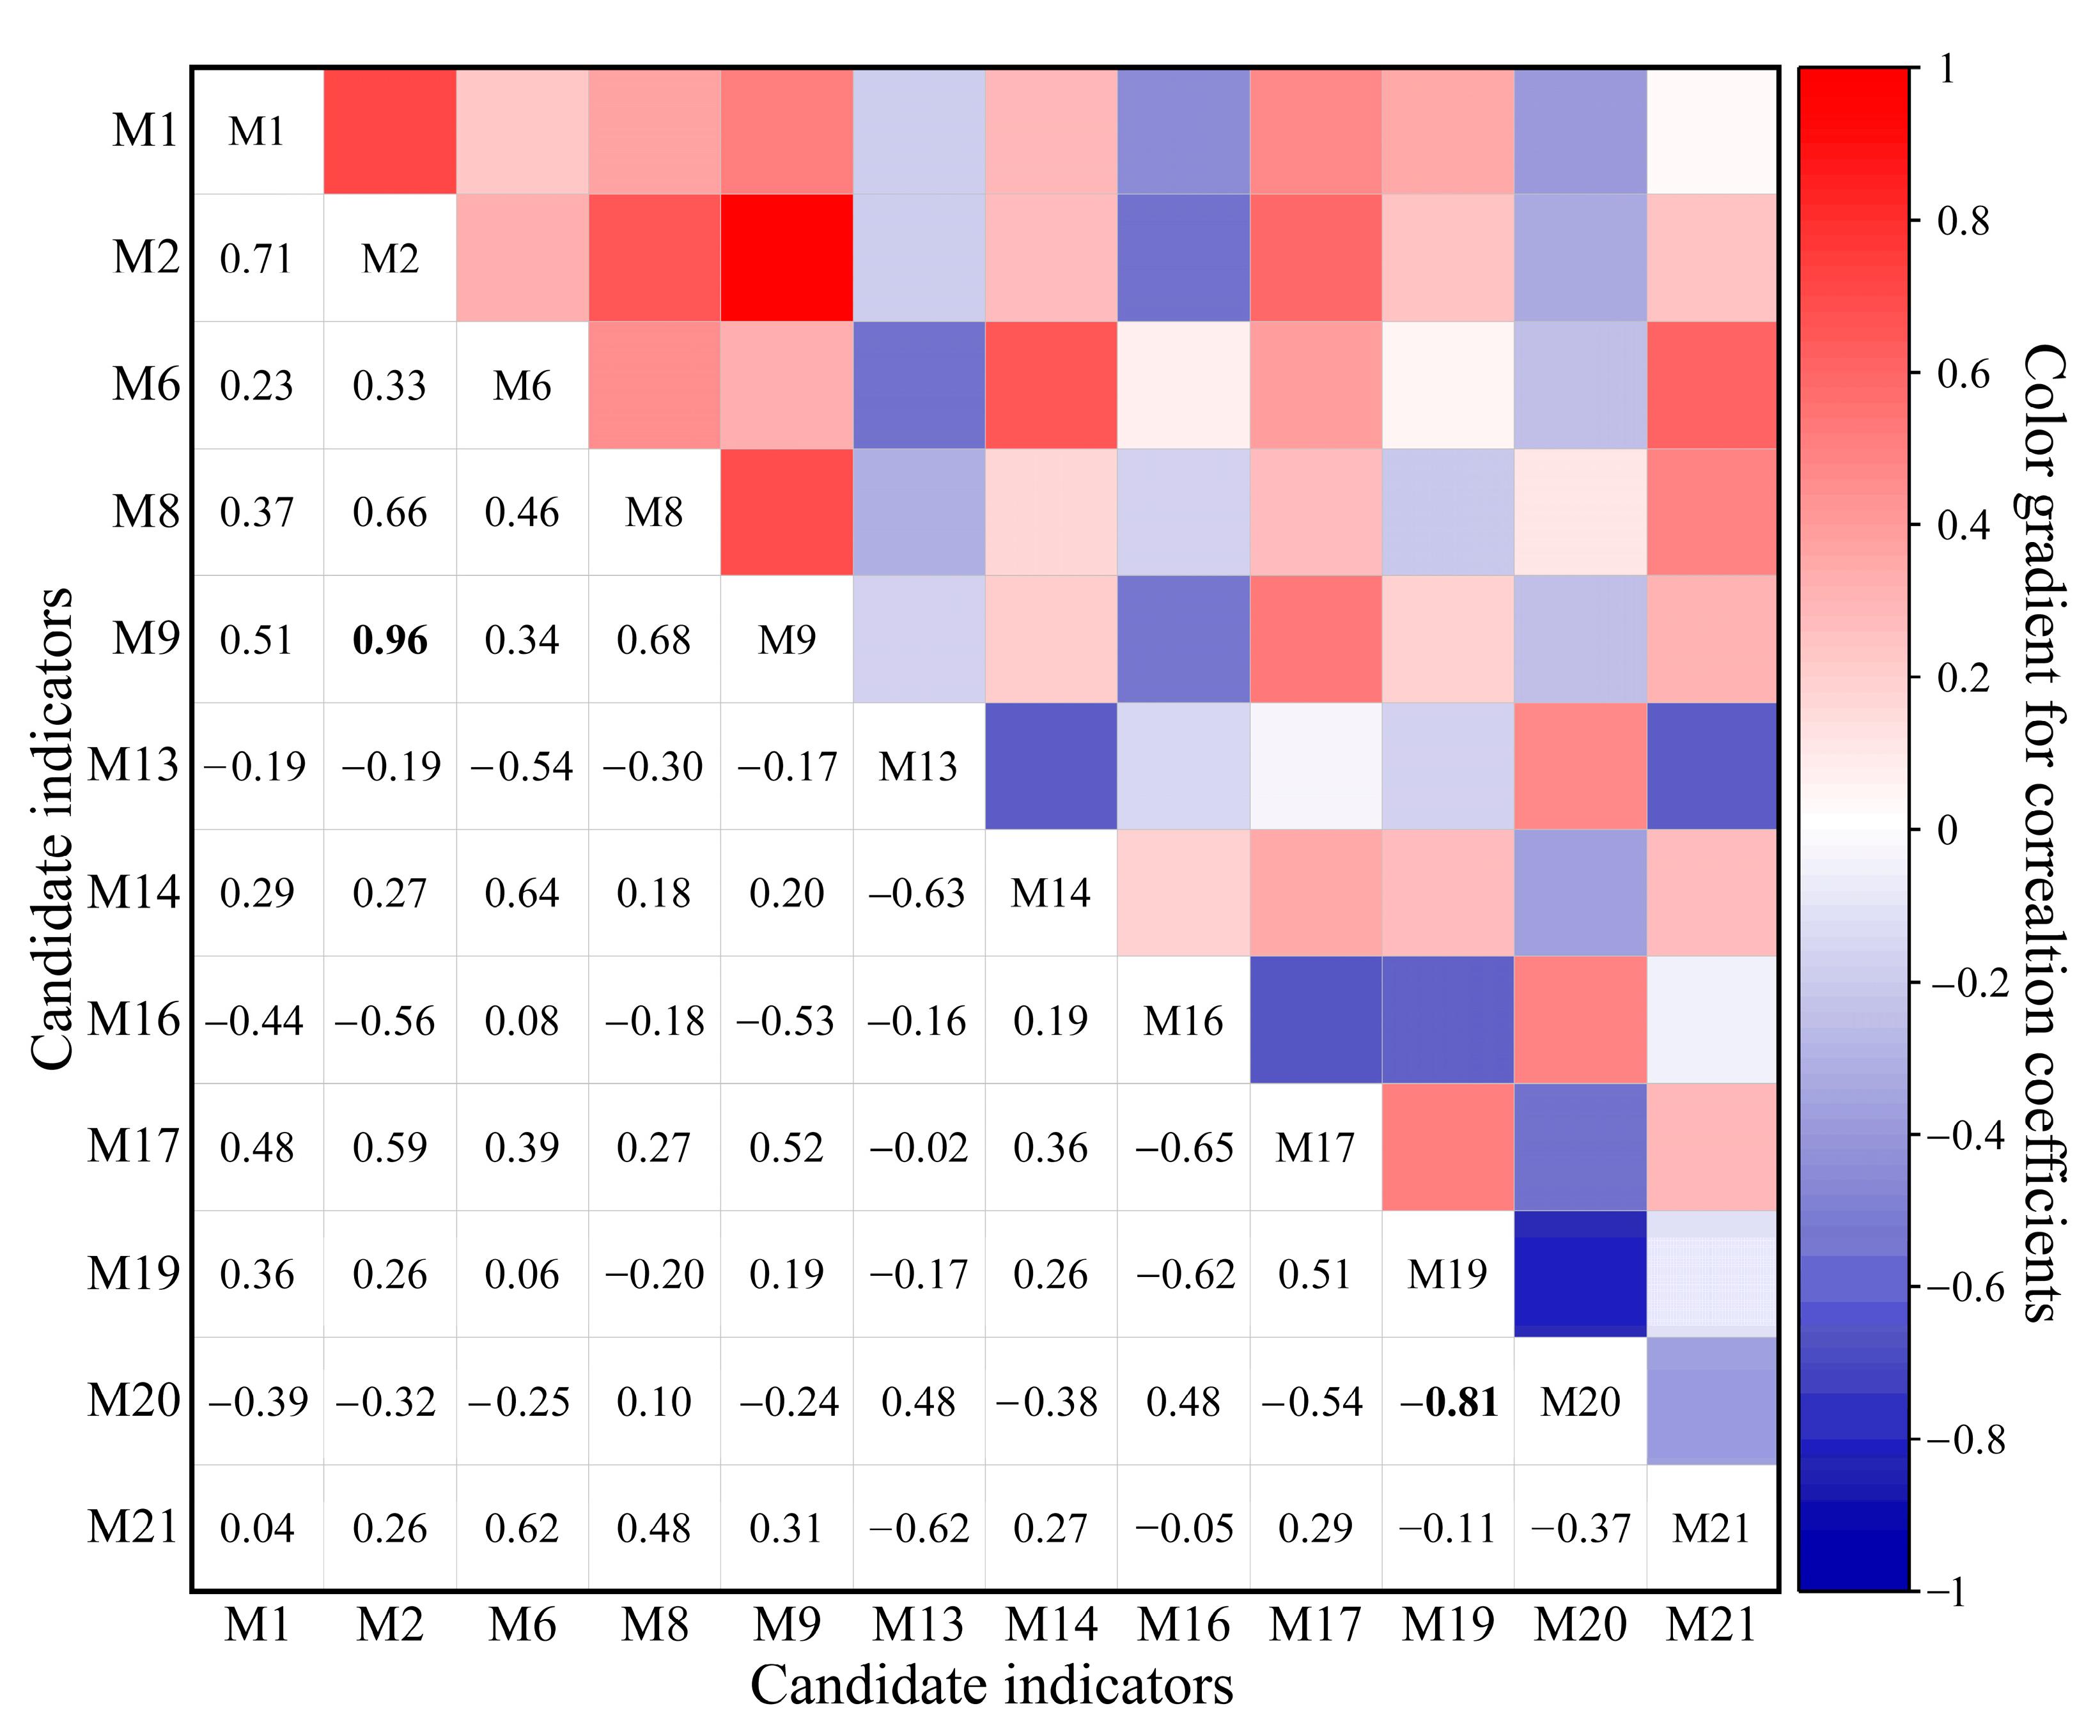
3.4. Selection of Core Metrics and Establishment of the F-IBI
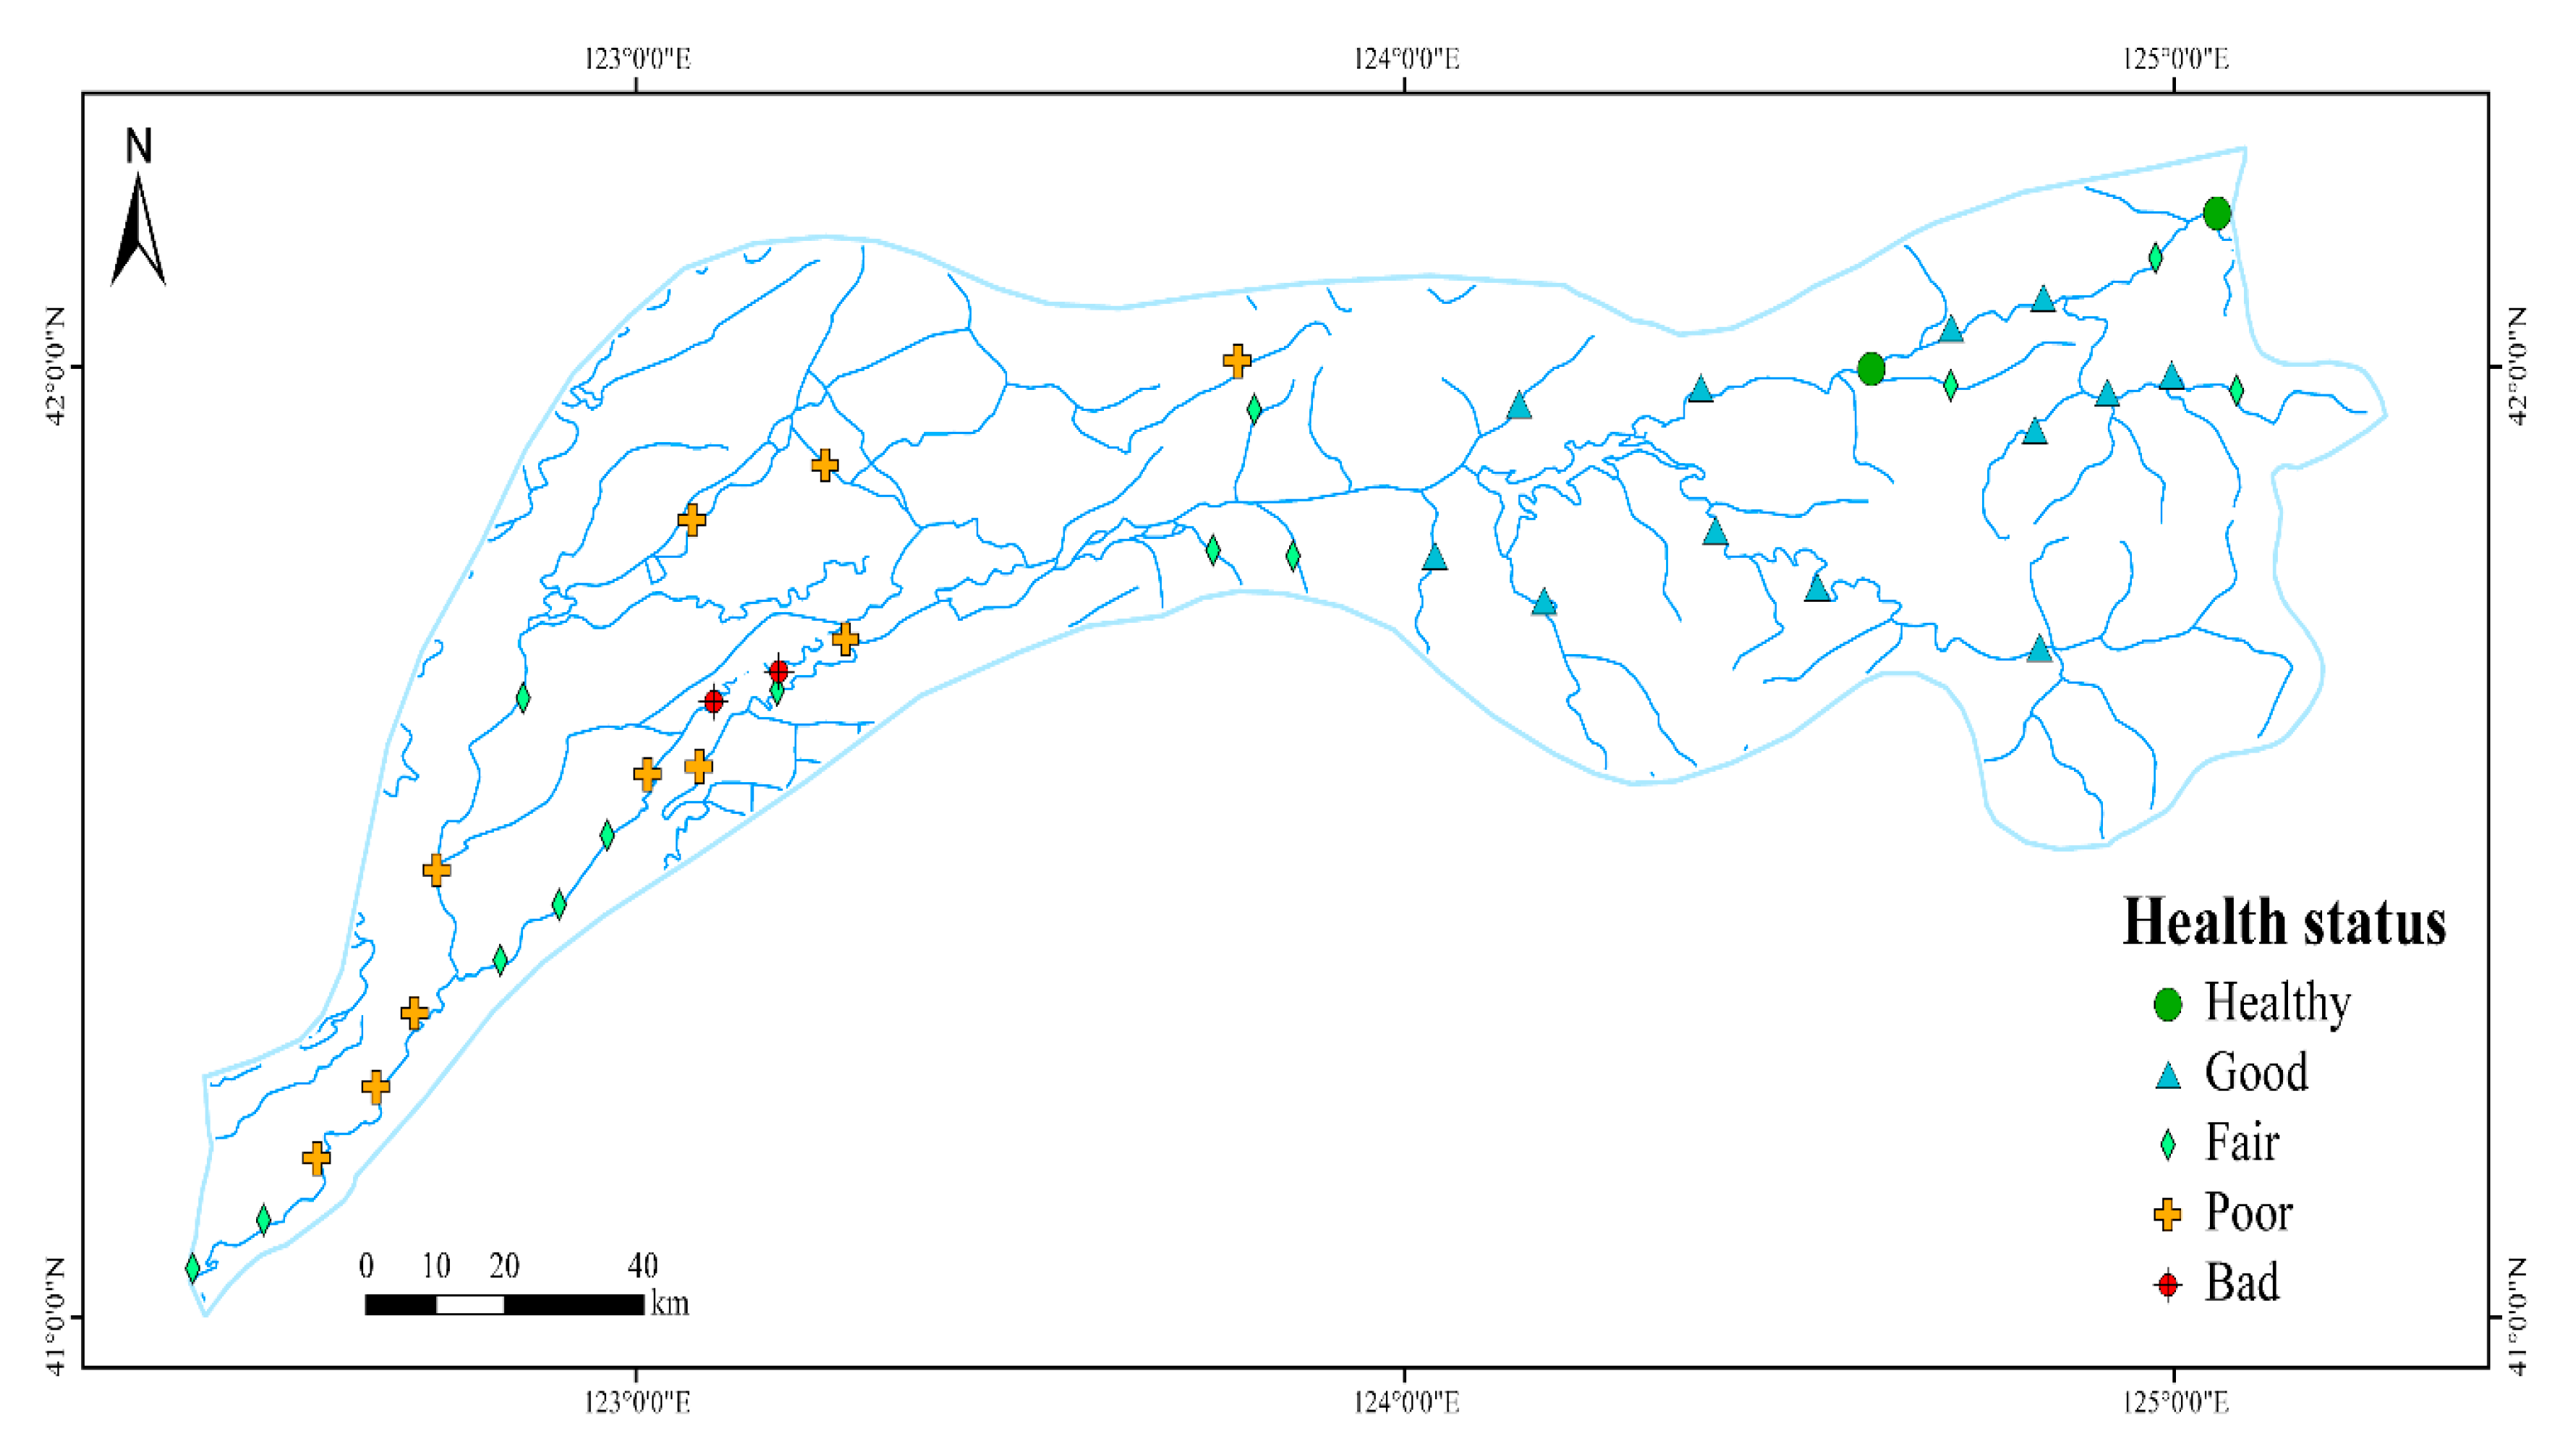
3.5. Distribution Patterns of Aquatic Ecological Health
4. Discussion
4.1. Fish Community Structures and Distribution Characteristics
4.2. Response of Fish Communities to Environmental Factors
4.3. Evaluation of Assessment Results Obtained Based on the F-IBI
4.4. Implications for Protection and Rehabilitation
5. Conclusions
- (1)
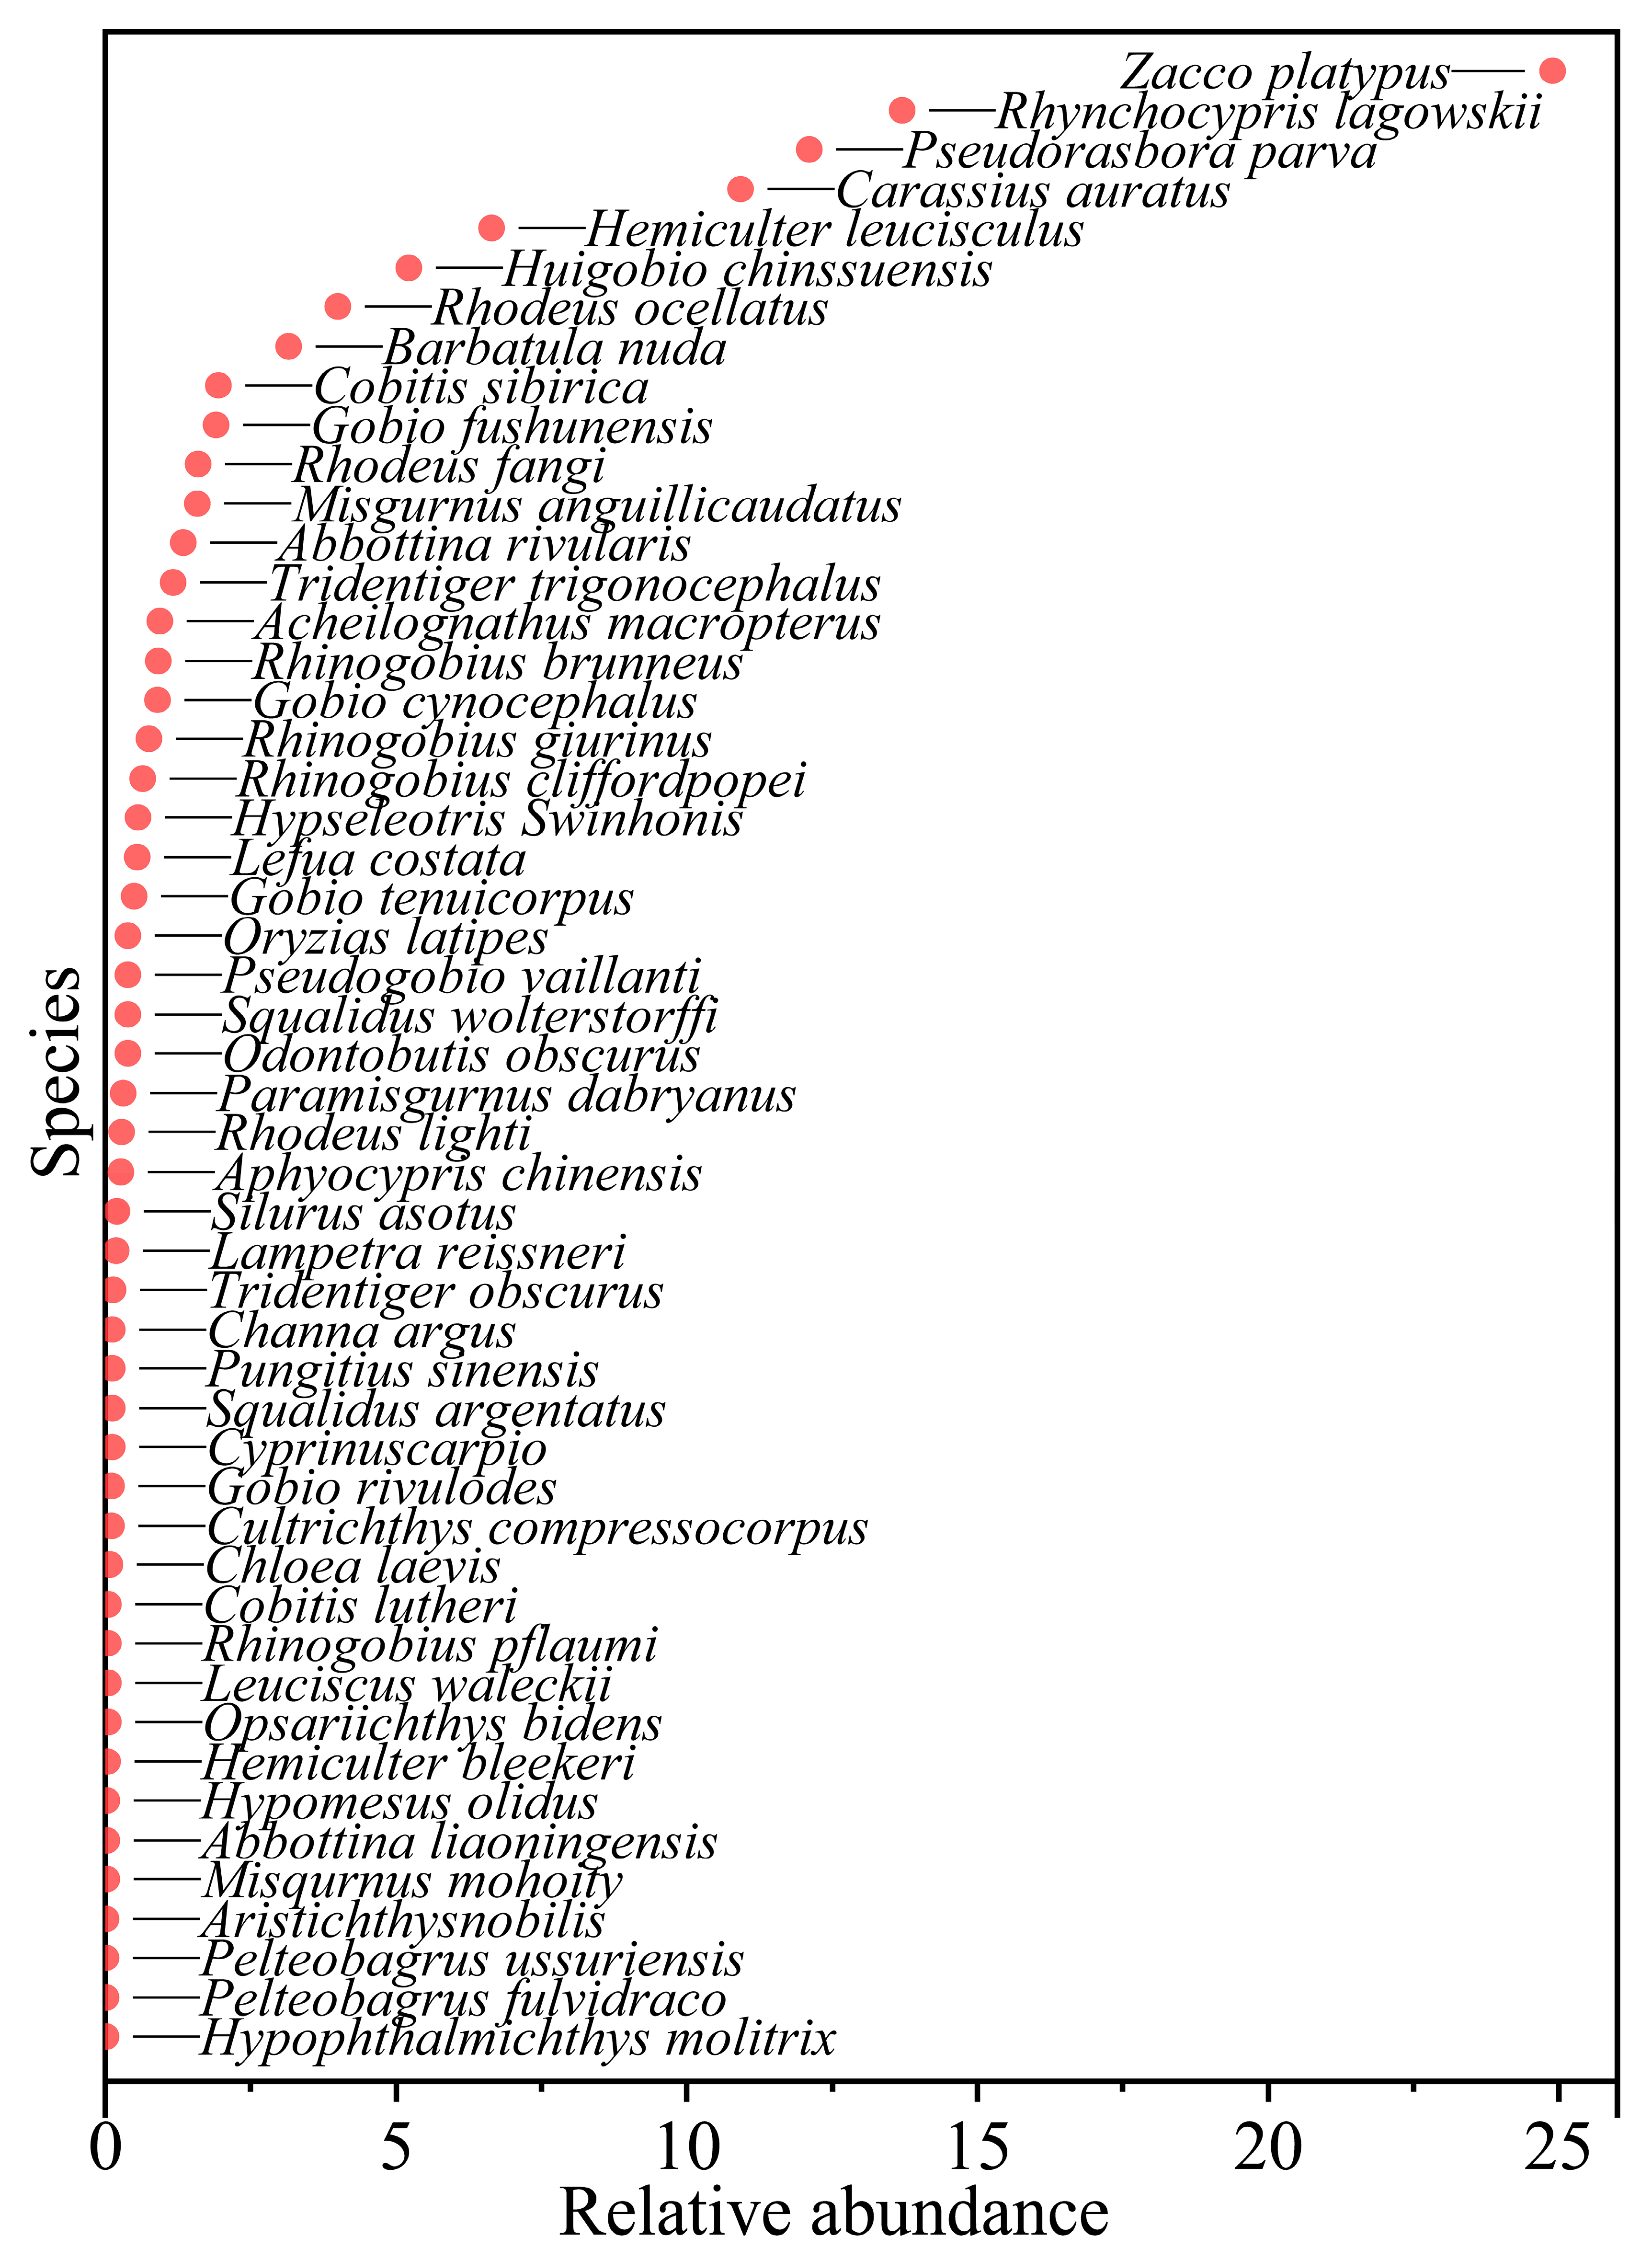
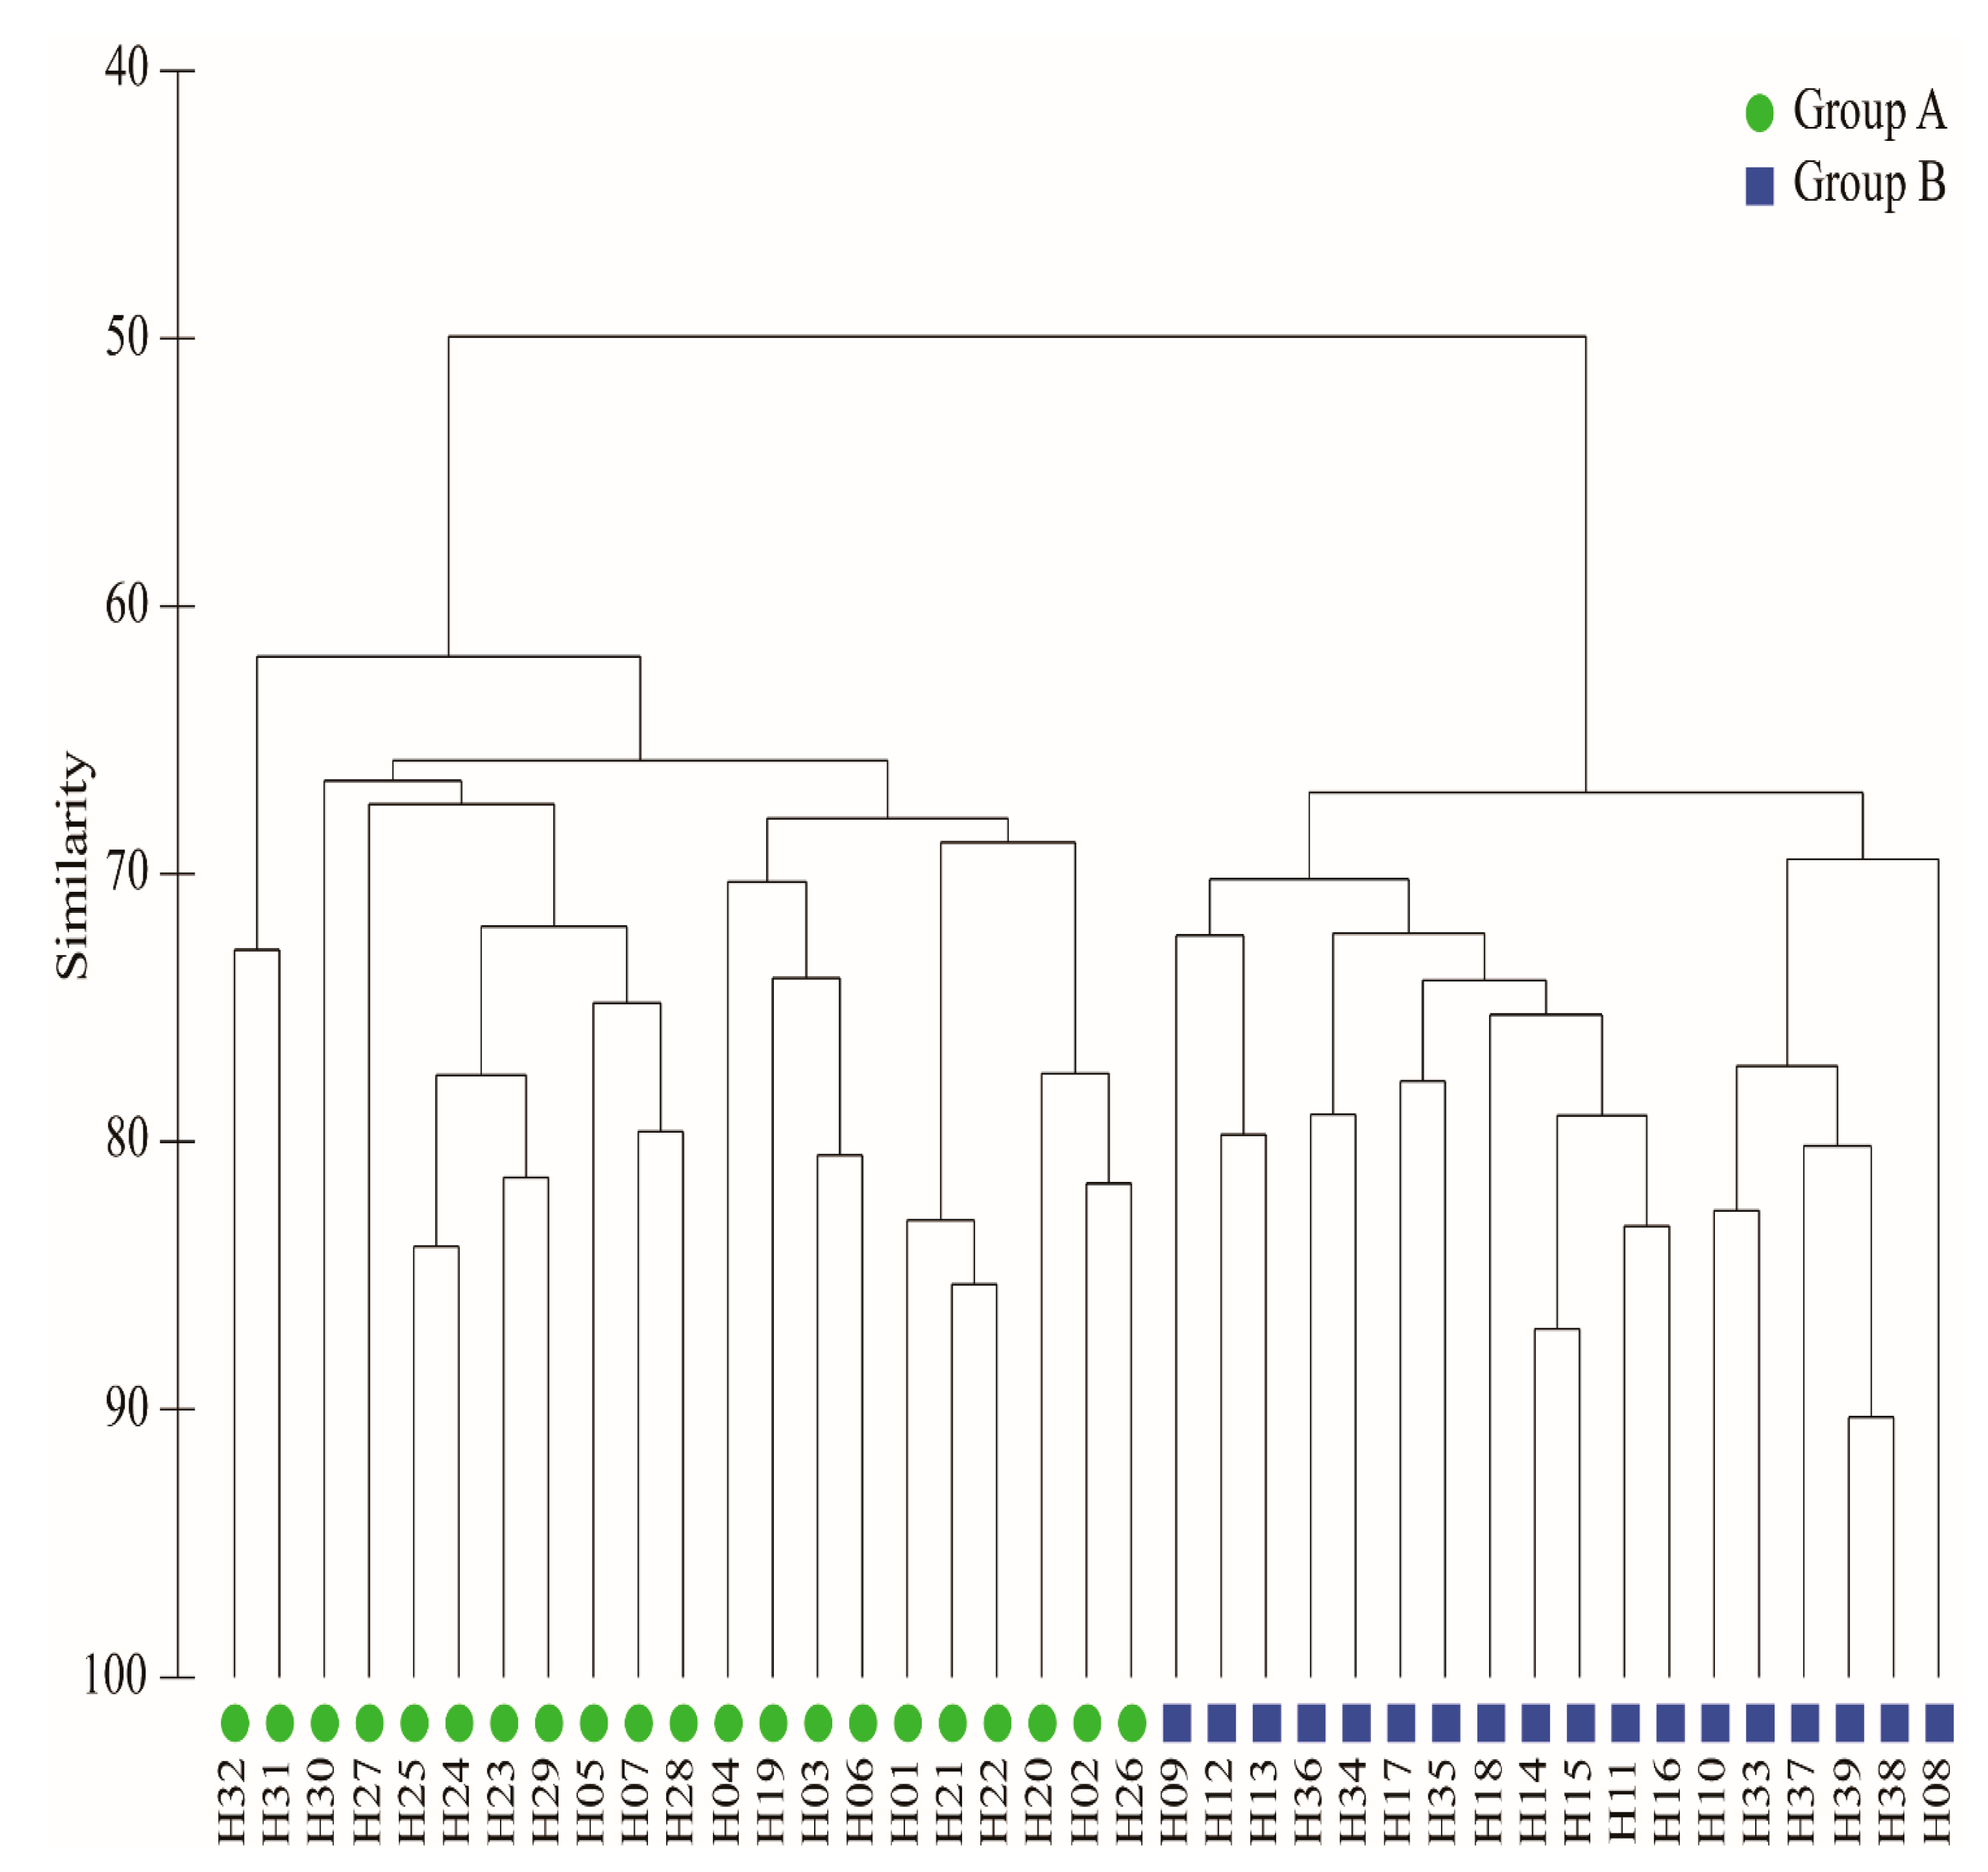
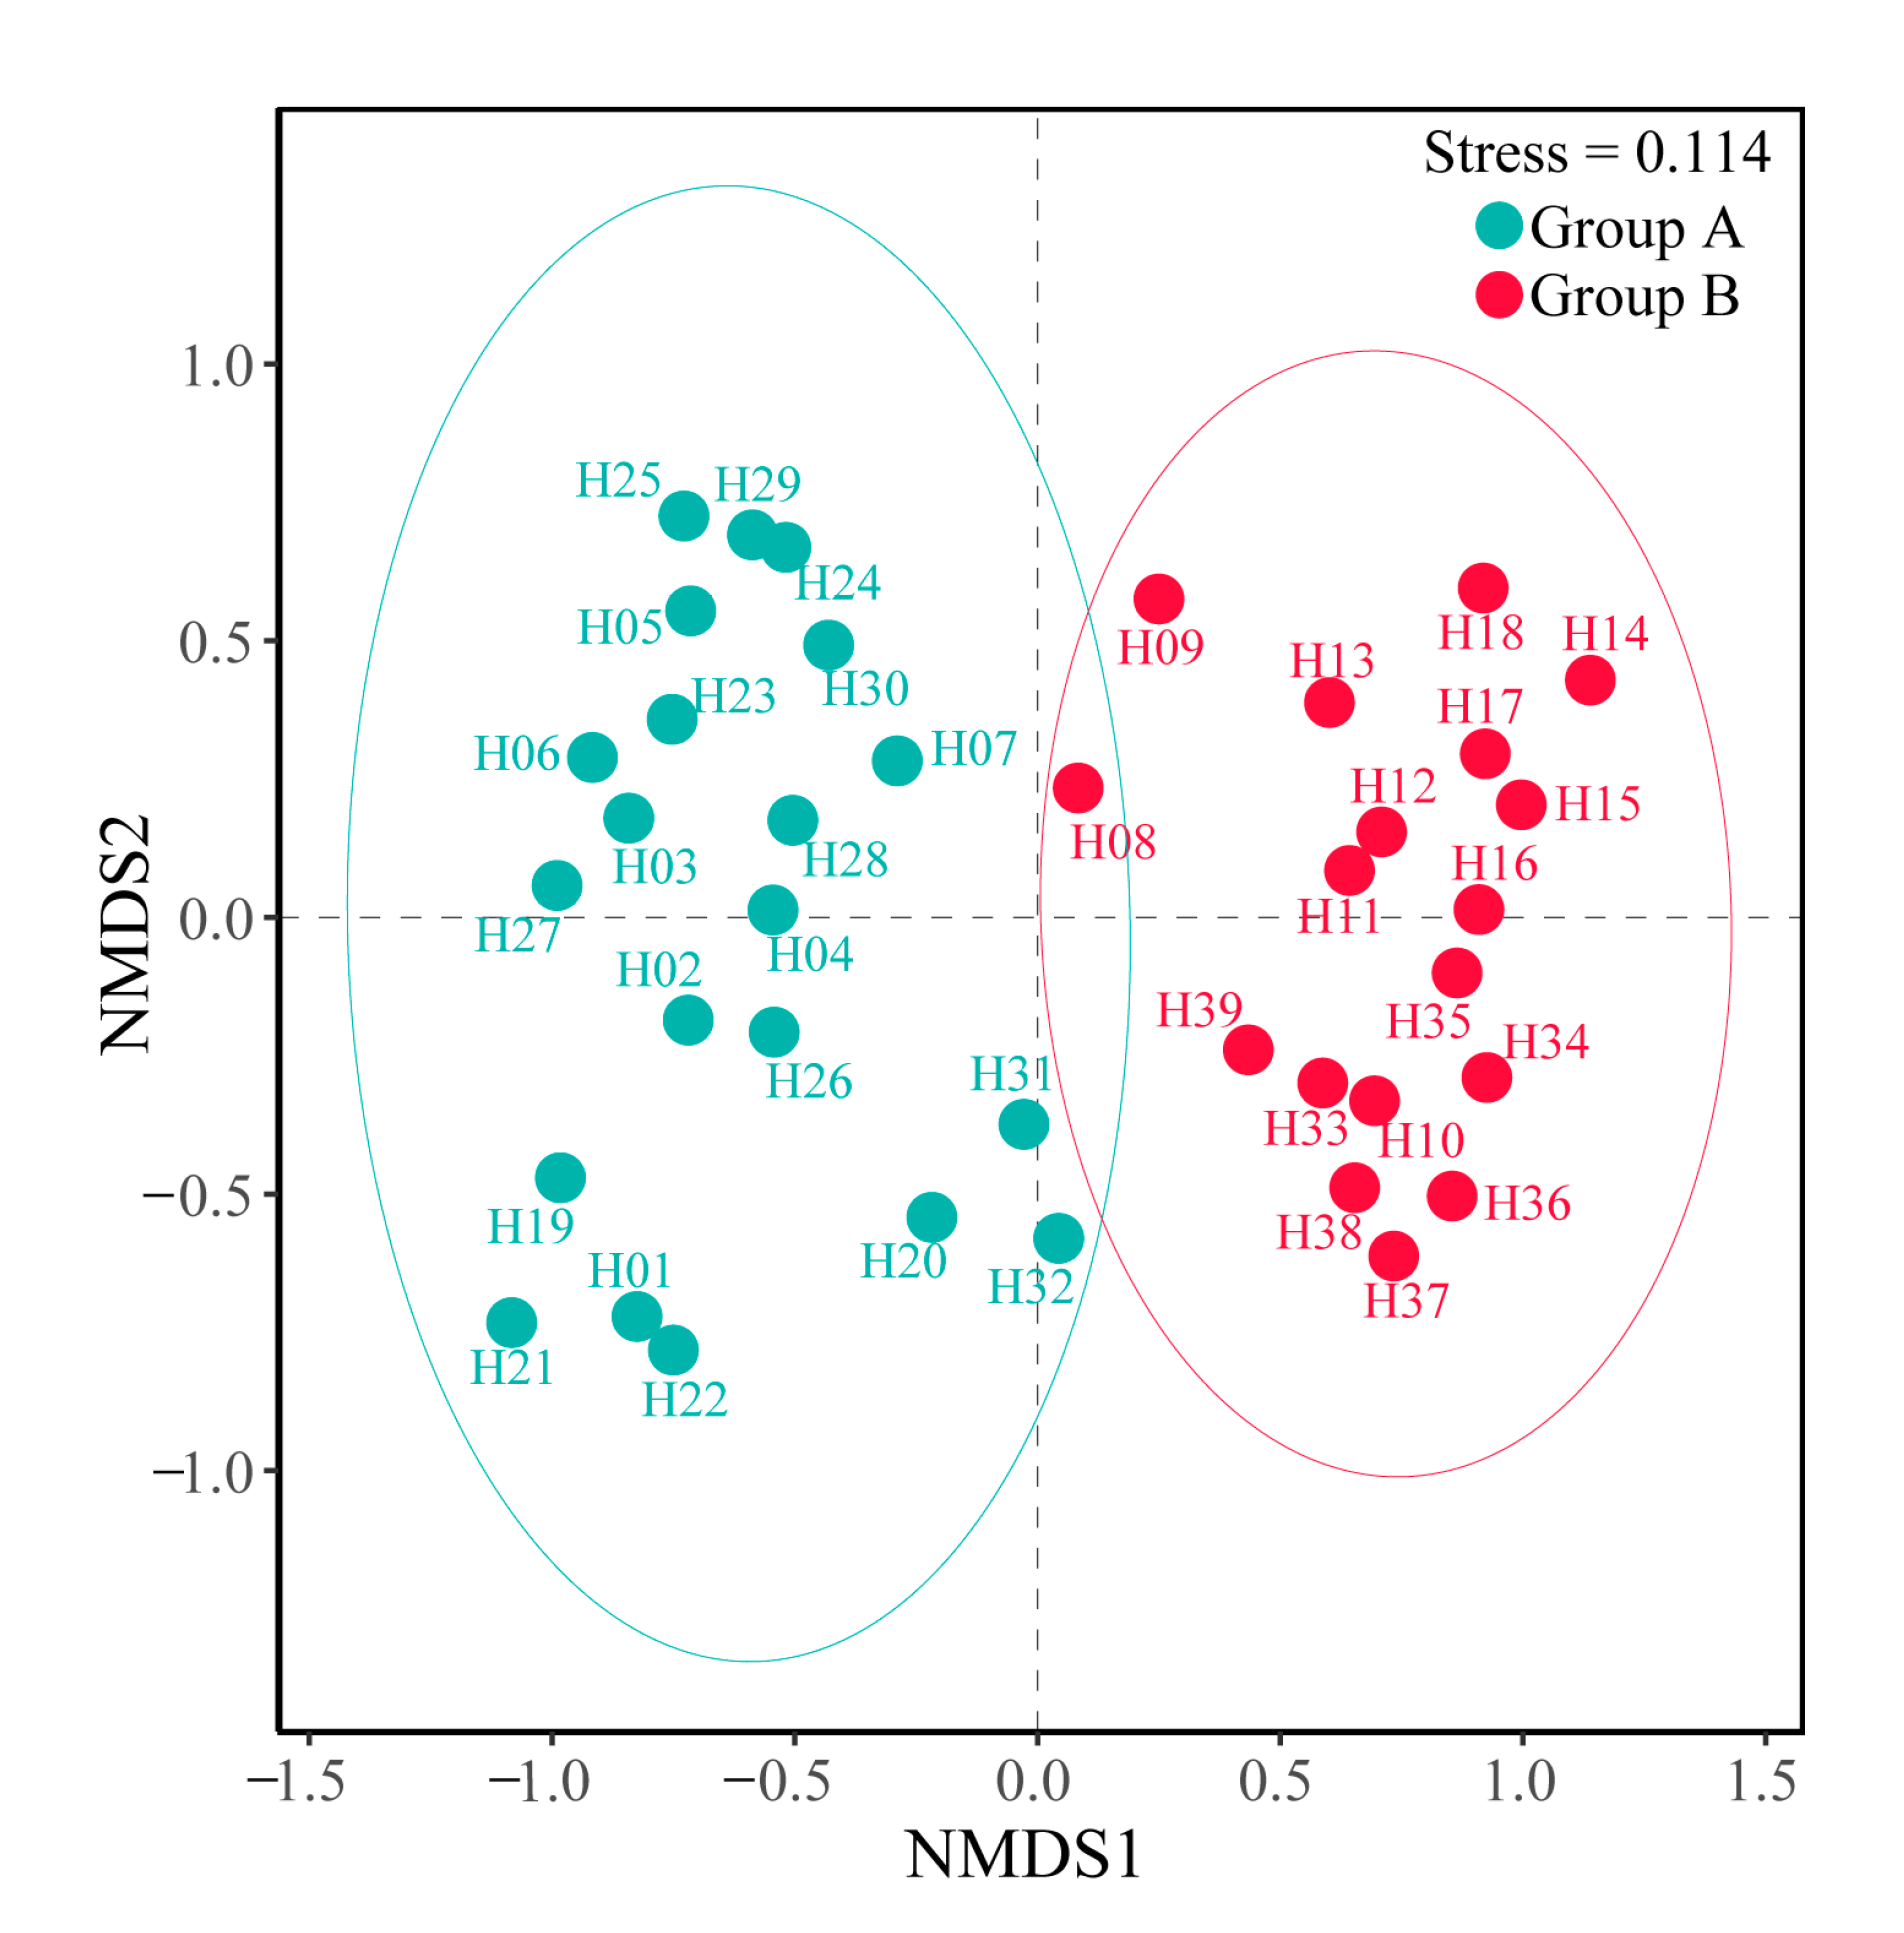
- A total of 51 species of fish were identified in the two seasons, belonging to 7 orders, 11 families and 37 genera. The dominant species of the fish community in the Hun River Basin were R. lagowskii, Z. platypus, C. auratus and P. parva. Fish communities were divided into two groups along the watershed longitudinal gradient. Agricultural land, urban land and grassland had significant effects on fish community.
- (2)
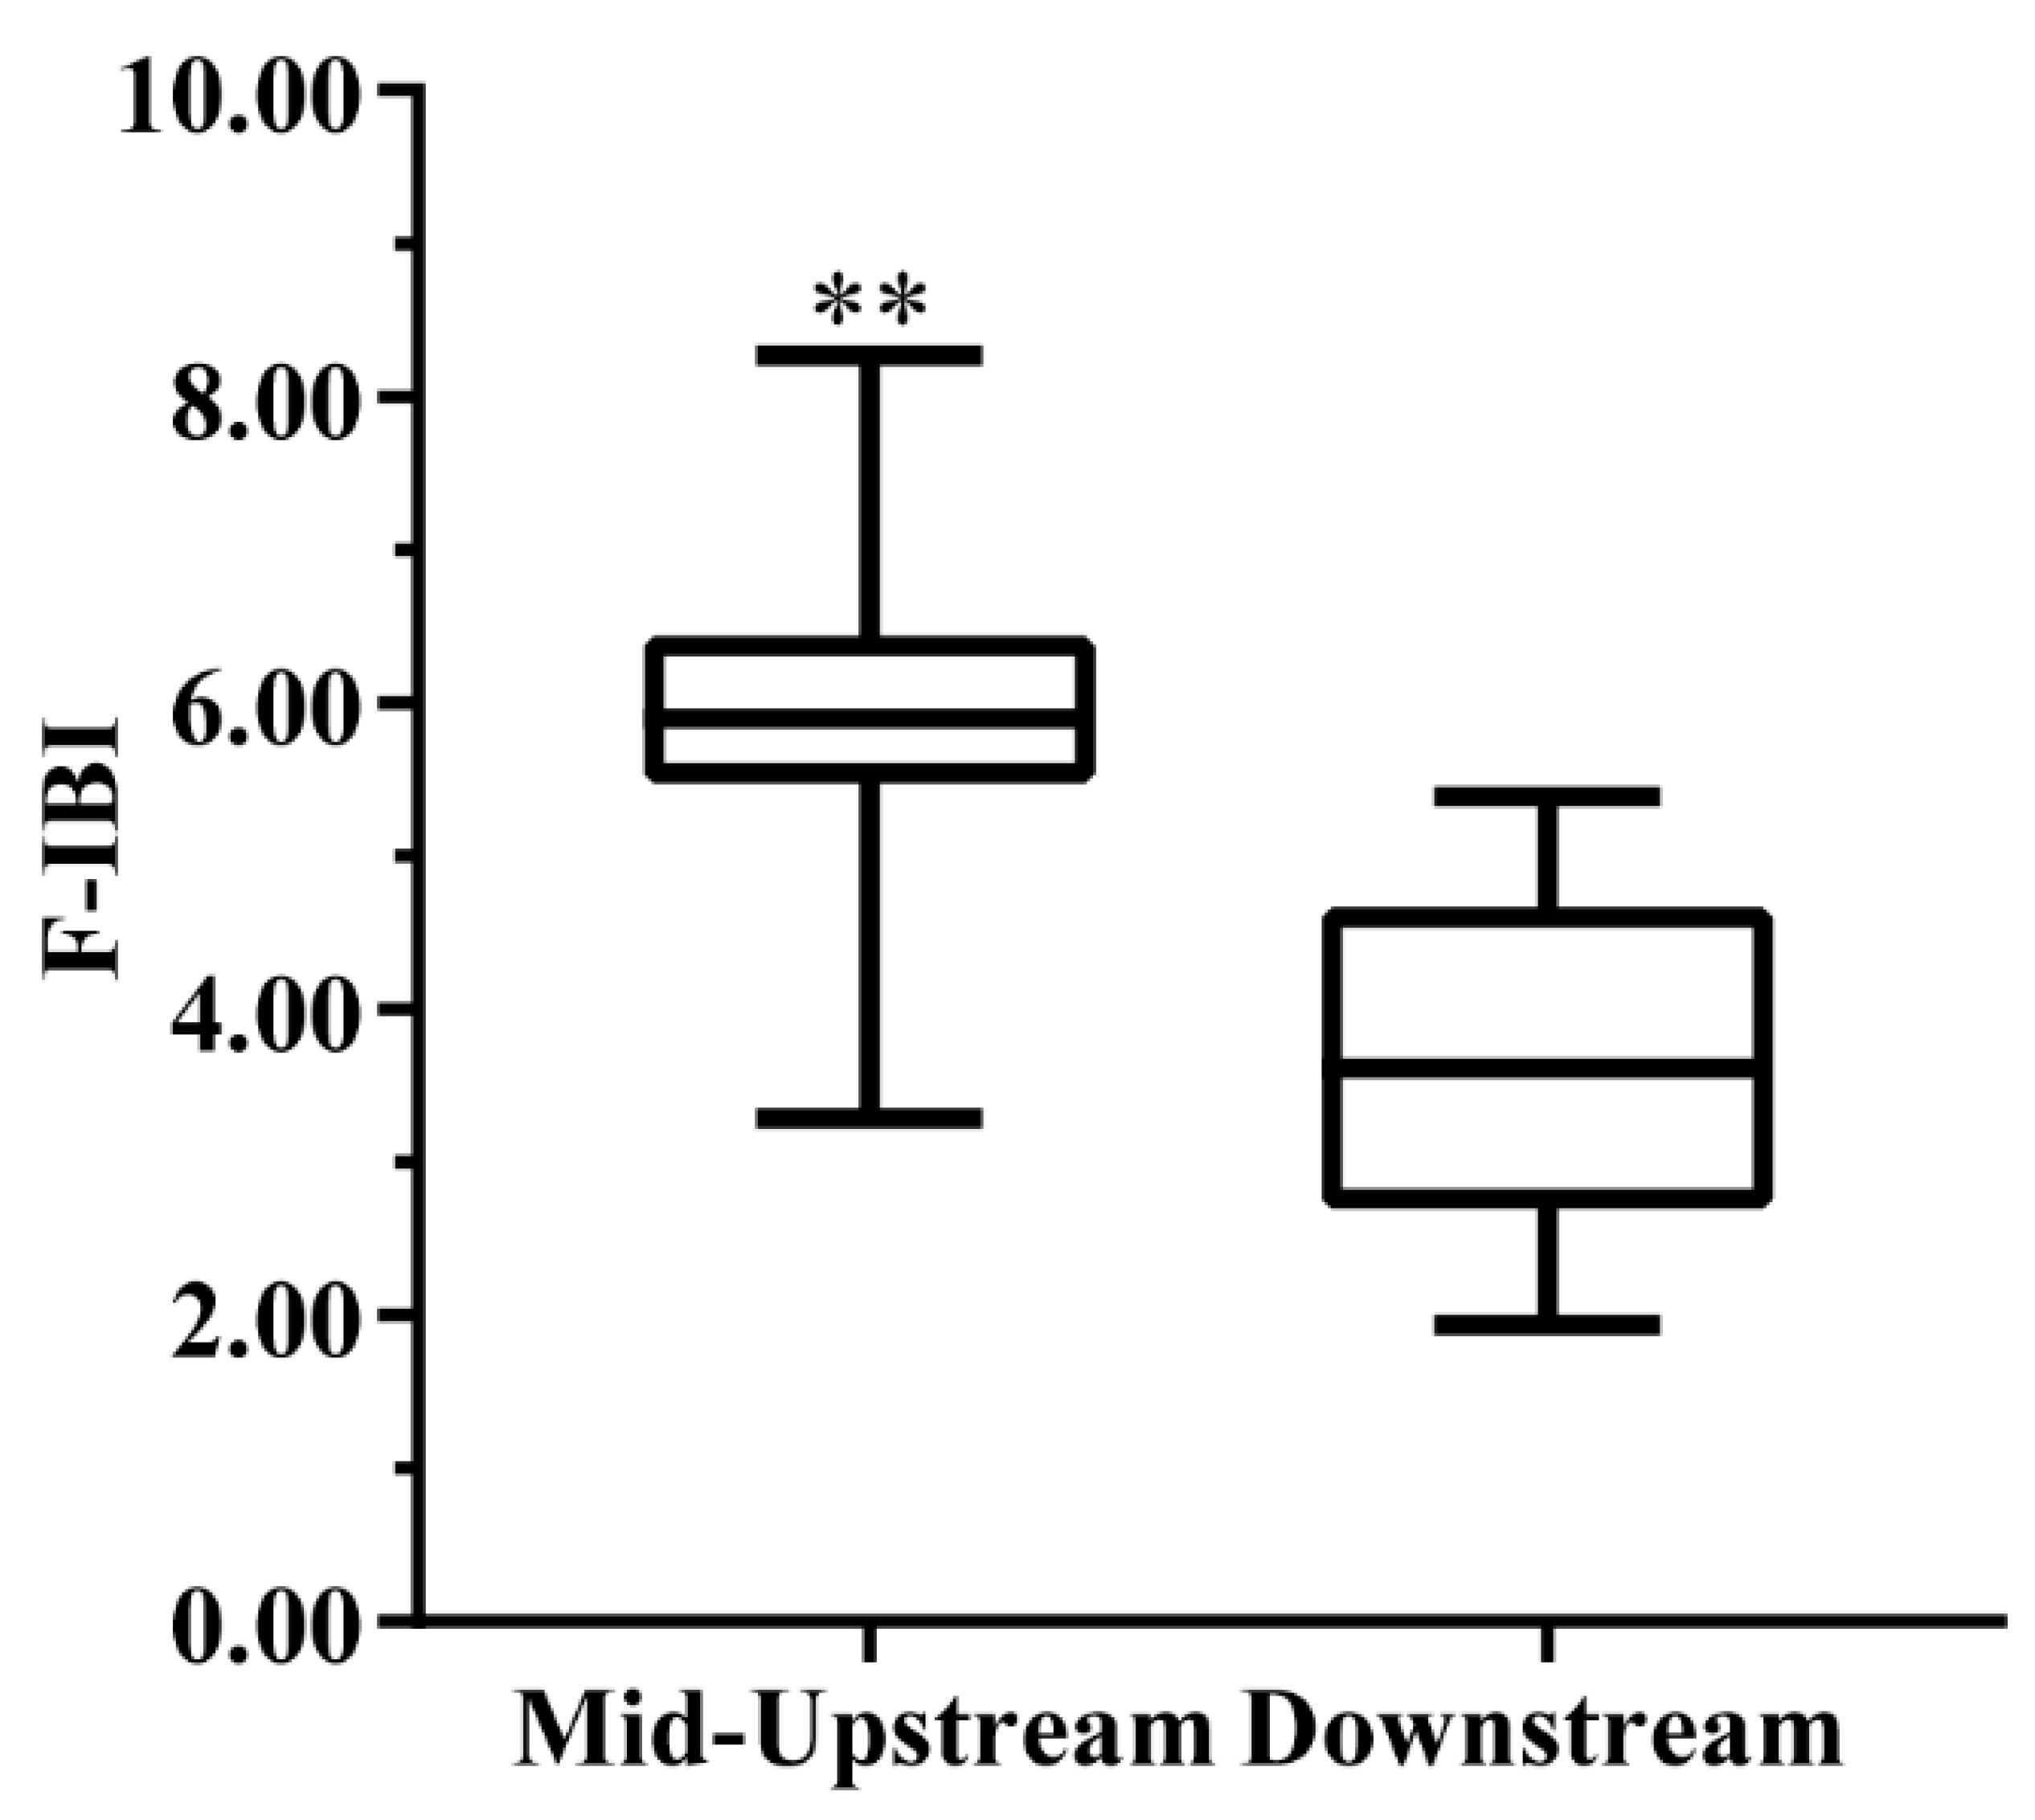
- The health status of the water bodies in the Hun River Basin was mostly at the fair level or above. The F-IBI values were significantly different in spatial distribution, and the health status of the middle and upper reaches was better. The long-term ecological restoration had improved the health status of the downstream area, to some extent.
- (3)
- According to the F-IBI assessment results, the middle and upper reaches should adopt natural habitat protection as a management goal, and the lower reaches should adopt ecological restoration as a primary goal.
Author Contributions
Funding
Institutional Review Board Statement
Informed Consent Statement
Data Availability Statement
Acknowledgments
Conflicts of Interest
References
- Cai, Q.H.; Tang, T.; Deng, H.B. Discussion on freshwater ecosystem service and its evaluation index system. Chinese J. Appl. Ecol. 2003, 14, 135–138. [Google Scholar]
- Zhao, J.; Yang, K. Estimating urban inland river ecosystem services value in Shanghai by contingent valuation method. Res. Environ. Sci. 2004, 17, 49–52. [Google Scholar]
- Gal, B.; Szivak, I.; Heino, J.; Schmera, D. The effect of urbanization on freshwater macroinvertebrates-knowledge gaps and future research directions. Ecol. Indic. 2019, 104, 357–364. [Google Scholar] [CrossRef]
- Tagliaferro, M.; Giorgi, A.; Torremorell, A.; Albarino, R. Urbanisation reduces litter breakdown rates and affects benthic invertebrate structure in Pampean streams. Int. Rev. Hydrobiol. 2020, 105, 33–43. [Google Scholar] [CrossRef]
- Zhang, J.; Su, H.; Sheng, C.H.; Chong, X.Y.; Yin, X.W.; Xu, Z.X.; Zhang, Y. Construction of an evaluation system to assess the ecosystem integrity of the Hun-Tai River. Res. Environ. Sci. 2020, 33, 363–374. [Google Scholar]
- Helson, J.E.; Williams, D.D. Development of a macroinvertebrate multimetric index for the assessment of low-land streams in the neotropics. Ecol. Indic. 2013, 29, 167–178. [Google Scholar] [CrossRef]
- Huang, Q.; Gao, J.F.; Cai, Y.J.; Yin, H.B.; Gao, Y.N.; Zhao, J.H.; Liu, L.Z.; Huang, J.C. Development and application of benthic macroinvertebrate-based multimetric indices for the assessment of streams and rivers in the Taihu Basin, China. Ecol. Indic. 2015, 48, 649–659. [Google Scholar] [CrossRef]
- Karr, J.R. Assessment of biotic integrity using fish community. Fisheries 1981, 6, 21–27. [Google Scholar] [CrossRef]
- Jungwirth, M.; Muhar, S.; Schmutz, S. Assessing the ecological integrity of running waters. Hydrobiologia 2000, 422/423, 85–97. [Google Scholar] [CrossRef]
- Zalack, J.T.; Smucker, N.J.; Vis, M.L. Development of a diatom index of biotic integrity for acid mine drainage impacted streams. Ecol. Indic. 2010, 10, 287–295. [Google Scholar] [CrossRef]
- Karr, J.R.; Rossano, E.M. Applying public health lessons to protect river health. Ecol. Civ. Eng. 2001, 4, 3–18. [Google Scholar] [CrossRef]
- Kerans, B.L.; Karr, J.R. A benthic index of biotic integrity (B-IBI) for rivers of the Tennessee Valley. Ecol. Appl. 1994, 4, 768–785. [Google Scholar] [CrossRef]
- Griffitth, M.B.; Hill, B.H.; Mccormick, F.H.; Kaufmann, P.R.; Herlihy, A.T.; Selle, A.R. Comparative application of indices of biotic integrity based on periphyton, macroinvertebrates, and fish to southern Rocky Mountain streams. Ecol. Indic. 2005, 5, 117–136. [Google Scholar] [CrossRef]
- Zhang, Y.Y.; Ban, X.; Li, E.H.; Wang, Z.; Xiao, F. Evaluating ecological health in the middle-lower reaches of the Hanjiang River with cascade reservoirs using the Planktonic index of biotic integrity (P-IBI). Ecol. Indic. 2020, 114, 106282. [Google Scholar] [CrossRef]
- Beck, M.W.; Vondracek, B.; Hatch, L.K. Environmental clustering of lakes to evaluate performance of a macrophyte index of biotic integrity. Aquat. Bot. 2013, 108, 16–25. [Google Scholar] [CrossRef]
- Johnson, S.L.; Ringler, N.H. The response of fish and macroinvertebrate assemblages to multiple stressors: A comparative analysis of aquatic communities in a perturbed watershed (Onondaga Lake, NY). Ecol. Indic. 2014, 41, 198–208. [Google Scholar] [CrossRef]
- Arman, N.Z.; Salmiati, S.; Said, M.I.M.; Aris, A. Development of macroinvertebrate-based multimetric index and establishment of biocriteria for river health assessment in Malaysia. Ecol. Indic. 2019, 104, 449–458. [Google Scholar] [CrossRef]
- Karr, J.R.; Kimberling, D.N. A Terrestrial Arthropod Index of Biological Integrity for Shrub-Steppe Landscapes. Northwest Sci. 2003, 77, 202–213. [Google Scholar]
- Mamun, M.; An, K. The application of chemical and biological multi-metric models to a small urban stream for ecological health assessments. Ecol. Inform. 2019, 50, 1–12. [Google Scholar] [CrossRef]
- Suarez, Y.R.; Petrere, J.M.; Catella, A.C. Factors determining the structure of fish communities in Pantanal lagoons (MS, Brazil). Fisheries. Manag. Ecol. 2001, 8, 173–186. [Google Scholar] [CrossRef]
- Trautwein, C.; Schinegger, R.; Schmutz, S. Cumulative effects of land use on fish metrics in different types of running waters in Austria. Aquat. Sci. 2012, 74, 329–341. [Google Scholar] [CrossRef] [PubMed]
- Bhatt, J.P.; Manish, K.; Pandit, M.K. Elevational gradients in fish diversity in the Himalaya: Water discharge is the key driver of distribution patterns. PLoS ONE 2012, 7, e46237. [Google Scholar] [CrossRef] [PubMed]
- Figuerola, B.; Maceda-Veiga, A.; Sostoa, A.D. Assessing the effects of sewage effluents in a Mediterranean creek: Fish population features and biotic indices. Hydrobiologia 2012, 694, 75–86. [Google Scholar] [CrossRef]
- Ding, S.; Zhang, Y.; Qu, X.D.; Kong, W.J.; Liu, S.S.; Meng, W. Influence on the spatial distirbution of fish in Taizi River Basin by environmentla factors at Multiple Scales. Enviorn. Sci. 2012, 33, 2272–2280. [Google Scholar]
- Liu, W.; Zhang, Y.; Gao, X.; Jia, X.B.; Ma, S.Q.; Liu, S.S. Variation of fish community and water system conditions from 2010 to 2014 in Hun River of Liaoning Province, northeast part of China. Acta Hydrobiol. Sin. 2016, 40, 968–977. [Google Scholar]
- Chen, W.; Liu, L.; Wang, J.; Zhou, L. Threatened freshwater fish need protection. Science 2021, 374, 164. [Google Scholar] [CrossRef]
- Foubert, A.; Lecomte, F.; Legendre, P.; Cusson, M. Spatial organisation of fish communities in the St. Lawrence River: A test for longitudinal gradients and spatial heterogeneities in a large river system. Hydrobiologia 2018, 809, 155–173. [Google Scholar] [CrossRef]
- Zhang, S.S.; Gao, W.F.; Sun, S.M.; Sun, H.; Zhang, Y.; Ding, S.; Wang, W. Assessment of ecosystem health in Hun River Basin using fish-index of biotic integrity. Res. Environ. Sci. 2015, 28, 1570–1577. [Google Scholar]
- Liu, W.; Zhang, Y.; Gao, X.; Jia, X.B.; Ma, S.Q.; Liu, S.S. Fish community structure and its relationship with environmental variables in Hun River basin of Liaoning province. J. Environ. Eng. Technol. 2016, 6, 266–274. [Google Scholar]
- Wang, Y.T.; Zhang, Y.; Gao, X.; Jia, X.B.; Ma, S.Q. Analysis of environmental factors affecting fish community distribution at different scales in Hun River Basin. In Proceedings of the 2015 Annual Meeting of Chinese Society for Environmental Sciences, Shenzhen, China, 6 August 2015; Volume 2, pp. 203–210. [Google Scholar]
- Barbour, M.T.; Gerritsen, J.; Snyder, B.D.; Stribling, J.B. Rapid Bioassessment Protocols for Use in Streams and Wadeable Rivers: Periphyton, Benthic Macroinvertebrates and Fish; US Environmental Protection Agency, Office of Water: Washington, DC, USA, 1999. [Google Scholar]
- Song, J.X.; Yang, X.G.; Zhang, J.L.; Long, Y.Q.; Zhang, Y.; Zhang, T.F. Assessing the Variability of Heavy Metal Concentrations in Liquid-Solid Two-Phase and Related Environmental Risks in the Weihe River of Shaanxi Province, China. Int. J. Environ. Res. Public Health 2015, 12, 8243–8262. [Google Scholar] [CrossRef]
- National Environmental Protection Bureau (NEPB). Standard Methods for the Examination of Water and Wastewater (Version 4); China Environmental Science Publish Press: Beijing, China, 2002. (In Chinese) [Google Scholar]
- Allan, J.D. Landscapes and Riverscapes: The Influence of Land Use on Stream Ecosystems. Annu. Rev. Ecol. Evol. Syst. 2004, 35, 257–284. [Google Scholar] [CrossRef]
- Tóth, R.; Czeglédi, I.; Kern, B.; Eros, T. Land use effects in riverscapes: Diversity and environmental drivers of stream fish communities in protected, agricultural and urban landscapes. Ecol. Indic. 2019, 101, 742–748. [Google Scholar] [CrossRef]
- Jun, C.; Ban, Y.; Li, S. Open access to Earth land-cover map. Nature 2014, 514, 434. [Google Scholar] [CrossRef] [PubMed]
- Li, Y.; Fang, L.C.; Wang, Y.Z.; Mi, W.J.; Ji, L.; Zhang, G.X.; Yang, P.H.; Chen, Z.B.; Bi, Y.H. Anthropogenic activities accelerated the evolution of river trophic status. Ecol. Indic. 2022, 136, 108584. [Google Scholar] [CrossRef]
- Li, F.Q.; Cai, Q.H.; Ye, L. Developing a Benthic Index of Biological Integrity and Some Relationships to Environmental Factors in the Subtropical Xiangxi River, China. Int. Rev. Hydrobiol. 2010, 95, 171–189. [Google Scholar] [CrossRef]
- Li, Y.; Yang, N.; Qian, B.; Yang, Z.; Liu, D.; Niu, L.; Zhang, W. Development of a bacteria-based index of biotic integrity (Ba-IBI) for assessing ecological health of the Three Gorges Reservoir in different operation periods. Sci. Total Environ. 2018, 640–641, 255–263. [Google Scholar] [CrossRef]
- Zhou, Y.; Qu, X.D.; Zhao, R.; Ma, S.Q.; Zhang, Y.; Yin, Q.W. Standardized methods for selecting reference and impaired sites to evaluate river health. Res. Environ. Sci. 2013, 26, 410–417. [Google Scholar]
- Zhu, H.; Hu, X.D.; Wu, P.P.; Chen, W.M.; Wu, S.S.; Li, Z.Q.; Zhu, L.; Xi, Y.L.; Huang, R. Development and testing of the phytoplankton biological integrity index (P-IBI) in dry and wet seasons for Lake Gehu. Ecol. Indic. 2021, 129, 107882. [Google Scholar] [CrossRef]
- Huang, X.Y.; Xu, J.; Liu, B.; Guan, X.; Li, J.S. Assessment of Aquatic Ecosystem Health with Indices of Biotic Integrity (IBIs) in the Ganjiang River System, China. Water 2022, 14, 278. [Google Scholar] [CrossRef]
- Wang, B.X.; Yang, L.F.; Hu, B.J.; Shan, L.N. A preliminary study on the assessment of stream ecosystem health in south of Anhui Province using Benthic-Index of Biotic Integrity. Acta Ecol. Sin. 2005, 25, 1481–1490. [Google Scholar]
- Gao, S.B.; Chi, S.Y.; Li, S.X.; Zheng, J.X.; Dong, F.Y. Fish resource investigation and species diversity analysis of Nanxi River in Zhejiang Province. J. Hydrol. 2017, 38, 72–81. [Google Scholar]
- Kurian, A. Index of relative importance—A new method for Assessing the food habits of fishes. Indian J. Fish. 1977, 24, 217–219. [Google Scholar]
- Wu, N.; Schmalz, B.; Fohrer, N. Development and testing of a phytoplankton index of biotic integrity (P-IBI) for a German lowland river. Ecol. Indic. 2012, 13, 158–167. [Google Scholar] [CrossRef]
- Qu, X.; Peng, W.; Liu, Y.; Zhang, M.; Ren, Z.; Wu, N.; Liu, X. Networks and ordination analyses reveal the stream community structures of fish, macroinvertebrate and benthic algae, and their responses to nutrient enrichment. Ecol. Indic. 2019, 101, 501–511. [Google Scholar] [CrossRef]
- Chen, Y.; Qu, X.; Xiong, F.; Lu, Y.; Wang, L.; Hughes, R.M. Challenges to saving China’s freshwater biodiversity: Fishery exploitation and landscape pressures. Ambio 2020, 49, 926–938. [Google Scholar] [CrossRef]
- Shuai, F.M.; Li, X.H.; Liu, Q.F.; Li, Y.F.; Yang, J.P.; Li, J.; Chen, F.C. Spatial patterns of fish diversity and distribution in the Pearl River. Acta Ecol. Sin. 2017, 37, 3182–3192. [Google Scholar]
- Fei, J.H.; Wang, X.Z.; Shao, X.Y. Spatial pattern of fish community in the Erhai Lake. J. Fish. China 2012, 36, 1225–1233. [Google Scholar] [CrossRef]
- Gao, X.; Ding, S.; Zhang, Y.; Ma, S.Q.; Liu, S.S.; Meng, W. Exploring the relationship among land-use, riparian habitat quality, and biological integrity of a fishcommunity. Acta Ecol. Sin. 2015, 35, 7198–7206. [Google Scholar]
- Perkin, J.S.; Bonner, T.H. Historical changes in fish assemblage composition following water quality improvement in the mainstem Trinity River of Texas. River Res. Appl. 2016, 32, 85–99. [Google Scholar] [CrossRef]
- Li, Y.L.; Li, Y.F.; Xu, Z.X. Effect of environmental factors on fish community structure in the Huntai River basin at multiplescales. Environ. Sci. 2014, 35, 3504–3512. [Google Scholar]
- Wang, L.Z.; Lyons, J.; Kanehl, P.; Gatti, R. Influences of watershed land use on habitat quality and biotic integrity in Wisconsin streams. Fisheries 1997, 22, 6–12. [Google Scholar] [CrossRef]
- Wang, L.Z.; Lyons, J.; Kanehl, P.; Bannerman, R. Impacts of urbanization on stream habitat and fish across multiple spatial scales. Environ. Manag. 2001, 28, 255–266. [Google Scholar] [CrossRef] [PubMed]
- Zhang, Y.; Wang, X.N.; Ding, H.Y.; Dai, Y.; Ding, S.; Gao, X. Threshold Responses in the Taxonomic and Functional Structure of Fish Assemblages to Land Use and Water Quality: A Case Study from the Taizi River. Water 2019, 11, 661. [Google Scholar] [CrossRef]
- Meng, W.; Zhang, Y.; Zheng, B.H. Study of aquatic ecoregion in Liao River Ba-sin. Acta Scientiae Circumstantiae 2007, 27, 911–918. (In Chinese) [Google Scholar]
- An, K.G.; Park, S.S.; Shin, J.Y. An evaluation of river health using the index of biological integrity along with relations to chemical and habitat conditions. Environ. Int. 2002, 28, 411–420. [Google Scholar] [CrossRef]
- Deng, M.X.; Huang, L.L.; Mo, Y.M.; Huang, J.; Wang, Q.; Song, X.H.; Gao, M.H.; Zou, Q.; Wu, Z.Q. River health assessment using biotic integrity index based on fish for Lipu River. Asian J. Ecotoxicol. 2018, 13, 111–119. (In Chinese) [Google Scholar]
- Belpaire, C.; Smolders, R.; Auweele, I.V.; Ercken, D.; Breine, J.; Thuyne, G.V.; Ollevier, F. An Index of Biotic Integrity characterizing fish populations and the ecological quality of Flandrian water bodies. Hydrobiologia 2000, 434, 17–33. [Google Scholar] [CrossRef]
- Albert, J.S.; Destouni, G.; Duke-Sylvester, S.M.; Magurran, A.E.; Oberdorff, T.; Reis, R.E.; Winemiller, K.O.; Ripple, W.J. Scientists’ warning to humanity on the freshwater biodiversity crisis. Ambio 2021, 50, 85–94. [Google Scholar] [CrossRef]
- Su, G.; Logez, M.; Xu, J.; Tao, S.; Villéger, S.; Brosse, S. Human impacts on global freshwater fish biodiversity. Science 2021, 371, 835–838. [Google Scholar] [CrossRef]
- Sutela, T.; Vehanen, T.; Jounela, P. Longitudinal patterns of fish assemblages in European boreal streams. Hydrobiologia 2020, 847, 3277–3290. [Google Scholar] [CrossRef]
- Feio, M.J.; Hughes, R.M.; Callisto, M.; Nichols, S.J.; Odume, O.N.; Quintella, B.R.; Kuemmerlen, M.; Aguiar, F.C.; Almeida, S.F.; Alonso-Eguíalis, P.; et al. The Biological Assessment and Rehabilitation of the World’s Rivers: An Overview. Water 2021, 13, 371. [Google Scholar] [CrossRef] [PubMed]
- Zhu, D.; Yang, Z. Application of fish index of biotic integrity inriver health management. Yangtze River 2013, 15, 65–68. [Google Scholar]


| Indicator Type | Candidate Indicators | Response to Disturbance |
|---|---|---|
| Species composition and abundance | Number of individuals (M1) | Decrease |
| Species of fish (M2) | Decrease | |
| Percentage of Cypriniformes (M3) | Decrease | |
| Percentage of Perciformes (M4) | Increase | |
| Percentage of Cyprinidae (M5) | Increase | |
| Percentage of Cobitidae (M6) | Decrease | |
| Percentage of Gobiidae (M7) | Increase | |
| Shannon–Wiener index (M8) | Decrease | |
| Margalef index (M9) | Decrease | |
| Nutritional structure | Percentage of carnivorous fish (M10) | Decrease |
| Percentage of herbivorous fish (M11) | Decrease | |
| Percentage of omnivorous fish (M12) | Increase | |
| Tolerance | Percentage of tolerant fish (M13) | Increase |
| Percentage of sensitive fish (M14) | Decrease | |
| Reproductive co-location group | Percentage of floating-egg fish (M15) | Decrease |
| Percentage of sticky-egg fish (M16) | Increase | |
| Percentage of sinking-egg fish (M17) | Decrease | |
| Percentage of fish with special spawning types (M18) | Increase | |
| Habitat preference | Percentage of pelagic fish (M19) | Decrease |
| Percentage of middle and lower layers (M20) | Increase | |
| Percentage of bottom fish (M21) | Decrease |
| Family | Species | N (ind.) | W (g) | IRI |
|---|---|---|---|---|
| Petromyzonidae | Lampetra reissneri | 23 | 218.57 | 6.41 |
| Cyprinidae | Zacco platypus | 3041 | 10,500.84 | 3367.27 |
| Opsariichthys bidens | 6 | 111.02 | 3.28 | |
| Aphyocypris chinensis | 33 | 35.99 | 5.89 | |
| Leuciscus waleckii | 6 | 372.54 | 2.98 | |
| Rhynchocypris lagowskii | 1674 | 5822.03 | 1183.95 | |
| Hemiculter leucisculus | 812 | 194.97 | 544.05 | |
| Hemiculter bleekeri | 5 | 70.79 | 0.36 | |
| Cultrichthys compressocorpus | 13 | 56.12 | 3.82 | |
| Acheilognathus macropterus | 115 | 48.08 | 60.88 | |
| Rhodeus ocellatus | 488 | 189.77 | 316.43 | |
| Rhodeus lighti | 35 | 41.6 | 4.43 | |
| Rhodeus fangi | 195 | 106.34 | 79.81 | |
| Pseudorasboraparva | 1479 | 1239.31 | 1598.23 | |
| Gobio fushunensis | 232 | 857.8 | 48 | |
| Gobio cynocephalus | 110 | 1033.08 | 42.61 | |
| Gobio rivulodes | 13 | 29.53 | 0.92 | |
| Gobio tenuicorpus | 61 | 501.42 | 31.5 | |
| Squalidus argentatus | 15 | 34.59 | 2.8 | |
| Squalidus wolterstorffi | 48 | 88.38 | 5.33 | |
| Huigobio chinssuensis | 637 | 1736.69 | 416.27 | |
| Abbottina rivularis | 164 | 672.42 | 91.29 | |
| Abbottina liaoningensis | 4 | 7.3 | 0.22 | |
| Pseudogobio vaillanti | 48 | 221.31 | 10.89 | |
| Cyprinus carpio | 14 | 233 | 41.7 | |
| Carassius auratus | 1335 | 8360.97 | 4267.26 | |
| Aristichthys nobilis | 2 | 954 | 3.54 | |
| Hypophthalmichthys molitrix | 1 | 257.66 | 0.96 | |
| Cobitidae | Barbatula nuda | 386 | 1887.57 | 299.93 |
| Lefua costata | 68 | 249.15 | 11.68 | |
| Cobitis sibirica | 237 | 526.56 | 124.66 | |
| Misgurnus anguillicaudatus | 193 | 1083.75 | 263.78 | |
| Misqurnus mohoity | 3 | 9.99 | 0.3 | |
| Cobitis lutheri | 7 | 39.89 | 1.17 | |
| Paramisgurnus dabryanus | 37 | 193.29 | 41.71 | |
| Bagridae | Pelteobagrus fulvidraco | 1 | 32.45 | 0.86 |
| Pelteobagrus ussuriensis | 1 | 36.06 | 0.15 | |
| Siluridae | Silurus asotus | 25 | 2048.52 | 96.32 |
| Osmeridae | Hypomesus olidus | 4 | 3.11 | 0.1 |
| Adrianichthyidae | Oryzias latipes | 48 | 15.13 | 12.73 |
| Gasterosteidae | Pungitius sinensis | 15 | 17.78 | 1.52 |
| Eleotridae | Odontobutis obscurus | 47 | 193.25 | 6.77 |
| Hypseleotris swinhonis | 69 | 53.36 | 29.99 | |
| Gobiidae | Tridentiger trigonocephalus | 143 | 722.04 | 11.28 |
| Tridentiger obscurus | 16 | 129.64 | 0.81 | |
| Rhinogobius cliffordpopei | 78 | 105.11 | 40.98 | |
| Rhinogobius brunneus | 111 | 117.14 | 51.02 | |
| Rhinogobius giurinus | 91 | 97.31 | 24.88 | |
| Rhinogobius pflaumi | 6 | 15.48 | 0.18 | |
| Chloea laevis | 10 | 13.16 | 0.26 | |
| Channidae | Channa argus | 15 | 3051.98 | 104.94 |
| Environmental Factors | Mid-Upstream | Downstream | p |
|---|---|---|---|
| TN (mg/L) | 5.30 ± 1.57 | 7.97 ± 1.64 | 0.000 ** |
| TP (mg/L) | 0.19 ± 0.05 | 0.32 ± 0.10 | 0.000 ** |
| NH3-N (mg/L) | 0.25 ± 0.21 | 1.01 ± 0.88 | 0.000 ** |
| NO3-N (mg/L) | 3.04 ± 1.07 | 4.31 ± 1.41 | 0.003 ** |
| NO2-N (mg/L) | 0.04 ± 0.05 | 0.16 ± 0.05 | 0.000 ** |
| SRP (mg/L) | 0.08 ± 0.14 | 0.14 ± 0.11 | 0.000 ** |
| CODMn (mg/L) | 3.52 ± 0.91 | 6.64 ± 1.53 | 0.000 ** |
| Chl-a (mg/L) | 8.12 ± 4.11 | 40.65 ± 30.75 | 0.000 ** |
| SD (m) | 0.44 ± 0.20 | 0.49 ± 0.22 | 0.621 |
| FV (m/s) | 0.56 ± 0.19 | 0.25 ± 0.21 | 0.000 ** |
| DO (mg/L) | 10.67 ± 0.97 | 10.36 ± 2.56 | 0.714 |
| pH | 8.09 ± 0.25 | 8.47 ± 0.26 | 0.000 ** |
| WT (°C) | 15.72 ± 1.61 | 17.86 ± 1.05 | 0.000 ** |
| Alt (m) | 206.48 ± 112.42 | 15.22 ± 8.53 | 0.000 ** |
| AL (%) | 27.46 ± 11.21 | 76.74 ± 11.78 | 0.000 ** |
| FL (%) | 58.62 ± 19.08 | 1.27 ± 1.41 | 0.000 ** |
| GL (%) | 8.97 ± 5.14 | 1.73 ± 1.46 | 0.000 ** |
| UL (%) | 4.94 ± 5.83 | 20.26 ± 11.12 | 0.000 ** |
| Health Status | Healthy | Good | Fair | Poor | Bad |
|---|---|---|---|---|---|
| F-IBI | ≥7.92 | 5.94–7.92 | 3.96–5.94 | 1.98–3.96 | <1.98 |
Disclaimer/Publisher’s Note: The statements, opinions and data contained in all publications are solely those of the individual author(s) and contributor(s) and not of MDPI and/or the editor(s). MDPI and/or the editor(s) disclaim responsibility for any injury to people or property resulting from any ideas, methods, instructions or products referred to in the content. |
© 2023 by the authors. Licensee MDPI, Basel, Switzerland. This article is an open access article distributed under the terms and conditions of the Creative Commons Attribution (CC BY) license (https://creativecommons.org/licenses/by/4.0/).
Share and Cite
Xie, J.; Wang, C.; Liu, L.; Duan, Y.; Huo, B.; Li, D. Assessment of Aquatic Ecological Health Based on the Characteristics of the Fish Community Structures of the Hun River Basin, Northeastern China. Water 2023, 15, 501. https://doi.org/10.3390/w15030501
Xie J, Wang C, Liu L, Duan Y, Huo B, Li D. Assessment of Aquatic Ecological Health Based on the Characteristics of the Fish Community Structures of the Hun River Basin, Northeastern China. Water. 2023; 15(3):501. https://doi.org/10.3390/w15030501
Chicago/Turabian StyleXie, Jun, Caiyan Wang, Lu Liu, Yuanshuai Duan, Bin Huo, and Dapeng Li. 2023. "Assessment of Aquatic Ecological Health Based on the Characteristics of the Fish Community Structures of the Hun River Basin, Northeastern China" Water 15, no. 3: 501. https://doi.org/10.3390/w15030501
APA StyleXie, J., Wang, C., Liu, L., Duan, Y., Huo, B., & Li, D. (2023). Assessment of Aquatic Ecological Health Based on the Characteristics of the Fish Community Structures of the Hun River Basin, Northeastern China. Water, 15(3), 501. https://doi.org/10.3390/w15030501