Article

Trend Analysis of Selected Hydroclimatic Variables for the Hornad Catchment (Slovakia)

by
Katarzyna Kubiak-Wójcicka
1,*,
Patrik Nagy
2,
Agnieszka Pilarska
1 and
Martina Zeleňáková
2
1
Faculty of Earth Sciences and Spatial Management, Nicolaus Copernicus University, Lwowska 1, 87-100 Toruń, Poland
2
Department of Environmental Engineering, Faculty of Civil Engineering, Technical University of Košice, 04200 Košice, Slovakia
*
Author to whom correspondence should be addressed.
Water 2023, 15(3), 471; https://doi.org/10.3390/w15030471
Submission received: 30 December 2022 / Revised: 16 January 2023 / Accepted: 18 January 2023 / Published: 25 January 2023

Abstract

:
This study examines the trends in air temperature, precipitation and flow rates over a 50-year observation period (1961–2010) and compares two periods, 1961–1985 and 1986–2010. The research was carried out in terms of annual and monthly values. The research area is the Hornad River in Slovakia. The main aim of the study was to examine the evolution of precipitation, air temperature and flows in the Hornad River catchment area, as well as to identify the regions (sub-catchments) most vulnerable to climate change. Increasing trends in air temperature in the years 1961–2010 were found to be statistically significant (the Sen’s slope was between 0.0197 and 0.0239). On the other hand, a statistically significant downward trend in flows was recorded only at the Stratená station (a small mountain catchment, where the Sen’s slope was −0.0063). The remaining upward and downward trends were not statistically significant. Greater differences in the course of the trends were recorded on a monthly basis in individual multi-years. Increasing trends in air temperature were statistically significant from May to August in the period 1961–2010. No trends in precipitation were recorded in the period 1961–2010, and only an upward trend in precipitation was recorded in June from 1986–2010.

1. Introduction

The impact of climate change on water resources is the most discussed problem worldwide [1,2,3,4,5,6,7,8]. Precipitation and air temperature are climatic factors that have a strong influence on changes in the global hydrological cycle. The variability of these elements may lead to changes in water resources from a global and regional perspective [9]. Spatial and temporal changes in river runoff have been observed in many regions of Europe [10,11,12,13,14,15,16,17]. Such great interest of researchers in the variability of water resources is due to the fact that many aspects of the environment, economy and society depend on water resources. Any change in water resources can have a severe impact on environmental quality, economic development and social welfare [18].
The research of the Intergovernmental Panel on Climate Change (IPCC) [19] indicates that in Slovakia, as in other European countries (e.g., Poland, the Czech Republic), there will be an increase in extreme events. Therefore, a significant part of research conducted in Slovakia focuses on modeling future changes in water resources based on prepared climate change scenarios [20,21,22,23,24] and detecting changes in long-time series of hydrometeorological data [25,26,27,28,29]. Changes in climatic conditions, but also land use and human activity, strongly affect the size and variability of water resources [30,31,32,33,34,35,36,37,38]. Analysis of river runoff trends is particularly important, as it represents the integration of climatic variables and other non-climatic factors in a specific area [39,40]. Identification of the impact of climate change on the hydrological regime of rivers in mountain areas seems particularly necessary due to the extreme sensitivity of these areas [41,42,43,44,45,46,47,48,49].
According to the latest IPCC report [50], the observed changes in mountain areas have already occurred. These changes include rising air temperatures, changing seasonal weather patterns and reducing the extent and duration of snow cover at low altitudes. Research by Fan et al. [51] in mountainous areas in northwestern China showed that climate change in the high mountains is more significant than in the lowlands. In the high mountains, changes in runoff are mainly affected by temperature, while in the lowlands, precipitation has a greater effect on runoff than temperature. An analysis of trends in total annual precipitation in the period from 34 to 119 years for 48 climatic stations in Slovakia did not show significant changes [52]. On the other hand, the analysis of precipitation for Slovakia carried out for the years 1981–2013 showed an increasing trend of precipitation in June, July and January and a decreasing trend of precipitation in December, April, May and August [53]. This study fills a research gap where a joint long-term analysis of changes in precipitation, air temperature and river flows has been conducted.
Due to the high sensitivity of mountain catchments, more detailed analyzes of the variability of precipitation and air temperature were carried out, and their impact on the flow intensity of mountain rivers was determined. The study focuses on the annual and monthly values of flow, precipitation and air temperature, analyzed over the period 1961–2010. The aim of this study was to investigate the long-term changes in precipitation (P), air temperature and flows (Q) over 50 years (1961–2010) in the Hornad River catchment, in its mountainous part—an important water supply area.

2. Materials and Methods
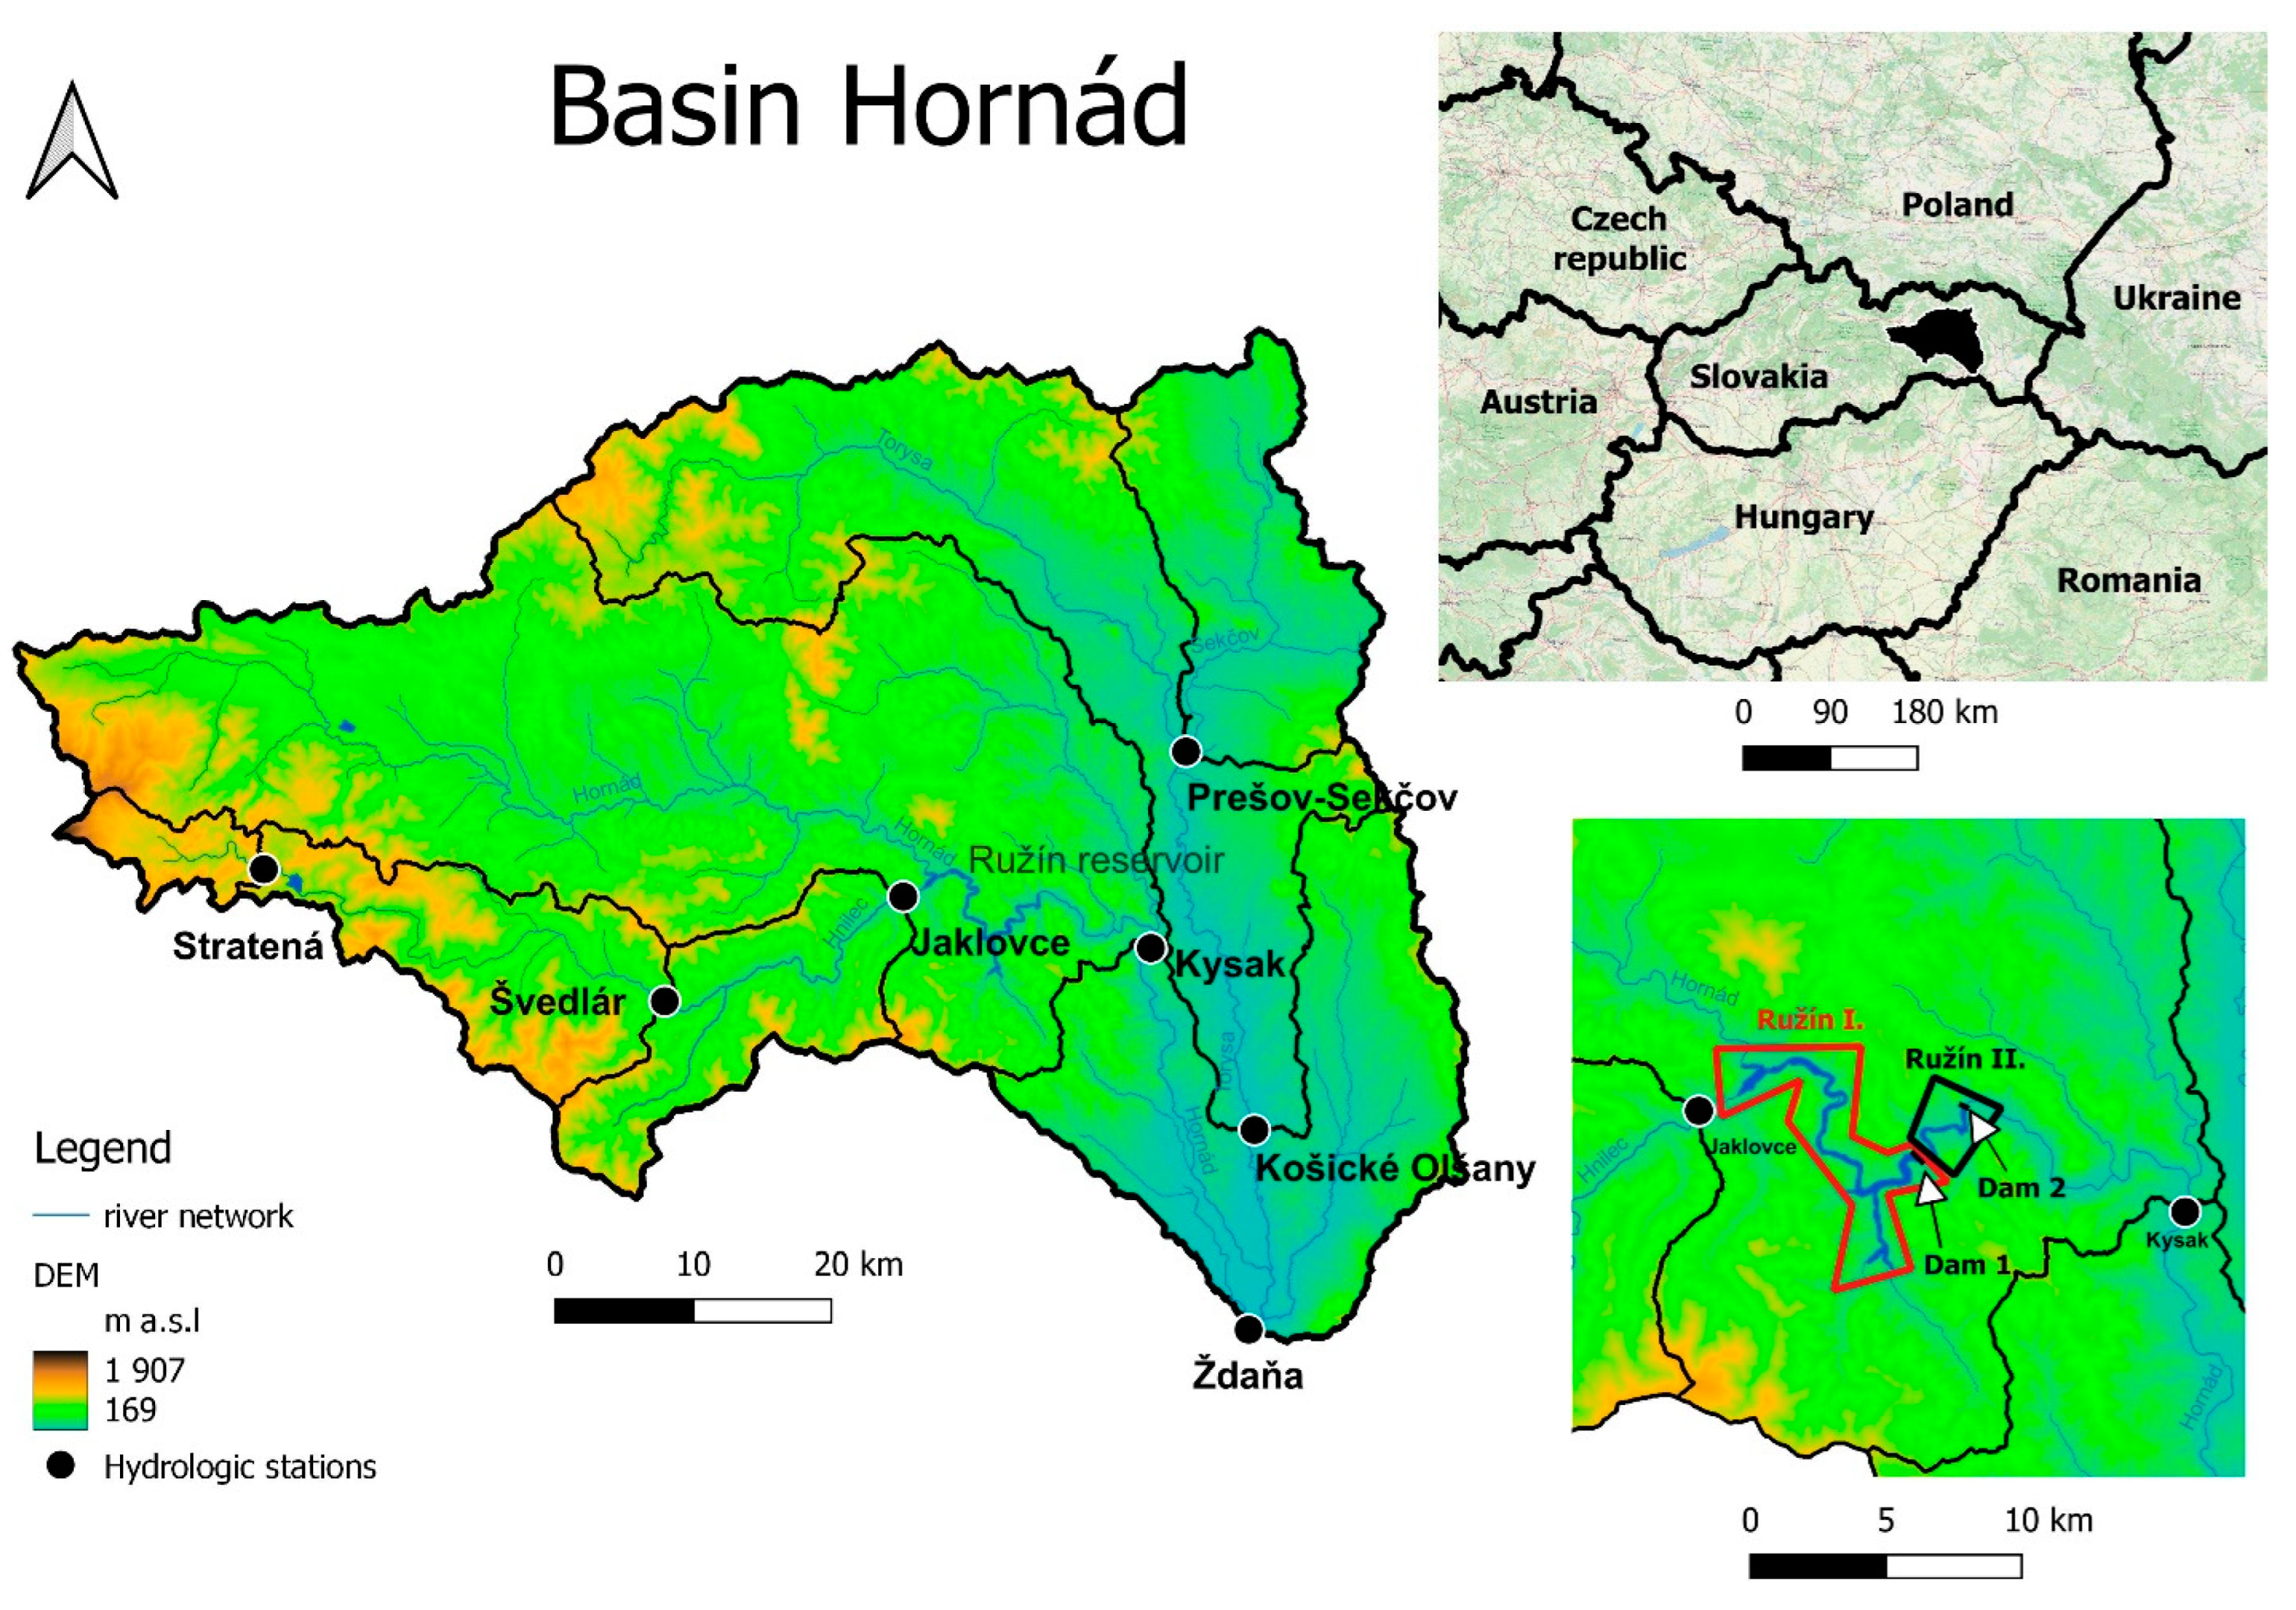
2.1. Study Area

The Hornad River is located in the central part of Slovakia and is a tributary of the Sajo River, which is a tributary of the Tisza (Figure 1). The Tisza is a tributary of the Danube. The main tributaries of the Hornad are the Hnilec (a right-hand tributary) and the Torysa (a left-hand tributary). In the middle reaches of the Hornad River is the Ružin multi-purpose reservoir, which was built in 1963. The water reservoir is divided into two objects: Ružin I and Ružin II. Ružin I consists of an accumulation reservoir with a total volume of 49.451 million m3, a 59.2 m high dam and a 60 MW pumped-storage hydro power plant. The catchment area of the Ružín I profile is 1906.70 km2, and the average annual flow in the Ružín I profile is 15.455 m3/s. The area of the water reservoirs is 390 ha. Ružin II consists of an equalizing reservoir with total volume of 4.43 million m3, a 27 m high dam and a run-of-the-river power plant with a capacity of 1.9 MW. The catchment area for the Ružín II profile is 1932.80 km2, and the average annual flow in the Ružín II profile is 15,580 m3/s. The area of the water reservoirs is 70 ha. The task of the water reservoir is to equalize the flows caused by the operation of the pumped-storage power plant on Ružín I [54]. The Hornad basin is a large mountain catchment area covering 4249.14 km2, which is enclosed by the Ždaná station. The Hornad River catchment is located at an elevation of 167.7 to 1932.1 m above sea level. Some of the physiographic and hydrological features of the Hornad basin are given in Table 1. According to Bahremand et al. [55], the average elevation of the catchment area is 580 m above sea level, while the average slope of the catchment area is about 17.6%. Nearly half (49.8%) of the Hornad River catchment area is covered by forests, while 43% comprises agricultural areas. Urbanized areas constitute 5.31% of the total catchment area (Table 2) [56].

2.2. Data and Methods

This study examines trends in temperature, precipitation and flow rates over a 50-year observation period (1961–2010) and compares two periods: 1961–1985 and 1986–2010. The research was carried out in terms of annual and monthly values. Average monthly and annual values of flows were obtained from measurements carried out at 7 hydrological stations located in the Hornad River catchment area. The data was made available by the Slovak Hydrometeorological Institute [57] and covered the research period 1961–2010. The characteristics of hydrometeorological data in the Hornad catchment are presented in the Table 3 and Table 4.
Data on the monthly sums of atmospheric precipitation and average monthly air temperature were obtained from maps prepared by the Slovak Hydrometeorological Institute [57]. They included averaged monthly and annual values obtained for the entire catchment area enclosed by a hydrological station. The QGIS version 3.20.1 program was used to present the data in the form of maps.

2.3. Detecting Trends

The trend analysis was performed using the non-parametric Mann-Kendall trend test (MK test) [58,59], and the slope β was expressed with the Theil-Sen estimator [60]. The MK test is widely used in detecting trends in hydrometeorological time series data. In the Mann-Kendall test, the null hypothesis is that there is no significant trend in the data series. The trend is significant if the null hypothesis cannot be accepted. The acceptance region at the significance level α = 0.05 defines the range −1.96 ≤ Z ≤ 1.96 (no significant trend), while the rejection region is given by Z <−1.96 (a significant downward trend) and Z > 1.96 (a significant upward trend), where Z is a normalized test statistic [40]. A positive value of the β slope indicates an upward (increasing) trend, and a negative value indicates a downward (decreasing) trend in the time series. The Theil-Sen estimator makes no assumption about the distribution of the data and may be more robust against outliers in the comparison to Ordinary Least Squares (OLS) [61]. The basis for the study of changes in river runoff in selected stations was average monthly and annual precipitation totals, average monthly and annual air temperatures, as well as average monthly and annual flows in the years 1961−2010. The Mann-Kendall test and Sen’s slope method were conducted in RStudio [62] using the “readxl” [63] and “trend” [64] packages.
The article also used multidimensional scaling (MDS). The multidimensional scaling method is used to show the “structure” of objects (this is done by specifying the content of dimensions) and to present the relations between objects in the r-dimensional space [65]. In general, multidimensional scaling allows the visualization of the similarity (its level) between the elements in the dataset [66]. Evaluation of the results of multidimensional scaling is based on the value of the STRESS function. The obtained representation can be considered as faithful for STRESS values lower than 0.02 and as a very weak match when the STRESS value is above 0.2 [67].
Multidimensional scaling (PROXSCAL) was performed in PS IMAGO PRO 8.0 (software based on the IBM SPSS Statistics analytical engine), based on the Euclidean distance measure for the Z parameter of the Mann-Kendall test and for the Sen’s slope value. For the graphic processing, GIMP 2.10.18 and Inkscape 1.0.1 were used.

3. Results and Discussion

3.1. Variability of Hydrometeorological Parameters in the Years 1961–2010

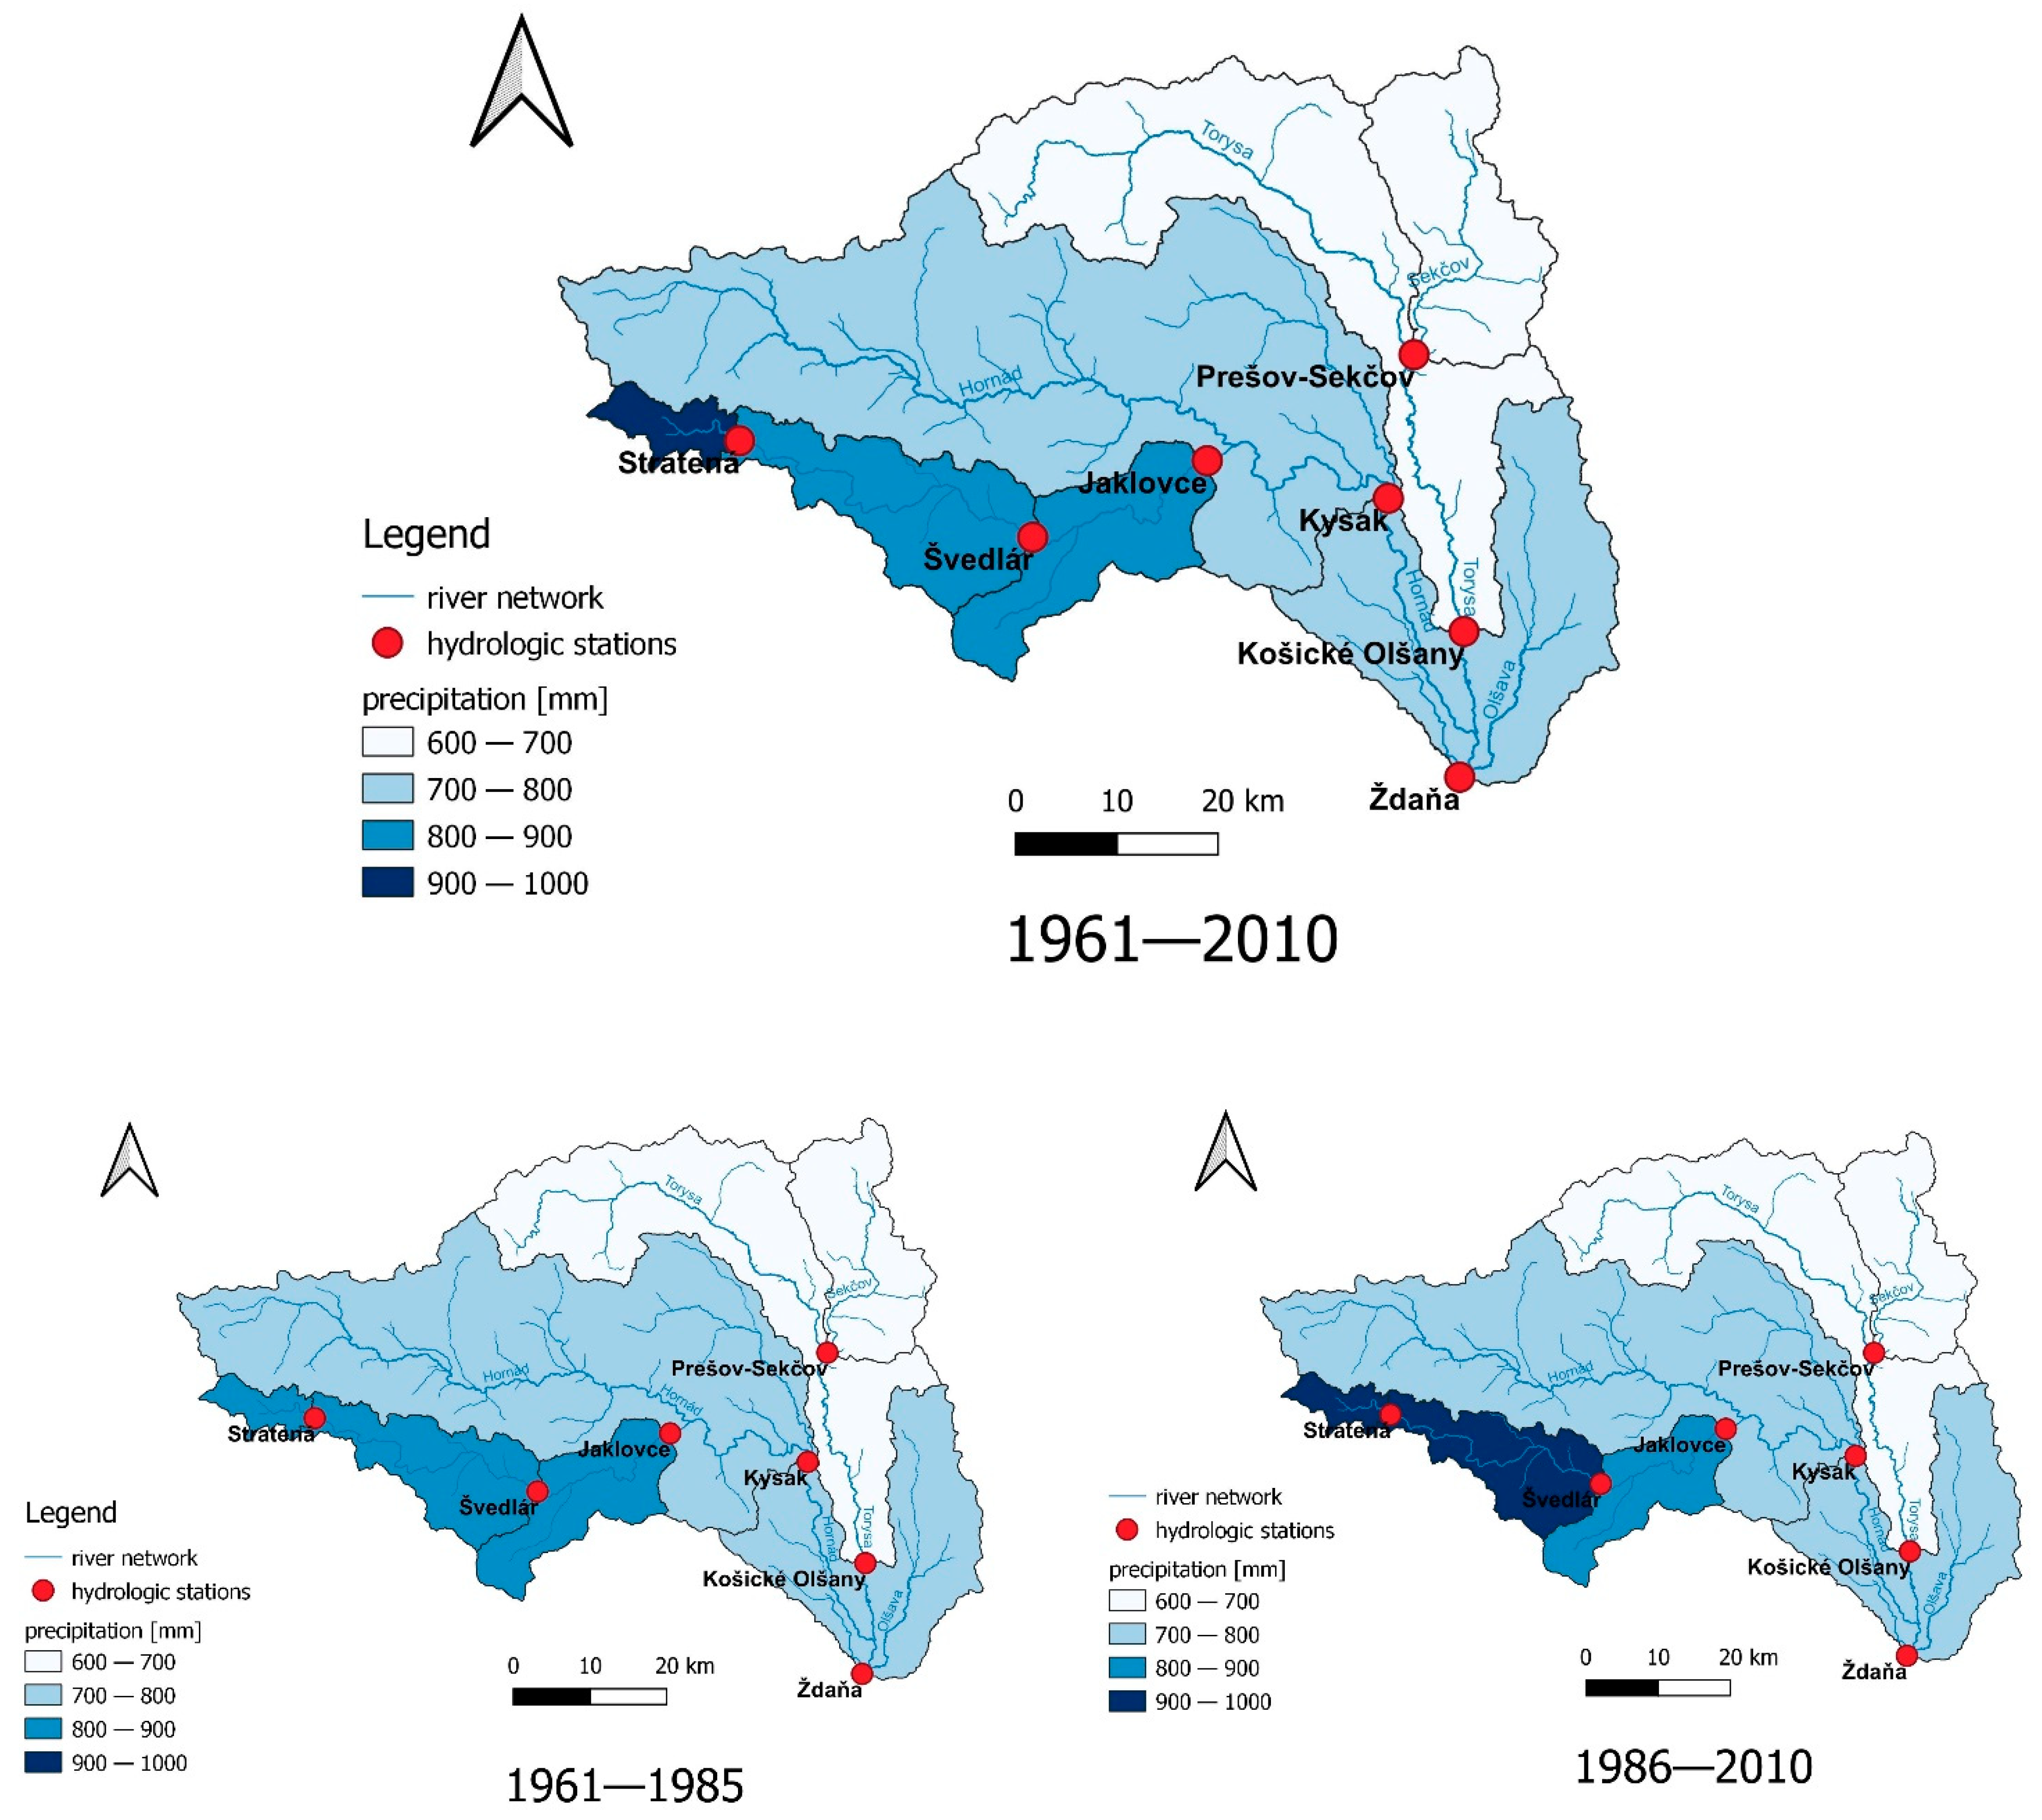
3.1.1. Average Annual Precipitation

The distribution of the average annual precipitation from each catchment area from the years 1961–2010, 1961–1985 and 1986–2010 is presented in Figure 2. The lowest annual sums of precipitation in the entire analyzed multi-year period of 1961–2010 occurred in the catchment area of the Torysa River and ranged from 600 to 700 mm per year, while the highest annual sums of precipitation (from 900 to 1000 mm) were recorded only in the upper reaches of the Hnilec River. The Hnilec River catchment area showed higher precipitation than other catchments due to its location in a mountain area. This is visible in the years 1986–2010 in the catchment area closed by the Stratená and Švedlár gauging stations. In the period 1961–2010, the highest values of annual precipitation sums were recorded only for the catchment area closed by the Stratená station.
During the entire analyzed multi-year period of 1961–2010, the highest annual sums of precipitation were recorded in 2010, and they occurred in all the catchments. The highest precipitation was recorded in 2010 in the mountain catchment of the Hnilec river at the Stratená (1472 mm), Švedlár (1493 mm) and Jaklovce (1483 mm) stations, while significantly lower precipitation occurred in the lower catchment at the stations of Kosickie Olsany (991 mm) and Prešov-Sekčov (996 mm) (Figure S1). The lowest amounts of precipitation were recorded in 1986 in four sub-catchments (Ždaná—502 mm, Kysak—517 mm, Jaklovce—597 mm, Švedlár—622 mm), in 1961 in two sub-catchments (Košické Olšany—420 mm, Prešov-Sekčov—447 mm) and in 2003 in one (Stratená—669 mm). The division into the multi-year periods 1961–1985 and 1986–2010 clearly shows the disproportion of extreme values in individual years. Extreme values of precipitation recorded in the years 1986–2010 were extreme values for the entire period 1961–2010 for 5 out of 7 sub-catchments. The exceptions were two sub-catchments (Košické Olšany and Prešov-Sekčov), where the lowest precipitation totals were recorded in 1961. The division of the 1961–2010 period into two equal 25-year periods indicates that the 1986–2010 period was definitely wetter in terms of precipitation than the years 1961–1985.

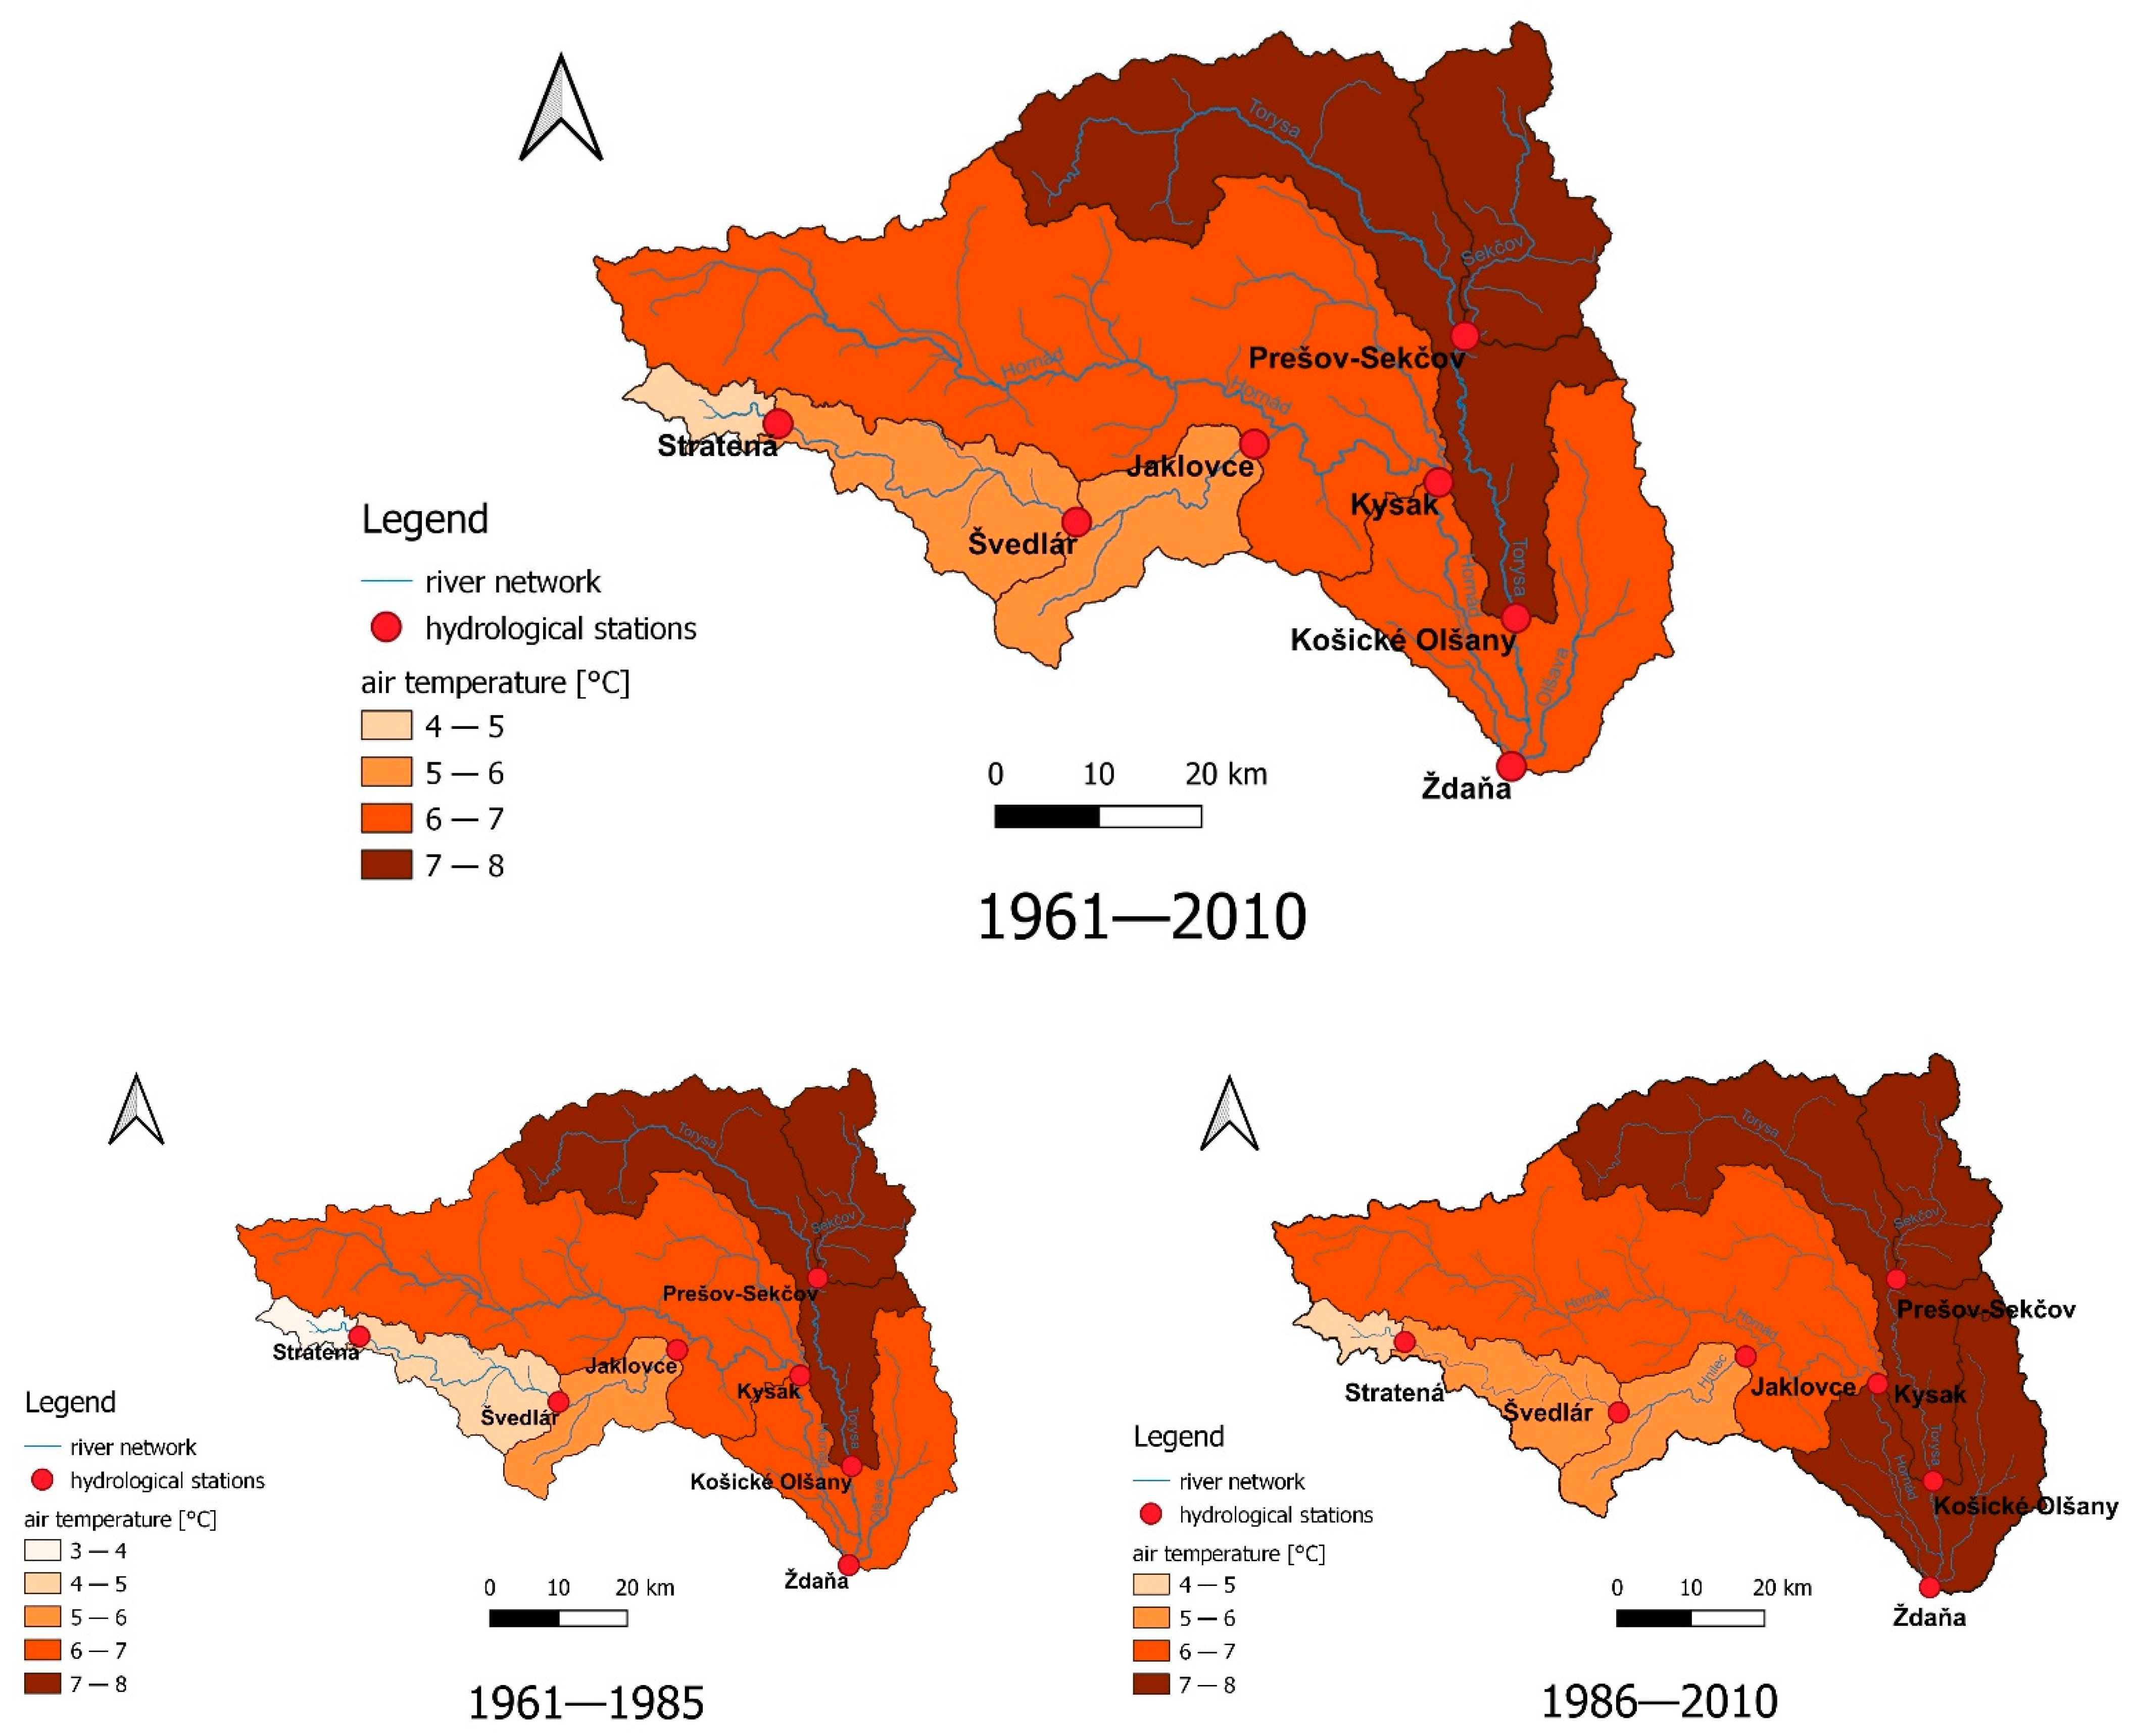
3.1.2. Average Annual Air Temperature

The distribution of the average annual air temperature in individual sub-catchments in the years 1961–2010 is presented in Figure 3. The lowest average annual air temperature in the analyzed periods was recorded in the upper catchment area of the Hnilec River (Stratená). The highest average air temperature (7–8 °C) was recorded in the Sekčov and Torysa sub-catchment areas. The analysis of the annual air temperature values in particular periods shows that the 1986–2010 multi-year period was warmer than the 1961–1985 multi-year period and took up a much larger area of the Hornad River catchment area.
The lowest average annual air temperature was recorded in 1965 at stations Ždaná (5.4 °C), Košické Olšany (5.8 °C), Prešov-Sekčov (5.8 °C), Kysak (5.0 °C) and Stratená (2.9 °C) and in 1980 at stations Jaklovce (4.2 °C) and Švedlár (3.7 °C). The maximum average annual air temperature was recorded in 2008 at stations Ždaná (8.6 °C), Košické Olšany (9.3 °C), Kysak (8.1°C) and Jaklovce (7.4 °C) and 2007 at stations Prešov-Sekčov (9.1 °C), Švedlár (6.6 °C) and Stratená (5.6 °C) (Figure S2). The division of the multi-year period 1961–2010 into two equal 25-year periods indicates that the period 1986–2010 was definitely warmer, while the period 1961–1980 was cooler.

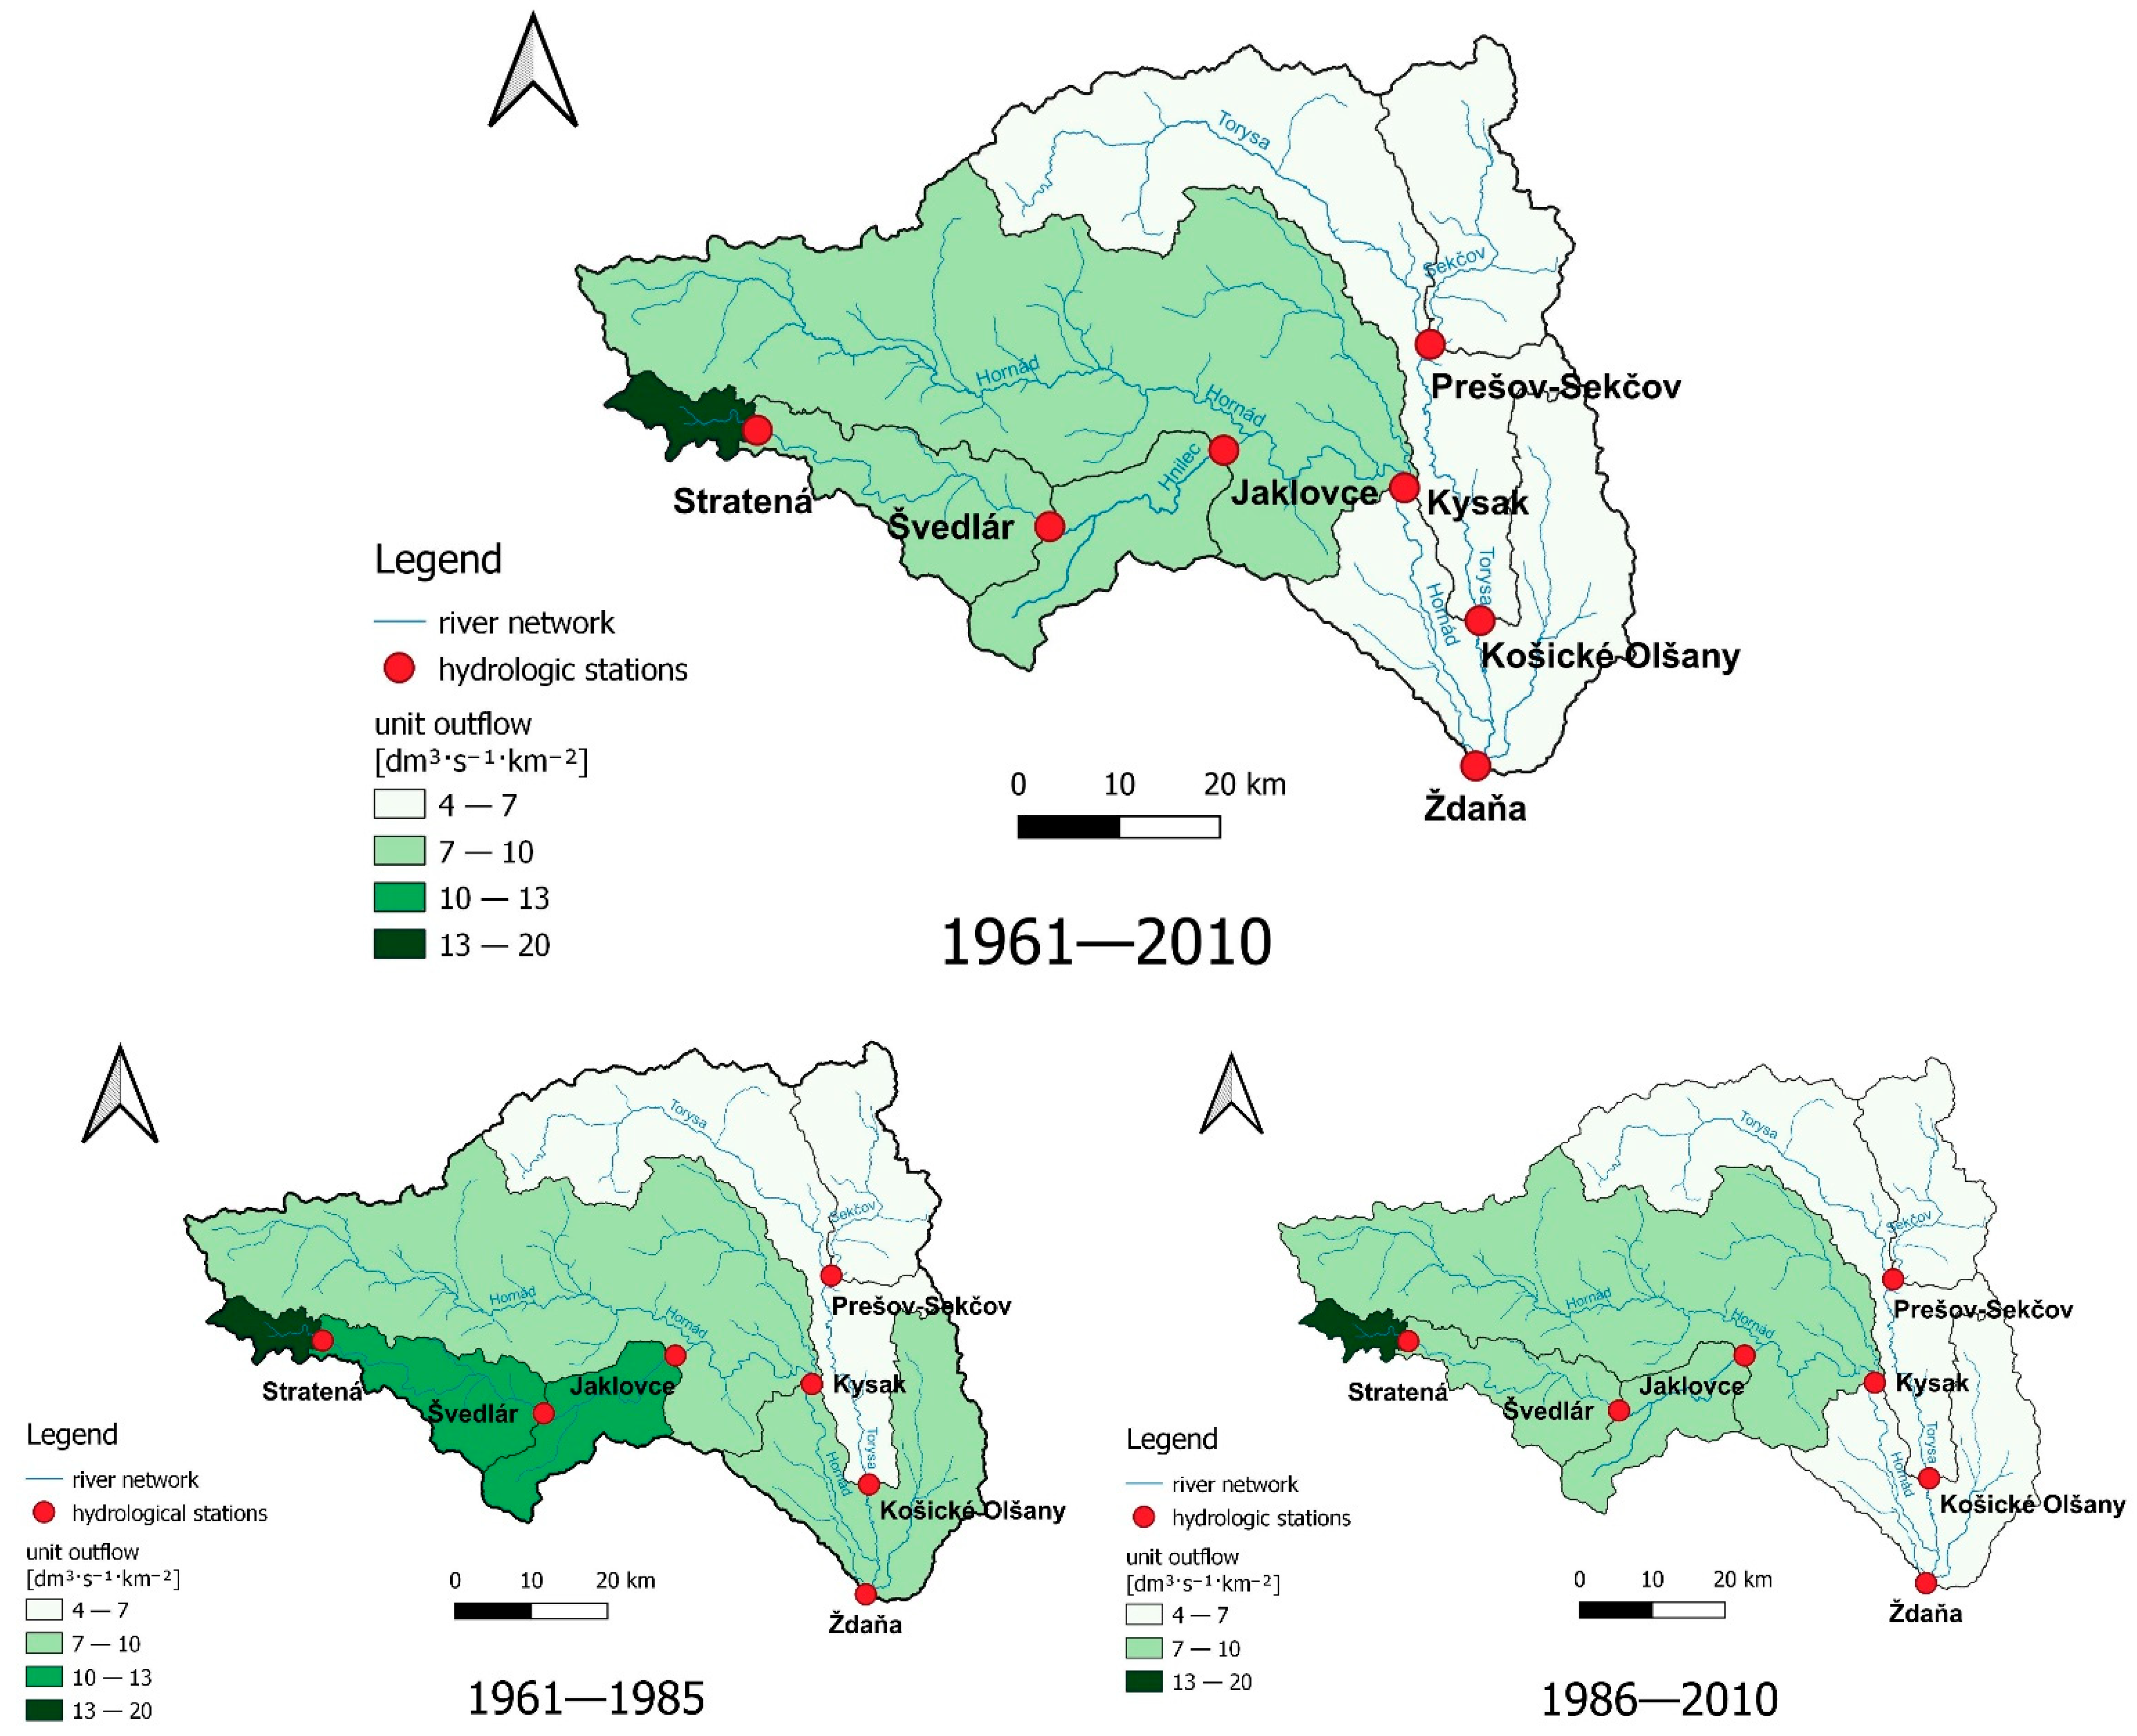
3.1.3. Average Annual Flows

Due to the diversified surface of the catchment area, the size of water resources was presented in the form of a unit runoff for the multi-year periods 1961–2010, 1961–1985 and 1986–2010 (Figure 4). The Hnilec River catchment closed by the Stratená water gauge station had the largest water resources per 1 km2 (from 13 to 20 dm3.s−1.km−2), while the lowest water resources were recorded in the eastern part of the Hornad catchment—its tributaries Torysa and Sekčov (from 4 to 7 dm3.s−1.km−2)—in the years 1961–2010 and 1986–2010. A larger unit outflow was recorded at the Stratená and Švedlár stations in the multi-year period 1961–1985 compared to the multi-year periods 1961–2010 and 1986–2010.
The analysis of the average annual flows in particular years showed that the maximum values of flows were recorded at all hydrological stations in 2010 except for the Prešov-Sekčov station (1980). The lowest annual flows were recorded in 1993 at stations Ždaná (12.76 dm3.s−1.km−2), Kysak (7.86 dm3.s−1.km−2), Jaklovce (2.28 dm3.s−1.km−2), Švedlár (1.49 dm3.s−1.km−2), and Stratená (0.51 dm3.s−1.km−2); in 1961 at station Košické Olšany (3.05 dm3.s−1.km−2); and in 2002 at station Prešov-Sekčov (0.78 dm3.s−1.km−2) (Figure S3). The period 1961–1985 was characterized by higher average annual flows than the period 1986–2010 and the entire analyzed multi-year period 1961–2010.

3.2. Trends of Hydrometeorological Parameters in the Years 1961–2010

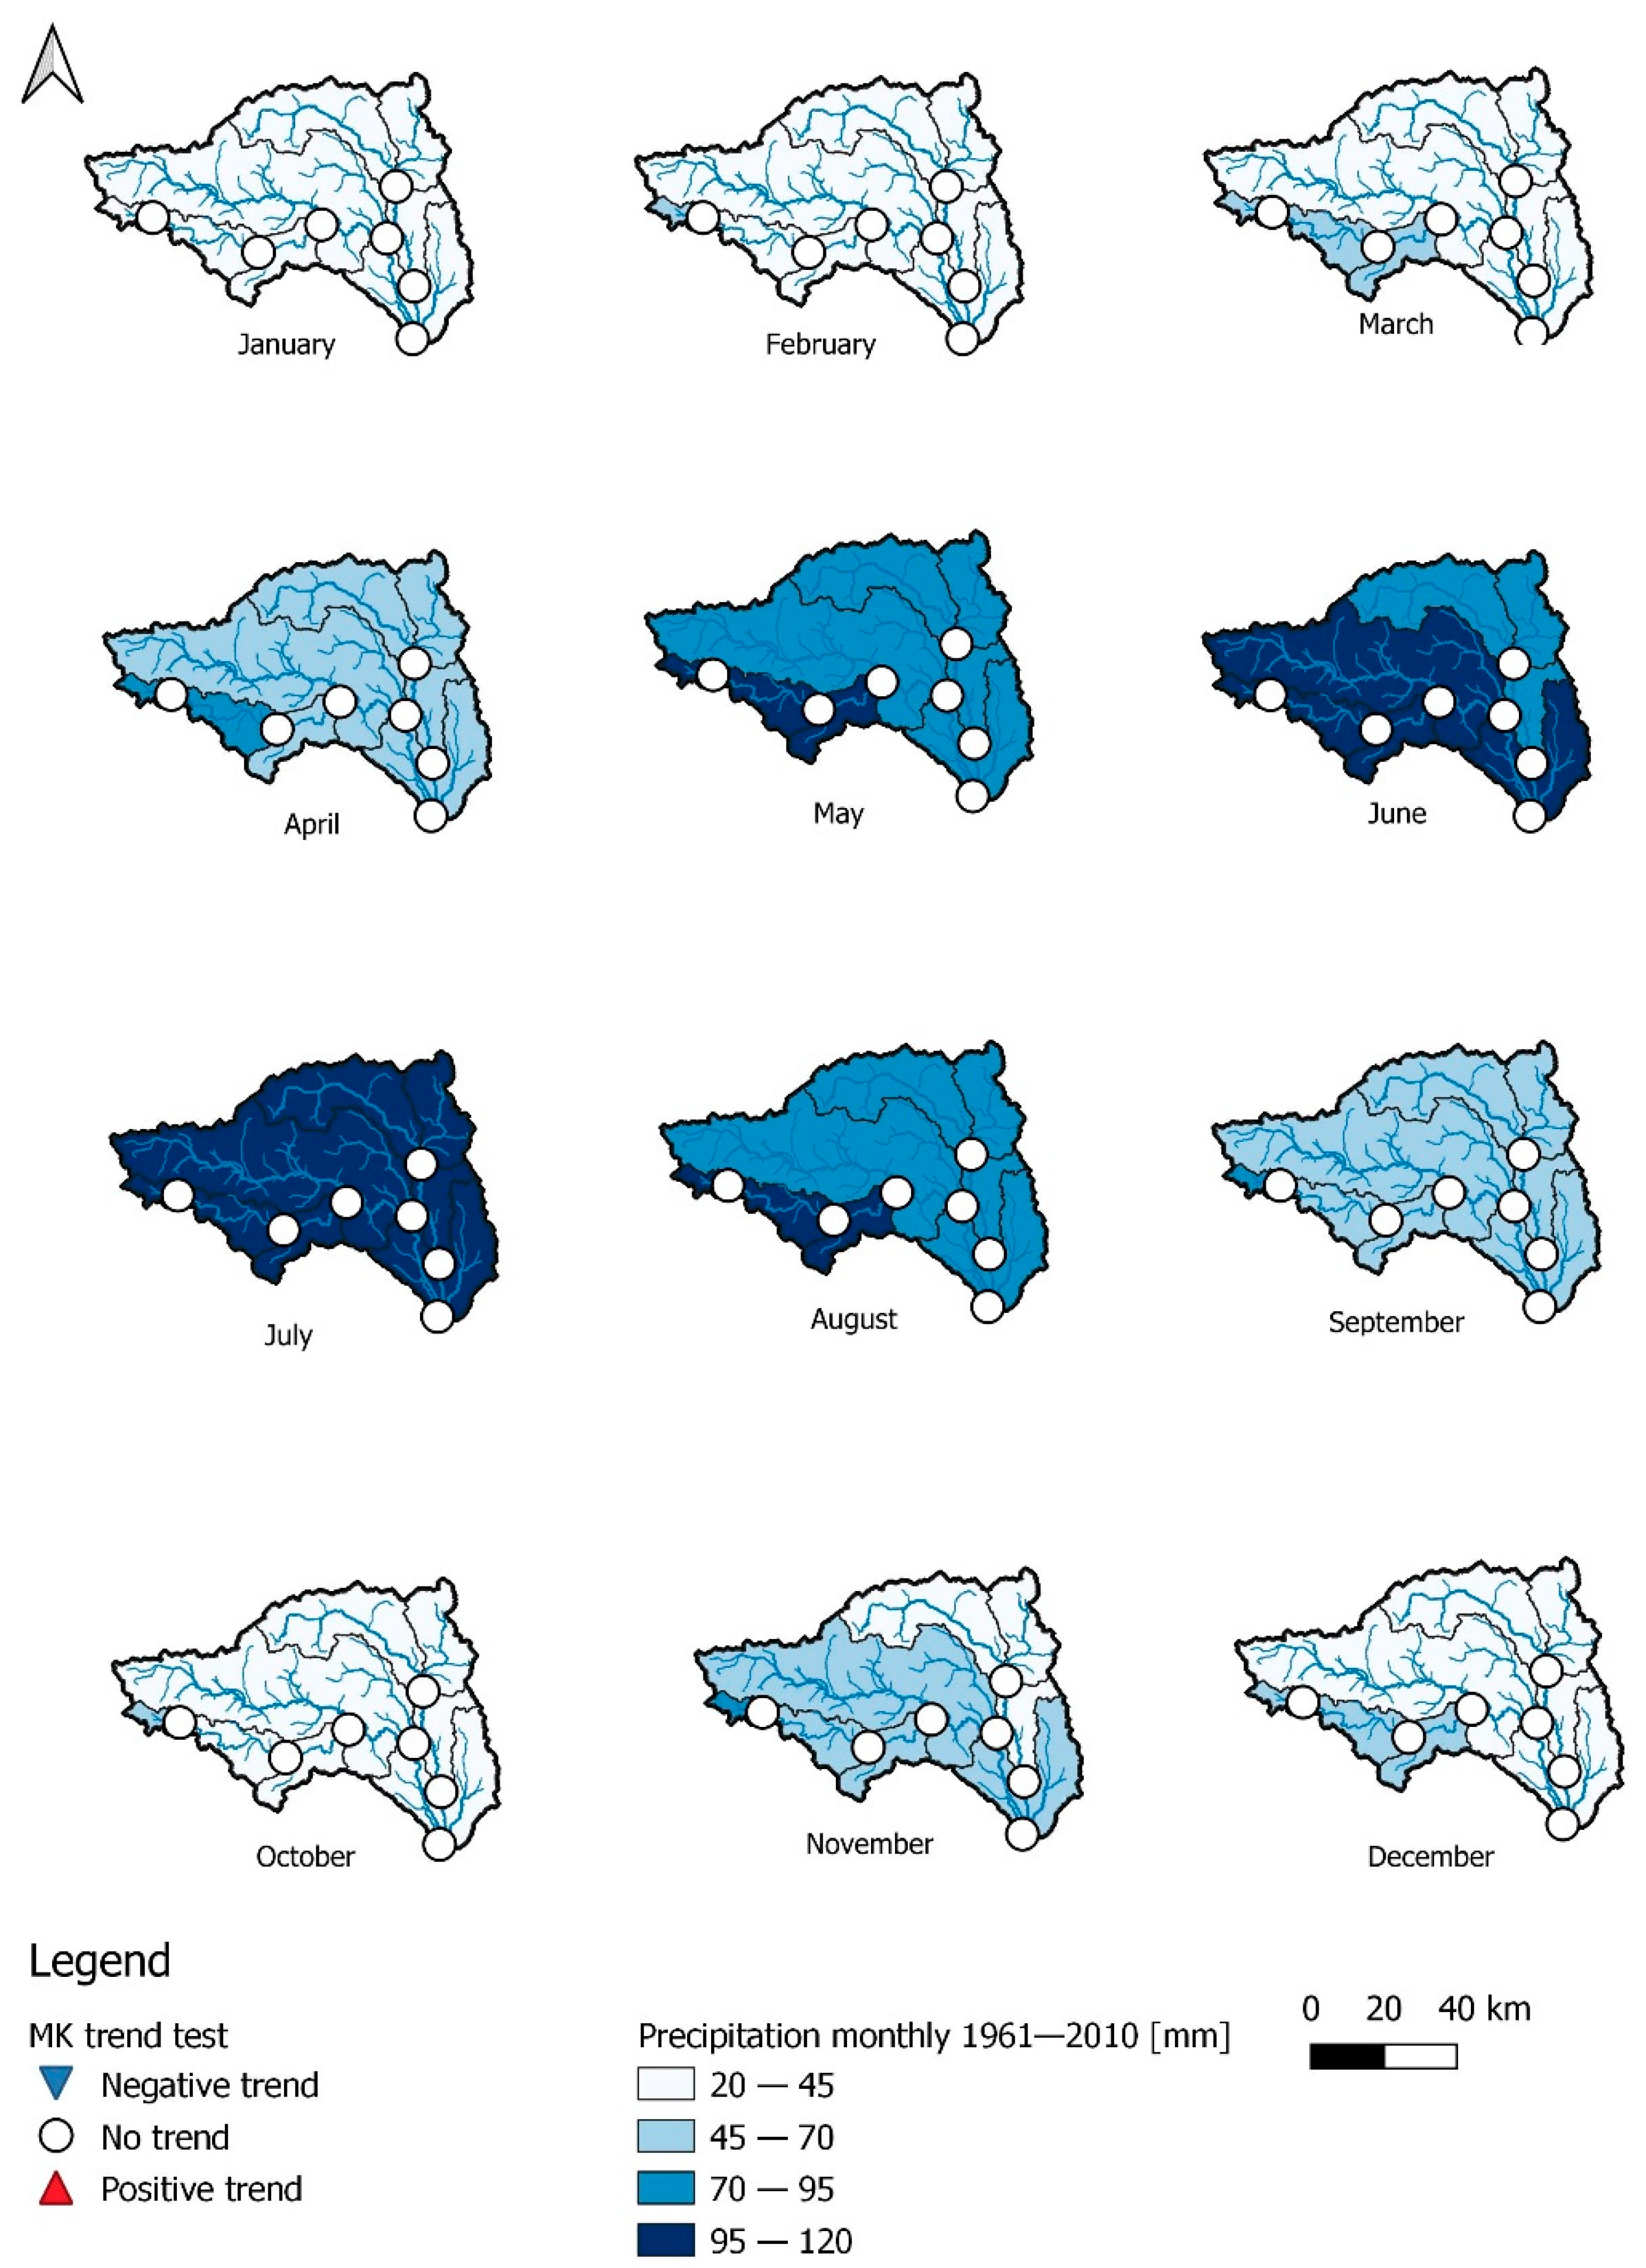
3.2.1. Precipitation

The analysis of long-term precipitation trends using the MK test and Sen’s slope method showed that in the years 1961–2010 there was an increase in precipitation in all the sub-catchments, and this increase was statistically significant in four sub-catchments. The upward trend in annual precipitation in the period 1986–2010 was statistically significant in all sub-catchments and had an impact on the upward trend in precipitation recorded in the multi-year period 1961–2010. In the period 1961–1985, slight upward trends in precipitation were noted, but they were statistically insignificant (Table 5 and Table S1).

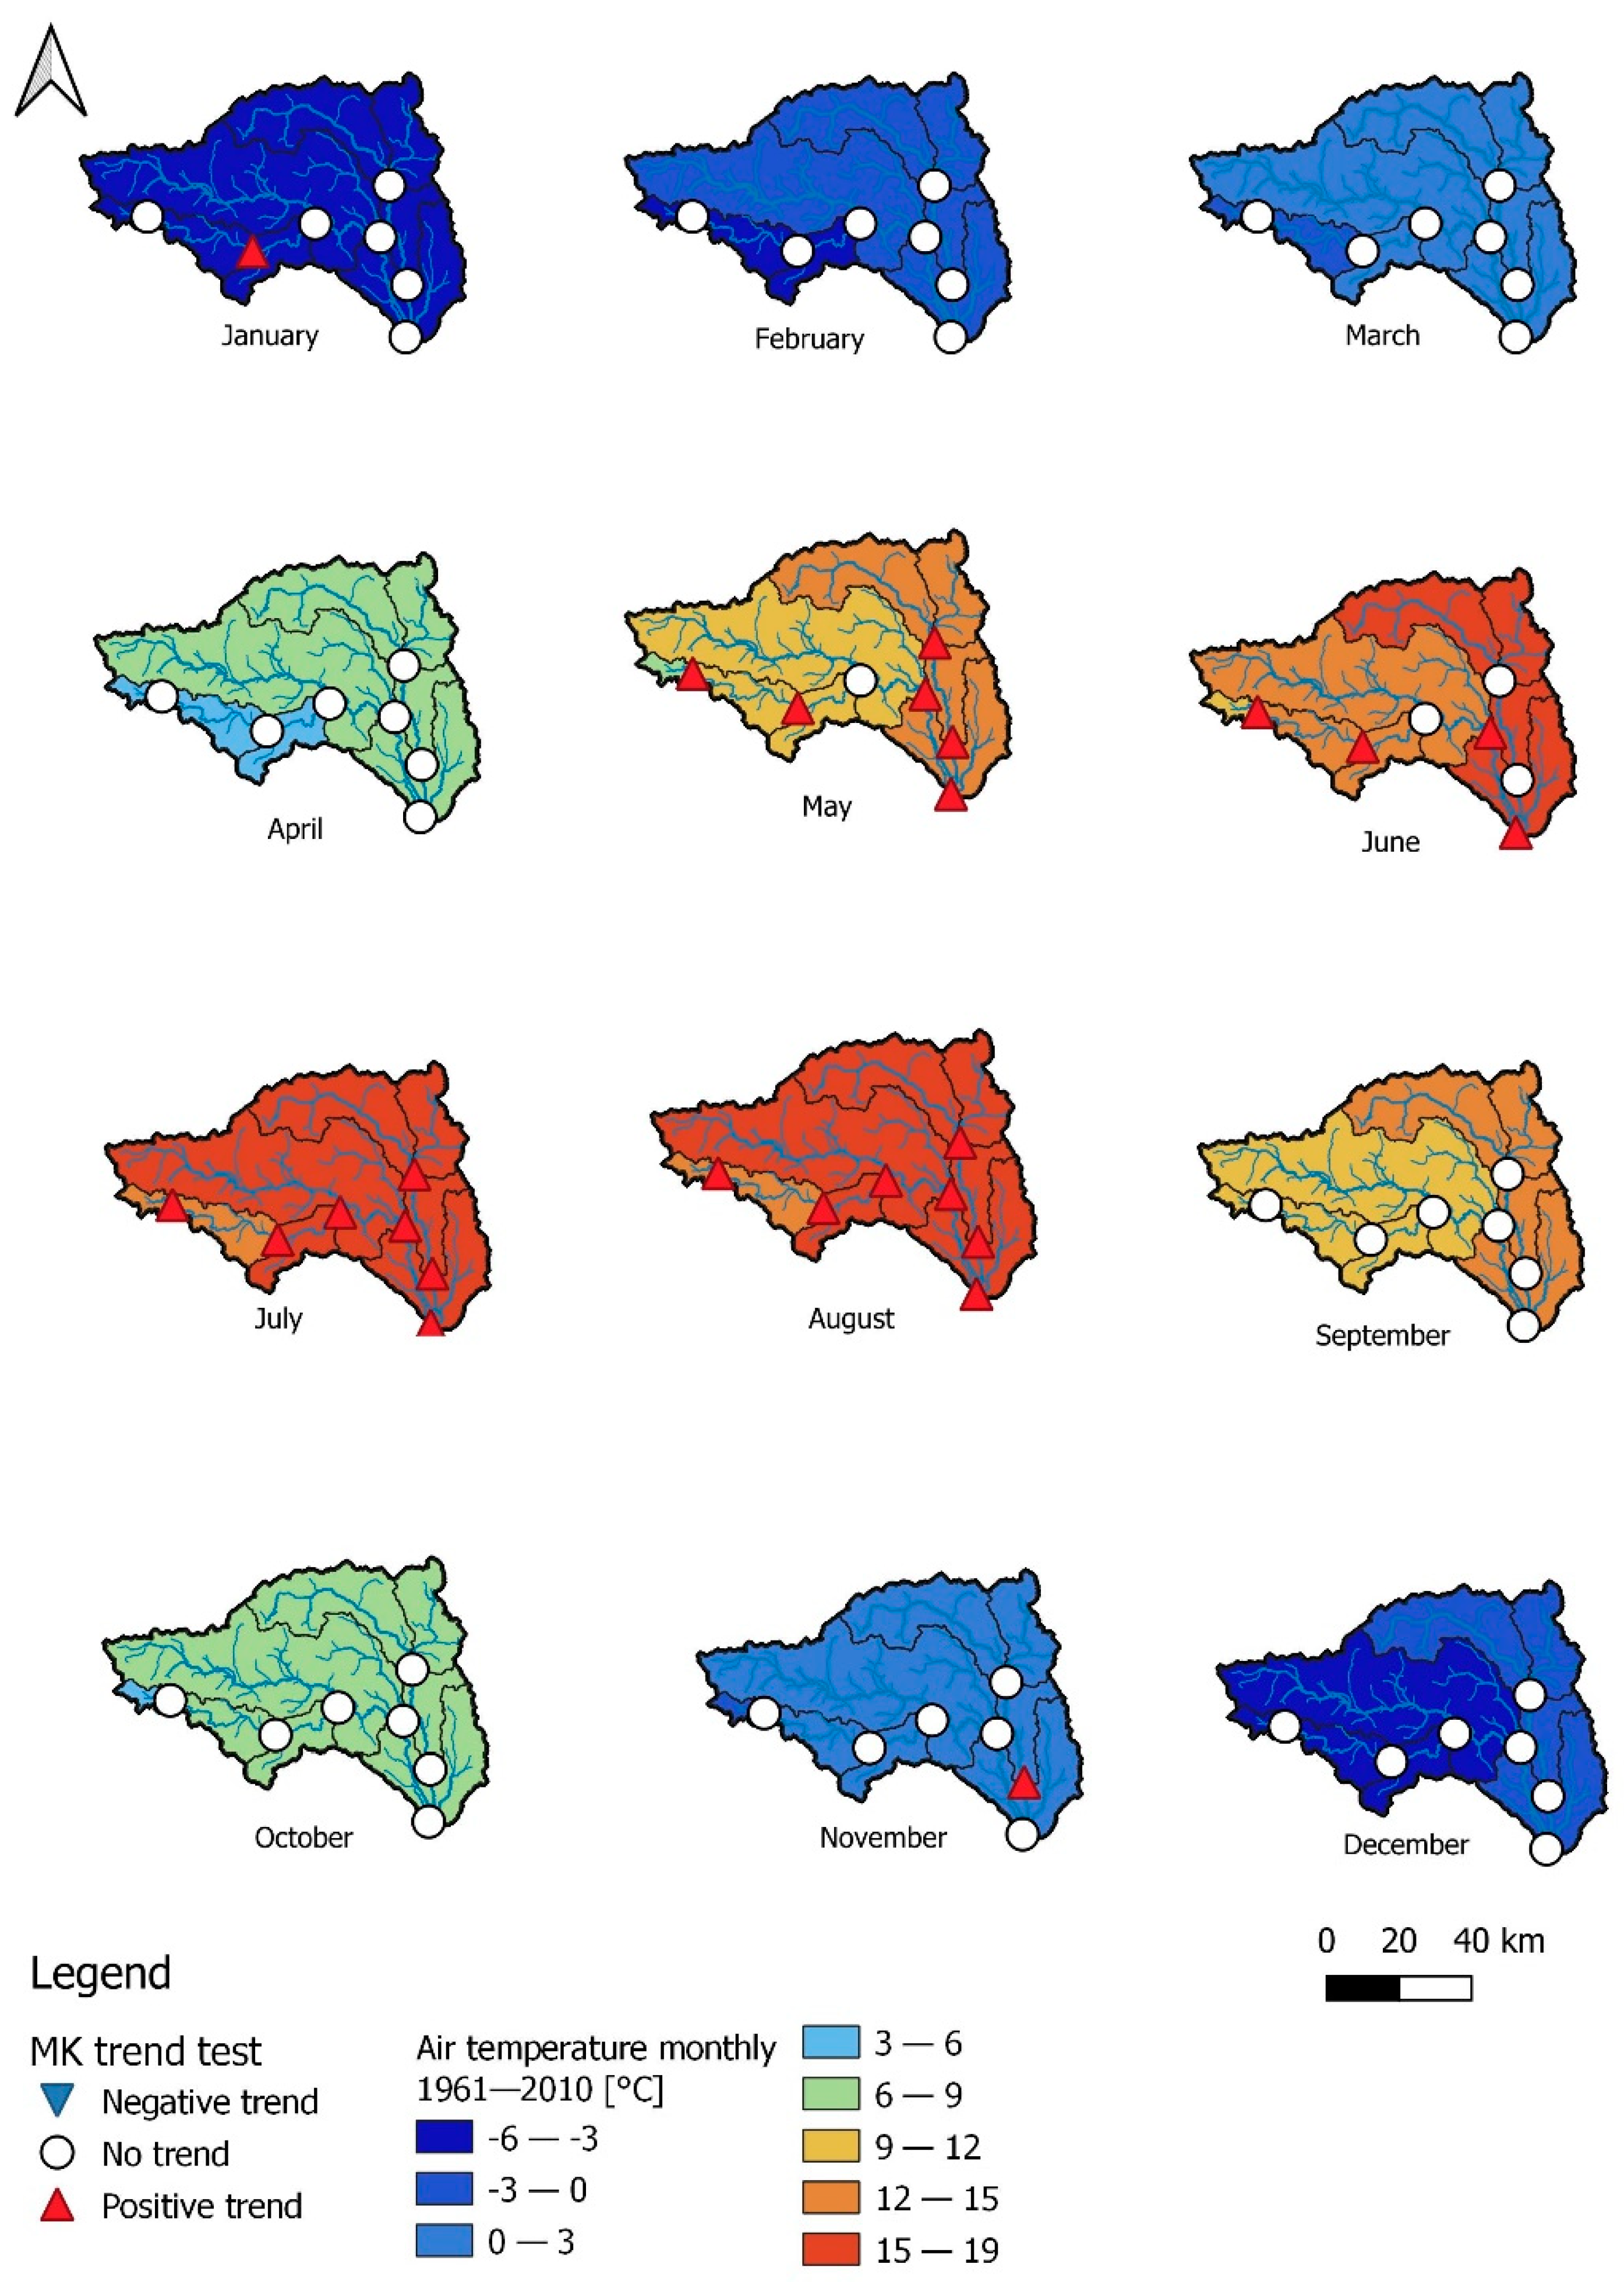
3.2.2. Air Temperature

The analysis of long-term trends in air temperature using the MK test and Sen’s slope method showed statistically significant upward trends in air temperature in the periods 1961–2010 and 1986–2010 in all sub-catchments. The period 1961–1985 was much cooler than the period 1986–2010, and the trend was decreasing in four of the seven sub-catchment areas, but it was not statistically significant (Table 6 and Table S2).
The calculations show that both precipitation and air temperature had statistically significant growth trends in the period 1986–2010, which influences the course of the trends in the entire analyzed period of 1961–2010.

3.2.3. Flows

The analysis of the variability of annual flows using the MK test and Sen’s slope method showed an upward trend of flows at four hydrological stations in 1961–2010, while on the other three, the trend was downward (Table 7 and Table S3). In MK test cases, these values were not statistically significant, except for the downward trend in flows at the Stratená station. The multi-year period 1961–1985 showed slight trends in flows or no trends, as opposed to the period 1986–2010, when the upward trends in flows were noted at all stations and were statistically significant for six of the seven analyzed hydrological stations. It can be concluded that there was a tendency to increase the volume of flows in the multi-year period 1986–2010 in relation to the multi-year period 1961–1985. This is the effect of an increase in annual precipitation totals and an increase in air temperature. This is especially visible at the hydrological stations located on the Hornad River (Ždaná, Kysak and Košické Olšany). The increase in flows should be associated with the increase in precipitation, but also with the increase in air temperature. Air temperature accelerates the melting of snow accumulated in the upper parts of the catchment area. An additional element influencing the changes in the runoff is land use, which contributes to the rapid runoff of precipitation.

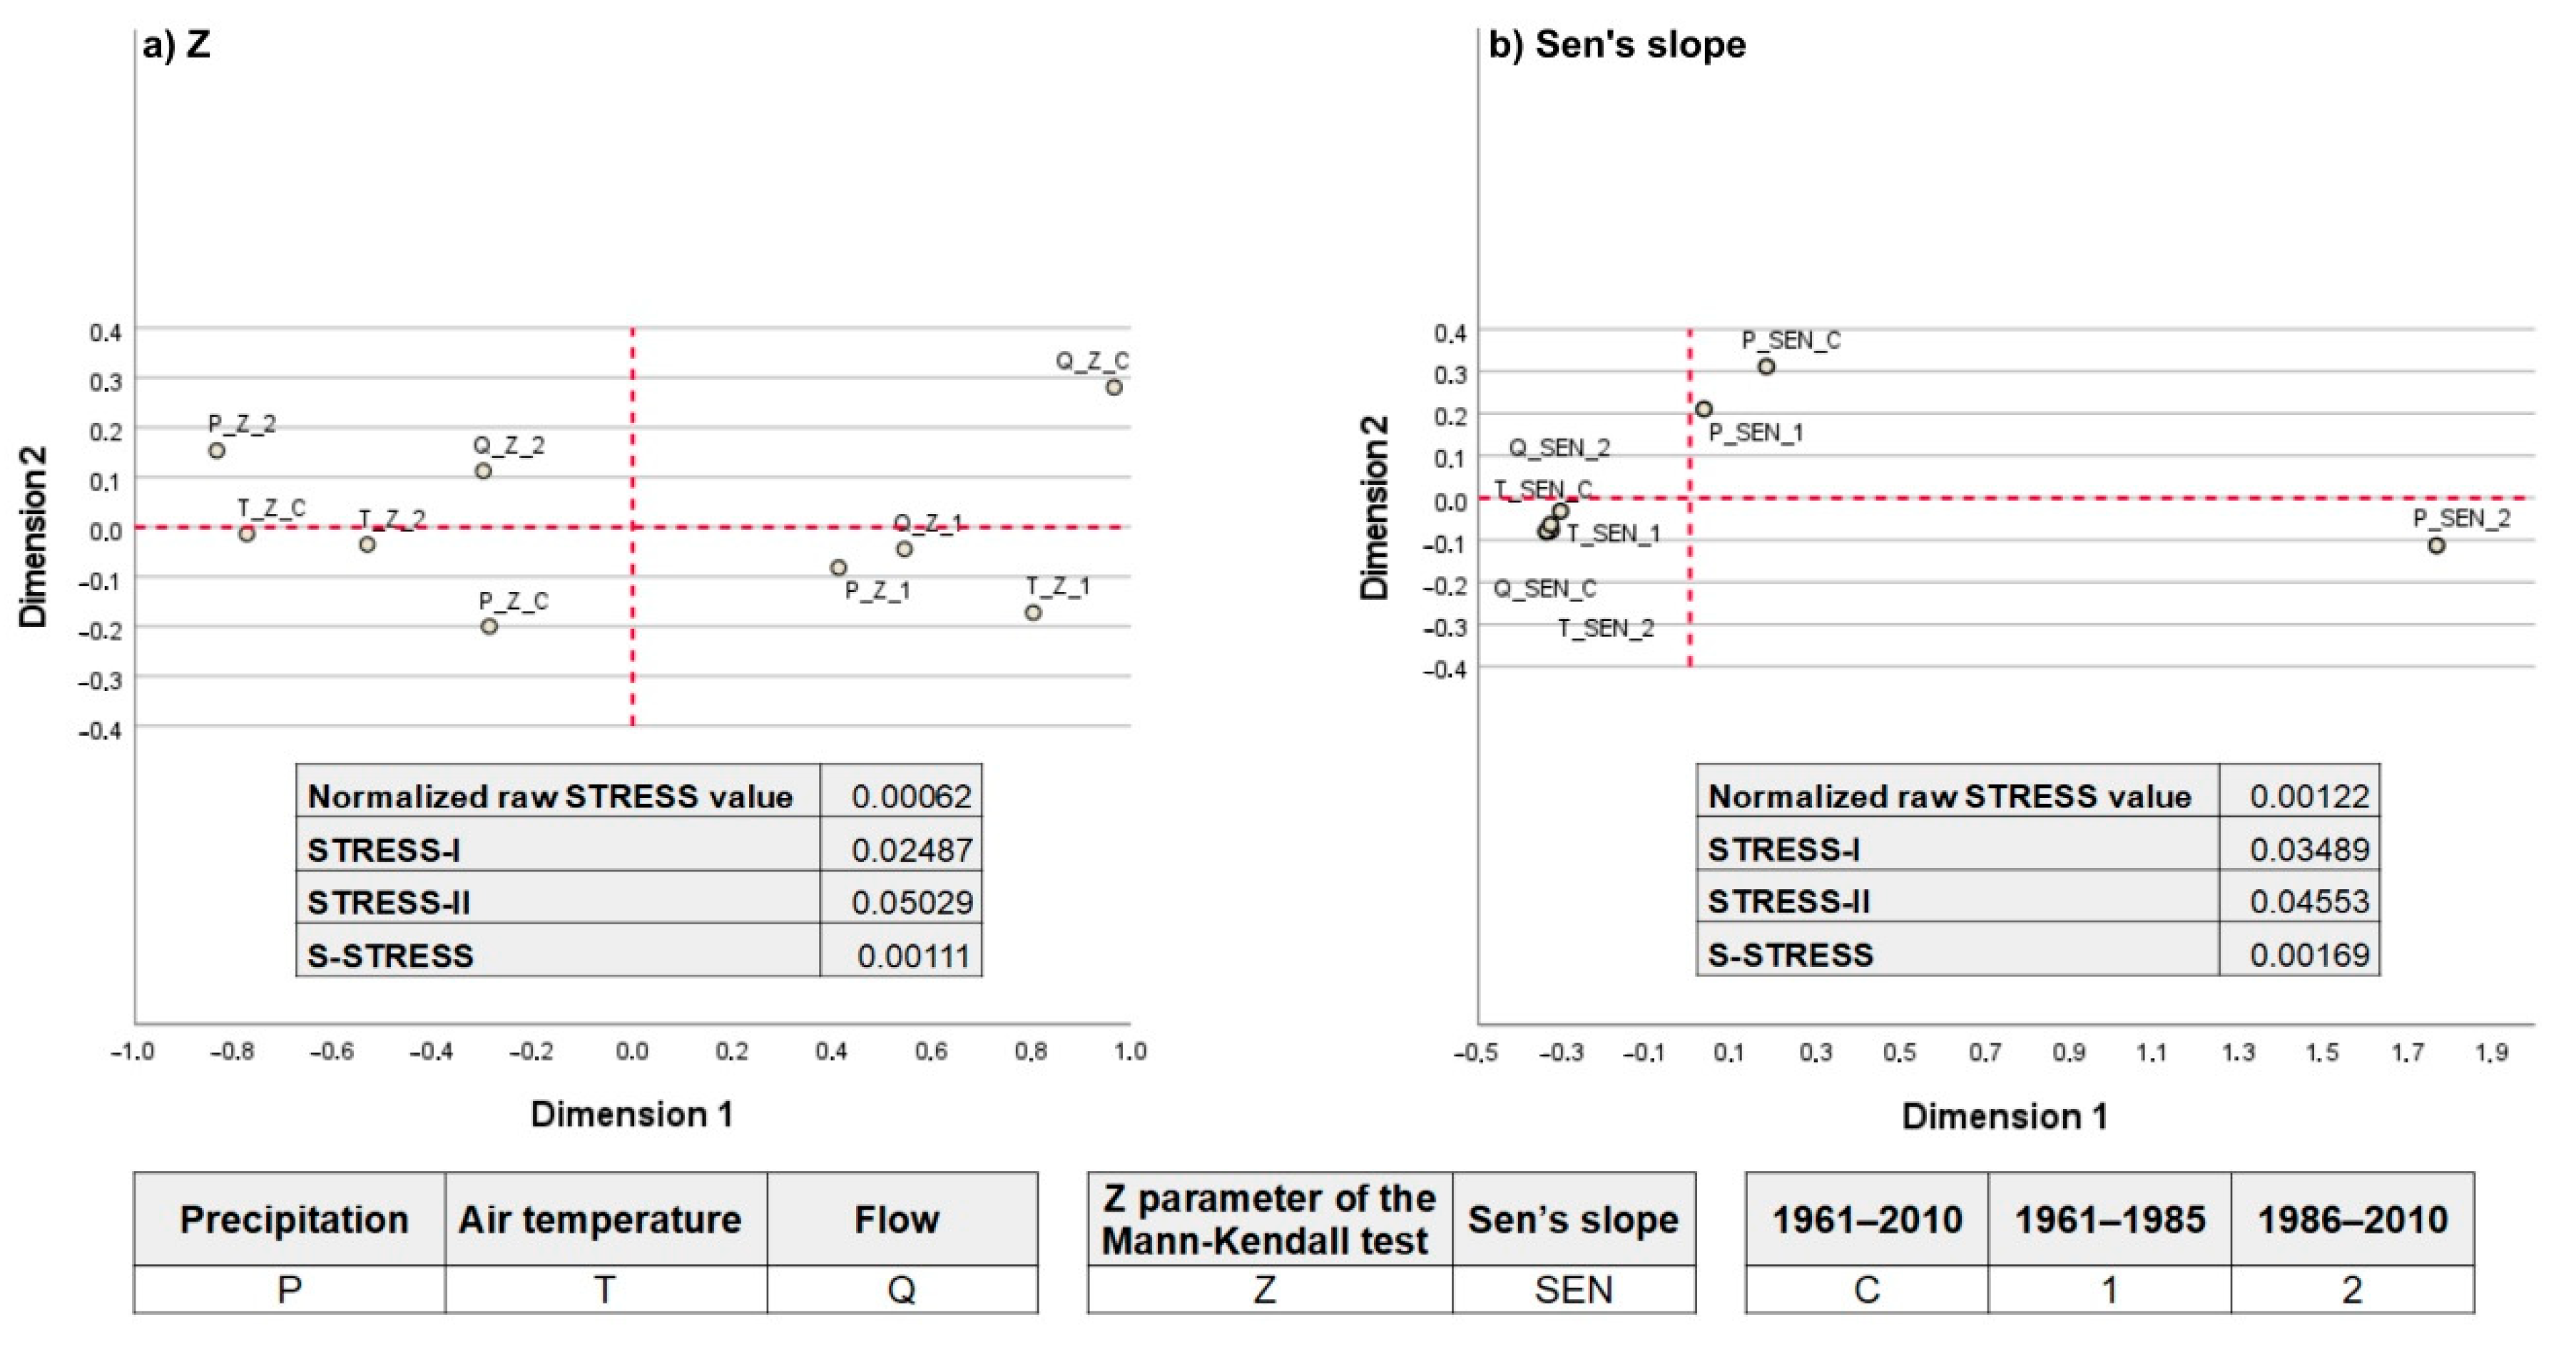
3.2.4. Relationships between Trends in Precipitation, Air Temperature and Flow

The normalized raw STRESS and S-STRESS values of the analyzed Z parameter of the Mann-Kendall test and Sen’s slope (Figure 5) are less than 0.02, so a faithful representation was obtained. The STRESS-I and STRESS-II values, although higher, do not meet the very weak matching criterion.
When analyzing the results of multidimensional scaling carried out for the Z parameter of the Mann-Kendall test (Figure 5), it should be indicated that the most compact group of similarity between hydroclimatic variables are the variables from the period 1961–1985 (in particular, the precipitation trend with the flow trend). This means that the trends in precipitation and air temperature recorded within all sub-catchments in the analyzed period are in a certain relationship with the flow trends. The greatest dissimilarity is shown in the flow trend from the entire analyzed period of 1961–2010.
As for the results of multidimensional scaling for Sen’s slope (magnitude of trends), the greatest dissimilarity among all the variables is shown by the magnitude of the precipitation trend from 1986–2010 (Figure 5). It should also be noted that it is the magnitude of precipitation trends for all analyzed periods that show a certain dissimilarity in relation to the magnitude of air temperature and flow trends. This means that each of the sub-catchments reacts differently to changes in precipitation, air temperature and flow.

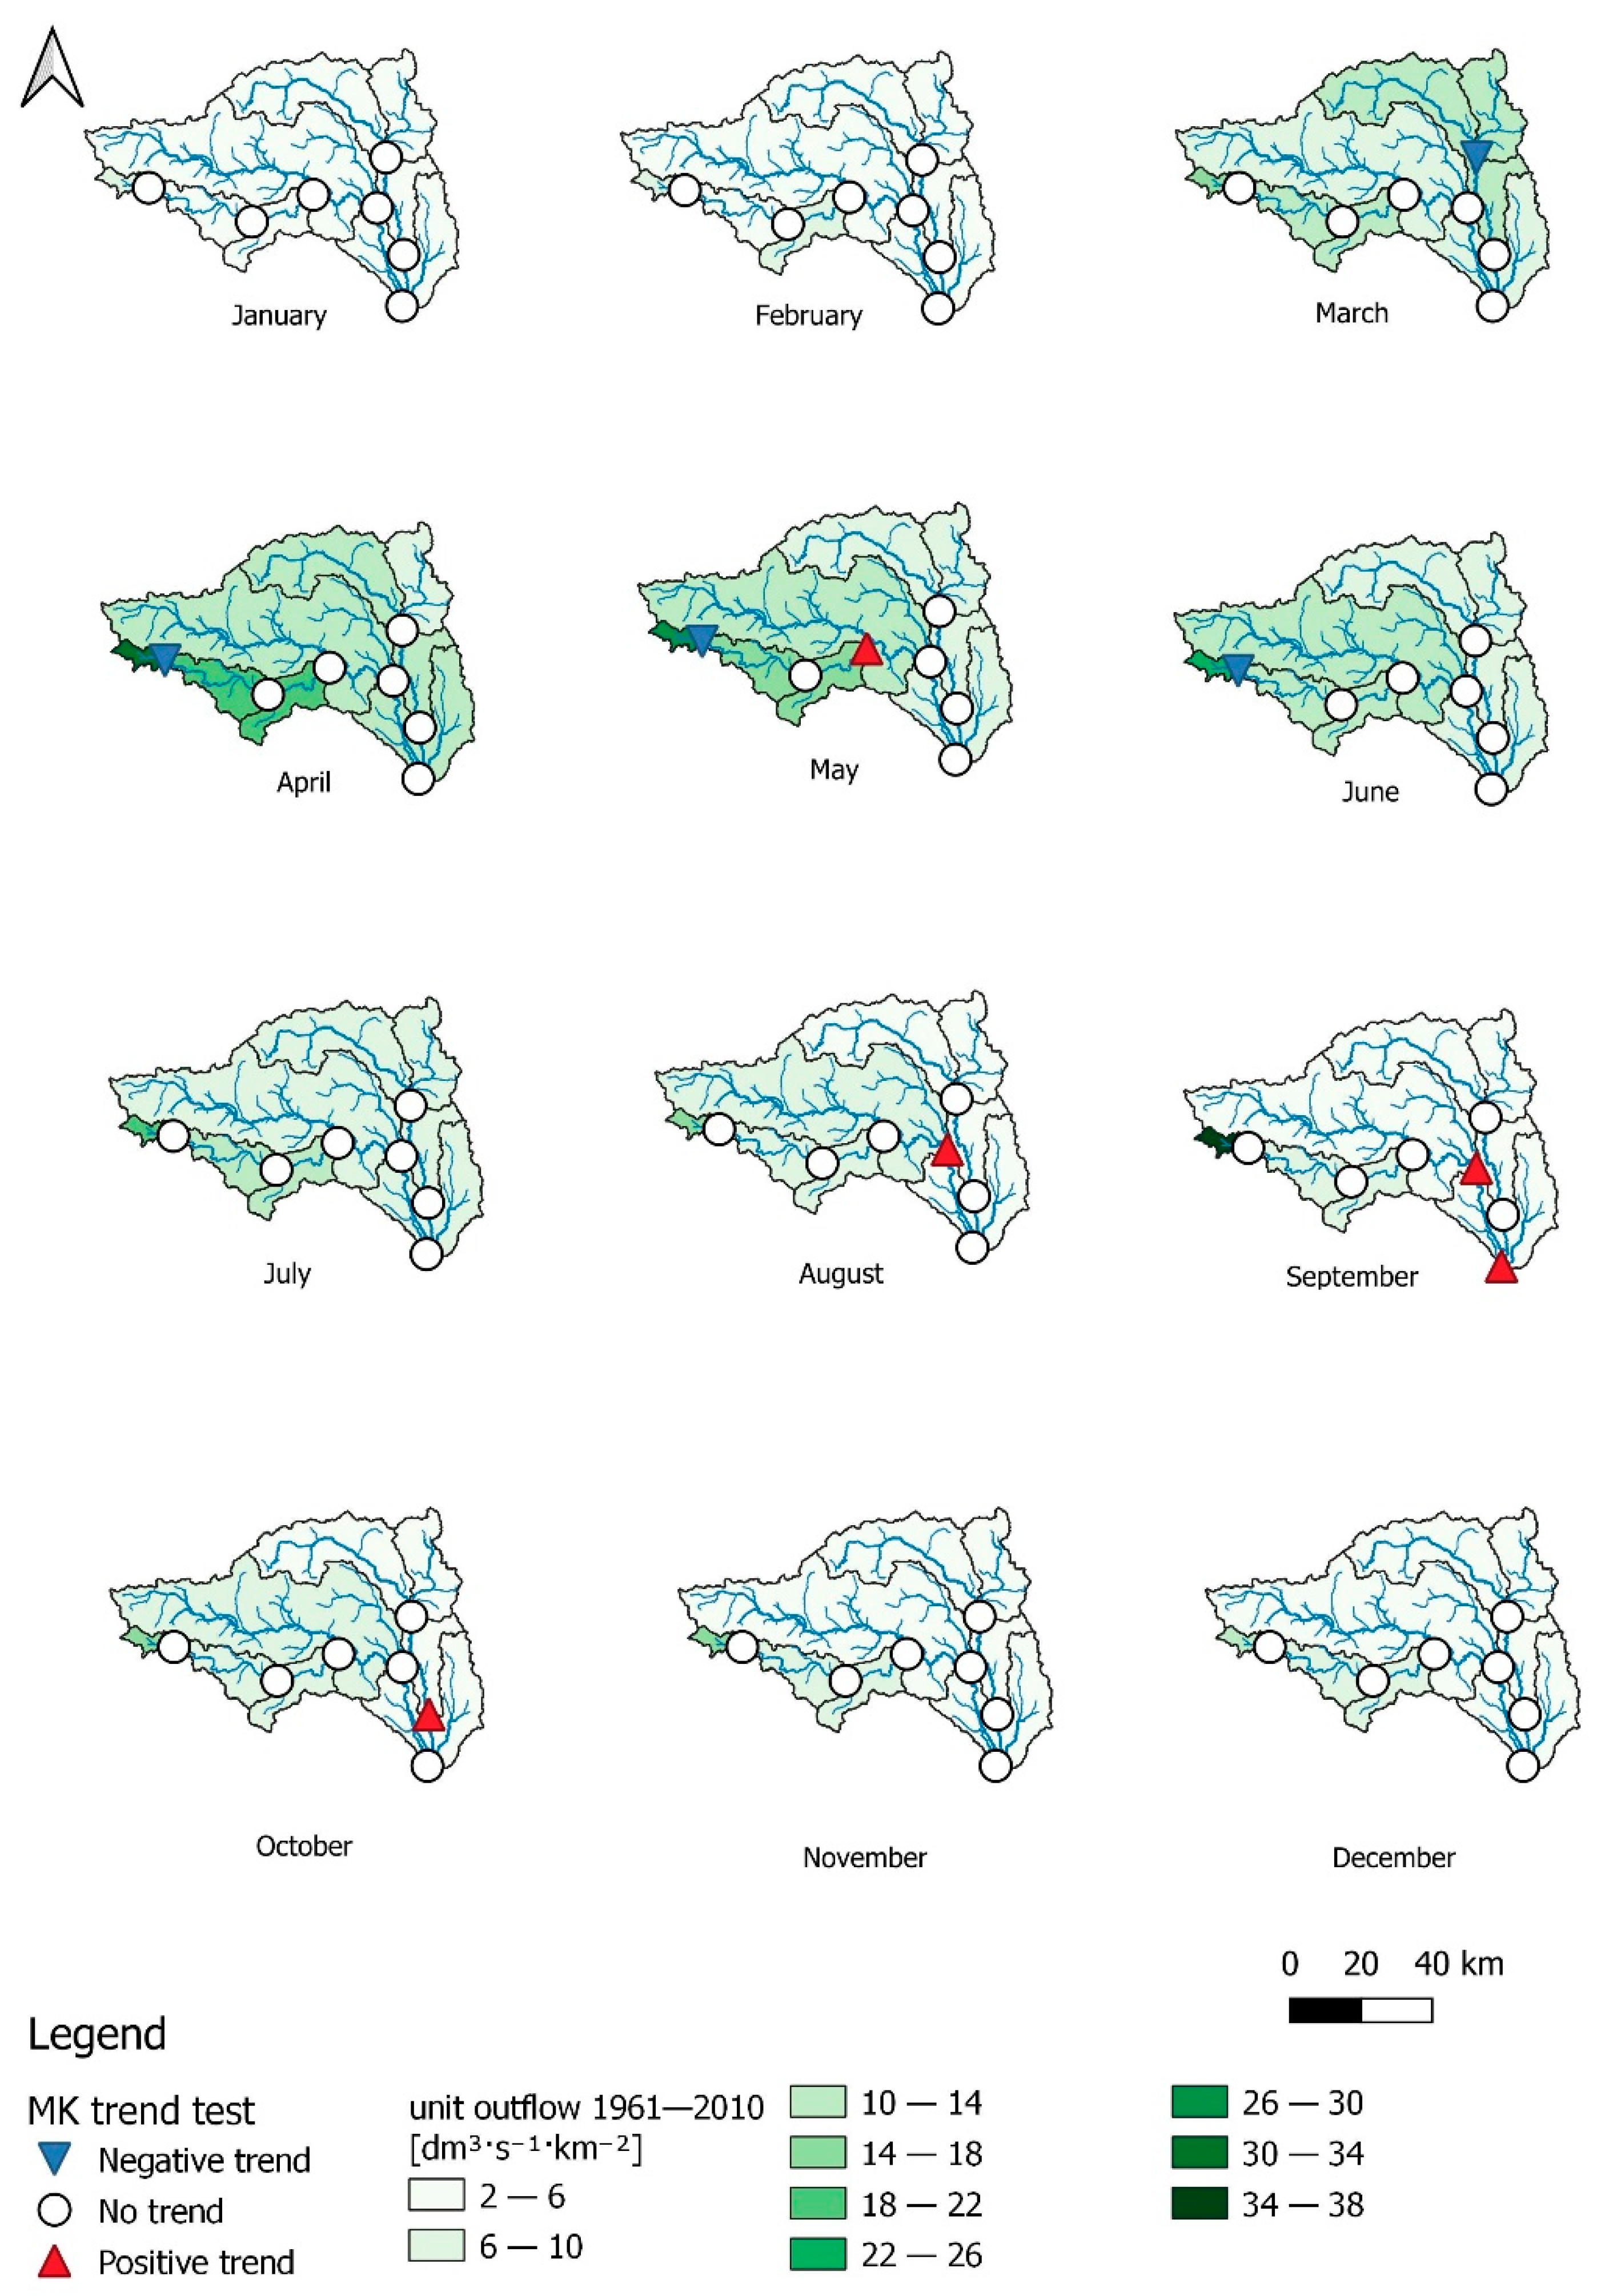
3.3. Monthly Variability in Precipitation, Air Temperature and Flows

A characteristic feature of the flows is their monthly variability. Figure 6, Figure 7 and Figure 8 present the variability of river flows, air temperature and precipitation in individual months in the analyzed multi-year period 1961–2010. In the multi-year period 1961–1985 (Figures S4–S6), an upward trend in precipitation was recorded within the sub-catchment closed by the hydrological station Ždaná in September and Košické Olšany in May and October. In the remaining months of this multi-year period, the trend was not statistically significant. In the multi-year period 1986–2010 (Figures S7–S9), an upward trend in precipitation in July was noticeable, which was recorded in six of the seven sub-catchments. No statistically significant trend was recorded, with the exception of the Švedlár sub-catchment area. In January, for the multi-year period 1986–2010, a statistically significant upward trend was recorded only for the Jaklovce sub-catchment. The analysis of the entire multi-year period 1961–2010, in terms of the variability of atmospheric precipitation, showed no statistically significant trend. In the case of seasonal variability of air temperature, greater variation in the variability in individual multi-year periods and in individual months is visible. In the period 1961–1985, an upward trend in air temperature is visible, statistically significant in April in the sub-catchment closed by the Stratená and Švedlár stations (the upper part of the Hnilec River catchment), but in other sub-catchments, a downward trend in air temperature is visible. In November, there is a downward trend in air temperature in almost all sub-catchments, except for the Stratená sub-catchment. On the other hand, in June, an upward trend is visible only at the Stratená station, and in December, an upward trend in air temperature is visible only in the Švedlár and Jaklovce sub-catchments. In the years 1986–2010, an upward trend in air temperature is visible, which was observed in April (for three sub-catchments: Stratená, Jeklovce, Kysak). In June, an upward trend was recorded in all sub-catchments, in July for three sub-catchments (Prešov-Sekčov, Kysak, Košické Olšany), in August for four sub-catchments (Prešov-Sekčov, Kysak, Ždaná, Košické Olšany) and in September for two sub-catchments (Prešov-Sekčov and Košické Olšany). In the years 1961–2010, an upward trend in air temperature was recorded in May in six of the seven sub-catchments (except Jaklovce), in June in four stations (except Jaklovce, Prešov-Sekčov, Košické Olšany) and in July and August in all sub-catchments. Moreover, it should be noted that in January, there was an upward trend in the Švedlár sub-catchment.
The analysis of the variability of flows in the years 1961–1985 showed smaller variations (Figure S8). A statistically significant upward trend was recorded in individual months, e.g., in January (Košické Olšany), April (Jeklovce, Košické Olšany), May (Jaklovce, Košické Olšany), September (Ždaná) and October (Prešov-Sekčov, Kysak, Košické Olšany). In the years 1986–2010, a statistically significant upward trend in flows was recorded from August to December at most of the hydrological stations. In the years 1961–2010, flow growth trends were recorded at individual stations—mainly at the Kysak hydrological station. As shown by the analysis of trends in individual months and multi-years, the most visible is an upward trend in the multi-year period 1986–2010, which was recorded mainly from August to December within the individual hydrological stations.

3.4. Discussion

The analysis of annual precipitation and air temperature throughout the analyzed multi-year period 1961–2010, as well as in the years 1961–1985 and 1986–2010, showed an increasing trend. The increase in precipitation and the increase in air temperature did not translate into an increase in flows within all sub-catchments. The decisive factor in this period were the dry years in Slovakia in the 1980s and 1990s. Vido et al. [68] believes that in these years there was a change in the weather circulation pattern in the region, but this change had only a marginal impact on the overall tendency towards drought.
Many researchers believe that the amount of precipitation and air temperature depend on the circulation in the North Atlantic region, which affects the whole of Europe [69,70,71]. The impact of NAO in the winter season is particularly visible. Research by Labudová et al. [72] showed that the impact of the North Atlantic Oscillation on the sum of winter precipitation in Slovakia is zonal. The correlations between NAO and precipitation in eastern Slovakia are low, which may result from the occurrence of a natural orographic barrier such as the Carpathians.
The trend detection study in eastern Slovakia conducted by Zelenakova et al. [73] showed time differences in the occurrence and direction of trends. Among other things, several increasing significant trends in precipitation were identified, but more pronounced increasing significant trends were noted in air temperature. This situation confirms our analyzes in this area carried out on the basis of traditional methods, namely the Mann Kendall test and the Sen’s slope. A new look at the relationship between precipitation, air temperature and flow trends was possible using the multidimensional scaling method. The results of multidimensional scaling carried out for the Z parameter of the Mann-Kendall test showed that the most compact group of similarity of hydroclimatic variables within all sub-catchments are the variables from the period 1961–1985. The trend of the outflow from the entire analyzed period of 1961–2010 shows the greatest dissimilarity, while for Sen’s slope, the greatest dissimilarity among all the variables is shown in the strength of the precipitation trend in the years 1986–2010. The obtained results indicate that there has been a change in the mutual relations between the trends in precipitation, temperature and flow in individual sub-catchments, especially in the period 1986–2010, which may be an indicator of local climate changes in recent years.
A study of the variability and trends of flows on most Slovak rivers was carried out by Danácová et al. [74]. The trend analysis of the average monthly flows over the longer research period (60 years) showed a significant downward tendency in flows in the summer months (April to August). The difference in the response of runoff to variability in precipitation and air temperature within individual sub-catchments is probably related to other factors. The discussed catchments are diversified in terms of area, topography and land use, which is important in the catchment’s response to changes in the meteorological conditions. Small mountain catchments are extremely delicate and sensitive to climate change or land use [75,76,77]. Sub-catchments with low sensitivity react much slower to the variability of flows as a result of meteorological changes. The lack of visible downward or upward trends in individual months does not translate into visible inter-year volatility. The reason for this may be the occurrence of short-term changes, often impossible to capture due to the period of their occurrence. Thus, land-use change and topography are only two of the factors influencing precipitation behavior, and, in some cases, they may not be sufficient to explain the variability of long-term precipitation trends if analyzed on their own. Detailed research is therefore required to understand the interactions of various environmental factors and their effect on precipitation trends. As many studies indicate, the analysis of precipitation trends, air temperature and flows will play a significant role in the future and sustainable development of water resource management [78,79].

4. Conclusions

The study examined monotonic trends in precipitation, air temperature and flows in seven river sub-catchments in eastern Slovakia. The data covered the years 1961–2010, both on an annual and monthly basis. The Mann-Kendall test and Sen’s slope method were used for the assessment. A new approach was used to determine the relationship between the trends, involving the use of the multidimensional scaling method. The main findings are: (1) Statistically significant upward trends were found in annual air temperature in the years 1961–2010. On the other hand, a statistically significant downward trend in flows was recorded only at the Stratená station (a small mountain catchment with high sensitivity). The remaining upward and downward trends were not statistically significant. (2) Considerable and statistically significant upward trends in the average annual precipitation, air temperature and flows were recorded in the period 1986–2010. (3) Trends in air temperature, precipitation and flow varied in individual months during the analyzed multi-year periods. (4) On the basis of multidimensional scaling, the best relationships between trends in precipitation, air temperature and flow were recorded in the period 1961–1985 for the Z parameter of the MK test, while weaker relationships between air temperature and precipitation, as well as flows and precipitation, were recorded for Sen’s slope (trend strength) in the period 1986–2010. (5) Increasing trends in air temperature were statistically significant from May to August in the period 1961–2010. No trends in precipitation were recorded in the period 1961–2010, and only an upward trend in precipitation was recorded in June in 1986–2010. Statistically significant downward trends in flows were recorded at most of the hydrological stations in the months from August to December in the multi-year period 1986–2010. (6)A high sensitivity of river flows to changes in meteorological conditions on a monthly basis was observed in smaller mountain catchments (Stratená). Perhaps the reason was a change in land use. (7) Due to the large differences in the area, topography and land use of the analyzed catchments, the river’s reaction to meteorological conditions is difficult to capture by means of annual trends over a long period of observation. Constant monitoring of hydrometeorological conditions in connection with the physical-geographic conditions of the catchment area and anthropogenic activity is required in order to gain insight into various aspects of the hydrological changes taking place at smaller, subregional and local scales.

Supplementary Materials

The following supporting information can be downloaded at: https://www.mdpi.com/article/10.3390/w15030471/s1, Figure S1. Annual precipitation totals (P) in particular years in the multiannual period 1961–2010; Figure S2. Average annual air temperature (T) in particular years in the multiannual period 1961–2010; Figure S3. Annual flows (Q) in particular years in the multiannual period 1961–2010 as well as 1961–1985 and 1986–2010; Figure S4. Monthly trends in the precipitation during the years 1961–1985; Figure S5. Monthly trends in the precipitation during the years 1986–2010; Figure S6. Monthly trends in the air temperature during the years 1961–1985; Figure S7. Monthly trends in the air temperature during the years 1986–2010; Figure S8. Monthly trends in flow during the years 1961–1985; Figure S9. Monthly trends in flow during the years 1986–2010; Table S1. Results of trend analysis in precipitations; Table S2. Results of trend analysis in air temperature; Table S3. Results of trend analysis in flow.

Author Contributions

Conceptualization, K.K.-W., P.N., A.P. and M.Z.; methodology, K.K.-W., P.N. and A.P.; software, K.K.-W., P.N., A.P. and M.Z.; validation, K.K.-W., P.N. and A.P.; formal analysis, K.K.-W., P.N., A.P. and M.Z.; investigation, K.K.-W., P.N., A.P. and M.Z.; resources, K.K.-W., P.N. and M.Z.; data curation, K.K.-W., P.N., A.P. and M.Z.; writing—original draft preparation, K.K.-W. and A.P.; writing—review and editing, K.K.-W., P.N., A.P. and M.Z.; visualization, K.K.-W. and P.N.; supervision, K.K.-W., P.N., A.P. and M.Z.; project administration, K.K.-W.; funding acquisition, K.K.-W. All authors have read and agreed to the published version of the manuscript.

Funding

This research received no external funding.

Institutional Review Board Statement

Not applicable.

Informed Consent Statement

Not applicable.

Data Availability Statement

Not applicable.

Conflicts of Interest

The authors declare no conflict of interest.

References

  1. Pekárová, J.; Miklanek, P.; Pekár, J. Long-term trends and runoff fluctuations of European rivers. Climate Variability and Change—Hydrological Impacts. In Proceedings of the Fifth FRIEND World Conference, Havana, Cuba, 27 November–1 December 2006; pp. 520–525. [Google Scholar]
  2. Stahl, K.; Hisdal, H.; Hannaford, J.; Tallaksen, L.; Van Lanen, H.; Sauquet, E.; Demuth, S.; Fendekova, M.; Jordar, J. Streamflow trends in Europe: Evidence from a dataset of near-natural catchments. Hydrol. Earth Syst. Sci. 2010, 14, 2367–2382. [Google Scholar] [CrossRef] [Green Version]
  3. Kubiak-Wójcicka, K.; Jamorska, I. An analysis of groundwater drought in combination with meteorological drought. Case study of the Gwda River catchment (northern Poland). Acta Montanistica Slovaca 2022, 27, 667–684. [Google Scholar] [CrossRef]
  4. Pabón-Caicedo, J.D.; Arias, P.A.; Carril, A.F.; Espinoza, J.C.; Borrel, L.F.; Goubanova, K.; Lavado-Casimiro, W.; Masiokas, M.; Solman, S.; Villalba, R. Observed and Projected Hydroclimate Changes in the Andes. Front. Earth Sci. 2020, 8, 61. [Google Scholar] [CrossRef]
  5. Šraj, M.; Bezak, N. Comparison of time trend- and precipitation-informed models for assessing design discharges in variable climate. J. Hydrol. 2020, 589, 125374. [Google Scholar] [CrossRef]
  6. Banda, V.D.; Dzwairo, R.B.; Singh, S.K.; Kanyerere, T. Trend analysis of selected hydro-meteorological variables for the Rietspruit sub-basin, South Africa. J. Water Clim. Chang. 2021, 12, 3099–3123. [Google Scholar] [CrossRef]
  7. El Aoula, R.; Mahe, G.; Mhammdi, N.; Ezzahouani, A.; Kacimi, I.; Khomsi, K. Evolution of the hydrological regime in relation to climate change: Case of the Bouregreg River basin, Morocco. Geogr. Pol. 2021, 1, 131–147. [Google Scholar] [CrossRef]
  8. Makungo, R.; Mashinye, M.D. Long-term trends and changes in rainfall magnitude and duration in a semi-arid catchment, South Africa. J. Water Clim. Chang. 2022, 13, 2319. [Google Scholar] [CrossRef]
  9. Du, P.; Xu, M.; Li, R. Impacts of climate change on water resources in the major countries along the Belt and Road. PeerJ 2021, 9, e12201. [Google Scholar] [CrossRef]
  10. Hlavčová, K.; Kohnová, S.; Borga, M.; Horvát, O.; Št’astný, P.; Pekárová, P.; Majerčáková, O.; Danáčová, Z. Post-event analysis and flash flood hydrology in Slovakia. J. Hydrol. Hydromech. 2016, 64, 304–315. [Google Scholar] [CrossRef] [Green Version]
  11. Wałęga, A.; Kowalik, T.; Bogdał, A. Estimating the occurrence of trends in selected elements of a small sub-mountain catchment hydrological regime. Pol. J. Environ. Stud. 2016, 25, 2151–2159. [Google Scholar] [CrossRef]
  12. Spinoni, J.; Naumann, G.; Vogt, J.V. Pan-European seasonal trends and recent changes of drought frequency and severity. Glob. Planet. Chang. 2017, 148, 113–130. [Google Scholar] [CrossRef]
  13. Wrzesiński, D. Use of entropy in the assessment of uncertainty of river runoff regime in Poland. Acta Geophys. 2016, 64, 1825–1839. [Google Scholar] [CrossRef] [Green Version]
  14. Krebs, G.; Camhy, D.; Muschalla, D. Hydro-Meteorological Trends in an Austrian Low-Mountain Catchment. Climate 2021, 9, 122. [Google Scholar] [CrossRef]
  15. Jalón-Rojas, I.; Castelle, B. Climate Control of Multidecadal Variability in River Discharge and Precipitation in Western Europe. Water 2021, 13, 257. [Google Scholar] [CrossRef]
  16. Kubiak-Wójcicka, K. Variability of Air Temperature, Precipitation and Outflows in the Vistula Basin (Poland). Resources 2020, 9, 103. [Google Scholar] [CrossRef]
  17. Stefanidis, S.; Stathis, D. Spatial and Temporal Rainfall Variability over the Mountainous Central Pindus (Greece). Climate 2018, 6, 75. [Google Scholar] [CrossRef] [Green Version]
  18. Arnell, N.W. Climate change and global water resources. Glob. Environ. Chang. 1999, 9, S31–S49. [Google Scholar] [CrossRef]
  19. The Intergovernmental Panel on Climate Change (IPCC). Climate Change (IPCC). Climate change 2013: The physical science basis. In Contribution of Working Group I to the 5th Assessment Report of the Intergovernmental Panel on Climate Change; Cambridge University Press: Cambridge, UK; New York, NY, USA, 2013. [Google Scholar]
  20. Melo, M.; Lapin, M.; Damborska, I. Methods for the design of climate change scenario in Slovakia for the 21st Century. Bull. Geogr. Phys. Geogr. Ser. 2009, 1, 77–90. [Google Scholar] [CrossRef] [Green Version]
  21. Štefunková, Z.; Hlavčová, K.; Lapin, M. Runoff change scenarios based on regional climate change projections in mountains basin in Slovakia. Contrib. Geophys. Geod. 2013, 43, 327–350. [Google Scholar] [CrossRef] [Green Version]
  22. Kohnová, S.; Vasilaki, M.; Hanel, M.; Szolgay, J.; Hlavčová, K.; Loukas, A.; Földes, G. Detection of future changes in trends and scaling exponents in extreme short-term precipitation at selected stations in Slovakia. Contrib. Geophys. Geod. 2018, 48, 207–230. [Google Scholar] [CrossRef]
  23. Fendeková, M.; Horvát, O.; Blaškovičova, L.; Danáčová, Z.; Fendek, M.; Bochníček, O. Prognosis of climate change driven drought in the Poprad, Torysa and Topl’a river basins. Acta Hydrol. Slovaca 2018, 19, 234–243. [Google Scholar]
  24. Marková, I.; Monoši, M. Expressions of climatic change in Slovak Republic. Ann. Univ. Paedagog. Crac. Stud. Nat. 2020, 5, 145–156. [Google Scholar] [CrossRef]
  25. Labudová, L.; Faško, P.; Ivaňáková, G. Changes in climate and changing climate regions in Slovakia. Morav. Geogr. Rep. 2015, 23, 71–82. [Google Scholar] [CrossRef] [Green Version]
  26. Büntgen, U.; Brázdil, R.; Frank, D.; Esper, J. Three centuries of Slovakian drought dynamics. Clim Dyn 2010, 35, 315–329. [Google Scholar] [CrossRef] [Green Version]
  27. Holko, L.; Sleziak, P.; Danko, M.; Bičárová, S.; Pociask-Karteczka, J. Analysis of changes in hydrological cycle of a pristine mountain catchment.1. Water balance components and snow cover. J. Hydrol. Hydromech. 2020, 68, 180–191. [Google Scholar] [CrossRef]
  28. Repel, A.; Zelenakova, M.; Vranayova, Z.; Kanalikova, A.; Hlavata, H. Analysis of trends in precipitation time series in selected precipitation stations in eastern Slovakia. IOP Conf. Ser. Earth Environ. Sci. 2020, 444, 012048. [Google Scholar] [CrossRef]
  29. Blaškovičová, L.; Jeneiová, K.; Melová, K.; Poórová, J.; Liová, S.; Slivková, K.; Síčová, B. Changes in Selected Low-Flow Characteristics in the 2001–2015 Period Compared to the 1961–2000 Reference Period in Slovakia. Climate 2022, 10, 81. [Google Scholar] [CrossRef]
  30. Kubiak-Wójcicka, K.; Machula, S. Influence of Climate Changes on the State of Water Resources in Poland and Their Use. Geosciences 2020, 10, 312. [Google Scholar] [CrossRef]
  31. Gudmundsson, L.; Boulange, J.; Do, H.X.; Gosling, S.N.; Grillakis, M.G.; Koutroulis, A.G.; Leonard, M.; Liu, J.; Schmied, H.M.; Papadimitriou, L.; et al. Globally observed trends in mean and extreme river flow attributed to climate change. Science 2021, 371, 1159–1162. [Google Scholar] [CrossRef] [PubMed]
  32. Bahremand, A.; De Smedt, F. Distributed Hydrological Modeling and Sensitivity Analysis in Torysa Watershed, Slovakia. Water Resour Manag. 2008, 22, 393–408. [Google Scholar] [CrossRef]
  33. Kliment, Z.; Matoušková, M. Runoff Changes in the Šumava Mountains (Black Forest) and the Foothill Regions: Extent of Influence by Human Impact and Climate Change. Water Resour Manag. 2009, 23, 1813–1834. [Google Scholar] [CrossRef]
  34. Faško, P.; Kajaba, P.; Markovic, L.; Pecho, J. Trends in heavy precipitation in Slovakia over 1951–2017. EMS Annu. Meet. Abstr. 2018, 15, EMS 2018-462. [Google Scholar]
  35. Kralovec, V.; Kliment, Z.; Matouškova, M. Evaluation of runoff response on the basis of a comparative paired research in mountain catchments with the different land use: Case study of the Blanice River, Czechia. Geografie 2016, 121, 209–234. [Google Scholar] [CrossRef]
  36. Zeleňáková, M.; Repel, A.; Vranayová, Z.; Kaposztasová, D.; Abd-Elhamid, H.F. Impact of land use changes on surface runoff in urban areas—Case study of Myslavsky Creek Basin in Slovakia. Acta Montan. Slovaca 2019, 24, 129–139. [Google Scholar]
  37. Kubiak-Wójcicka, K.; Zelenakova, M.; Purcz, P.; Simovova, D. The use of a Standardized Runoff Indicator for hydrological characterization of selected rivers of Poland and Slovakia. Middle Pomeranian Sci. Soc. Environ. Prot. 2019, 21, 167–183. Available online: http://ros.edu.pl/images/roczniki/2019/010_ROS_V21_R2019.pdf (accessed on 10 October 2021).
  38. Vido, J.; Nalevanková, P. Drought in the Upper Hron Region (Slovakia) between the Years 1984–2014. Water 2020, 12, 2887. [Google Scholar] [CrossRef]
  39. Croitoru, A.-E.; Minea, I. The impact of climate changes on rivers discharge in Eastern Romania. Appl. Clim. 2014, 120, 563–573. [Google Scholar] [CrossRef]
  40. Kubiak-Wójcicka, K.; Pilarska, A.; Kamiński, D. The analysis of Long-Term Trends in the Meteorological and Hydrological Drought Occurrences Using Non-Parametric Methods—Case Study of the Catchment of the Upper Noteć River (Central Poland). Atmosphere 2021, 12, 1098. [Google Scholar] [CrossRef]
  41. Krajčí, P.; Holko, L.; Parajka, J. Variability of snow line elevation, snow cover area and depletion in the main Slovak basins in winters 2001–2014. J. Hydrol. Hydromech. 2016, 64, 12–22. [Google Scholar] [CrossRef] [Green Version]
  42. Kędra, M. Altered precipitation and flow patterns in the Dunajec River Basin. Water 2017, 9, 22. [Google Scholar] [CrossRef] [Green Version]
  43. Górnik, M.; Holko, L.; Pociask-Karteczka, J.; Bičárová, S. Variability of precipitation and runoff in the entire High Tatra Mountains in the period 1961–2010. Pr. Geogr. 2017, 151, 53–74. [Google Scholar] [CrossRef] [Green Version]
  44. Górnik, M. Changing trends of river flows in the Upper Vistula Basin (East-Central Europe). Acta Geophys. 2020, 68, 495–504. [Google Scholar] [CrossRef] [Green Version]
  45. Mostowik, K.; Siwek, J.; Kisiel, M.; Kowalik, K.; Krzysik, M.; Plenzler, M.; Rzonca, B. Runoff trends in a changing climate in the Eastern Carpathians (Bieszczady Mountains, Poland). CATENA 2019, 182, 104174. [Google Scholar] [CrossRef]
  46. Stefanidis, S.; Chatzichristaki, C. Response of soil erosion in a mountains catchment to temperature and precipitation trends. Carpathian J. Earth Environ. Sci. 2017, 12, 35–39. [Google Scholar]
  47. Kubiak-Wójcicka, K.; Zeleňáková, M.; Blištan, P.; Simonová, D.; Pilarska, A. Influence of climate change on low flow conditions. case study: Laborec river, eastern Slovakia. Ecohydrol. Hydrobiol. 2021, 21, 570–583. [Google Scholar] [CrossRef]
  48. Młyński, D.; Wałęga, A.; Kuriqi, A. Influence of meteorological drought on environmental flows in mountain catchments. Ecol. Indic. 2021, 133, 108460. [Google Scholar] [CrossRef]
  49. Borowska-Pakuła, J.; Mięsiak-Wójcik, K. Assessing discharge periodicity in mountain catchments using classified environmental conditions (Tatra Mountains, Poland). J. Mt. Sci. 2022, 19, 16–32. [Google Scholar] [CrossRef]
  50. IPCC. Climate Change 2022: Impacts, Adaptation and Vulnerability. Contribution of Working Group II to the Sixth Assessment Report of the Intergovernmental Panel on Climate Change; Pörtner, H.-O., Roberts, D., Tignor, M., Poloczanska, E., Mintenbeck, K., Alegría, A., Craig, M., Langsdorf, S., Löschke, S., Möller, V., Okem, A., Rama, B., Eds.; Cambridge University Press: Cambridge, UK; New York, NY, USA, 2022; p. 3056. [Google Scholar] [CrossRef]
  51. Fan, M.; Xu, J.; Chen, Y.; Fan, M.; Yu, W.; Li, W. Temperature Contributes More than Precipitation to Runoff in the High Mountains of Northwest China. Remote Sens. 2022, 14, 4015. [Google Scholar] [CrossRef]
  52. Repel, A.; Zeleňáková, M.; Jothiprakash, V.; Hlavatá, H.; Blištan, P.; Gargar, I.; Purcz, P. Long-Term Analysis of Precipitation in Slovakia. Water 2021, 13, 952. [Google Scholar] [CrossRef]
  53. Zeleňáková, M.; Vido, J.; Portela, M.M.; Purcz, P.; Blištán, P.; Hlavatá, H.; Hluštík, P. Precipitation Trends over Slovakia in the Period 1981–2013. Water 2017, 9, 922. [Google Scholar] [CrossRef] [Green Version]
  54. Manipulačný Poriadok Pre Vodnú Stabvu Ruizn I, II; Slovenský Vodohospodarsk Vodohospodársky Podnik, Odštepný Závod Košice: Banská Štlavnica, Slovakia, 2017.
  55. Bahremand, A.; Corluy, J.; Liu, Y.B.; De Smedt, F.; Poorova, J.; Velcicka, L. Stream flow simulation by WetSpa model in Hornad river basin, Slovakia. In Floods, from Defence to Management; Van Alphen, J., van Beek, E., Taal, M., Eds.; Taylor–Francis Group: London, UK, 2005; pp. 67–74. ISBN 0415380502. [Google Scholar]
  56. CORINE Land Cover (CLC). 2018. Available online: https://land.copernicus.eu/pan-european/corine-land-cover/view (accessed on 1 August 2022).
  57. Slovak Hydrometeorological Institute. Available online: https://www.intersucho.cz/sk/?mapcountry=sk&from=2022-01-19&to=2022-02-16&current=2022-02-13 (accessed on 19 January 2022).
  58. Kendall, M.G. Rank Correlation Measures; Charles Griffin: London, UK, 1975. [Google Scholar]
  59. Mann, H.B. Non-parametric tests against trend. Econometrica 1945, 13, 245–259. [Google Scholar] [CrossRef]
  60. Sen, P.K. Estimates of the regression coefficient based on Kendall’s tau. J. Am. Stat. Assoc. 1968, 63, 1379–1389. [Google Scholar] [CrossRef]
  61. Bulut, O.; Cormier, D.C. Validity Evidence for Progress Monitoring with Star Reading: Slope Estimates, Administration Frequency, and Number of Data Points. Front. Educ. 2018, 3, 68. [Google Scholar] [CrossRef]
  62. RStudio Team. RStudio: Integrated Development Environment for R; RStudio, PBC: Boston, MA, USA, 2021; Available online: http://www.rstudio.com/ (accessed on 10 October 2022).
  63. Wickham, H.; Bryan, J.; readxl: Read Excel Files. R Package Version 1.3.1. 2019. Available online: https://CRAN.R-project.org/package=readxl (accessed on 25 February 2022).
  64. Pohlert, T.; trend: Non-Parametric Trend Tests and Change-Point Detection. R Package Version 1.1.4. 2020. Available online: https://CRAN.R-project.org/package=trend. (accessed on 25 February 2022).
  65. Zaborski, A. Skalowanie wielowymiarowe. In Metody Statystycznej Analizy Wielowymiarowej w Badaniach Marketingowych; Gatnar, E., Walesiak., M., Eds.; Wydawnictwo Akademii Ekonomicznej im. Oskara Langego we Wrocławiu: Wrocław, Poland, 2004; pp. 246–282. [Google Scholar]
  66. Machado, J.A.T. Fractal and Entropy Analysis of the Dow Jones Index Using Multidimensional Scaling. Entropy 2020, 22, 1138. [Google Scholar] [CrossRef] [PubMed]
  67. Pekasiewicz, D.; Szczukocka, A. 2017, Analiza rozwoju usług finansowo-bankowych w Polsce na tle krajów Unii Europejskiej. Wiadomości Stat. 2017, 10, 38–51. [Google Scholar] [CrossRef]
  68. Vido, J.; Nalevanková, P.; Valach, J.; Šustek, Z.; Tadesse, T. Drought Analyses of the Horné Požitavie Region (Slovakia) in the Period 1966–2013. Hindawi Adv. Meteorol. 2019, 2019, 3576285. [Google Scholar] [CrossRef]
  69. Wang, Y.-H.; Magnusdottir, G.; Stern, H.; Tian, X.; Yu, Y. Decadal variability of the NAO: Introducing an augmented NAO index. Geophys. Res. Lett. 2012, 39, L21702. [Google Scholar] [CrossRef] [Green Version]
  70. Woollings, T.; Franzke, C.; Hodson, D.L.R.; Dong, B.; Barnes, E.A.; Raible, C.C.; Pinto, J.G. Contrasting interannual and multidecadal NAO variability. Clim. Dyn. 2015, 45, 539–556. [Google Scholar] [CrossRef] [Green Version]
  71. Espinosa, L.A.; Portela, M.M. Grid-Point Precipitation Trends, Teleconnection Patterns, and Regionalised Droughts in Portugal (1919–2019). Water 2022, 14, 1863. [Google Scholar] [CrossRef]
  72. Labudová, L.; Šťastný, P.; Trizna, M. The north atlantic oscillation and winter precipitation totals in Slovakia. Morav. Geogr. Rep. 2013, 21, 38–49. [Google Scholar] [CrossRef] [Green Version]
  73. Zeleňáková, M.; Purcz, P.; Blištan, P.; Vranayová, Z.; Hlavatá, H.; Diaconu, D.C.; Portela, M.M. Trends in precipitation and temperatures in Eastern Slovakia (1962–2014). Water 2018, 10, 727. [Google Scholar] [CrossRef] [Green Version]
  74. Danáčová, Z.; Jeneinová, K.; Blaškovičová, L. Hydrological situation on Slovak rivers from the point of view of hydrological drought assessment in the period 2011–2020. Acta Hydrol. Slovaca 2021, 22, 230–236. [Google Scholar] [CrossRef]
  75. Kohler, T.; Maselli, D. Mountains and Climate Change—From Understanding to Action. Produced with an International Team of Contributors; Geographica Bernensia and Swiss Agency for Development and Cooperation: Bern, Switzerland, 2009. [Google Scholar]
  76. Mastrotheodoros, T.; Pappas, C.; Molnar, P.; Burlando, P.; Manoli, G.; Parajka, J.; Rigon, R.; Szeles, B.; Bottazzi, M.; Hadjidoukas, P.; et al. More green and less blue water in the Alps during warmer summers. Nat. Clim. Chang. 2020, 10, 155–161. [Google Scholar] [CrossRef]
  77. Xu, J.; Gao, X.; Yang, Z.; Xu, T. Trend and Attribution Analysis of Runoff Changes in the Weihe River Basin in the Last 50 Years. Water 2021, 14, 47. [Google Scholar] [CrossRef]
  78. Bacanli, Ü.G. Trend analysis of precipitation and drought in the Aegean region, Turkey. Meteorol. Appl. 2017, 24, 239–249. [Google Scholar] [CrossRef]
  79. Hänsel, S.; Ustrnul, Z.; Łupikasza, E.; Skalak, P. Assessing seasonal drought variations and trends over Central Europe. Adv. Water Resour. 2019, 127, 53–75. [Google Scholar] [CrossRef]
Figure 1. Hornad River catchment.
Water 15 00471 g001
Figure 2. Distribution of annual precipitation totals in the years 1961–2010, 1961–1986 and 1986–2010.
Water 15 00471 g002
Figure 3. Average annual air temperature in the years 1961–2010, 1961–1986 and 1986–2010.
Water 15 00471 g003
Figure 4. Annual unit outflow in the years 1961–2010, 1961–1986 and 1986–2010.
Water 15 00471 g004
Figure 5. Results of multidimensional scaling: (a) for Z parameter of the Mann-Kendall test; (b) for Sen’s slope.
Water 15 00471 g005
Figure 6. Monthly trends in the precipitation during the years 1961–2010.
Water 15 00471 g006
Figure 7. Monthly trends in the air temperature during the years 1961–2010.
Water 15 00471 g007
Figure 8. Monthly trends in flow during the years 1961–2010.
Water 15 00471 g008
Table 1. Values of selected physiographic characteristics of the Hornad River catchment.
Hydrological StationsRiverCatchment Area (km2)River Length (km)Minimum Elevation m a.s.l.Maximum Elevation m a.s.l.Average Elevation m a.s.l.
StratenáHnilec64.6745.7794.71932.11066.7
ŠvedlárHnilec352.0160.8442.81932.1879.3
JaklovceHnilec604.0236.2328.81932.1800.4
KysakHornad2337.00118.6235.21932.1672.2
Prešov-Sekčov Sekčov350.9137.9234.51049.9427.6
Košické OlšanyTorysa 1296.26125.4185.91261.1507.6
ŽdanáHornad4249.1439.8167.71932.1579.1
Table 2. Land use in catchments according to CORINE Land Cover (CLC) [56].
Hydrological StationsRiverForest
(%)
Arable Land (%)Urban
Fabric (%)
Heterogeneous Agricultural Area (%)Pastures (%)Scrub and Herbaceous Vegetation (%)
StratenáHnilec78.80--2.346.7211.40
ŠvedlárHnilec68.501.861.156.515.0016.60
JaklovceHnilec73.801.881.876.134.6511.20
KysakHornad57.8018.003.977.013.406.69
Prešov-Sekčov Sekčov34.2047.508.059.227.831.21
Košické OlšanyTorysa69.6016.303.494.264.141.49
ŽdanáHornad49.8024.505.317.605.954.95
Table 3. Flow characteristic in the years 1961–2010, 1961–1986 and 1986–2010.
Hydrological StationsRiverAverage Discharge (m3·s−1)
/Unit Outflow (dm3·s−1·km−2)
1961–19851986–20101961–2010
StratenáHnilec1.29/19.951.08/16.721.19/18.34
ŠvedlárHnilec3.61/10.263.42/9.723.52/9.99
JaklovceHnilec6.43/10.655.59/9.256.01/9.95
KysakHornad18.24/7.8016.86/7.2117.55/7.51
Prešov-Sekčov Sekčov2.27/6.481.72/4.902.00/5.69
Košické OlšanyTorysa8.07/6.237.55/5.837.81/6.03
ŽdanáHornad30.59/7.1927.93/6.5729.26/6.89
Table 4. Precipitations and temperature characteristics in the years 1961–2010, 1961–1986 and 1986–2010.
Hydrological StationsRiverAverage Precipitation in Years (mm)Average Air Temperature in Years (℃)
1961–19851986–20101961–20101961–19851986–20101961–2010
StratenáHnilec879.1950.6914.83.994.574.28
ŠvedlárHnilec850.8901.1876.44.845.405.12
JaklovceHnilec839.0870.1854.65.415.905.65
KysakHornad739.5760.8750.26.066.576.32
Prešov-Sekčov Sekčov671.0693.9682.57.087.657.36
Košické OlšanyTorysa634.7650.0642.37.087.637.35
ŽdanáHornad720.8736.3728.66.547.116.83
Table 5. Results of trend analysis in precipitation in the years 1961–2010, 1961–1985 and 1986–2010.
StationsParametersYears
1961–20101961–19851986–2010
Ždanáp-value (MK test)
Sen’s slope
0.06820.46910.0008
1.99262.20518.1043
Košické Olšanyp-value (MK test)
Sen’s slope
0.0682
1.9204
0.1682
3.4245
0.0072
6.5628
Prešov-Sekčov p-value (MK test)
Sen’s slope
0.04130.46910.0035
2.02112.13098.6840
Kysakp-value (MK test)
Sen’s slope
0.0879
2.2103
0.5912
1.3042
0.0005
8.8045
Jaklovcep-value (MK test)
Sen’s slope
0.0322
2.6718
0.4137
1.7374
0.0002
9.9027
Švedlárp-value (MK test)
Sen’s slop
0.0153
3.2358
0.3875
1.6311
0.0008
9.6906
Stratenáp-value (MK test)
Sen’s slop
0.0095
3.8809
0.8335
1.5205
0.0014
12.0445
Table 6. Results of trend analysis in air temperature in the years 1961–2010, 1961–1985 and 1986–2010.
StationsParametersYears
1961–20101961–19851986–2010
Ždanáp-value (MK test)
Sen’s slope
0.00160.90700.0095
0.02300.00320.0521
Košické Olšanyp-value (MK test)
Sen’s slope
0.0031
0.0230
16.000
0.0110
0.0142
0.0525
Prešov-Sekčov p-value (MK test)
Sen’s slope
0.00100.69130.0072
0.02390.00580.0472
Kysakp-value (MK test)
Sen’s slope
0.0034
0.0204
0.9441
−0.0010
0.0063
0.0549
Jaklovcep-value (MK test)
Sen’s slope
0.0040
0.0197
0.9070
−0.0036
0.0063
0.0560
Švedlárp-value (MK test)
Sen’s slop
0.0012
0.0216
0.7261
−0.0043
0.0095
0.0498
Stratenáp-value (MK test)
Sen’s slop
0.0016
0.0218
0.5912
−0.0097
0.0161
0.0467
Table 7. Results of trend analysis in flow in the years 1961–2010, 1961–1985 and 1986–2010.
StationsParametersYears
1961–20101961–19851986–2010
Ždanáp-value (MK test)
Sen’s slope
0.93330.59120.0063
0.00580.16490.6206
Košické Olšanyp-value (MK test)
Sen’s slope
0.4124
0.0244
0.1290
0.1388
0.0109
0.1340
Prešov-Sekčov p-value (MK test)
Sen’s slope
0.27680.76140.2525
−0.00990.00650.0211
Kysakp-value (MK test)
Sen’s slope
0.9200
0.0081
0.6238
0.1140
0.0142
0.3565
Jaklovcep-value (MK test)
Sen’s slope
0.5924
−0.0106
0.7614
0.0213
0.0235
0.1015
Švedlárp-value (MK test)
Sen’s slop
0.8409
0.0030
0.6572
0.0158
0.0336
0.0642
Stratenáp-value (MK test)
Sen’s slop
0.0429
−0.0063
1.0000
−0.0005
0.0298
0.0123
Disclaimer/Publisher’s Note: The statements, opinions and data contained in all publications are solely those of the individual author(s) and contributor(s) and not of MDPI and/or the editor(s). MDPI and/or the editor(s) disclaim responsibility for any injury to people or property resulting from any ideas, methods, instructions or products referred to in the content.

