


Extreme Drought around Tomsk, Russia in Summer 2012 in Comparison with Other Regions in Western Siberia


Abstract
1. Introduction
1.1. Severe Drought around Tomsk in Summer 2012
1.2. Literature Review on the Severe Drought in WS in Summer 2012
1.3. Objective of This Study, and the Organization of This Article
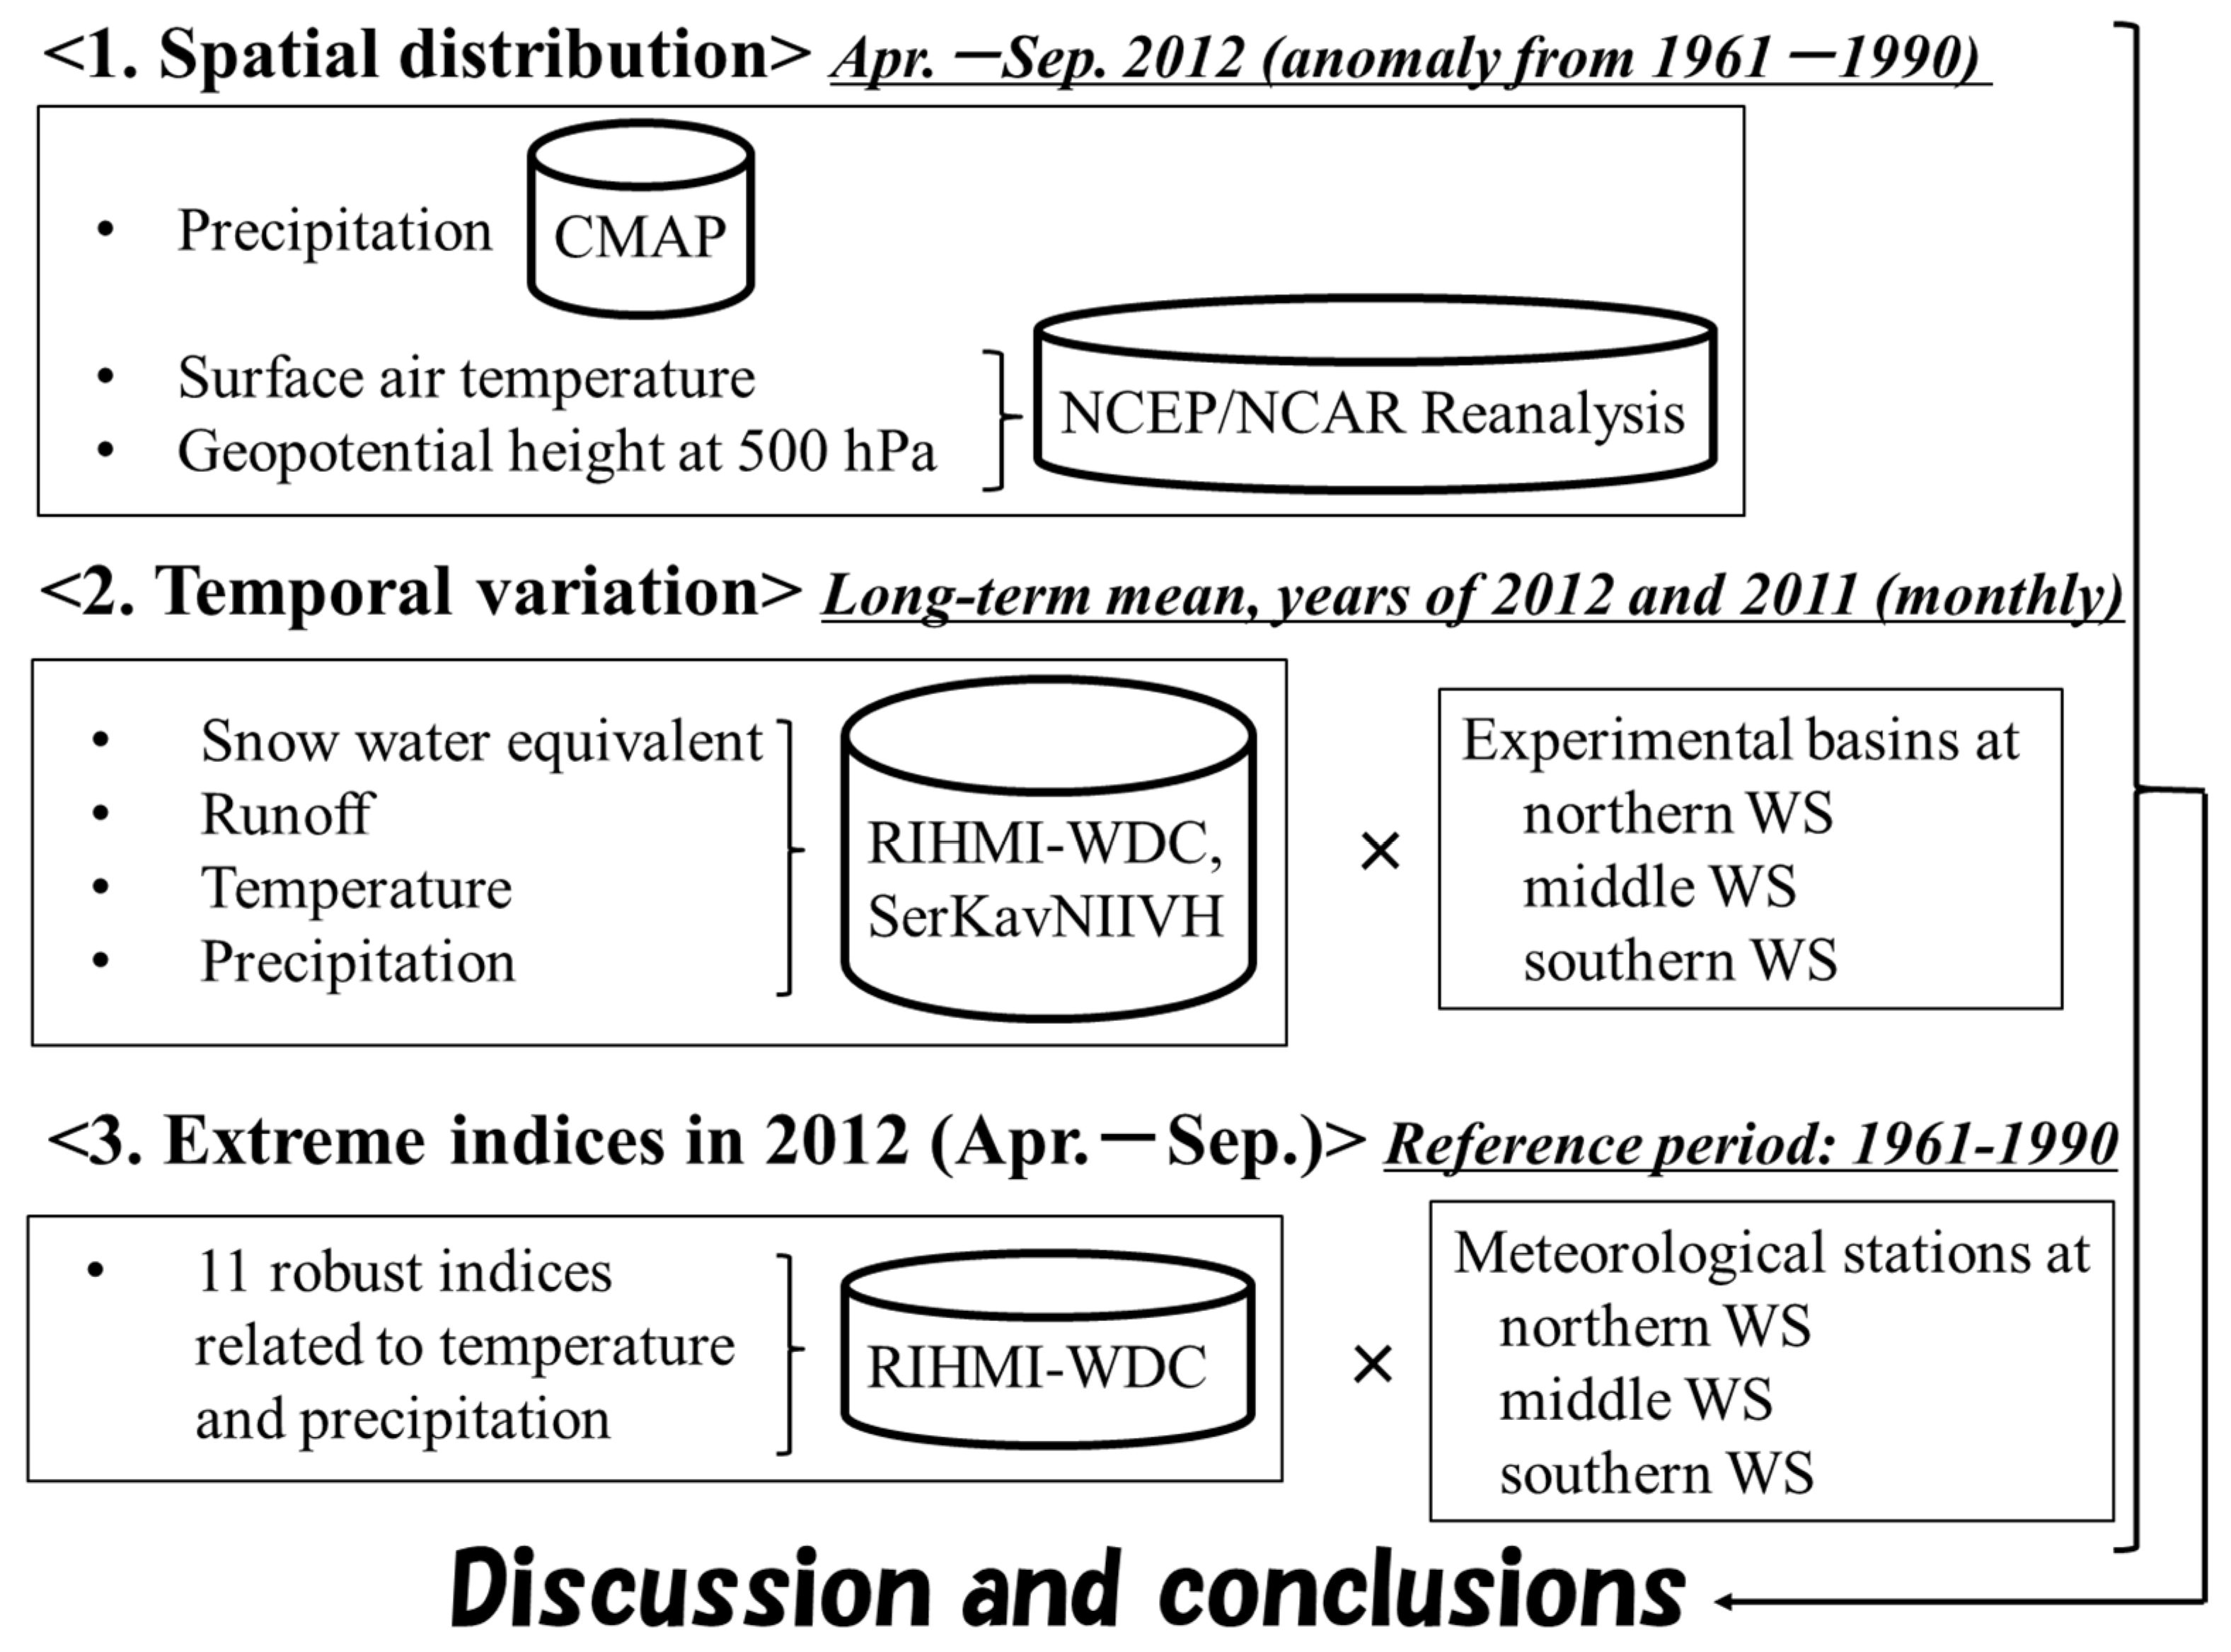
2. Data and Methods

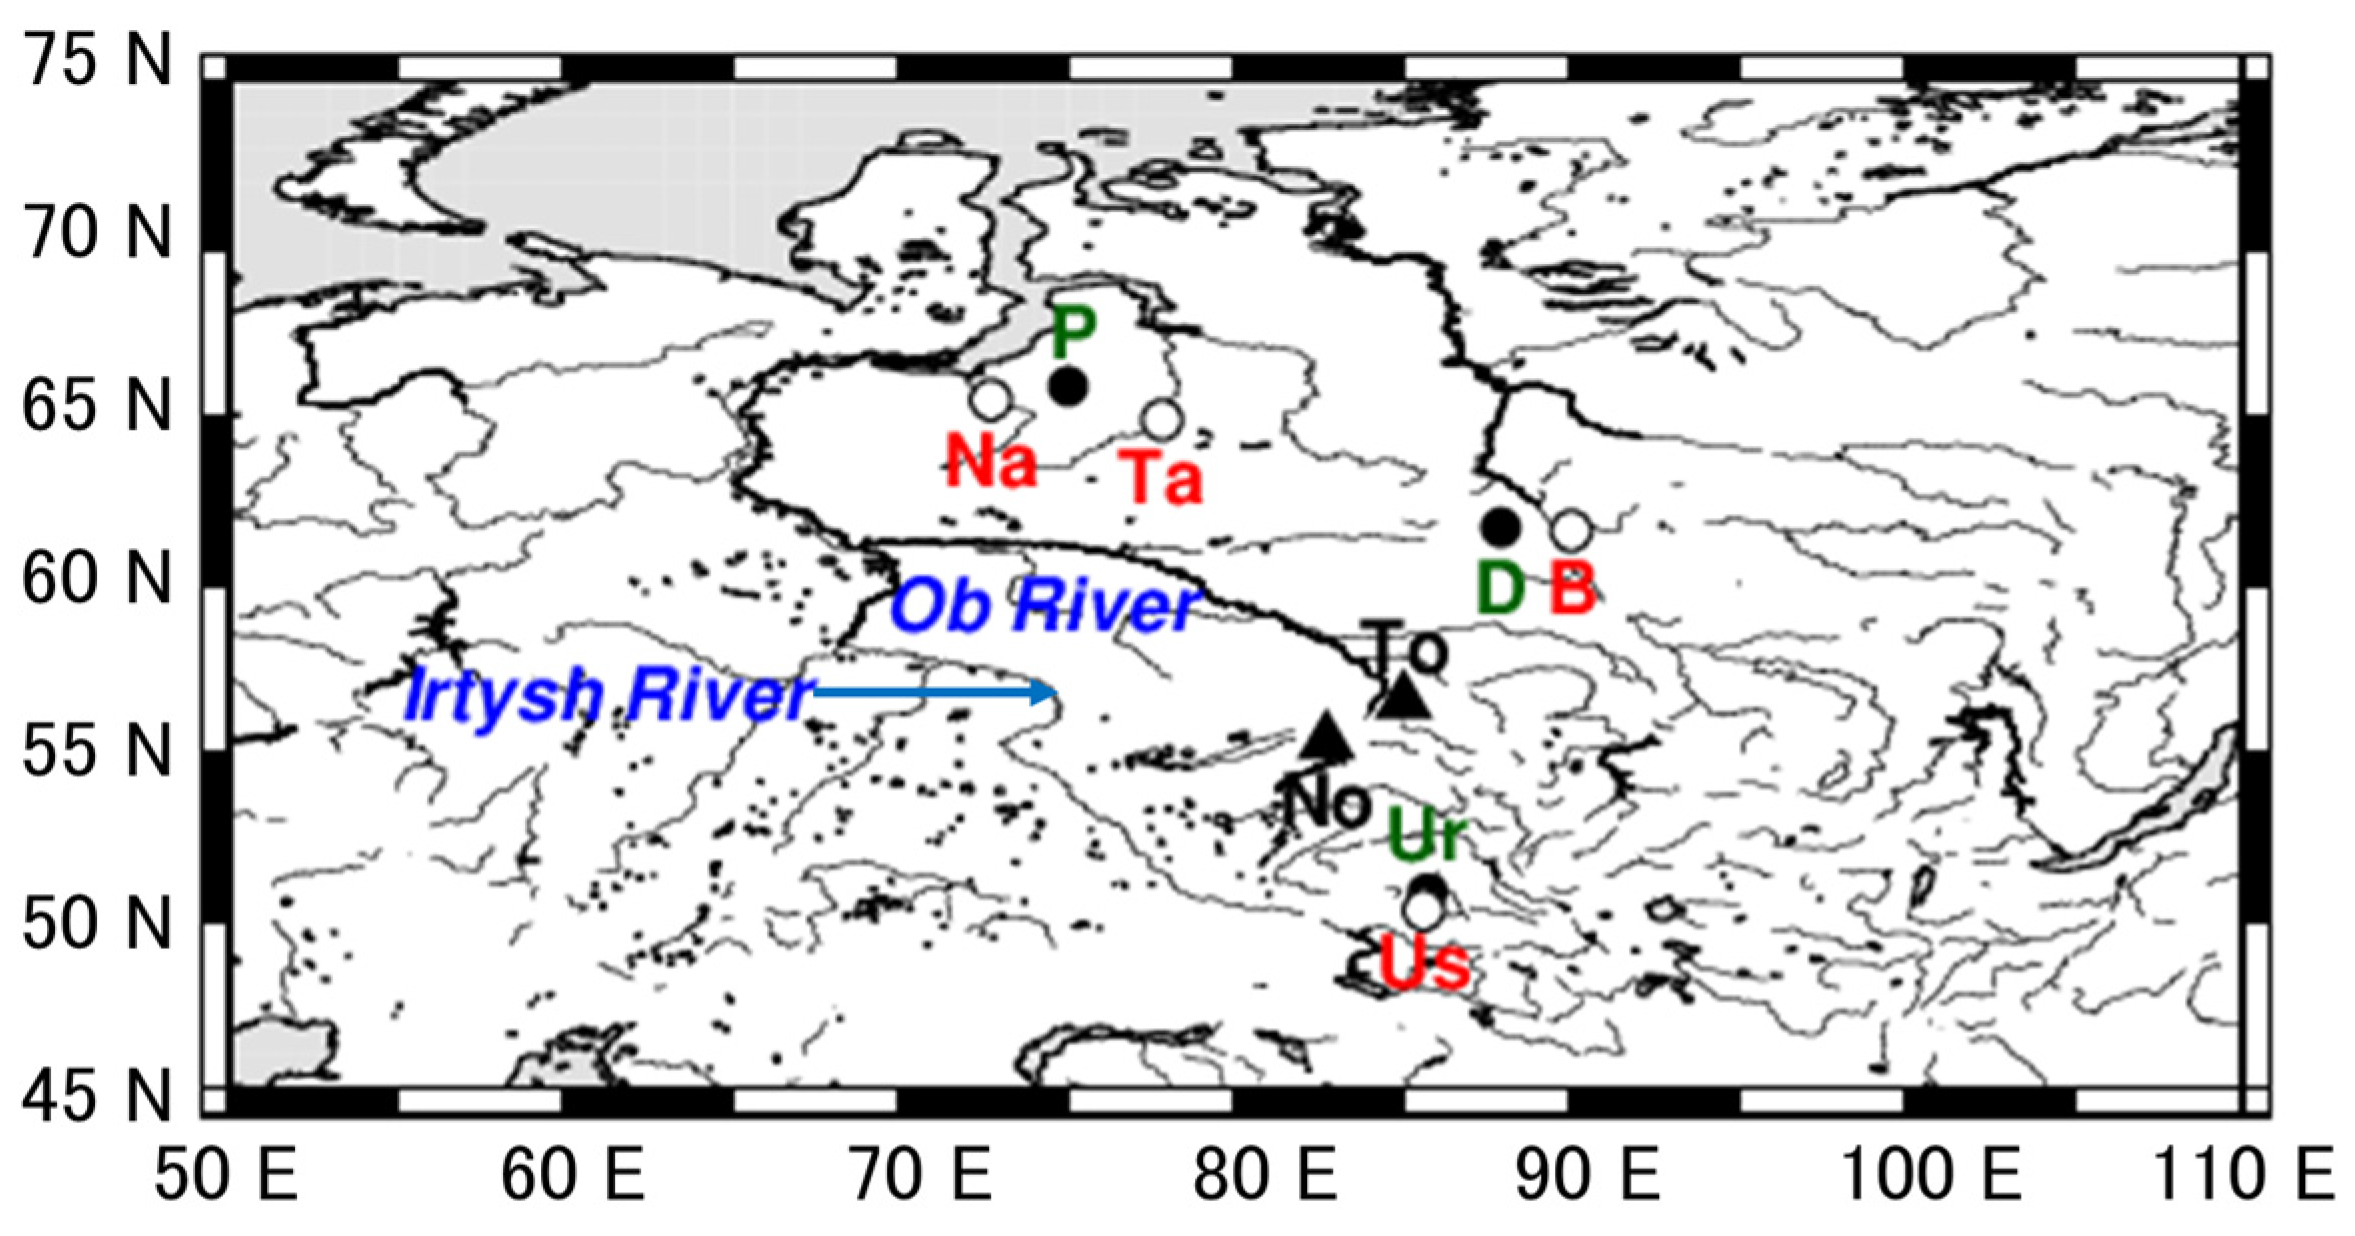
| Name | Position in Western Siberia | Longitude and Latitude | Period of Temperature and Precipitation | Period of Snow * |
|---|---|---|---|---|
| (Station) Tomsk | Middle | 56.5 N, 85.0 E | 1 January 1966– 30 June 2019 | 10 January 1996– 30 December 2017 |
| (Basin) Pravaya Khetta at Pangody | North | 65.9 N, 75.0 E | 1 January 1966– 30 June 2019 | 20 January 1985– 20 December 1990 |
| Dubches at Sandakches | Middle | 61.7 N, 87.9 E | 1 January 1966– 30 June 2019 | 20 January 1985– 10 May 2019 |
| Ursul at Onguday | South | 50.8 N, 85.7 E | 1 January 1966– 30 June 2019 | 31 October 1986– 30 December 2017 |
| Name of Basin | Drainage Area (km2) | Period of Runoff | Notes on Runoff | |
| Pravaya Khetta at Pangody | 1.200 | 1 January 1981– 1 January 1991 | Missing from 1 May 1982 to 24 May 1982 | |
| Dubches at Sandakches | 8.360 | 1 October 2008– 30 September 2020 | ||
| Ursul at Onguday | 3.080 | 1 October 2008– 30 September 2020 | ||
| Name of the Station | Position in Western Siberia | Latitude and Longitude | Period of Temperature and Precipitation |
|---|---|---|---|
| Nadym | North | 65.5 N, 72.7 E | 1 January 1961–30 June 2019 |
| Tarko-Sale | North | 64.9 N, 77.8 E | 1 January 1961–30 June 2019 |
| Bor | Middle | 61.6 N, 90.0 E | 1 January 1961–30 June 2019 |
| Ust-Koksa | South | 50.3 N, 85.6 E | 1 January 1961–30 June 2019 |
3. Results and Discussion
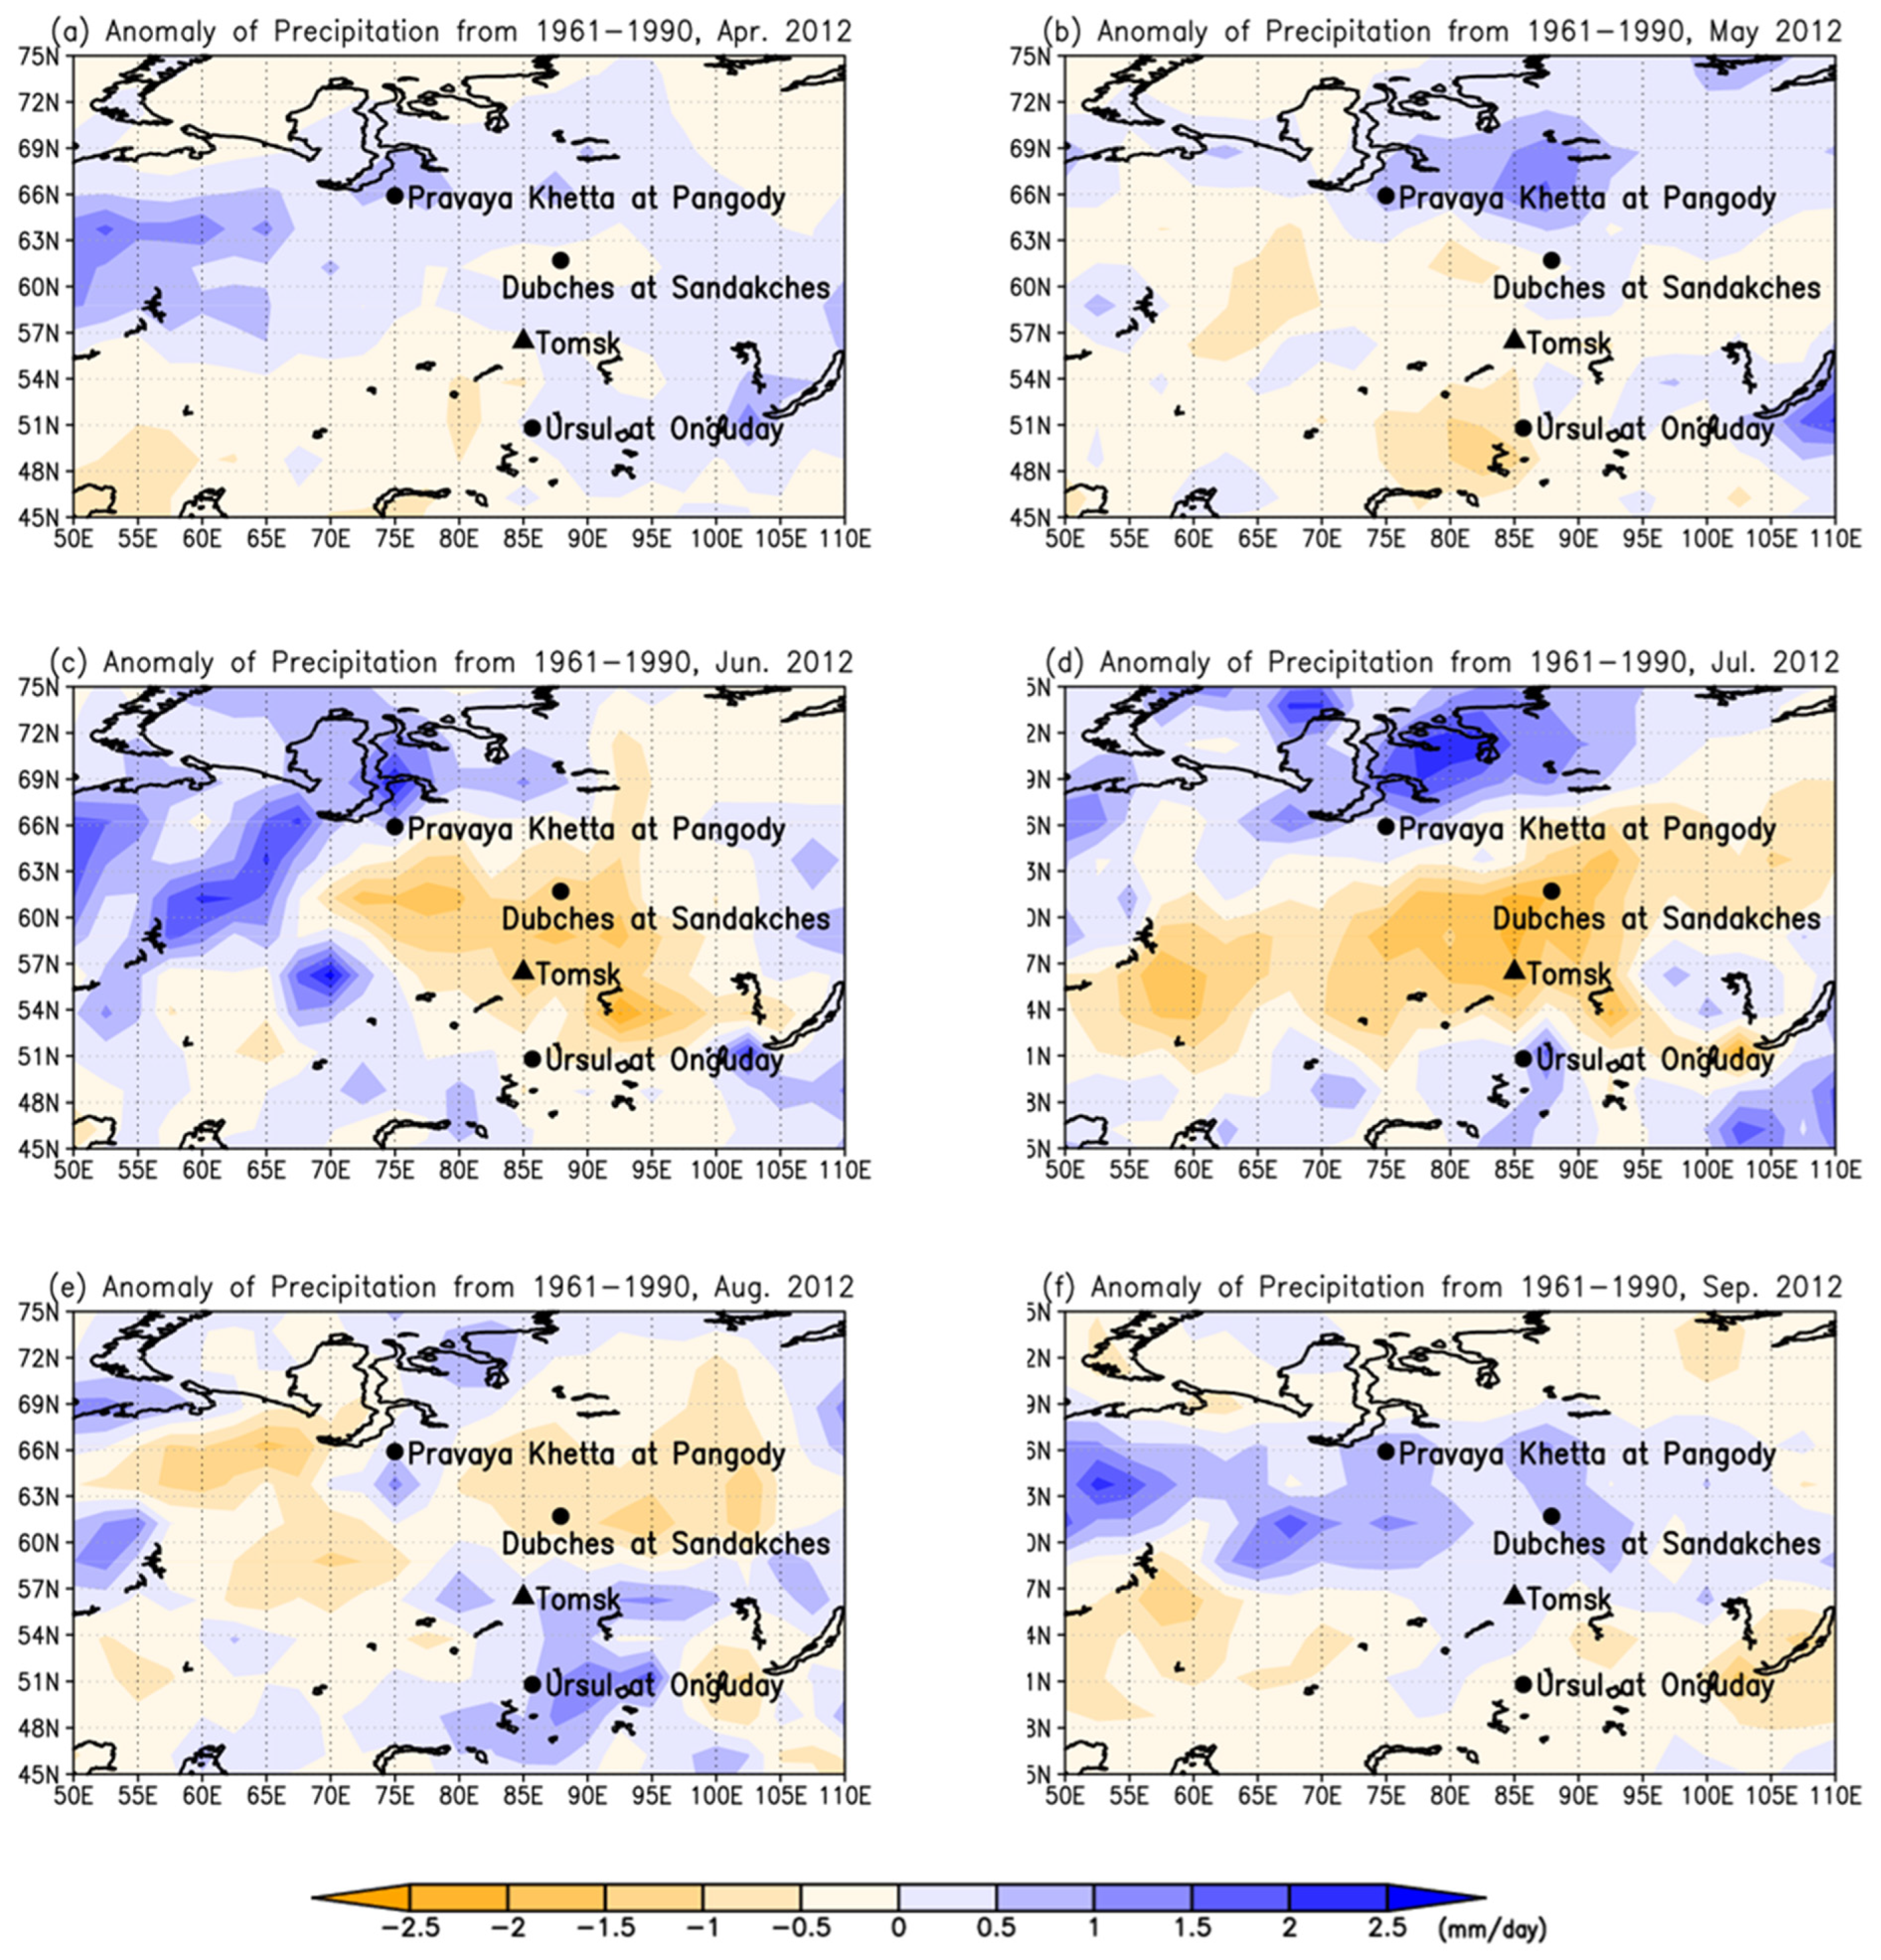
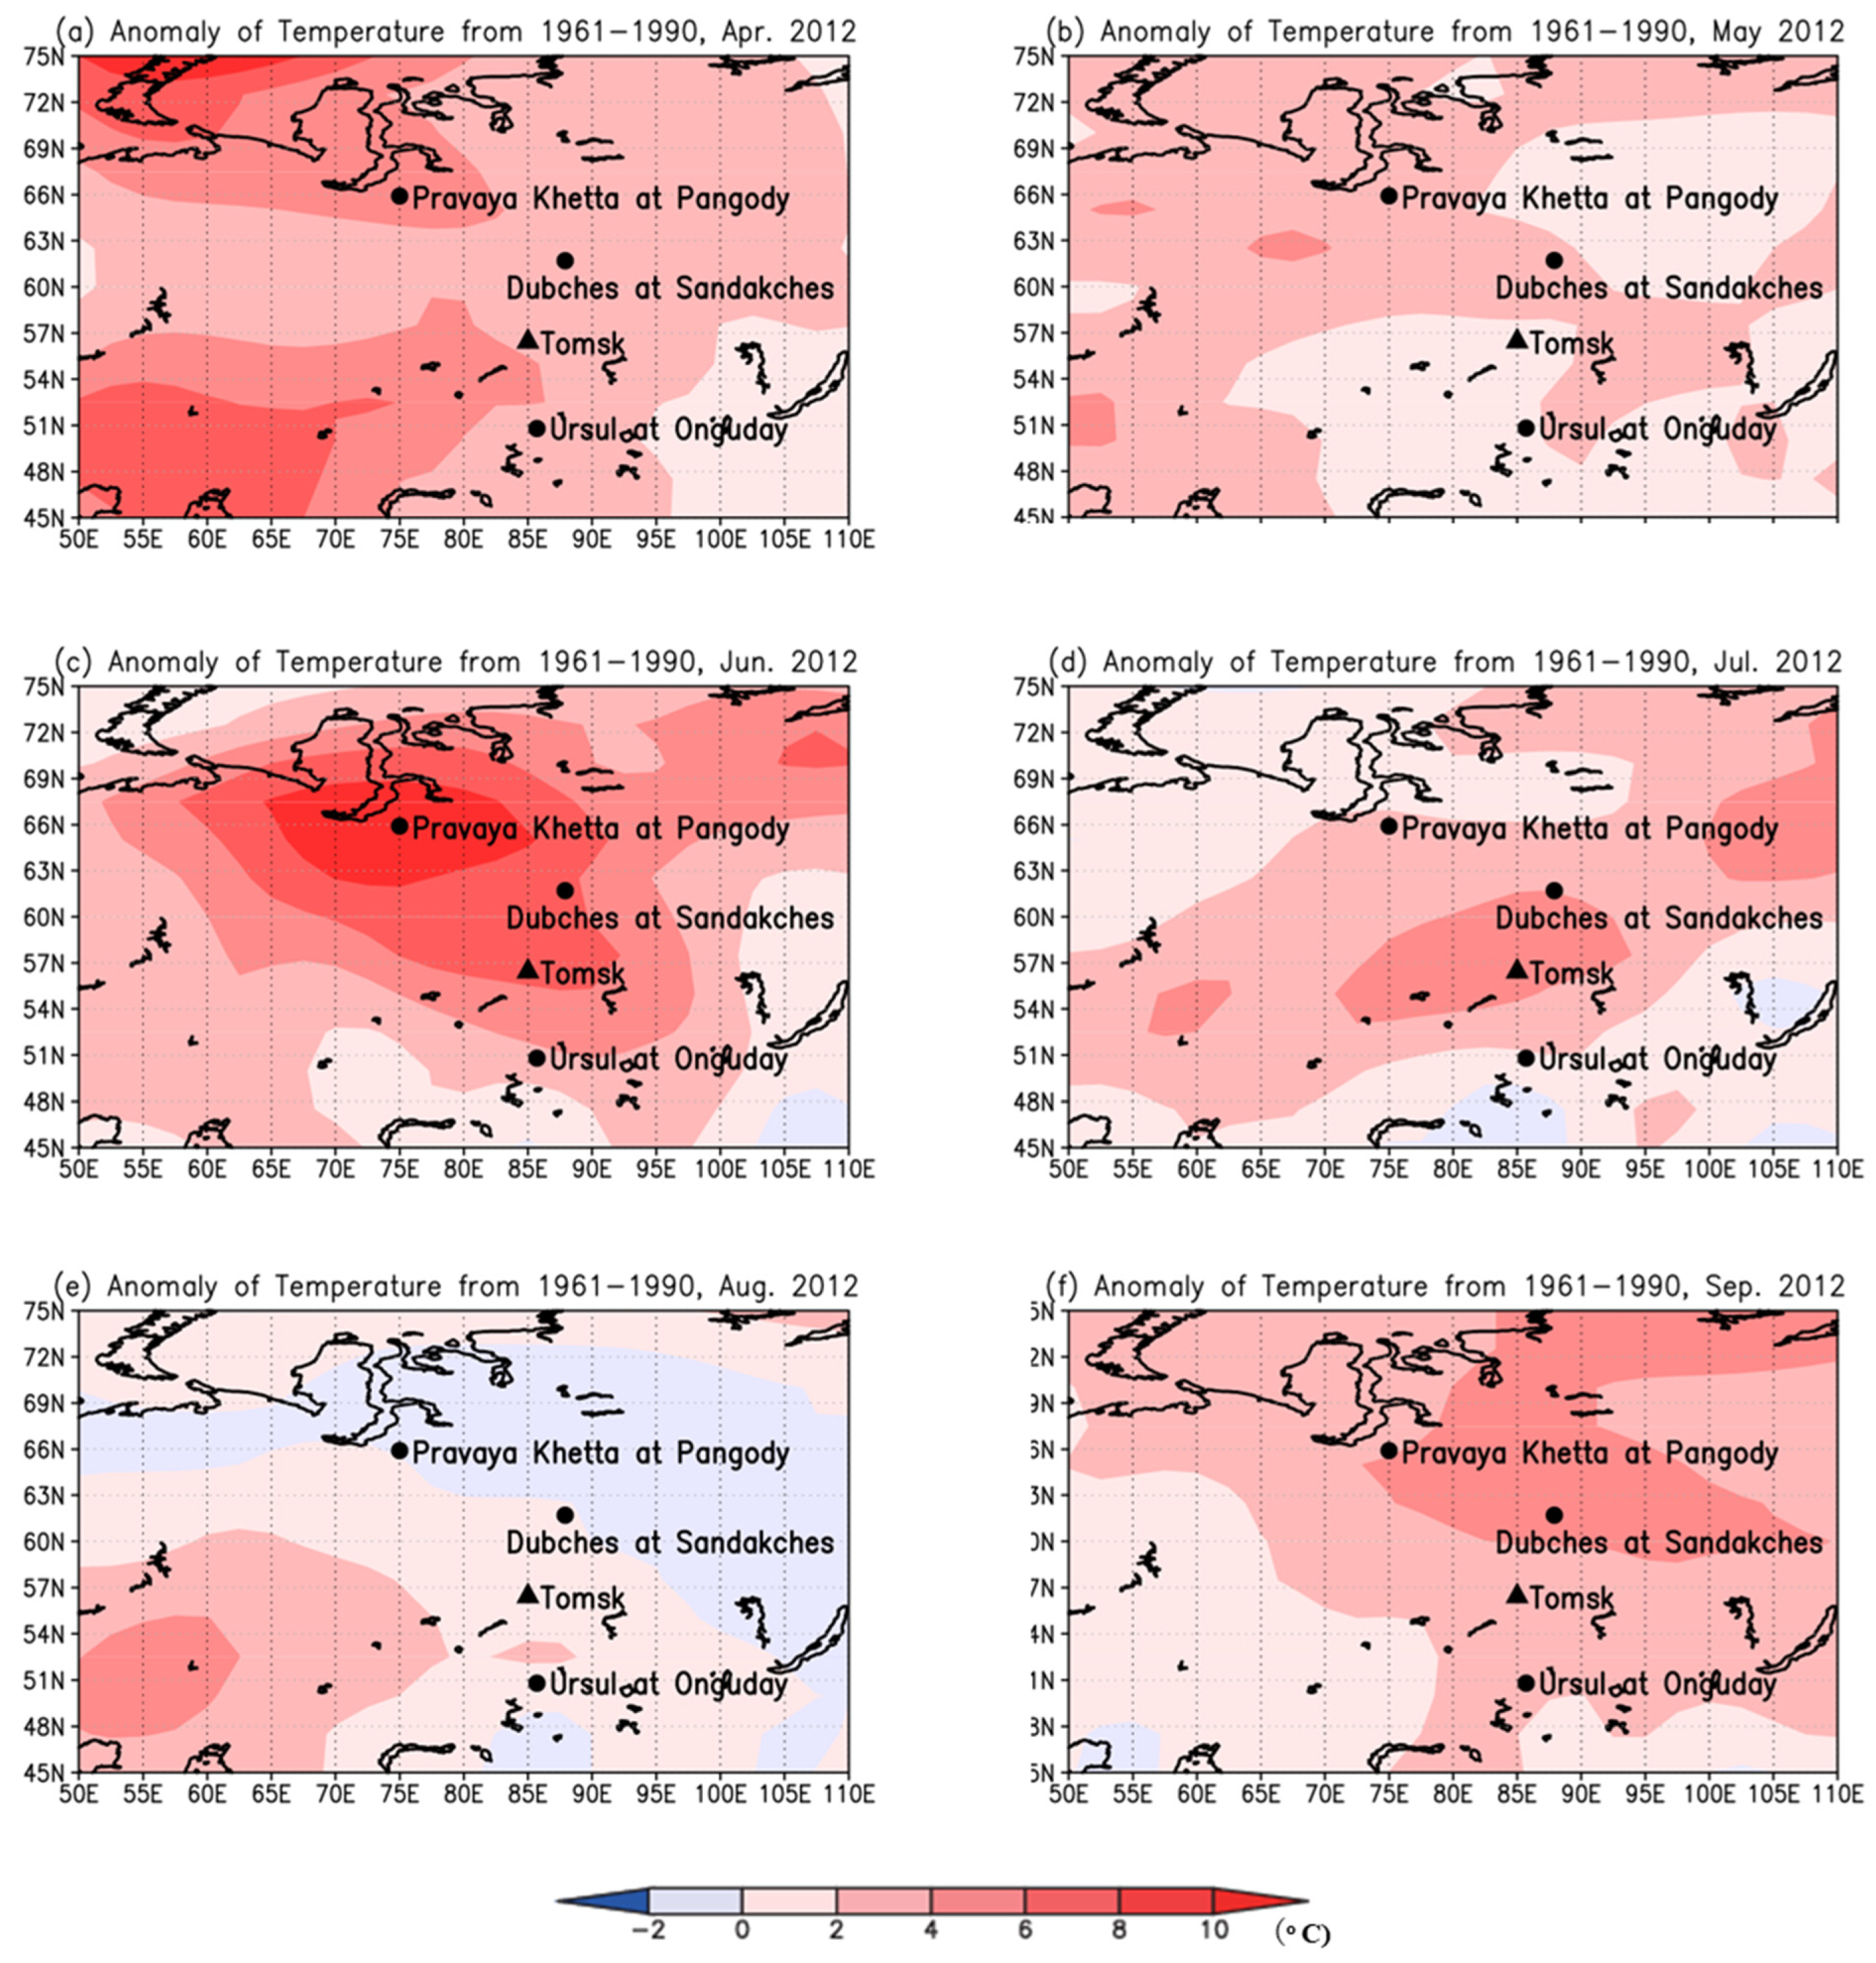
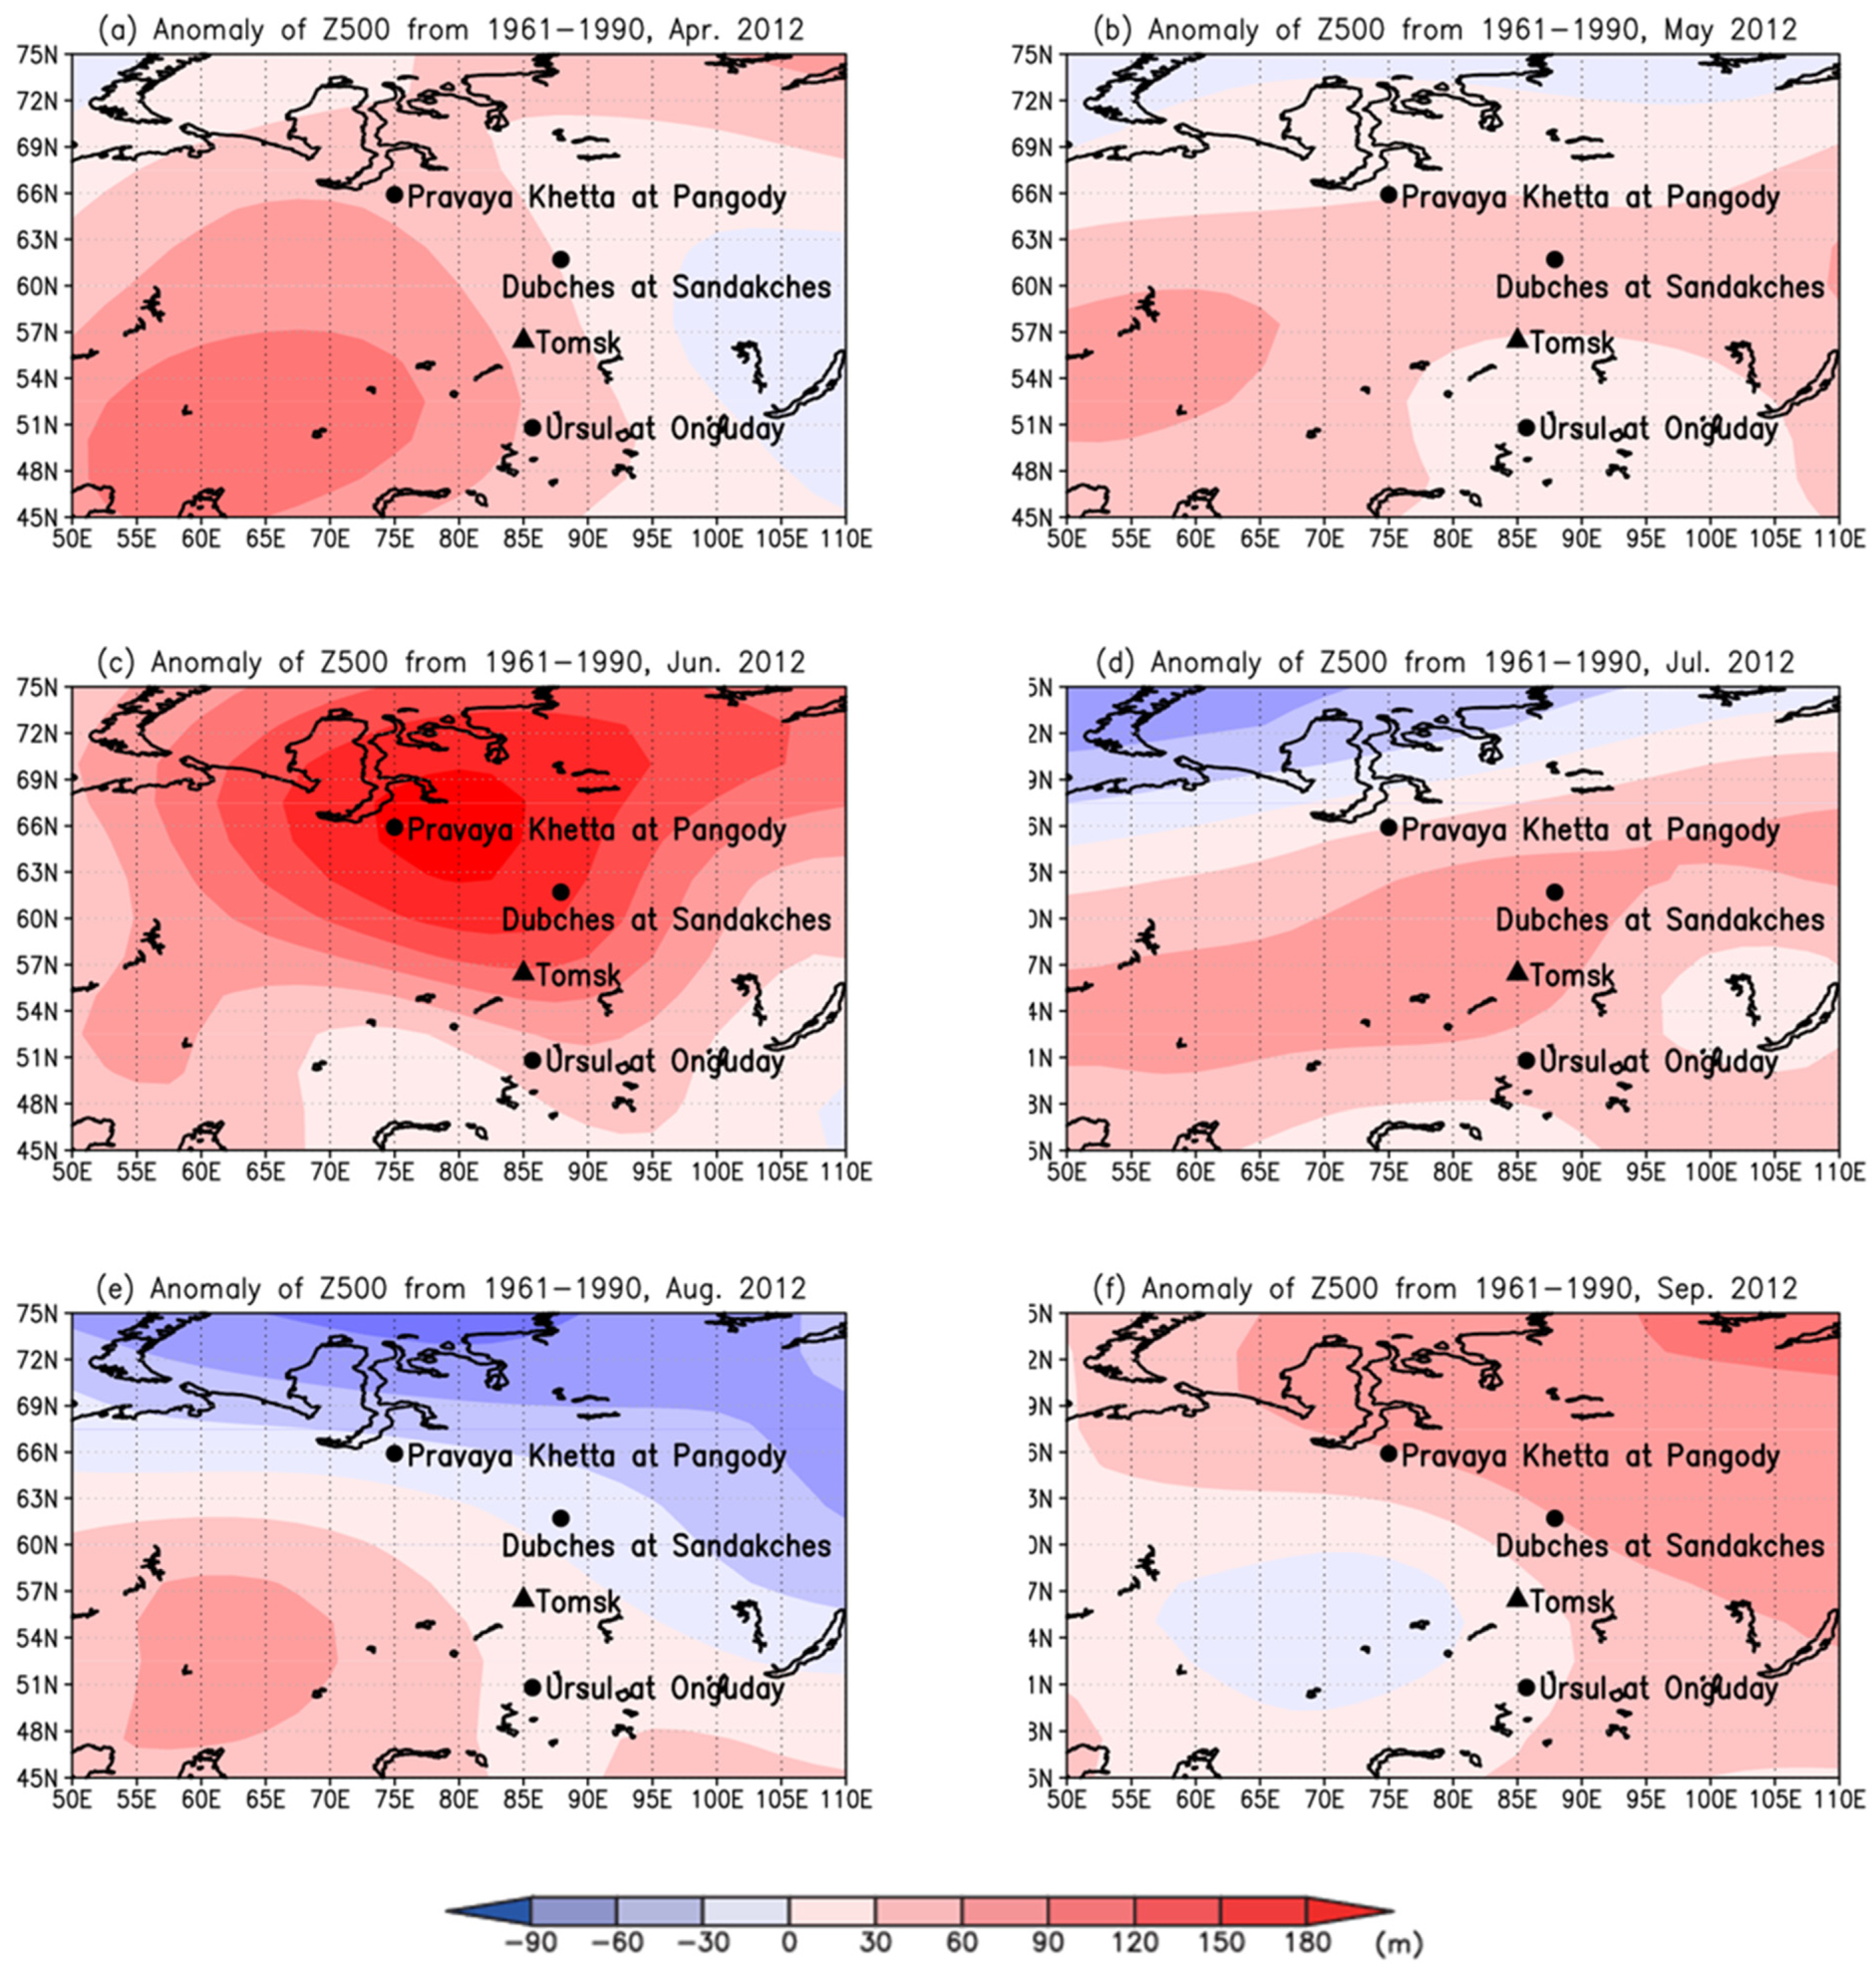
3.1. Spatial/Temporal Variation in the Atmospheric Field during Spring–Summer 2012


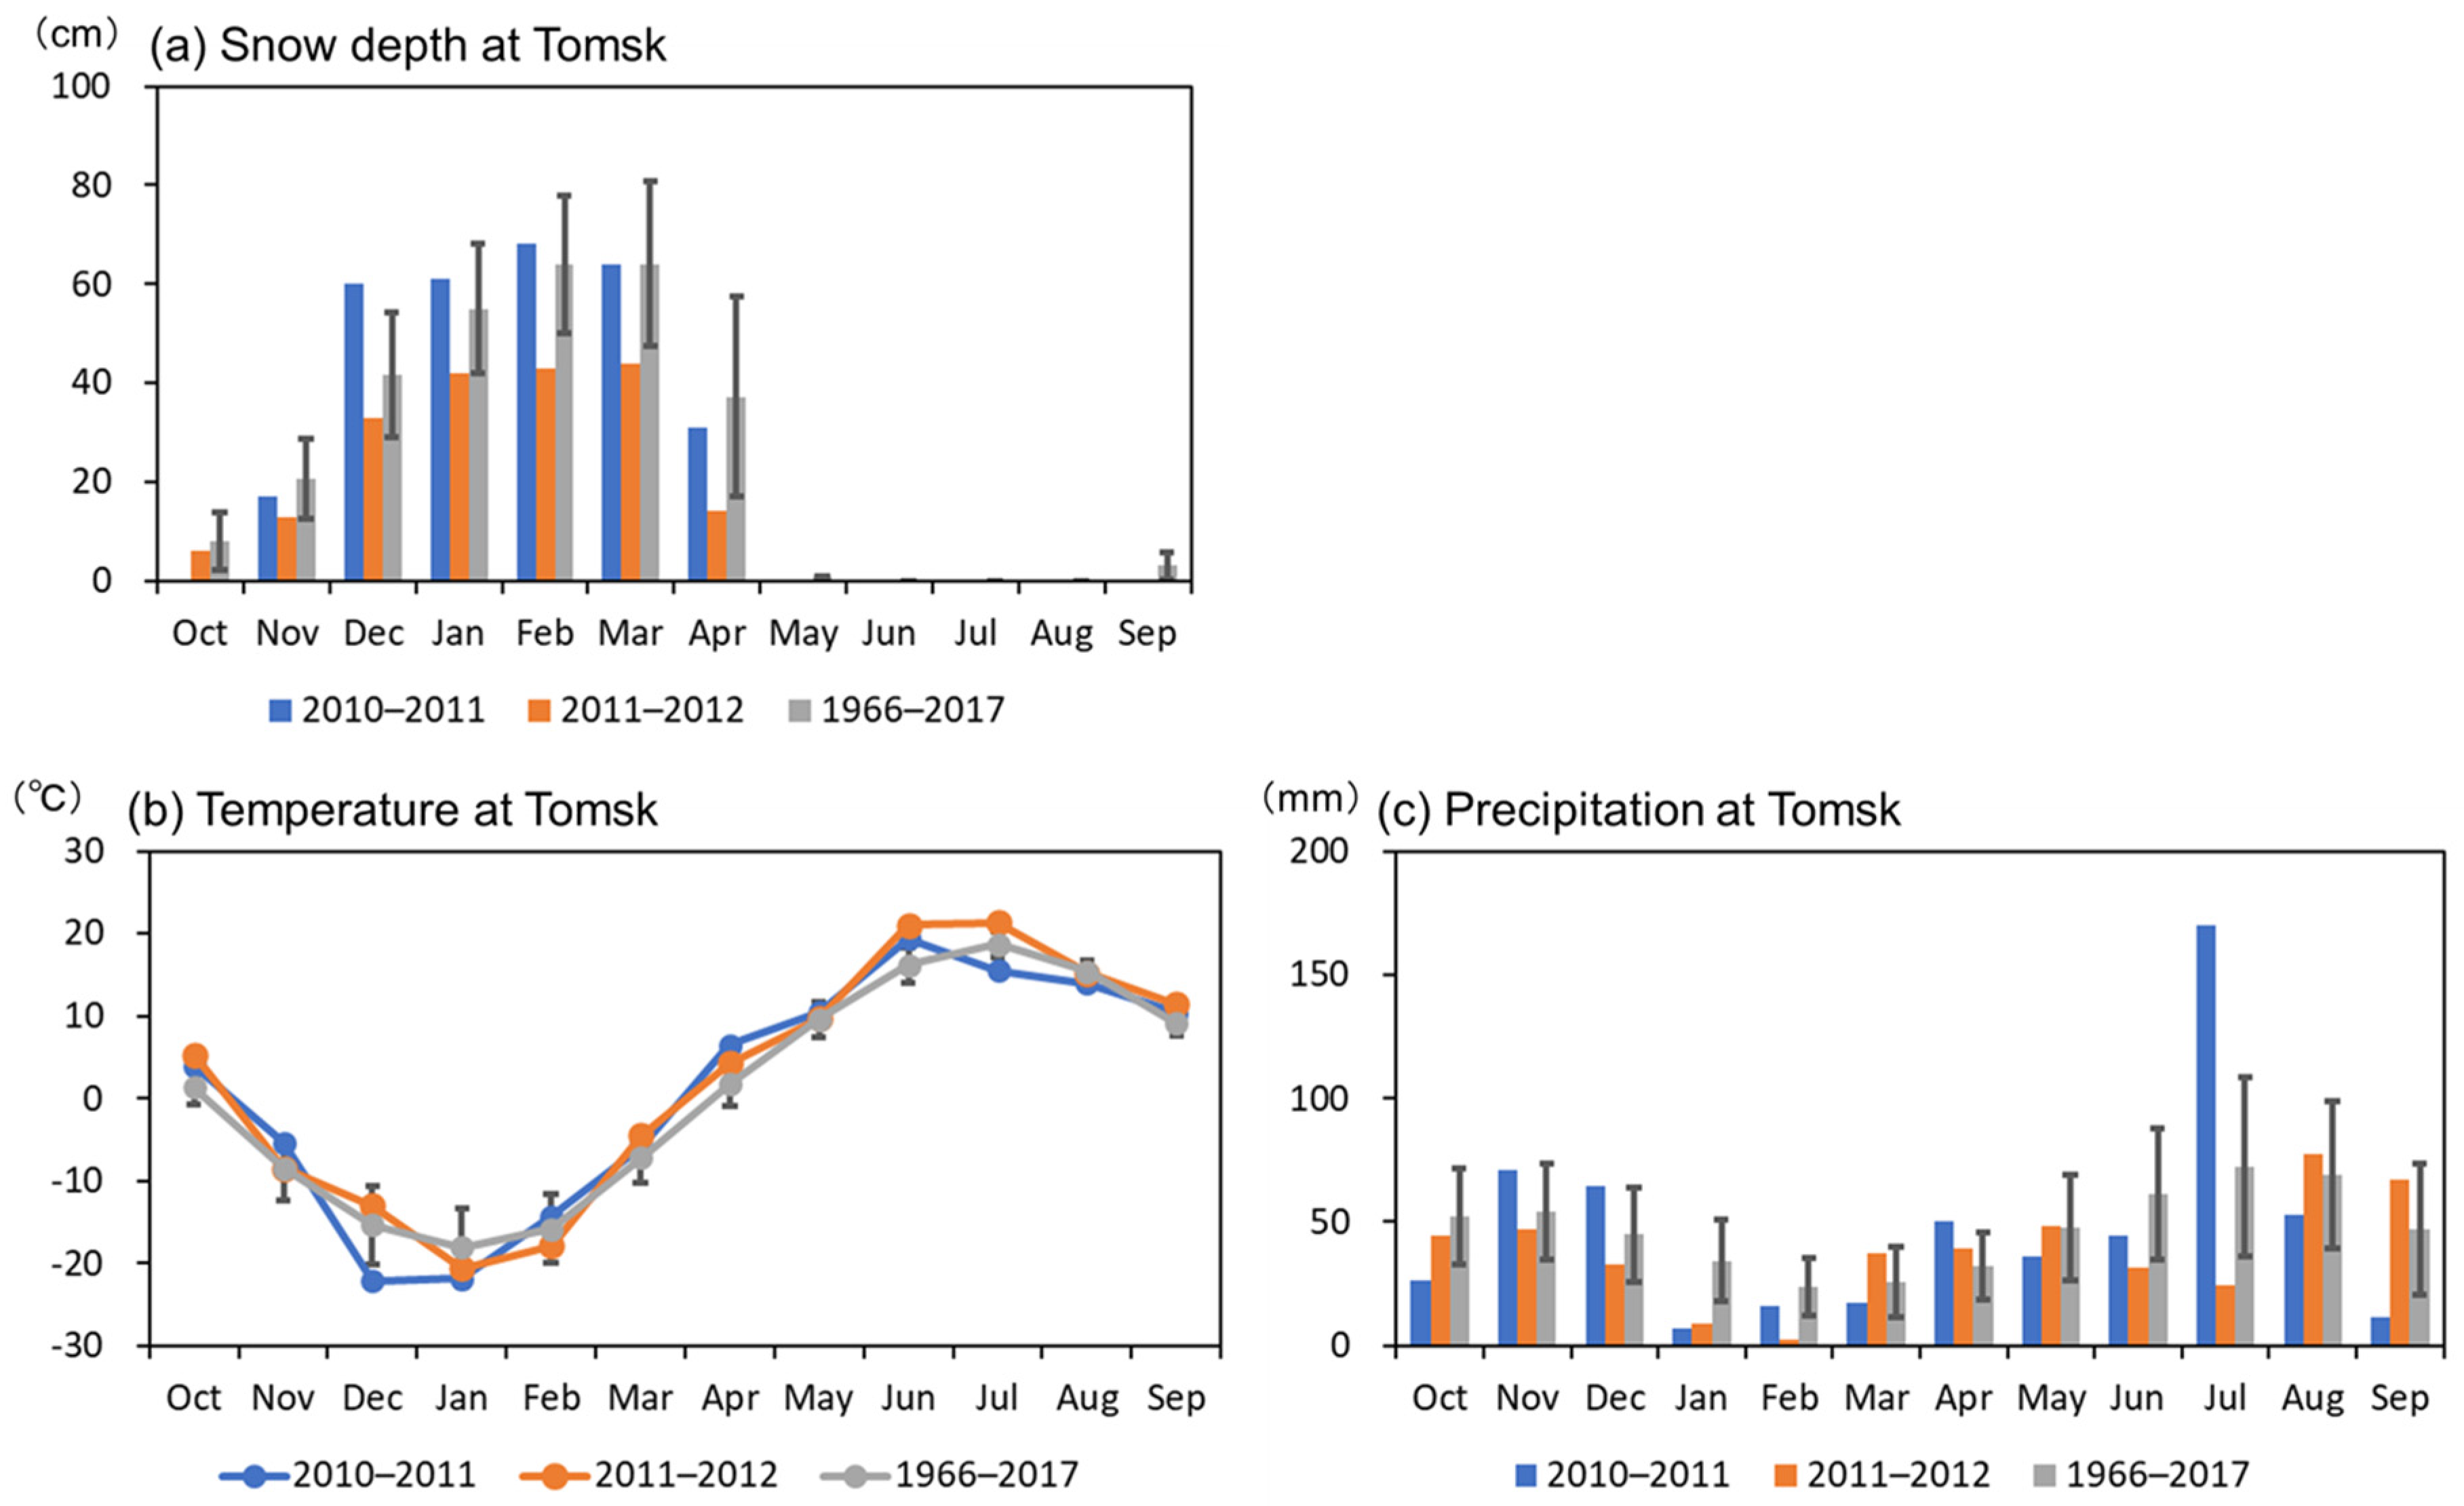
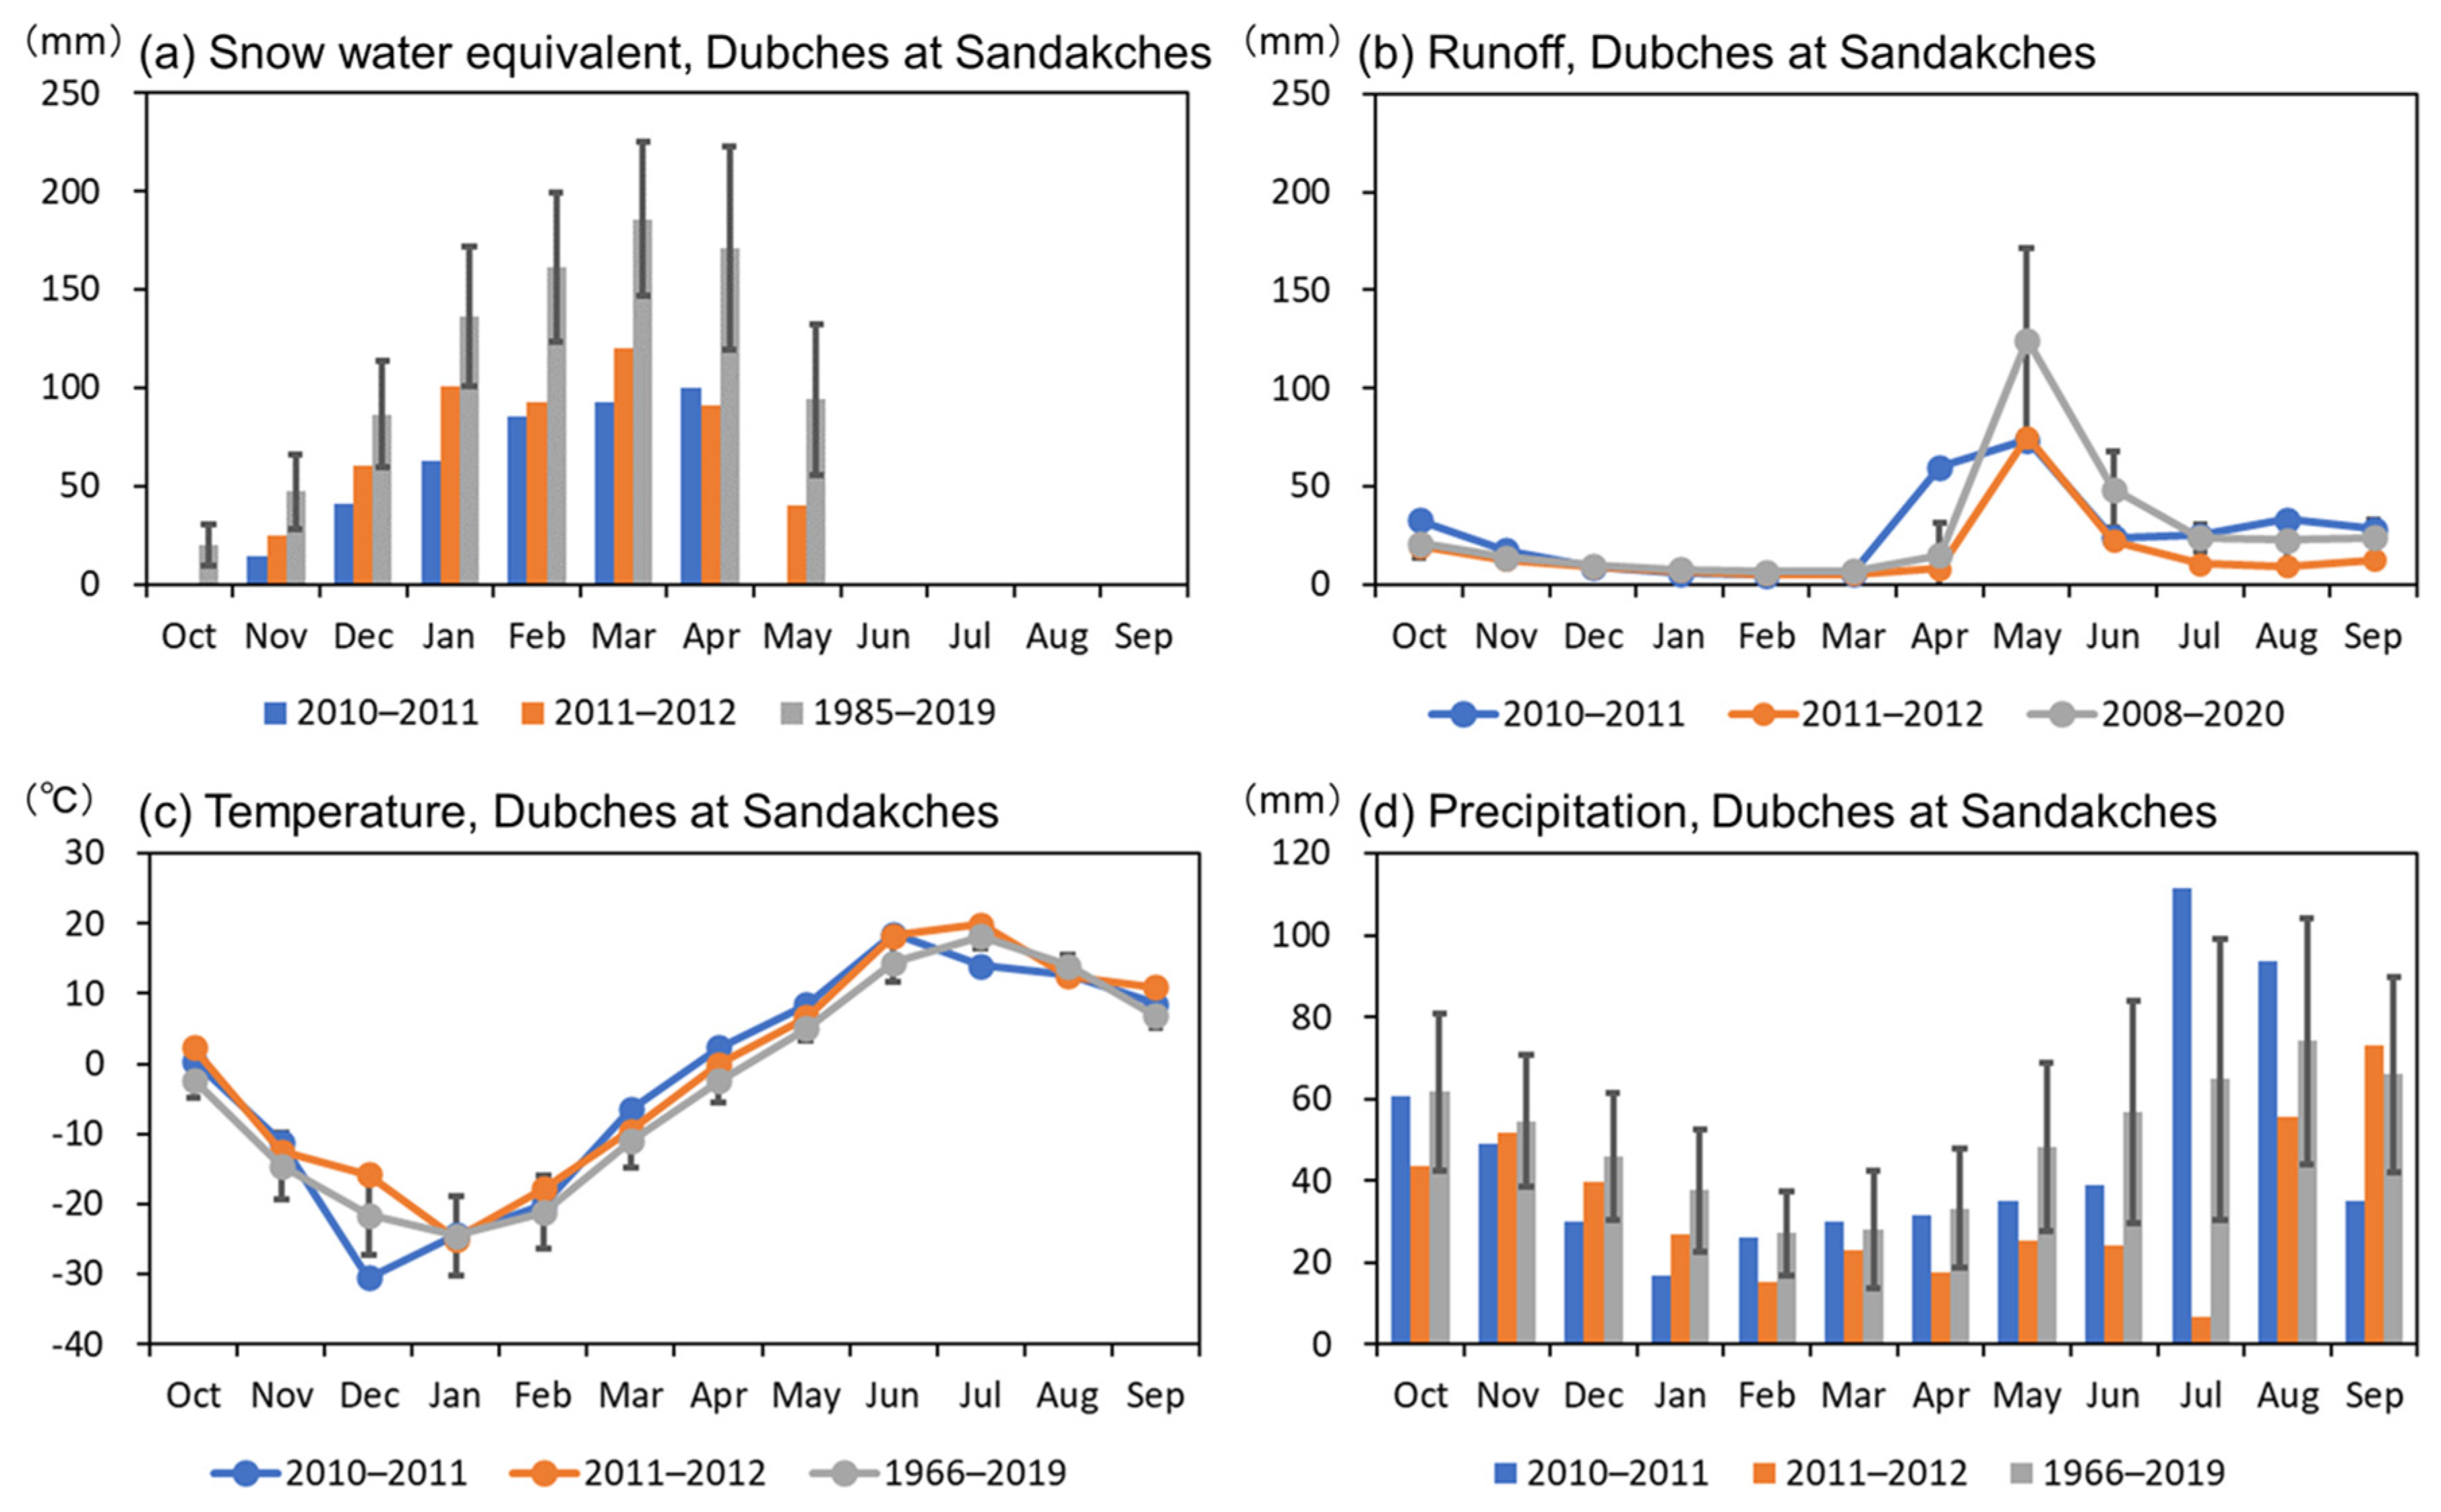
3.2. Hydrometeorological Characteristics at Dubches at Sandakches, Middle WS in 2012 and 2011

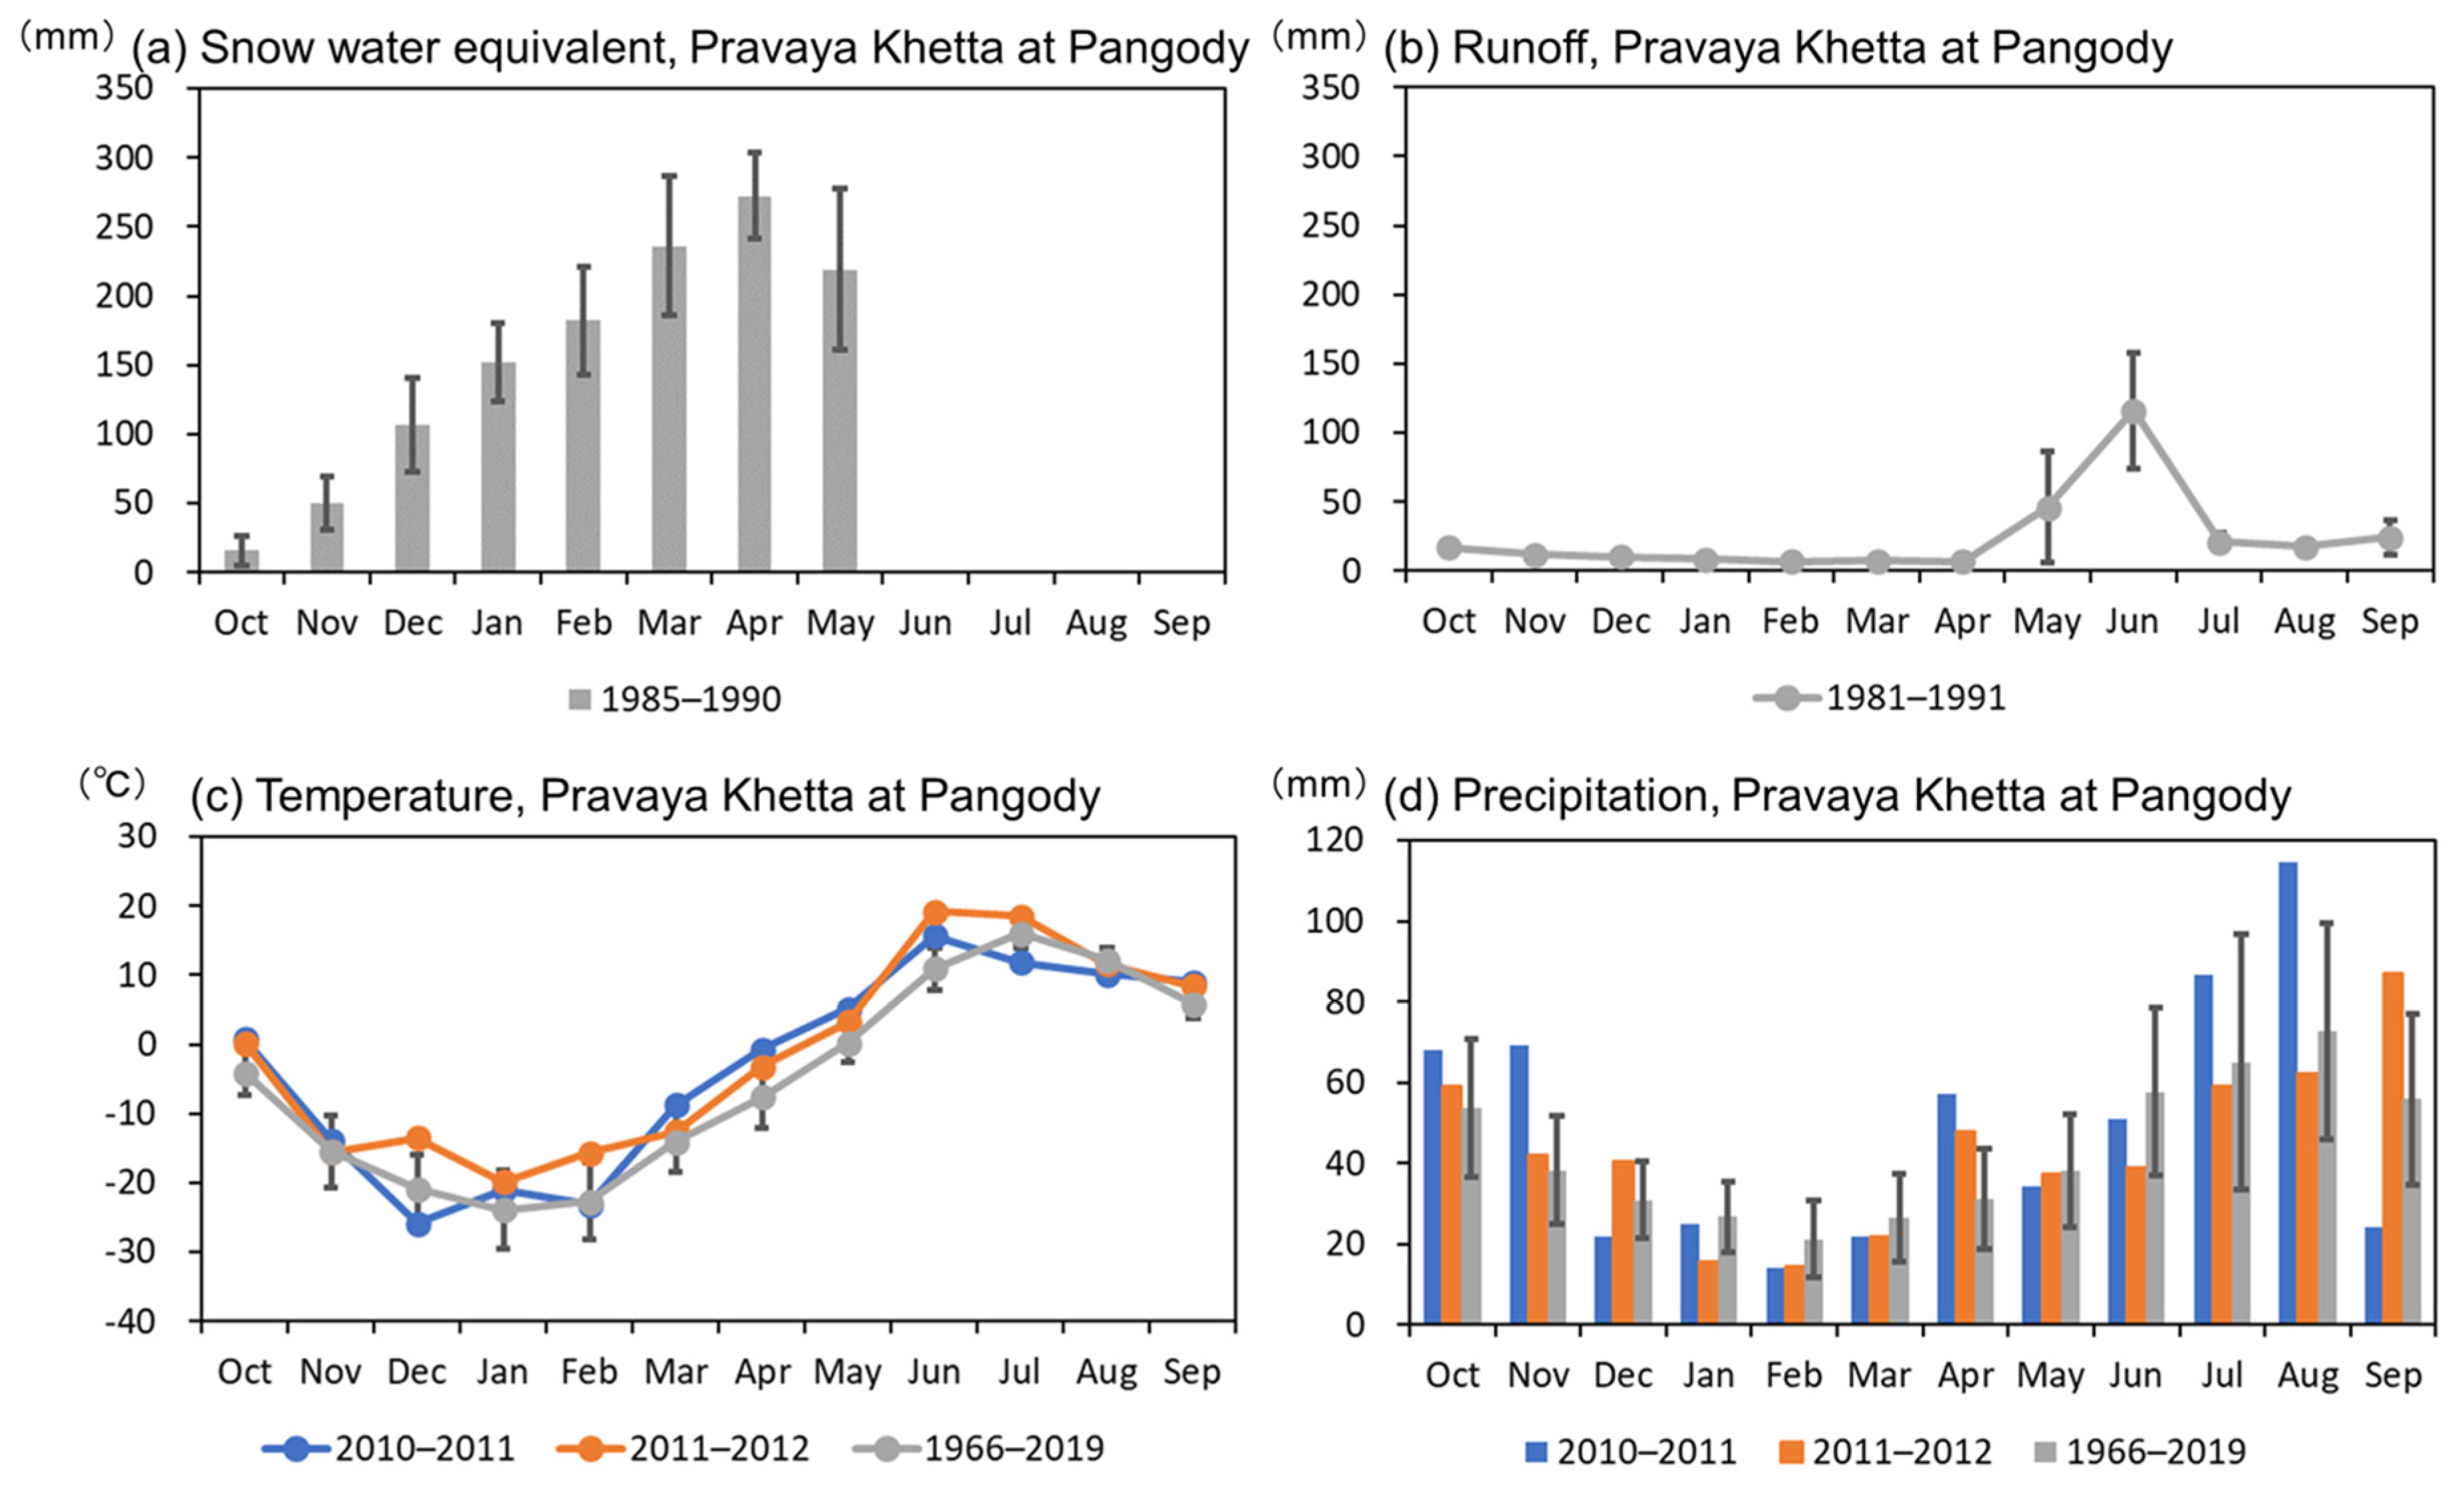
3.3. Hydrometeorological Characteristics at Pravaya Khetta at Pangody, North WS in 2012 and 2011
3.4. Hydrometeorological Characteristics at Ursul at Onguday, South WS in 2012 and 2011
3.5. Characteritics of Extreme Indices
4. Conclusions
- The entire WS experienced a high temperature anomaly from spring to summer in 2012, especially in June and July.
- In middle WS, the snow water equivalent in March 2012 was the third smallest from 1985 to 2019. The runoff in spring was also systematically lower than the long-term mean. Precipitation during April–August 2012 was continuously lower than the long-term mean. All these factors resulted in a severe drought. In particular, the five-day precipitation and daily precipitation in July 2012 were the lowest from 1966 to 2019. These characteristics were unique to middle WS alone, including Tomsk.
- In middle WS in 2011, the snow water equivalent in March was the lowest from 1985 to 2019. The peak runoff also appeared earlier than normal in 2011. However, precipitation during July–August 2011 prevented the occurrence of a severe drought in the summer of 2011.
- North and south WS did not suffer from severe drought in 2012 because substantial precipitation was observed in the summer, although the snow water equivalent in March 2012 in south WS was the fifth lowest from 1986 to 2017. The extreme precipitation indices in 2012 in north and south WS were not as distinct as those in middle WS.
Author Contributions
Funding
Institutional Rview Board Statement
Informed Consent Statement
Data Availability Statement
Conflicts of Interest
References
- IPCC. Climate Change 2021: The Physical Science Basis. Contribution of Working Group I to the Sixth Assessment Report of the Intergovernmental Panel on Climate Change; Cambridge University Press: Cambridge, UK; New York, NY, USA, 2013; 2391p. [Google Scholar]
- Doll, R.; Hoerling, M.; Perlwitz, J.; Eischeid, J.; Pegion, P.; Zhang, T.; Quan, X.-W.; Xu, T.; Murray, D. Was there a basis for anticipating the 2010 Russian heat wave? Geophys. Res. Lett. 2011, 38, L06702. [Google Scholar] [CrossRef]
- Doktycz, C.; Abkowitz, M. Loss and damage estimation for extreme weather events: State of the practice. Sustainability 2019, 11, 4243. [Google Scholar] [CrossRef]
- Elias, E.H.; Flynn, R.; Idowu, O.J.; Reyes, J.; Sanogo, S.; Schutte, B.J.; Smith, R.; Steele, C.; Sutherland, C. Crop vulnerability to weather and climate risk: Analysis of interacting systems and adaptation efficacy for sustainable crop production. Sustainability 2019, 11, 6619. [Google Scholar] [CrossRef]
- Elahi, E.; Khalid, Z.; Tauni, M.Z.; Zhang, H.; Lirong, X. Extreme weather events risk to crop-production and the adaptation of innovative management strategies to mitigate the risk: A retrospective survey of rural Punjab, Pakistan. Technovation 2022, 117, 102255. [Google Scholar] [CrossRef]
- Russian Federal Service for Hydrometeorology and Environmental Monitoring (Roshydromet). A Report of Climate Features of the Territory of the Russian Federation in 2012; Roshydromet: Moscow, Russia, 2013; 86p. (In Russian) [Google Scholar]
- Zemtsov, V.A.; Paromov, V.V.; Kopysov, S.G.; Kouraev, A.V.; Negrul, S.V. Hydrological risks in Western Siberia under the changing climate and anthropogenic influences conditions. Int. J. Environ. Studies 2014, 71, 611–617. [Google Scholar] [CrossRef]
- Beisembayeva, M.A.; Zemtsov, V.A.; Kamkin, V.A.; Bazarbekov, K.U. Chapter 9. Dynamics of the Irtysh River floodplain hydrology and vegetation in the Pavlodar Region of the Republic of Kazakhstan. In Riparian Zones: Characteristics, Management Practices and Ecological Impacts; Pokrovsky, O.S., Ed.; Nova Science Publishers: New York, NY, USA, 2016; pp. 211–230. [Google Scholar]
- Pokrovsky, O.S.; Shirokova, L.S.; Kirpotin, S.N.; Kulizhsky, S.P.; Vorobiev, S.N. Impact of western Siberia heat wave 2012 on greenhouse gases and trace metal concentration in thaw lakes of discontinuous permafrost zone. Biogeosciences 2013, 10, 5349–5365. [Google Scholar] [CrossRef]
- RIHMI-WDC. Databases of Research Institute of Hydrometeorological Information. Available online: http://aisori.meteo.ru/ClimateR (accessed on 27 April 2019).
- Haeseler, S. Heat and Drought in June/July 2012 in Tomsk/Siberia. Available online: https://www.dwd.de/EN/ourservices/specialevents/drought/20120801_Hitze_in_Tomsk_en.pdf?__blob=publicationFile&v=3 (accessed on 22 September 2022).
- Japan Meteorological Agency. Global circulation and world weather in June 2012. Tenki 2012, 59, 728–729. (In Japanese) [Google Scholar]
- Peterson, T.C.; Hoerling, M.P.; Scott, P.A.; Herring, S. Explaining extreme events of 2012 from a climate perspective. Bull. Amer. Meteor. Soc. 2013, 94, S1–S74. [Google Scholar] [CrossRef]
- Polyakov, D.Y.; Barashkova, N.K.; Kuzhevskay, I.V. Weather and climate description of anomalous summer 2012 in Tomsk region. Russian Meteor. Hydrol. 2014, 39, 22–28. [Google Scholar] [CrossRef]
- Voropay, N.N.; Ryazanova, A.A. Atmopsheric droughts in Southern Siberia in the late 20th and early 21st centuries. In IOP Conference Series: Earth and Environmental Science; IOP Publishing: Bristol, UK, 2018; Volume 211, p. 012062. [Google Scholar] [CrossRef]
- Kopysov, S.G.; Erofeev, A.A. The influences of climate on runoff: A case study of four catchments in Western Siberia. In IOP Conference Series: Earth and Environmental Science; IOP Publishing: Bristol, UK, 2019; Volume 381, p. 01246. [Google Scholar] [CrossRef]
- Van Loon, A.F. Hydrologic drought explained. WIRES Water 2015, 2, 359–392. [Google Scholar] [CrossRef]
- Xie, P.; Arkin, P.A. Global precipitation: A 17-year monthly analysis based on gauge observations, satellite estimates, and numerical model outputs. Bull. Amer. Meteor. Soc. 1997, 78, 2539–2558. [Google Scholar] [CrossRef]
- Kalnay, E.; Kanamitsu, M.; Kistler, R.; Collins, W.; Deaven, D.; Gandin, L.; Iredell, M.; Saha, S.; White, G.; Woollen, J.; et al. The NCEP/NCAR 40-year reanalysis project. Bull. Amer. Meteor. Soc. 1996, 77, 437–471. [Google Scholar] [CrossRef]
- NOAA/PSL. Monthly/Seasonal Climate Composites. Available online: https://psl.noaa.gov/cgi-bin/data/composites/printpage.pl (accessed on 11 October 2022).
- SevKavNIIVH. Automated Information System for State Monitoring of Water Bodies. Available online: https://gmvo.skniivh.ru/ (accessed on 12 December 2022). (In Russian).
- Klein Tank, A.M.G.; Zwiers, F.W.; Zhang, X. Guidelines on Analysis of Extremes in a Changing Climate in Support of Informed Decisions for Adaptation; World Meteorological Organization: Geneva, Switzerland, 2009; 52p. [Google Scholar]


| Index | Definition | Unit |
|---|---|---|
| TXx | Maximum of daily maximum temperature (TX) | °C |
| TXn | Minimum of daily TX | °C |
| TNx | Maximum of daily minimum temperature (TN) | °C |
| TNn | Minimum of daily TN | °C |
| TX90P | Percentage of days when TX > 90th percentile of TX in 1961–1990 | % |
| TX10P | Percentage of days when TX > 10th percentile of TX in 1961–1990 | % |
| TN90P | Percentage of days when TN > 90th percentile of TN in 1961–1990 | % |
| TN10P | Percentage of days when TN > 10th percentile of TN in 1961–1990 | % |
| RX5day | Maximum 5-day precipitation | mm |
| RX1day | Maximum daily precipitation | mm |
| DTR | Diurnal temperature range | °C |
| April 2012 | May 2012 | June 2012 | ||||||||||
|---|---|---|---|---|---|---|---|---|---|---|---|---|
| North | Middle | South | North | Middle | South | North | Middle | South | ||||
| Index | Nadym | Tarko- Sale | Bor | Ust- Koksa | Nadym | Tarko- Sale | Bor | Ust- Koksa | Nadym | Tarko- Sale | Bor | Ust- Koksa |
| TXx | 27 | 18 | 35 | 8 | 2 | 2 | 7 | 11 | 1 | 1 | 17 | 1 |
| TXn | 7 | 8 | 12 | 1 | 24 | 26 | 9 | 12 | 1 | 1 | 2 | 3 |
| TNx | 30 | 22 | 12 | 15 | 1 | 1 | 6 | 51 | 3 | 2 | 15 | 1 |
| TNn | 4 | 5 | 6 | 7 | 11 | 10 | 2 | 44 | 8 | 5 | 7 | 4 |
| TX90P | 19 | 11 | 14 | 3 | 7 | 8 | 12 | 15 | 1 | 1 | 3 | 1 |
| TX10P | 28 | 33 | 24 | 45 | 32 | 35 | 31 | 40 | 33 | 32 | 41 | 31 |
| TN90P | 8 | 7 | 19 | 4 | 6 | 14 | 7 | 23 | 1 | 2 | 10 | 1 |
| TN10P | 34 | 26 | 36 | 27 | 26 | 29 | 45 | 28 | 29 | 23 | 38 | 44 |
| RX5day | 7 | 8 | 45 | 24 | 48 | 18 | 44 | 45 | 15 | 51 | 29 | 21 |
| RX1day | 5 | 10 | 43 | 36 | 45 | 14 | 53 | 50 | 7 | 33 | 28 | 30 |
| DTR | 41 | 49 | 49 | 5 | 21 | 27 | 34 | 7 | 1 | 1 | 6 | 14 |
| July 2012 | August 2012 | September 2012 | ||||||||||
| North | Middle | South | North | Middle | South | North | Middle | South | ||||
| Index | Nadym | Tarko- Sale | Bor | Ust- Koksa | Nadym | Tarko- Sale | Bor | Ust- Koksa | Nadym | Tarko- Sale | Bor | Ust- Koksa |
| TXx | 9 | 10 | 9 | 4 | 21 | 48 | 33 | 20 | 29 | 12 | 6 | 9 |
| TXn | 6 | 11 | 9 | 16 | 33 | 16 | 15 | 32 | 7 | 8 | 2 | 14 |
| TNx | 13 | 1 | 31 | 18 | 44 | 38 | 24 | 28 | 24 | 5 | 3 | 6 |
| TNn | 7 | 6 | 15 | 1 | 31 | 35 | 43 | 38 | 7 | 19 | 1 | 14 |
| TX90P | 5 | 4 | 1 | 2 | 16 | 40 | 23 | 8 | 18 | 13 | 7 | 6 |
| TX10P | 25 | 35 | 32 | 42 | 23 | 33 | 13 | 15 | 35 | 34 | 42 | 49 |
| TN90P | 4 | 4 | 19 | 3 | 44 | 38 | 39 | 17 | 11 | 8 | 1 | 25 |
| TN10P | 31 | 42 | 30 | 43 | 11 | 8 | 3 | 19 | 41 | 41 | 47 | 50 |
| RX5day | 40 | 19 | 53 | 51 | 38 | 35 | 37 | 11 | 2 | 17 | 26 | 20 |
| RX1day | 40 | 36 | 51 | 43 | 23 | 30 | 32 | 33 | 12 | 24 | 5 | 10 |
| DTR | 16 | 27 | 7 | 20 | 6 | 18 | 11 | 34 | 11 | 16 | 31 | 12 |
Disclaimer/Publisher’s Note: The statements, opinions and data contained in all publications are solely those of the individual author(s) and contributor(s) and not of MDPI and/or the editor(s). MDPI and/or the editor(s) disclaim responsibility for any injury to people or property resulting from any ideas, methods, instructions or products referred to in the content. |
© 2023 by the authors. Licensee MDPI, Basel, Switzerland. This article is an open access article distributed under the terms and conditions of the Creative Commons Attribution (CC BY) license (https://creativecommons.org/licenses/by/4.0/).
Share and Cite
Matsuyama, H.; Watanabe, T.; Zemtsov, V. Extreme Drought around Tomsk, Russia in Summer 2012 in Comparison with Other Regions in Western Siberia. Water 2023, 15, 388. https://doi.org/10.3390/w15030388
Matsuyama H, Watanabe T, Zemtsov V. Extreme Drought around Tomsk, Russia in Summer 2012 in Comparison with Other Regions in Western Siberia. Water. 2023; 15(3):388. https://doi.org/10.3390/w15030388
Chicago/Turabian StyleMatsuyama, Hiroshi, Takanori Watanabe, and Valerii Zemtsov. 2023. "Extreme Drought around Tomsk, Russia in Summer 2012 in Comparison with Other Regions in Western Siberia" Water 15, no. 3: 388. https://doi.org/10.3390/w15030388
APA StyleMatsuyama, H., Watanabe, T., & Zemtsov, V. (2023). Extreme Drought around Tomsk, Russia in Summer 2012 in Comparison with Other Regions in Western Siberia. Water, 15(3), 388. https://doi.org/10.3390/w15030388