1. Introduction
Water is an essential element for life because of its crucial role in the various biological and chemical activities that ensure the survival of plants and animals [
1]. However, agriculture and industry are exerting pressure on freshwater reserves [
2]. It may be inferred that the issue of water pollution caused by organic compounds, industrial operations, agricultural practices, and urban activities is a significant worldwide problem, with a particular emphasis on persistent organic pollutants (POPs) [
3], which pose a serious health risk due to their toxicity and potential danger to living organisms, including humans. Due to the disorganization and inefficiency of the majority of the global textile sector, nearly 200,000 tons of synthetic dyes are introduced annually into the environment [
4]. Dyeing effluent has a complex composition, deep color, and high pollutant concentration [
5,
6,
7].
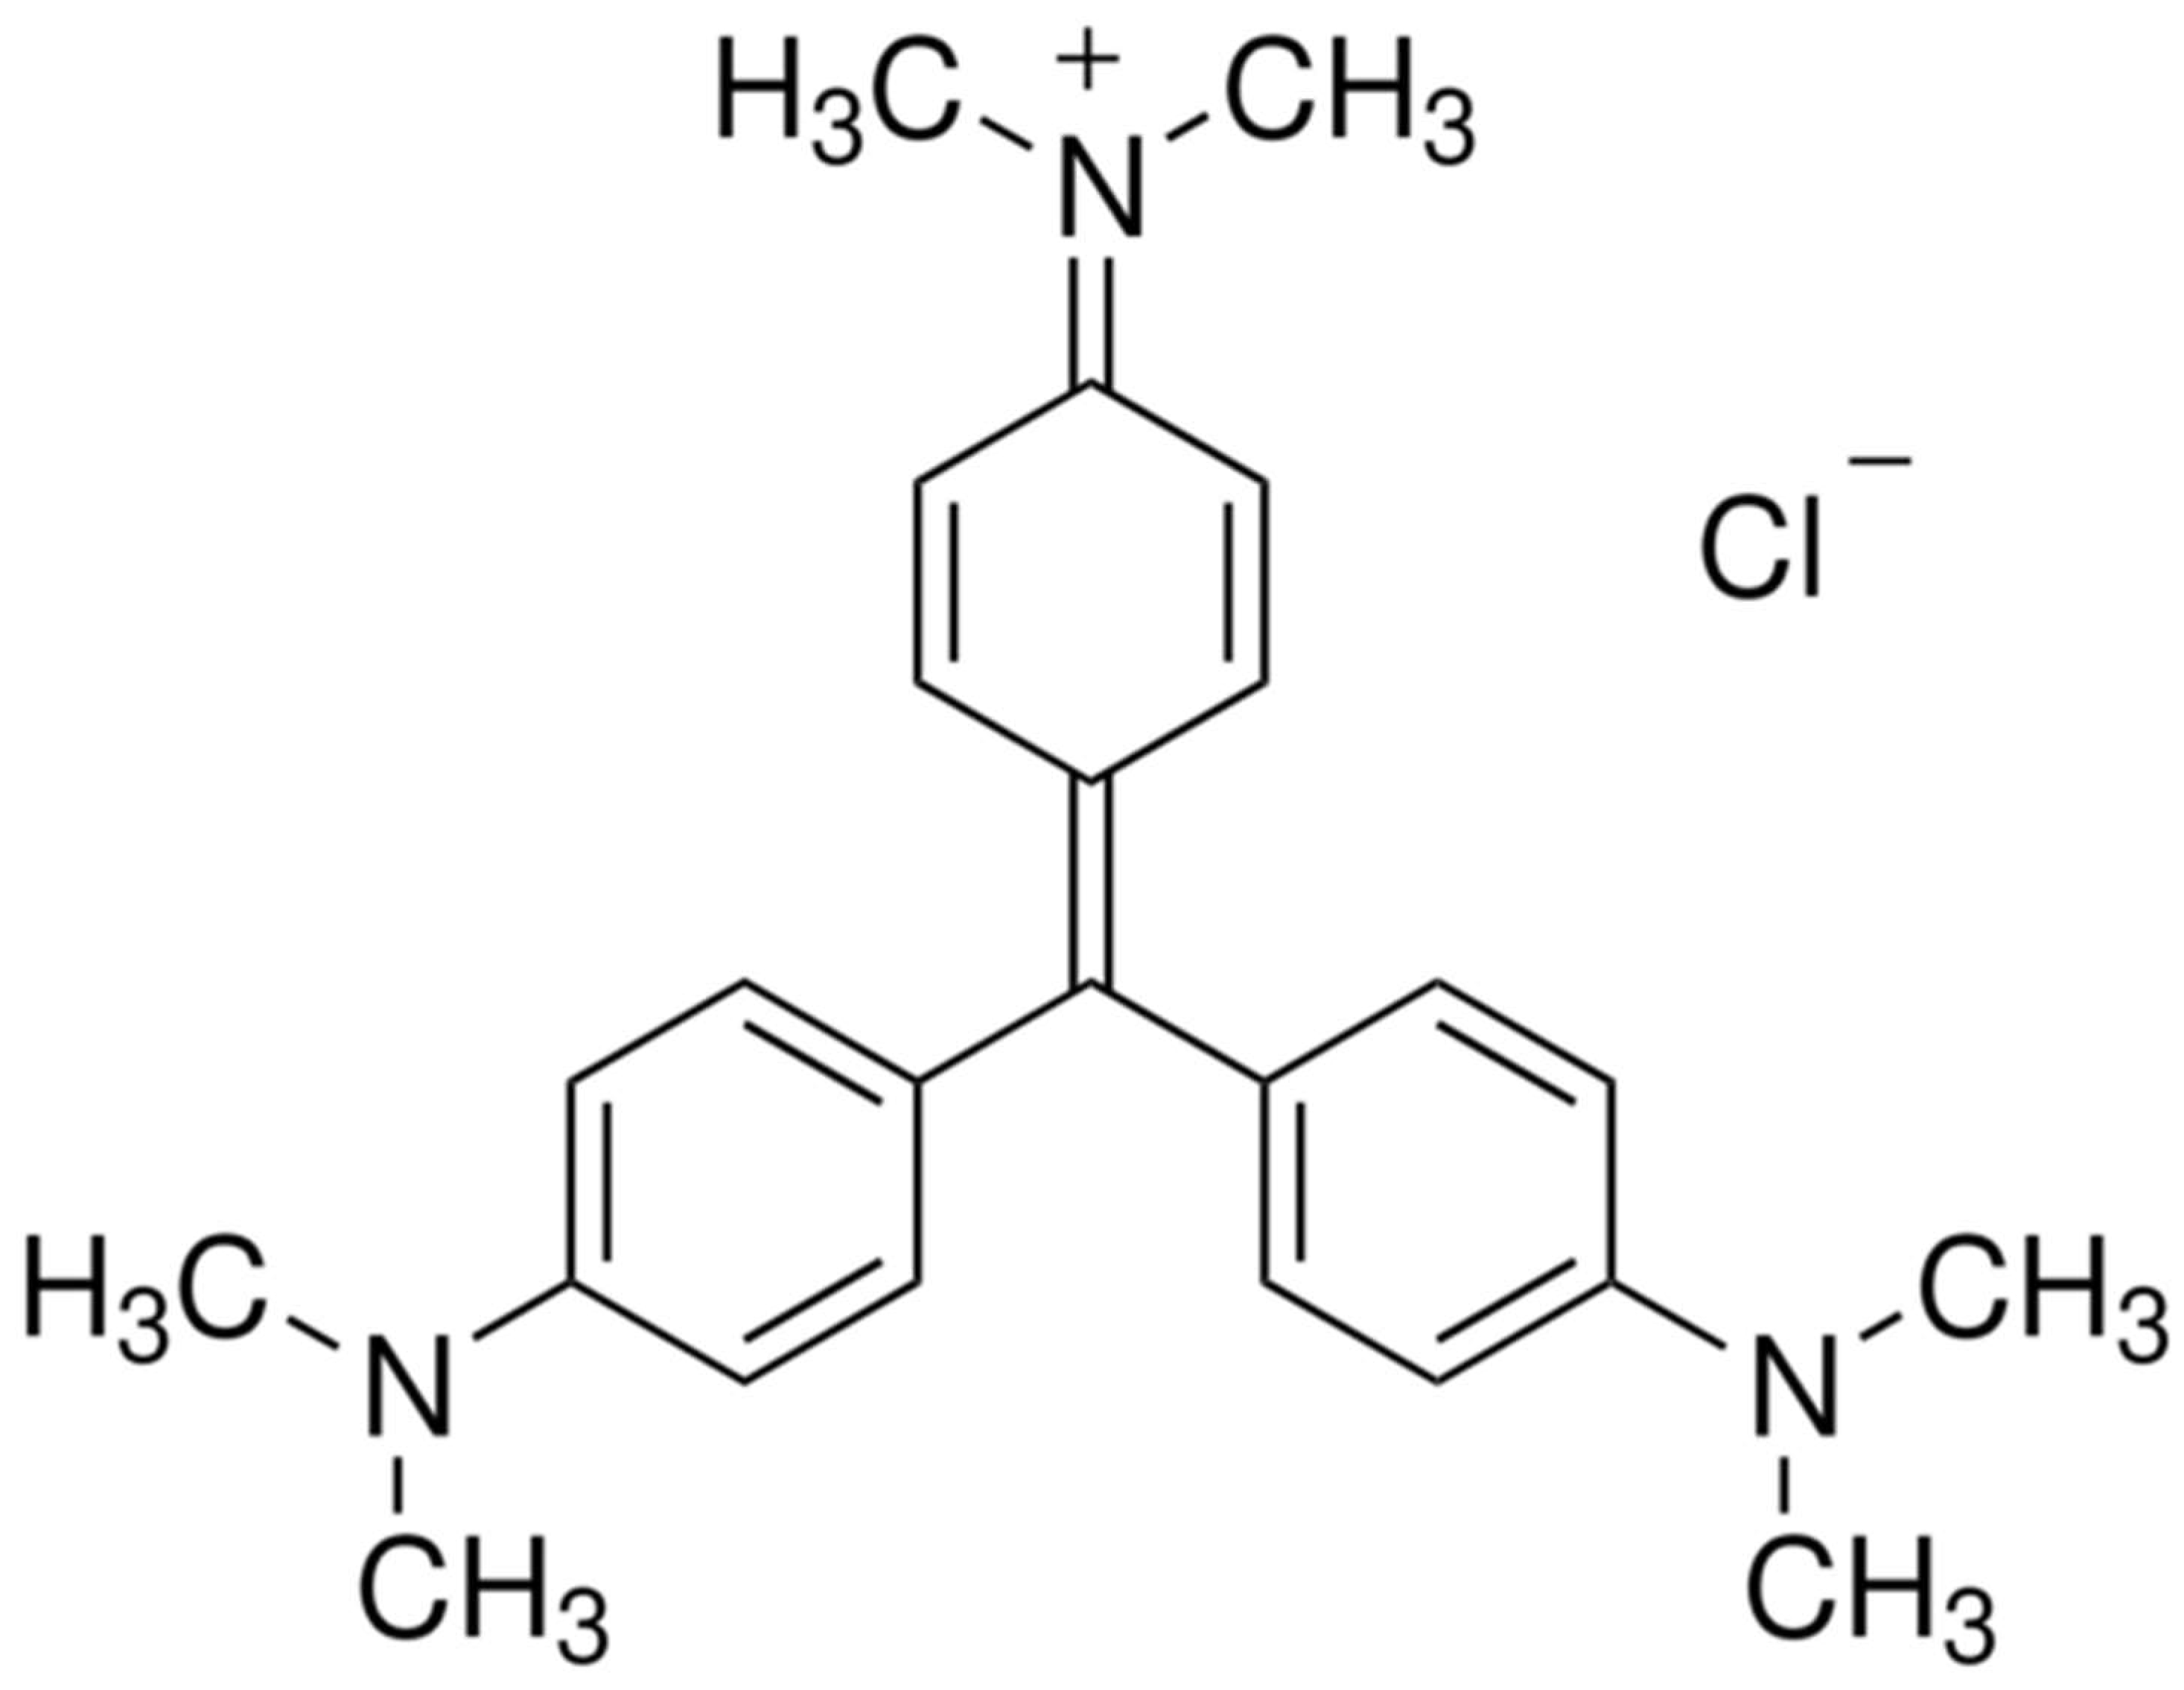
The CV dye, also known as gentian violet, is a triarylmethane dye that has several applications. It is used as a pH indicator, an active ingredient in Gram’s stain, and a bacteriostatic agent [
8]. It is also used as an external skin disinfectant and a purple dye in textiles, paints, and printing ink. However, CV poses risks for eye irritation, pain, and cornea and conjunctival damage, and its use can even result in respiratory and kidney failure [
9]. Hence, effective removal of dyes in aquatic systems is crucial due to their significant health and environmental concerns [
10,
11,
12]. The use of these strategies encompasses both conventional and contemporary techniques, such as coagulation [
13], air stripping [
14], the incineration process [
15], filtration through membrane [
16], adsorption on stimulated carbon [
17], electrochemical oxidation [
15], wet oxidation [
18], the biological oxidation process [
19], membrane technology [
20,
21], and chemical oxidation techniques [
22]. Recently, there has been a notable surge of interest in the domain of advanced oxidation processes (AOPs) [
23]. These are based on the generation of highly reactive hydroxyl radicals as primary oxidants. The main advantages of their application are their simplicity of use, accessibility, and moderate cost [
24]. Among the AOPs, Fenton- and photo-Fenton-like reactions are very promising [
25]. The pollutant oxidation using Fenton’s reagent is a homogeneous oxidation that takes place when H
2O
2 and ferrous ions are present in the mixture. In an acidic environment, if H
2O
2 is added to an aqueous system containing an organic substrate and ferrous ions, a complex redox reaction occurs.
The Fenton reaction is an AOP that produces active hydroxyl radicals by decomposing hydrogen peroxide with ferrous ions [
26,
27]. The Fenton reaction can be modified with metal centers and organic ligands for compatibility and good catalytic performance [
28]. The first study reported by H. J. Fenton in 1894 shows that it enhances the oxidative potential of H
2O
2 when iron (Fe
2+) is used as a catalyst under acidic conditions [
29]. (Equations (1)–(3)).
The formation of free active radicals by naturally occurring chemical species has significant environmental implications for Fenton chemistry [
29].
Recently, there has been a growing trend towards the use of detailed, highly accurate mathematical models to optimize water treatment processes. Several methods have been successfully used to predict and optimize the photo-Fenton process reaction, in order to degrade organic compounds and to determine the consumed amount of hydrogen peroxides, the amount of Fe
2+ catalysts, and the concentration of the CV dye. The types of modeling methods used include experimental designs [
30,
31], intelligence artificial neural network models [
32], Taguchi-based regression models [
31,
33], multivariate analysis [
34], and statistical regression models [
35]. However, in most scientific work over the last decade, Gaussian process regression or GPR models have been widely proposed for optimizing water treatment processes, which have proven to be well suited to the experiments [
36].
This study’s primary objective is to investigate the removal of CV and to determine the effects of various parameters on the degradation of CV dye in an aqueous Fenton solution. The effect of pH, the concentration of H2O2 and Fe2+ dye, and the temperature were investigated to determine the optimal operating conditions for a better performance of the degradation.
To enhance the degradation of CV dye, the process, which combines Fenton and ultrasound, uses the phenomenon of acoustic cavitation, i.e., the implosive formation, growth, and collapse of microbubbles in aqueous media, to produce chemical effects and improve the degradation efficiency of the colorant CV. The conditions are investigated under which microbubbles implode and generate localized hot spots with transient high temperatures, leading to the cleavage of water molecules and the dissolution of oxygen into radicals [
37,
38].
The Fenton process, widely used for degrading dyes like CV, exhibits certain limitations. One challenge is the occasional restriction in efficiency, particularly when dealing with complex organic compounds like CV, where the generation of hydroxyl radicals may not consistently achieve the necessary reactivity for exhaustive dye degradation. To address this, the study explores the integration of ultrasound with the Fenton process to enhance overall efficiency. Ultrasound induces acoustic cavitation, creating microenvironments conducive to heightened reactivity of hydroxyl radicals. This synergistic approach mitigates challenges associated with the limited efficiency of the Fenton process, enabling more complete degradation of the CV.
Another limitation of the Fenton process lies in its sensitivity to operational conditions, including pH, H2O2 concentration, and Fe2+ concentration. These variations can significantly impact process performance, complicating its optimization. To overcome this, the study incorporates artificial intelligence through the Gaussian process regression (GPR) model. GPR provides a dynamic solution by anticipating and adjusting operational conditions in real time. This adaptive approach ensures a flexible response to parameter variations, enhancing the efficiency of the Fenton process and its ability to degrade CV under variable operational conditions.
The complexity of chemical reactions in the CV degradation process can impede traditional modeling accuracy and adaptability. The study utilizes the GPR as a powerful modeling tool to accurately model degradation processes. Its capacity to manage system complexity and adjust the model based on experimental data enables robust and precise predictions.
By skillfully combining the Fenton process with ultrasound and leveraging the potential of artificial intelligence through the GPR model, this enriched approach surpasses the limitations of conventional approaches, providing an innovative perspective for optimizing the environmental degradation processes of crystal violet dye.
In this work, a comprehensive study was conducted to optimize the degradation conditions of CV dye using the Fenton process, both with and without the association of ultrasound. A meticulous analysis was undertaken to better understand how various parameters, such as the initial concentration of Fe2+, the H2O2 content, the pH, the type and concentration of the acid, the initial CV concentration, the temperature, and the agitation speed, affect the efficiency of the Fenton process in CV decomposition. The influence of each parameter on CV degradation was assessed. Furthermore, a sophisticated modeling approach using Gaussian process regression (GPR) and optimization through the Improved Grey Wolf Optimization (IGWO) algorithm were employed to predict the reduced concentration (C/C0) resulting from the degradation process, with the aim of optimizing conditions for achieving the lowest possible C/C0 ratio.
This pioneering research marks the dawn of a new era of innovation in the field of environmental chemistry and dye degradation. It introduces a cutting-edge approach by harnessing advanced tools such as GPR and the IGWO algorithm. This dynamic synergy empowers precise prediction of the C/C0 ratio, a pivotal metric representing the efficiency of the degradation process. This achievement not only elevates the level of precision and sophistication in optimizing the degradation conditions for CV dye but also holds the promise of profound implications. Going beyond traditional boundaries, this research embarks on a comprehensive exploration of a multitude of crucial parameters. These encompass the initial concentration of Fe2+, the content of H2O2, pH levels, the type and concentration of the acid, the initial CV concentration, temperature, agitation speed, and the innovative integration of the Fenton process coupled with ultrasound. This comprehensive analysis unveils the significant impact each of these variables exerts on CV degradation, offering profound insights into the intricate mechanisms of the process. Furthermore, the study’s ability to provide highly accurate predictions for finding optimal degradation conditions makes it invaluable for applications in water treatment and wastewater management. These applications, supported by the study’s findings, have the potential to deliver significant environmental benefits, thereby propelling progress in the field of pollution control and environmental conservation.
2. Experimental
2.1. Materials
All reagents used in the experimental runs were analytical grade, without further purification, and were purchased from commercial sources as follows: hydrogen peroxide, H2O2 (SARL ALGER CHIMIE N30%, Oued Smar, Algeria); crystal violet, C25H30CIN3 (Biochem chemopharma, dye content 97%, Cosne-Cours-sur-Loire, France); Fe2(SO4)3·7H2O (PRS (Panreac)); nitric acid HNO3 (SIGMA-ALDRICH N1.37–1.41, St. Louis, Missouri, United States); sodium chloride, (NaCl) (Sigma Aldrich); acetone, C3H6O (Honeywell N); sodium hydroxide, NaOH (Chem-LAB N98%); hydrochloric acid (HCl) (CARLO ERBA N37%, Emmendingen Germany); phosphoric acid, H3PO4 (Panreac N); sulfuric acid, H2SO4 (Sigma-Aldrich N 97%); potassium iodide, KI (Sigma-Aldrich N); ammonium hypta molybdate, (NH4)6Mo7O24-4H2O (Panreac N). Deionized (DI) water was used in the preparation of all solutions.
2.2. Fenton Experimental
Fenton’s reagent was used to degrade the CV dye, as mentioned in
Figure 1; a 10 mg/L solution of dye was prepared from a 0.5 g/L stock solution by distilled water, then adjusted to obtain the desired value of pH (pH = 3). The pH solution was adjusted by adding drops of either 0.1 M of sulfuric acid (H
2SO
4) or 0.5 M of sodium hydroxide (NaOH), and the values were measured using a Mettler Toledo pH meter (Sevan Easy, Inlab 418 electrode). The experiments were performed in a batch reactor.
The Fenton process requires the use of freshly prepared concentrations of catalyst and oxidizing solutions of hydrated ferrous sulfate (FeSO
4.7H
2O) and H
2O
2 for the CV dye degradation. The necessary amounts of reagents of Fe
2+ and H
2O
2 were added simultaneously to the dye solution. The experiment was performed in the batch reactor of a 500 mL volume, and the mixtures were perfectly homogenized by stirring. The maximum wavelength of absorption (ƛ
max) of the CV dye was found to be 586 nm. The kinetics of oxidation were followed by taking samples at regular time intervals. The residual concentration of the dye in the solution at different sampling times was determined by UV-visible spectroscopy (Shimadzu UV-161). To follow the efficiency of CV degradation, the rate degradation efficiency, R%, was calculated using the following expression:
where C
0 and C correspond to the initial and final dye concentrations, respectively.
2.3. Gaussian Process Regression
GPR is an advanced machine-learning technique known for its sophisticated probabilistic framework in regression modeling [
36]. At its core, GPR models the output by associating a Gaussian distribution with each data point, characterized by mean and variance [
36]. This unique probabilistic aspect of GPR grants it exceptional power in capturing complex and nonlinear relationships between input and output variables [
39]. Unlike many other regression methods, GPR does not require a predefined functional form to describe the connection between input and output variables, making it highly adaptable for solving a diverse range of problems [
36]. GPR offers several advantages over alternative regression techniques, including the ability to estimate uncertainty, adaptability, robustness against noise, and efficient hyperparameter optimization [
36].
In the context of this study, the main objective is to develop a mathematical model based on GPR to accurately predict the C/C0 of CV degradation. This prediction was carried out for two methods of degradation: the Fenton process degradation and the Fenton process degradation coupled with ultrasound. The parameters influencing these degradation processes were rigorously selected as independent variables, including the contact time for each sample (×1), the initial Fe2+ dose (×2), the H2O2 dose (×3), the pH of the Fenton reaction (×4), the type of acid (×5), the acid concentration (×6), the initial CV concentration (×7), temperature (×8), agitation speed (×9), and the method used (×10). Furthermore, numerical encoding was used to represent the different types of acids, assigning the number 1 to nitric acid, the number 2 to hydrochloric acid, the number 3 to phosphoric acid, and the number 4 to sulfuric acid. Similarly, to represent the two degradation methods, a numerical encoding was implemented, associating the number 1 with the “Fenton” method and the number 2 with the “Fenton coupled with ultrasound” method.
Once the database had been meticulously assembled, a pivotal step in the modeling process is the normalization of the data to ensure that they fell within the standardized range of [−1, 1]. Subsequently, the dataset was thoughtfully partitioned into three distinct subsets: a substantial 70% was allocated for the training data, another 15% was set aside for the validation set, and the remaining 15% was reserved for prospective evaluation, intended to gauge the optimal model’s performance at a later stage.
Following this, a crucial phase of the study is devoted to the refinement and optimization of ten diverse kernel functions. Each of these kernel functions was intricately associated with a unique set of foundational functions, providing a wide array of options, including the exponential, squared exponential, Matern32, Matern52, rational quadratic, ARD exponential, ARD squared exponential, ARD Matern32, ARD Matern52, and ARD rational quadratic. In addition to this, meticulous attention is given to fine-tuning the parameters of each kernel function, which encompass aspects such as the kernel scale, represented as [sigmaM, sigmaF], and sigma itself. This fine-tuning process is aimed at elevating the overall accuracy of the GPR model to its zenith.
2.4. Statistical Evaluation Criteria
The accuracy of each model is evaluated using the following essential performance measures: the correlation coefficient (
R), root mean square error (
RMSE), and mean absolute error (
MAE). These individual metrics are computed by applying the following mathematical expressions [
40,
41,
42,
43,
44]:
where
N is the number of data samples,
and
are the experimental and the predicted values, respectively, and
and
are, respectively, the average values of the experimental and the predicted values [
45,
46].
3. Results and Discussion
3.1. Investigation of Simultaneous Effect on RhB Dye Extraction
The effectiveness of Fenton reactions is associated with the generation of hydroxyl (•OH) radicals, which may be influenced by several factors. A parametric investigation was conducted to determine the optimal operational conditions for the removal of CV dye. This was achieved by systematically varying certain physicochemical parameters.
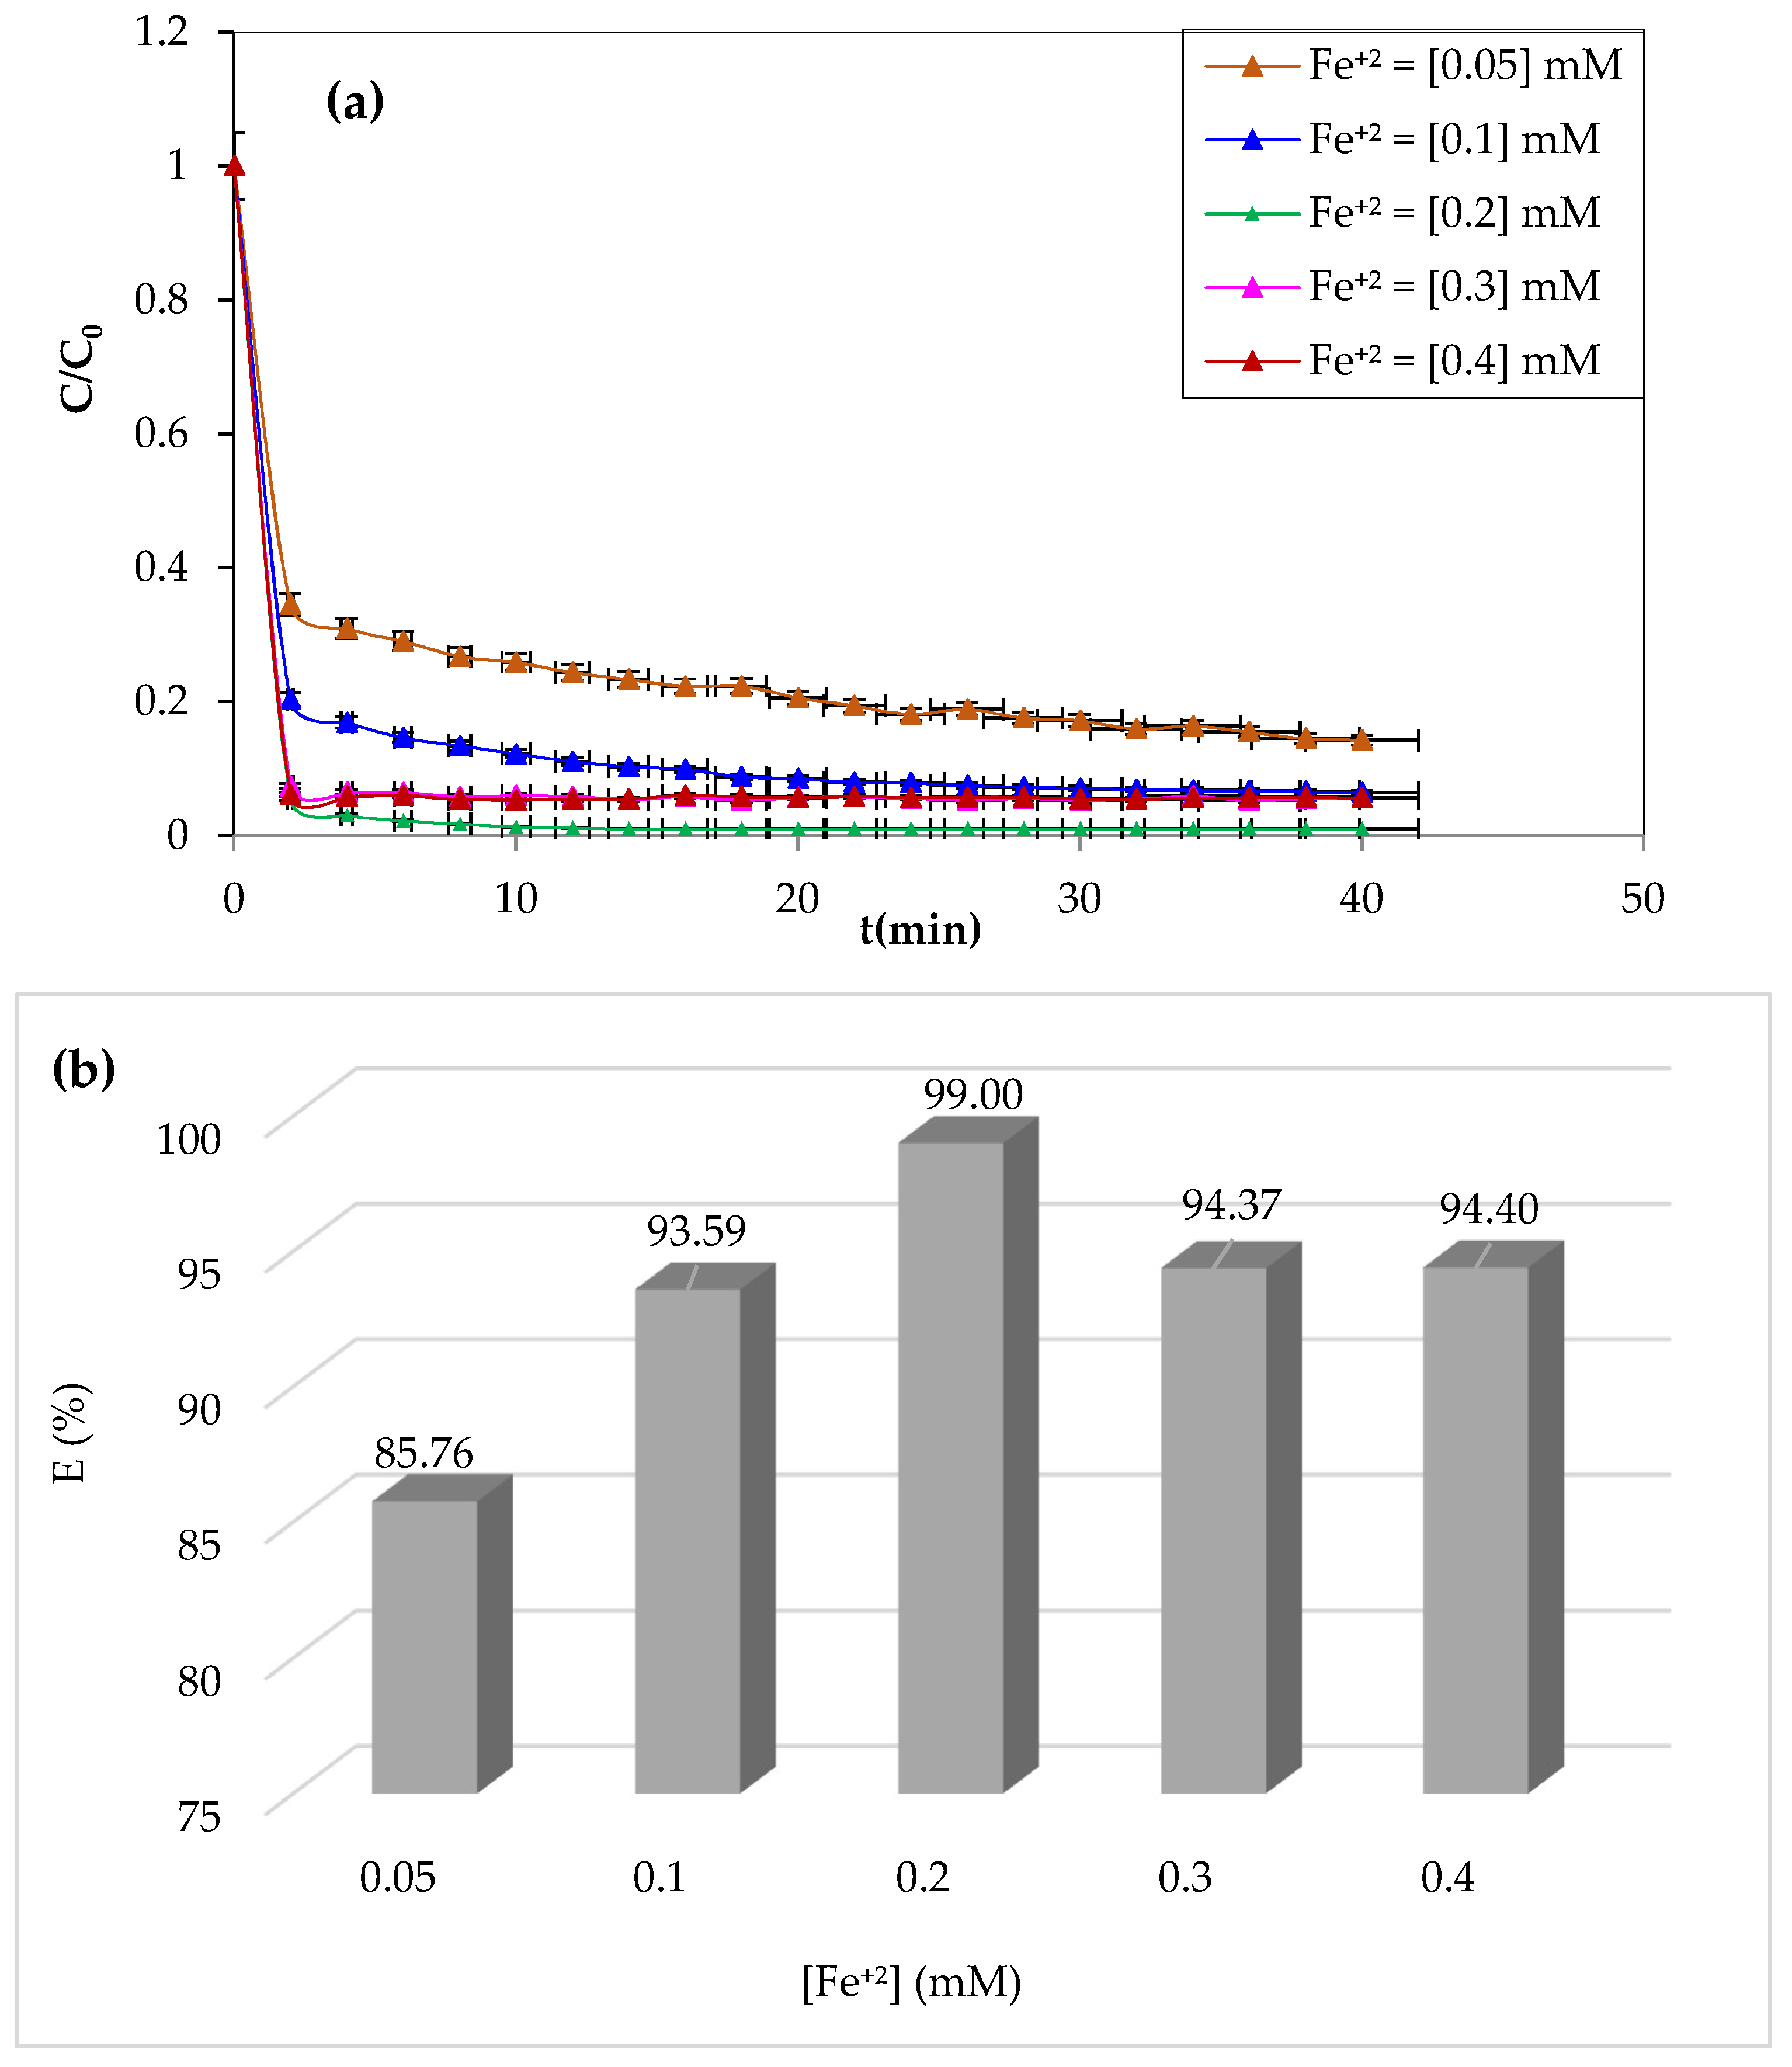
3.1.1. Effect of Initial Fe2+ Dose
Iron ions are the most widely used catalysts for the oxidation of organic pollutants in the Fenton process (Fe
2+/H
2O
2). The study of the effect of ferrous iron on the degradation of CV dye by the Fenton process was carried out by varying the concentrations of Fe
2+ from 0.05 to 0.4 mM. The pH of the solution was adjusted to pH = 3 by adding a drop of 0.1 M of sulfuric acid. The volume of the solution to be treated is 200 mL for a dye concentration of 10 mg/L, whereas the H
2O
2 concentration was 3.13 mM. The experiment was performed at a constant temperature of 25 °C and stirring at 300 rpm.
Figure 2a,b illustrate the obtained results.
As can be seen from
Figure 2, an improvement in the degradation kinetics by raising the catalyst’s concentration of Fe
+2 ions from 0.05 to 0.2 mM resulted in a yield increase from 85.76 to 99%. Although the degradation period significantly decreased, CV’s degradation was almost complete after the first 4 min at the 0.2 mM concentration. This increase in oxidation efficiency may be due to the Fenton reaction’s considerable generation of hydroxyl radicals [
26]. Even at very low concentrations (0.05 mM), Fe
2+ enables the breakdown of a significant portion of the CV (85.76%), showing the reaction’s catalytic nature and the highly significant reactivity of the hydroxyl groups.
Although hydroperoxyl radicals are less powerful than hydroxyl radicals, their effect on the pollutant cannot be neglected [
47,
48].
On the other hand, the Fenton reaction showed a slight decrease in yield above 0.2 mM Fe
+2, which was likely due to a limiting Fe
2+ concentration [
49]. The formation of ferrous iron hydroxides prevents efficiency and stimulates parasitic interactions between ferrous ions and hydroxyl radicals when Fe
2+ exists in excess [
50].
The optimal concentration of Fe+2 ions for maximum CV dye degradation at minimal time was determined to be 0.2 mM, which was used in the remaining oxidation tests.
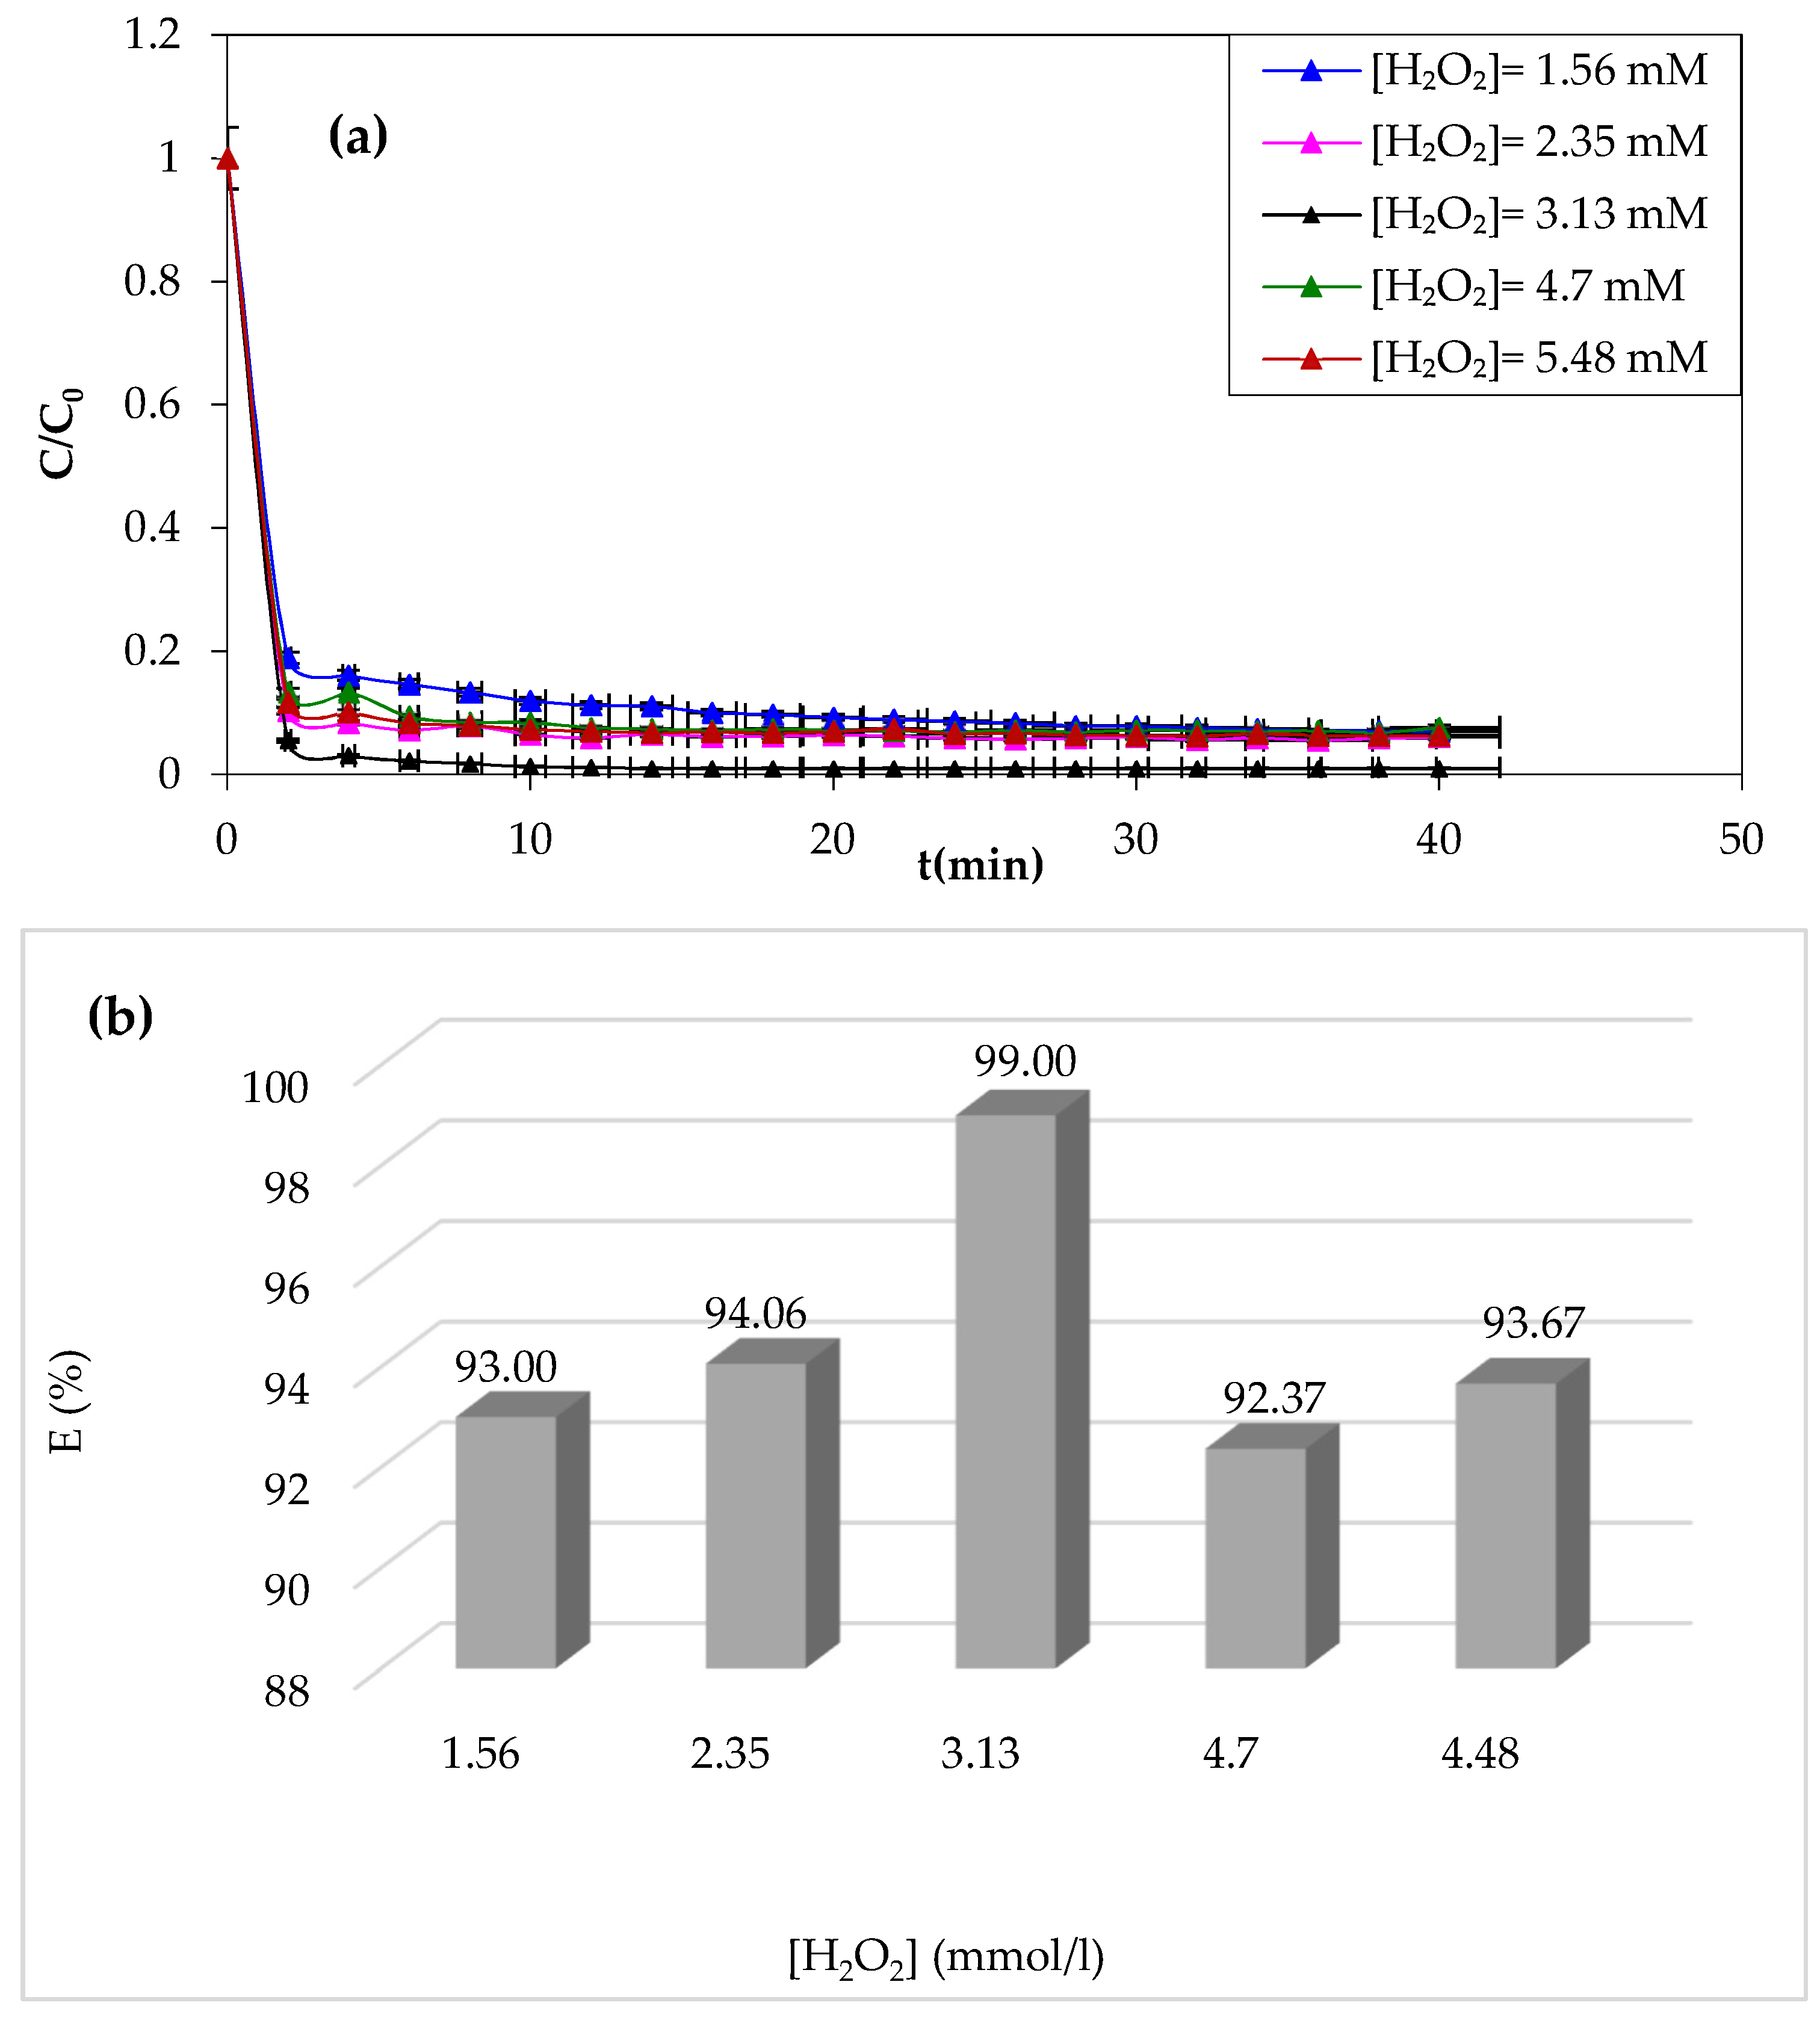
3.1.2. Effect of H2O2 Dose
Hydrogen peroxide is considered as an oxidant in the Fenton process. Its impact on the Fenton process was assessed by varying its concentration from 1.56 to 5.48 mM, as shown in
Figure 3a,b.
According to the results of CV degradation by the Fenton process displayed in
Figure 3, it was observed that at first sight, it appears that the violet crystal’s degradation is accelerated by increasing the H
2O
2 concentration, with significant elimination rates observed in the Fenton process. Meanwhile, a higher concentration beyond 3.13 mM results in a negative effect.
An increased concentration of H
2O
2 results in a rapid generation of hydroxyl radicals (HO
−), which accelerates the degradation of the CV [
51,
52]. Beyond an optimal H
2O
2 concentration of 3.13 mM giving a 99% yield, a decrease in CV degradation was observed. This may be due to the excessive generation of hydroxyl radicals (HO
−). The combination of hydroxyl radicals with CV formed the hydrogen peroxide according to the following reaction:
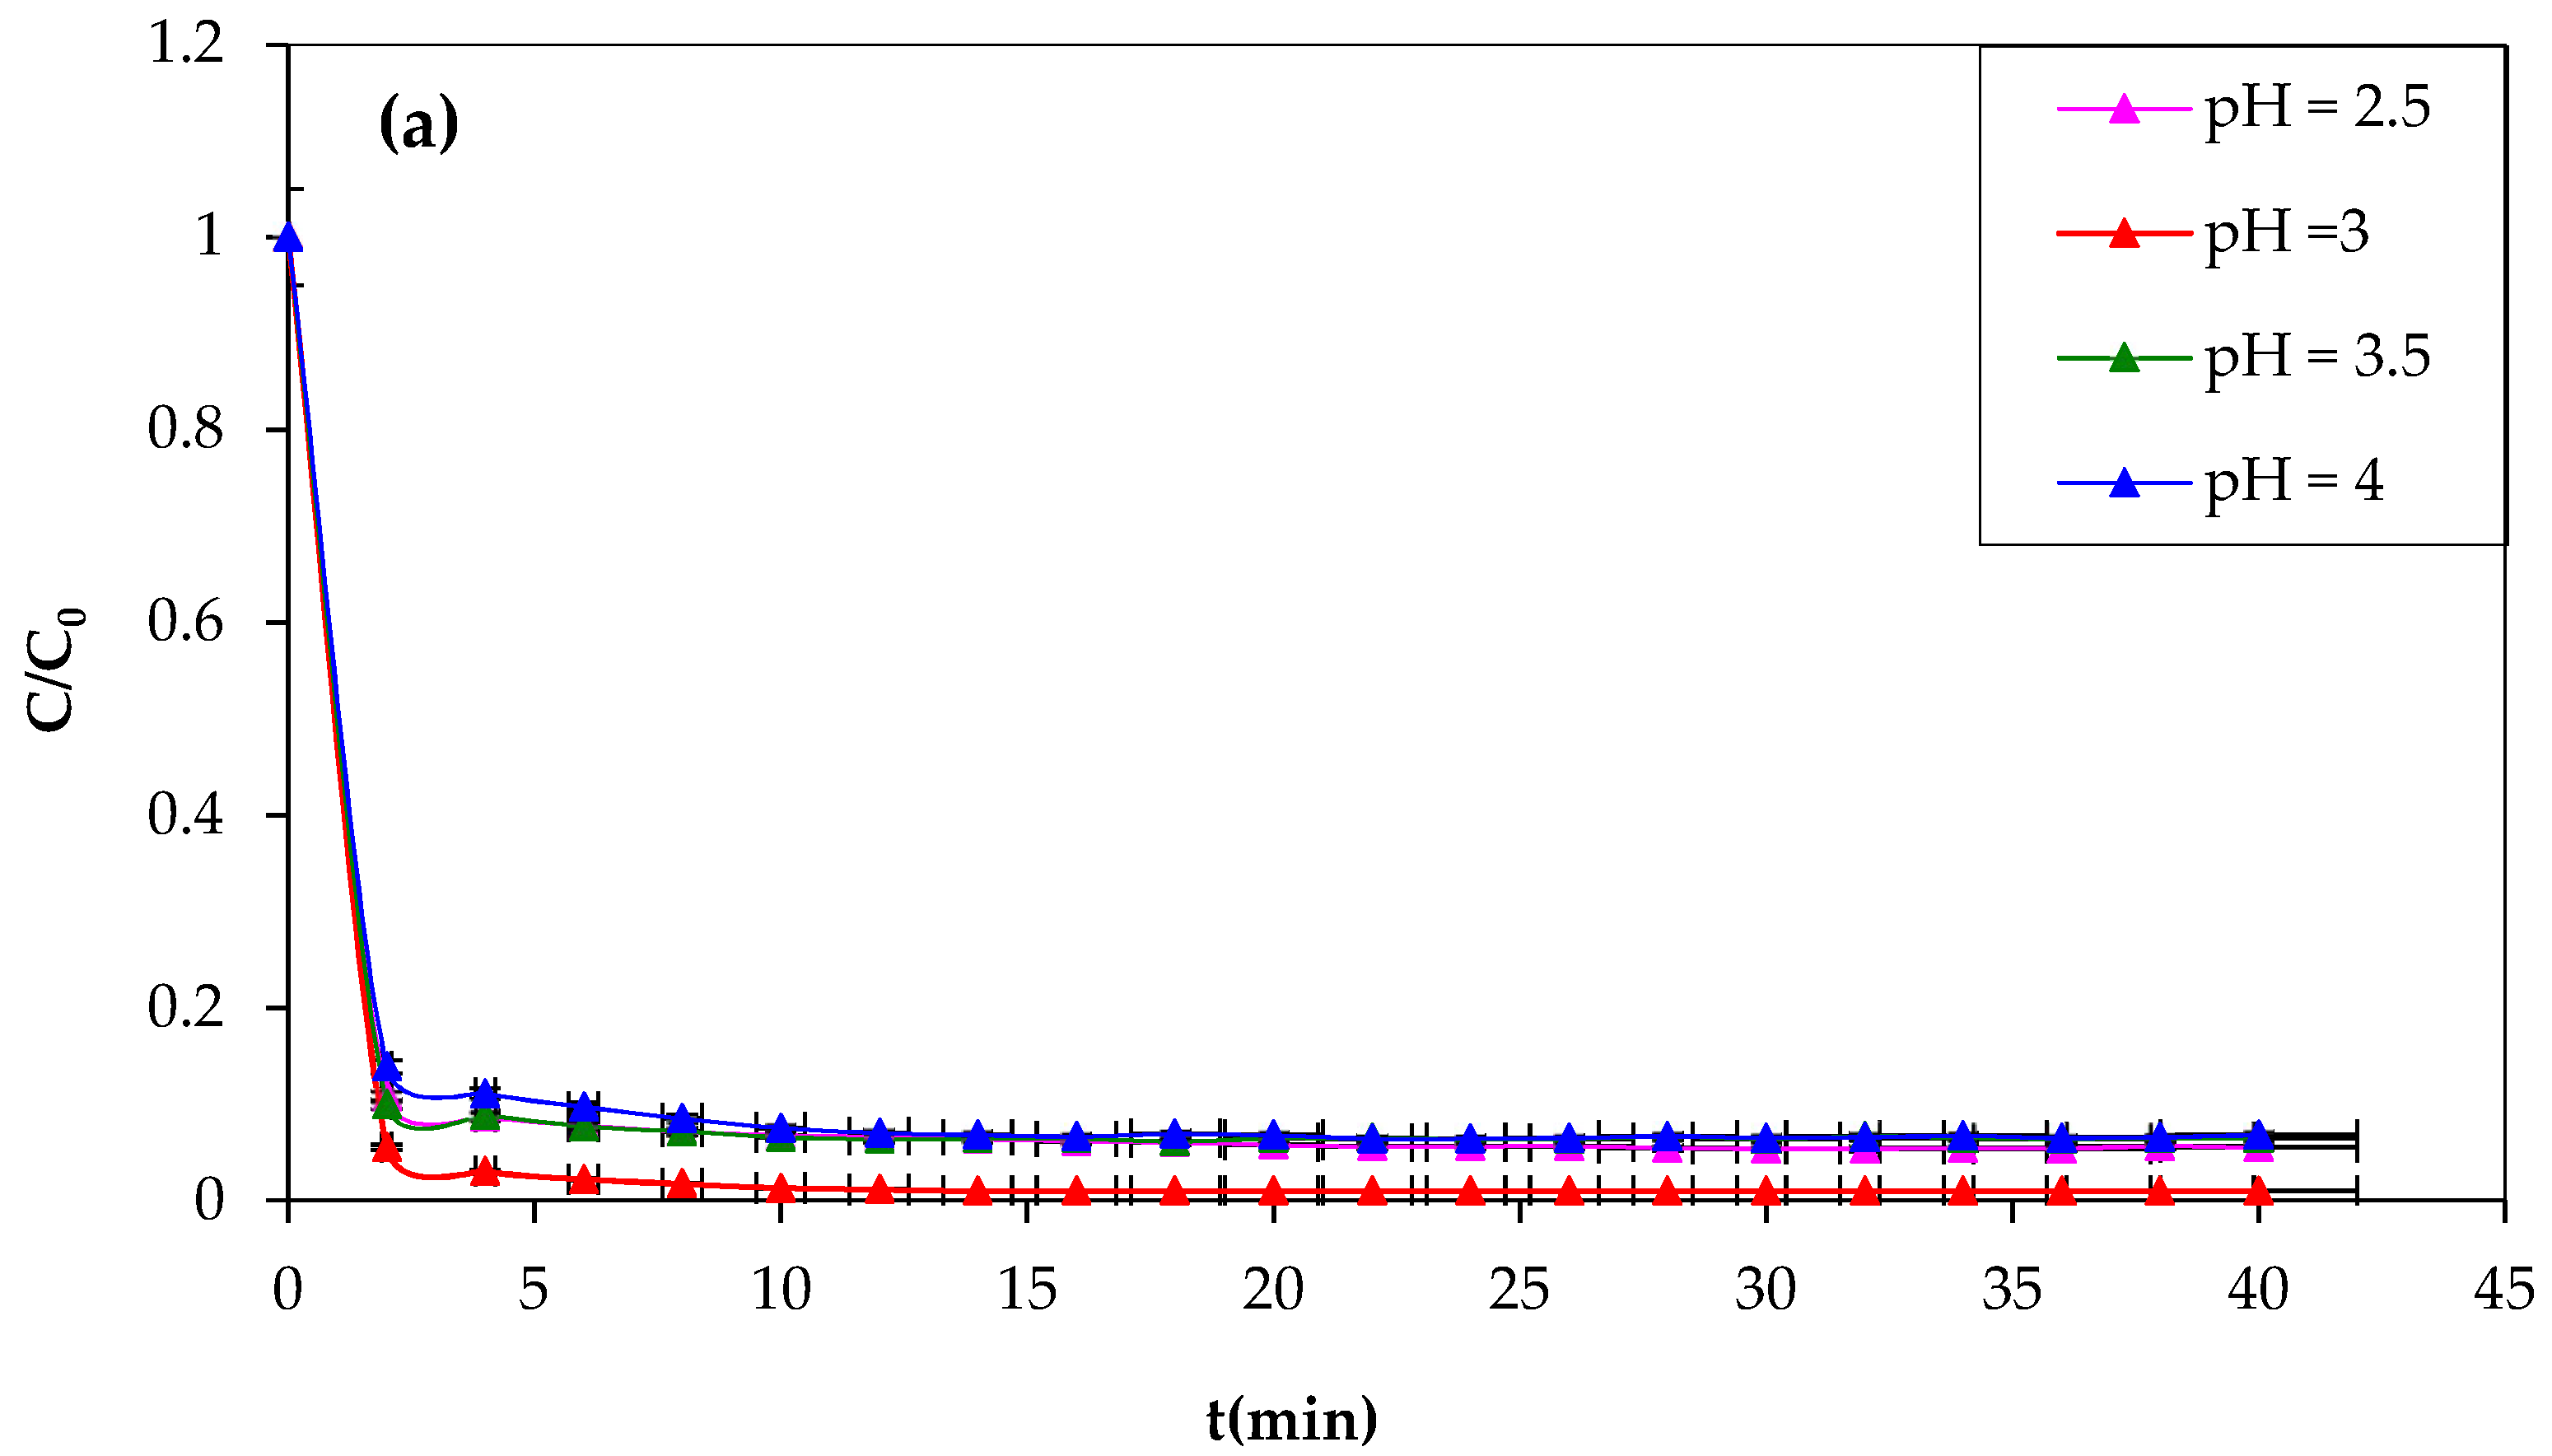
3.1.3. Effect of pH on Fenton Reaction
The pH of the reaction medium significantly influences the oxidation of organic compounds, affecting the behavior of Fe
2+ and H
2O
2 reagents. The study tested the following pH values of 2.5, 3, 3.5, and 4 to illustrate the effect of pH on CV oxidation. The pH value was adjusted with HCl or NaOH, and the values were recorded using a pH meter. The obtained results are illustrated in
Figure 4a,b.
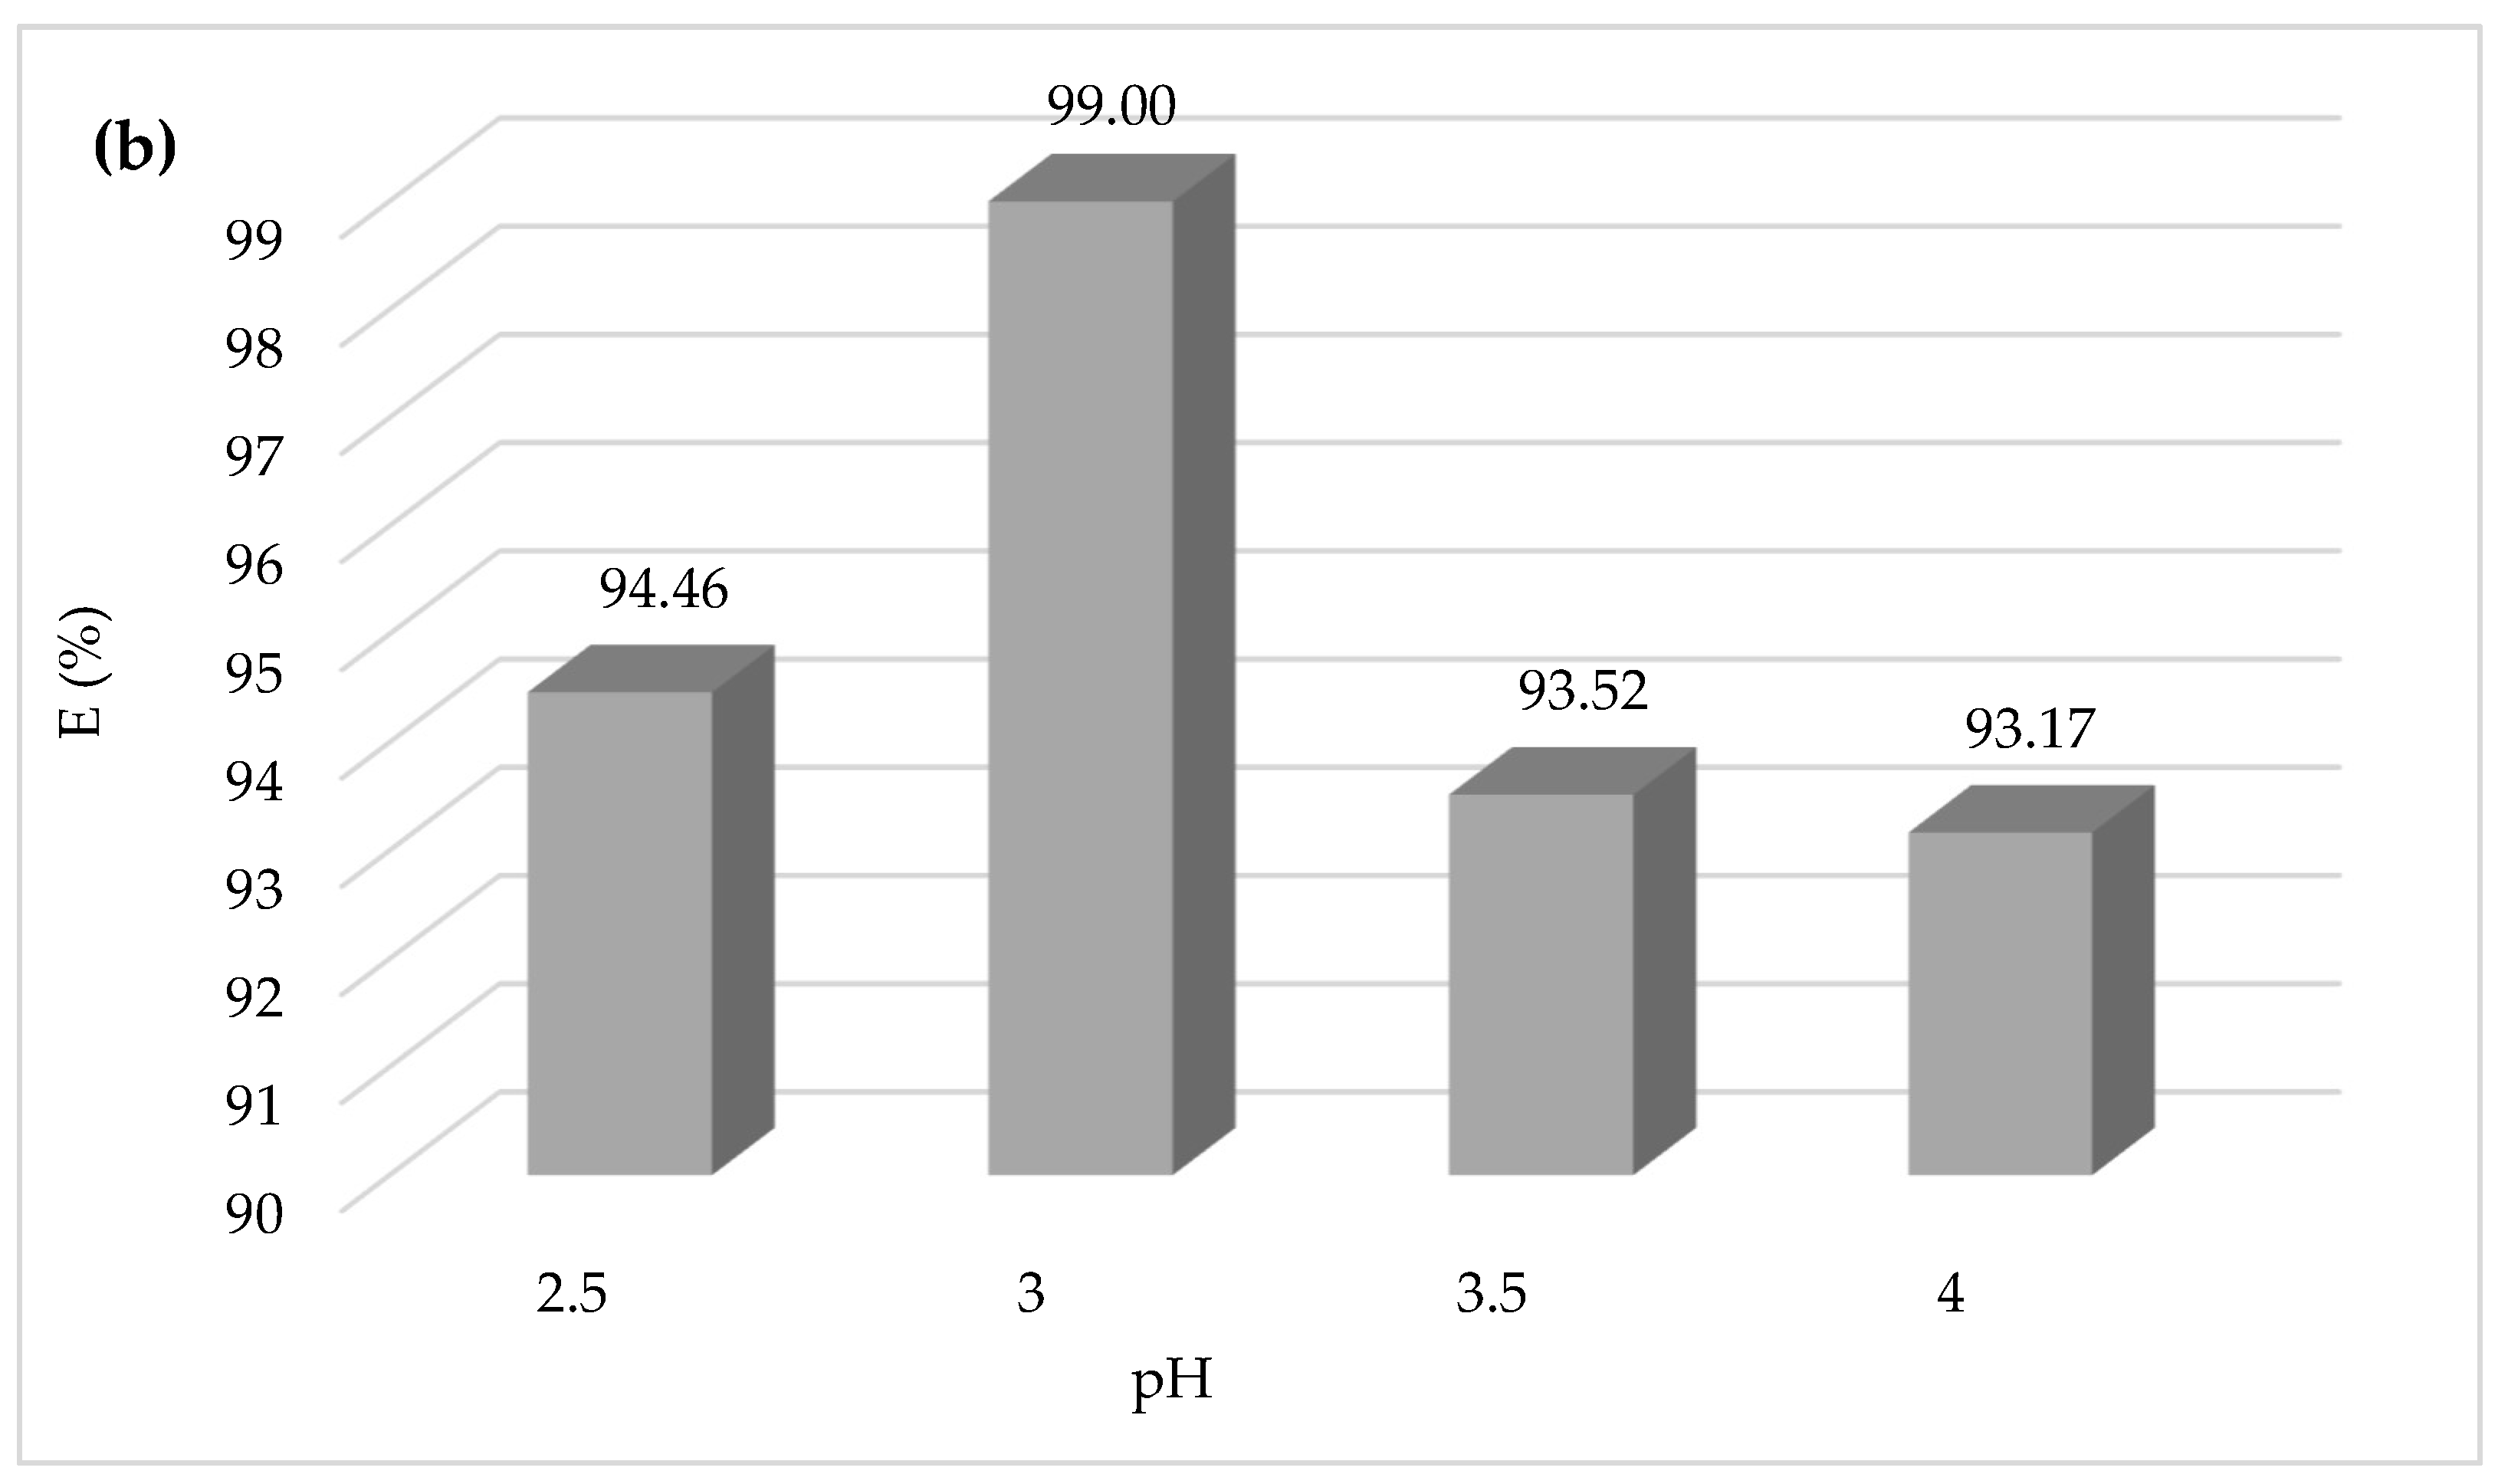
The importance of the effect of pH on the CV dye degradation is described in
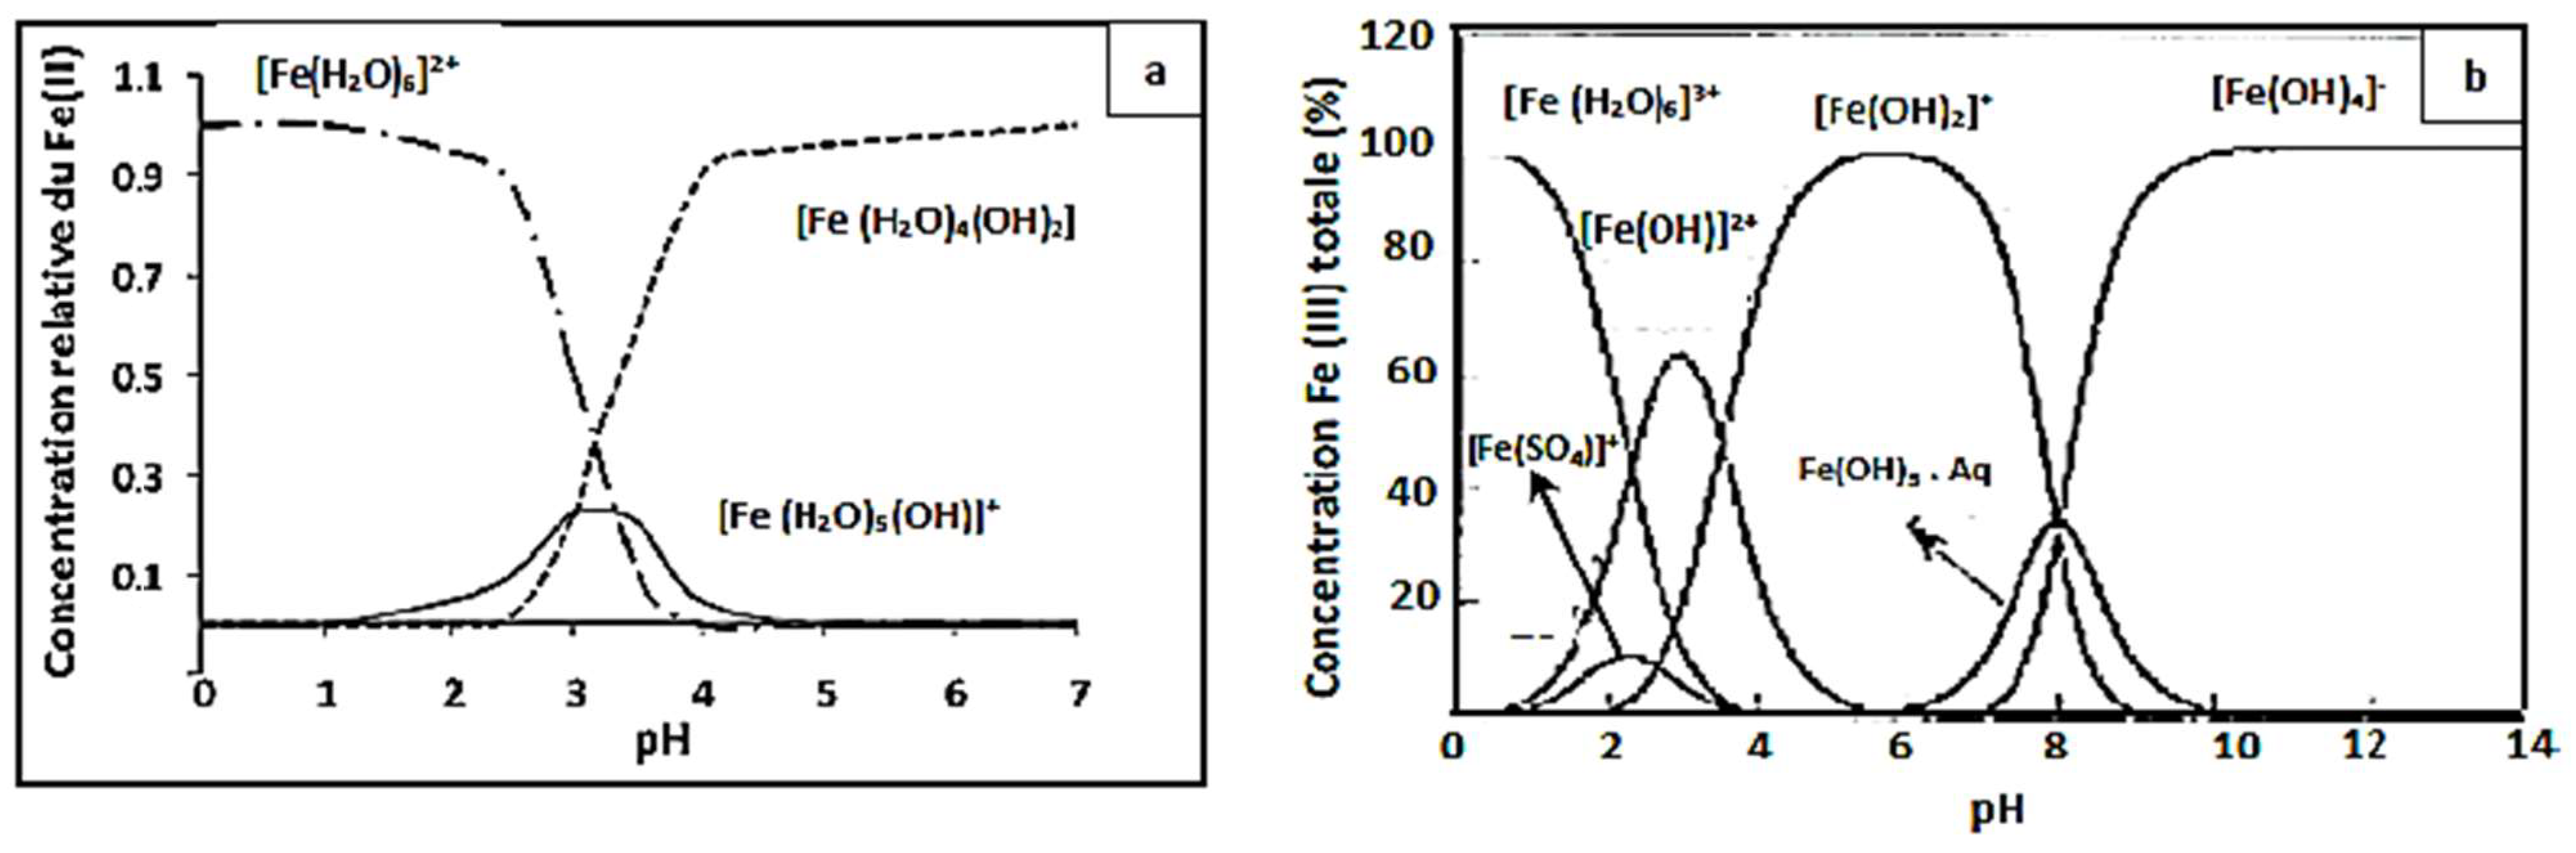
Figure 4, showing that the yield efficiency after 30 min of treatment at a pH of 3.5 and 4 is significantly lower than that at pH 3; the same behavior has been observed at pH 2.5 with a degradation yield of 94%. The higher Fenton degradation of 99% at a pH of 3 indicates that this value can be taken as optimal for the other Fenton experiments. To explain the decrease in yield, one can refer to the speciation diagrams of ferrous and ferric species given in
Figure 4a,b [
53].
At a very acidic pH (pH = 2.5 < 3), the Fenton reaction is inhibited, the amount of hydroxyl radicals that may be generated during the oxidation reaction is insufficient, and the CV dye easily forms a flocs [
54,
55]. The lower efficiency at pH 2.5 is probably due to reduced soluble iron ions, which form complexes [Fe(H
2O) 6]
2+ and [Fe(H
2O) 6]
3+ (
Figure 5). Consequently, they react very slowly with hydrogen peroxide [
56].
Protons inhibit dye degradation by consuming hydroxyl radicals, and ferric ions precipitate at high pH, resulting in the optimal pH for CV dye degradation by Fenton processes being 3. The decrease in oxidation rate at pH > 3 could be explained by the formation of Fe(OH)
3, which has lower catalytic activity in the decomposition of H
2O
2 [
57]. However, this investigation study demonstrates that the pH value for the most effective oxidation of CV is approximately 3. The results closely agreed with those in the literature [
58]. Lu et al. found the same optimum pH value of 3 of Safranine oxidation using the classic Fenton’s reagent [
59]. Another study found that the optimum pH of dichlorvos oxidation using Fenton’s reagent was between 3 and 4. In this investigation, they confirmed that the rate of oxidation decreased when the solution pH was 2.5. Additionally, at a very low pH, the reaction of Fe
3+ with H
2O
2 was inhibited [
60], and
•OH was scavenged by H
+ [
61].
3.1.4. Effect of Acid Nature
In this study, we examined the effect of acid nature in the Fenton process, which can affect CV dye degradation efficiency [
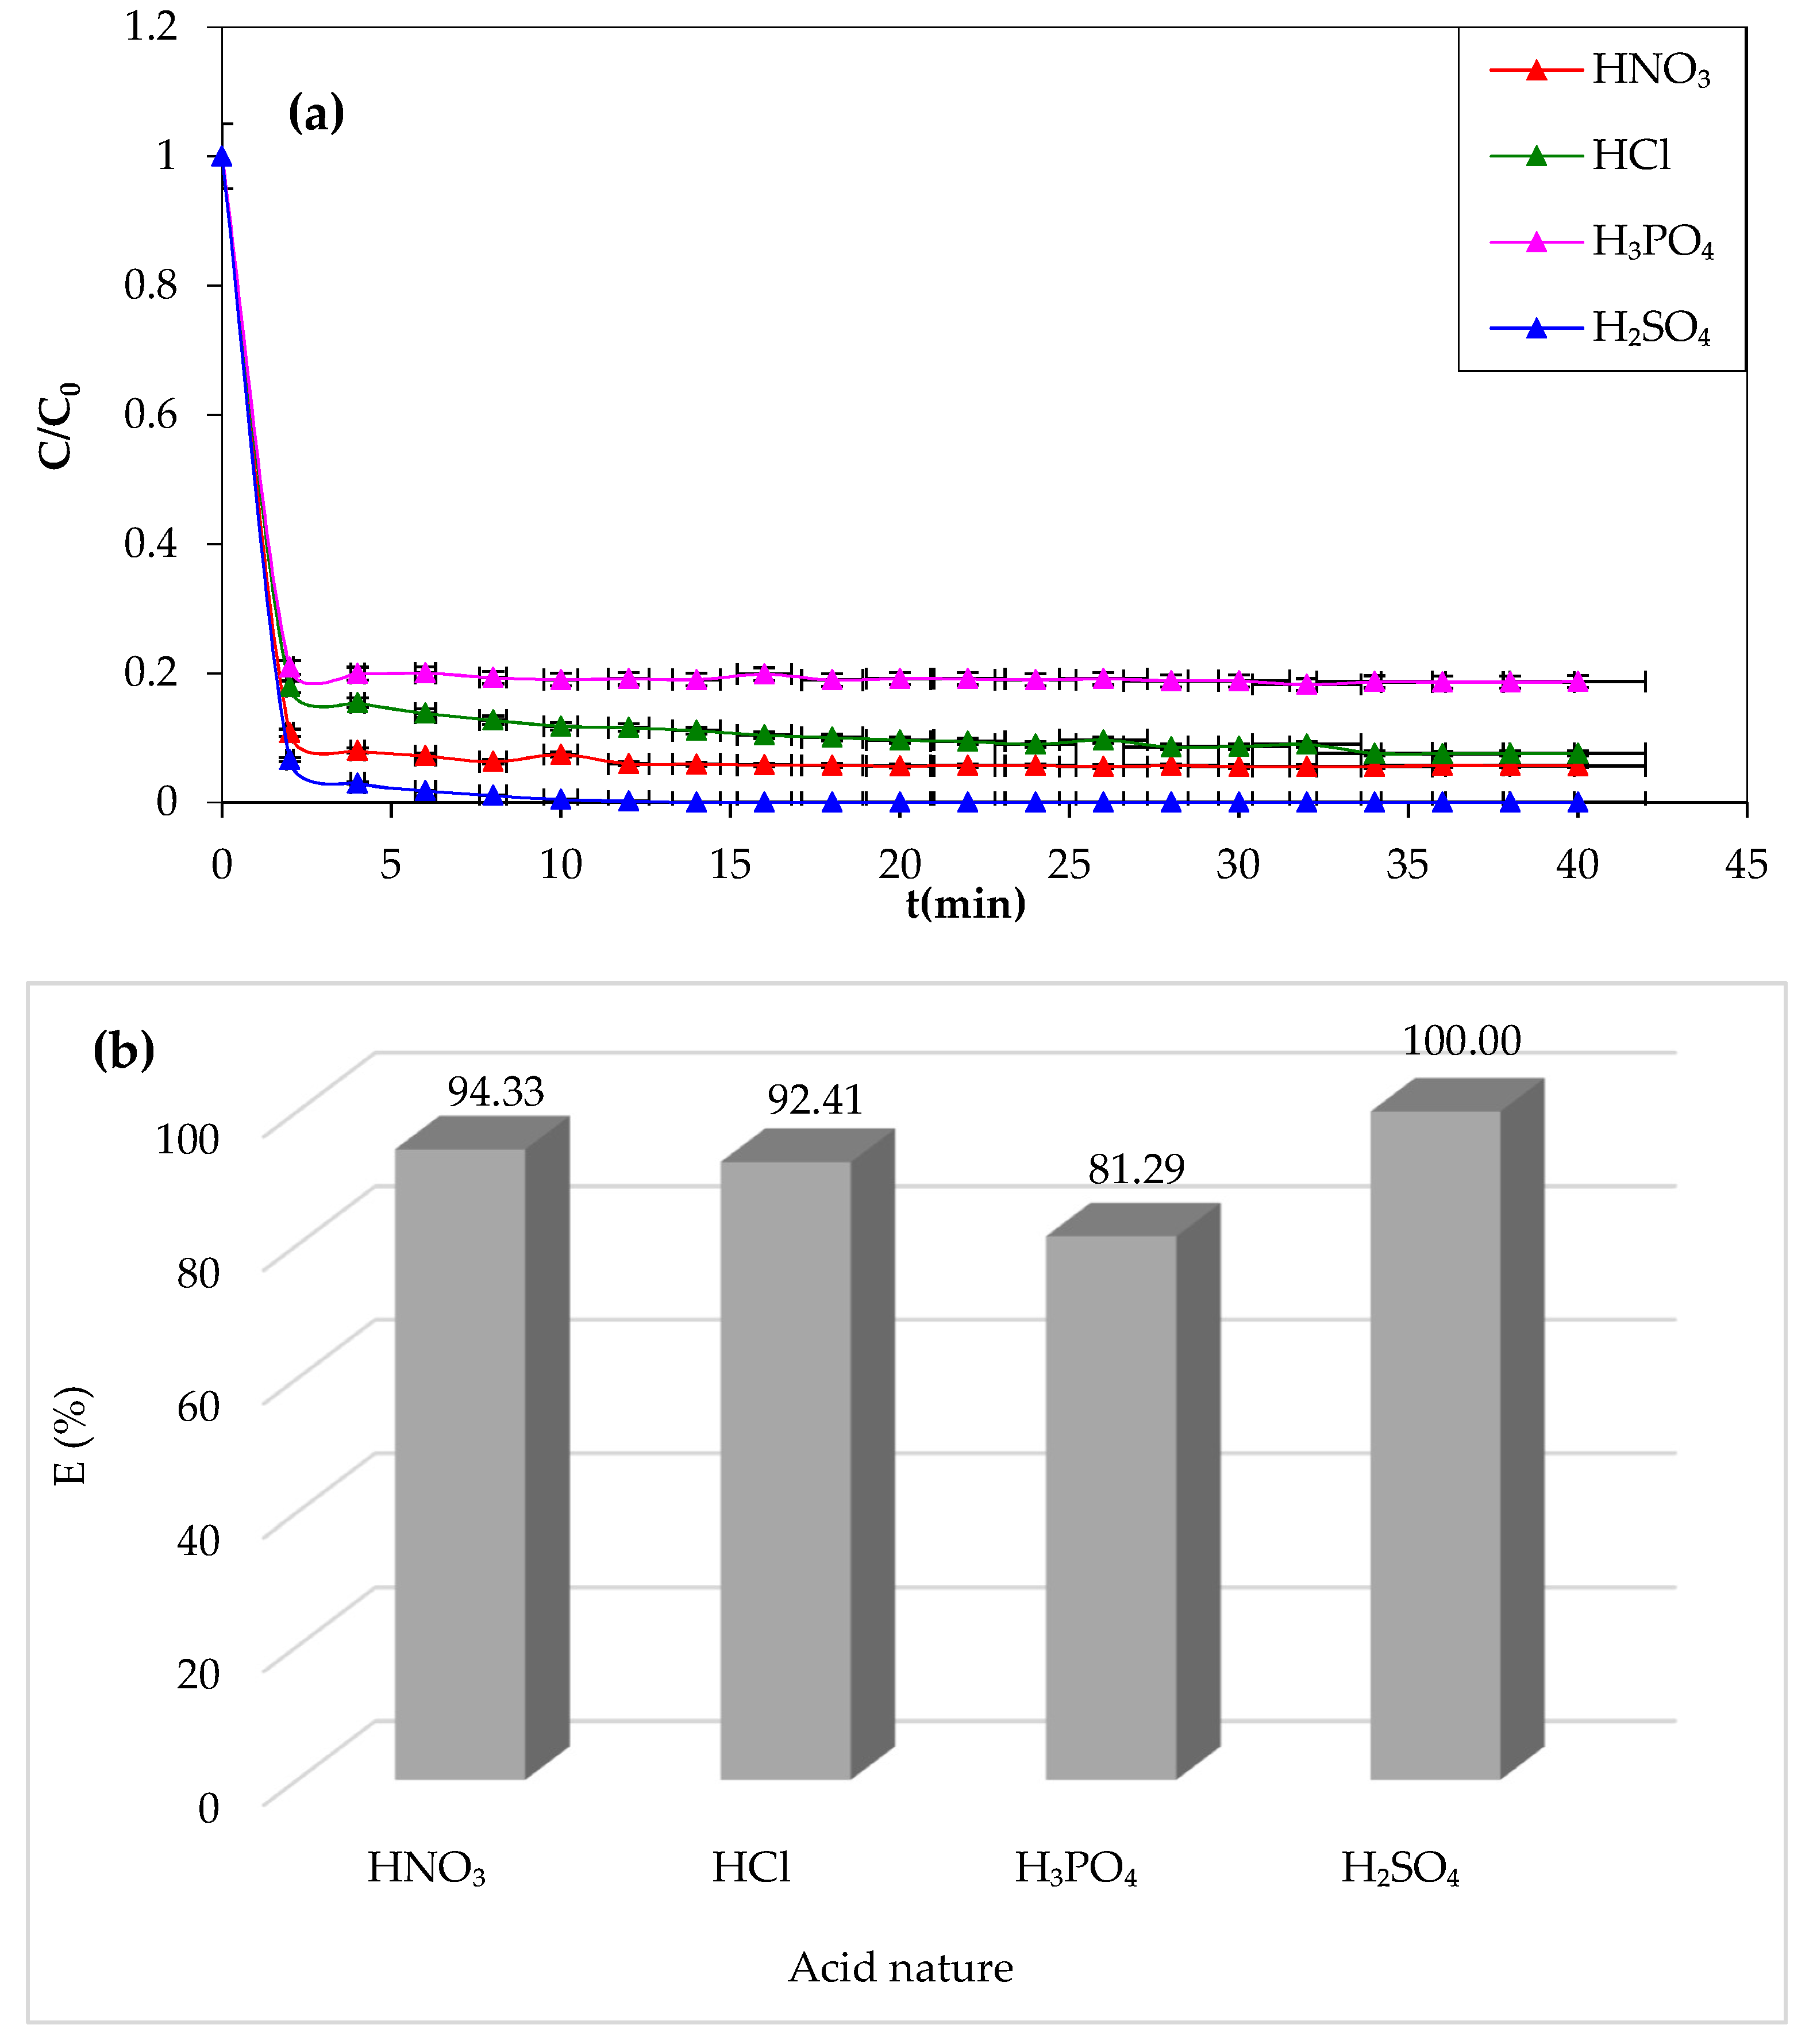
62]. Hence, different types of acids have been tested at the optimum pH of the medium. The acids tested are sulfuric acid, nitric acid, hydrochloric acid, and phosphoric acid. The data of the experimental results obtained are shown in
Figure 6a,b.
Figure 6
demonstrates that sulfuric acid is the most effective chemical agent for CV
removal (100%). However, a lower yield of degradation (81.29%) is obtained in
the presence of phosphoric acid. The oxidation yield of the dye improves with
different acids in the following sequence: phosphoric acid, hydrochloric acid,
nitric acid, and finally sulfuric acid. From this experimental attempt, it can
be concluded that sulfuric acid is the best chemical agent to adjust the pH of
the solution and favor the Fenton degradation process.
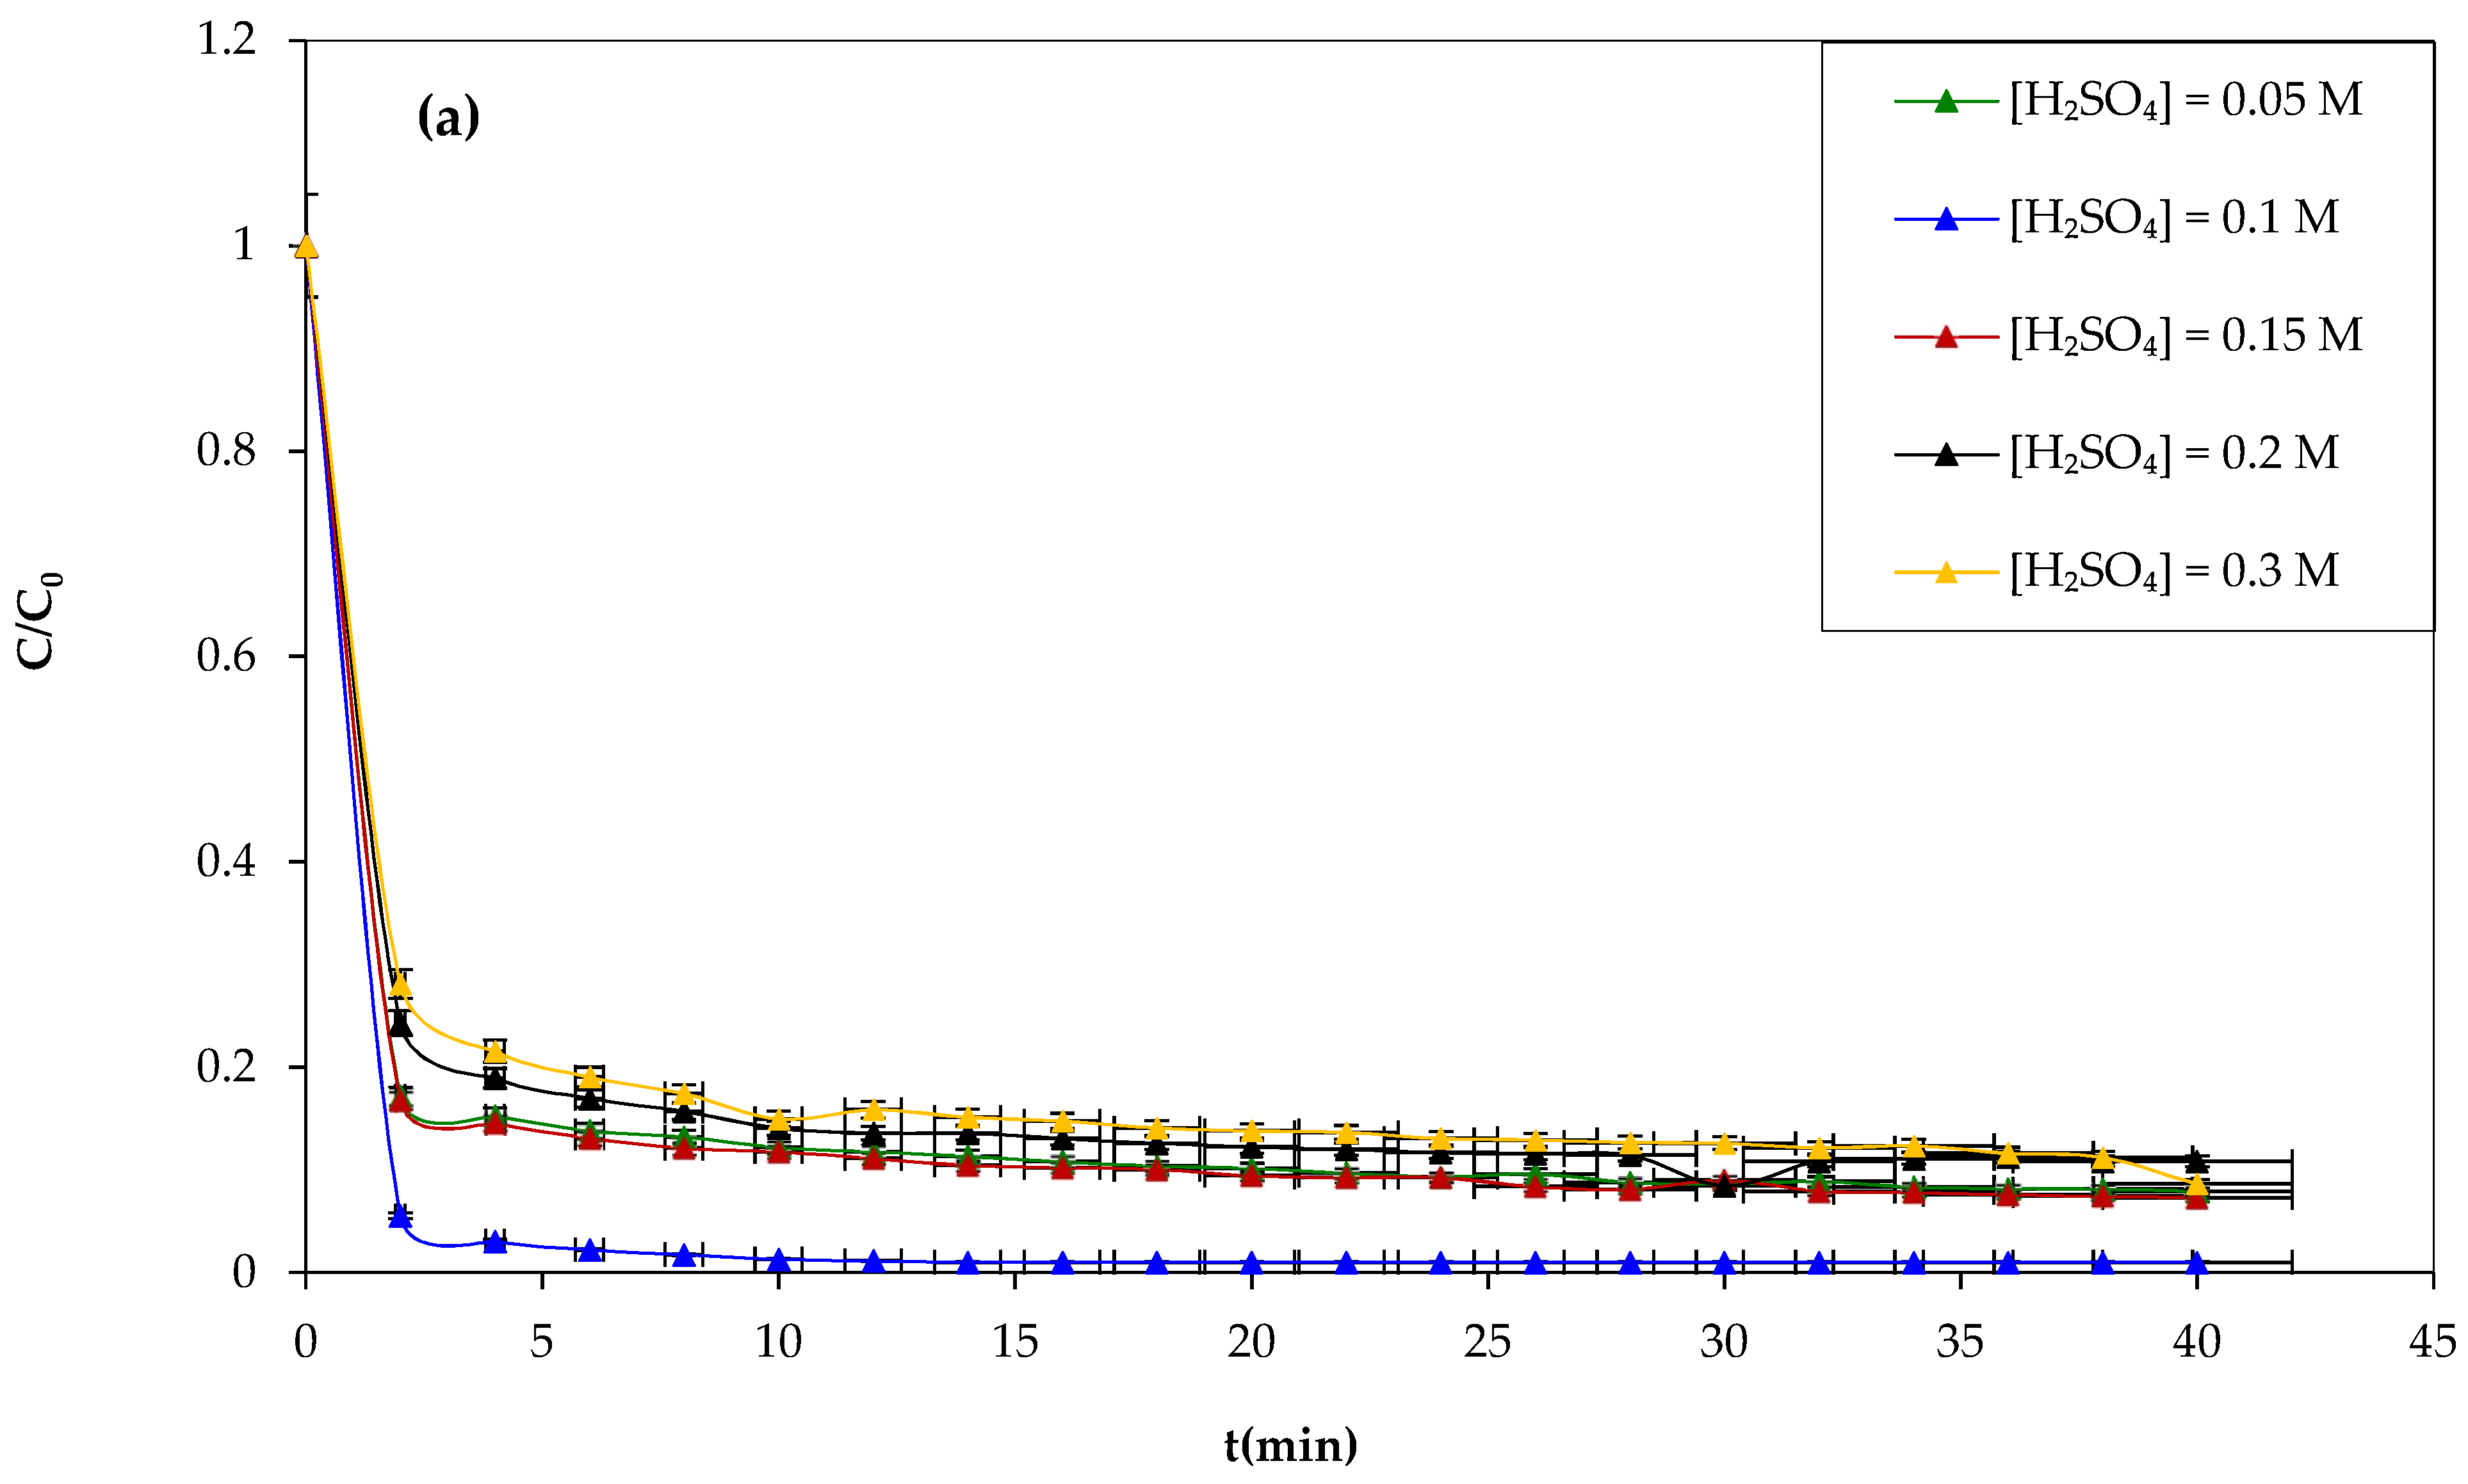
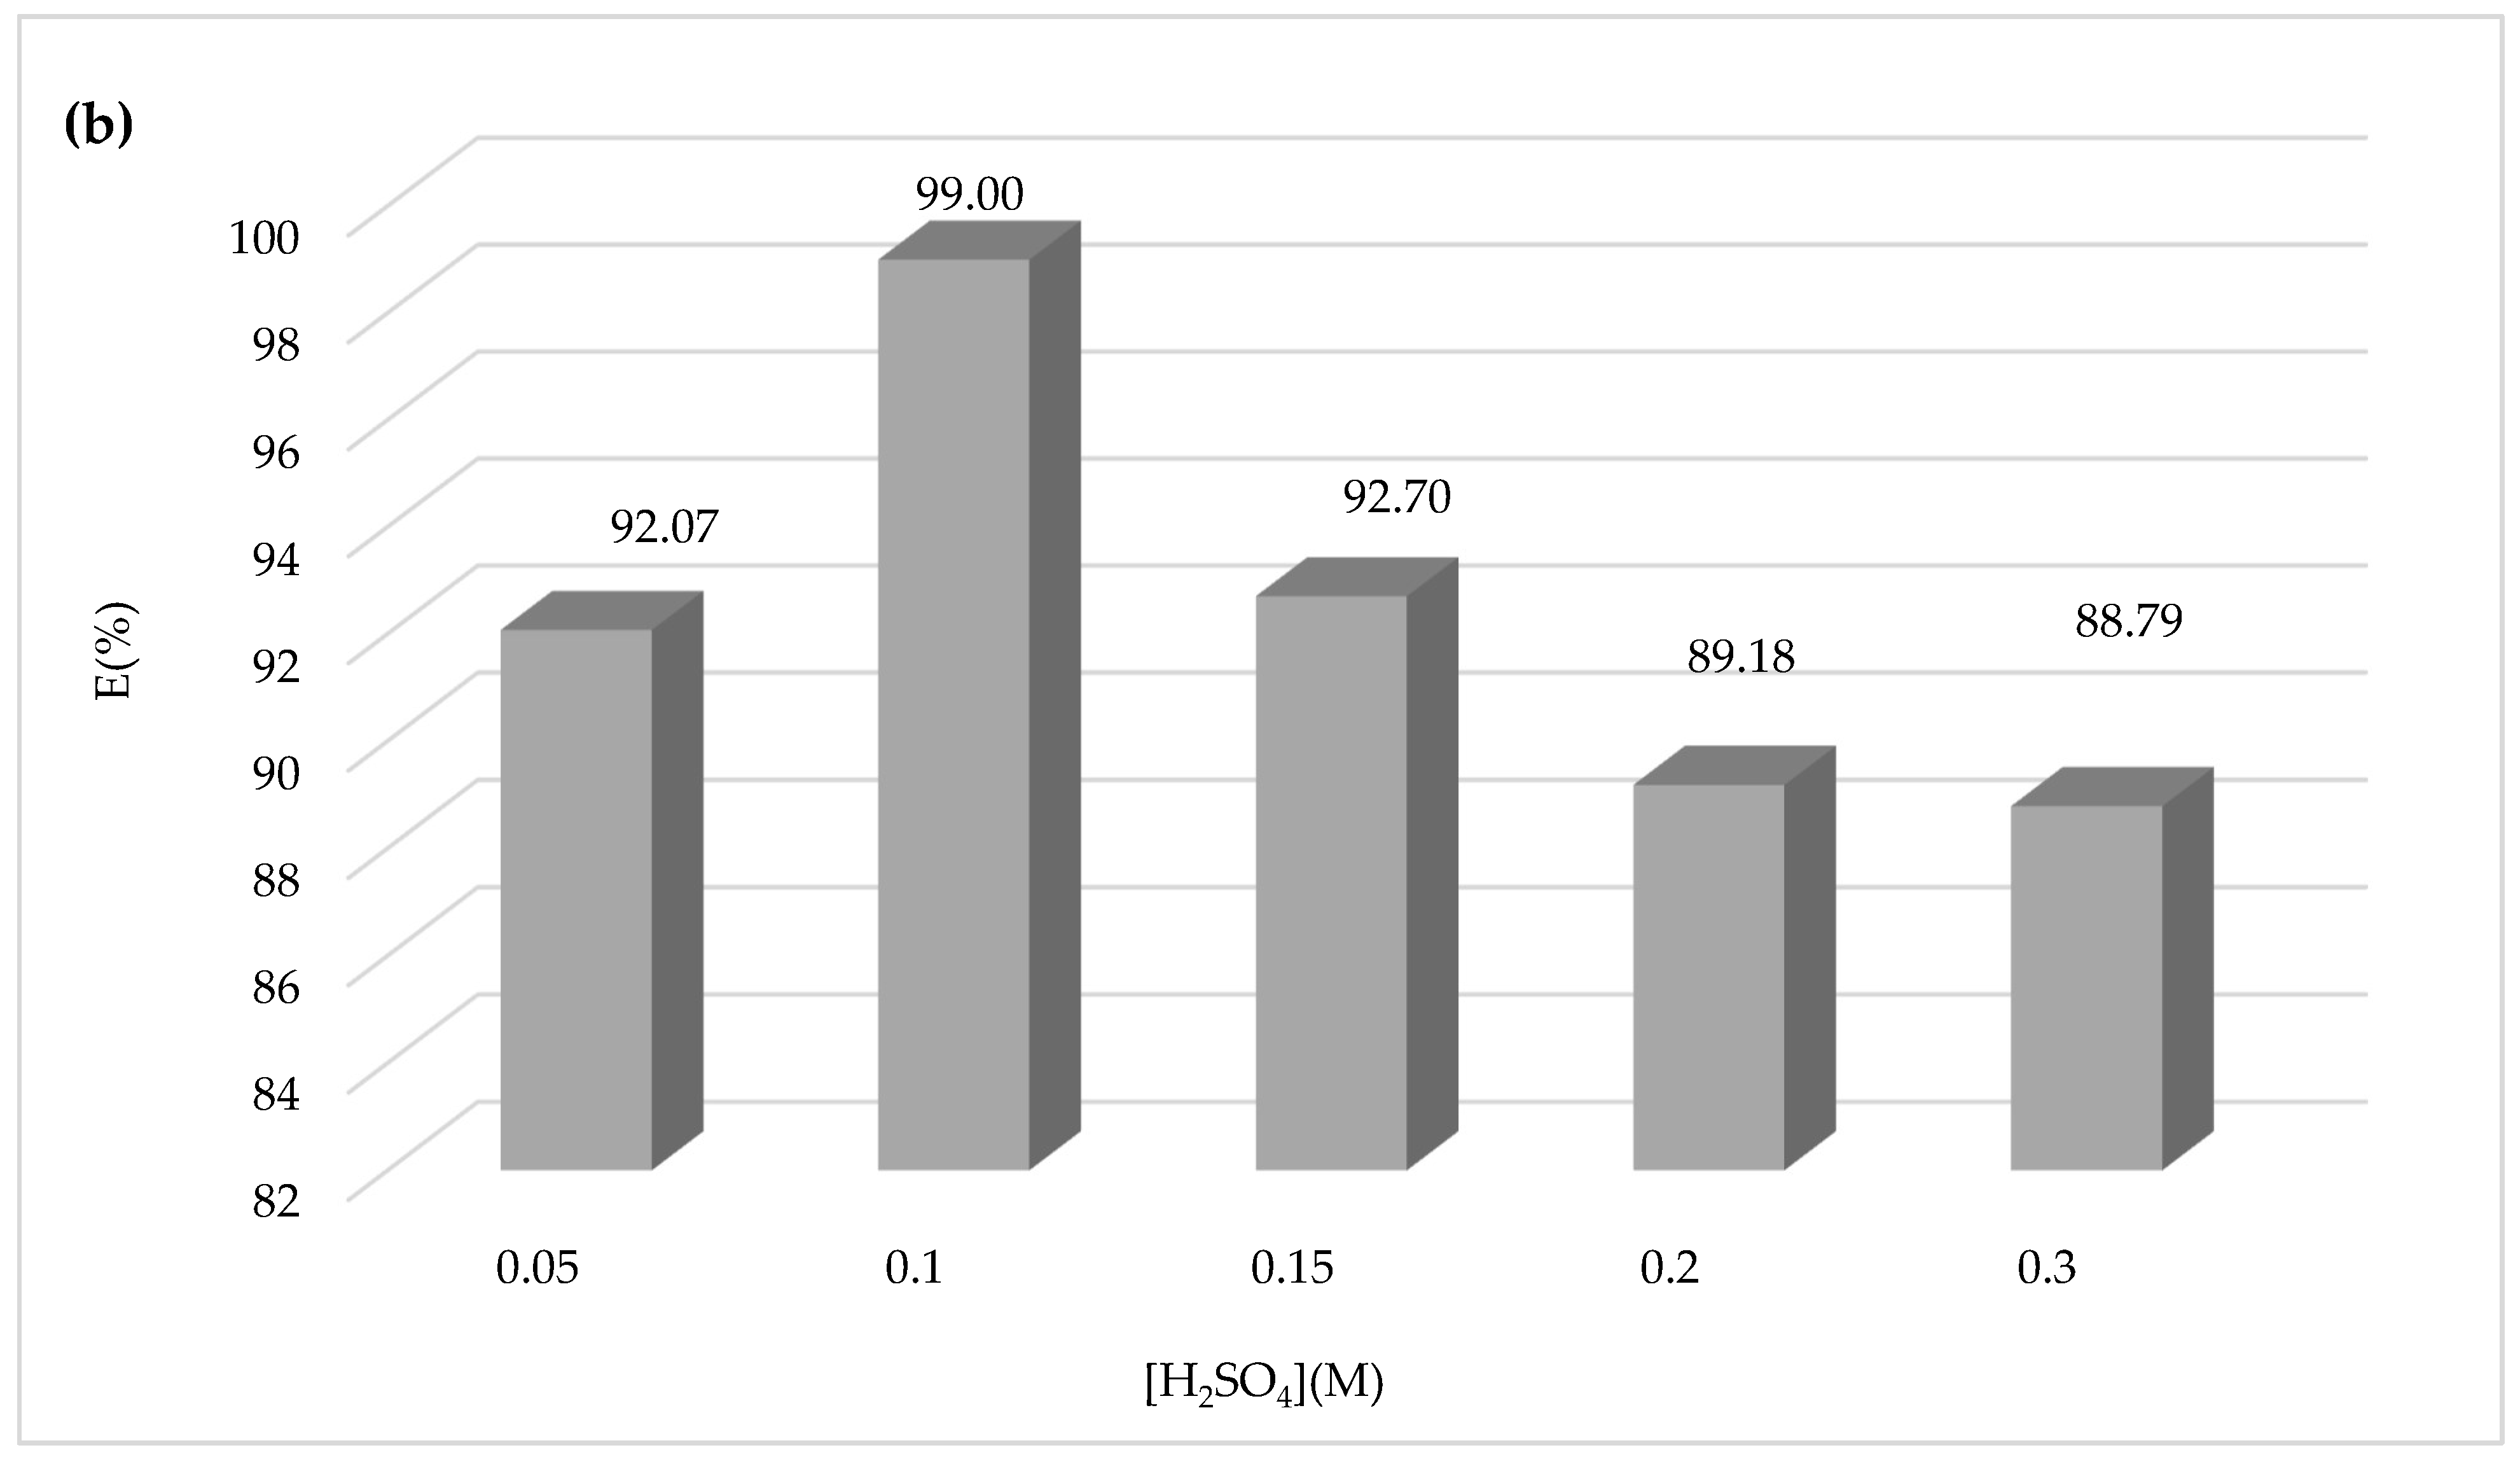
3.1.5. Effect of Acid Concentration
Another attempt was made to study the influence of the sulfuric acid concentration on the Fenton process and the degradation of CV dye using sulfuric acid at different concentrations of 0.05, 0.1, 0.15, 0.2, and 0.3 M during 30 min of the experiment, and the results obtained are shown in
Figure 7.
Figure 7a,b show that increasing the concentration of sulfuric acid above 0.1 M has negative effects on the yield of CV dye oxidation by the Fenton mechanism. Therefore, the optimum sulfuric acid concentration chosen is 0.1 M.
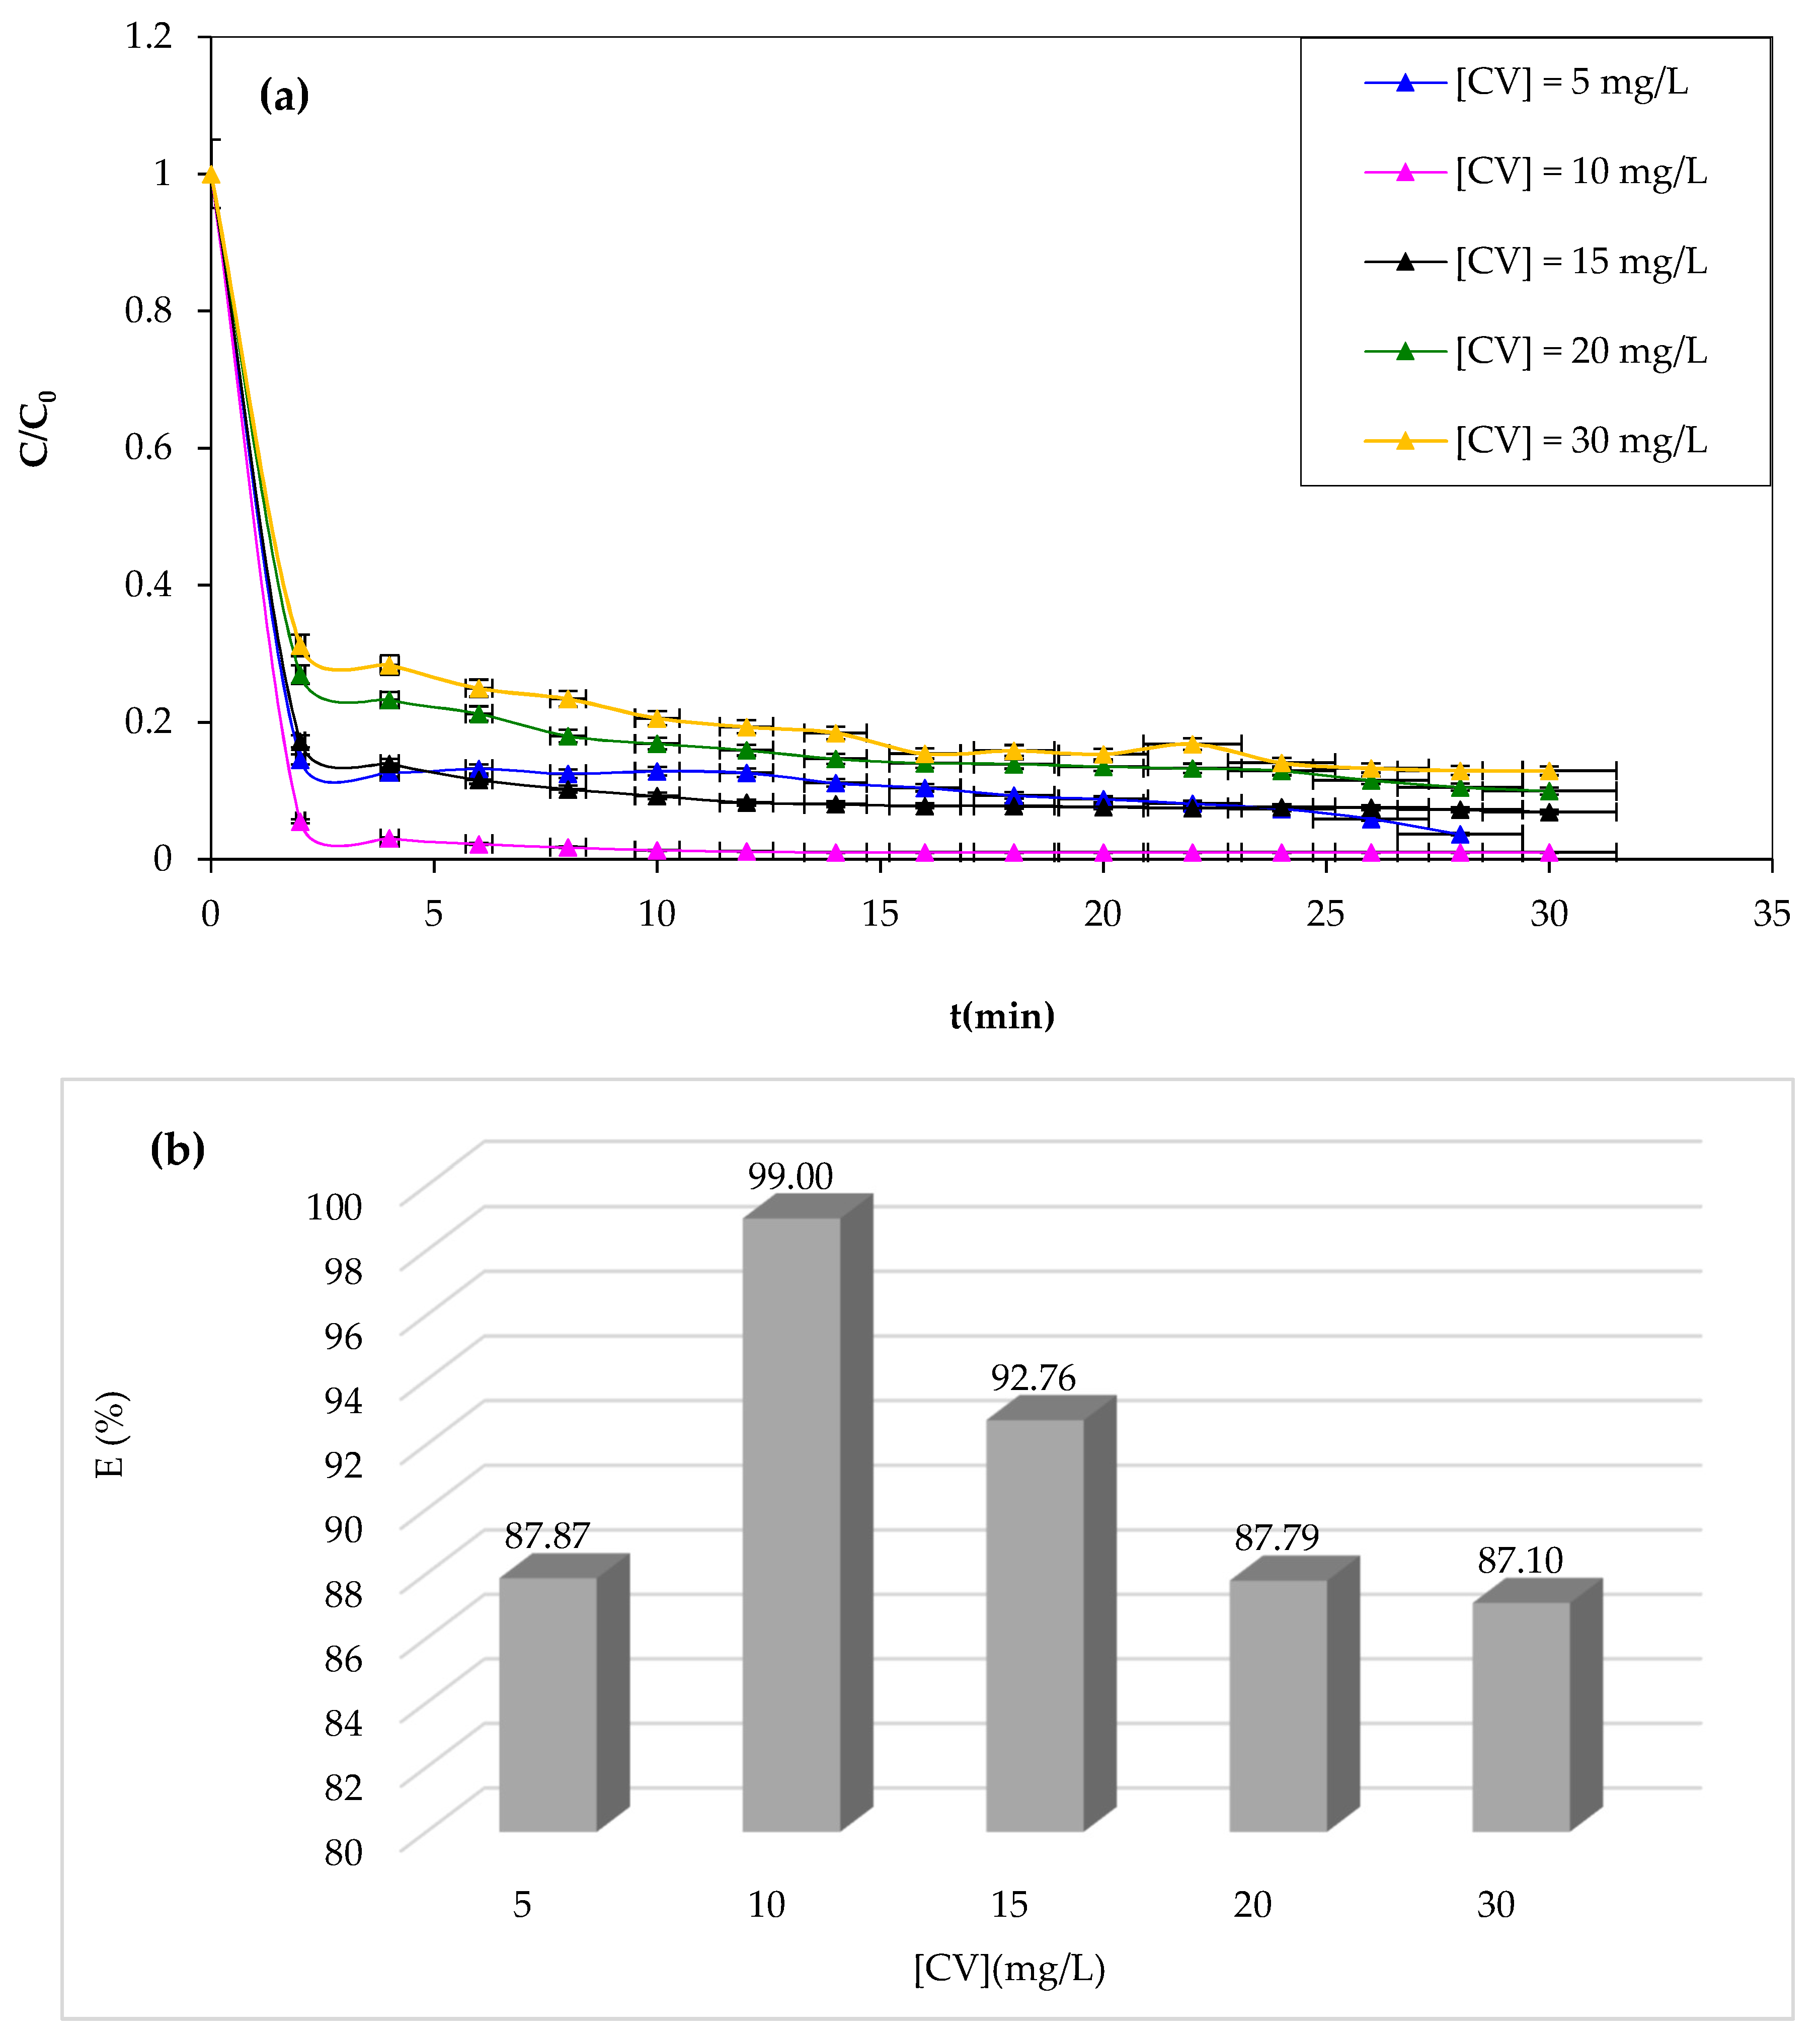
3.1.6. Effect of Initial CV Concentration
The Fenton process is typically effective at low concentrations. Therefore, this work investigated the effect of the initial CV dye concentration as an important parameter in practical applications [
63]. The study examined the degradation of the CV solution at various initial dye concentrations while maintaining optimal operating conditions determined before as constant. The results of CV degradation are shown in
Figure 8.
From
Figure 8a,b, it should be noted that the study reveals that increasing the CV concentration negatively impacts the Fenton process degradation performance, as the catalyst and oxidant amount remain constant, resulting in a decrease in hydroxyl radicals and increased CV dye molecules. Likewise, at a concentration of 10 mg/L, complete degradation is achieved after 30 min of reaction. This obtained data can be due to the increase in concentration enhancing the interaction between the dye and
•OH [
64]. It is well known that an increase in the initial concentration of CV dye results in a corresponding rise in the dye molecules, but the number of hydroxyl radicals remains unaffected. Consequently, the degradation yield exhibits a decrease as the original dye concentration increases.
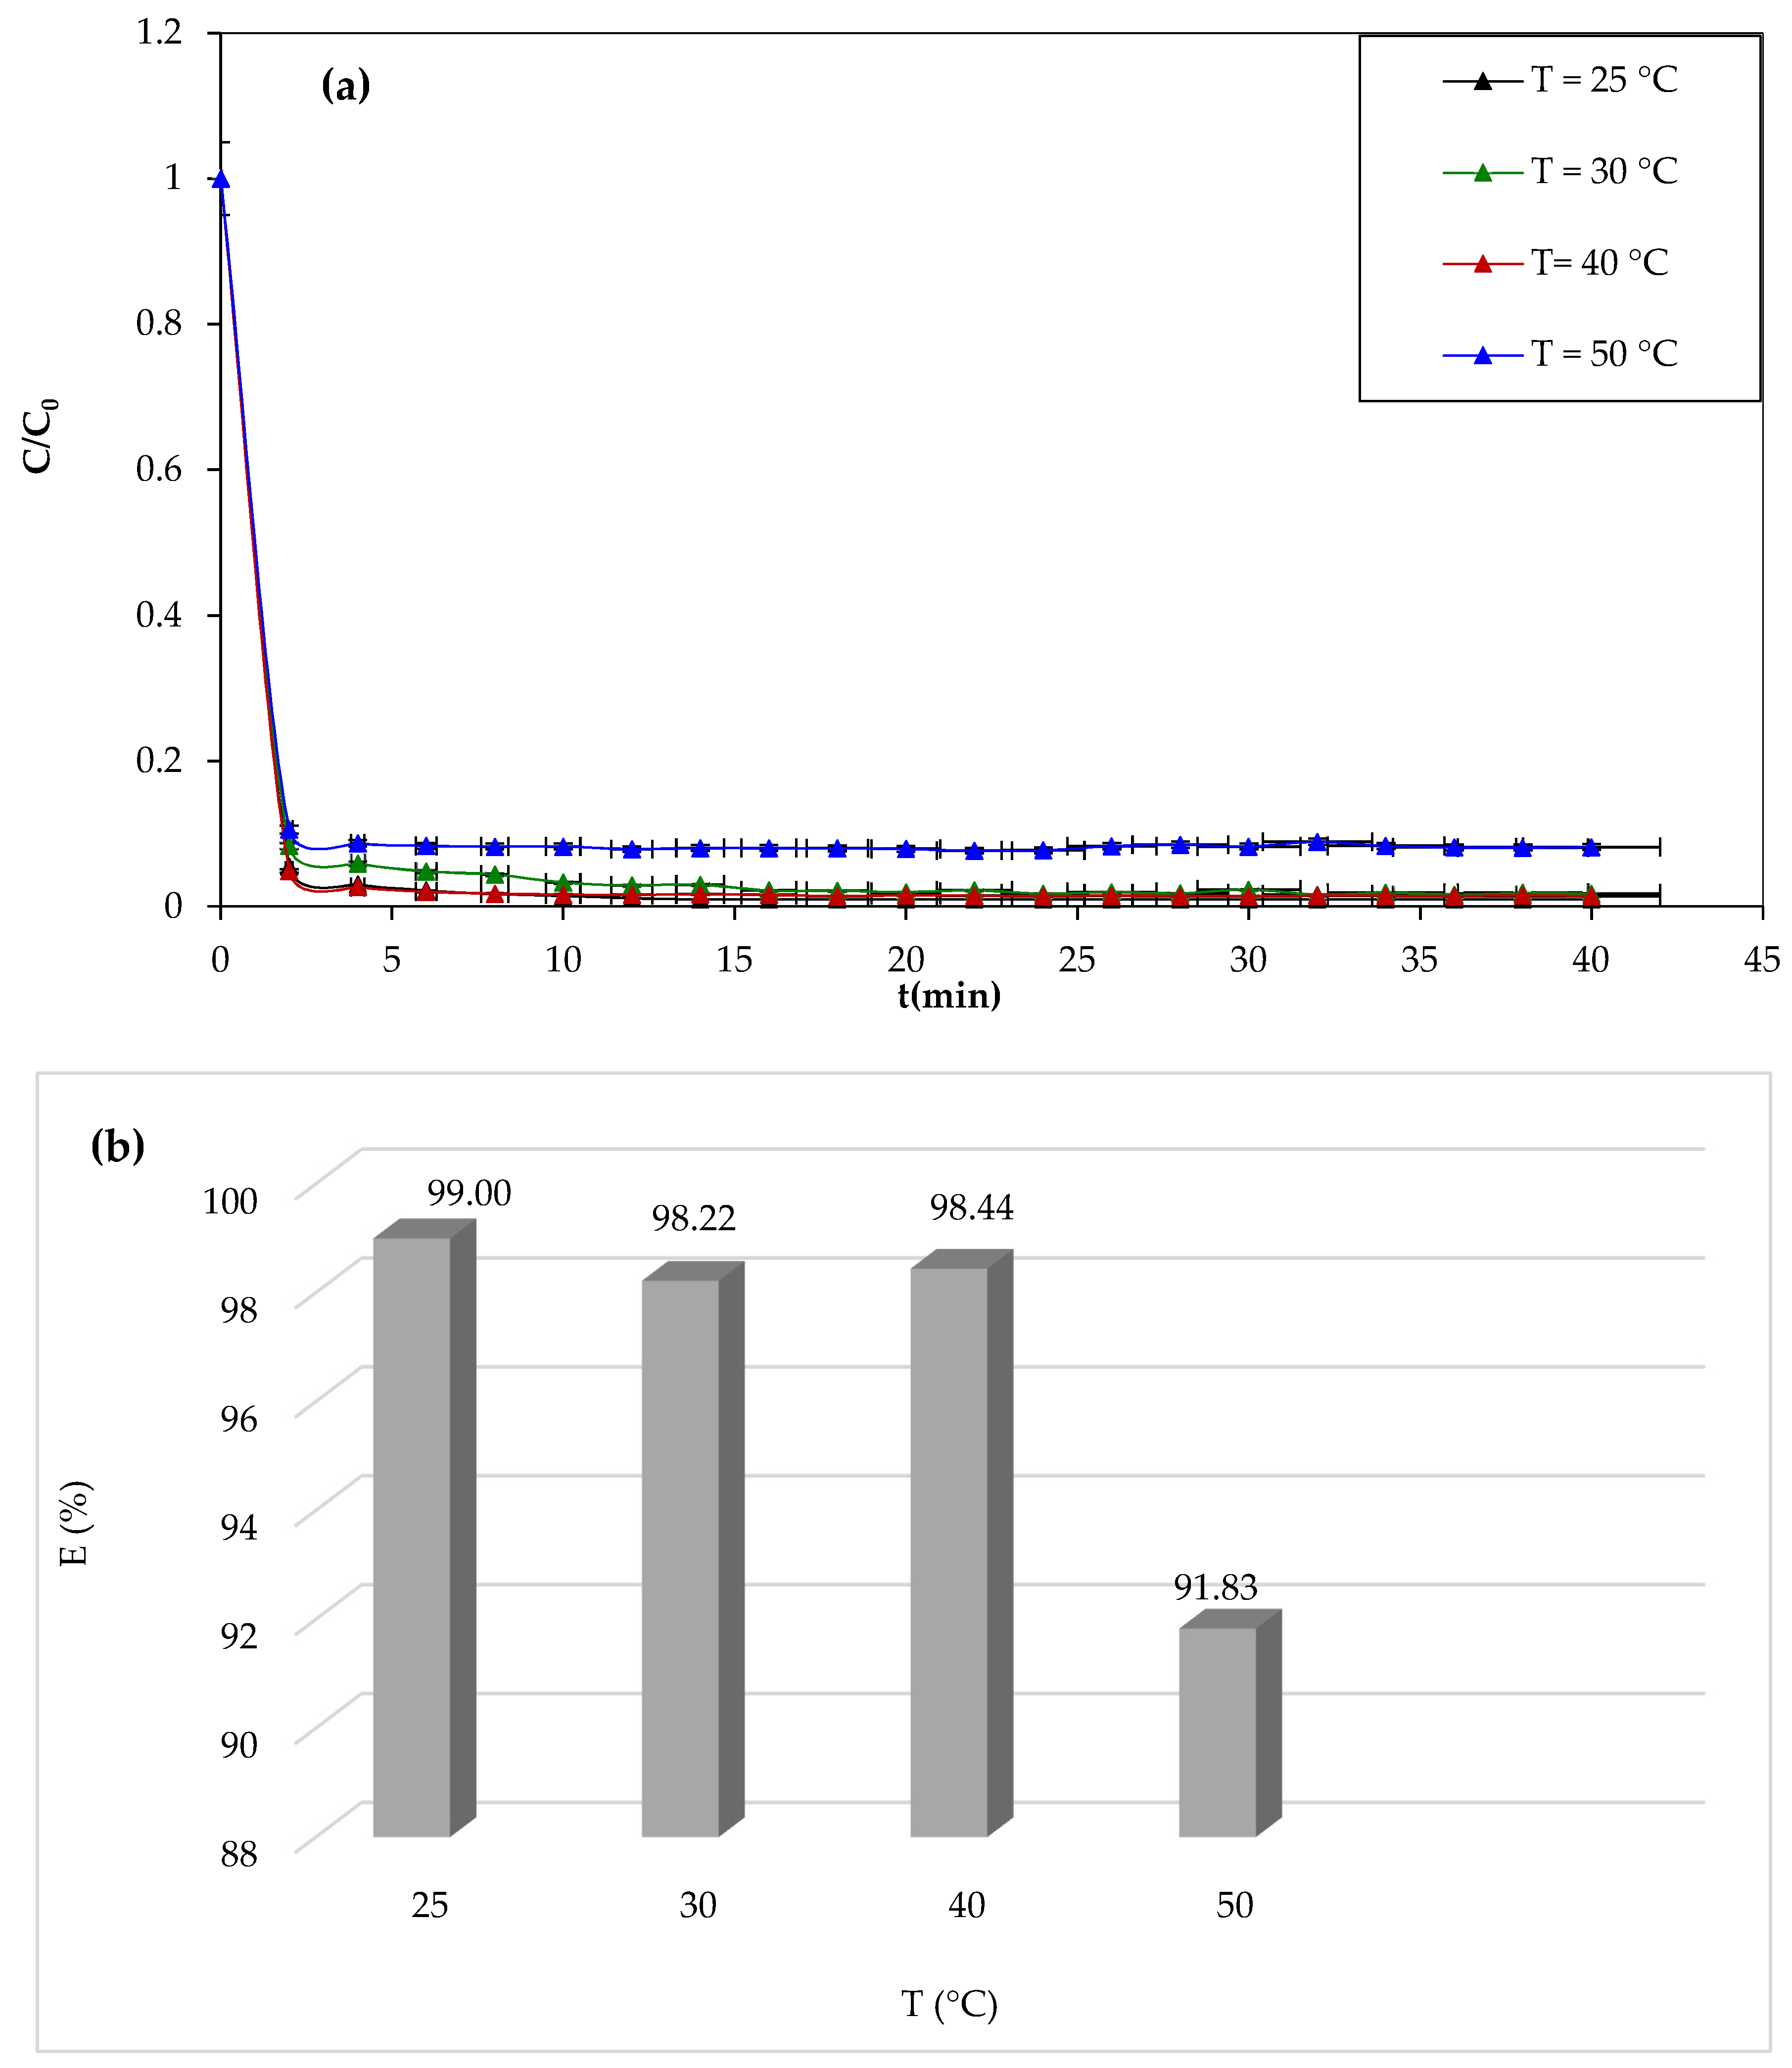
3.1.7. Effect of Temperature
One of the most important parameters affecting the efficiency of dye degradation by the Fenton process is the temperature of the reaction medium. We have studied the discoloration of the 10 mg/L solution of CV for 30 min for different temperatures (25 °C, 30 °C, 40 °C, and 50 °C), and the results of the study are shown in
Figure 9.
From
Figure 9a,b, it can be seen that the temperature has negative effects on the degradation of the CV dye. After 30 min of reaction, the yield decreases from 98.99% to 91.82%. The results obtained in this study are not in agreement with other works. Most reported works show a positive effect of the temperature. Similar results were obtained by Mohamaddine El Hadadi et al. [
65]. The negative effect of temperature is due to the fact that the concentration of oxygen in the solution decreases with increasing temperature. It is known that O
2 plays a key role in the Fenton reaction.
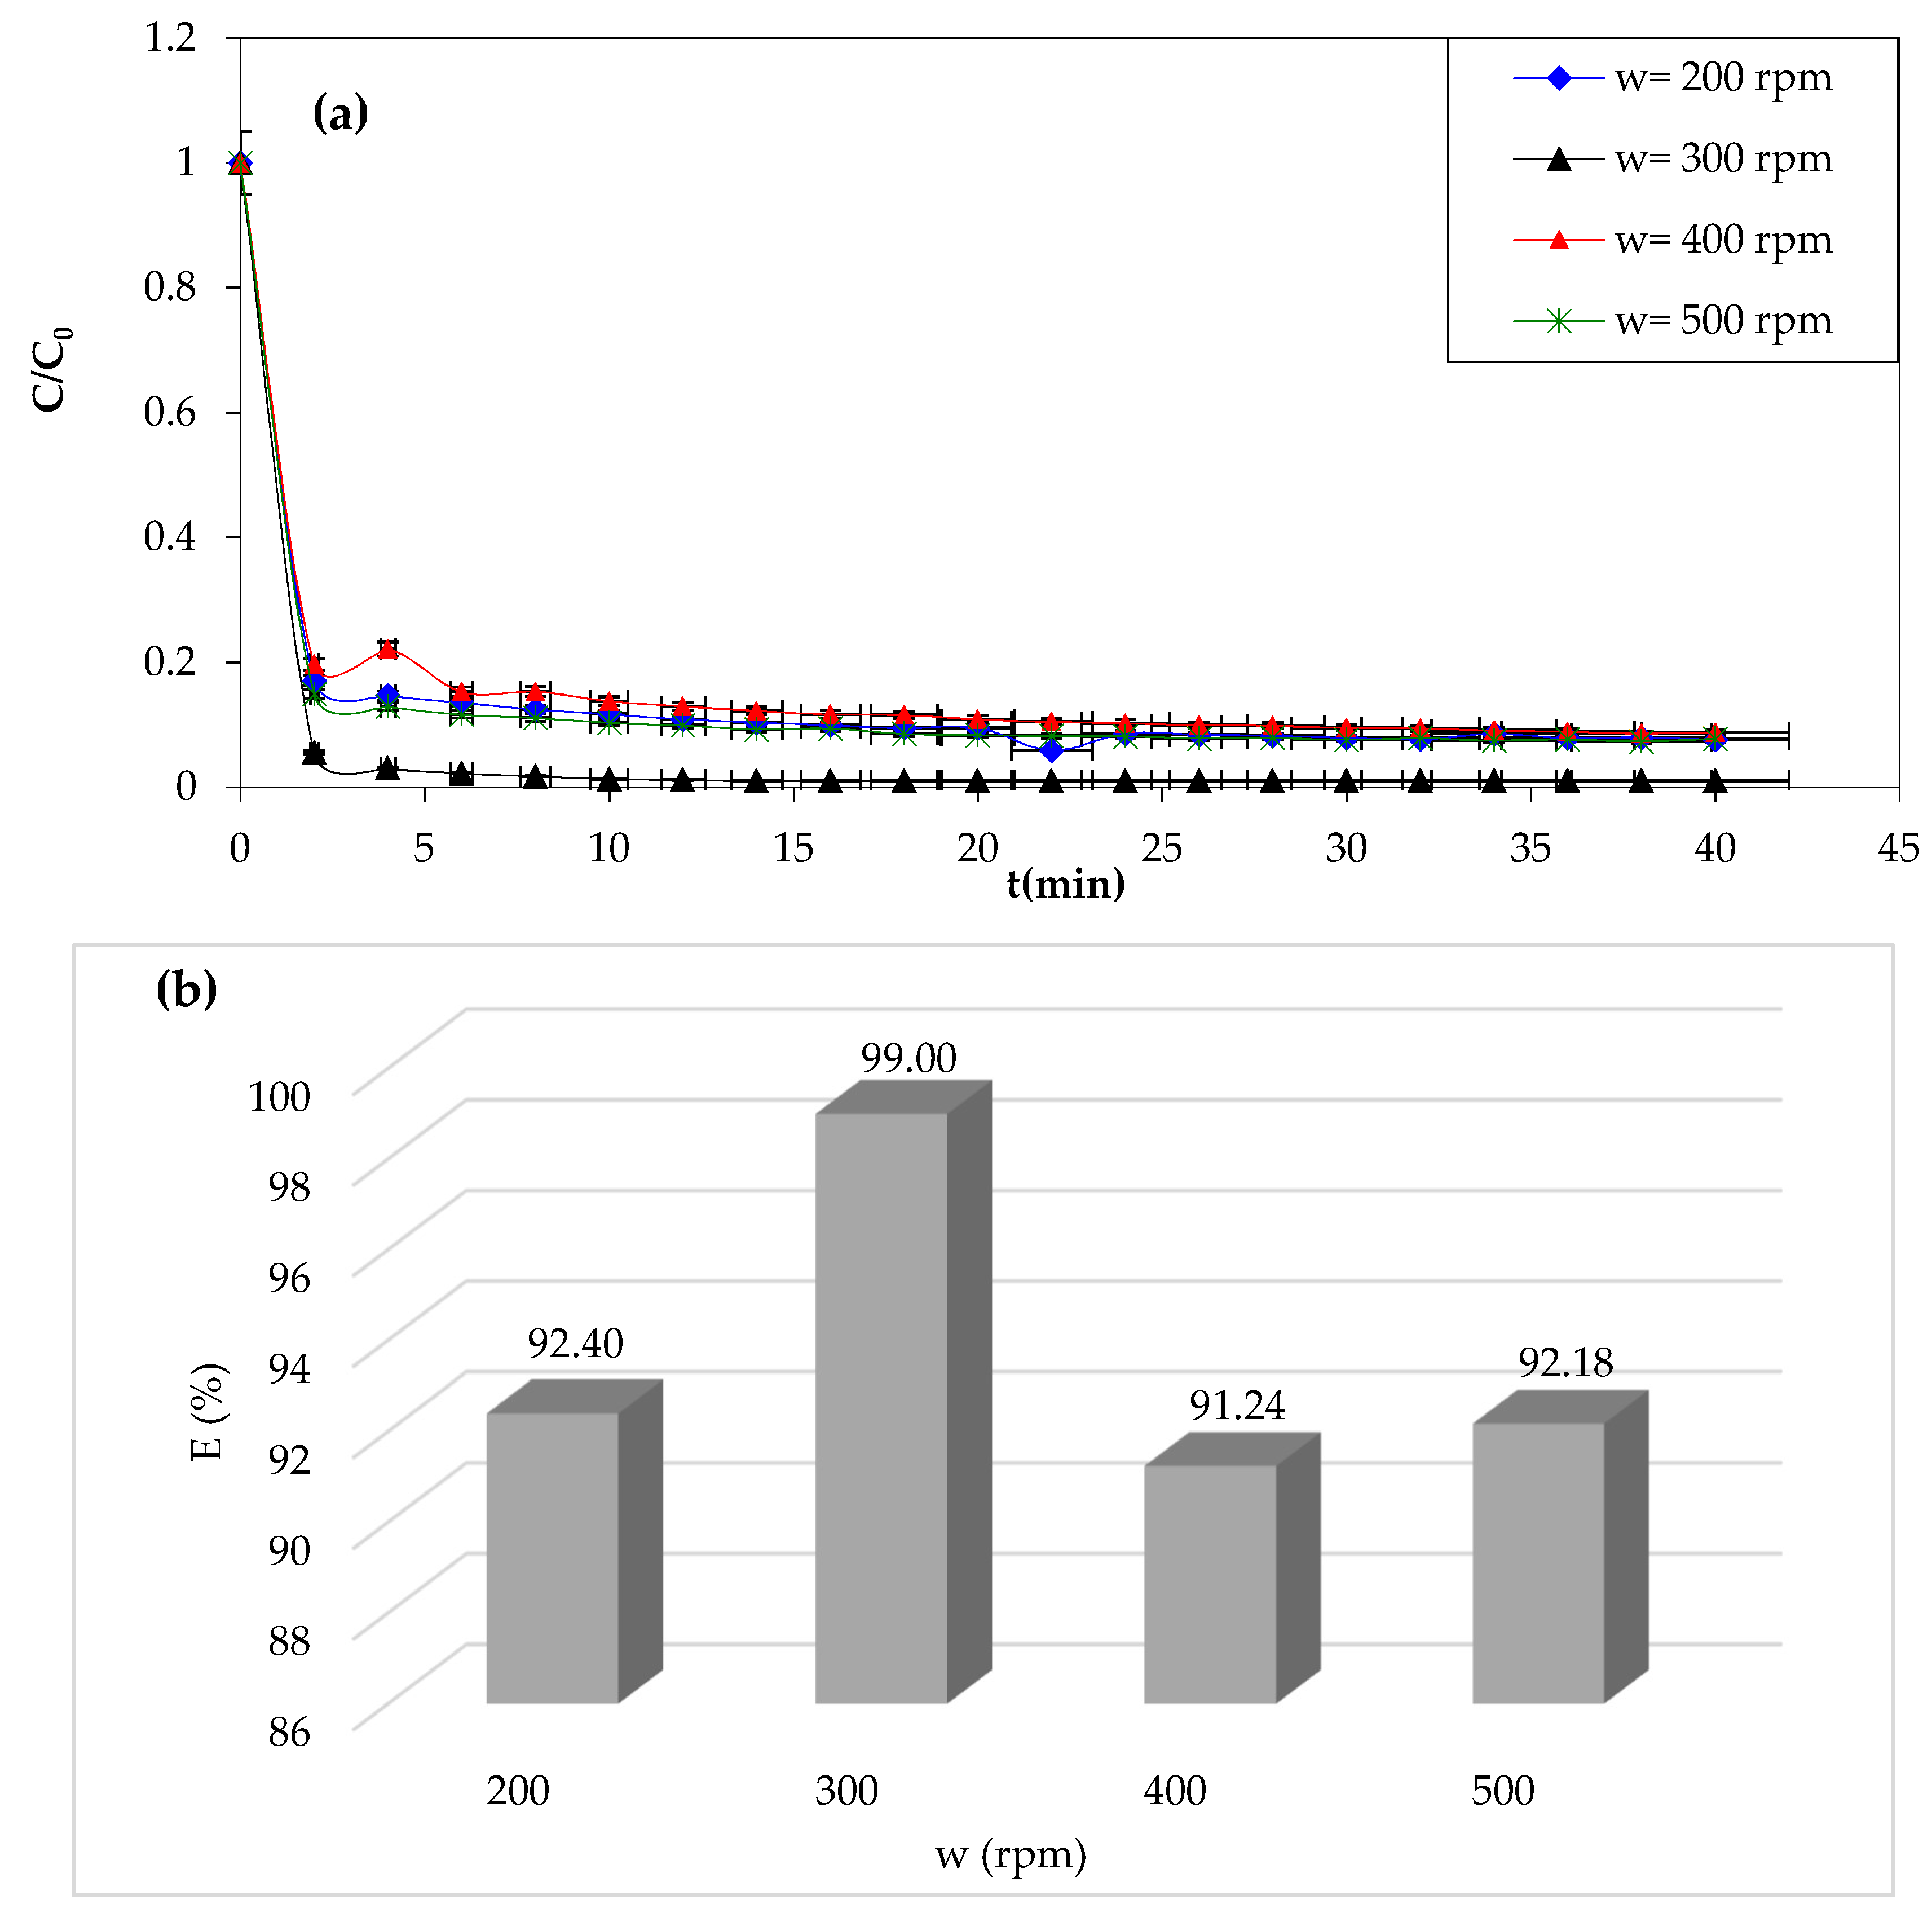
3.1.8. Effect of Stirring Speed
The stirring speed significantly impacts the Fenton process efficiency of the dye removal. In addition to its role in the homogenization of the reaction mixture and enhancing the mass transfer, it also promotes better contact between dye molecules and Fenton reagents [
66]. Higher stirring speeds also promote reaction kinetics, resulting in faster dye degradation. The results of the study of the effect of this parameter are presented in
Figure 10.
Overall, when examining the curves in
Figure 10a, it is clear that the stirring speed has negative effects on the dye removal rate. An improvement was observed when the stirring speed increased from 200 to 300 rpm. The dye removal rate increased from 92.40% to 99%, and then after 300 rpm, a decrease in CV dye degradation by Fenton processes was observed. The optimum stirring speed is taken as 300 rpm. However, the optimal stirring speed may vary depending on the specific conditions of the Fenton process being used, as we can see in the study of Giwa et al. [
67]. The authors found that the process was effective at pH 3, with a maximum dye decolorization efficiency of 98.8%, within 30 min of the Fenton reaction. Therefore, the optimal stirring speed for the Fenton process may depend on factors such as the pH, the specific Fenton reagents being used, and the type of pollutant being removed.
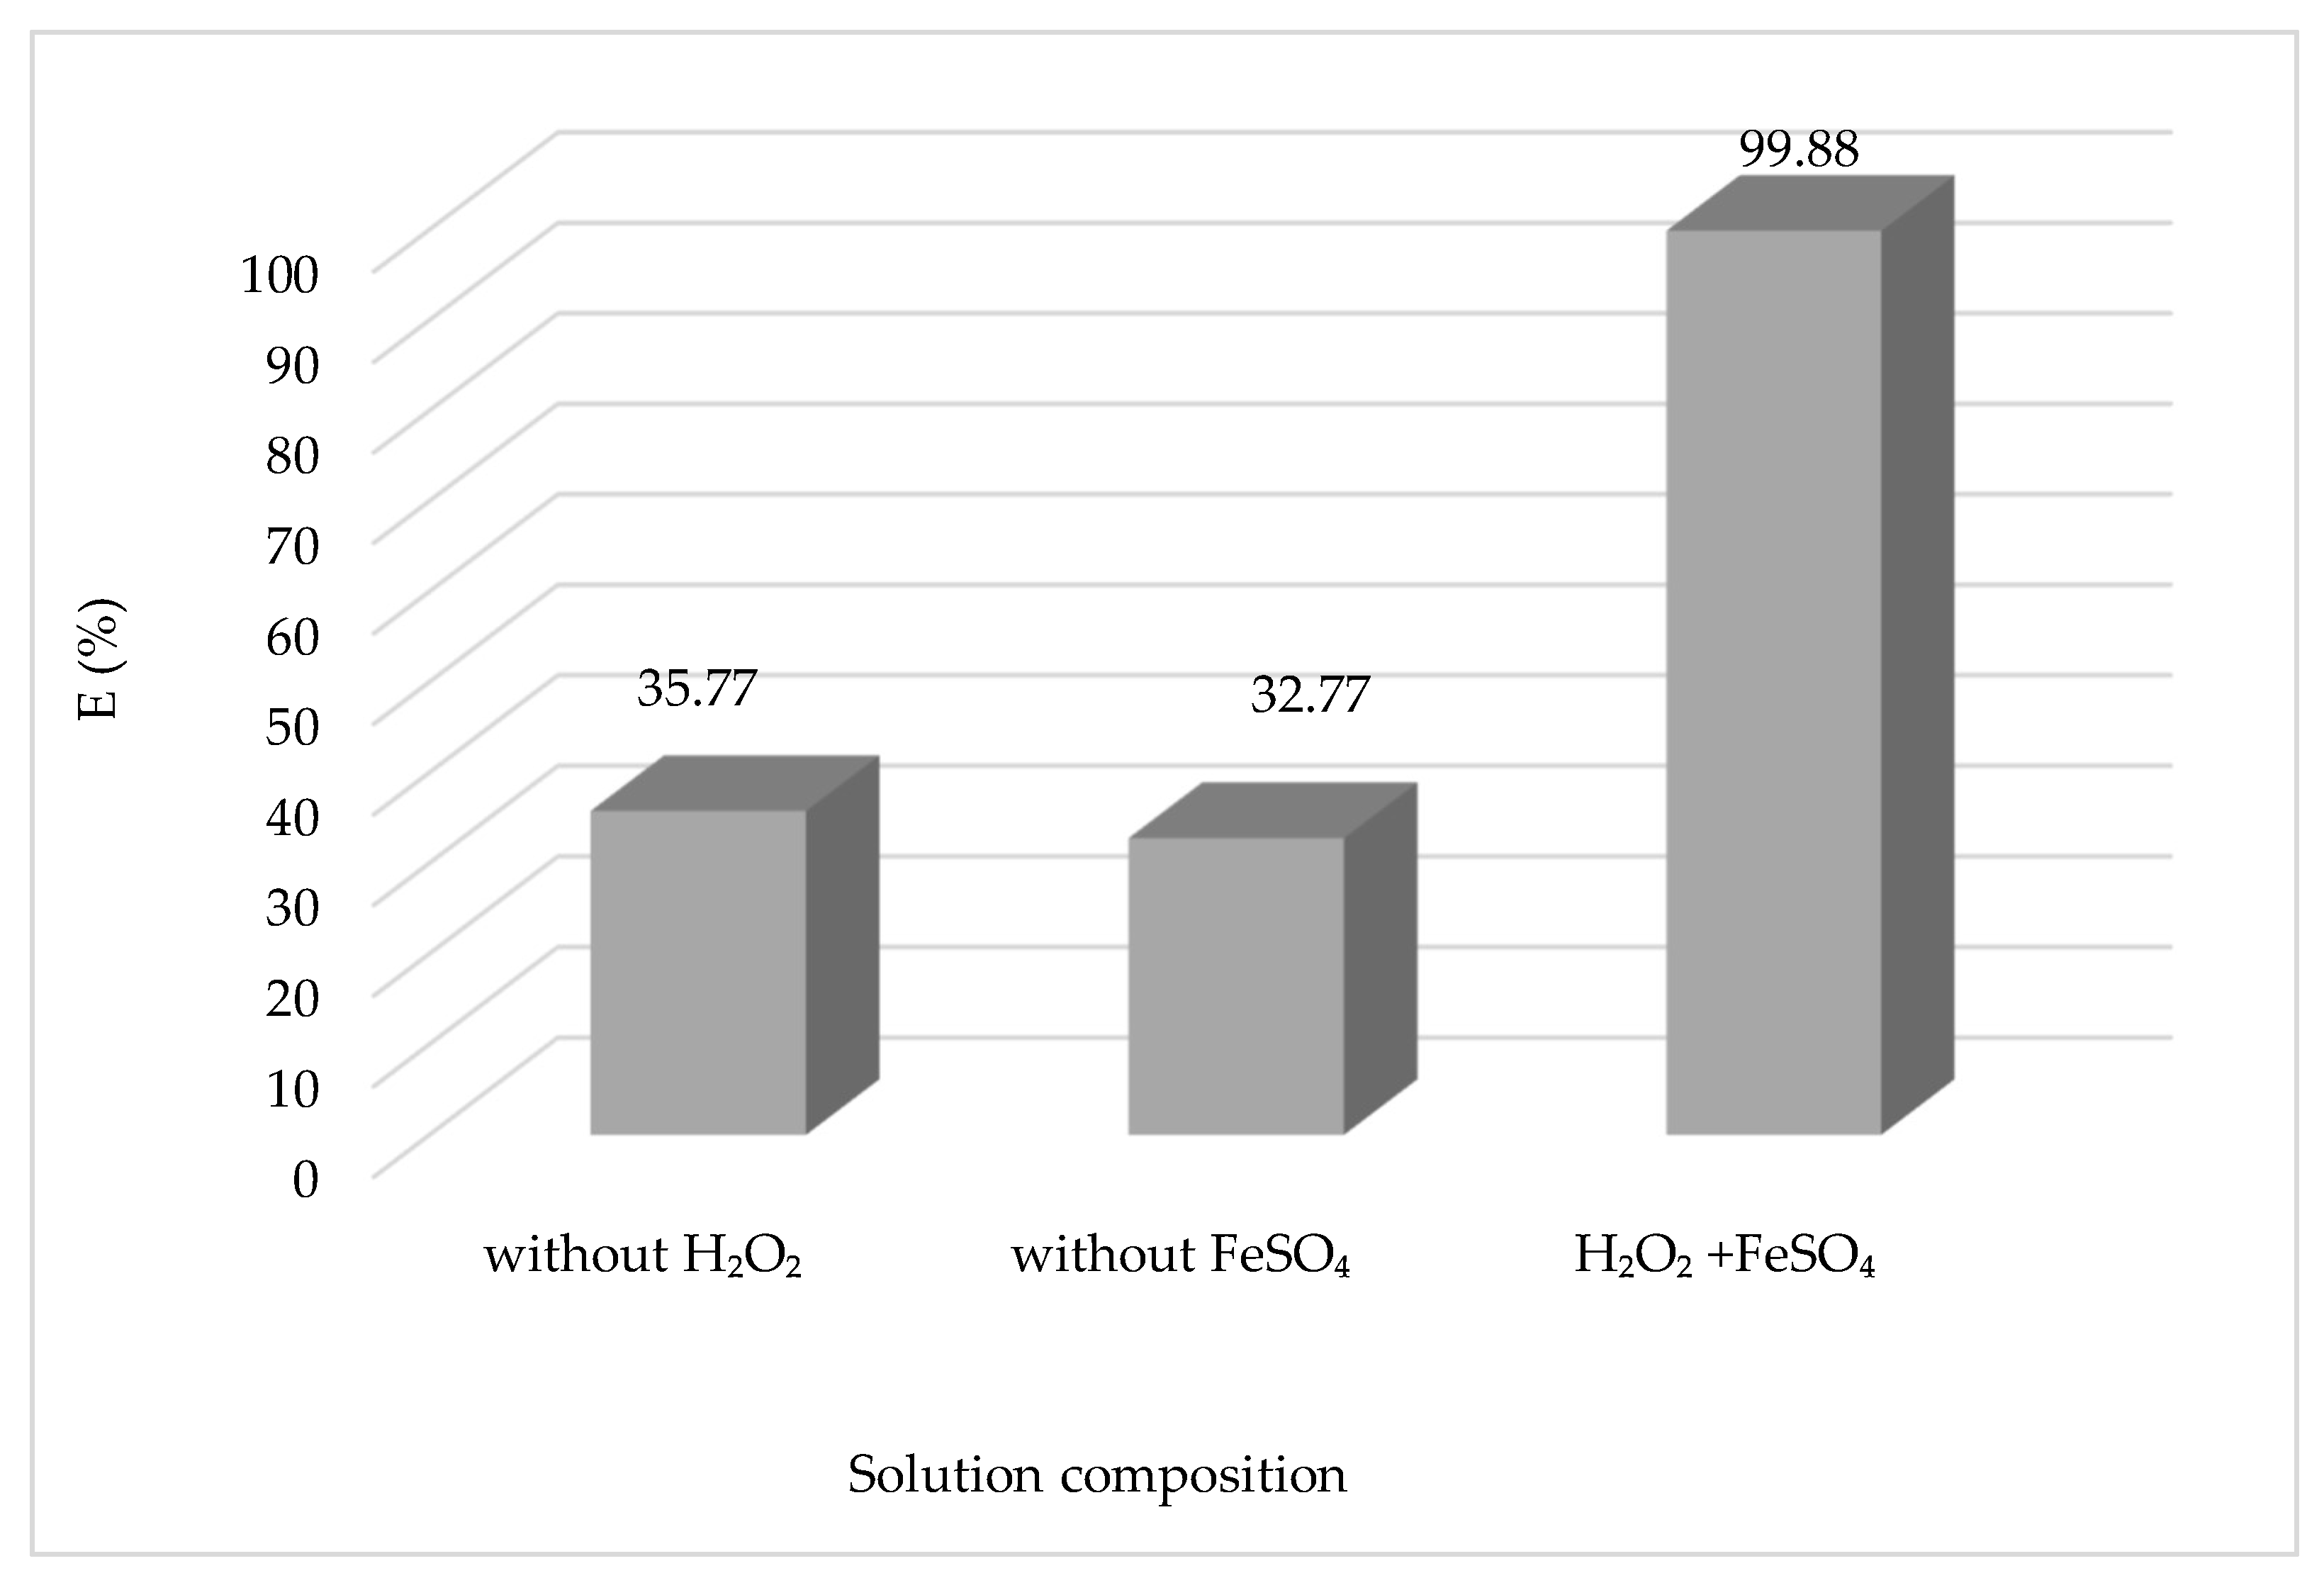
3.1.9. Effect of Solution Composition
The efficacy of the Fenton process is contingent upon the presence of H
2O
2/Fe
2+ reagents. The research substantiated the significance of a catalyst and oxidant in the generation of hydroxyl radicals
•HO by examining the discoloring effect of the CV solution and significantly impacting the process. The results obtained are shown in
Figure 11.
The concentration of reagents (H
2O
2 and Fe
2+) is probably the most important element to be taken into account when designing the treatment process, as it will not only condition the overall efficiency of the process but also its cost. From
Figure 11, we can see that the rate of CV degradation in the presence of Fe
2+ and H
2O
2 is higher compared to those in the experiments with an absence of H
2O
2 or Fe
2+. Since the reaction with Fe
2+ is significantly slower as compared to H
2O
2, the catalyst regeneration phase is considered the most critical stage of the process, as it reduces the radical production rate and could end up depleting the iron available for the reaction. The concentration of H
2O
2 that must be supplied for the adequate degradation of pollutants is a function of the chemical oxygen demand (COD) of the effluent. Similarly, increasing the concentration of Fe
2+ leads to higher reaction rates until a certain concentration is reached, above which all rate increases become marginal. Furthermore, an enormous increase in the concentration of Fe
2+ may contribute to higher concentrations of total dissolved solids, which may be problematic for further treatment steps or discharge. It is generally recommended that an optimal dose of reagents is tailored to meet the desired removal of pollutants for a specific effluent using experimental trials and mathematical optimization techniques [
29].
3.1.10. Effect of Combining Ultrasound with Fenton Processes
An approach using ultrasound in conjunction with the Fenton process was employed to enhance the efficiency of degradation for the CV dye, capitalizing on the advantageous synergistic effect resulting from the simultaneous implementation of both processes. Furthermore, the approach can generate H
2O
2, reduce chemical quantities, enhance treatment performance, and improve decolorization efficiency. Moreover, combining the ultrasound and Fenton process requires less chemical quantities than the classic Fenton process. The ultrasound enhances the diffusion of the Fenton reagent, ensuring thorough contact between OH
• and organic matter, improving sludge disintegration efficiency. The decolorization efficiency of CV also increases when ultrasound is combined with the heterogeneous Fenton process. In this context, suitable conditions for the operation of the ultrasound reactor to produce CV degradation and H
2O
2 have been identified. In this work, we studied the effectiveness of ultrasound associated with the Fenton process on the degradation of crystal violet, using an ultrasound device from Selecta, with a capacity of 5 L, generator power of 120 w, and weight of 3.8 kg [
68].
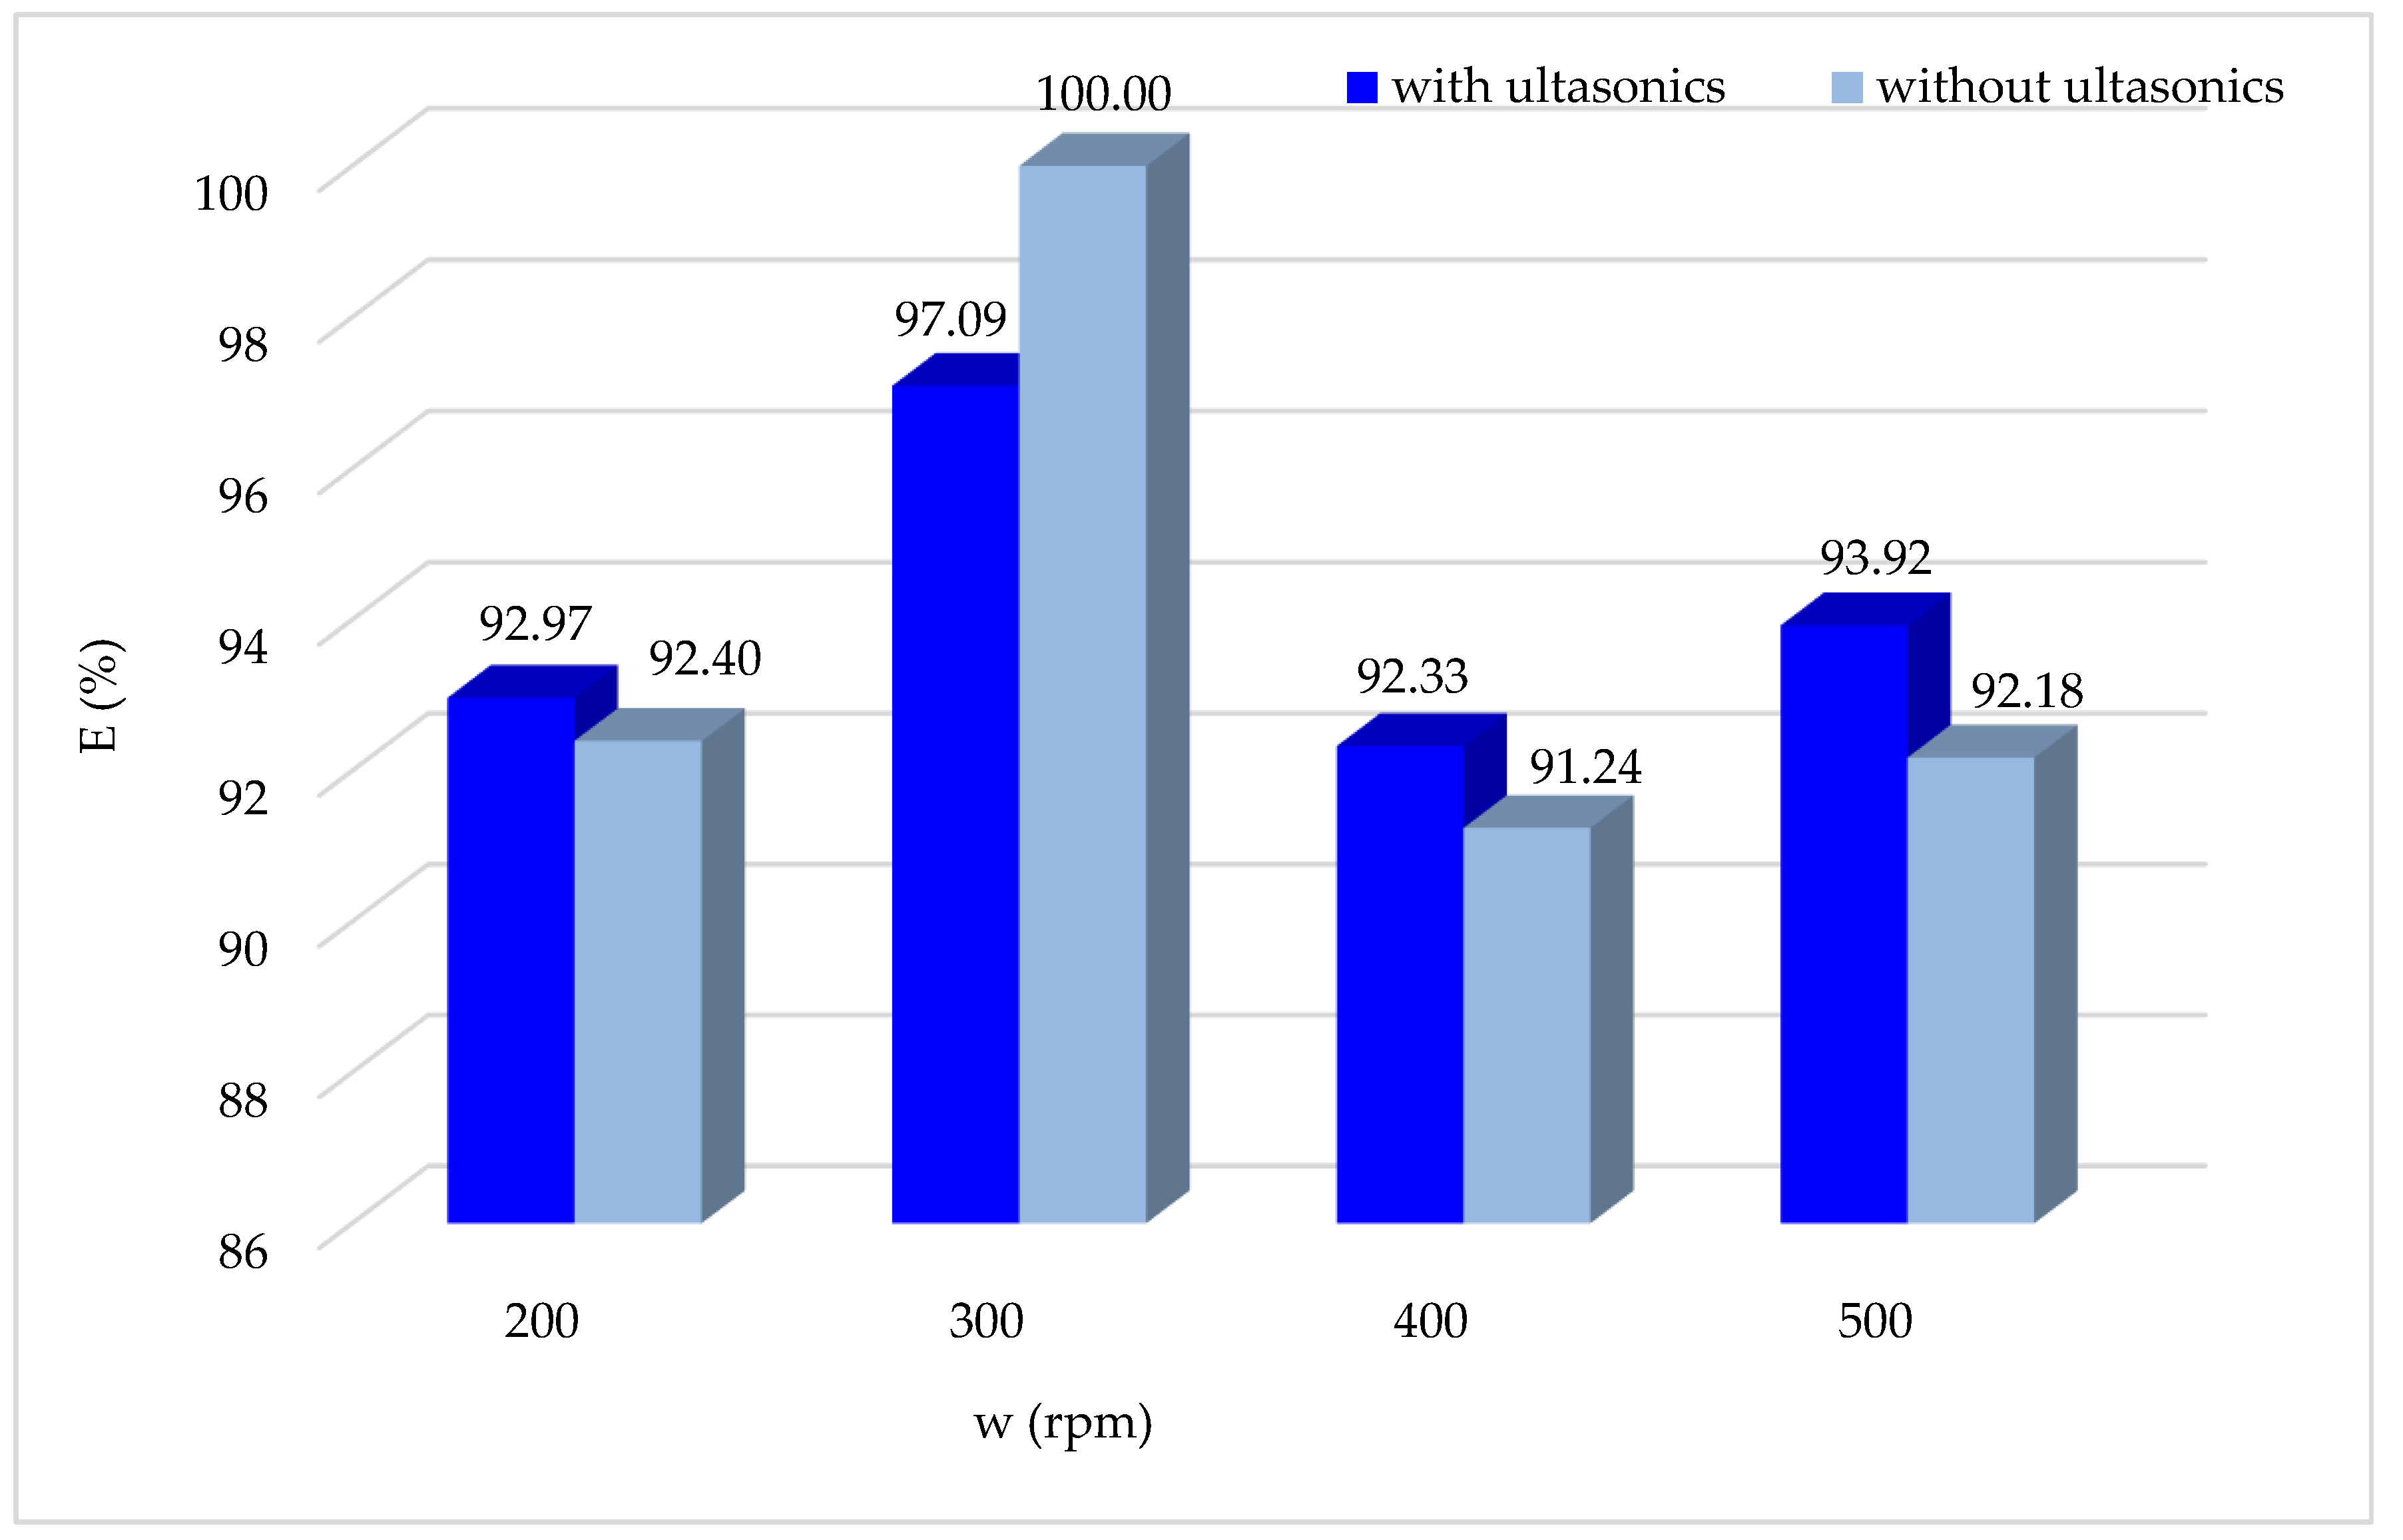
3.1.11. Effect of Agitation Speed Associated with Ultrasound
During the experimentation involving the combination of ultrasound and Fenton treatment, the impact of stirring on the degradation of the CV dye was assessed while maintaining the other optimum operating parameters.
According to the obtained results (
Figure 12), it is noted that overall, using ultrasound does not influence the Fenton process, with a slight improvement in the degradation of the CV dye by Fenton oxidation. The optimal stirring speed is always 300 rpm, both with and without the ultrasonic combination.
3.1.12. Effect of Crystal Violet Concentration in Combination with Ultrasound
The initial concentration of the pollutant is a principal parameter in wastewater treatment, playing a crucial function and substantially affecting the degradation rate of the CV dye. In this context, we have examined the degradation efficacy of two processes, ultrasonic and Fenton oxidation, by varying initial CV dye concentrations, based on the data shown in
Figure 13.
From
Figure 13, it is evident that ultrasound has a negative effect on E% at lower CV concentrations (i.e., less than 15 mg/L) while exhibiting a pronounced positive effect at higher concentrations. The observed negative impact of ultrasound at lower concentrations raises intriguing insights into the intricacies of ultrasonic-assisted degradation. This adverse effect may stem from the possibility that cavitation effects induced by ultrasound are not fully optimized at these concentrations, resulting in a less efficient breakdown of the dye molecules. Cavitation, which plays a pivotal role in sonication processes, involves the formation and collapse of microbubbles, generating localized high temperatures and pressures. At lower concentrations, the cavitation effects may be insufficient to induce the desired level of molecular degradation, leading to the observed decrease in degradation efficiency. This observation underscores the critical need for a thorough understanding of the interplay between ultrasonic treatment and varying pollutant concentrations. The dynamics involved in ultrasonic processes are highly dependent on factors such as cavitation intensity, which, in turn, can be influenced by the initial pollutant concentration. The nuanced relationship between ultrasound and pollutant concentration suggests that the introduction of ultrasound may not universally enhance the degradation process. Instead, its efficacy appears to be context-dependent, emphasizing the importance of tailored approaches in wastewater treatment [
69].
Conversely, the heightened positive effect of ultrasound at higher concentrations suggests a concentration-dependent response. As the concentration of the VC dye increases, ultrasound becomes progressively more effective, potentially due to intensified cavitation effects and enhanced generation of reactive species. The increased availability of dye molecules at higher concentrations may lead to more efficient utilization of the cavitation-induced reactive environment, resulting in enhanced degradation.
In essence, ultrasound’s efficacy in VC dye degradation appears to be a complex interplay of concentration-dependent factors. Whereas its negative impact at lower concentrations may be attributed to suboptimal cavitation effects, its positive effect at higher concentrations underscores the potential for ultrasound to excel in scenarios in which pollutant concentrations are elevated. These nuanced findings emphasize the necessity of a tailored and informed approach, considering specific environmental conditions, to optimize the application of ultrasound in wastewater treatment.
3.2. Gaussian Process Regression Modelling
In the process of developing the GPR model, we undertook an extensive and meticulous optimization effort that involved ten distinct kernel functions. These kernel functions were carefully fine-tuned to maximize their effectiveness. The ten kernels in question are: Exponential, Squared Exponential, Matern32, Matern52, Rational Quadratic, ARD Exponential, ARD Squared Exponential, ARD Matern32, ARD Matern52, and ARD Rational Quadratic. Moreover, each kernel was intricately adjusted in conjunction with four distinct base functions, namely, Constant, Linear, Zero, and PureQuadratic. This optimization process was highly tailored to accommodate the specific parameters associated with each kernel function, including SigmaM, SigmaF, and Sigma.
Table 1 serves as an extensive repository, providing a comprehensive summary of the most favorable results achieved through this comprehensive optimization of kernel functions. The table further elaborates on the respective base functions and their specific parameters. Importantly, the table gives the statistical coefficients and associated errors, such as R, RMSE, and MAE, for the training dataset, the validation dataset, and the merged dataset that encompasses both training and validation data.
The results in
Table 1 show that the “ARD Exponential” kernel with the “Constant” basis function exhibited an exceptional model in terms of performance compared to other kernels.
The GPR model was meticulously designed and proved to be exceptionally effective in predicting and generalizing complex relationships within our dataset. The performance metrics are highly compelling, affirming the model’s accuracy. The correlation coefficient measures the linear relationship between the model’s predictions and the actual values. Values close to 1 indicate a strong correlation, signifying that the model’s predictions closely align with the actual values. In this study, the correlation coefficients are exceptionally high, whether for the training set (Train: 0.99996), the validation set (Validation: 0.99998), or the combined set (All: 0.99997). This suggests that the model based on the “ARD Exponential” kernel with the “Constant” basis function is extremely effective in capturing trends in the data, whether in the training data, validation data, or the entire dataset.
Additionally, RMSE measures the average squared error between the model’s predictions and the actual values. Low RMSE values indicate that the model’s predictions are very close to the actual values. In this study, the RMSE values are remarkably low for the training set (Train: 0.0020), the validation set (Validation: 0.0013), and the combined set (All: 0.0018). These very low RMSE values suggest that the model based on the “ARD Exponential” kernel with the “Constant” basis function is extremely precise in its predictions, whether underestimating or overestimating.
Similarly, MAE measures the average absolute error between the model’s predictions and the actual values. Low MAE values indicate that the model’s predictions are very close to the actual values, regardless of direction. In this study, the MAE values are extremely low for the training set (Train: 0.0006), the validation set (Validation: 0.0003), and the combined set (All: 0.0005). This means that the model based on the “ARD Exponential” kernel with the “Constant” basis function demonstrates exceptional precision and can predict actual values with high accuracy.
The study’s results demonstrate that the model based on the “ARD Exponential” kernel with the “Constant” basis function is remarkably effective. It exhibits a high correlation with the actual data, low RMSE, and low MAE. These results indicate that the model is highly accurate and reliable, making it an optimal choice for applications requiring high-quality modeling.
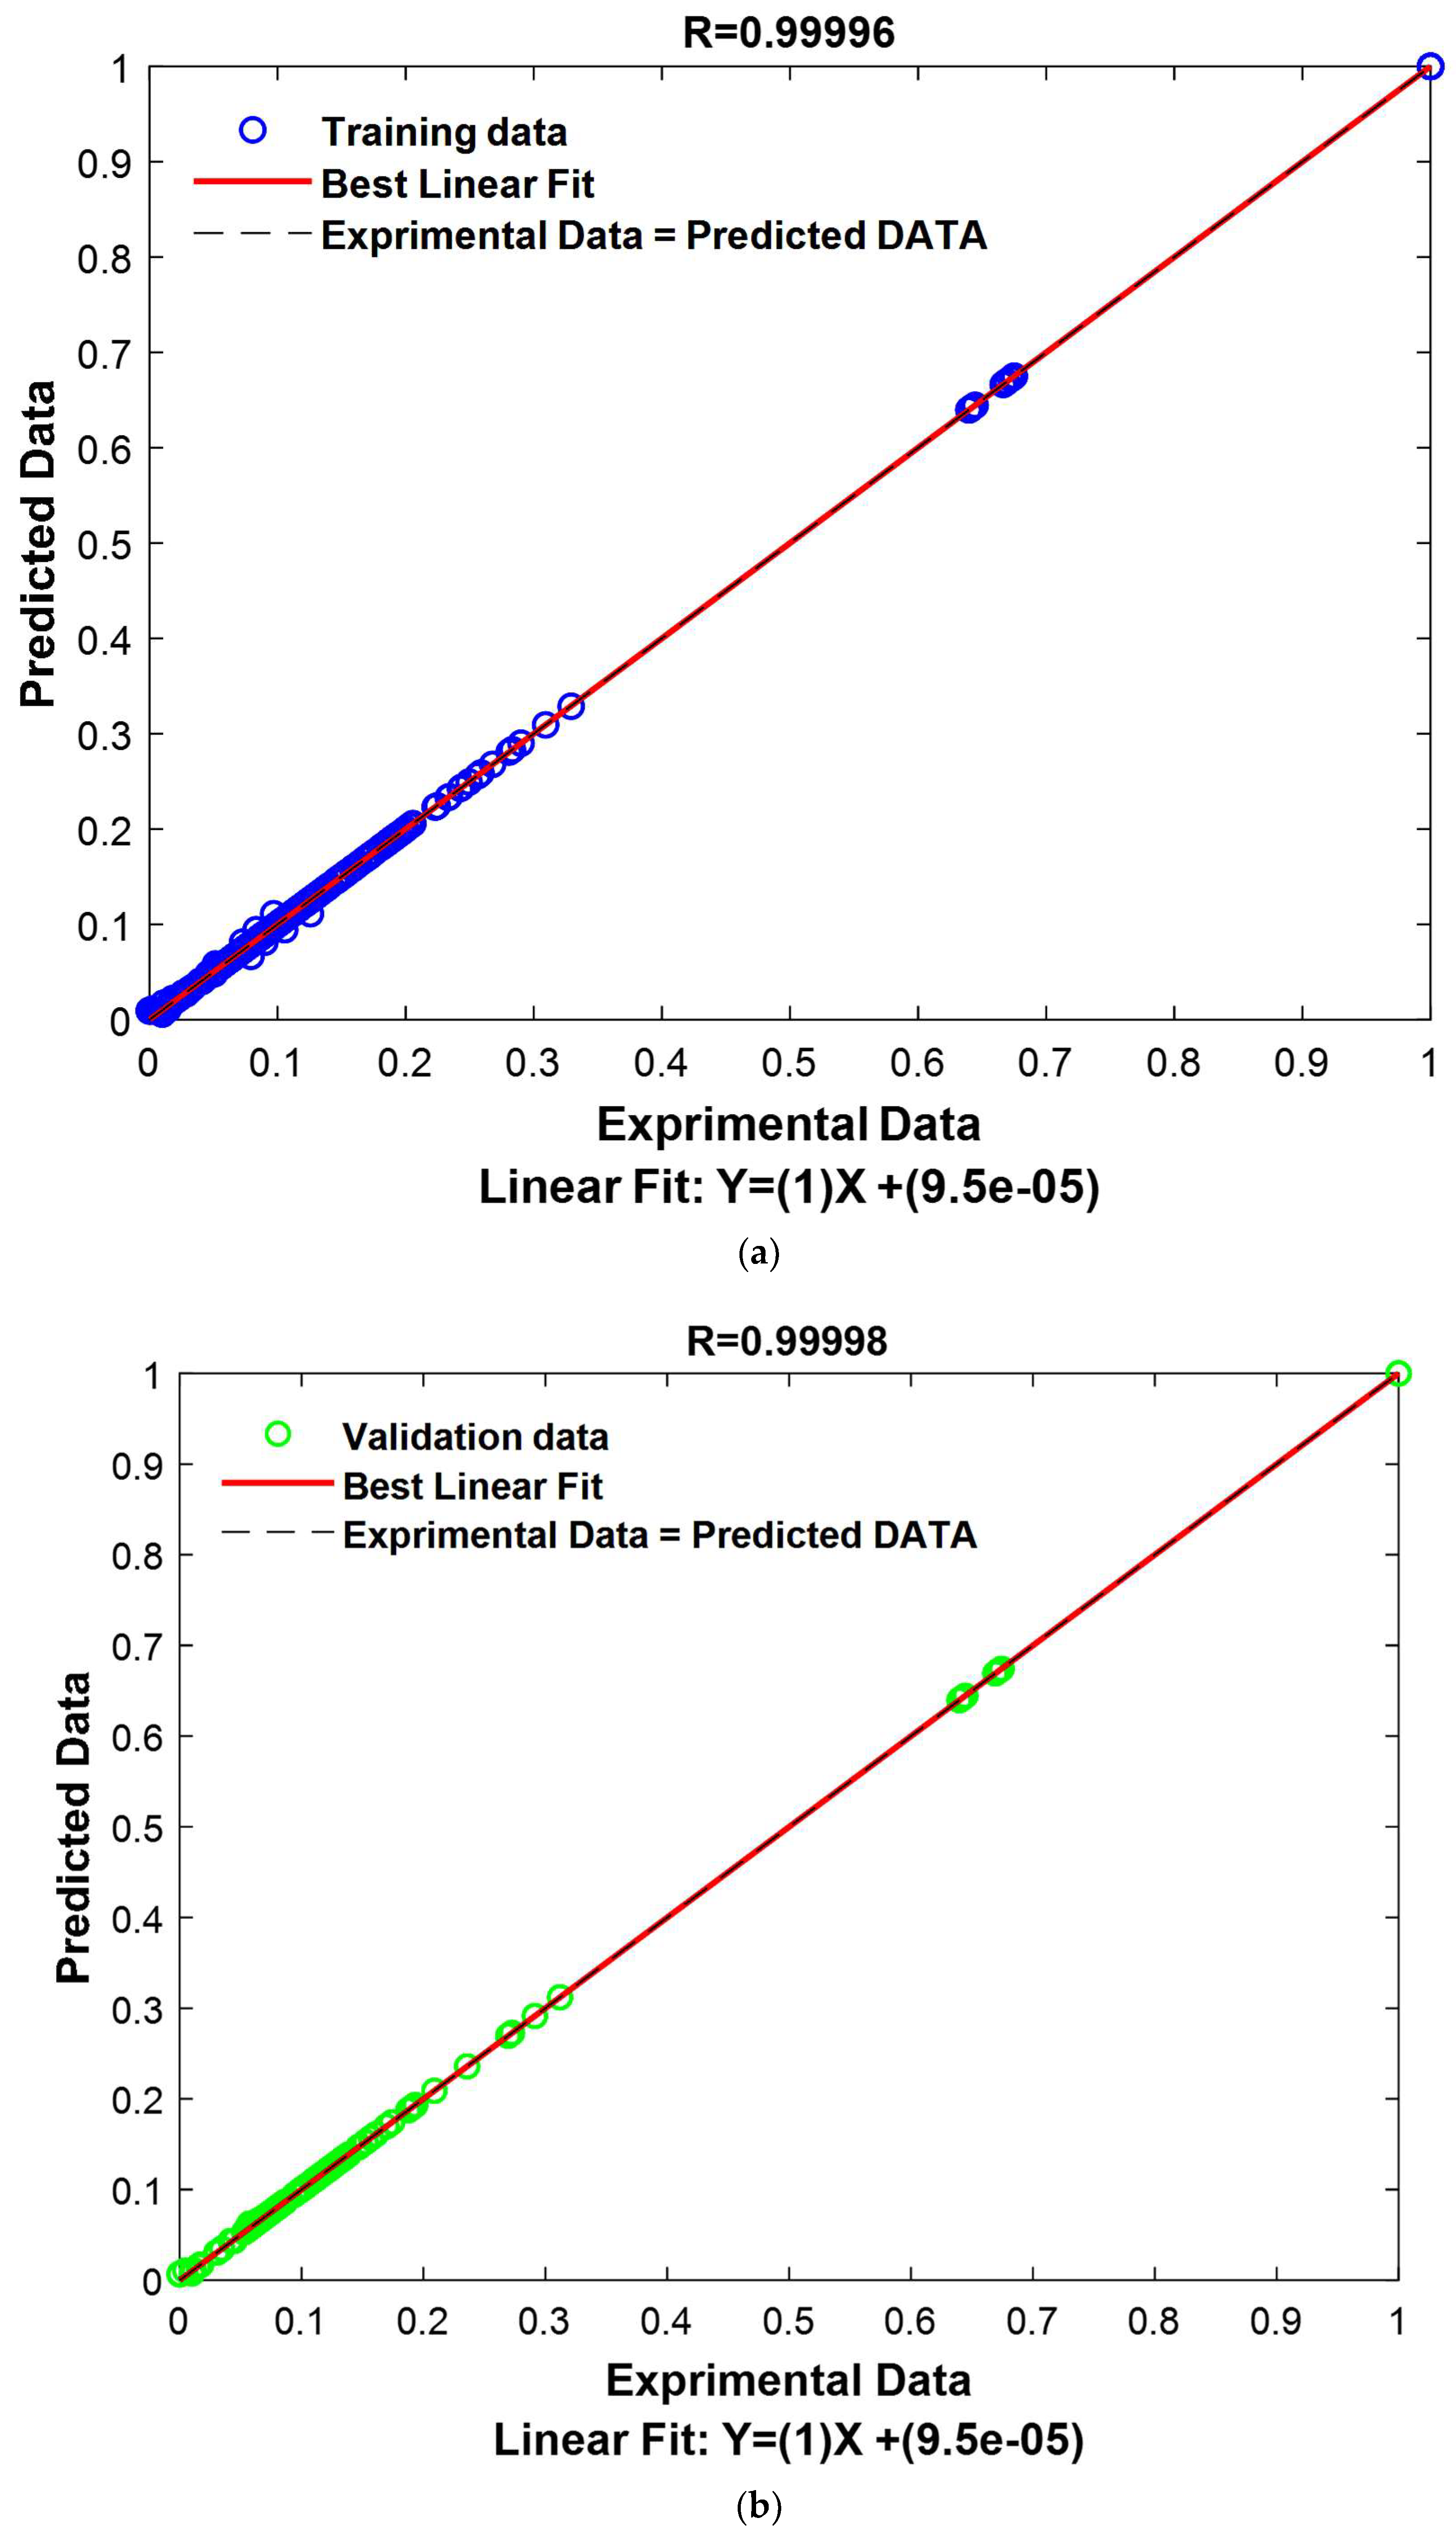
The outcomes achieved by employing the GPR model in conjunction with the ARD-Exponential kernel function, paired with the Constant basis function, are undeniably promising. This model has not only exhibited exceptional performance in terms of its impeccable alignment with the training dataset but has also demonstrated a noteworthy ability to generalize its predictions to new data points. These compelling findings serve to reinforce the credibility and relevance of this model in the context of modeling intricate relationships between input and output variables. The model’s robustness and reliability make it a compelling choice for scientific investigations demanding a high degree of accuracy and trustworthiness. These results are presented graphically in
Figure 14.
3.2.1. Performance of GPR Model Tested
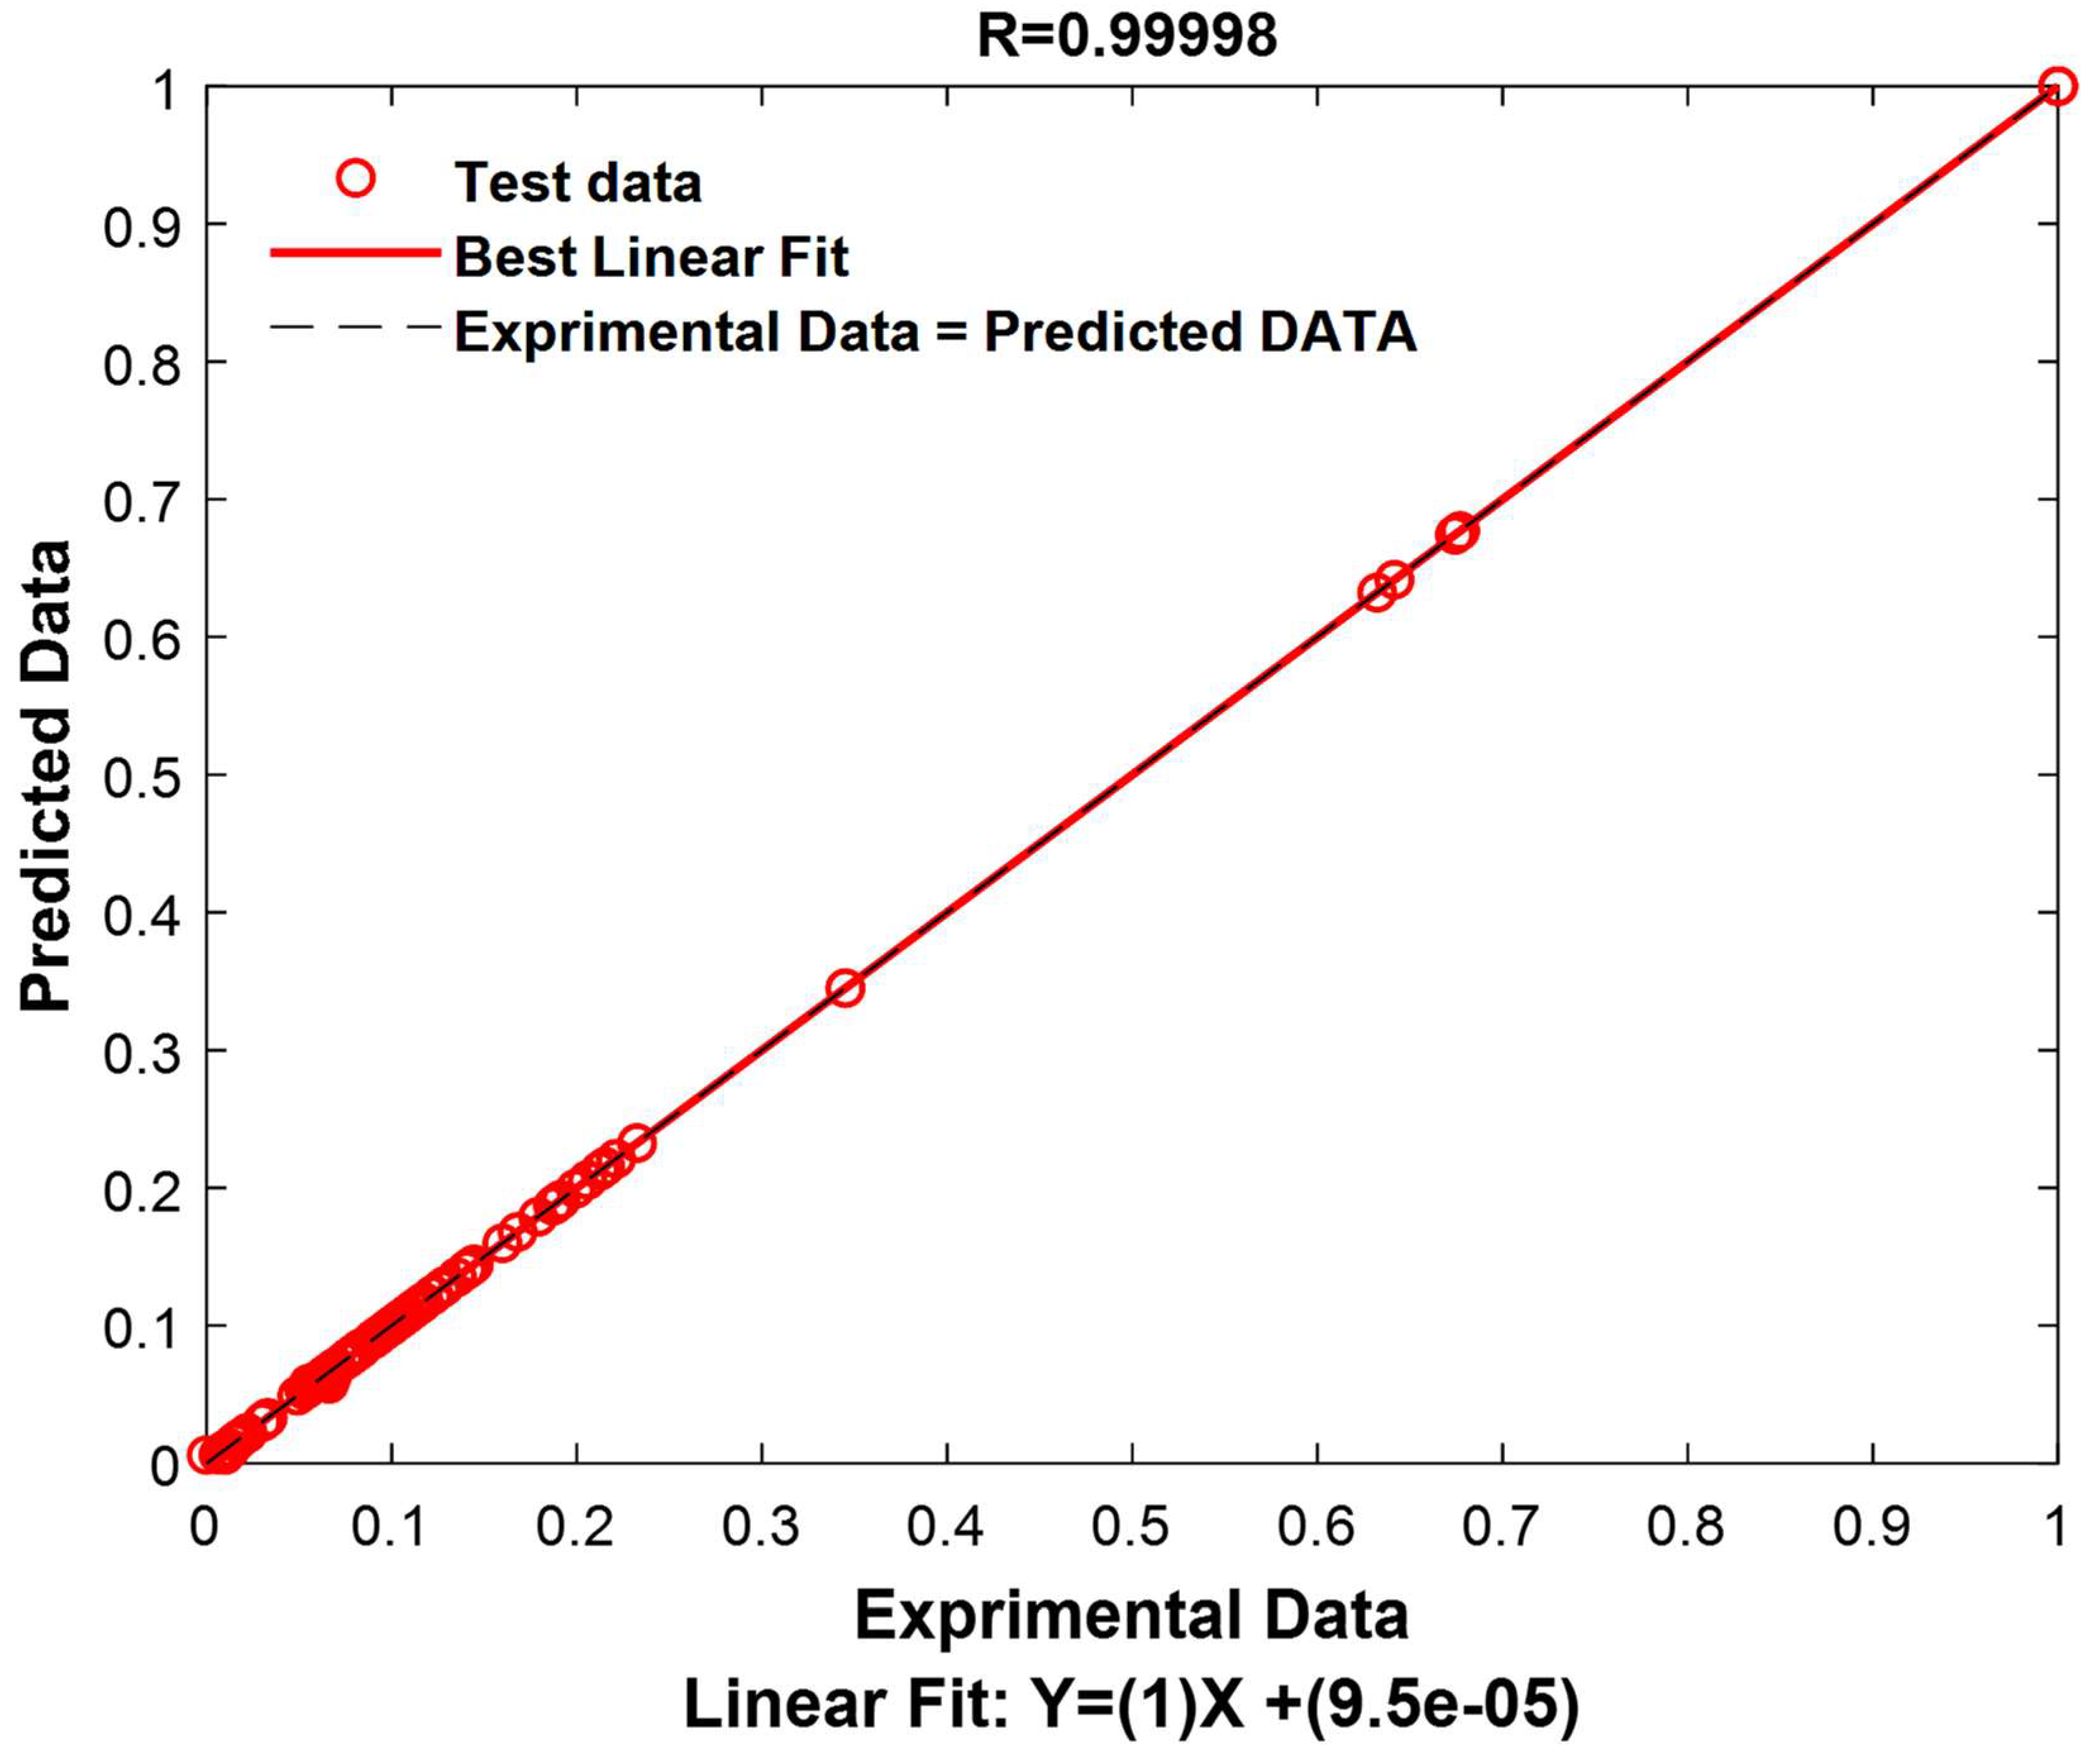
During the initial data partitioning process, a deliberate allocation of 15% from the database was set aside for the purpose of evaluating the top-performing GPR model achieved through interpolation. The results of this comprehensive evaluation have been methodically documented in
Table 2, offering a detailed presentation of statistical coefficients and their associated errors.
The results presented in
Table 2 provide an evaluation of the GPR model’s performance on the test segment, representing 15% of the previously reserved database.
The results of this test are extremely encouraging, revealing an exceptional model performance. The correlation coefficient reaches an exceptionally high value of 0.99998, indicating an extremely strong correlation between the model’s predictions and the actual values in the test set. Furthermore, the RMSE demonstrates remarkable precision, with a value of only 0.0020, indicating that the model’s predictions are extremely close to the actual values. Similarly, the MAE also shows high accuracy with a value of 0.0006, signifying that the model predicts test data with great accuracy, regardless of the direction of the error. These robust results unequivocally confirm the validity and resilience of the model for data prediction within this specific test set.
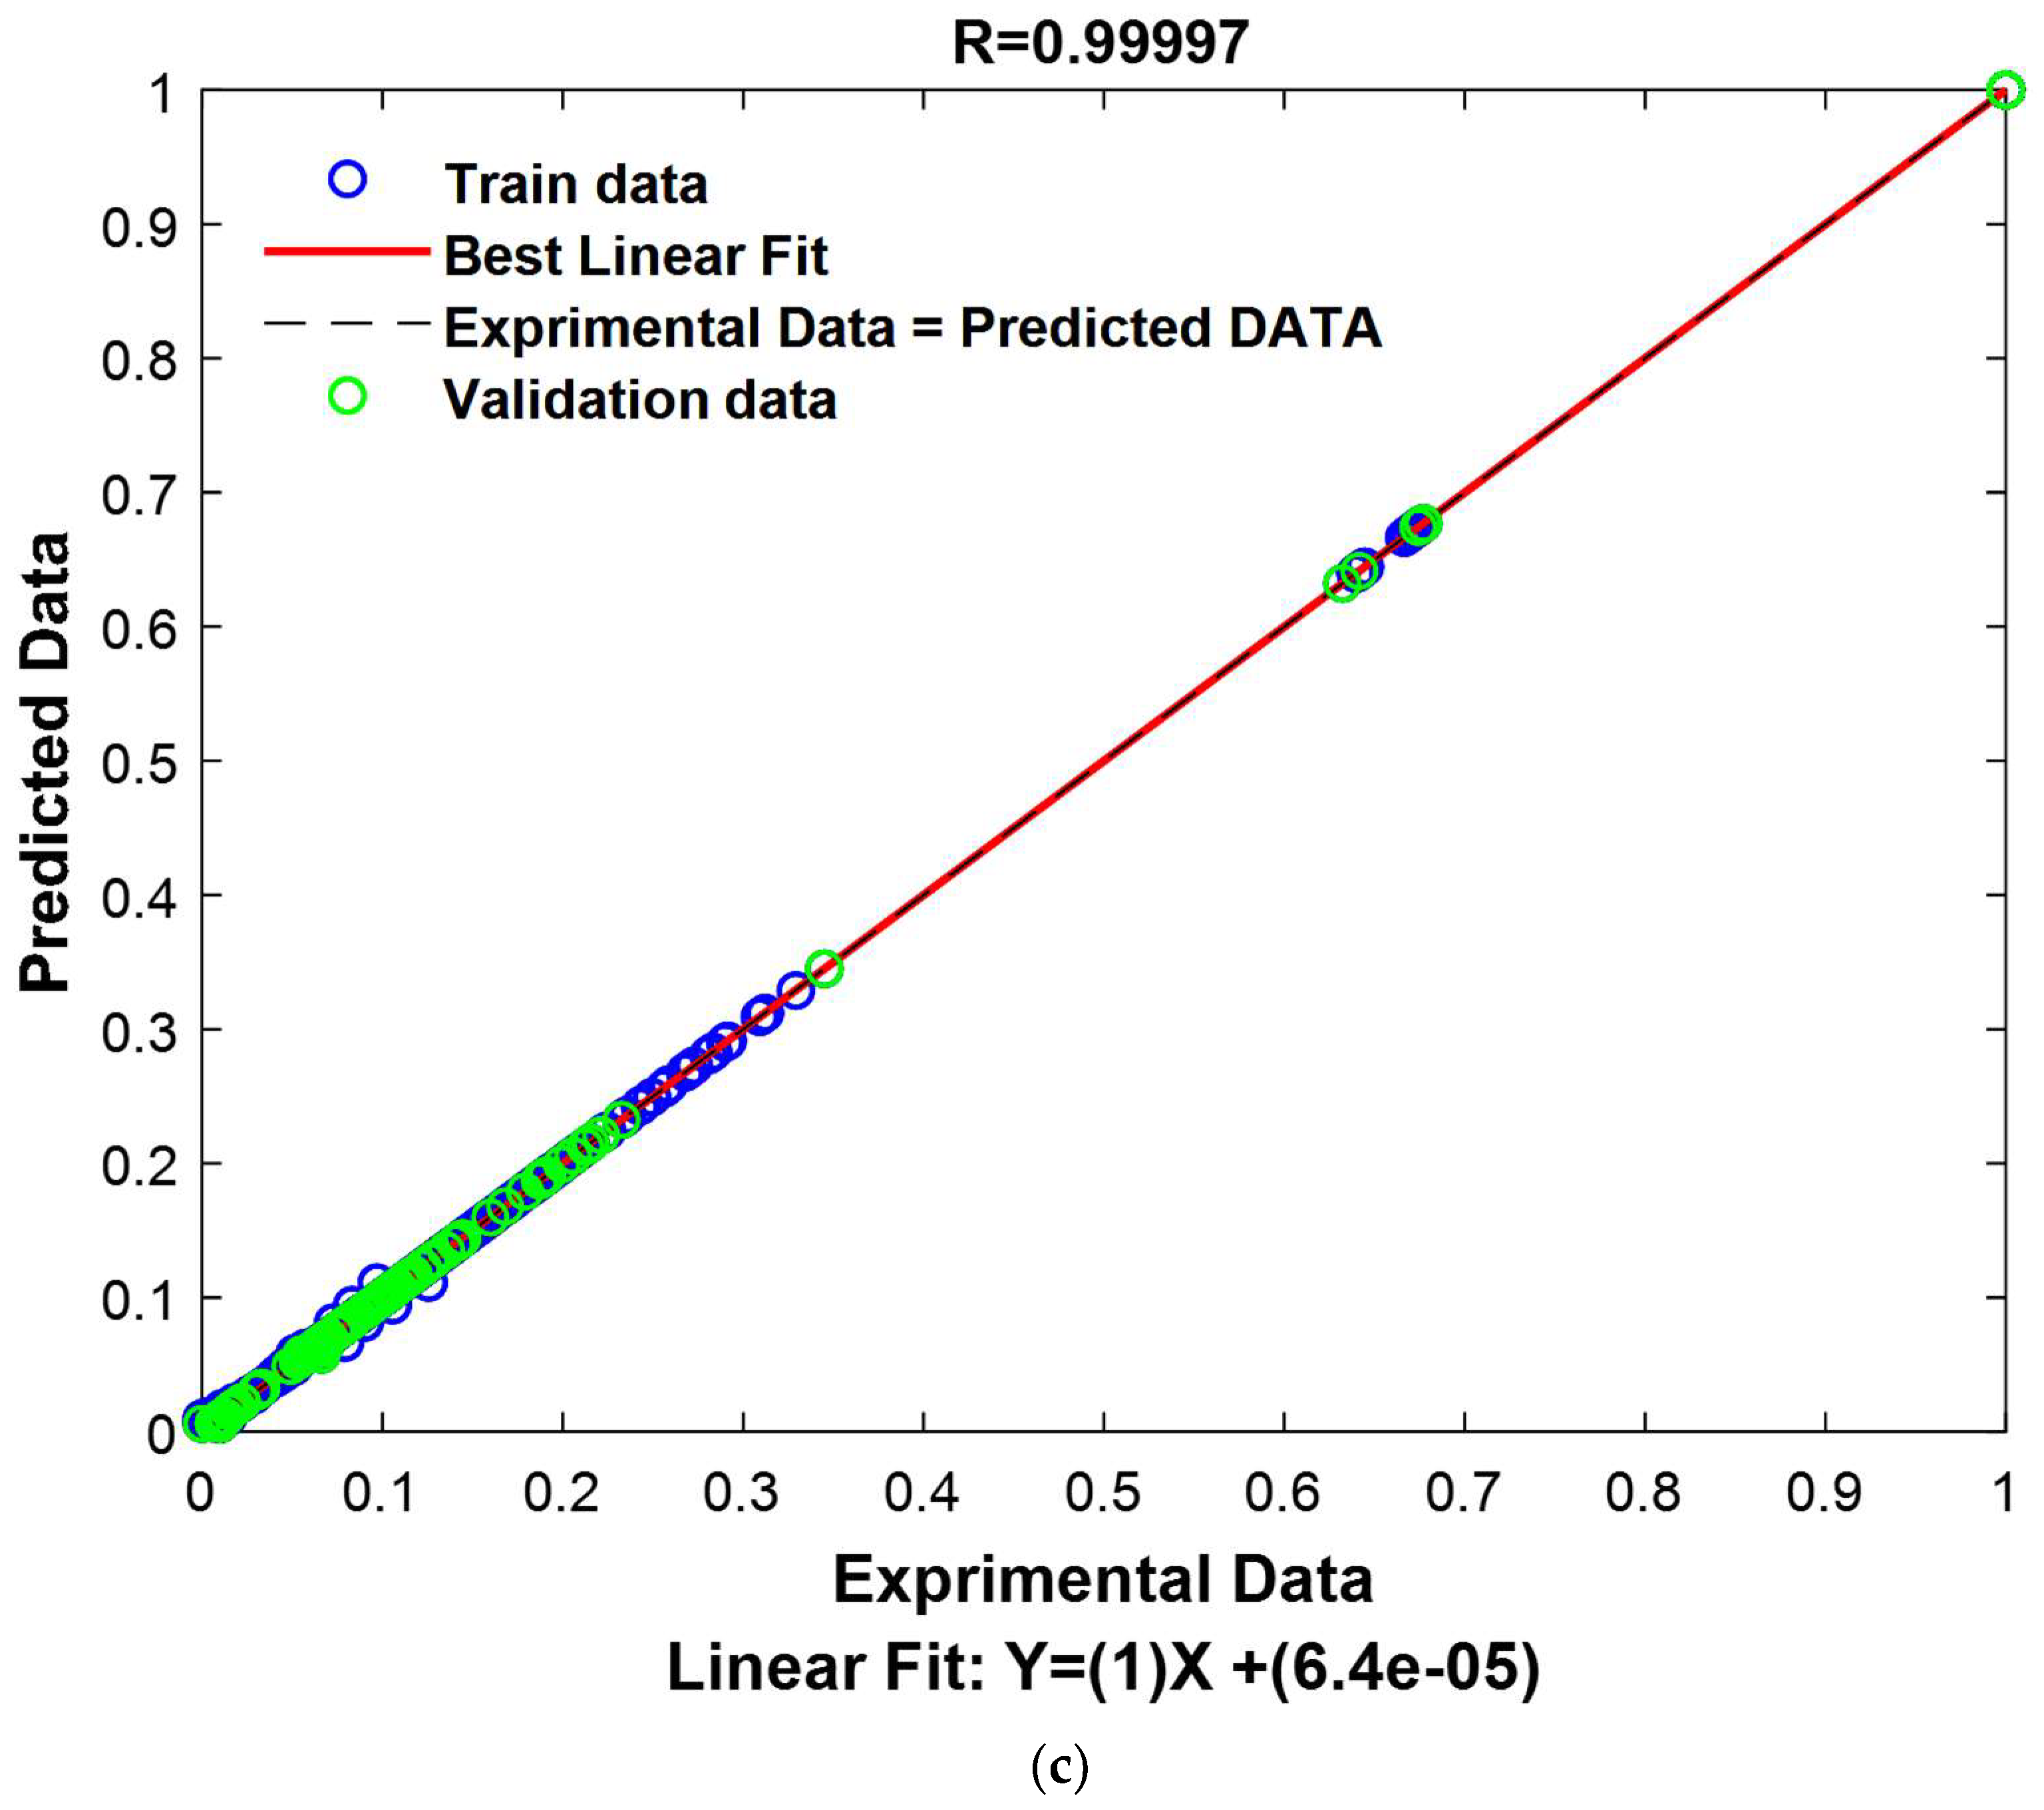
To provide a visual representation of these performances, experimental values and predicted values have been graphically represented in
Figure 15.
3.2.2. Residues Study
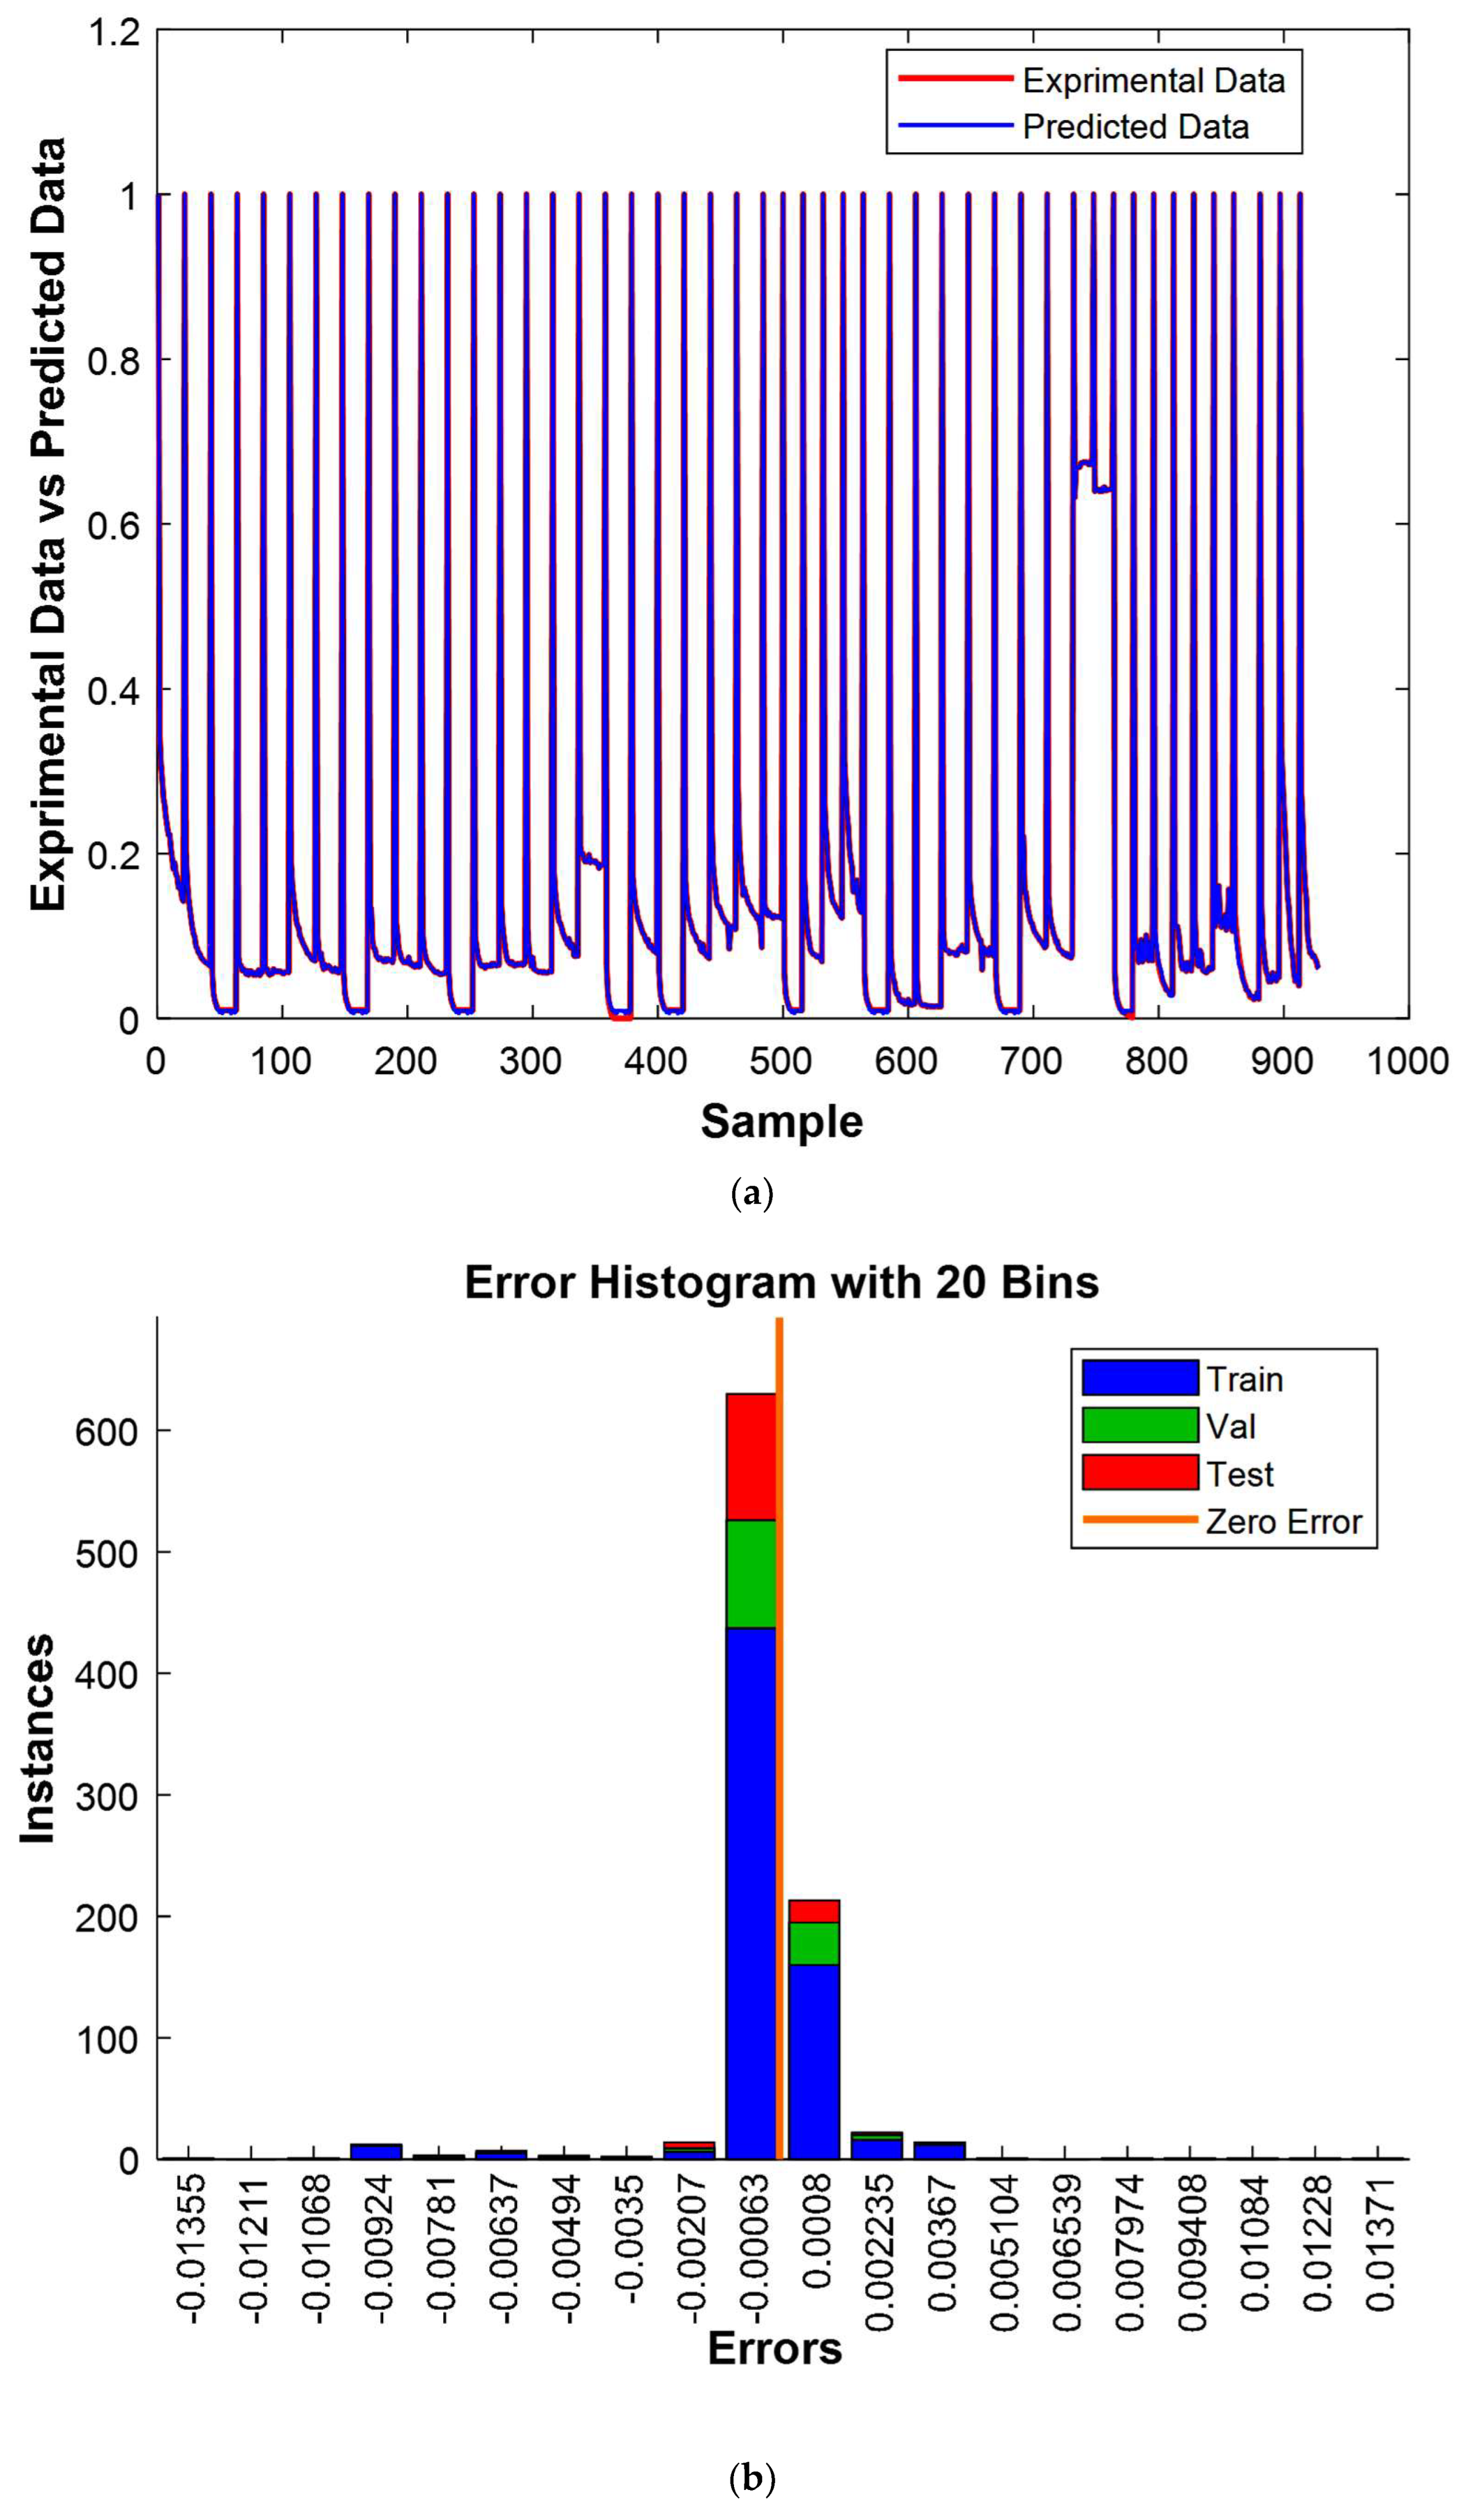
In this section, a comprehensive and meticulous evaluation was carried out to thoroughly assess the performance and effectiveness of the selected model. This multifaceted evaluation incorporated the use of both the residual method and an error histogram, spanning various phases, including training, validation, and testing [
36]. Following this, a detailed comparative analysis was executed by superimposing experimental values onto predicted values, encompassing all data points, including those from the training, validation, and testing datasets, as elegantly depicted in
Figure 16a. Furthermore, an in-depth error quantification was performed by painstakingly scrutinizing the disparities between the experimental and predicted values for the entire dataset, which included data from the training, validation, and testing sets, in accordance with established methodologies. This comprehensive error assessment was then thoughtfully visualized in
Figure 16b, making use of advanced residual analysis techniques.
The results shown in
Figure 16a elegantly demonstrate a significant concordance between the experimental and predicted values, presenting compelling validation of the model’s effectiveness. Furthermore,
Figure 16b furnishes additional persuasive evidence of the model’s efficiency, with 800 out of 928 experimental values closely mirroring their predicted counterparts, resulting in only minor deviations. It is noteworthy that the residual errors for the remaining 128 cases were also exceptionally minuscule, further accentuating the model’s remarkable performance. These comprehensive observations undeniably establish the model’s robustness and precision beyond doubt.
3.2.3. Optimization and Validation
In order to enhance the degradation conditions of CV, the exceptional capabilities of the Improved Grey Wolf Optimization (IGWO) algorithm were harnessed [
70]. IGWO, inspired by collaborative hunting strategies of gray wolves, stands out as a robust metaheuristic optimization technique, renowned for its ability to navigate complex solution spaces [
46]. What sets IGWO apart is its adept balancing act, combining an exploratory phase for broad-scale exploration and an exploitation phase for identifying local optima [
70]. This dynamic equilibrium ensures a thorough exploration of the solution landscape, making IGWO a valuable tool for addressing optimization challenges [
70]. In this study, the upper and lower parameter bounds were meticulously defined, initiating the optimization process with IGWO, guided by a rigorously developed GPR model. During the optimization phase, the CV concentration, initially set at 10 mM, was systematically adjusted to identify the minimum C/C
0 conditions for the two methods used. Subsequently, the obtained results underwent rigorous laboratory validation. The culmination of this meticulous effort is summarized in
Table 3, where the outcomes of the optimization and validation procedures are presented in detail, accompanied by a comprehensive analysis of discrepancies between predicted and experimental degradation rates.
Table 3 provides a detailed view of the results obtained from the optimization and validation processes for both methods, while highlighting the associated errors. In the context of the “Fenton” method, the minimum conditions required to achieve a C/C
0 of 0.0093 were rigorously established through IGWO. However, it is essential to note that the error associated with this prediction amounts to 0.007, indicating a slight discrepancy compared to the experimental data.
In contrast, the “Fenton coupled with ultrasound” method also had its minimum conditions determined through IGWO, allowing for the attainment of a C/C0 of 0.0276. What is particularly remarkable is that the error associated with this prediction is significantly lower, standing at only 0.0039 in comparison to the experimental values.
These findings shed light on the effectiveness of the model created and the efficiency of the IGWO method in terms of precision in predicting the minimum degradation conditions of CV. This heightened precision is underscored by a substantially reduced error, thereby bolstering confidence in its ability to accurately predict the optimal degradation parameters.
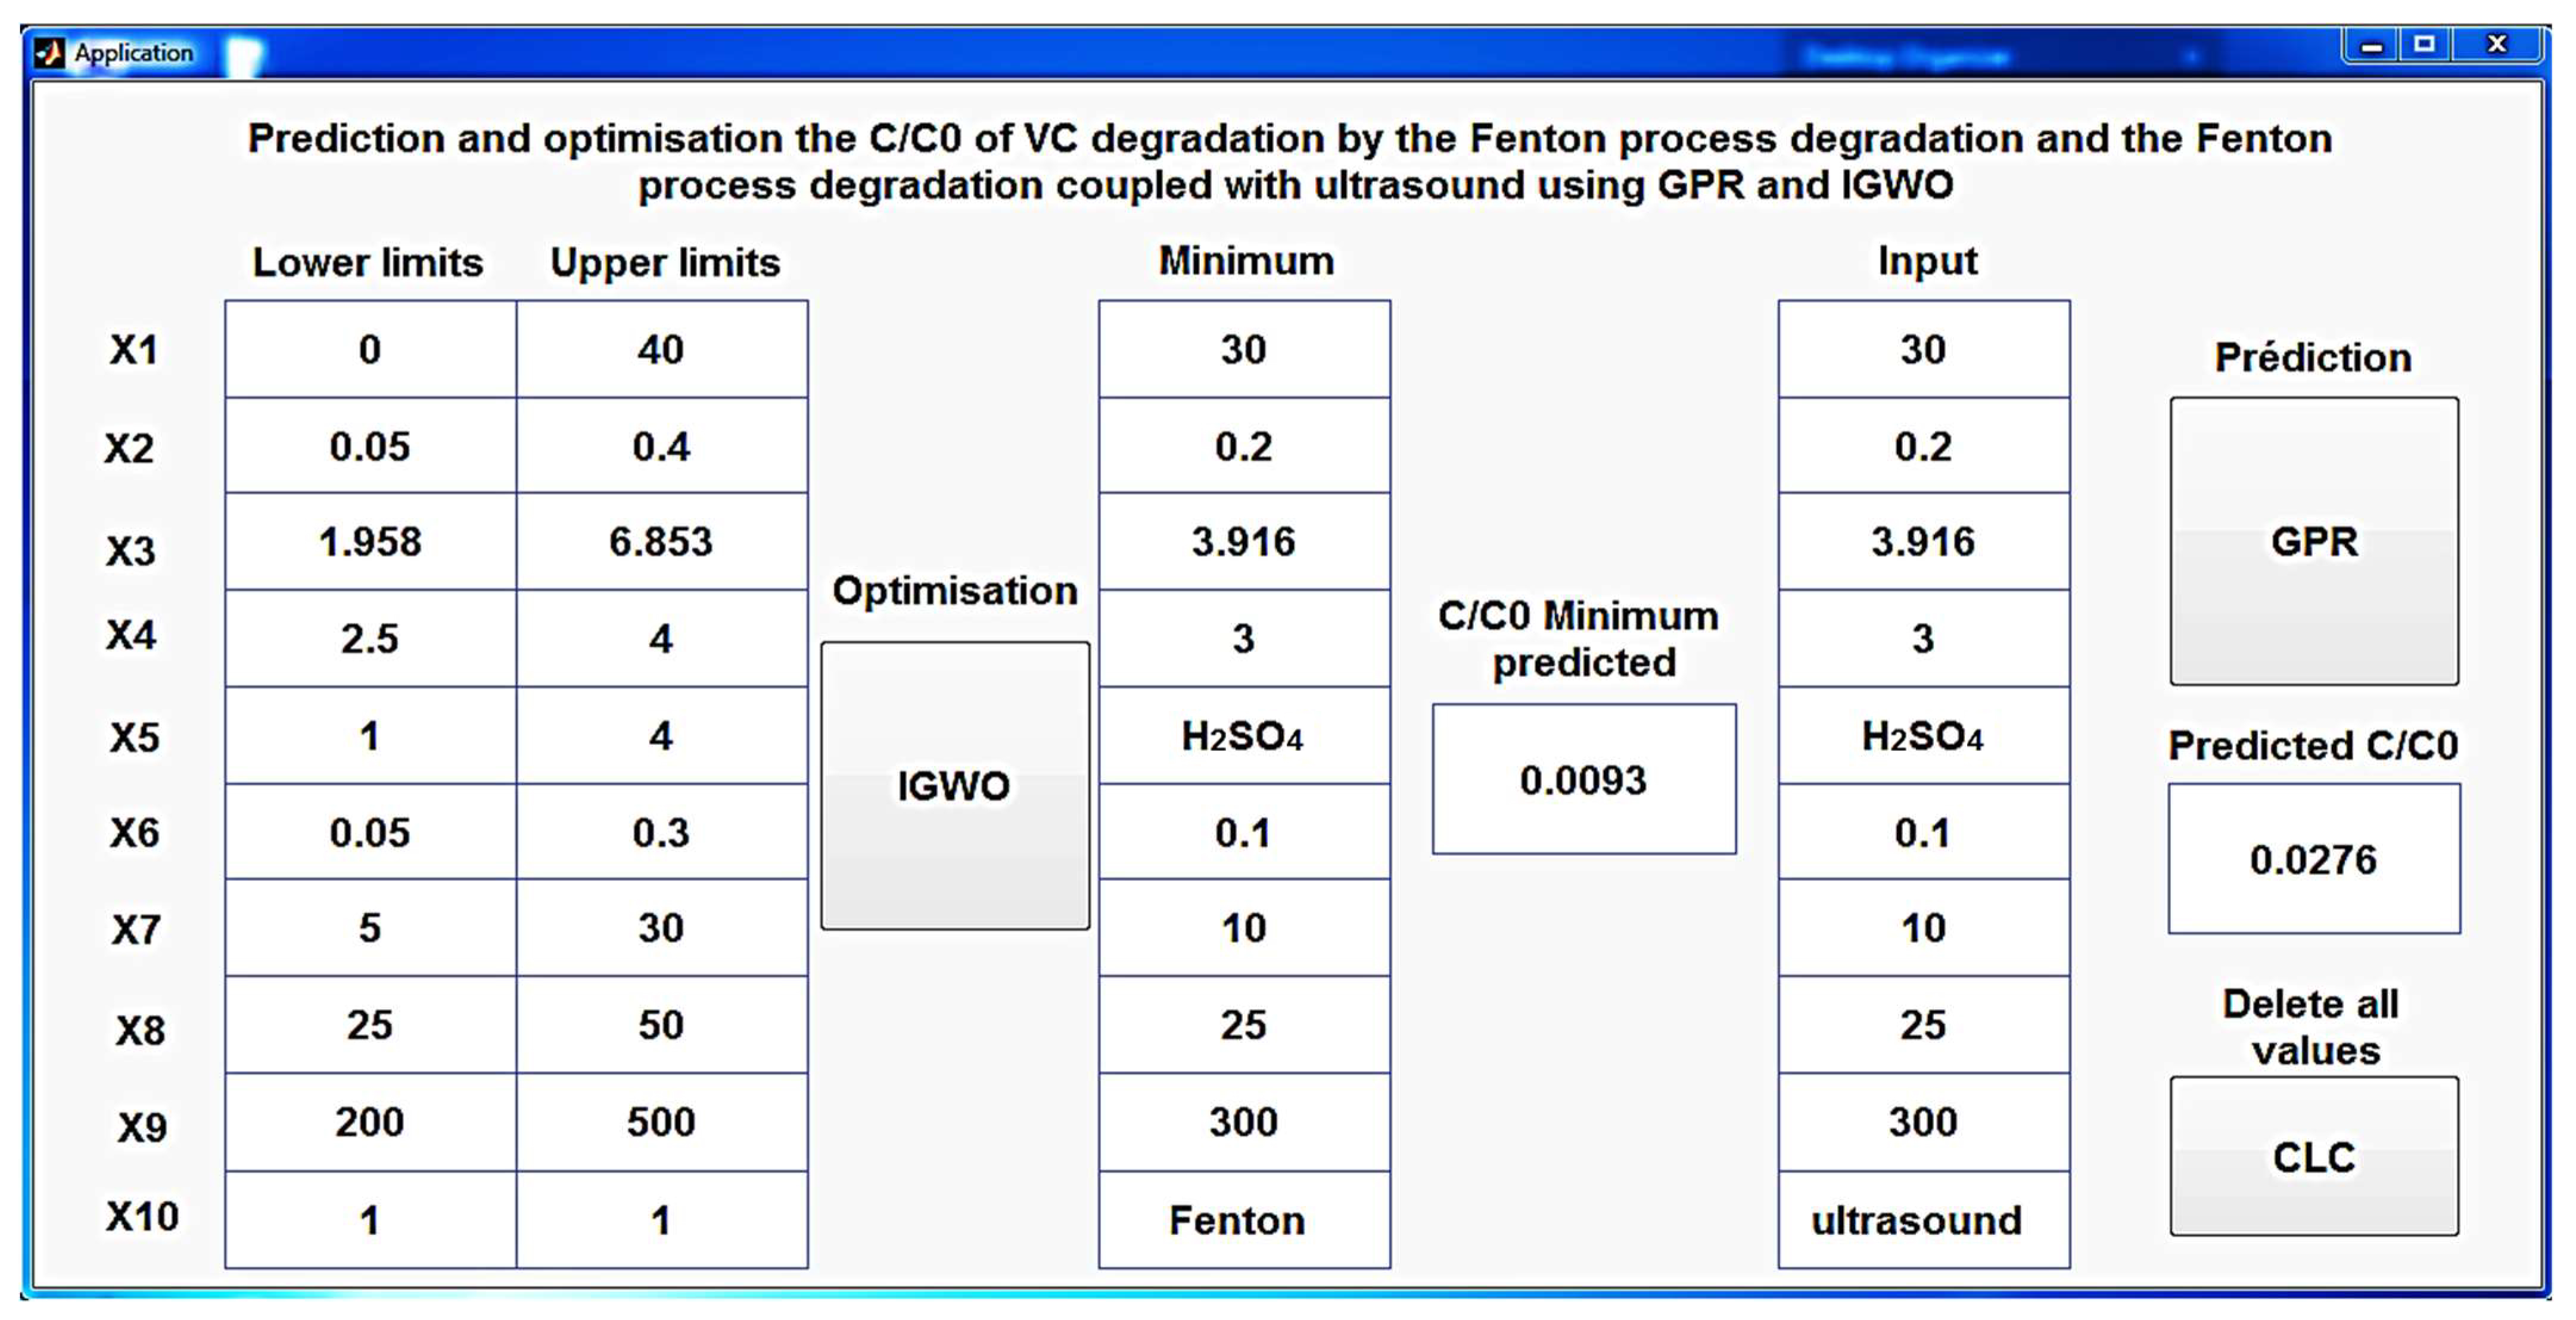
3.3. Interface for Optimization and Prediction
An innovative and meticulously designed MATLAB application (
Figure 17) has been created to shed light on the intricate process of predicting C/C
0 during CV degradation, utilizing the developed GPR model. This user-friendly tool not only simplifies the prediction process for both the Fenton process and the Fenton process coupled with ultrasound but also offers the unique feature of optimizing the conditions that yield the minimal C/C
0 using IGWO. This multifaceted application serves as a powerful and versatile resource, making the intricate science of CV degradation accessible to a broader audience, from researchers to practitioners, while delivering precise and efficient predictions.


 ,
, 


