
An Experimental Study of Different Stratified Water Intake Structures in a Deep-Water Reservoir
Abstract
:1. Research Background
2. Water Temperature Model Design and Test Method
2.1. The Similarity of Water Temperature Stratification Model
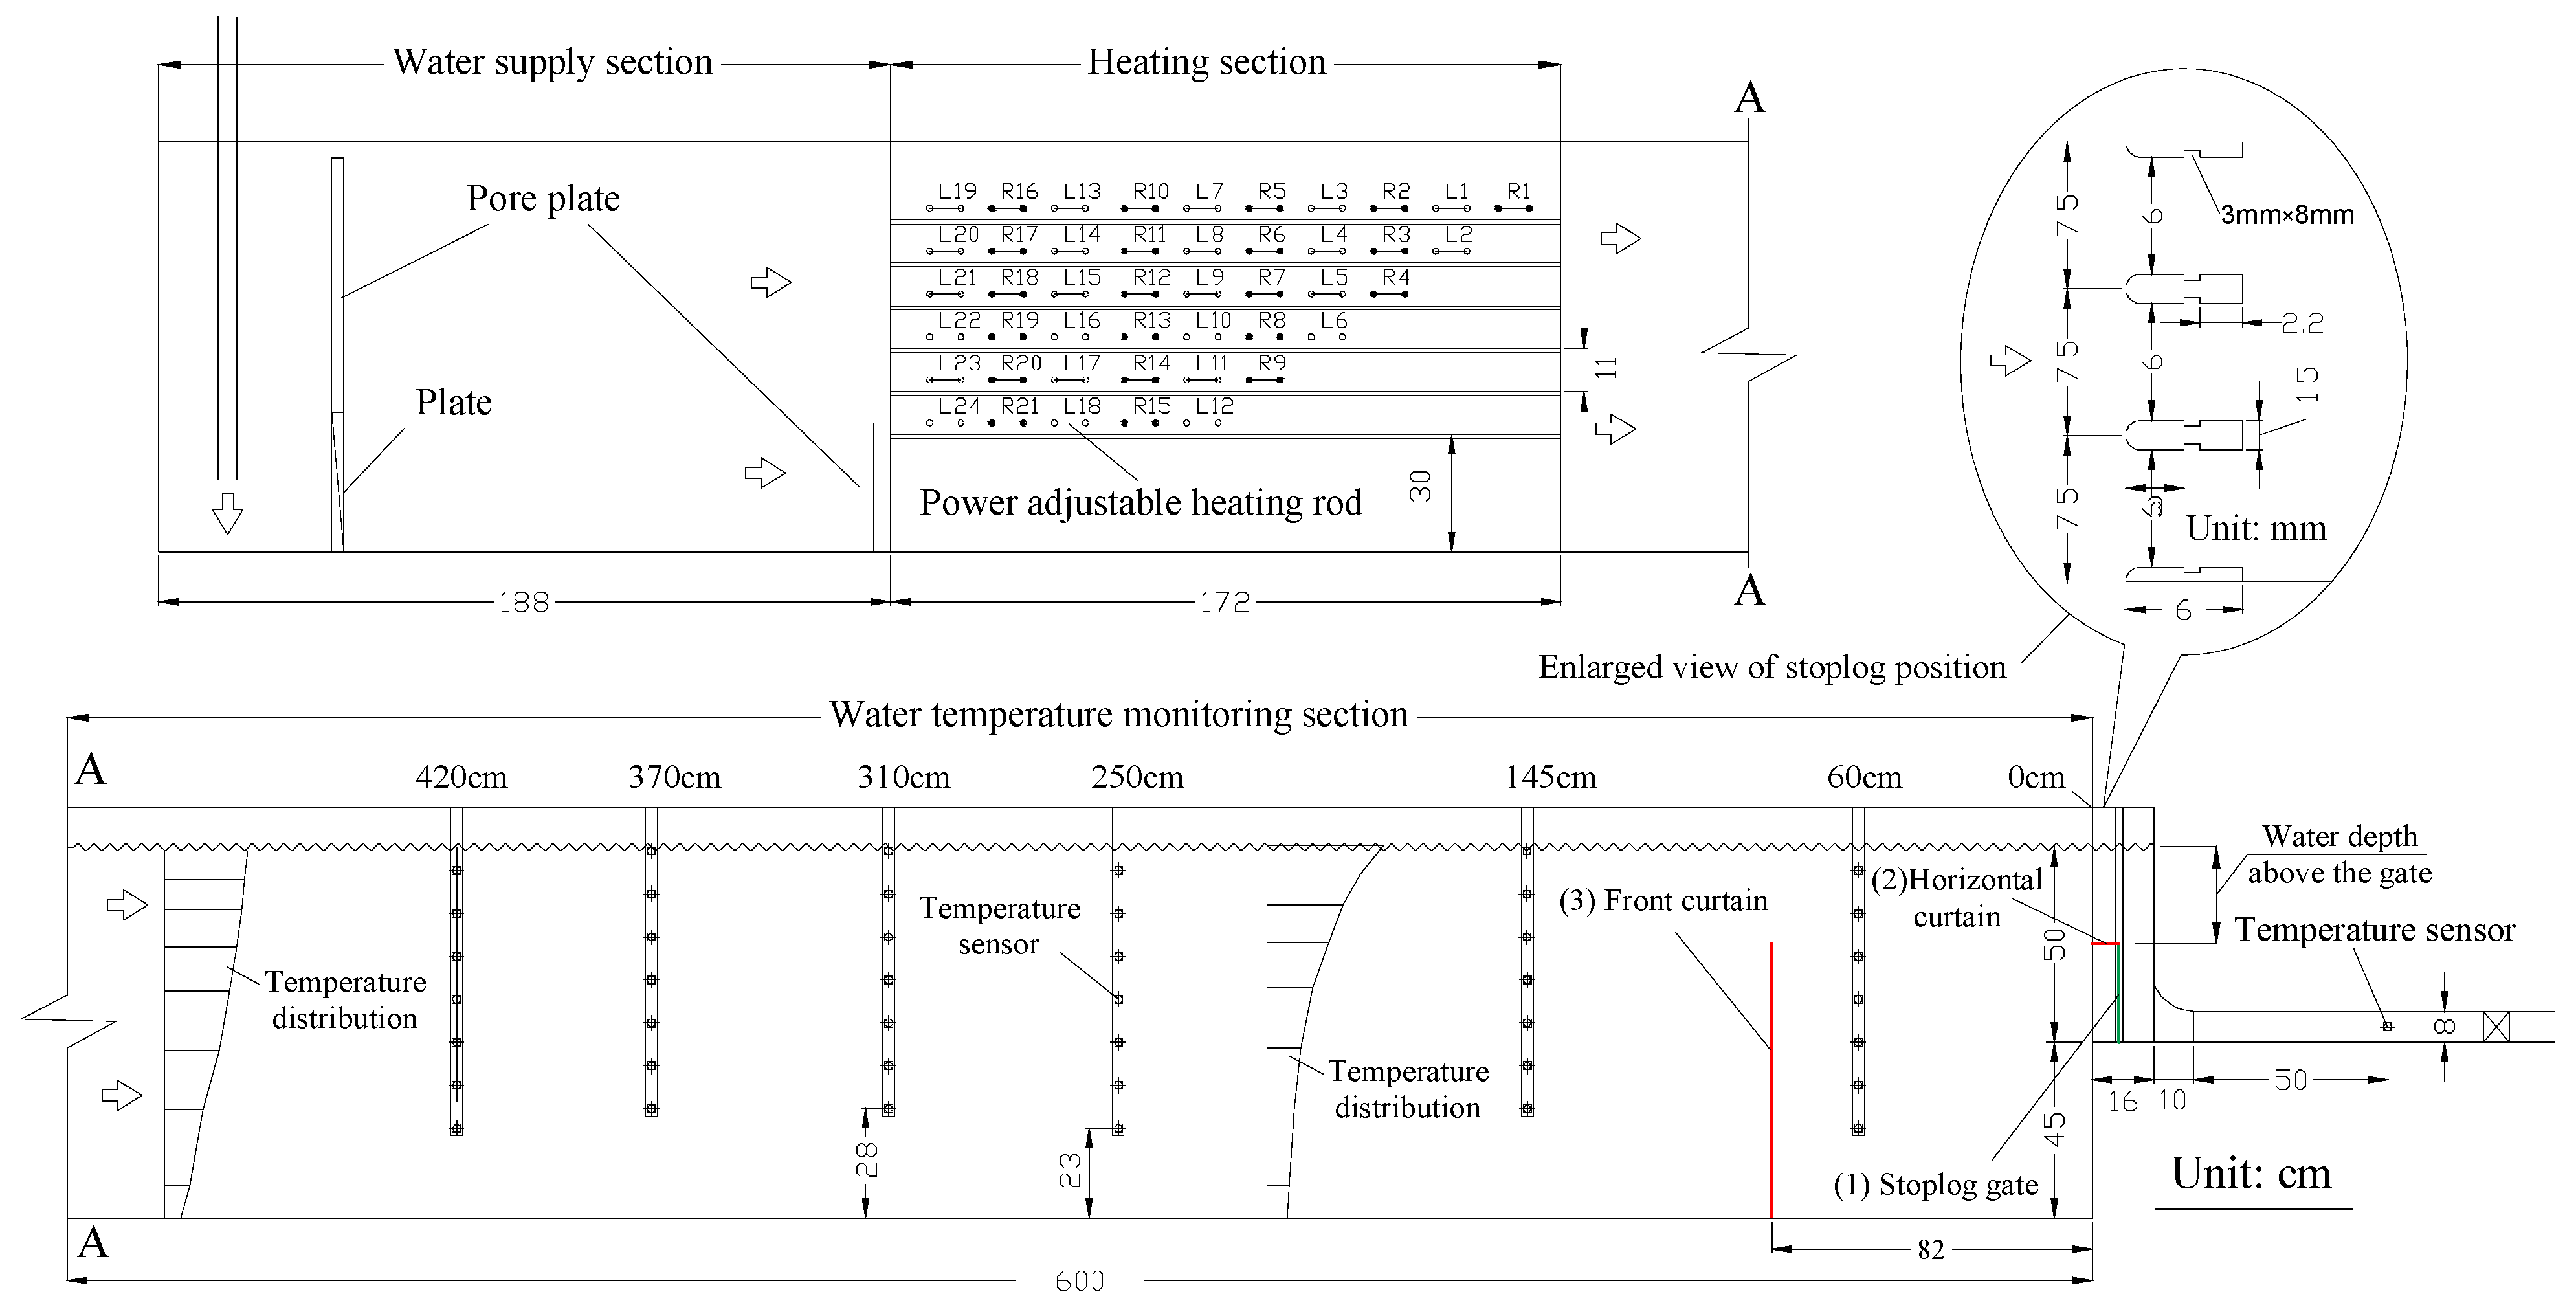
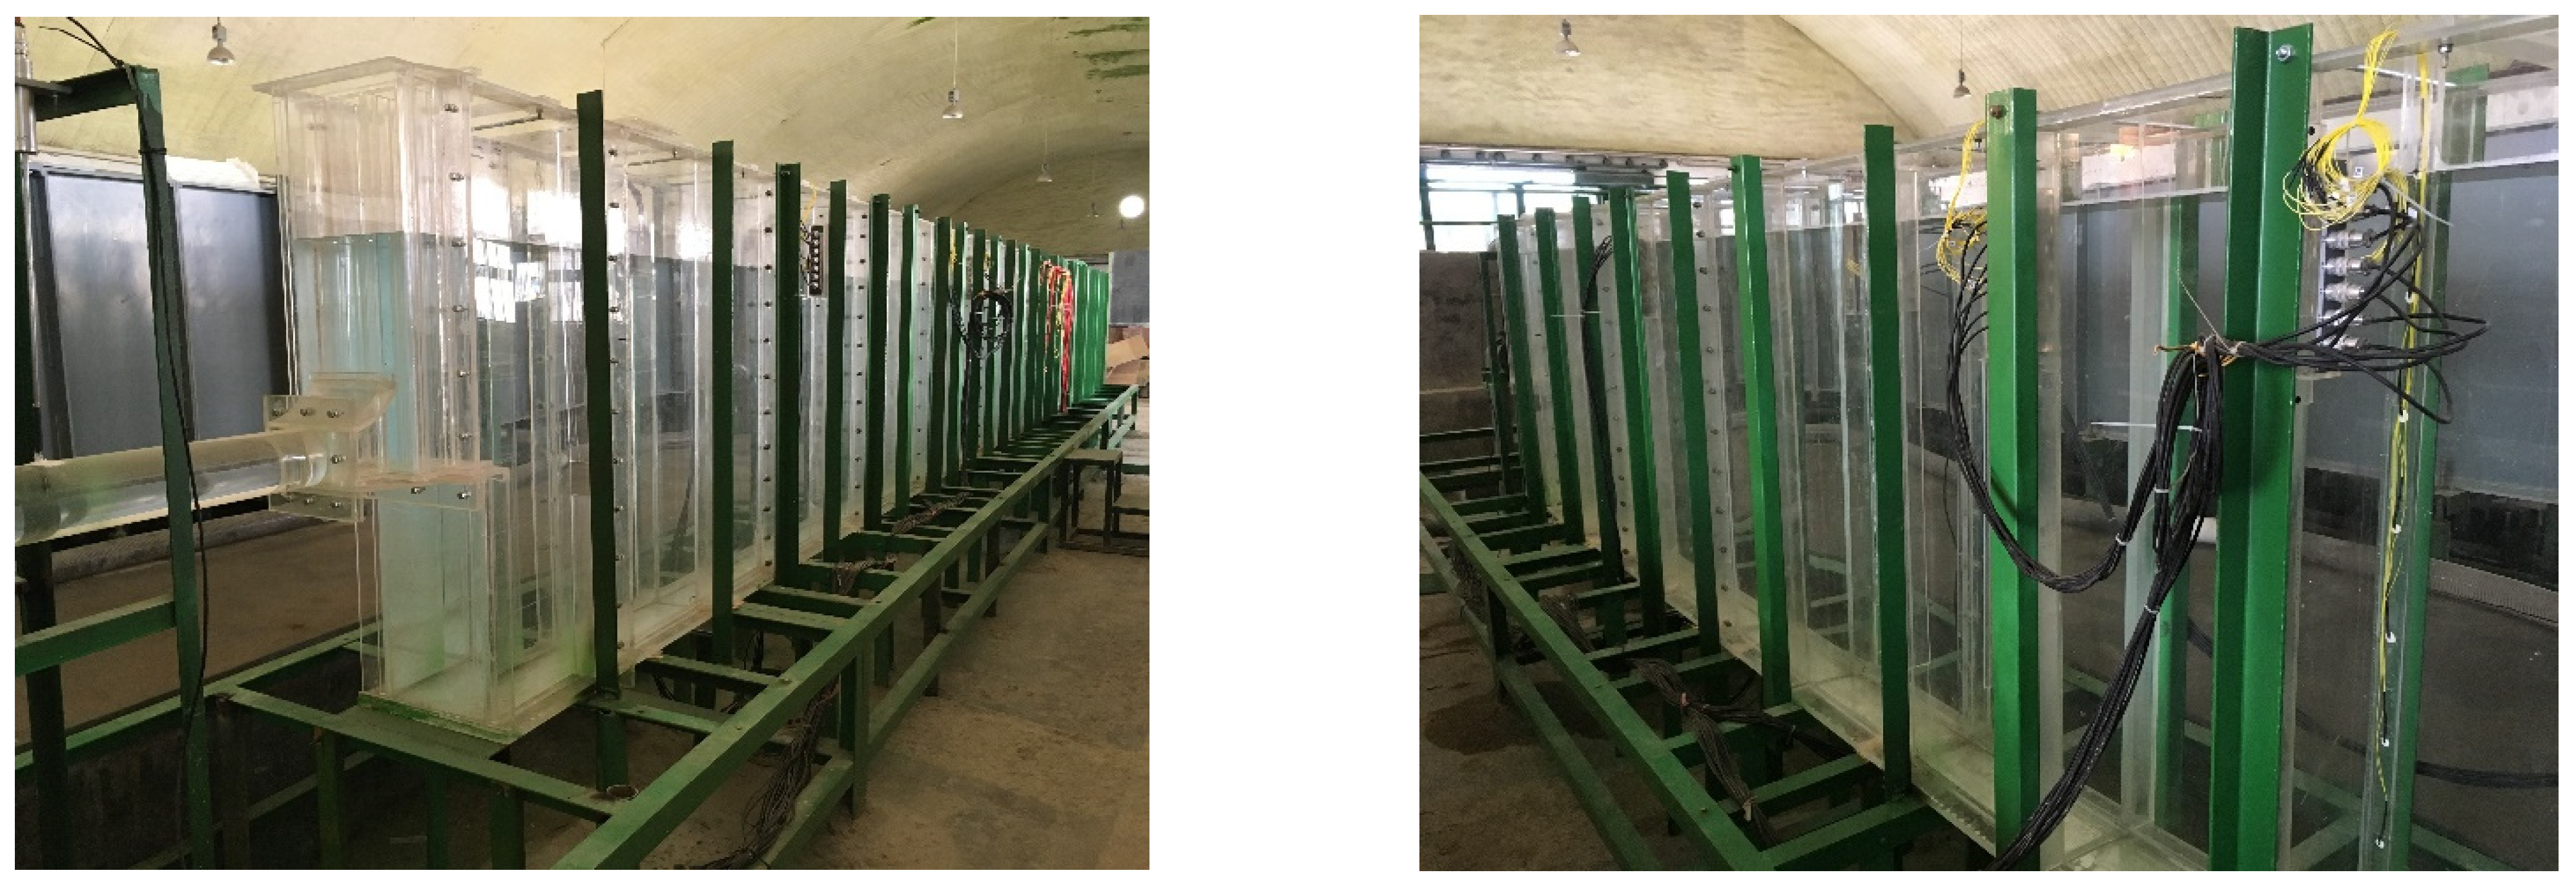
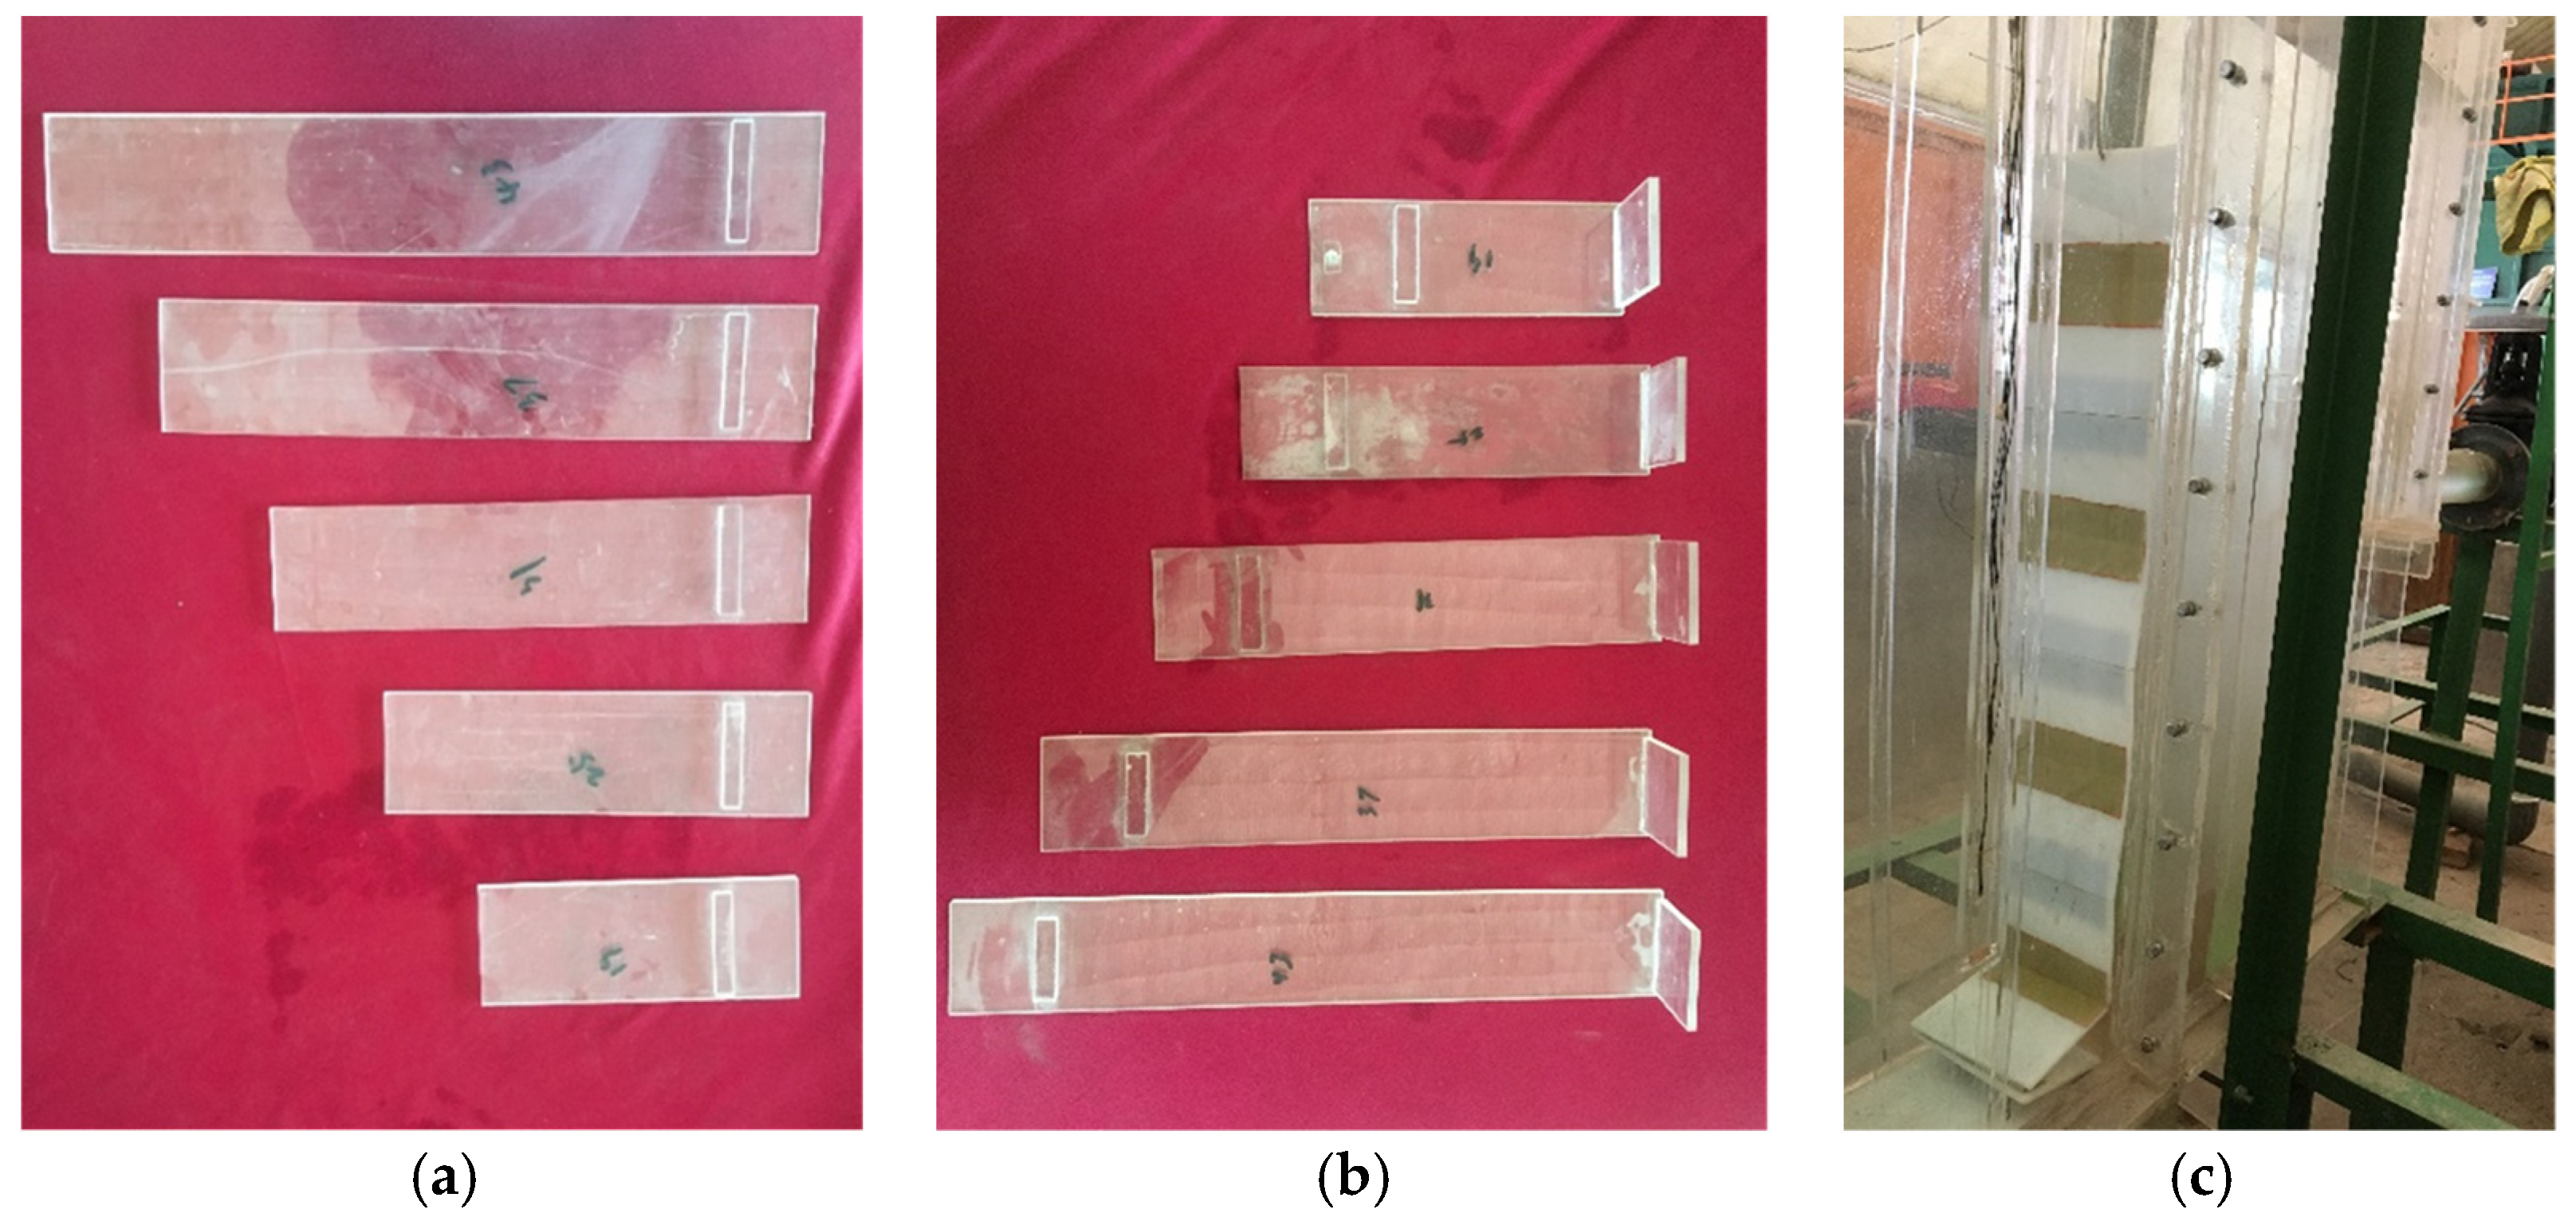
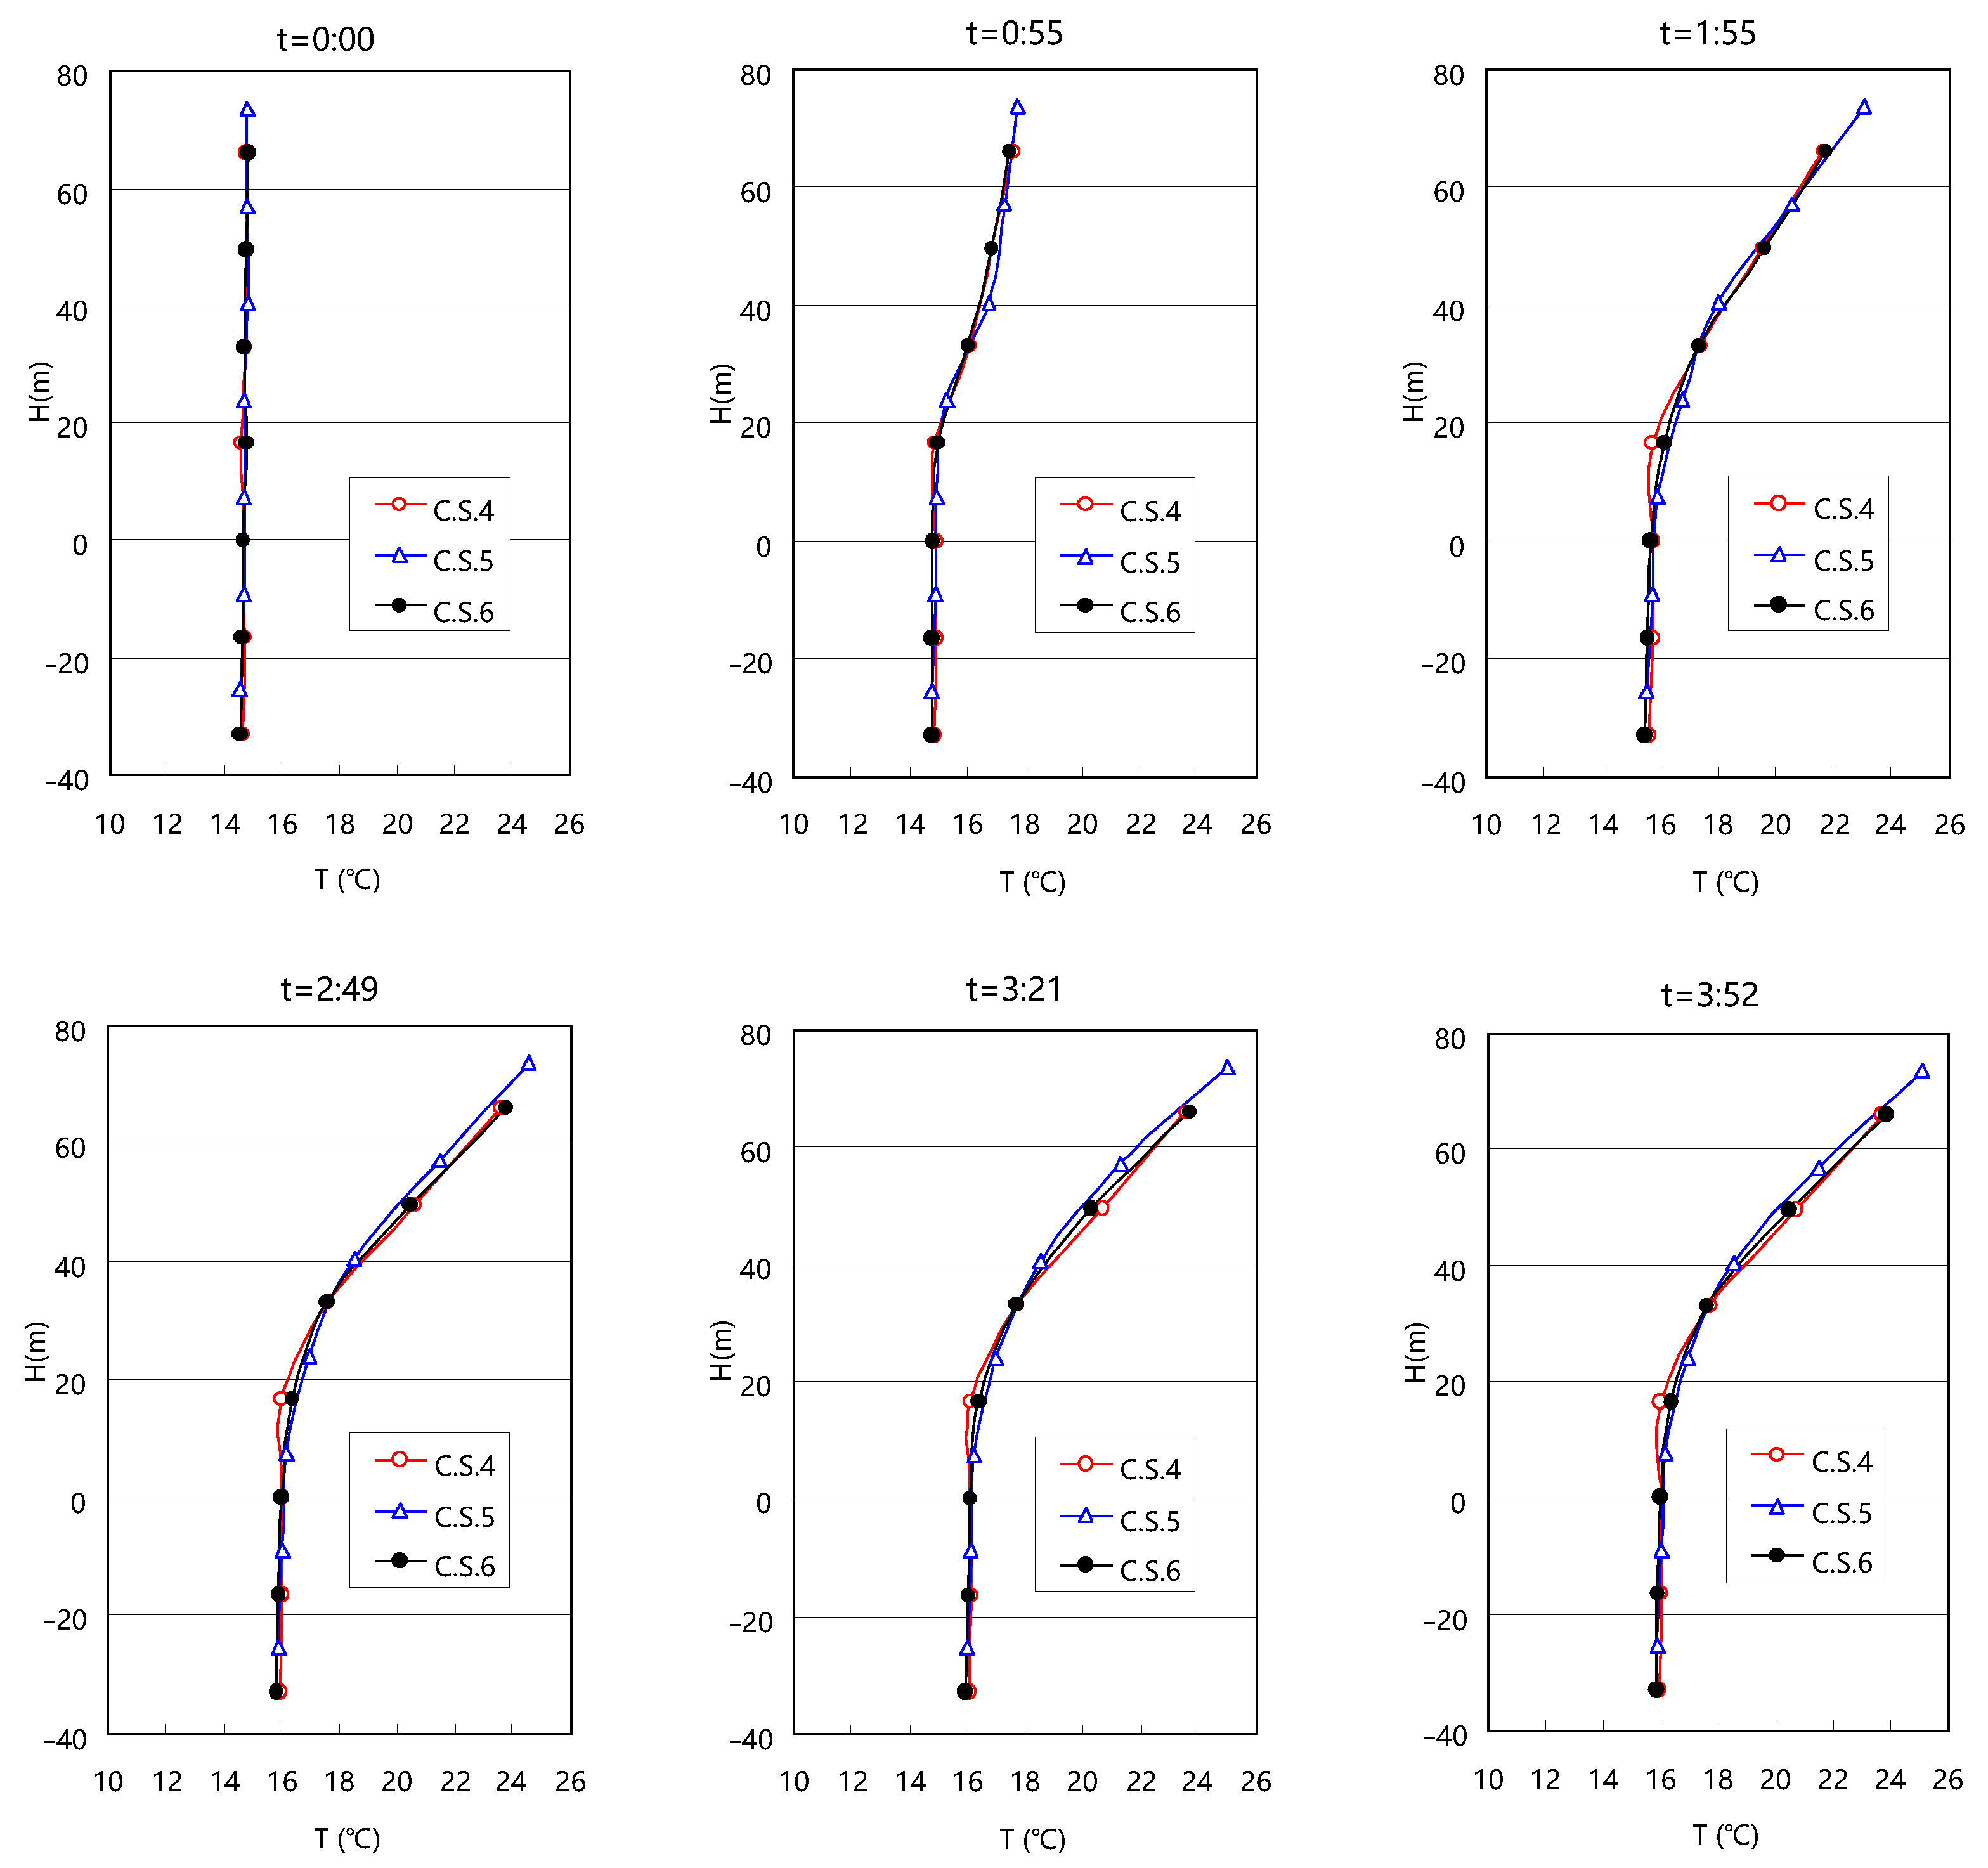
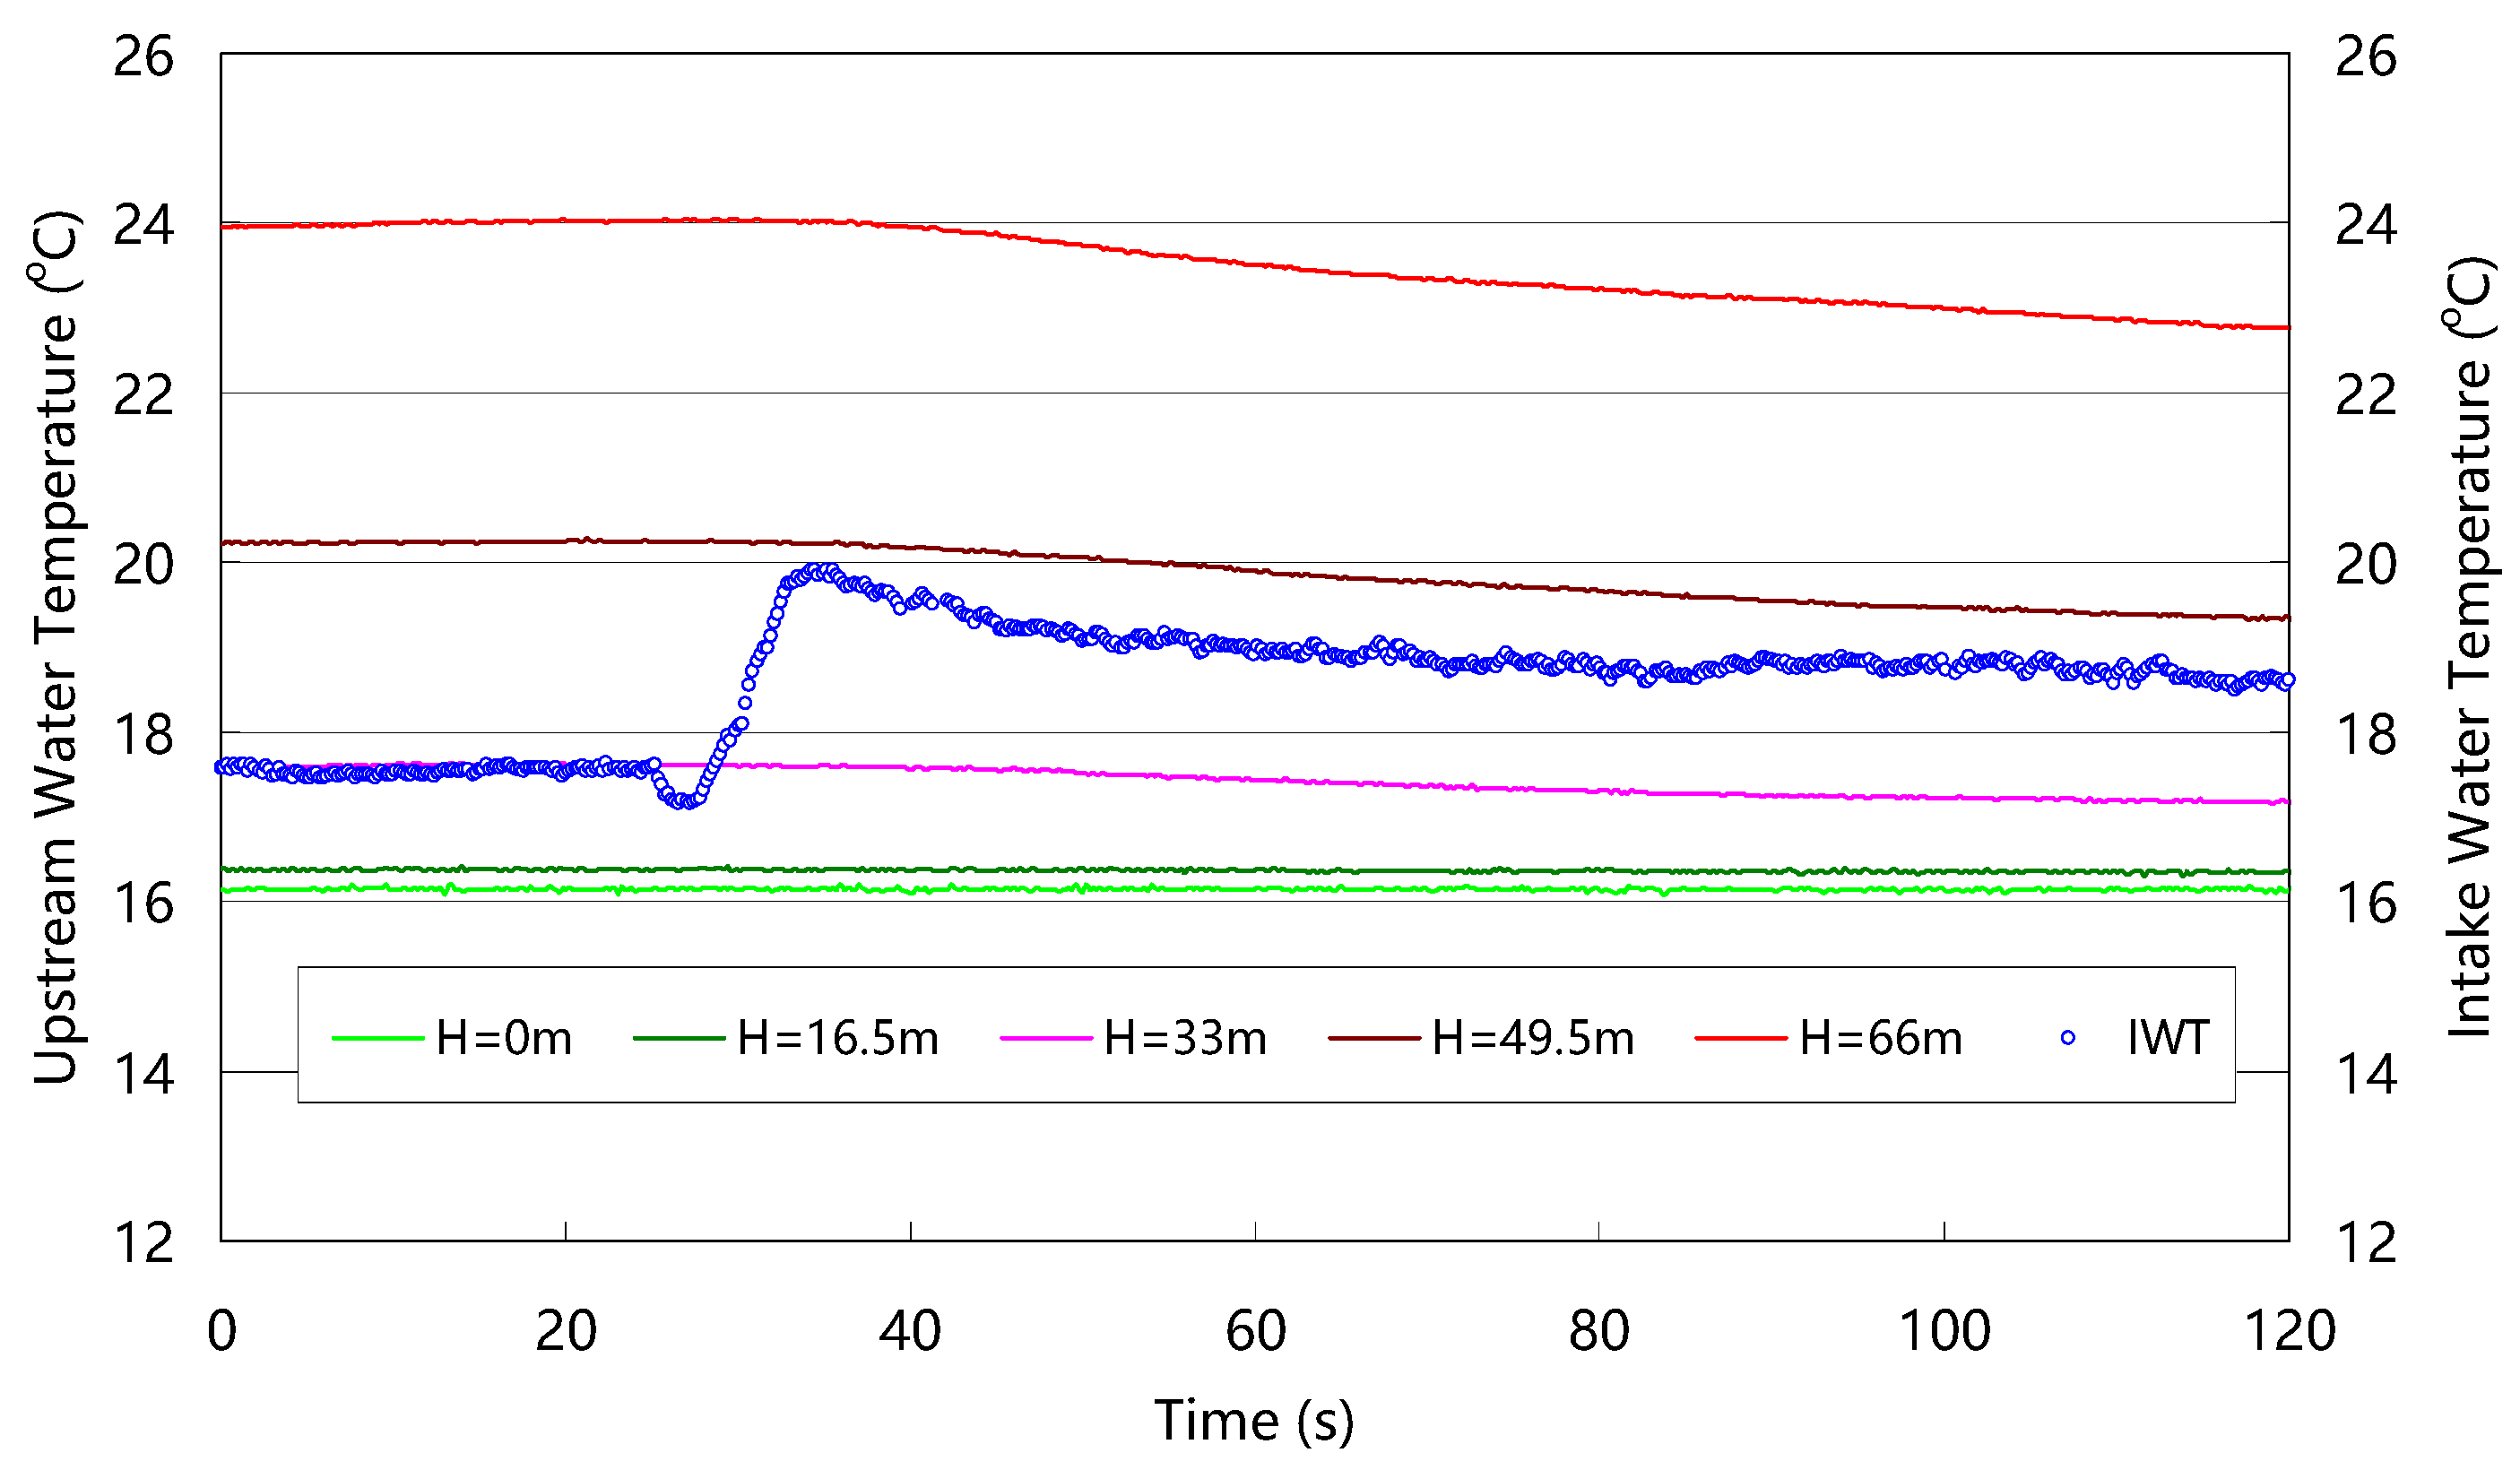
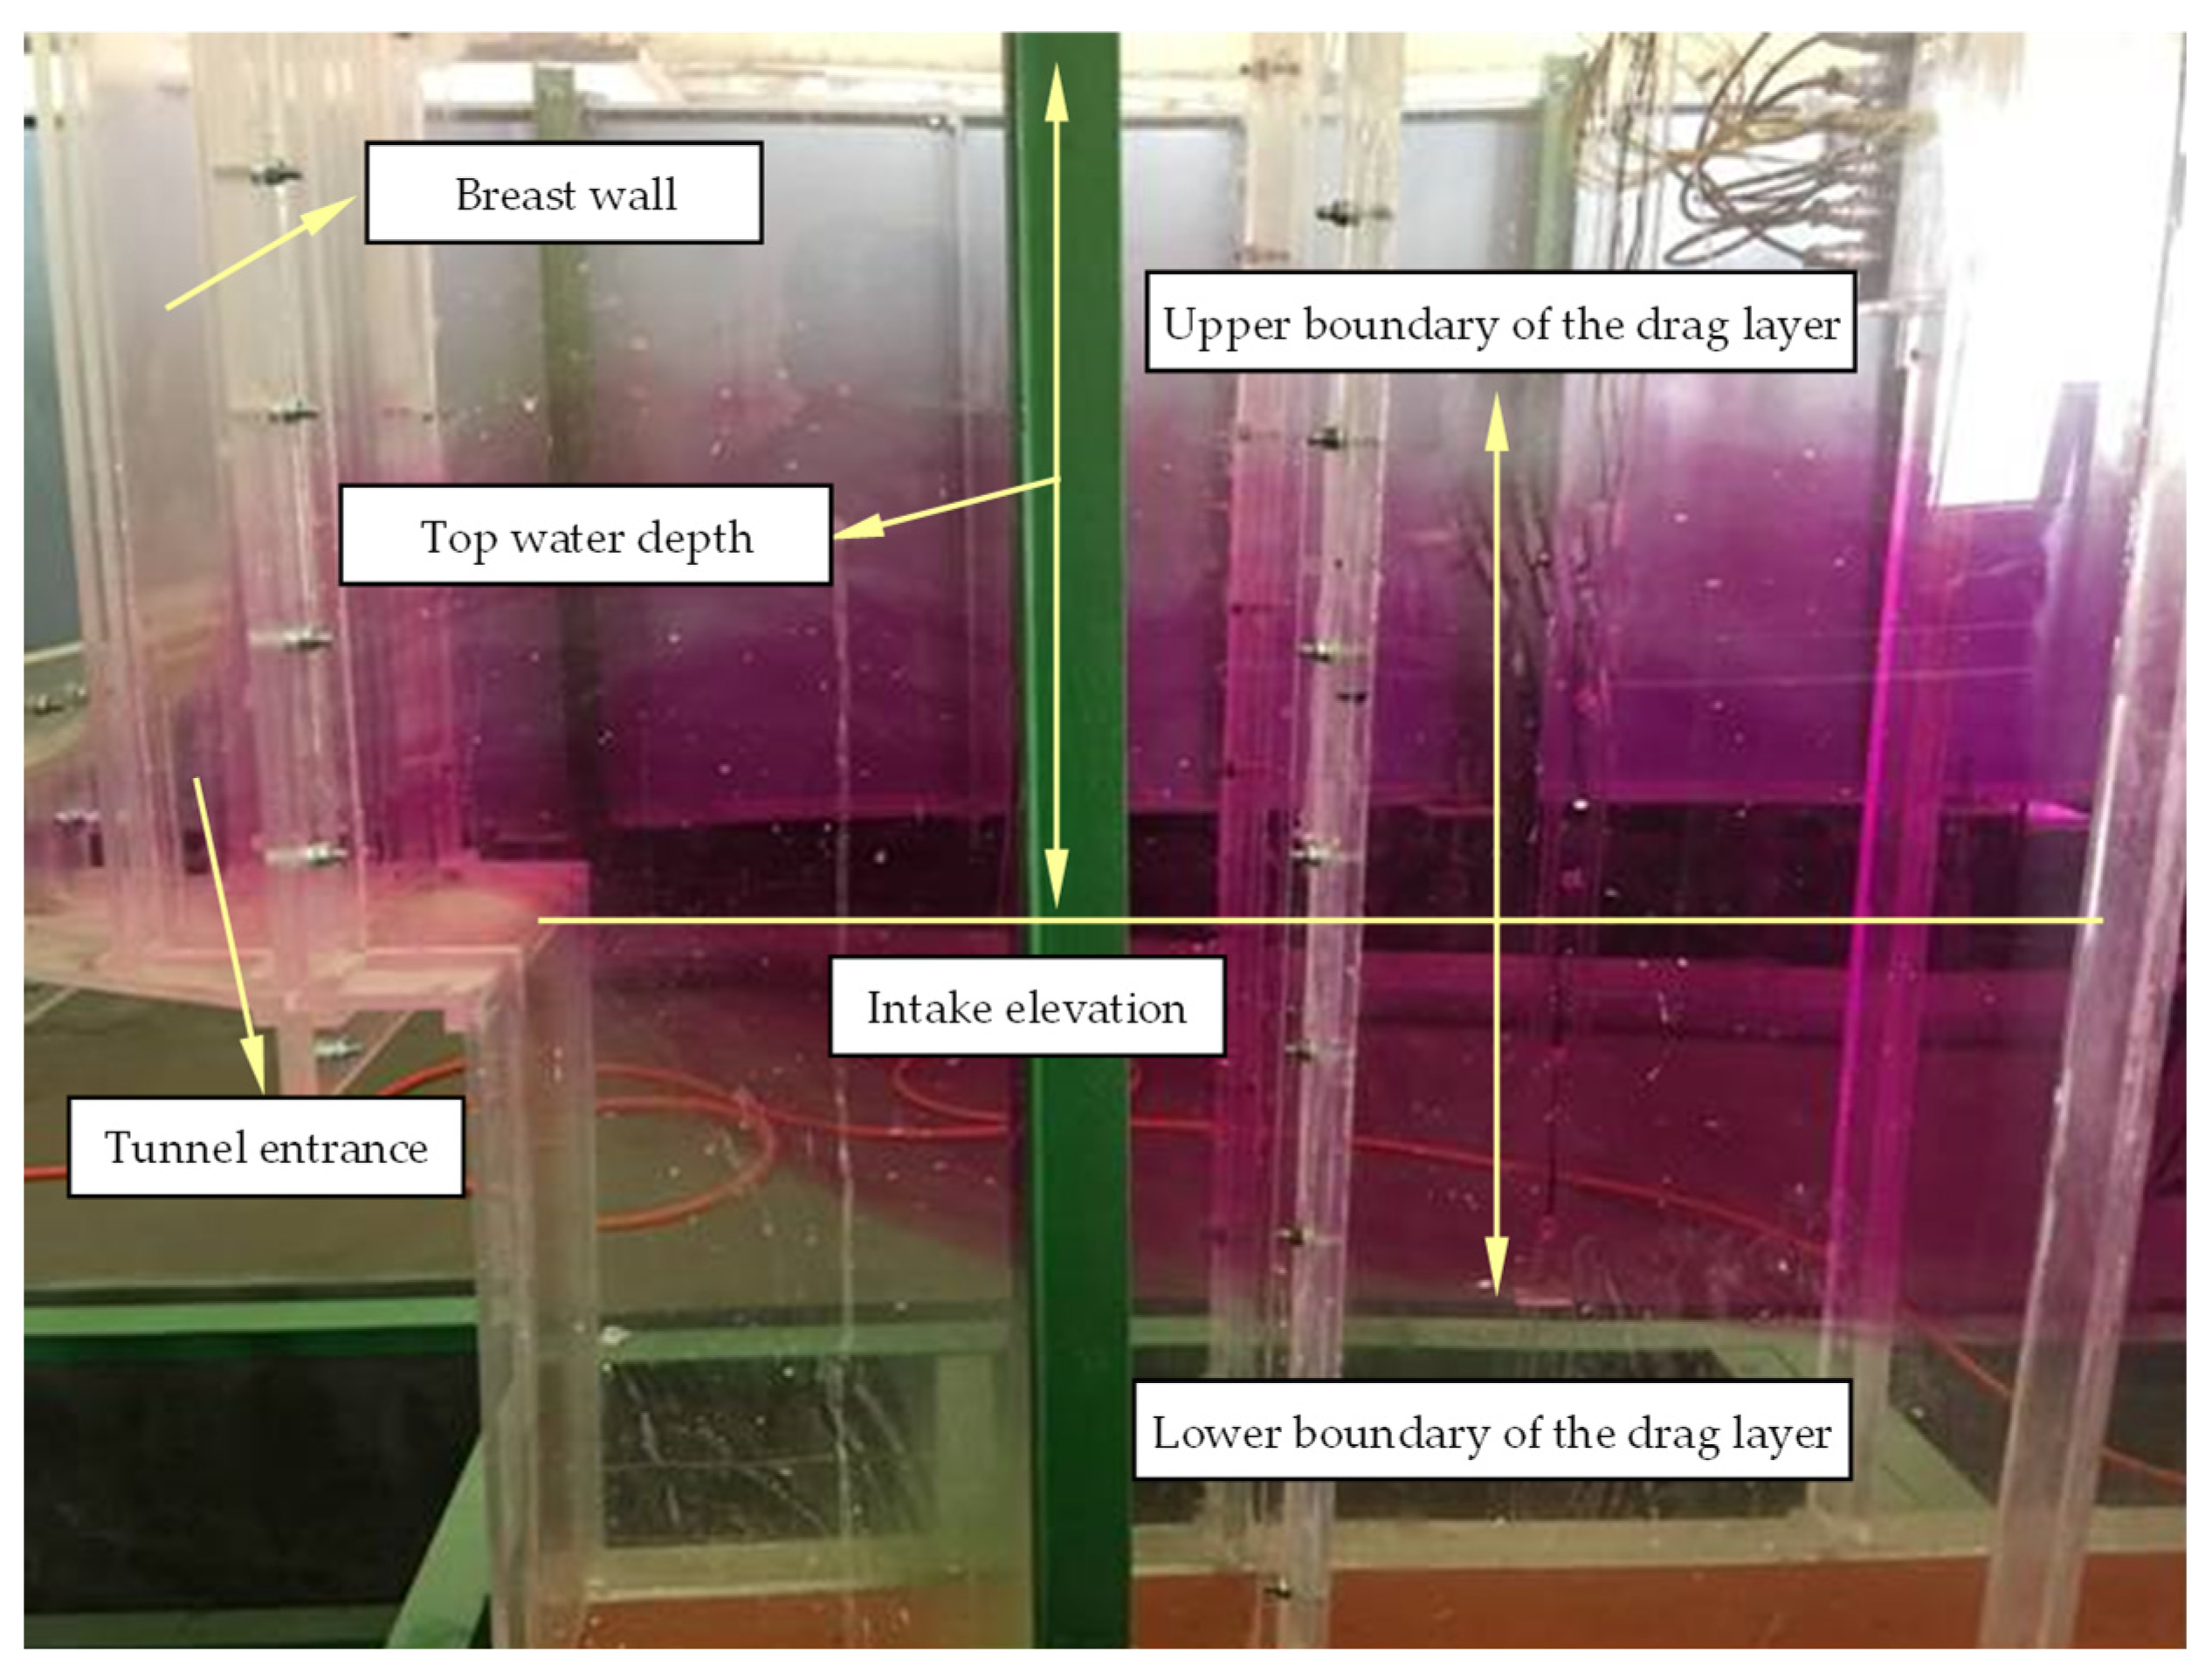
2.2. Test Model Layout and Monitoring Method under Transient Water Intake Conditions
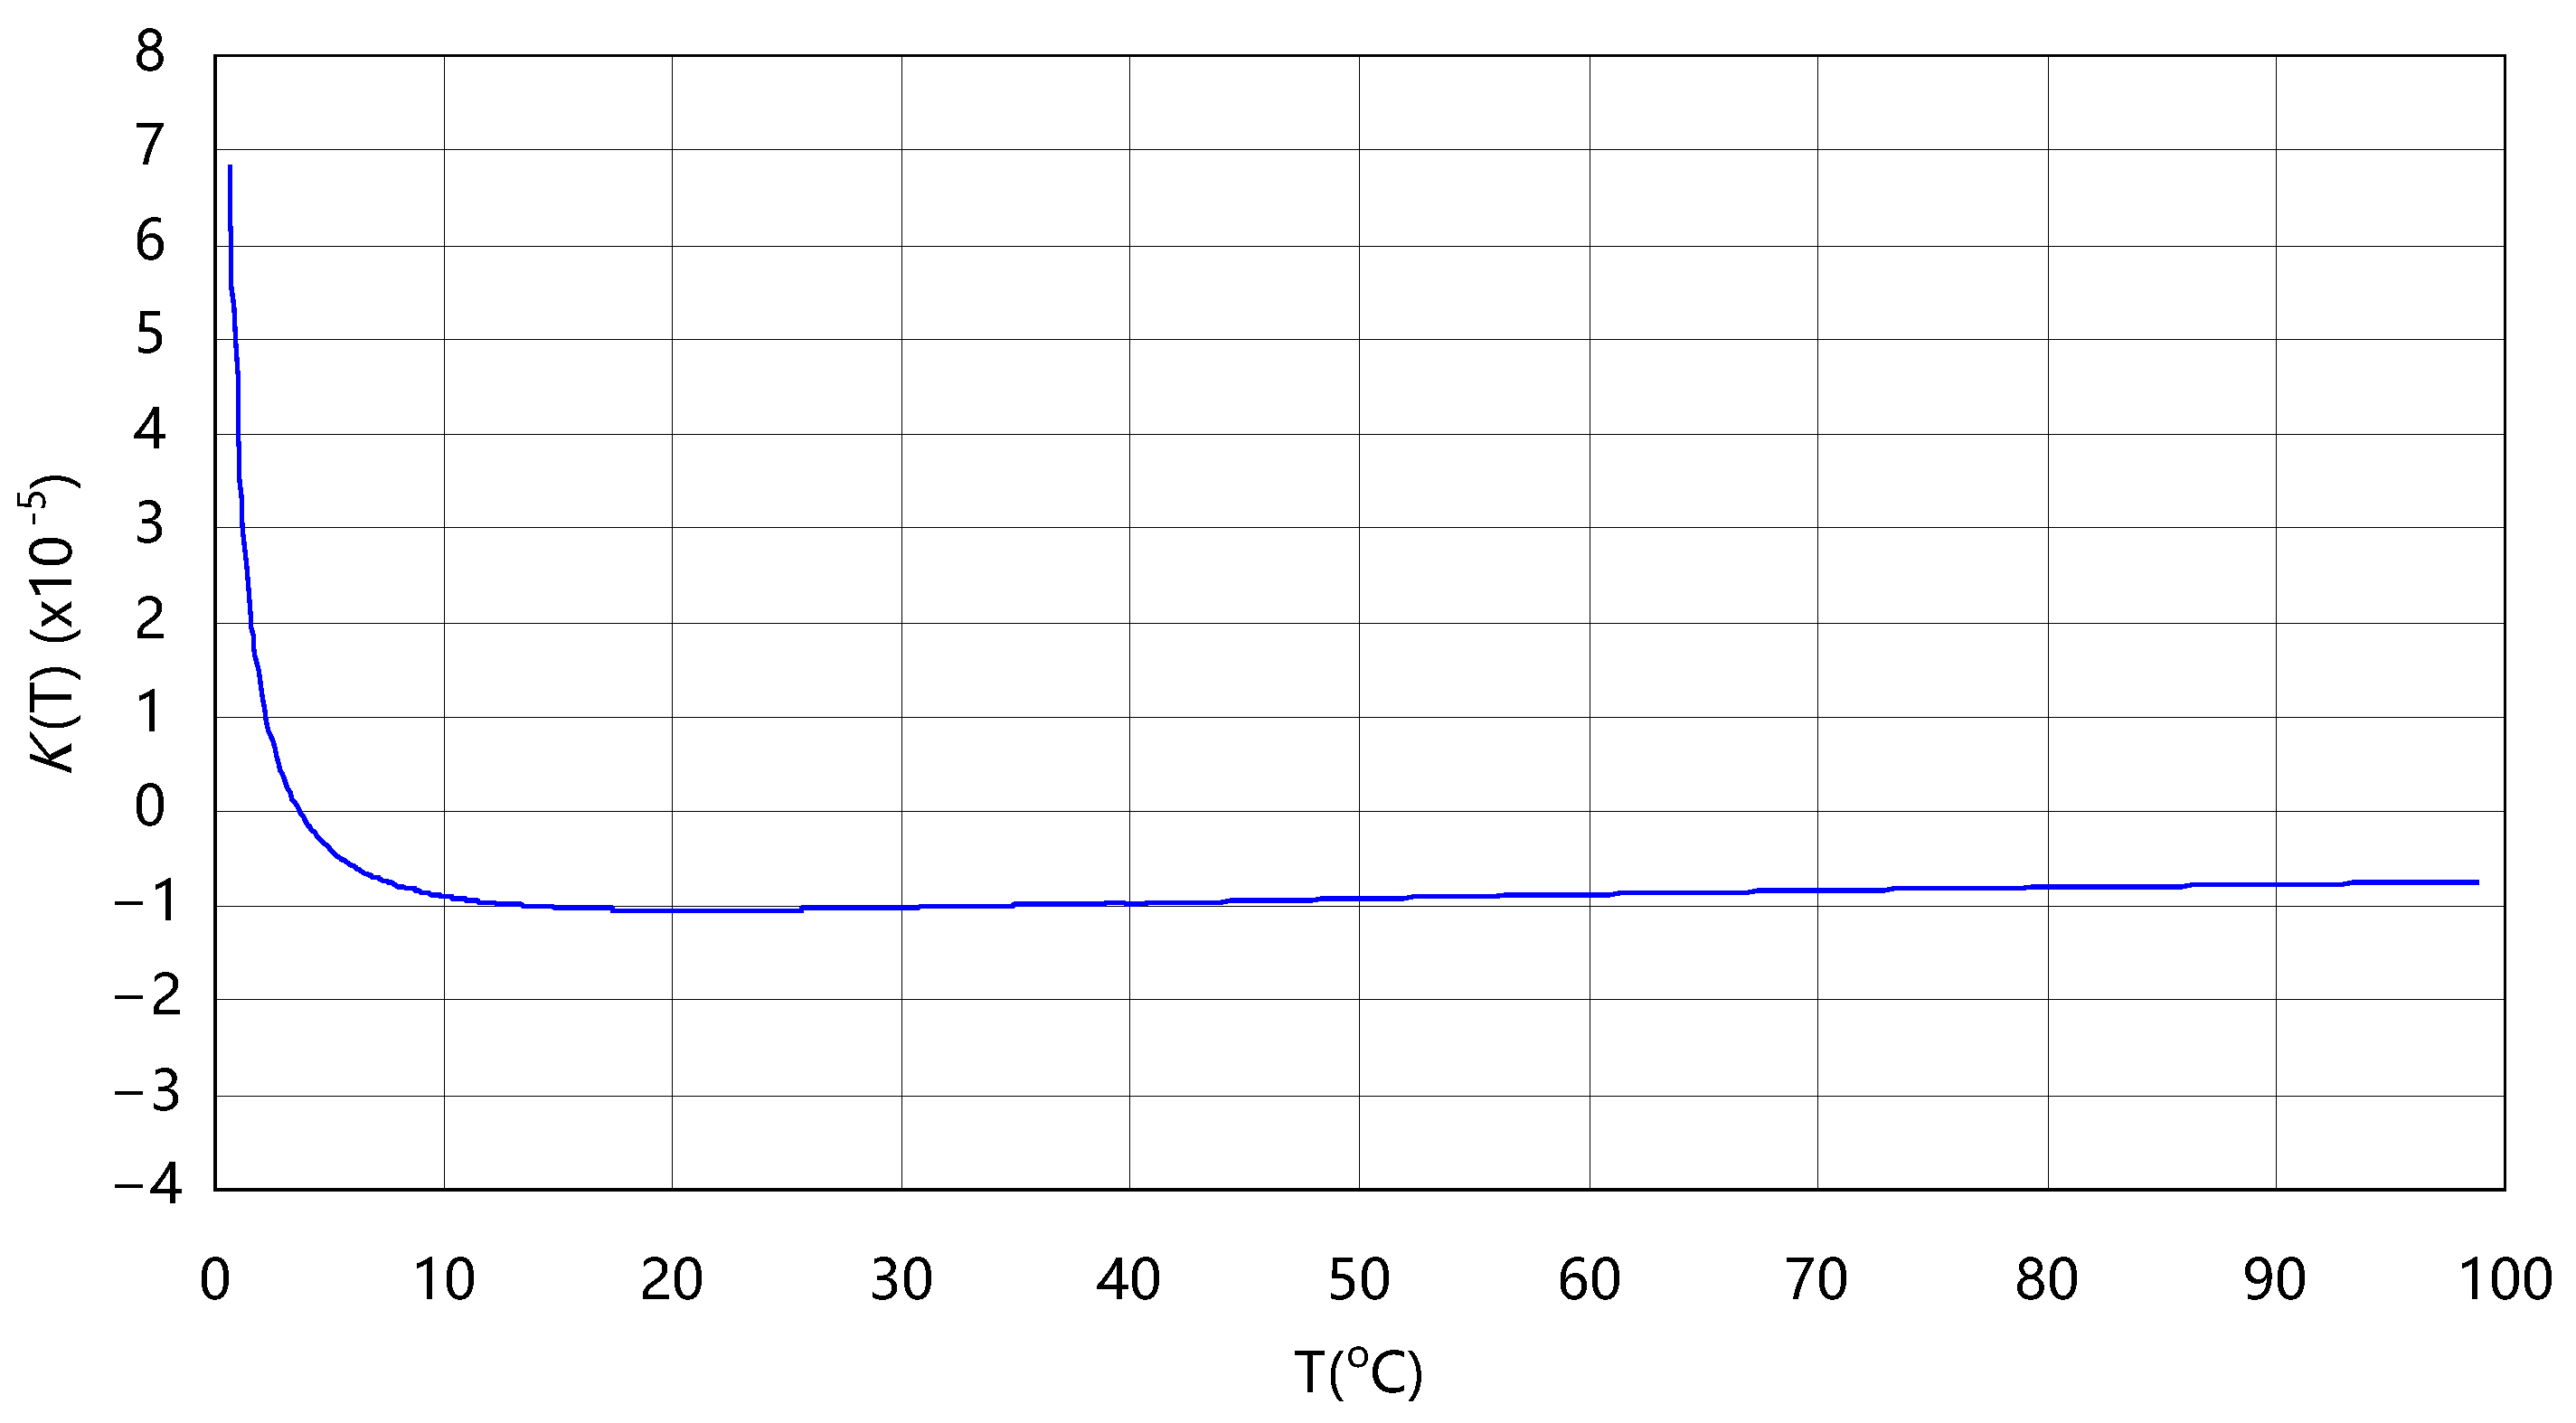
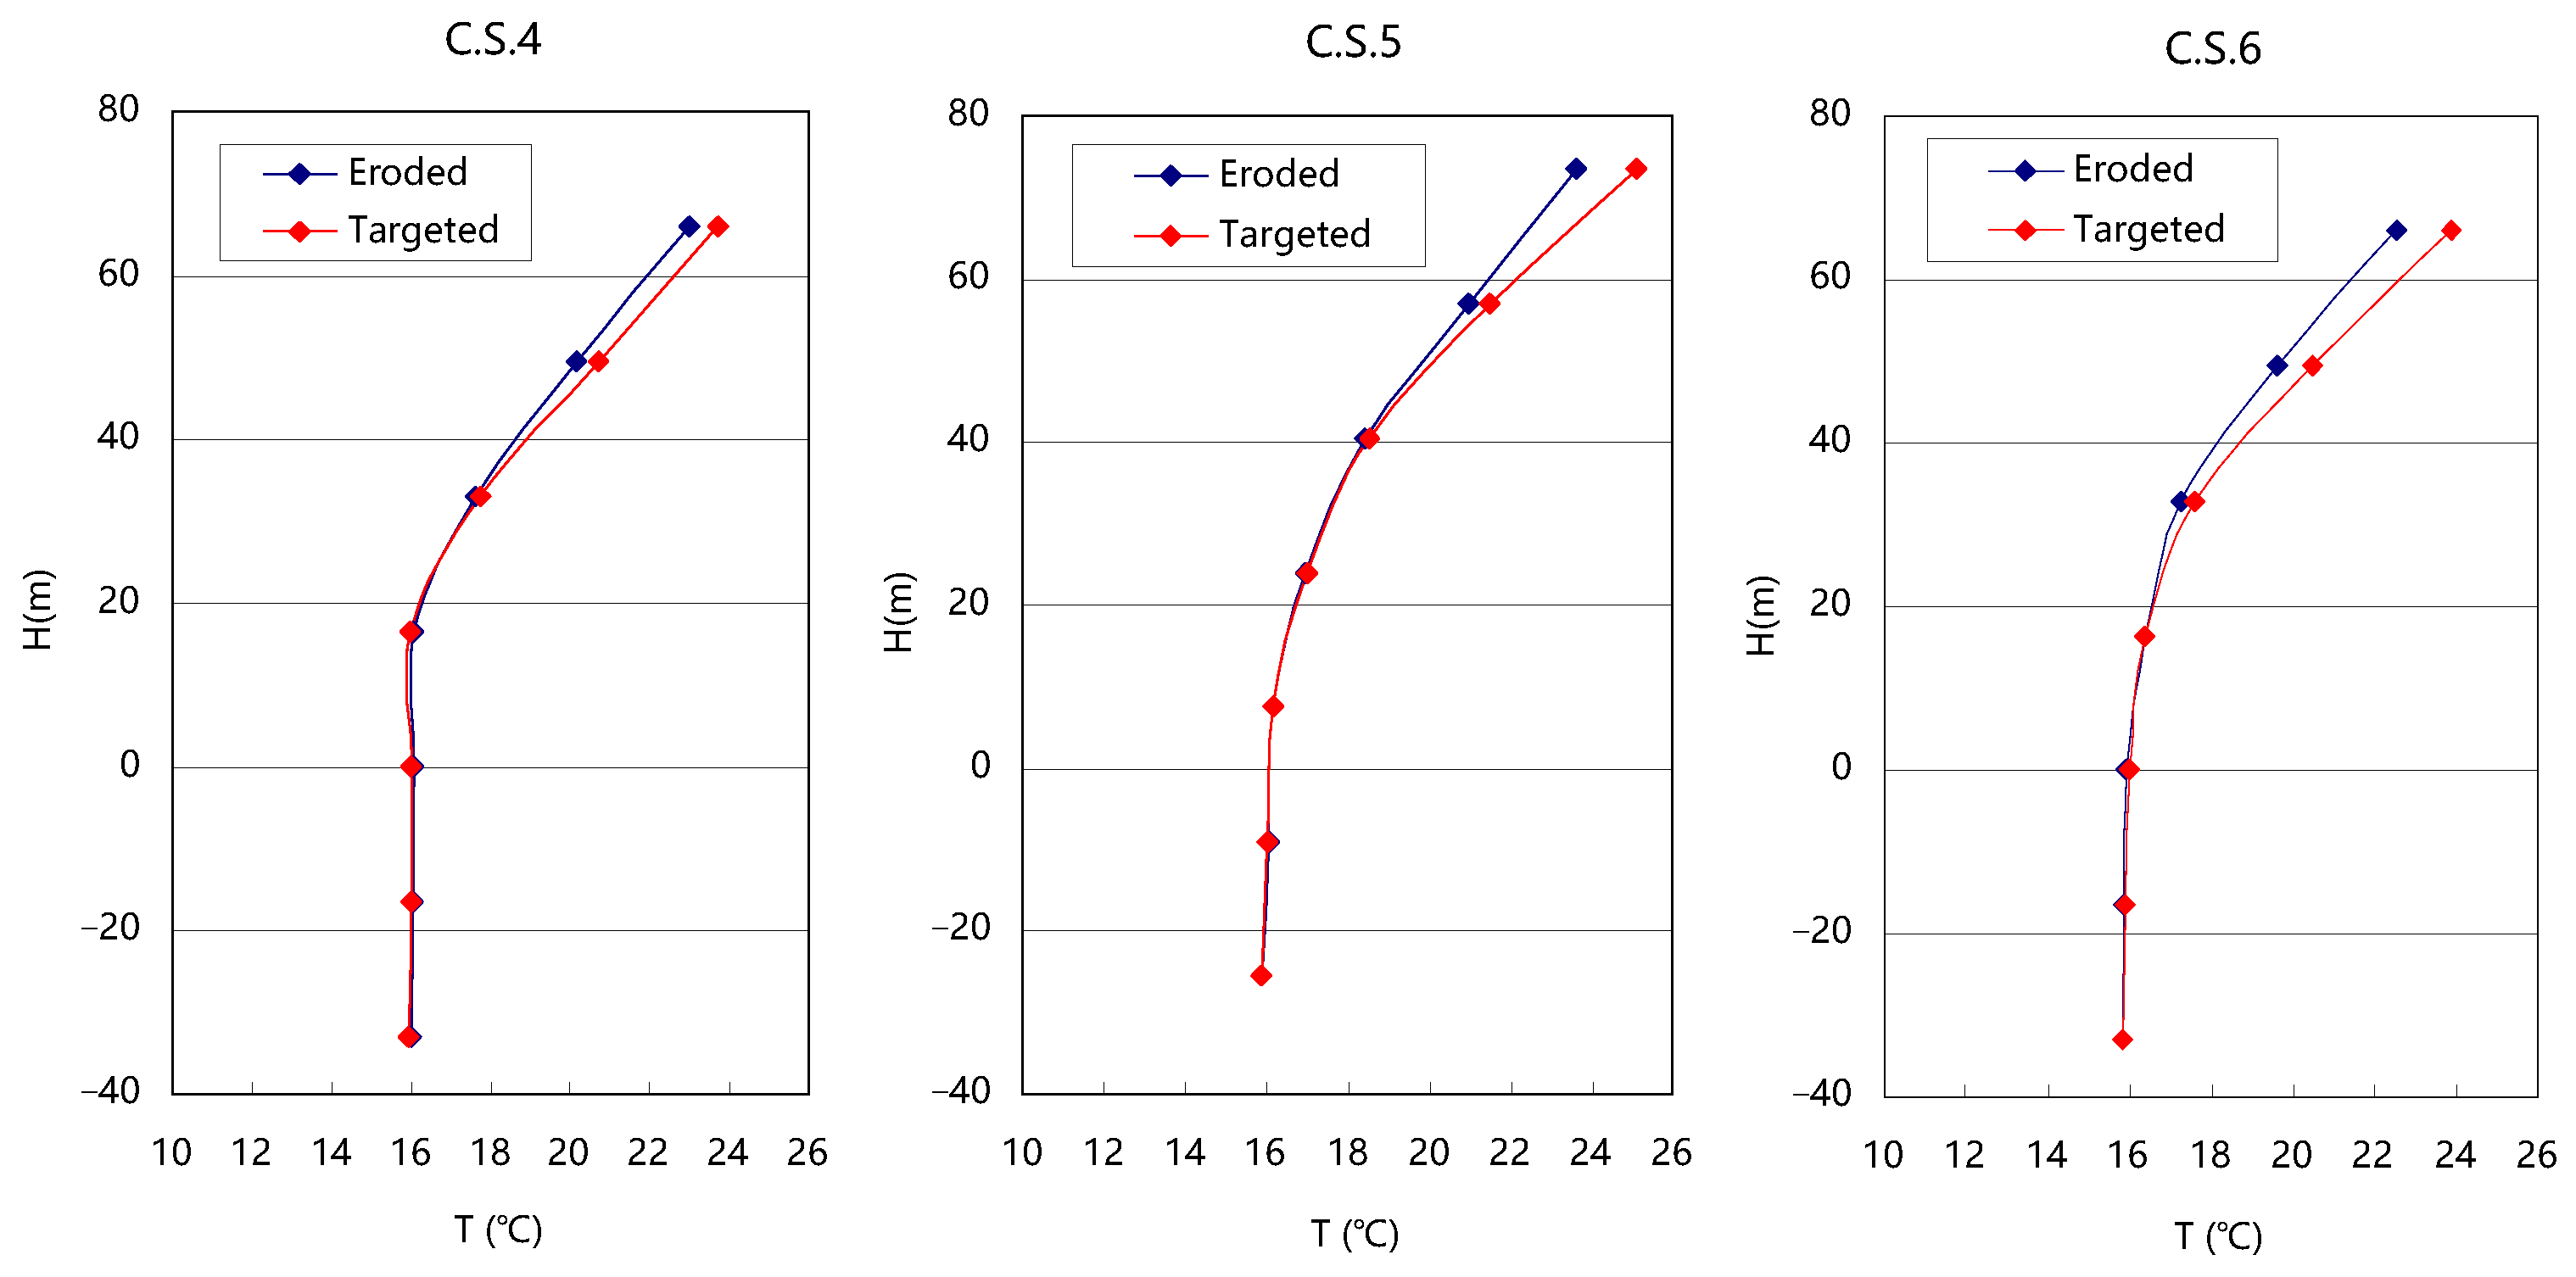
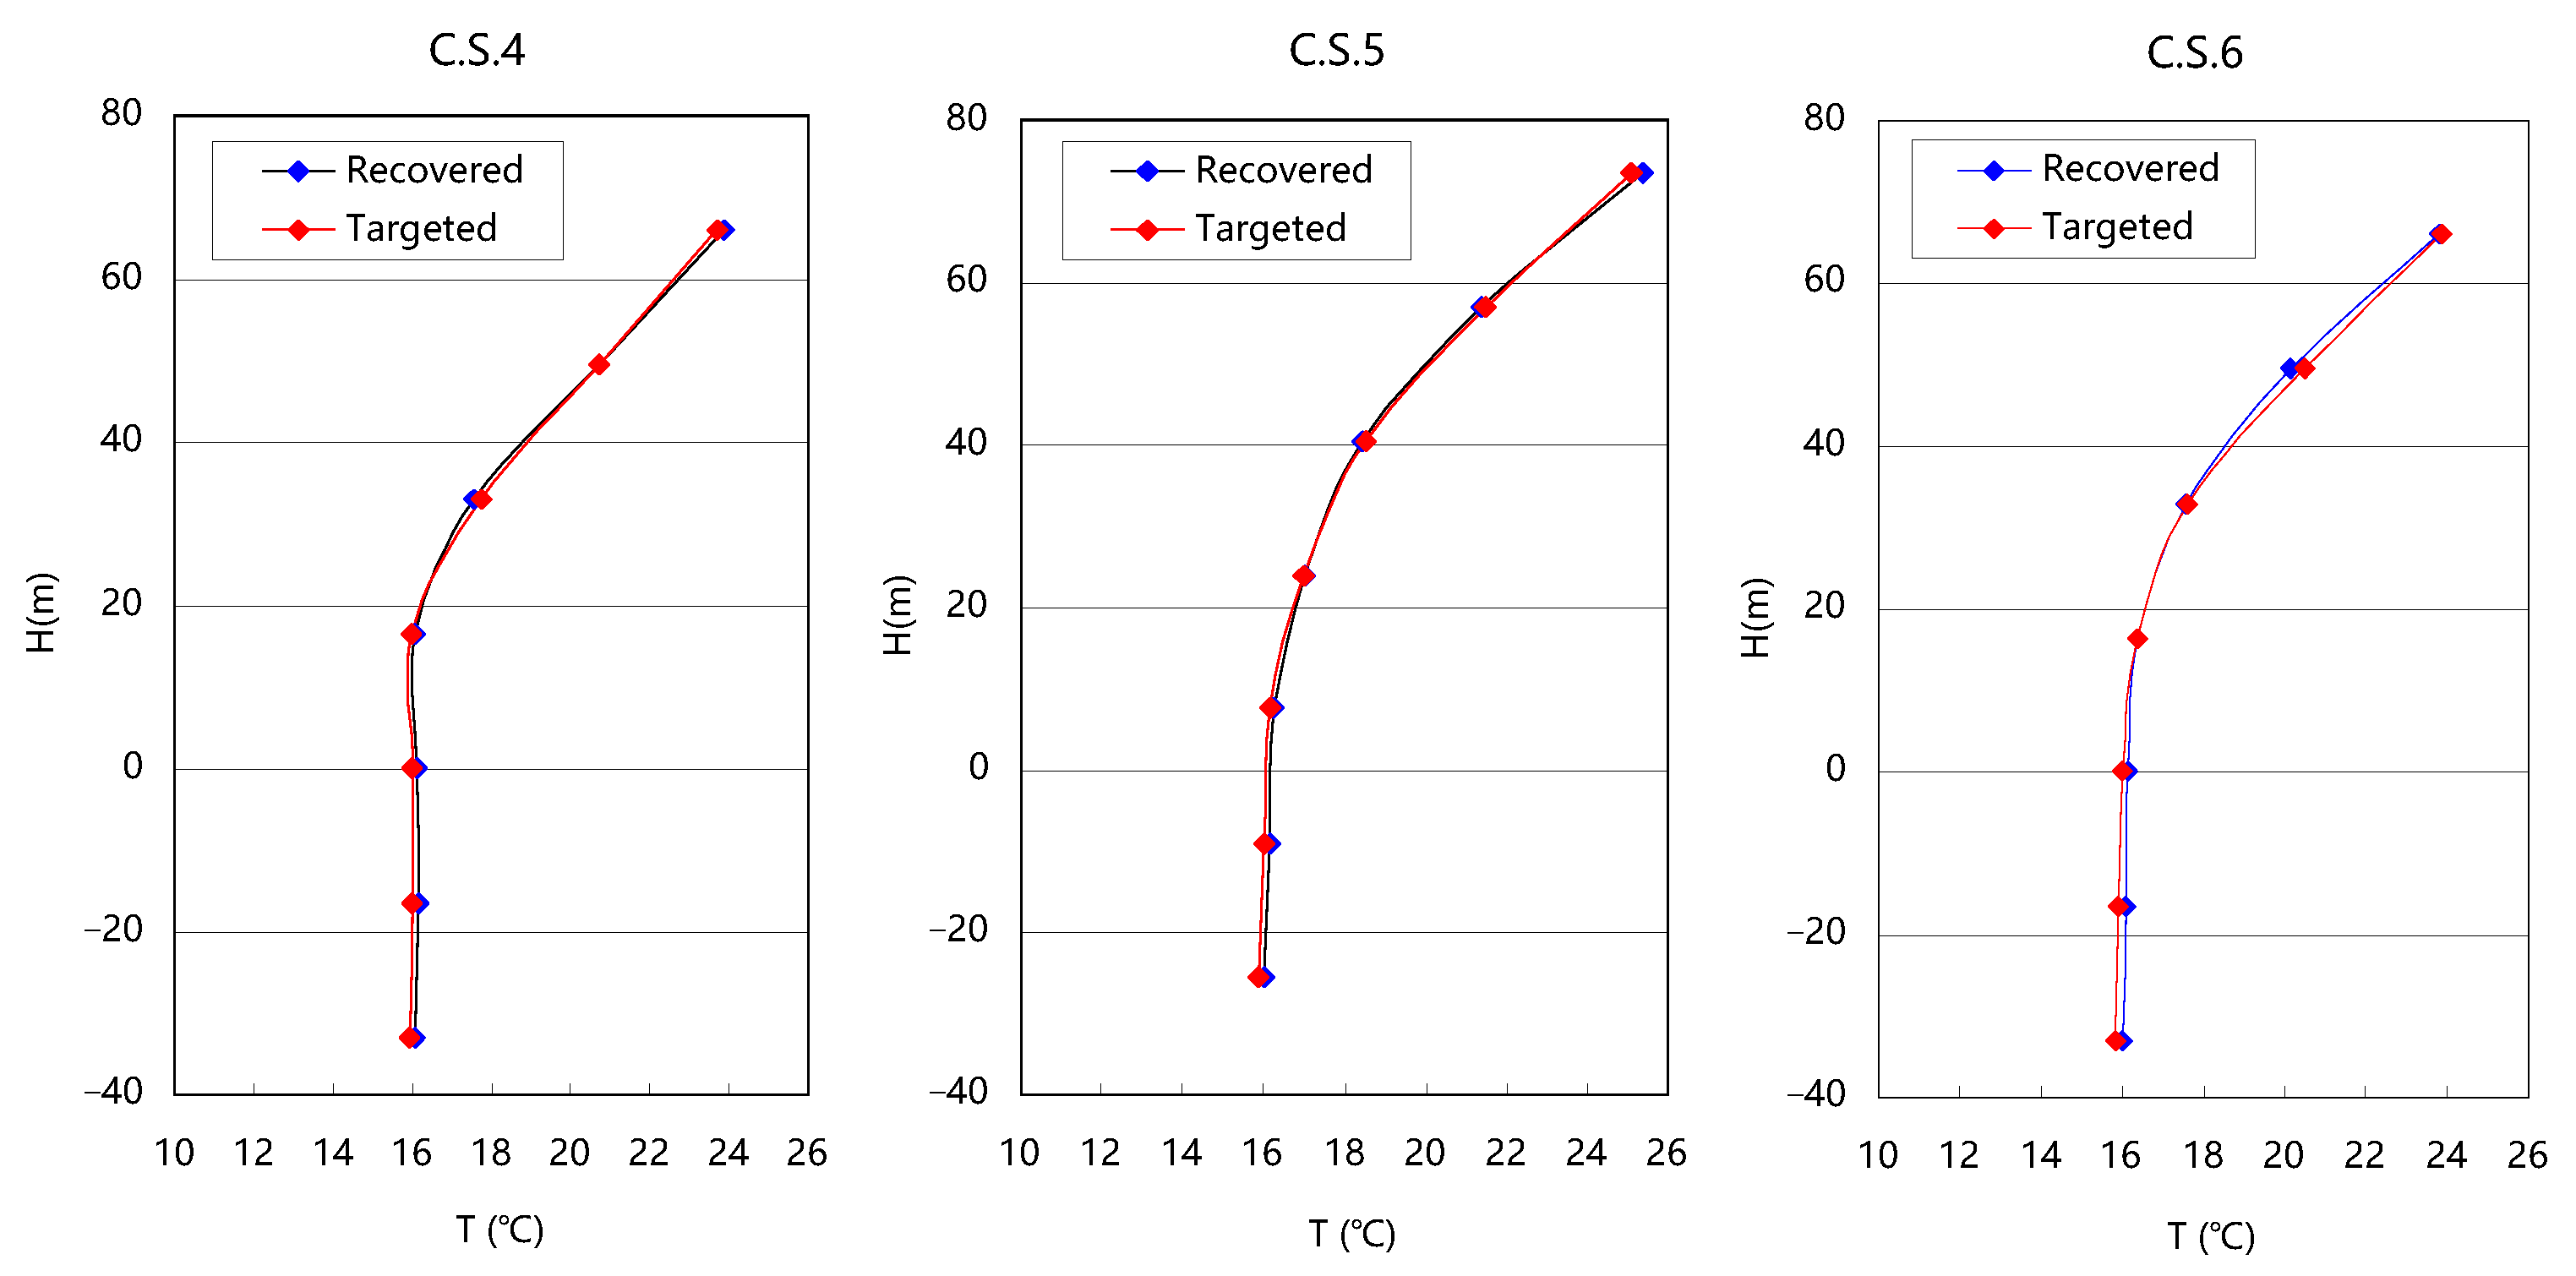
2.3. Similarity Verification of Water Temperature Stratification Model
3. Effect of Different Stratified Intake Structures on Extracting Surface Warm Water
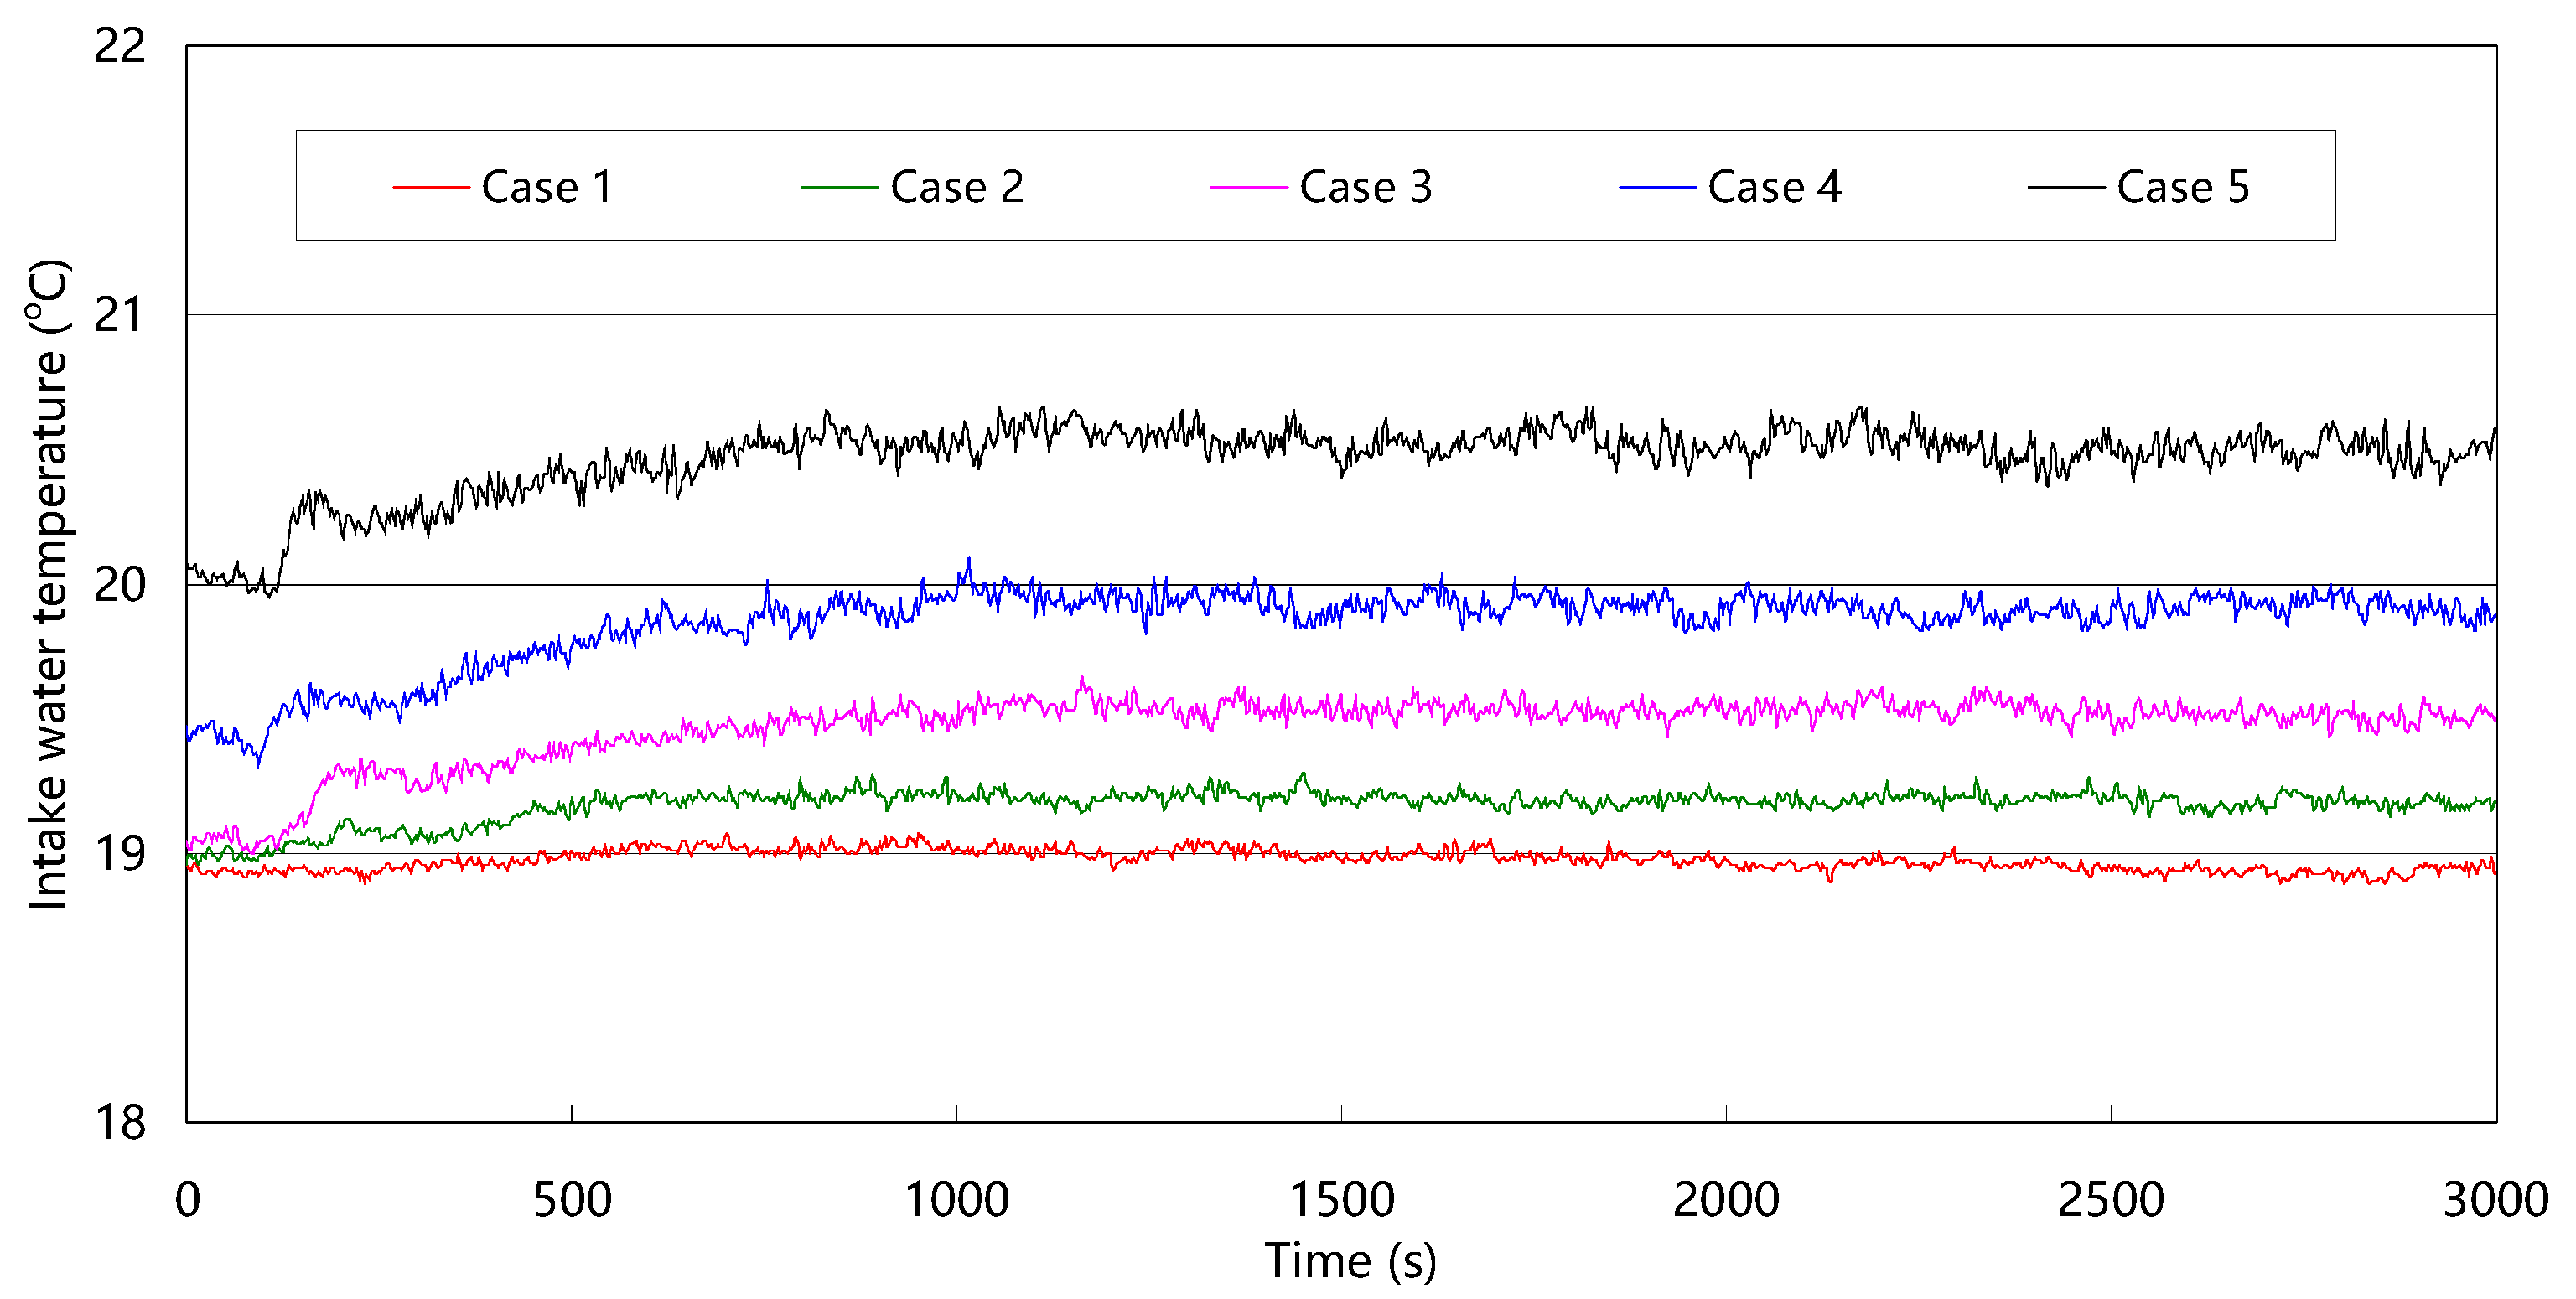
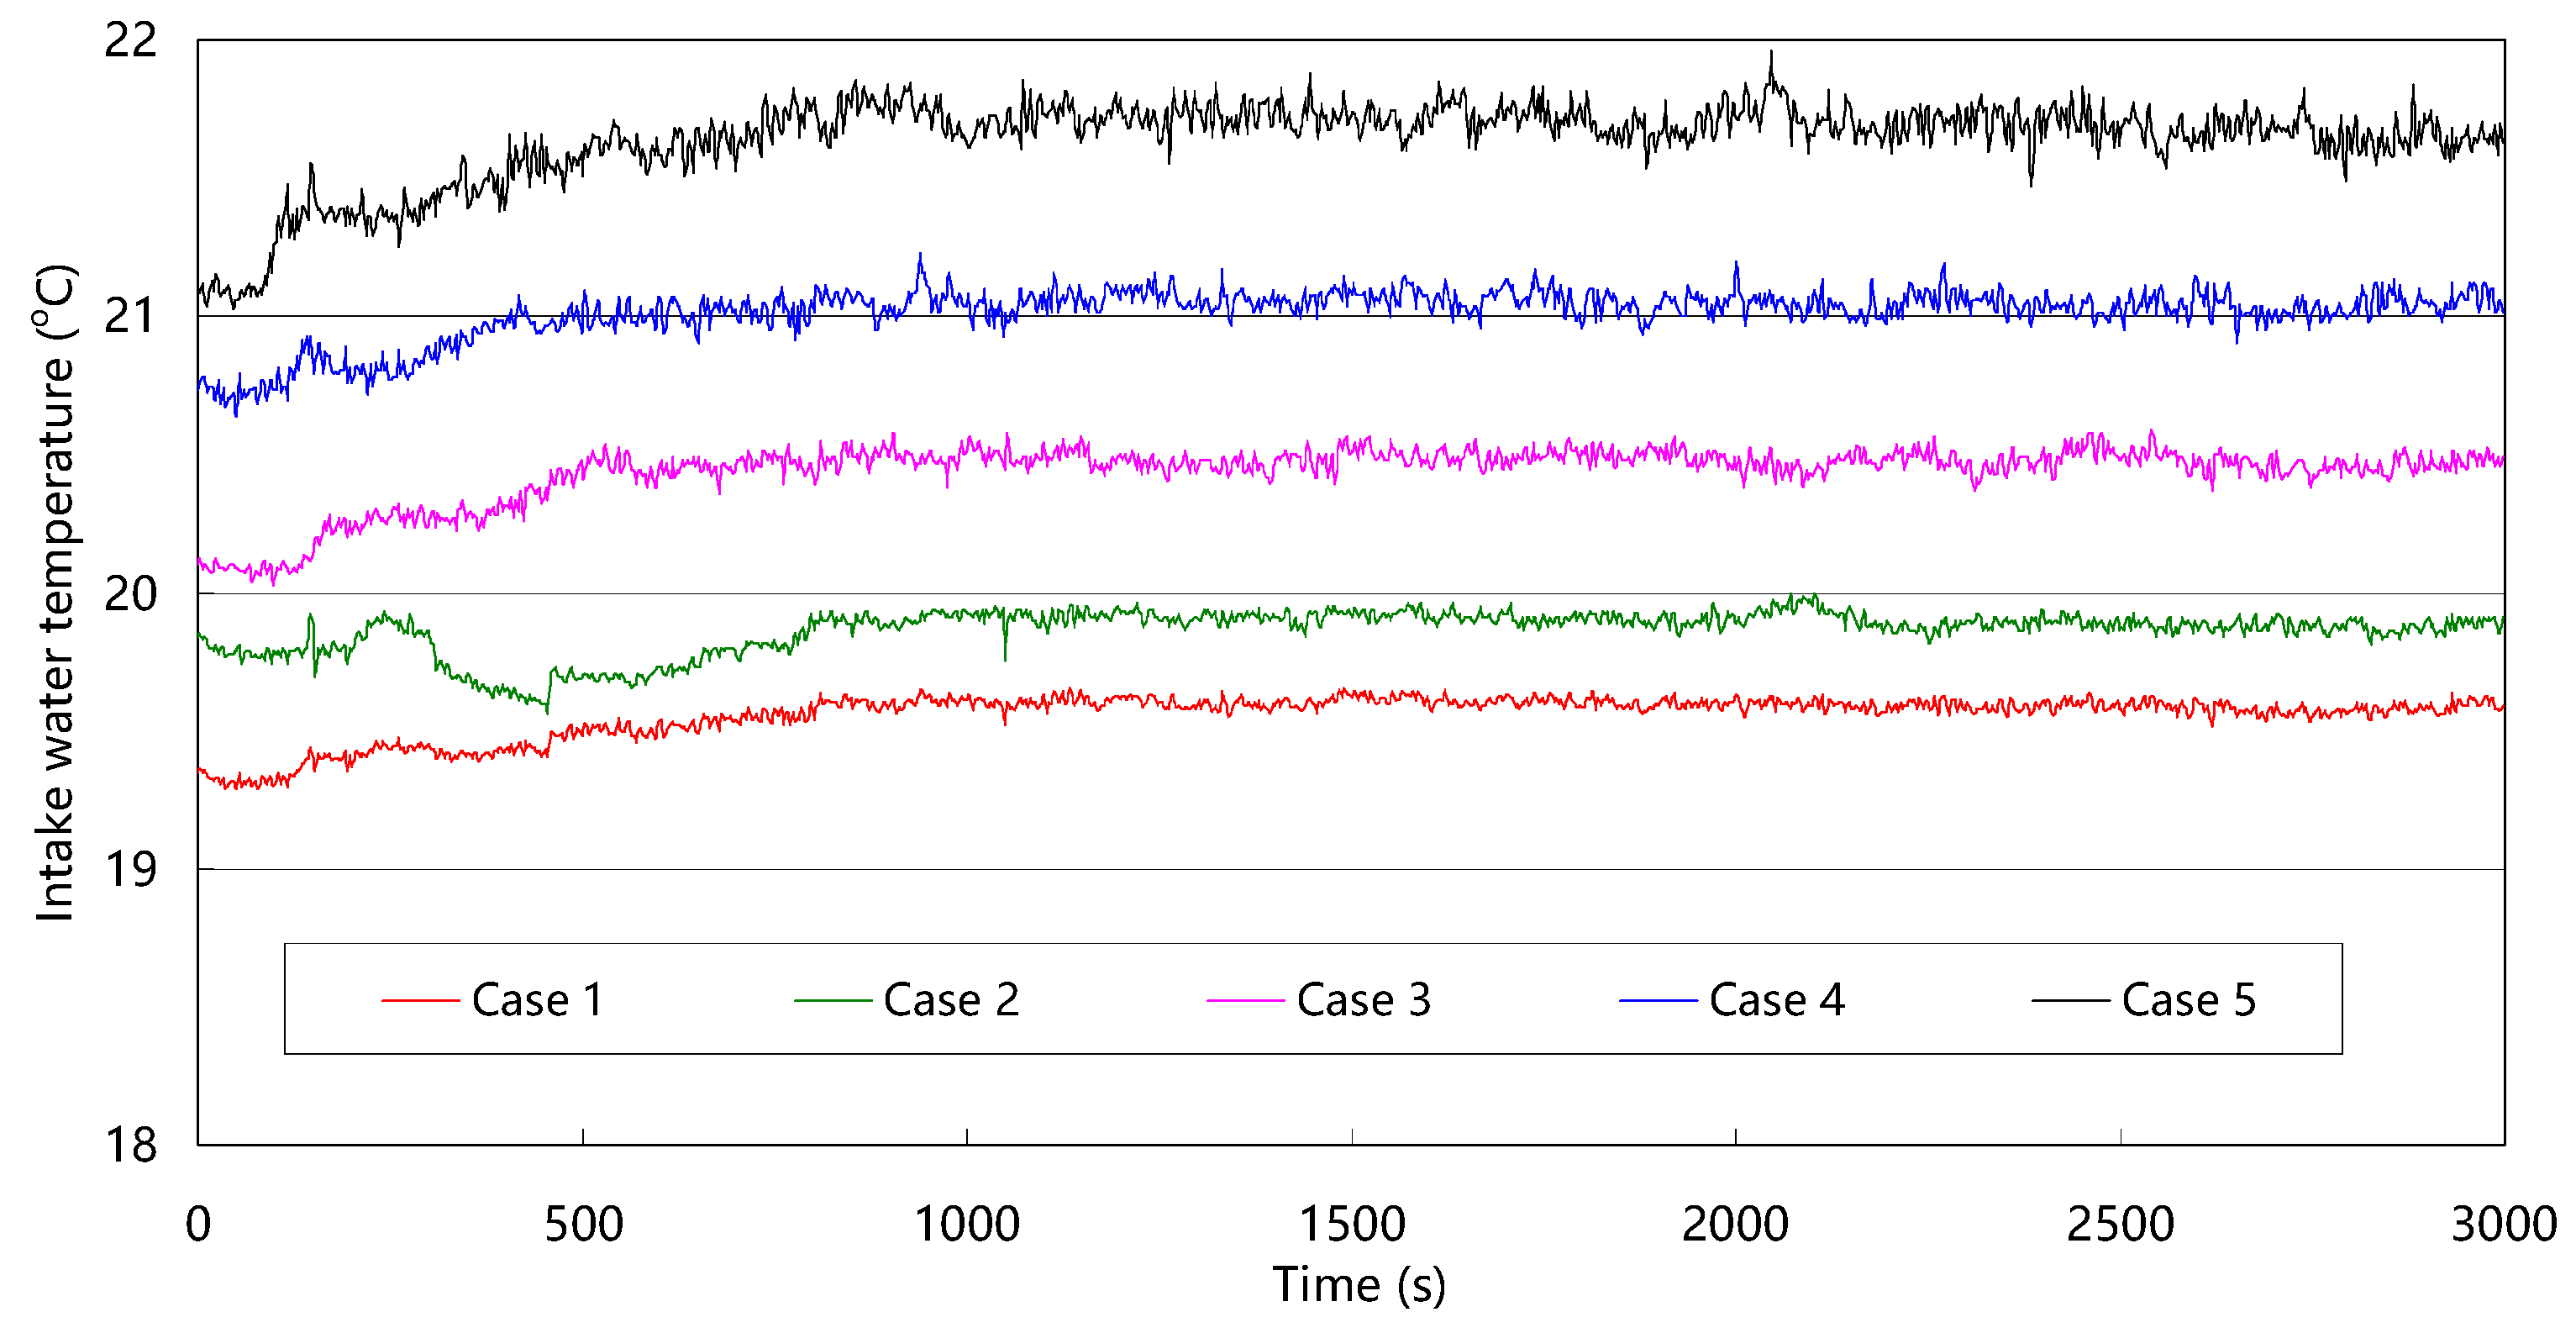
3.1. Monitoring Method under Constant Water Intake Conditions
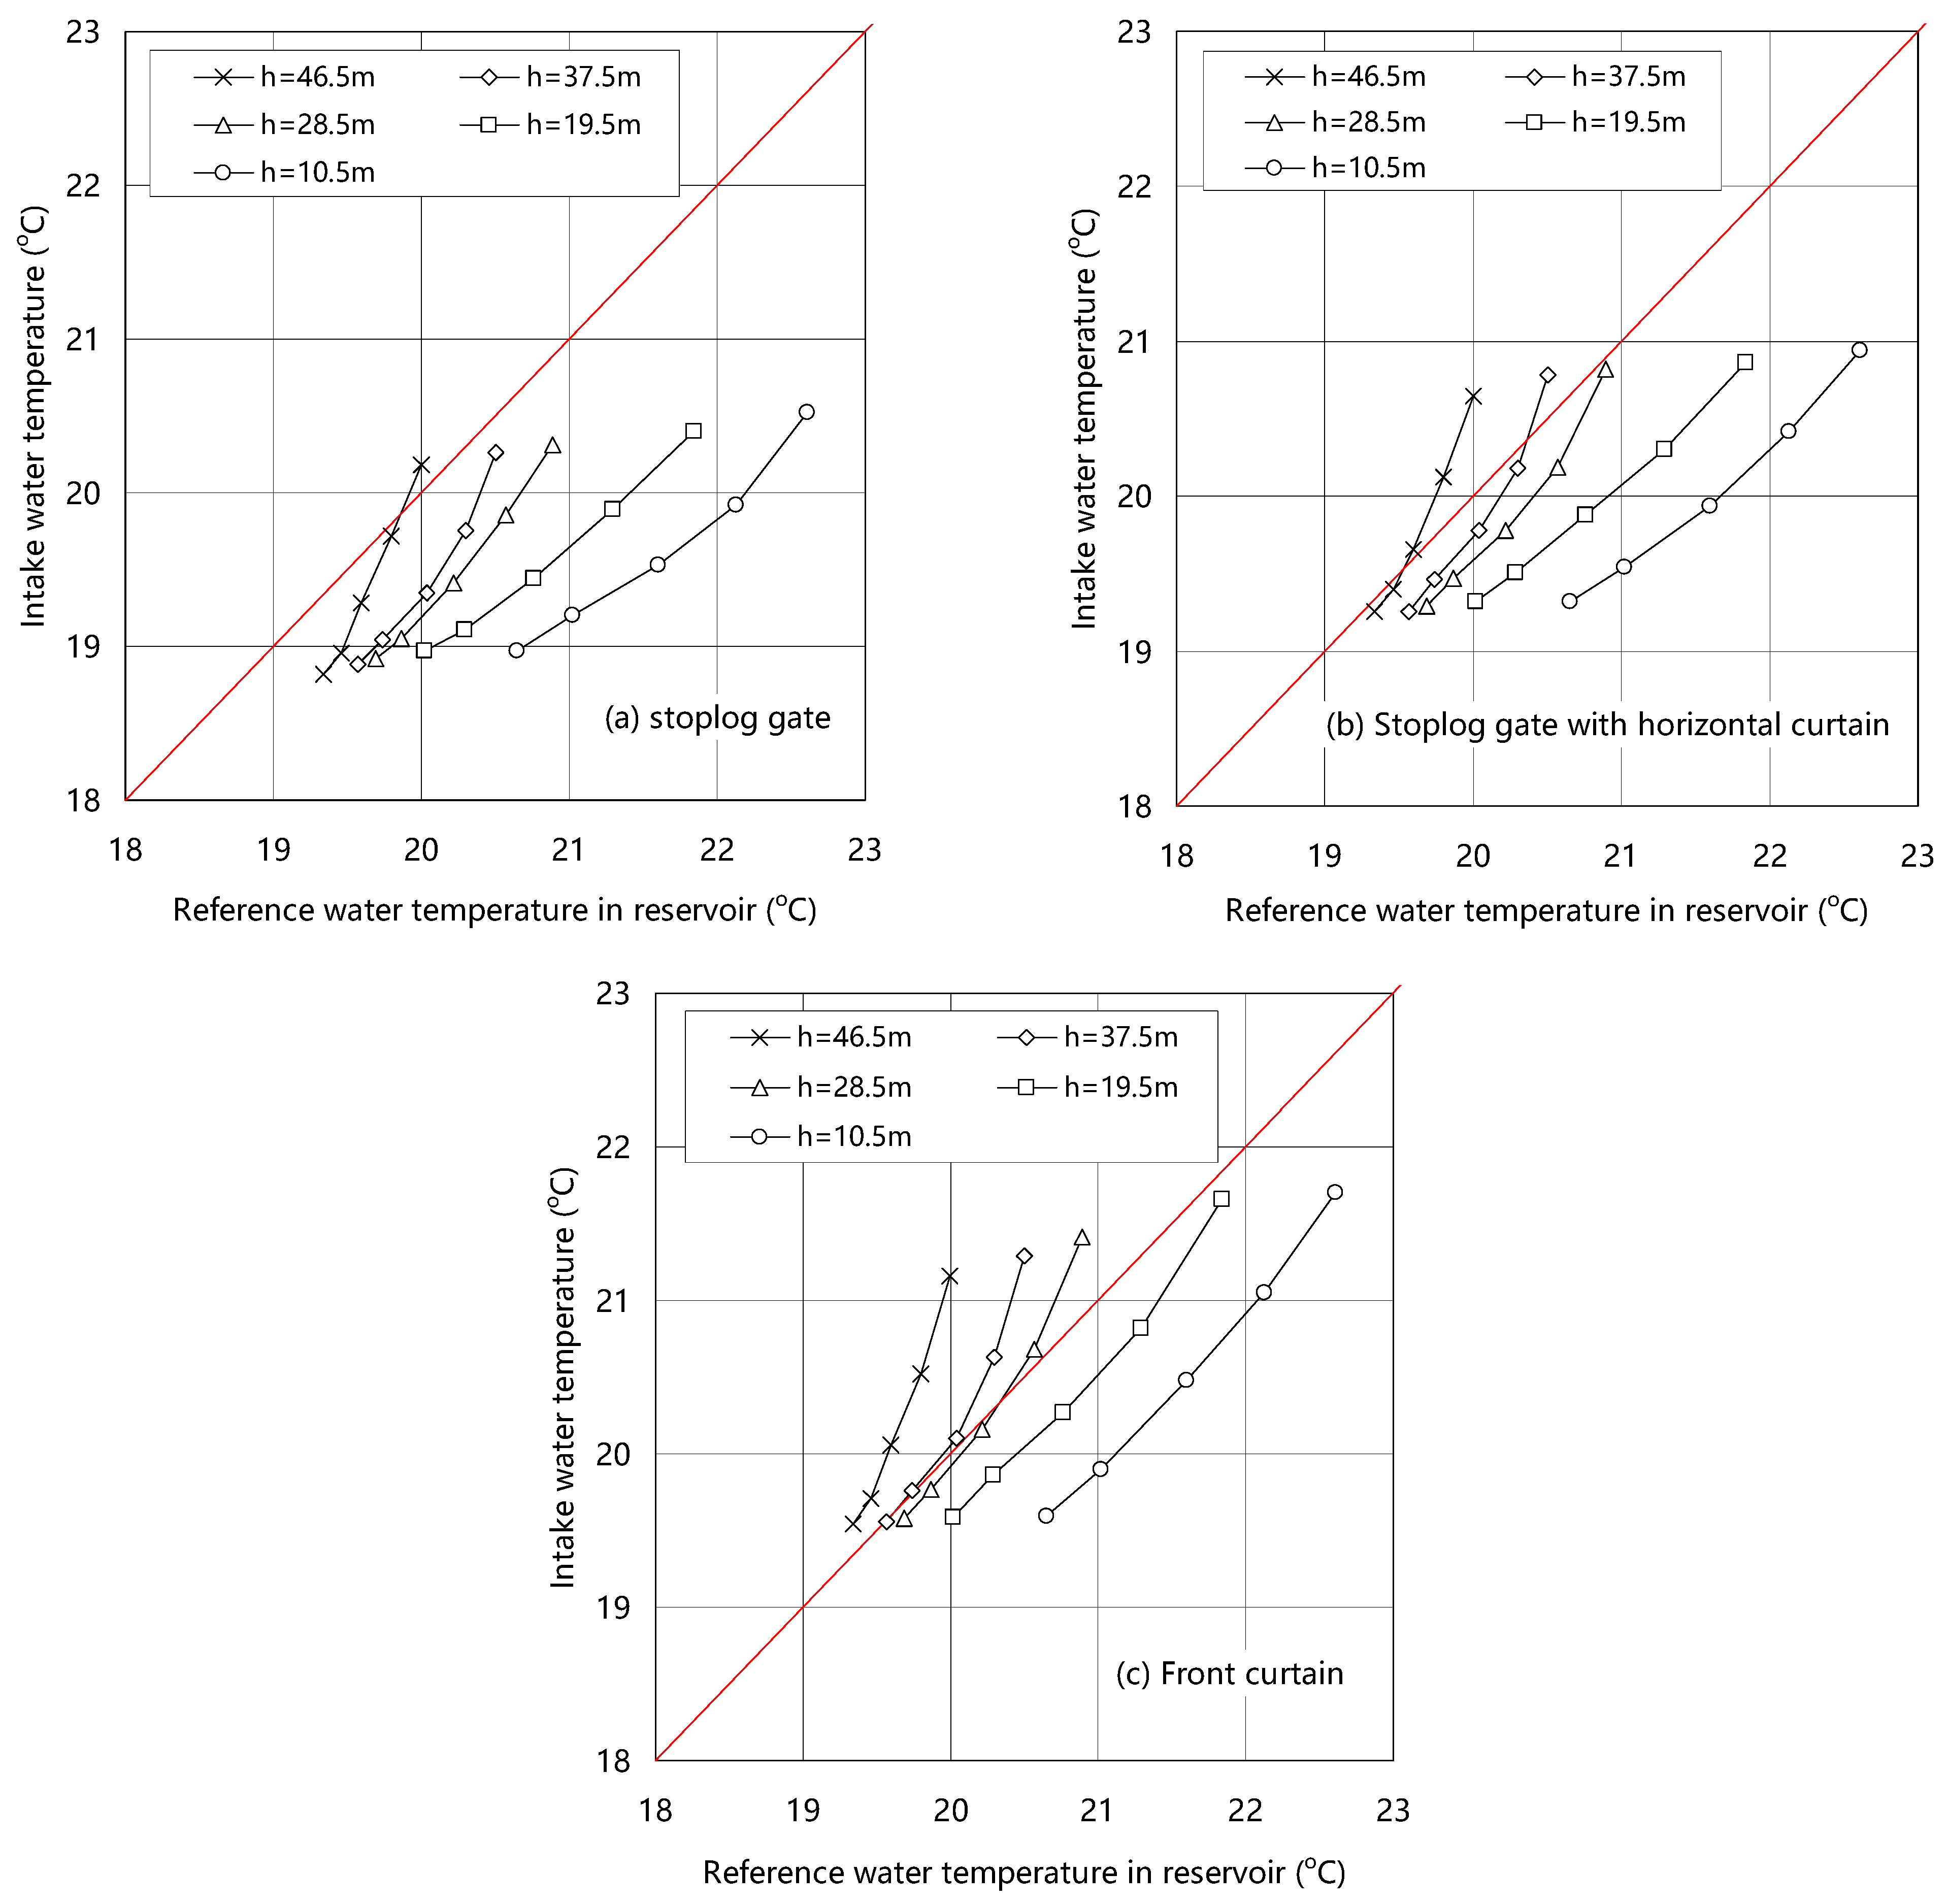
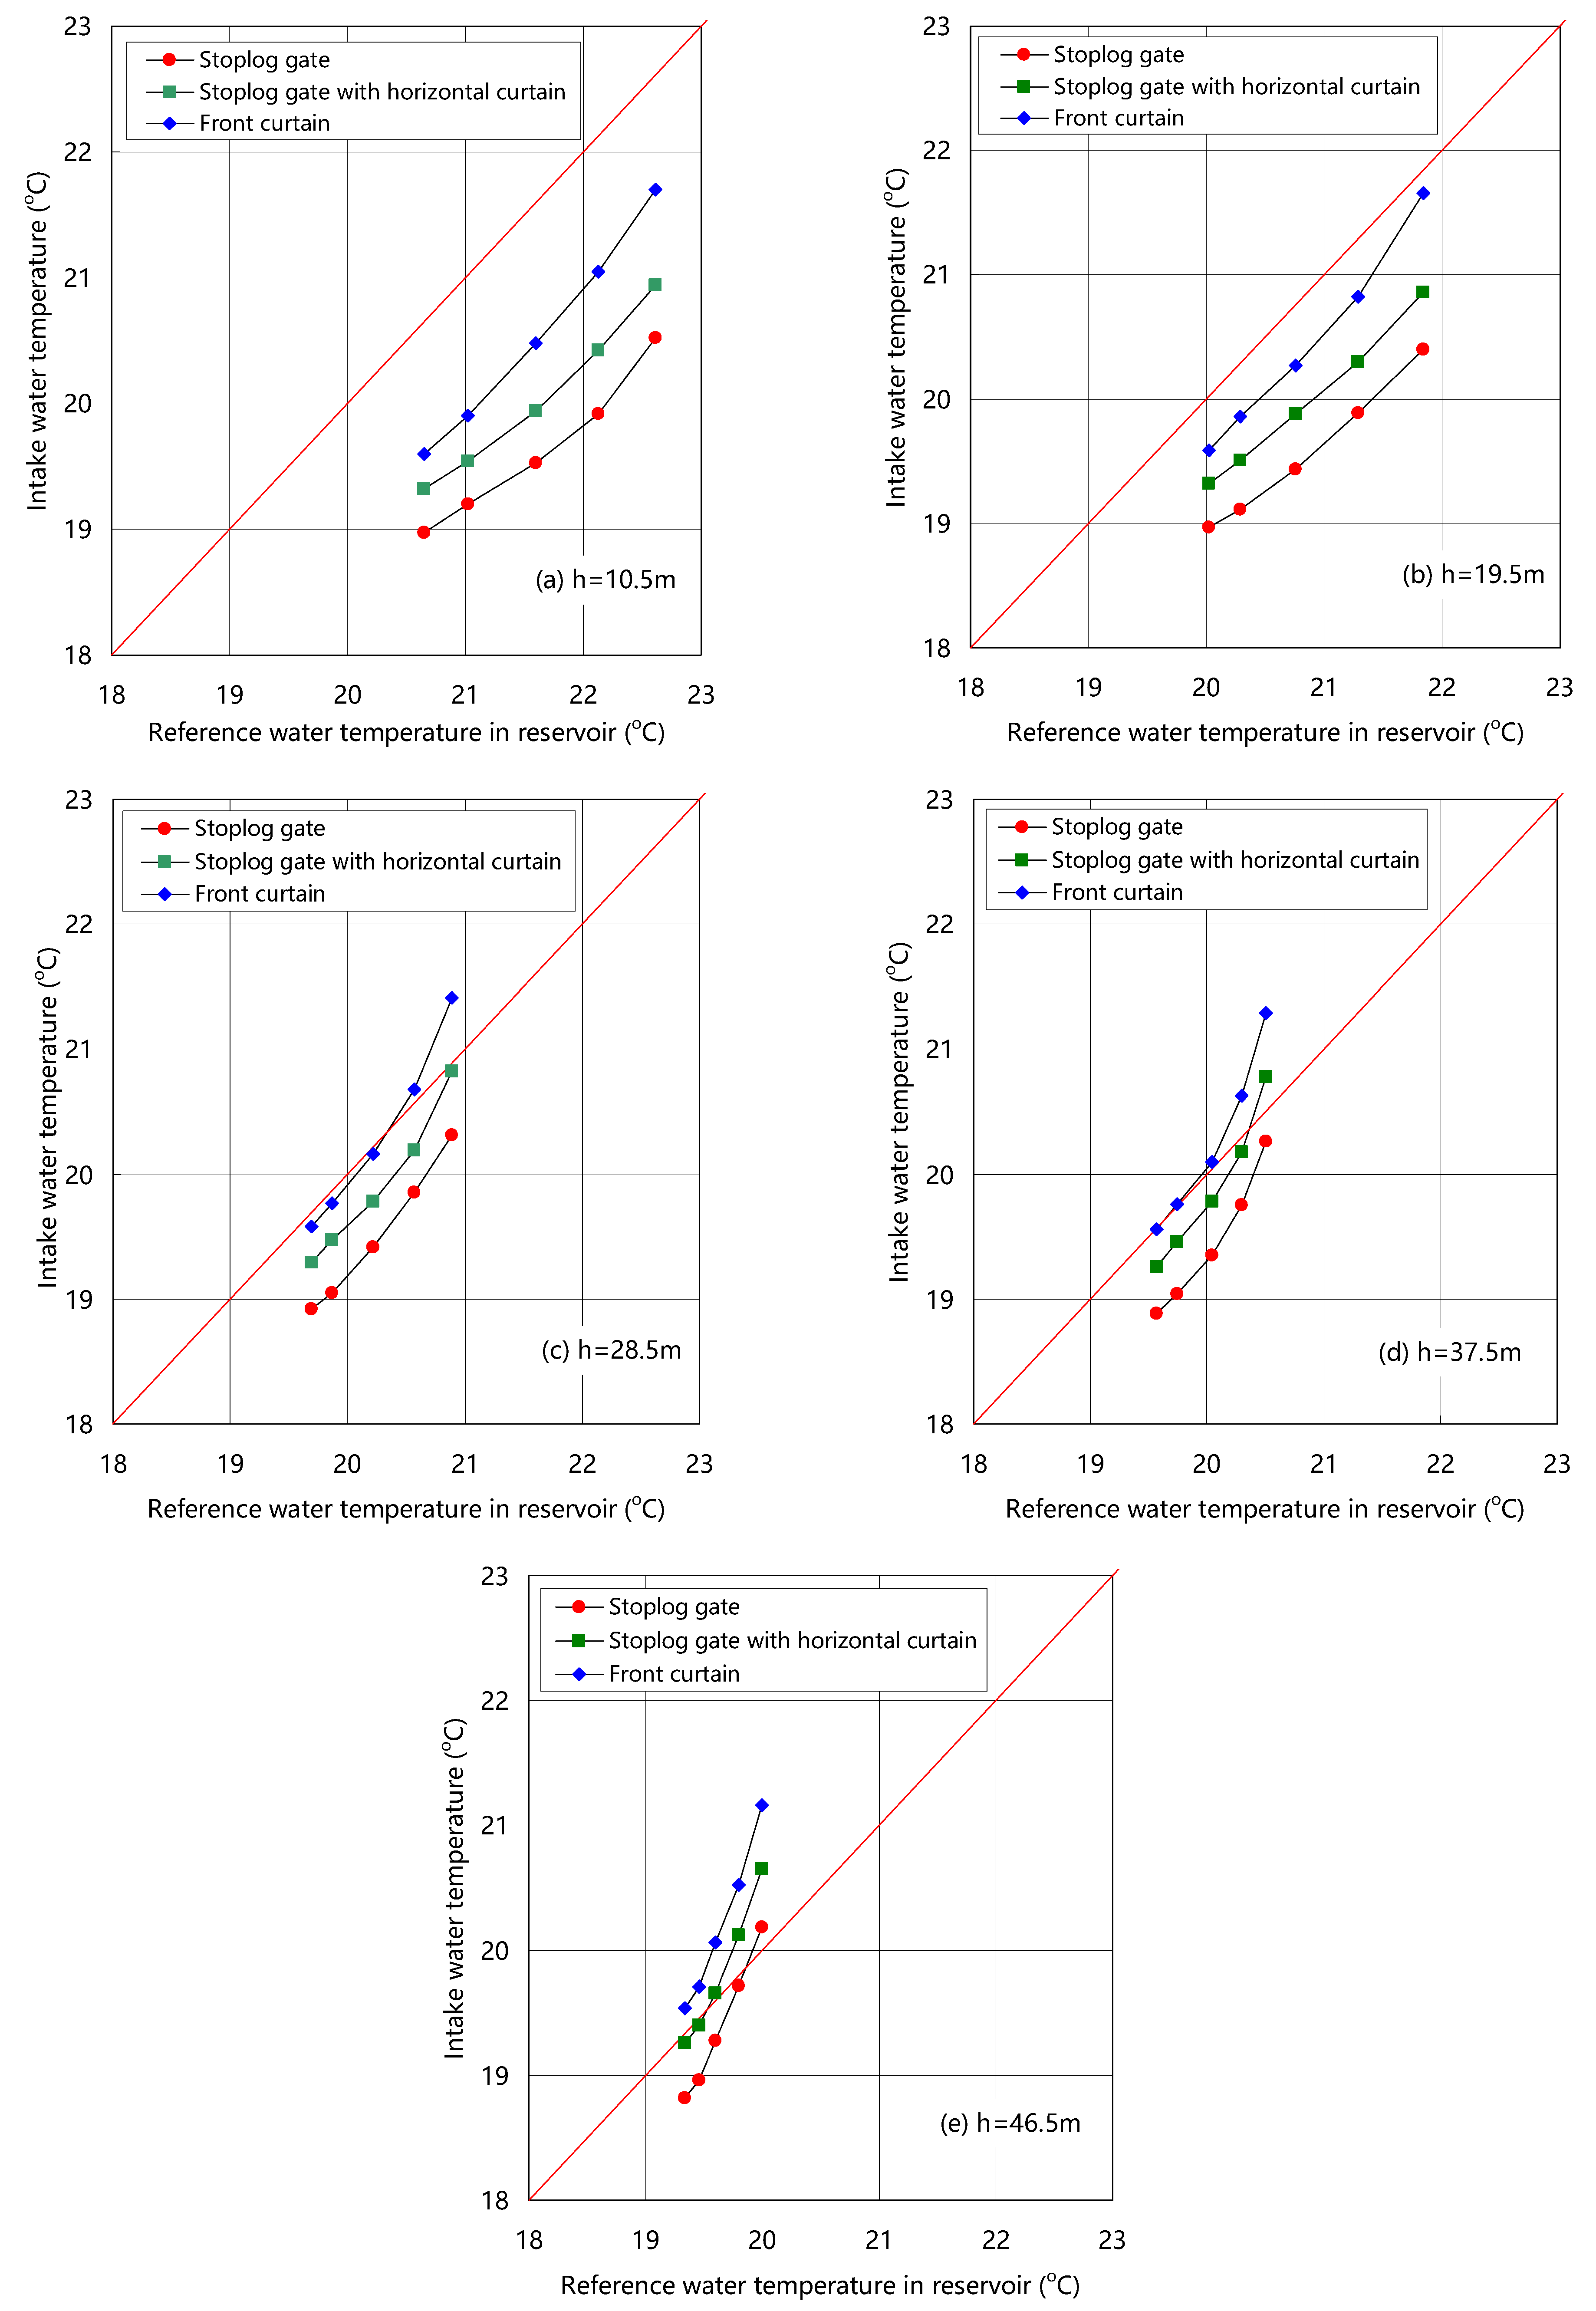
3.2. Experimental Results and Analysis of Different Stratified Intake Structures
4. Discussion
5. Conclusions
Author Contributions
Funding
Data Availability Statement
Conflicts of Interest
References
- Noori, R.; Asadi, N.; Deng, Z. A simple model for simulation of reservoir stratification. J. Hydraul. Res. 2018, 57, 561–572. [Google Scholar] [CrossRef]
- Boyer, D.L.; Srdic-Mitrovic, A. Laboratory Studies of Continuously Stratified Flows Past Obstacles. Topics in Environmental Fluid Mechanics; Springer: Greer, SC, USA, 2003; pp. 190–222. [Google Scholar] [CrossRef]
- Gu, L.; Li, Q.; Hua, Z.; Wang, L.; Yuan, H. Thermal-hydraulic characteristics of stratified shear flow in braided rivers. J. Hydraul. Res. 2015, 53, 747–759. [Google Scholar] [CrossRef]
- Fan, J. Stratified flow through outlets. J. Hydro-Environ. Res. 2008, 2, 3–18. [Google Scholar] [CrossRef]
- Krebs, P.; Armbruster, M.; Rodi, W. Laboratory experiments of buoyancy-influenced flow in clarifiers. J. Hydraul. Res. 1998, 36, 831–851. [Google Scholar] [CrossRef]
- Lee, J.; Hyun, M.T.; Moh, J.H. Numerical experiments on natural convection in a stably stratified fluid due to side-wall heating. Numer. Heat Transf. Part A Appl. 1990, 18, 343–355. [Google Scholar] [CrossRef]
- Chanudet, V.; Guédant, P.; Rode, W.; Godon, A.; Guérin, F.; Serça, D.; Deshmukh, C.; Descloux, S. Evolution of the physico-chemical water quality in the Nam Theun 2 Reservoir and downstream rivers for the first 5 years after impoundment. Hydroécologie Appl. 2015, 19, 27–61. [Google Scholar] [CrossRef]
- Priyantha, D.; Asaeda, T.; Saitoh, S.; Gotoh, K. Modelling the Effects of Curtains on Water Quality of a Eutrophic Reservoir. Doboku Gakkai Ronbunshuu B 2010, 40, 7–12. [Google Scholar] [CrossRef]
- Aghasian, K.; Moridi, A.; Mirbagheri, A.; Abbaspour, M. Selective withdrawal optimization in a multipurpose water use reservoir. Int. J. Environ. Sci. Technol. 2019, 16, 5559–5568. [Google Scholar] [CrossRef]
- Noori, R.; Ansari, E.; Bhattarai, R.; Tang, Q.; Aradpour, S.; Maghrebi, M.; Haghighi, A.T.; Bengtsson, L.; Kløve, B. Complex dynamics of water quality mixing in a warm mono-mictic reservoir. Sci. Total Environ. 2021, 777, 146097. [Google Scholar] [CrossRef]
- Holland, J.P. Design of Selective Withdrawal Intake Structures. In Water for Resource Development; ASCE: Reston, VA, USA, 2015. [Google Scholar]
- Liu, W.; Jiang, D.; Cheng, T. Effects of Flood on Thermal Structure of a Stratified Reservoir. Procedia Environ. Sci. 2011, 10, 1811–1817. [Google Scholar] [CrossRef]
- He, W.; Luo, J.; Xing, L.; Yu, X.; Zhang, J.; Chen, S. Effects of temperature-control curtain on algae biomass and dissolved oxygen in a large stratified reservoir: Sanbanxi Reservoir case study. J. Environ. Manag. 2019, 248, 109250. [Google Scholar] [CrossRef] [PubMed]
- Wang, S.; Qian, X.; Han, B.; Luo, L.; Ye, R.; Xiong, W. Effects of different operational modes on the flood-induced turbidity current of a canyon-shaped reservoir: Case study on Liuxihe Reservoir, South China. Hydrol. Process. 2013, 27, 4004–4016. [Google Scholar] [CrossRef]
- Sokolov, A.G. Effect of selective water intake on the oxygen regime of a stratified reservoir. Hydrotech. Constr. 1999, 33, 116–125. [Google Scholar] [CrossRef]
- Zhang, L.; Zhang, J.; Peng, Y.; Pan, J.; Peng, Z. Numerical Simulation of Flow and Temperature Fields in a Deep Stratified Reservoir Using Water-Separating Curtain. Int. J. Environ. Res. Public Health 2019, 16, 5143. [Google Scholar] [CrossRef]
- Yang, M.; Wang, M.; Zhang, F.; Lai, R. Numerical Simulation and Experimental Study of Three-Dimensional Density-Stratified Flow. IOP Conf. Ser. Mater. Sci. Eng. 2019, 472, 012080. [Google Scholar] [CrossRef]
- Lian, J.; Du, H.; Ma, C. Effects of temperature control curtain on water releases in deep water reservoirs. J. Hydraul. Eng. 2016, 47, 942–948. (In Chinese) [Google Scholar] [CrossRef]
- Bidokhti, A.; Britter, R. A large stratified shear flow water channel facility. Exp. Fluids 2002, 33, 281–287. [Google Scholar] [CrossRef]
- Yu, W.; Hsu, M.S.; Fan, K. Experiments on Selective Withdrawal of a Codirectional Two-Layer Flow through a Line Sink. J. Hydraul. Eng. 2004, 130, 1156–1166. [Google Scholar] [CrossRef]
- Gilreath, H.E. The establishment and control of density microstructure in stratified flow experiments. Exp. Fluids 1983, 1, 210–212. [Google Scholar] [CrossRef]
- Wu, Y.; Ren, H.; He, J.; Xia, J. Experimental studies on water temperature stratified flow in front region of reservoirs. Hydro-Sci. Eng. 2017, 2017, 67–74. (In Chinese) [Google Scholar]
- Shammaa, Y.; Zhu, D.Z. Experimental study on selective withdrawal in a two-layer reservoir using a temperature-control curtain. J. Hydraul. Eng. 2010, 136, 234–246. [Google Scholar] [CrossRef]
- Onishi, S.; Imamura, K.; Haraguchi, S. Study on selective withdrawal in reservoirs. Doboku Gakkai Ronbunshu 1986, 1986, 79–87. [Google Scholar] [CrossRef]
- Han, Y.; Gao, X. Similarity Theory of Withdrawn Water Temperature Experiment. Sci. World J. 2015, 2015, 429781. [Google Scholar] [CrossRef]
- Chung, S.W.; Hipsey, M.R.; Imberger, J. Modelling the propagation of turbid density inflows into a stratified lake: Daecheong Reservoir, Korea. Environ. Model. Softw. 2009, 24, 1467–1482. [Google Scholar] [CrossRef]
- Weber, M.; Rinke, K.; Hipsey, M.R.; Boehrer, B. Optimizing withdrawal from drinking water reservoirs to reduce downstream temperature pollution and reservoir hypoxia. J. Environ. Manag. 2017, 197, 96–105. [Google Scholar] [CrossRef]
- Ren, W.; Wei, J.; Xie, Q.; Miao, B.; Wang, L. Experimental and Numerical Investigations of Hydraulics in Water Intake with Stoplog gate. Water 2020, 12, 1788. [Google Scholar] [CrossRef]
- Song, Q.; Sun, B.; Gao, X.; Zhang, C. PIV experimental investigation of the outflow temperature from nonlinearly stratified reservoir regulated by floating intake. Exp. Therm. Fluid Sci. (Exp. Fluid Sci.) 2019, 109, 109893. [Google Scholar] [CrossRef]
- Takashi, I.; Hiroshi, Y.; Tomoyuki, S. Intake characteristics of the selective withdrawal system with simultaneous operation of multi-gates in a reservoir. J. Jpn. Soc. Civ. Eng. Ser. B1 (Hydraul. Eng.) 2016, 72, I_685–I_690. [Google Scholar] [CrossRef]
- Vermeyen, T. Application of Flexible Curtains to Control Mixing and Enable Selective Withdrawal in Reservoirs. In Proceedings of the 5th International Symposium on Stratified Flows, IAHR, Vancouver, BC, Canada, 10–13 July 2000. [Google Scholar]
- Xue, W.; Deng, Y.; Li, J.; Tuo, Y. Effect of Temperature Control Curtain on Selective Water Withdrawal in Large Reservoirs. Adv. Eng. Sci. 2017, 49, 27–34. (In Chinese) [Google Scholar] [CrossRef]
- Jamali, M.; Haddadzadegan, H. Effects of a sill on selective withdrawal through a point sink in a linearly stratified fluid. Adv. Water Resour. 2010, 33, 1517–1523. [Google Scholar] [CrossRef]
- Gushchin, V.A.; Mitkin, V.V.; Rozhdestvenskaya, T.I.; Chashechkin, Y.D. Numerical and experimental study of the fine structure of a stratified fluid flow over a circular cylinder. J. Appl. Mech. Tech. Phys. 2007, 48, 34–43. [Google Scholar] [CrossRef]
- Caliskan, A.; Elci, S. Effects of Selective Withdrawal on Hydrodynamics of a Stratified Reservoir. Water Resour. Manag. 2009, 23, 1257–1273. [Google Scholar] [CrossRef]
- Wang, S.; Qian, X.; Han, B.; Luo, L.; Hamilton, D.P. Effects of local climate and hydrological conditions on the thermal regime of a reservoir at Tropic of Cancer, in southern China. Water Res. 2012, 46, 2591–2604. [Google Scholar] [CrossRef]
- Shawky, Y.M.; Ezzat, M.B.; Abdellatif, M.M. Power plant intakes performance in low flow water bodies. Water Sci. 2015, 29, 54–67. [Google Scholar] [CrossRef]
- Ren, L.; Wu, W.; Song, C.; Zhou, X.; Cheng, W. Characteristics of reservoir water temperatures in high and cold areas of the Upper Yellow River. Environ. Earth Sci. 2019, 78, 160. [Google Scholar] [CrossRef]
- Saadatpour, M.; Javaheri, S.; Afshar, A.; Sandoval Solis, S. Optimization of selective withdrawal systems in hydropower reservoir considering water quality and quantity aspects. Expert Syst. Appl. 2021, 184, 115474. [Google Scholar] [CrossRef]
- Shi, Z.; Chen, J.; Chen, Q. On the turbulence models and turbulent Schmidt number in simulating stratified flows. J. Build. Perform. Simul. 2015, 9, 134–148. [Google Scholar] [CrossRef]
- He, W.; Lian, J.; Du, H.; Ma, C. Source tracking and temperature prediction of discharged water in a deep reservoir based on a 3-D hydro-thermal-tracer model. J. Hydro-Environ. Res. 2018, 20, 9–21. [Google Scholar] [CrossRef]
- Fu, J.; Li, J.; Rui, J.; Tang, Y. Raising discharge water temperature by using water-level-selection with stoplog gate. J. Tianjin Univ. (Sci. Technol.) 2014, 47, 589–595. (In Chinese) [Google Scholar] [CrossRef]
- Li, K.; Cao, X.; Wen, J.; Jian, Y. Comparative analysis between numerically simulated water temperature and measured water temperature during commissioning of stoplog gate for Nuozhadu Hydropower Station. Water Resour. Hydropower Eng. 2017, 48, 156–162+186. (In Chinese) [Google Scholar] [CrossRef]
- Horner-Devine, A.R. Velocity, density and transport measurements in rotating, stratified flows. Exp. Fluids 2006, 41, 559–571. [Google Scholar] [CrossRef]
- Johnson, P.L. Hydraulic Features of Flexible Curtains Used for Selective Withdrawal. In Hydraulic Engineering; ASCE: Greer, SC, USA, 2015. [Google Scholar]
- Ettema, R.; Muste, M.; Jacob Odgaard, A.; Abaci, O. Outflow calibration for vertically distorted models of thermally stratified reservoirs. J. Hydraul. Res. 2006, 44, 535–547. [Google Scholar] [CrossRef]


| Hydropower Station | Huang- Deng | Jing- Ping I | Xiluo- Du | Guang- Zhao | Nuozha- Du | Wudong- De | Bahe- Tan | The Model Test |
|---|---|---|---|---|---|---|---|---|
| Design flow of single intake diversion (m3/s) | 409 | 350 | 424 | 433 | 390 | 691 | 547 | 690 |
| Design flow per unit width (m2/s) | 25.6 | 23 | 22.3 | 35.3 | 25.7 | 28.8 | 27.4 | 26 |
| Water depth above stoplog gate (m) | 23.5–28 | 21–35 | 25–35 | 15–21 | 28–42 | >30 | >21 | 10.5–46.5 |
| Water intake depth (m) | 61 | 101 | 82 | 75 | 76 | 62 | 91 | 75 |
| Average velocity of trash rack section (m/s) | 0.42 | 0.23 | 0.27 | 0.47 | 0.34 | 0.46 | 0.30 | 0.50 |
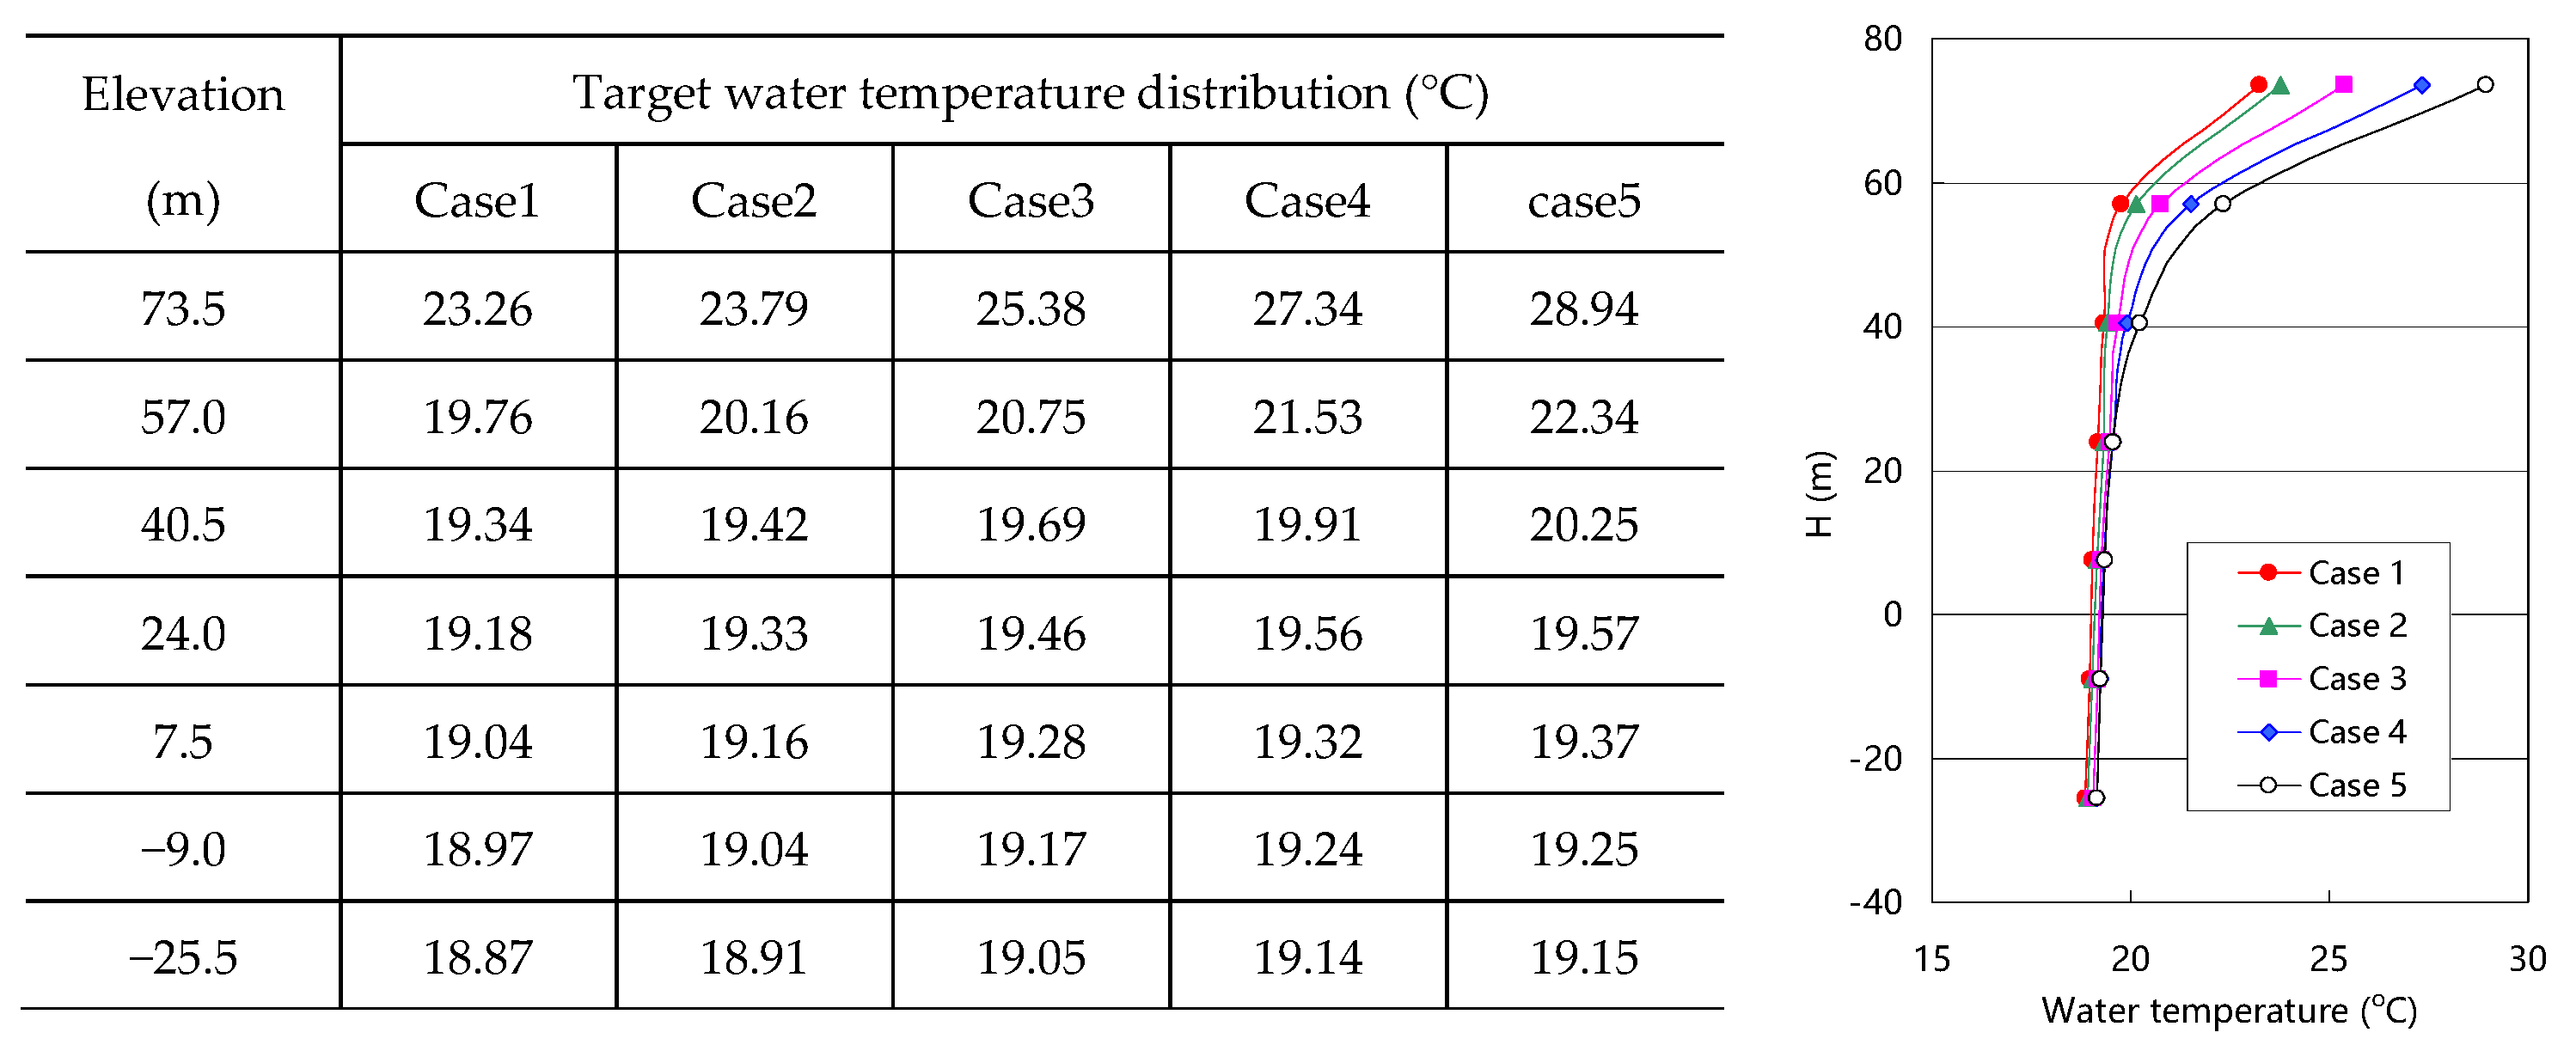
| Elevation (m) | Equivalent Stratification under Different Substrate Water Temperatures (°C) | Laboratory Simulated Water Temperature Stratification (°C) | |||||
|---|---|---|---|---|---|---|---|
| 66.0 | 19.15 | 22.33 | 23.64 | 25.03 | 22.10 | 23.80 | 24.67 |
| 49.5 | 14.66 | 18.63 | 20.17 | 21.79 | 18.31 | 20.39 | 22.02 |
| 33.0 | 10.91 | 15.84 | 17.64 | 19.47 | 15.63 | 17.74 | 19.46 |
| 16.5 | 8.85 | 14.50 | 16.44 | 18.39 | 14.43 | 16.41 | 18.58 |
| 0.0 | 8.36 | 14.21 | 16.19 | 18.17 | 14.18 | 16.12 | 18.25 |
| −16.5 | 8.23 | 14.13 | 16.12 | 18.10 | 14.11 | 16.04 | 18.05 |
| −33.0 | 8.00 | 14.00 | 16.00 | 18.00 | 13.97 | 15.93 | 17.96 |
| Case | Lab Substrate Water Temperature (°C) | Intake Flow (m3/s) | Height of Stoplog Gates (m) | Water Depth above the Gate (m) |
|---|---|---|---|---|
| 1 | 14 | 665 | 28.5/37.5/46.5/55.5/64.5 | 46.5/37.5/28.5/19.5/10.5 |
| 2 | 16 | 665 | ||
| 3 | 18 | 665 |
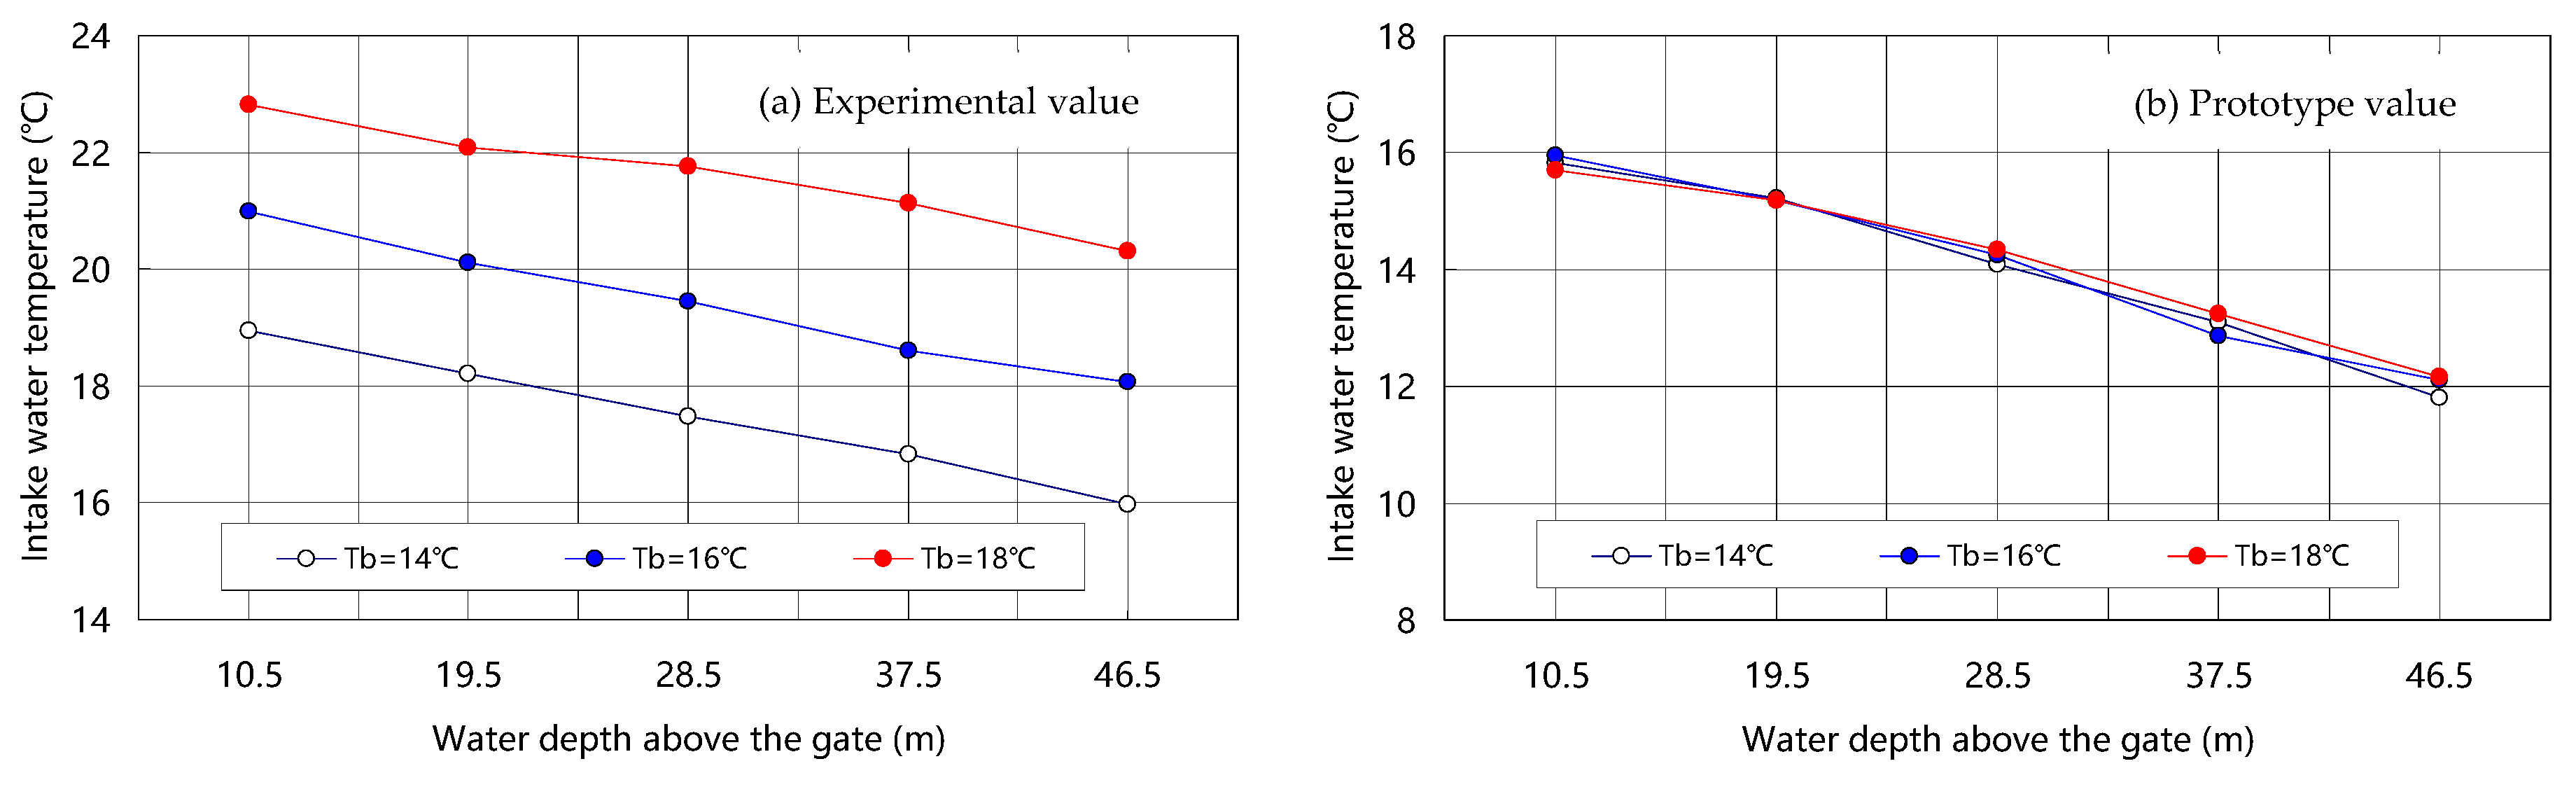
| Case | Substrate Water Temperature | Intake Water Temperature | Water Depth above the Gate (m) | ||||
|---|---|---|---|---|---|---|---|
| (°C) | (°C) | 10.5 | 19.5 | 28.5 | 37.5 | 46.5 | |
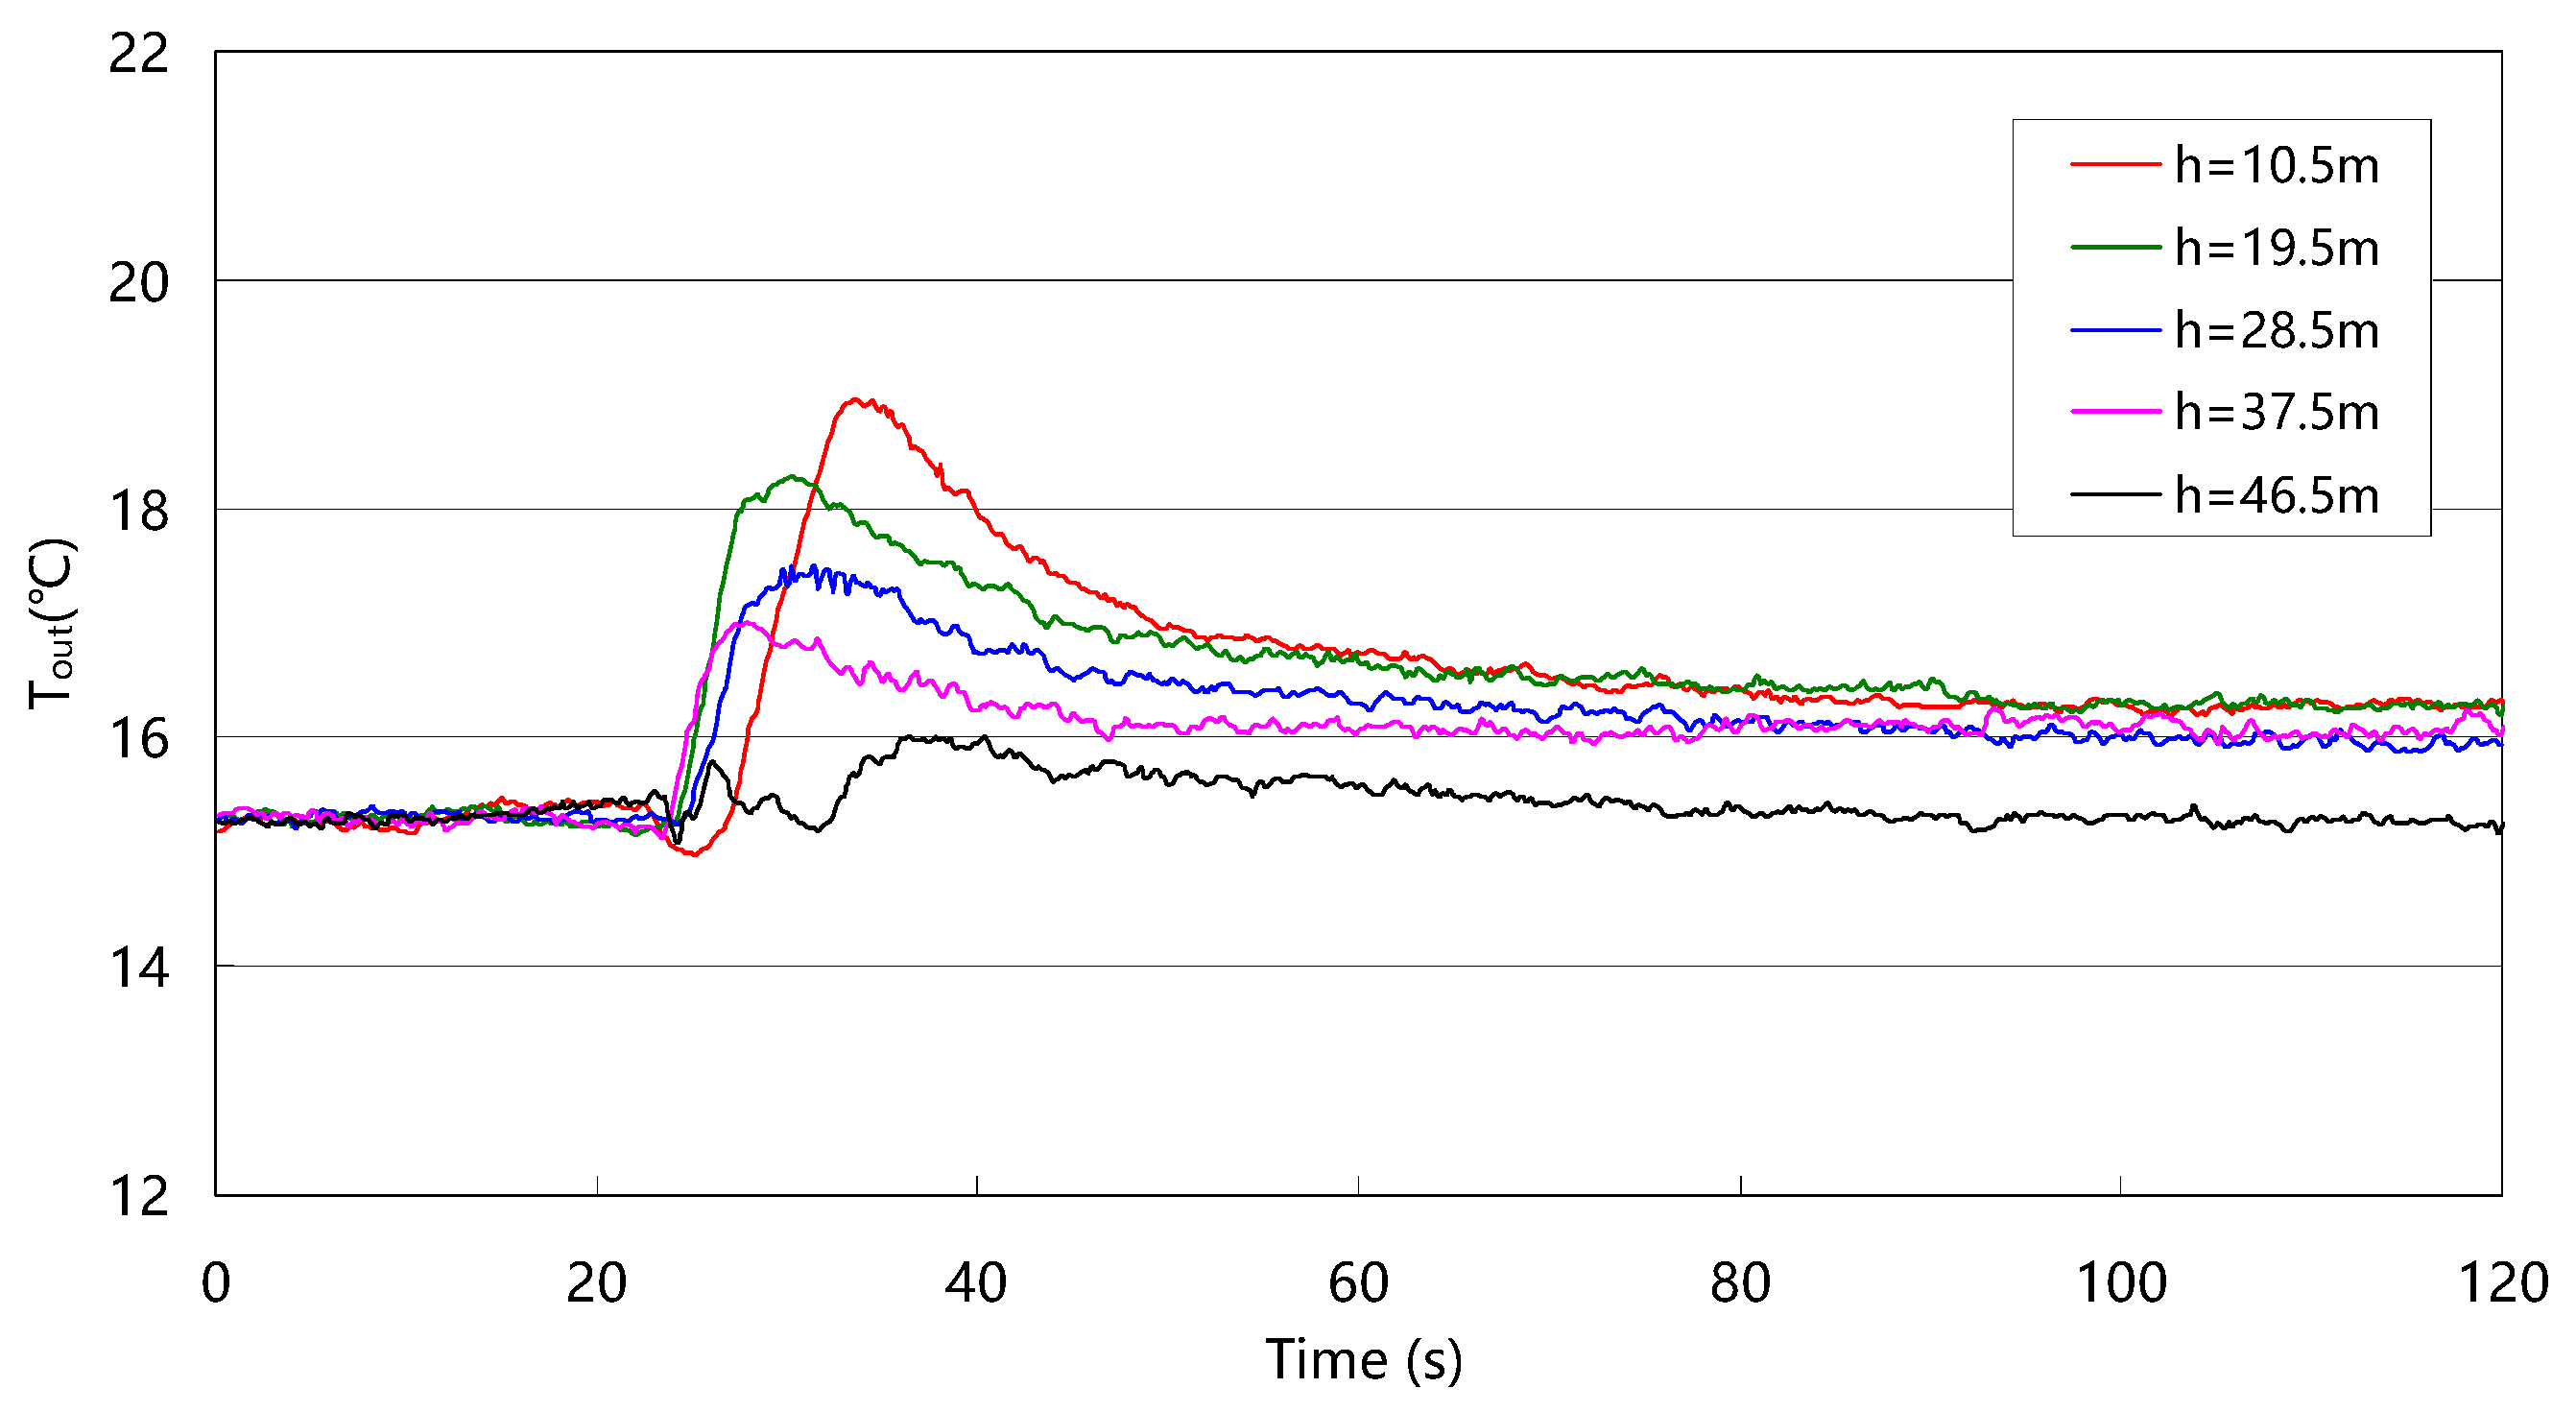
| 1 | 14 | Model | 18.95 | 18.21 | 17.47 | 16.83 | 15.97 |
| Prototype | 15.83 | 15.21 | 14.08 | 13.09 | 11.81 | ||
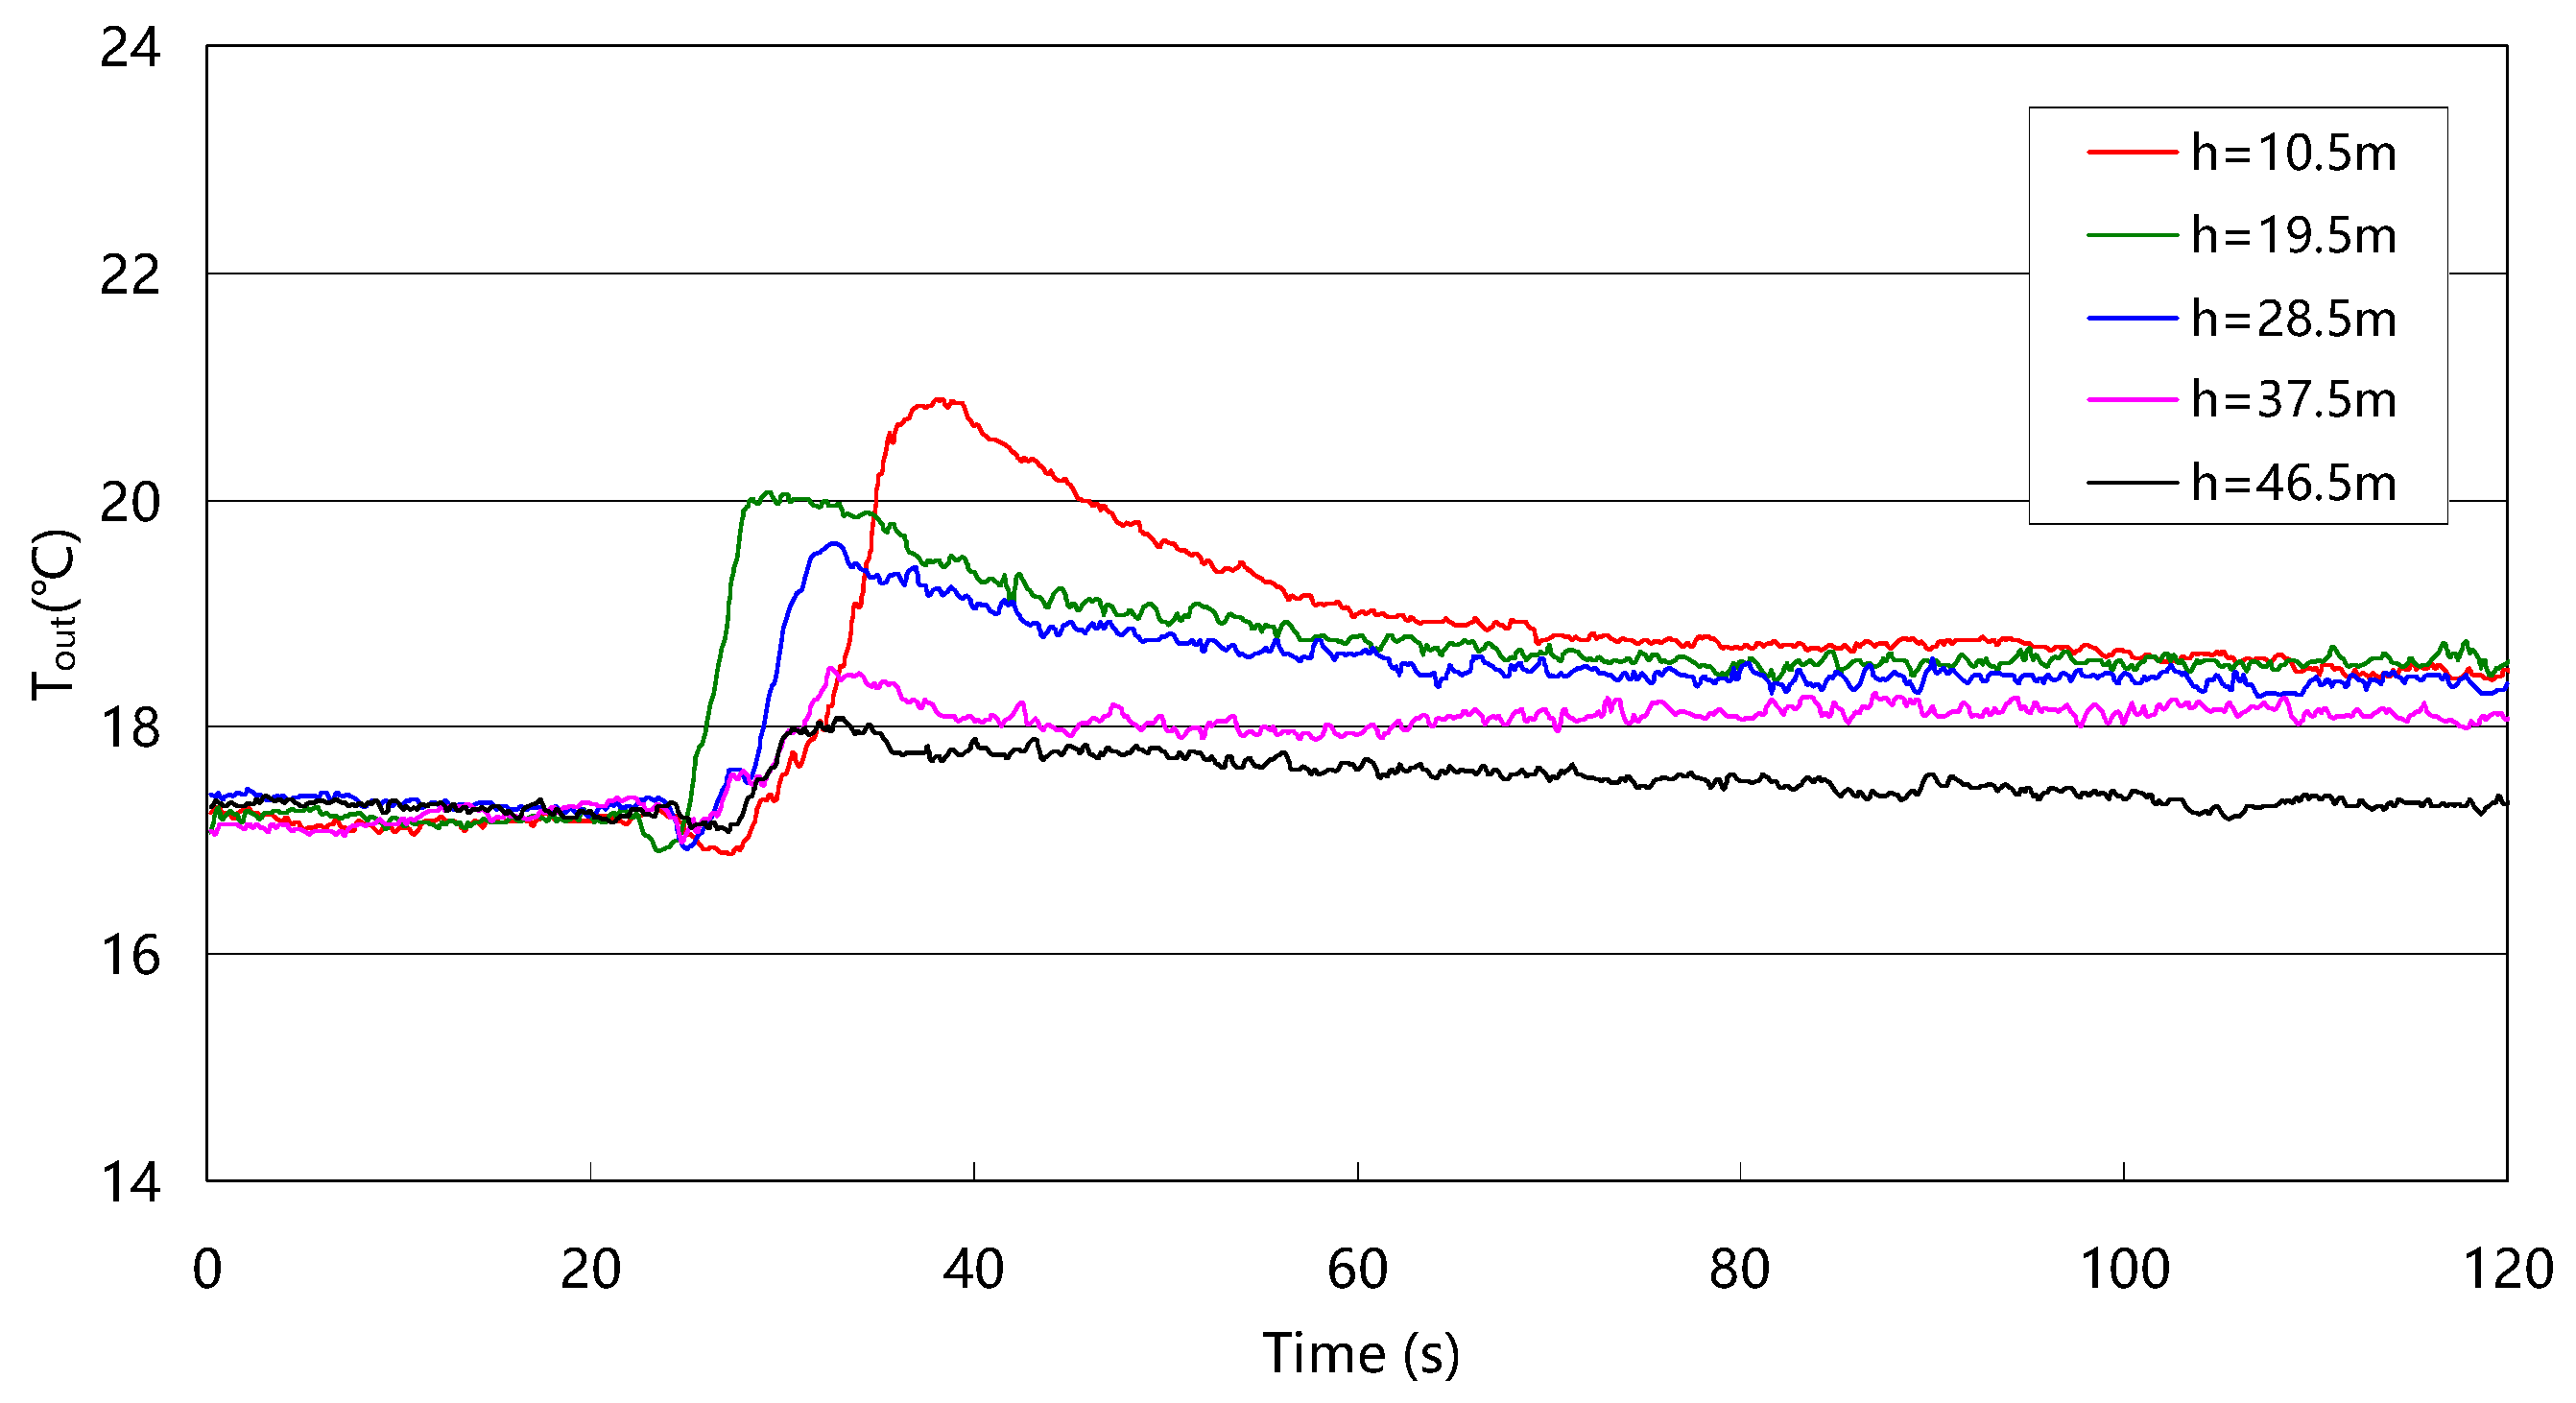
| 2 | 16 | Model | 20.99 | 20.12 | 19.44 | 18.6 | 18.07 |
| Prototype | 15.95 | 15.19 | 14.25 | 12.86 | 12.11 | ||
| 3 | 18 | Model | 22.81 | 22.09 | 21.76 | 21.14 | 20.3 |
| Prototype | 15.70 | 15.18 | 14.33 | 13.25 | 12.16 | ||
| Water intake structure | Top water depth (m) | 10.5 | 19.5 | 28.5 | 37.5 | 46.5 |
| Traditional stoplog | Velocity at water intake elevation (m/s) | 3.81 | 2.05 | 1.40 | 1.07 | 0.86 |
| Surface velocity of water intake section (m/s) | 0.39 | 0.21 | 0.14 | 0.11 | 0.09 | |
| Thickness of drag layer below intake elevation (m) | 20.0 | 17.0 | 11.5 | 6.5 | 4.0 | |
| Intake water temperature (°C) | 20.52 | 20.40 | 20.31 | 20.26 | 20.18 | |
| Stoplog with horizontal curtain | Velocity at water intake elevation (m/s) | 3.36 | 1.76 | 1.18 | 0.91 | 0.74 |
| Surface velocity of water intake section (m/s) | 0.59 | 0.33 | 0.24 | 0.17 | 0.14 | |
| Thickness of drag layer below intake elevation (m) | 15.0 | 12.5 | 8.5 | 5.0 | 3.0 | |
| Intake water temperature (°C) | 20.94 | 20.86 | 20.82 | 20.78 | 20.65 | |
| Front curtain | Velocity at water intake elevation (m/s) | 2.26 | 1.28 | 0.81 | 0.63 | 0.53 |
| Surface velocity of water intake section (m/s) | 1.29 | 0.64 | 0.41 | 0.32 | 0.26 | |
| Thickness of drag layer below intake elevation (m) | 11.5 | 10.0 | 6.5 | 4.0 | 2.5 | |
| Intake water temperature (°C) | 21.70 | 21.66 | 21.41 | 21.29 | 21.16 |
Disclaimer/Publisher’s Note: The statements, opinions and data contained in all publications are solely those of the individual author(s) and contributor(s) and not of MDPI and/or the editor(s). MDPI and/or the editor(s) disclaim responsibility for any injury to people or property resulting from any ideas, methods, instructions or products referred to in the content. |
© 2023 by the authors. Licensee MDPI, Basel, Switzerland. This article is an open access article distributed under the terms and conditions of the Creative Commons Attribution (CC BY) license (https://creativecommons.org/licenses/by/4.0/).
Share and Cite
Liu, H.; Sun, S.; Li, G.; Zheng, T.; Shi, K. An Experimental Study of Different Stratified Water Intake Structures in a Deep-Water Reservoir. Water 2023, 15, 4251. https://doi.org/10.3390/w15244251
Liu H, Sun S, Li G, Zheng T, Shi K. An Experimental Study of Different Stratified Water Intake Structures in a Deep-Water Reservoir. Water. 2023; 15(24):4251. https://doi.org/10.3390/w15244251
Chicago/Turabian StyleLiu, Haitao, Shuangke Sun, Guangning Li, Tiegang Zheng, and Kai Shi. 2023. "An Experimental Study of Different Stratified Water Intake Structures in a Deep-Water Reservoir" Water 15, no. 24: 4251. https://doi.org/10.3390/w15244251