1. Introduction
The piano key (PK) weir is an innovative structure for the effective release of flood water from hydropower reservoirs. It was developed to antagonize some of the geometrical drawbacks of the traditional labyrinth type of weir [
1,
2]. With its rectangular form in plan and distinguishing tilted floors, the overhanging apexes are created, thus engendering additional crest length beyond what could be obtained in a rectangular labyrinth weir occupying the same footprint. Owing to its limited base dimension in the flow direction, it can be easily placed on existing dams in refurbishment projects or simply designed for new dams.
With experiences from the labyrinth weir, Lempérière och Ouamane [
3,
4] proposed, for the first time in 2003, the ingenious PK weir layout, which was based on extensive hydraulic model tests carried out over several years. In 2006, Electricité de France (EDF) built the first prototype weir at the Goulours dam [
5]. Since then, more than 10 such weirs have been constructed by EDF in the upgrades of its existing gravity and arch dams, almost all of which aim to increase the spillway discharge capacity [
6,
7]. Owing to its simplicity and unique performance, 30+ such weirs have been accomplished worldwide [
8]. At the Escouloubre dam, it was instead built to neutralize the rise in reservoir water level in case of a sudden load rejection of the power plant. In Vietnam, for example, six weirs were built [
9]; in the U.S., two weirs were constructed at the Lake Peachtree and Hillborough dams [
10].
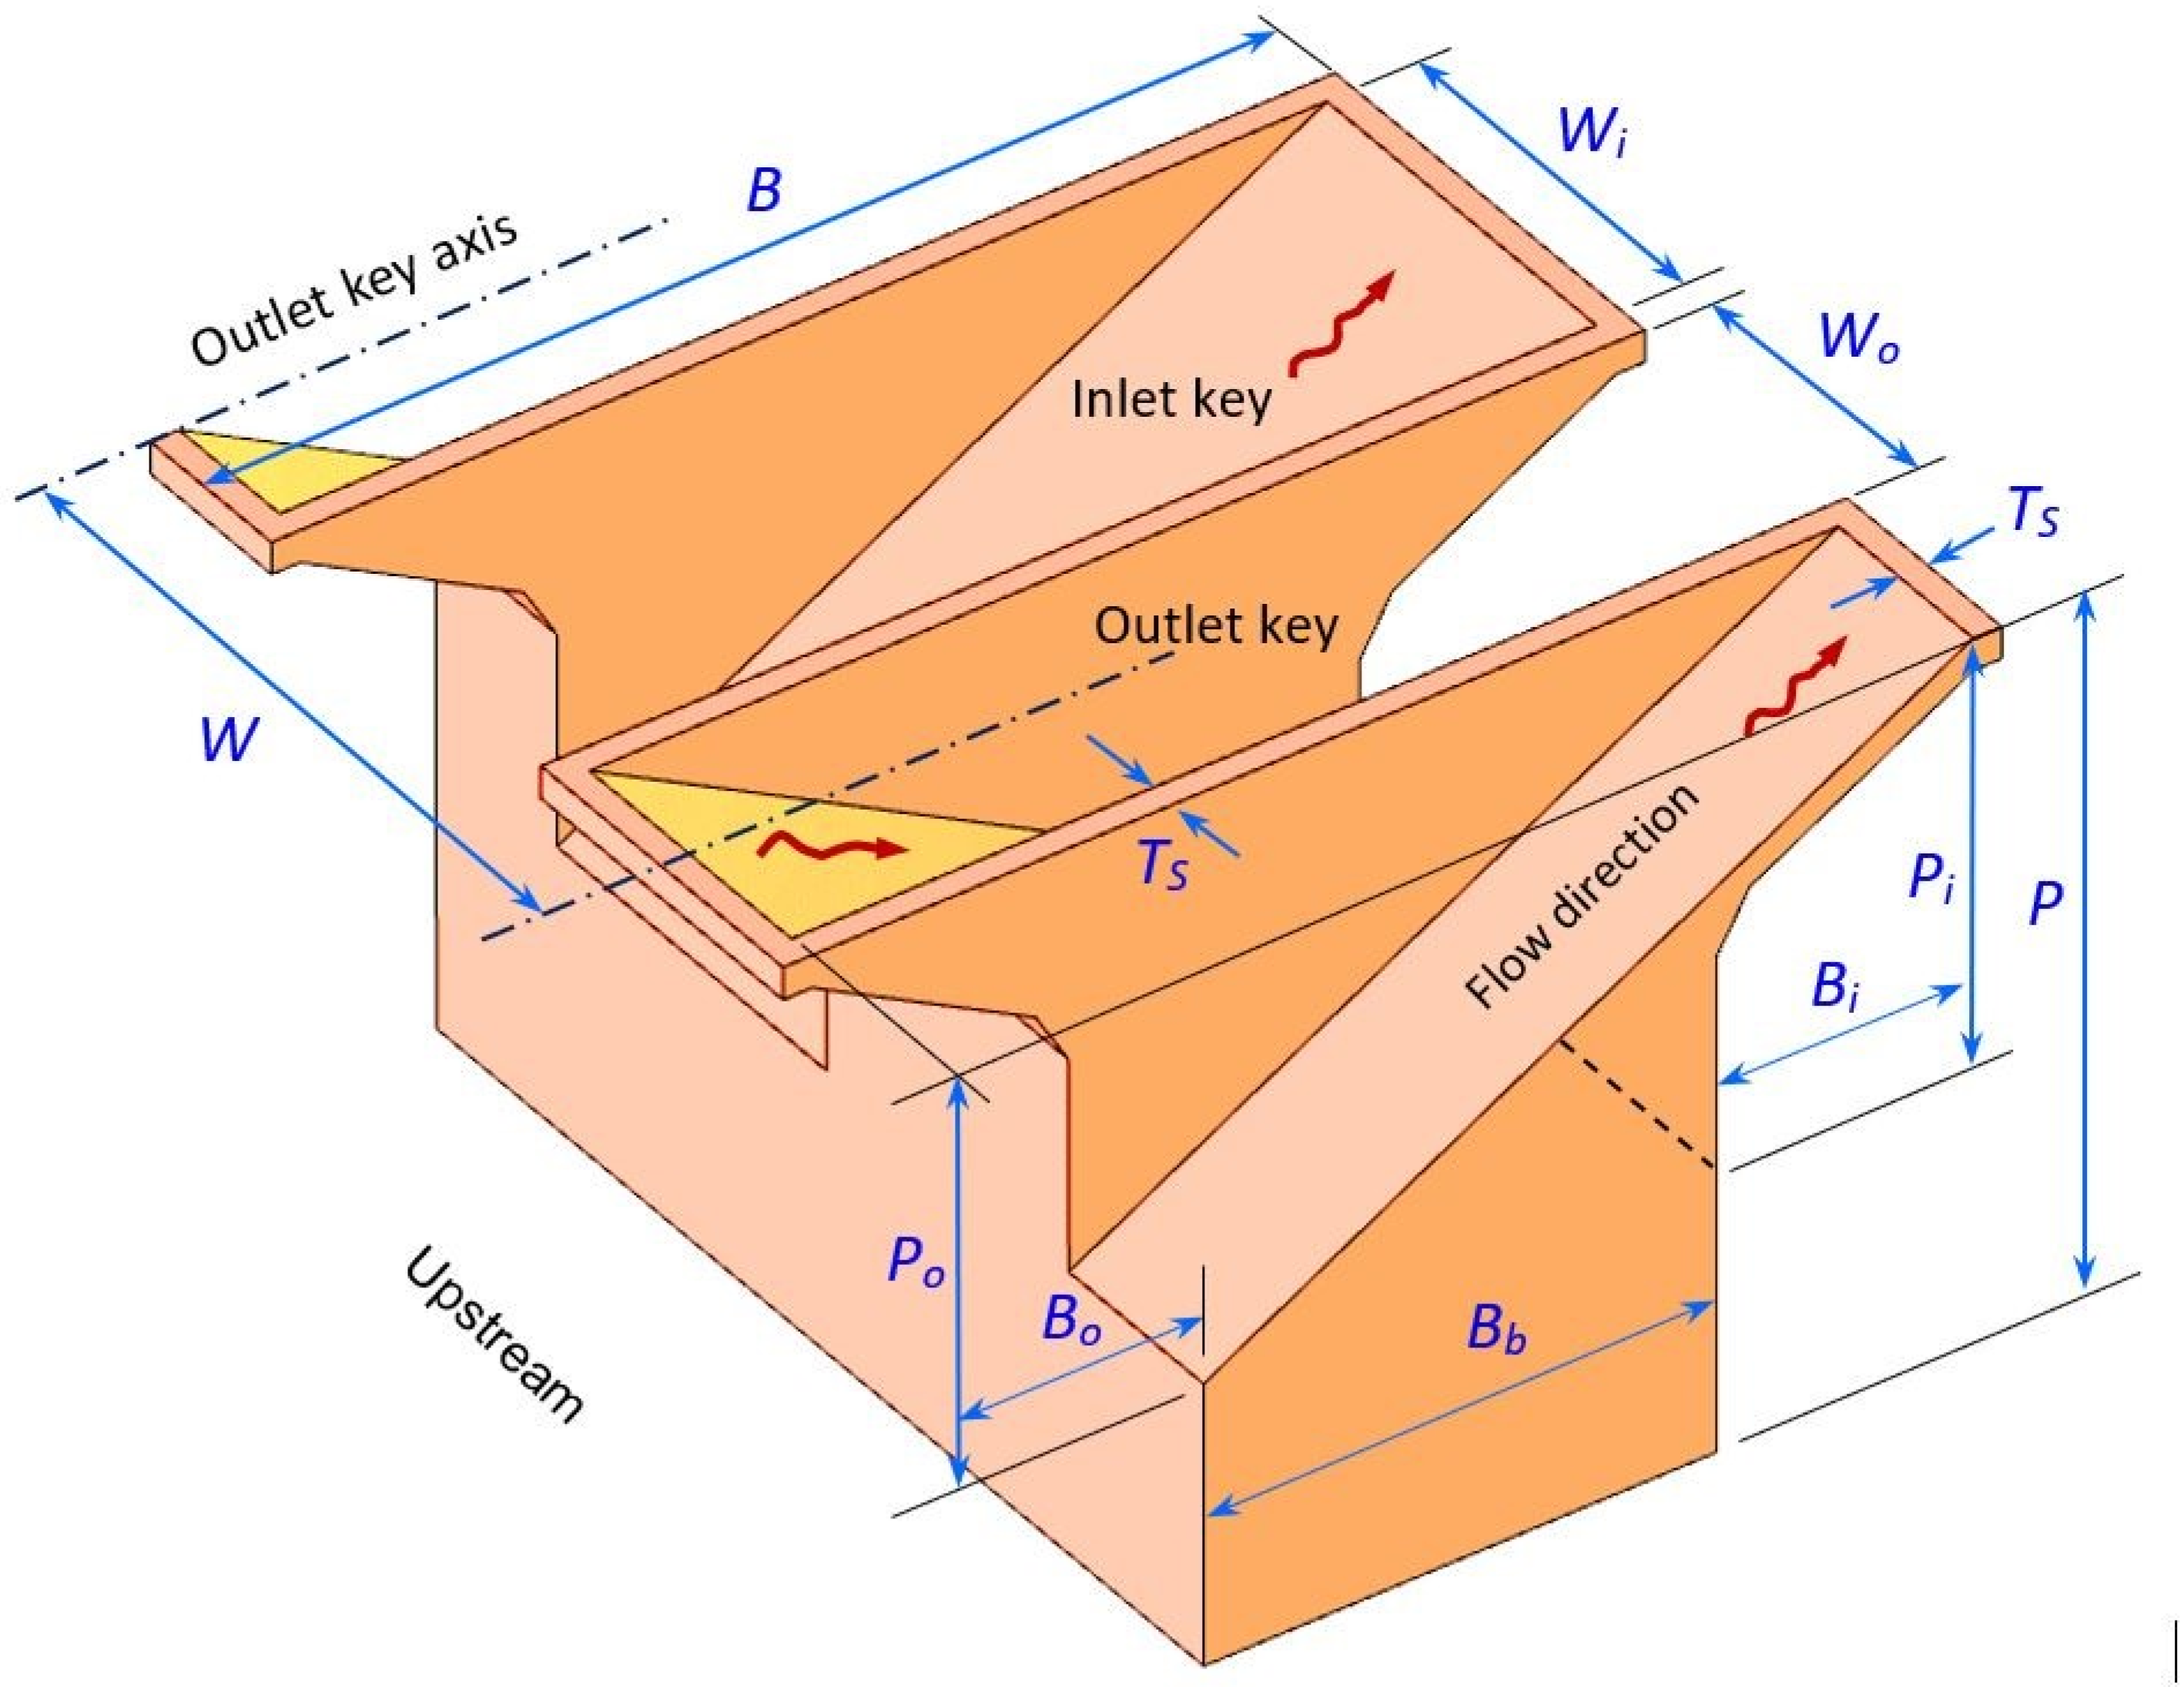
Compared to the labyrinth weir with vertical walls, the PK weir features several more governing parameters. A PK weir is usually divided into four basic types: type A—with both up- and downstream overhangs; type B—with upstream overhang (vertical wall downstream); type C—with downstream overhang (vertical front upstream); and type D—with both up- and downstream vertical walls [
11]. For either type, its major feature is that the floors of both inlet and outlet keys are tilted, with vertical sidewalls. With the same notation as defined by Pralong et al. [
12] and Pfister and Schleiss [
13], the parameter definition for the type A weir is shown in
Figure 1.
In the figure,
Ts is the wall crest thickness;
Wi,
Wo is the inlet and outlet key width;
Pi,
Po is the inlet and outlet key height;
Bi,
Bo is the crest length of inlet and outlet key overhang (excluding
Ts);
Bb is the weir base length; and subscripts
i and
o denote the inlet and the outlet key, respectively. The angles of the inlet and outlet key floors with the horizontal plane are
αi = tan
−1[
Pi/(
Bb +
Bi)] and
αo = tan
−1[
Po/(
Bb +
Bo)]. A single weir unit (cycle) comprises one inlet key and one outlet key, and its unit width
W is
In the flow direction, the weir crest length
B (including the apex walls) is
Measured along the centerline of the overflow crest, the crest length of the single cycle is
This is customarily referred to as the developed crest length of the weir unit, a characteristic length in the analysis of flow discharges.
For a weir unit, the major parameters affecting its hydraulic efficiency are
Wi,
Wo,
Pi,
Po,
Bi,
Bo,
Bb, and
Ts; the dominating ratios include
L/
W,
Wi/
Wo, and
Bi/
Bo. Based upon the French experiences, Laugier and Vermeulen [
7] pointed out that the nose shape beneath the upstream overhang, the parapet wall, the cross-sectional profile of the crest, and sidewall thickness were also influencing parameters of the 11 PK weirs at EDF. With respect to geometrical effects on weir flow performance, Anderson and Tullis [
8] reviewed several related studies. The PK weir design and its geometrical optimization have engineering implications, therefore drawing attention from many researchers. A partial review of related studies is given below.
Relation between inlet and outlet widths—In their experiments, Ouamene and Lempérière [
14] examined three thin-walled PK weirs with significant differences in key widths, i.e.,
Wi/
Wo = 0.67, 1.0, and 1.5. They showed that the discharge performance became enhanced with an increase in
Wi/
Wo, and the condition
Wi/
Wo ≥ 1 contributed to higher hydraulic efficiency. Lempérière [
15] considered
Wi/
Wo = 1.25 to be close to optimal. Anderson and Tullis [
8] stated that the optimal
Wi/
Wo range for maximizing flow discharge efficiency was likely within the approximate interval of
Wi/
Wo = 1.25–1.50, and the
Wi/
Wo > 1.5 configuration was, however, not tested.
Table 1 summarizes the
Wi/
Wo values of 14 weirs, with 11 in France; one in Giritale, Sri Lanka; one in Van Phong, Vietnam; and one in Emmenau, Switzerland [
7]. Obviously,
Wi/
Wo ranges from 1.00 to 1.83.
Weir height (floor slope)—Machiels, et al. [
16] presented an experimental study of varying weir heights. With the same base (
Bb) for all models,
Wi/
Wo = 1.5,
L/
W = 5, and symmetrical overhangs, the floor sloping angle (
α) is successively changed, thus resulting in different weir heights. Seven angles were tested, with tan
α = 0.25–1.50 (
α ≈ 14°–56°). An analytical formulation of the unit weir discharge as a function of its height is developed. The experimental results revealed that, starting from tan
α = 0.25, an increase in the inlet floor slope led to an increase in weir capacity. However, beyond the limit tan
α = 1.2 (
α ≈ 50°), the increase became insignificant. The effects of weir heights on discharge were also briefly tested by Anderson and Tullis [
2].
Nose beneath upstream overhang—In the model studies for the Raviege and Escouloubre dams, Erpicum, et al. [
17,
18] showed that an addition of a triangular nose below the upstream overhang gave rise to an enhancement in discharge capacity, which was obviously attributable to the alleviation of the side-contraction effects leading to improved conditions of the approach flow into the inlet key. A parallel can be drawn with the approach flow at a spillway gate surrounded by piers.
Crest (wall) thickness—It is the wall crest width that controls the weir flow, not the wall thickness itself. However, the crest usually has the same width as the wall or is slightly narrower. By means of numerical modeling, Bremer and Oertel [
19] examined walls that are 0.05, 0.10, and 0.20 m thick. They showed that, with an increase in wall thickness, the weir flow efficiency decreased, especially at low wall heads. At small discharges, the
Ts = 0.05 m weir was up to 40% more efficient, compared to the
Ts = 0.20 m weir. Based on experimental data, Laugier et al. [
20] also established CFD models to evaluate the
Ts influences on discharge capacity.
Table 2 lists the sidewall thicknesses of the 14 PK weirs. Except for
Ts = 0.08 m at the Emmenau weir, which is made of stainless sheet steel,
Ts ranges from 0.20 to 0.40 m. Seeming to be a rule,
Ts is preferable not to go beyond 0.40 m.
Crest cross-sectional shape—Crookston [
21] examined several crest shapes of labyrinth weirs and concluded that an abrupt or sharp leading edge is less efficient than a rounded (fillet) or chamfered one. For PK weirs, a parallel study was performed by Cicero and Delisle [
22]. They presented model tests of a type A weir with a flat-topped, a half-rounded, and a quarter-rounded crest. Some crest configurations were tested at two weir heights. It was confirmed that the crest shape influenced the discharge capacity, especially at low heads, and the latter two shapes exhibited better hydraulic performance than the flat-topped one. Relative to the flat-topped crest, the gain in flow discharge was as high as 10–20% at low heads. With linearly varying key cross-sections, Shen and Oertel [
23] evaluated the effects of four crest profiles on discharge behaviors, stating that the half-round crest provided the highest discharge capacity, while the flat crest was the most efficient configuration in terms of energy dissipation.
Parapet wall—Model studies by Anderson and Tullis [
8] and Laiadi, et al. [
24] demonstrated that the addition of a parapet wall on the weir crest contributed to an increment in flow discharge. This was presumably associated with two aspects—the volume increase in the inlet key that mitigated the inlet key entrance energy loss and a higher outlet key that alleviated the outflow submergence at high flow rates.
Upstream overhang length and inlet key cross-sectional area—With a calibrated and validated 3D CFD model, Pralong, et al. [
25] carried out sensitivity analyses of several geometrical parameters of a type B weir, inclusive of upstream overhang length (
Bo) and inlet key volume. The simulations were made for a wide range of flow rates. By maintaining the same crest length of the inlet key, the overhang was progressively narrowed. A longer overhang led to a discharge increment, albeit the gain was limited. The changes in the
Wi/
Wo ratio indicated that, to enhance the flow capacity, it was important to maximize the flow in the inlet key. Both the overhang length and the inlet key volume contributed positively to the discharge.
Weir crest length—Optimizing
Wi/
Wo,
Bo, or assigning the keys with trapezoidal planforms [
8,
25,
26,
27] affects in one way or another the crest length. Other conditions being the same, a longer crest leads to higher discharge efficiency. Laugier et al. [
28] proposed a so-called fractal PK weir, with a number of small PK weirs placed on the crest of a PK weir of ordinary size to extend the crest length. Both model tests and CFD modeling showed that the fractal weir was efficient at low water heads below 1.0 m. In the rehabilitation of the Oule spillway for a higher design flood, the crest of its 33 m long ungated overflow weir was lowered by 1.0 m, and 22.5 small PK weirs of stainless steel were installed on it, with
Wi = 0.65 m,
Wo = 0.55 m,
Ts = 0.02 m,
B = 2.4 m, and a 1.0 m height [
29,
30,
31].
The present study deals with geometrical modifications of a typical PK weir with up- and downstream overhangs (type A) and examinations of its discharge features. The near-optimal weir configuration with the rectangularly cranked planform is treated as a reference weir. Modifications of the inlet and outlet key floors and the resulting elliptical crests of the overhang apexes create an improved weir. Physical models of both the reference and improved weirs are 3D-printed. Laboratory tests are carried out to explore their similarities as well as discrepancies in hydraulic behaviors. The purpose of the study is to devise an improved weir and to substantiate, by means of experiments, its enhancement in hydraulic performance and augment in discharge capacity.
4. Experimental Results and Discussions
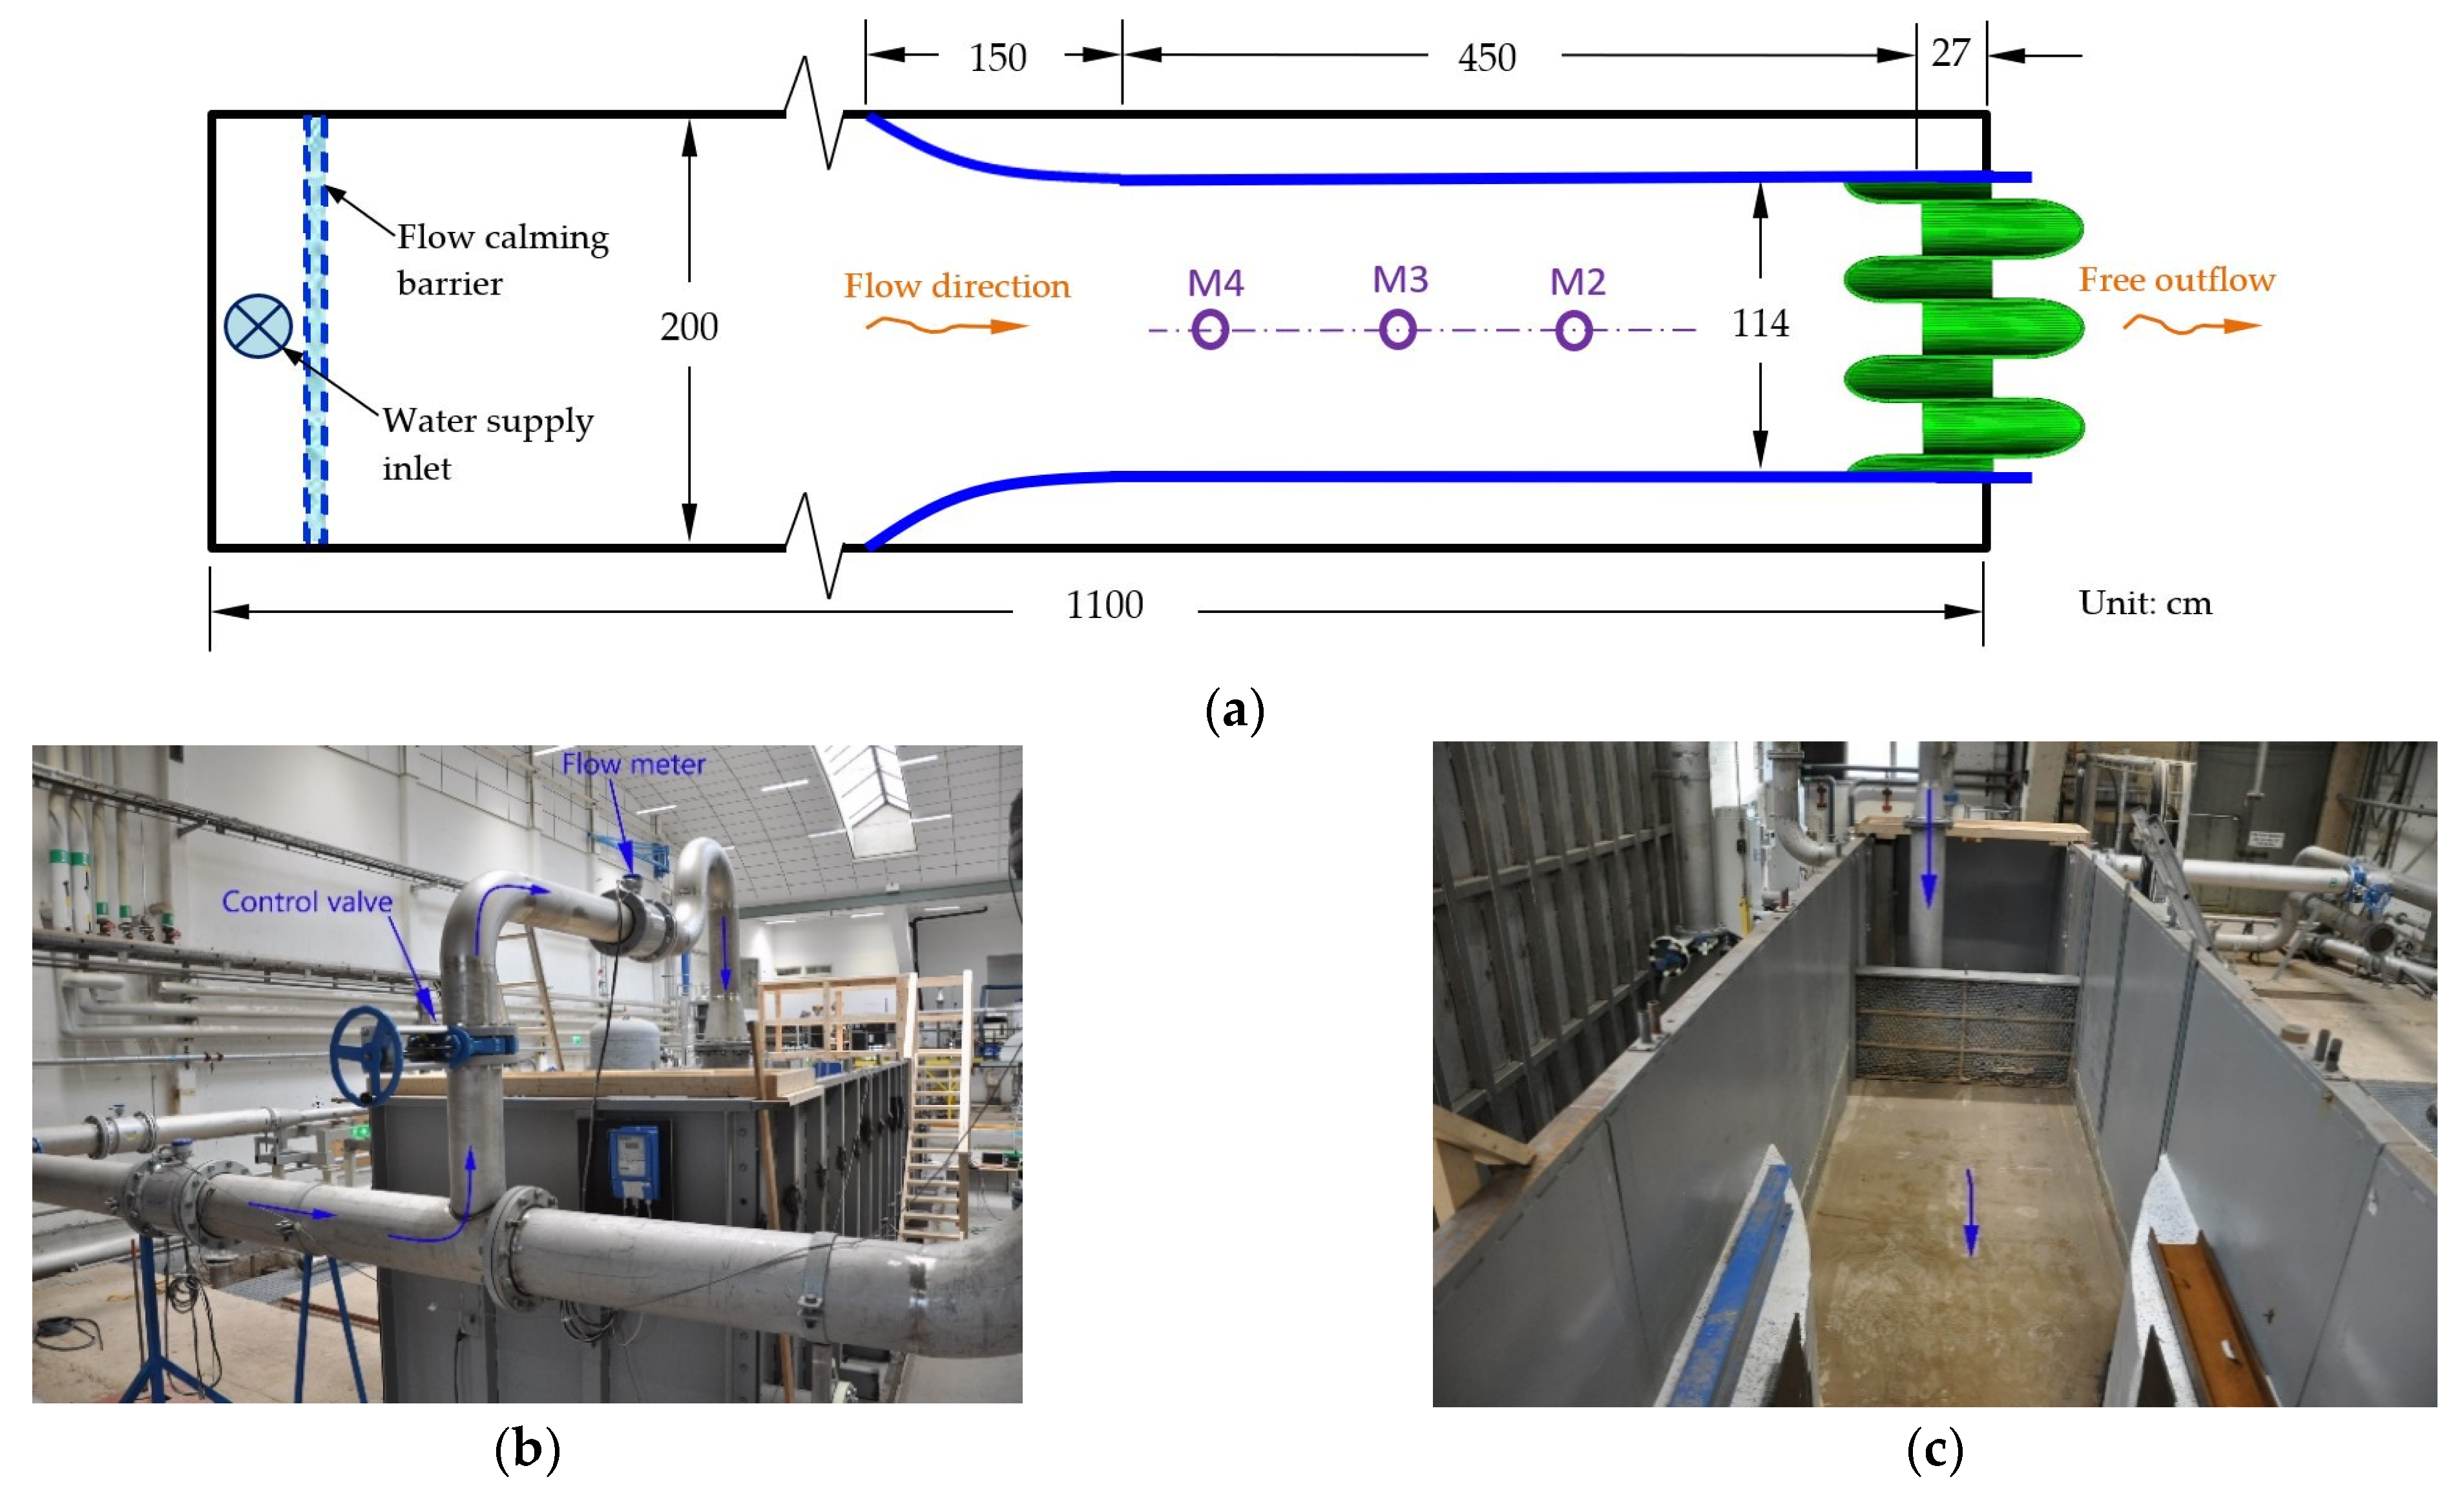
The experimental results are analyzed in terms of weir discharge capacity and hydraulic performance. The latter refers to overall overflow patterns, crest flow depth and velocity, near-bottom velocity in the inlet key, extent of free-falling jets, etc. Included are also the discharge coefficients, defined by the developed crest length and weir width of one single weir unit, respectively.
4.1. Flow Discharge Capacity
The PK weir is a hydraulic structure with free-surface flow and free-falling jets. Based upon the developed crest length (
L) of a single weir cycle, its flow rate,
Q, is expressed as [
13,
32]
in which
C is the discharge coefficient,
g is the gravitational acceleration,
HT is the total water head (=
H +
/(2
g)),
V0 is the average approach velocity in the channel, and
H is the weir water head, i.e., the difference between the undisturbed upstream water stage and the weir crest elevation. The water stages at the three gauging stations differ negligibly little. The M3 station is used for calculations of
H,
V0, and
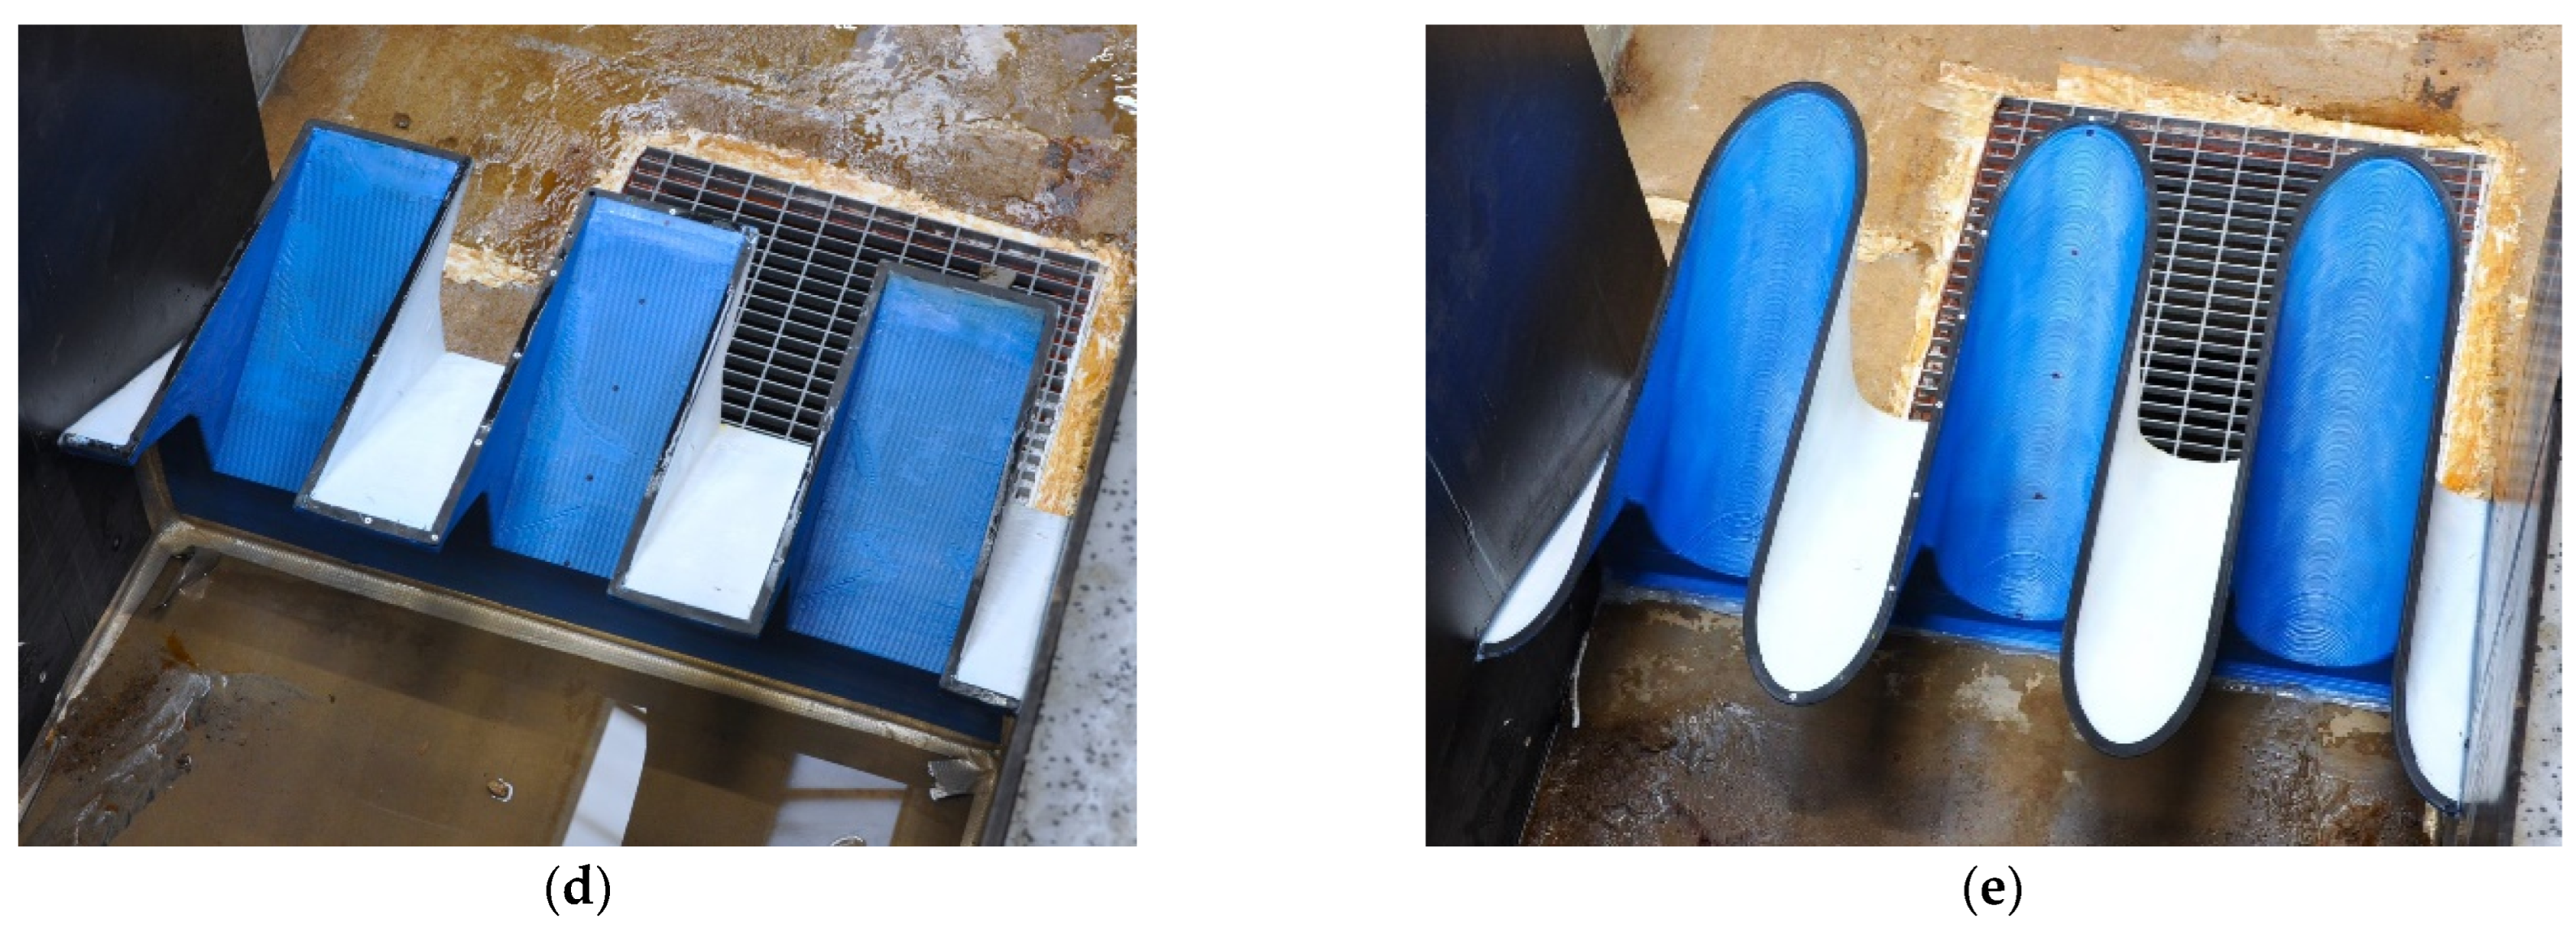
HT of the approach flow. To quantify the relative increase in flow discharge between the two weirs, define
For the reference weir,
Qref ≈ 105 L/s at maximum with
H ≈ 16.0 cm; for the improved one,
Qimp ≈ 117 L/s at maximum with
H ≈ 12.3 cm. As a function of
HT/
W,
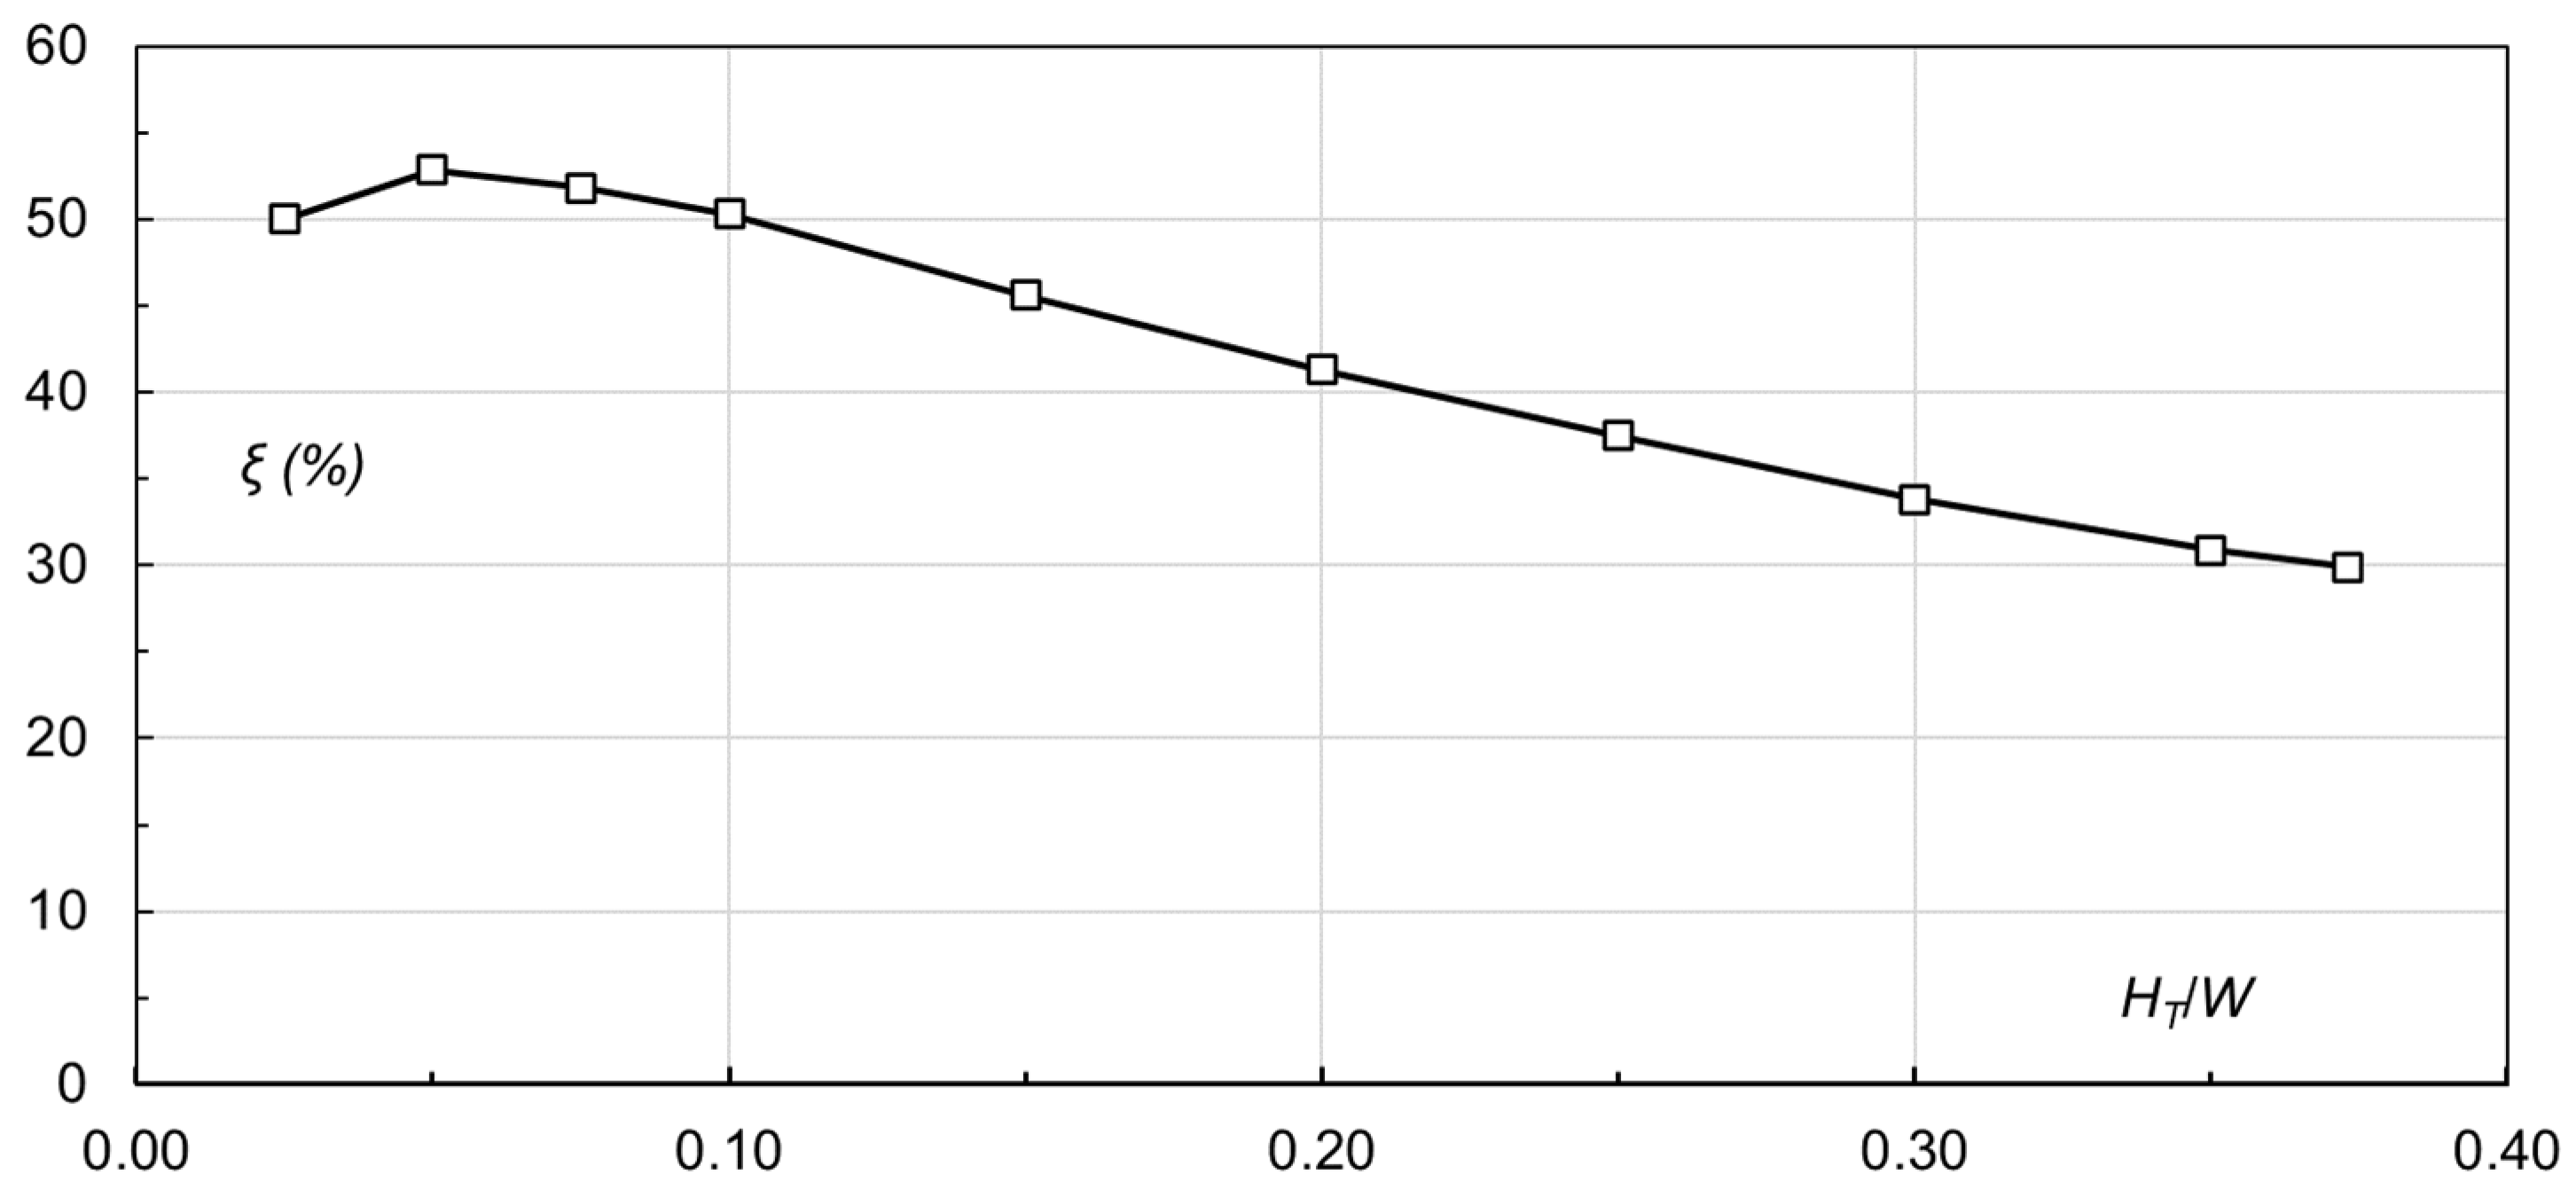
Figure 10,
Figure 11 and
Figure 12 present the comparisons between
Qimp and
Qref, the
ξ change, and the differences between
Cimp and
Cref.
The results demonstrate that, at the same
HT/
W, the improved weir gives rise to a pronounced enhancement in flow discharge and improvement in discharge coefficient. In the tests of the improved weir, the pump reaches its maximal capacity (~350 L/s), corresponding to
Q ≈ 117 L/s,
H ≈ 12.3 cm,
H/
W = 0.323, and
HT/
W = 0.373. Within the
HT/
W ≤ 0.373 range, the increase in discharge ranges within
ξ = 30–53%. It differs between the small and large water heads, with a more distinct increment in the former. For both weirs,
C first goes up with an increase in
HT/
W, and then goes down from
HT/
W ≈ 0.09, at which its maximal
C value is 0.60 for the improved weir and 0.54 for the reference one. The trend of the
C change is consistent with the findings from the studies by Anderson and Tullis [
40], Oertel and Bremer [
41], and Machiels, et al. [
42]. From
HT/
W ≈ 0.26 and upwards, the
C values of both weirs collapse onto the same line.
In the light of the unit weir width
W,
Q is written as
where
C# = discharge coefficient. Here,
H is used instead of
HT. With
W being the same for both weirs, the following relationship holds true,
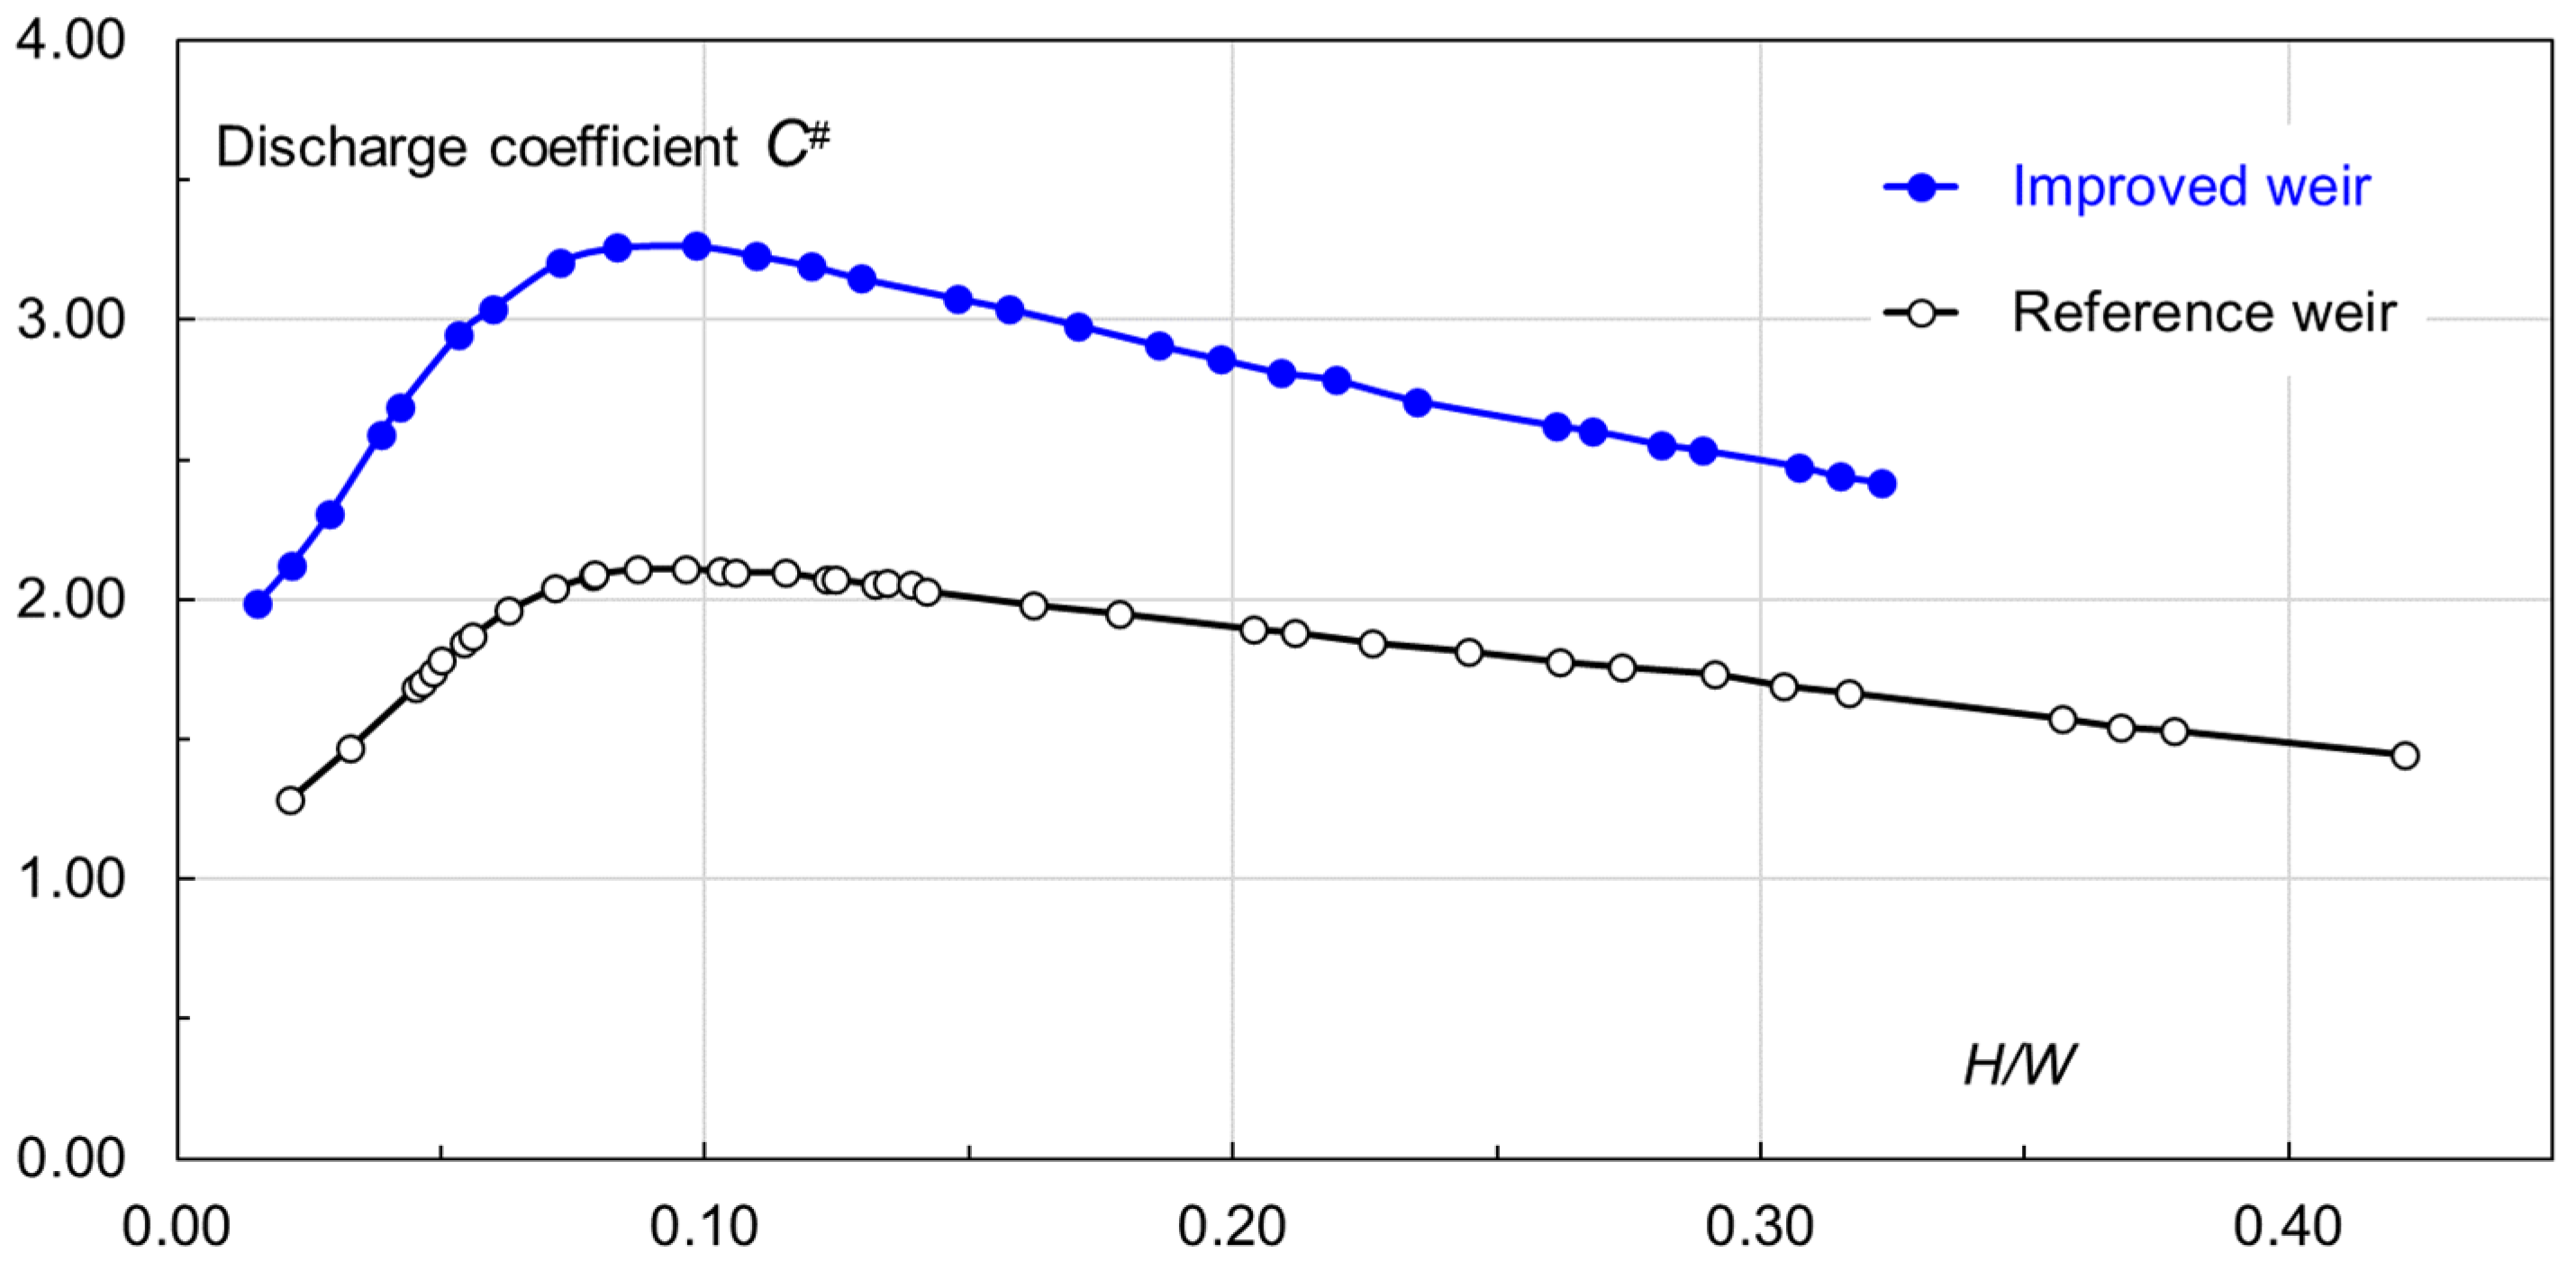
This is another way to compare their discharge efficiencies. If the upstream water stage or water head (
H) is the same, the coefficient proportionally mirrors the discrepancy in discharge between the two weirs. As a function of
H/
W,
Figure 13 shows the comparisons. Obviously, the change follows the
C trend, with
HT/
W = 0.09–0.10 as the turning point, at which
C# = 2.10 and 3.25 for the reference and improved weirs, respectively. With an increase in
H/
W,
C# declines linearly for both weirs and the distance between the two lines becomes somewhat less. Nevertheless, the difference is still considerable, suggestive of the superior performance of the improved layout.
4.2. Crest Flow Parameters
The flow over the PK crests is complex, with its flow patterns strongly dependent on the water head. It is therefore intricate in the experiments to map the flow distribution along the crest. The major reason is that, at a given flow rate, the spatially changing flow depth is also accompanied by the flow velocity that is not perpendicular to the weir wall [
43].
To obtain an approximate picture of the crest flow, measurements are made of crest water depth
h and near-crest normal velocity
Vn (perpendicular to the crest wall). The former is measured directly on the crest; the latter is recorded with the velocimeter, with its propeller axis 11 mm above the crest.
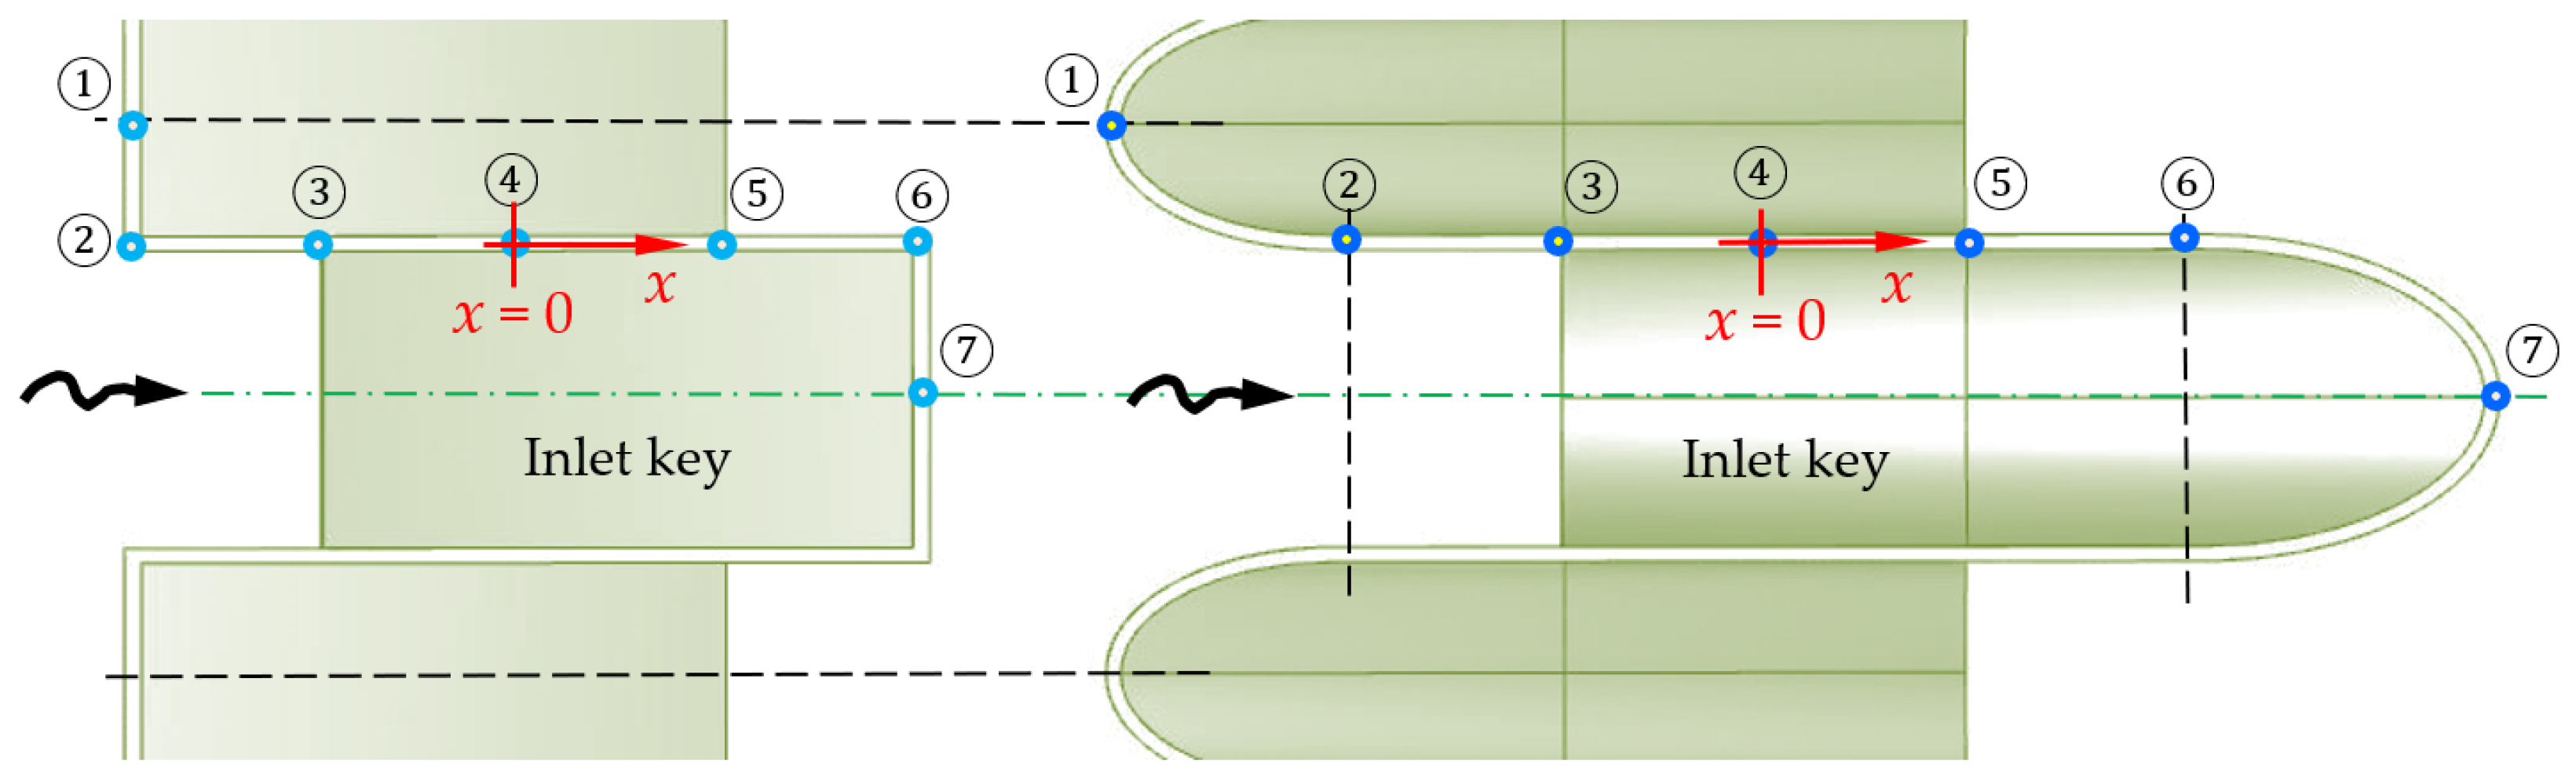
Figure 14 marks the characteristic points on the crest of each weir, covering half of the weir cycle with a length of 0.5
Lref = 73.0 cm for the reference weir and 0.5
Limp = 99.6 cm for the improved one. Points ②–⑥ are on the straight weir wall, at the same positions for both weirs. Following the crest centerline, an
x-coordinate is defined, with its origin at the weir base axis (point ④) and being positive downstream. Their curvilinear coordinates are listed in
Table 6.
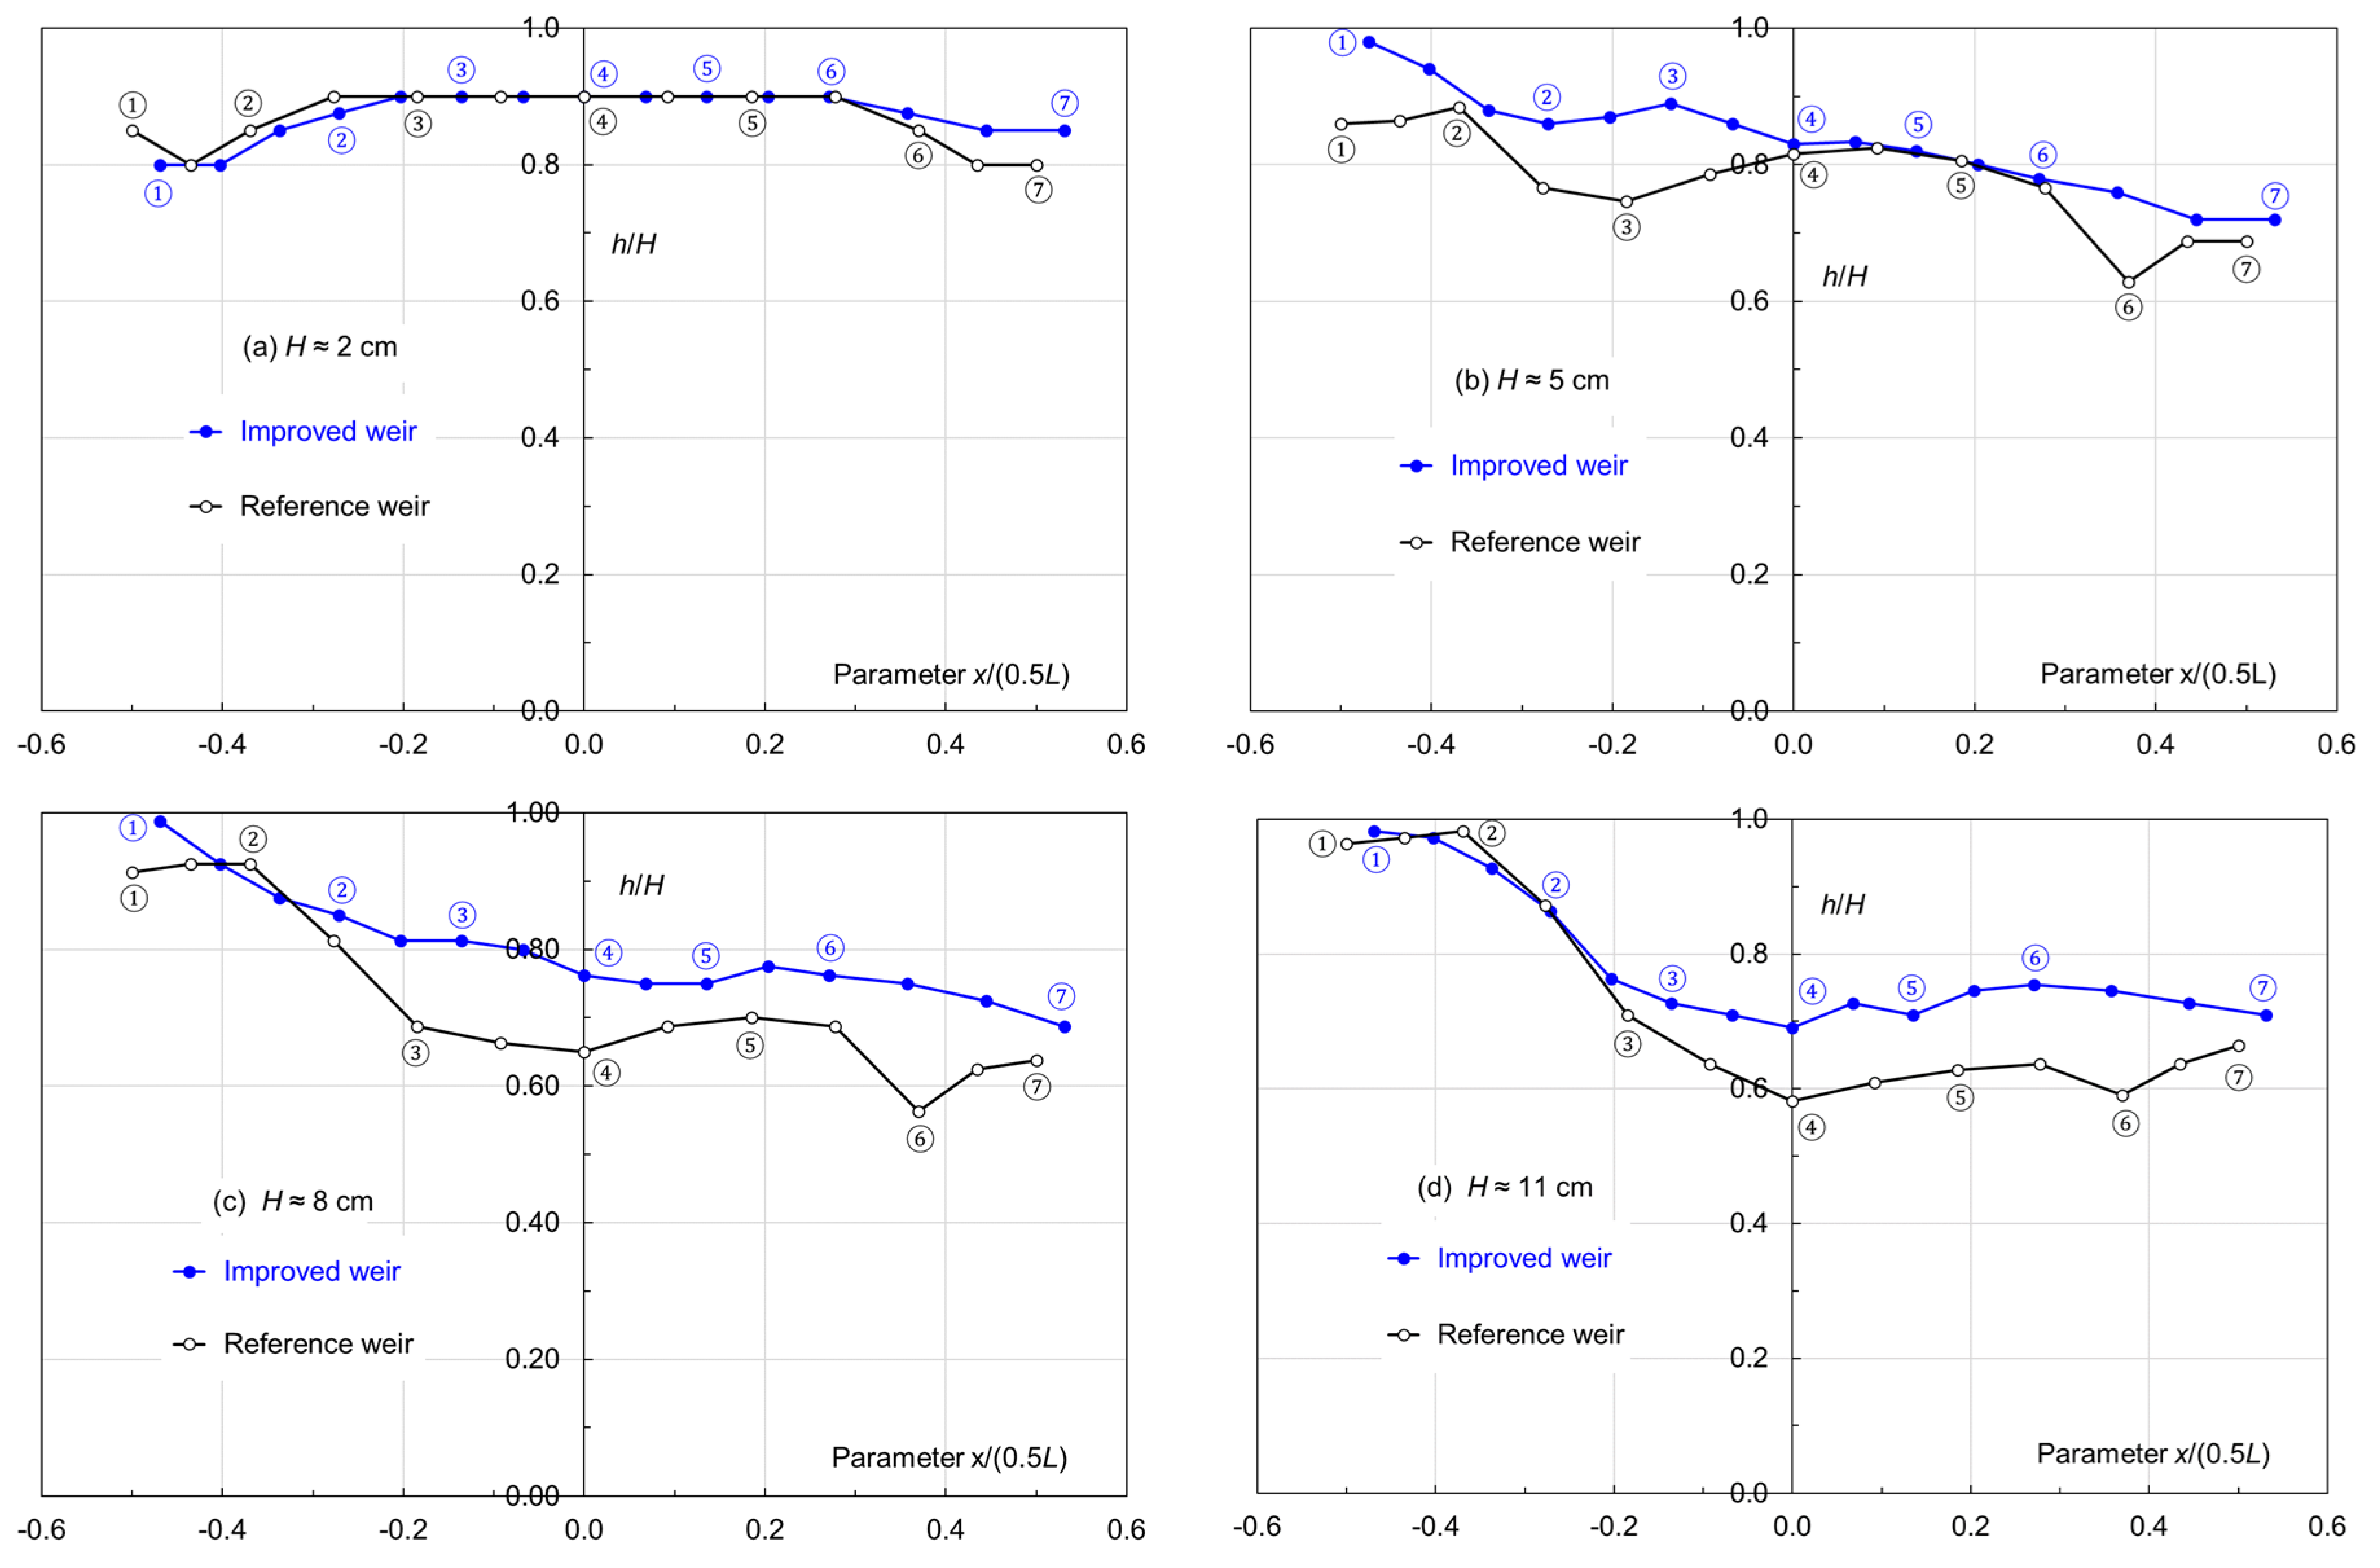
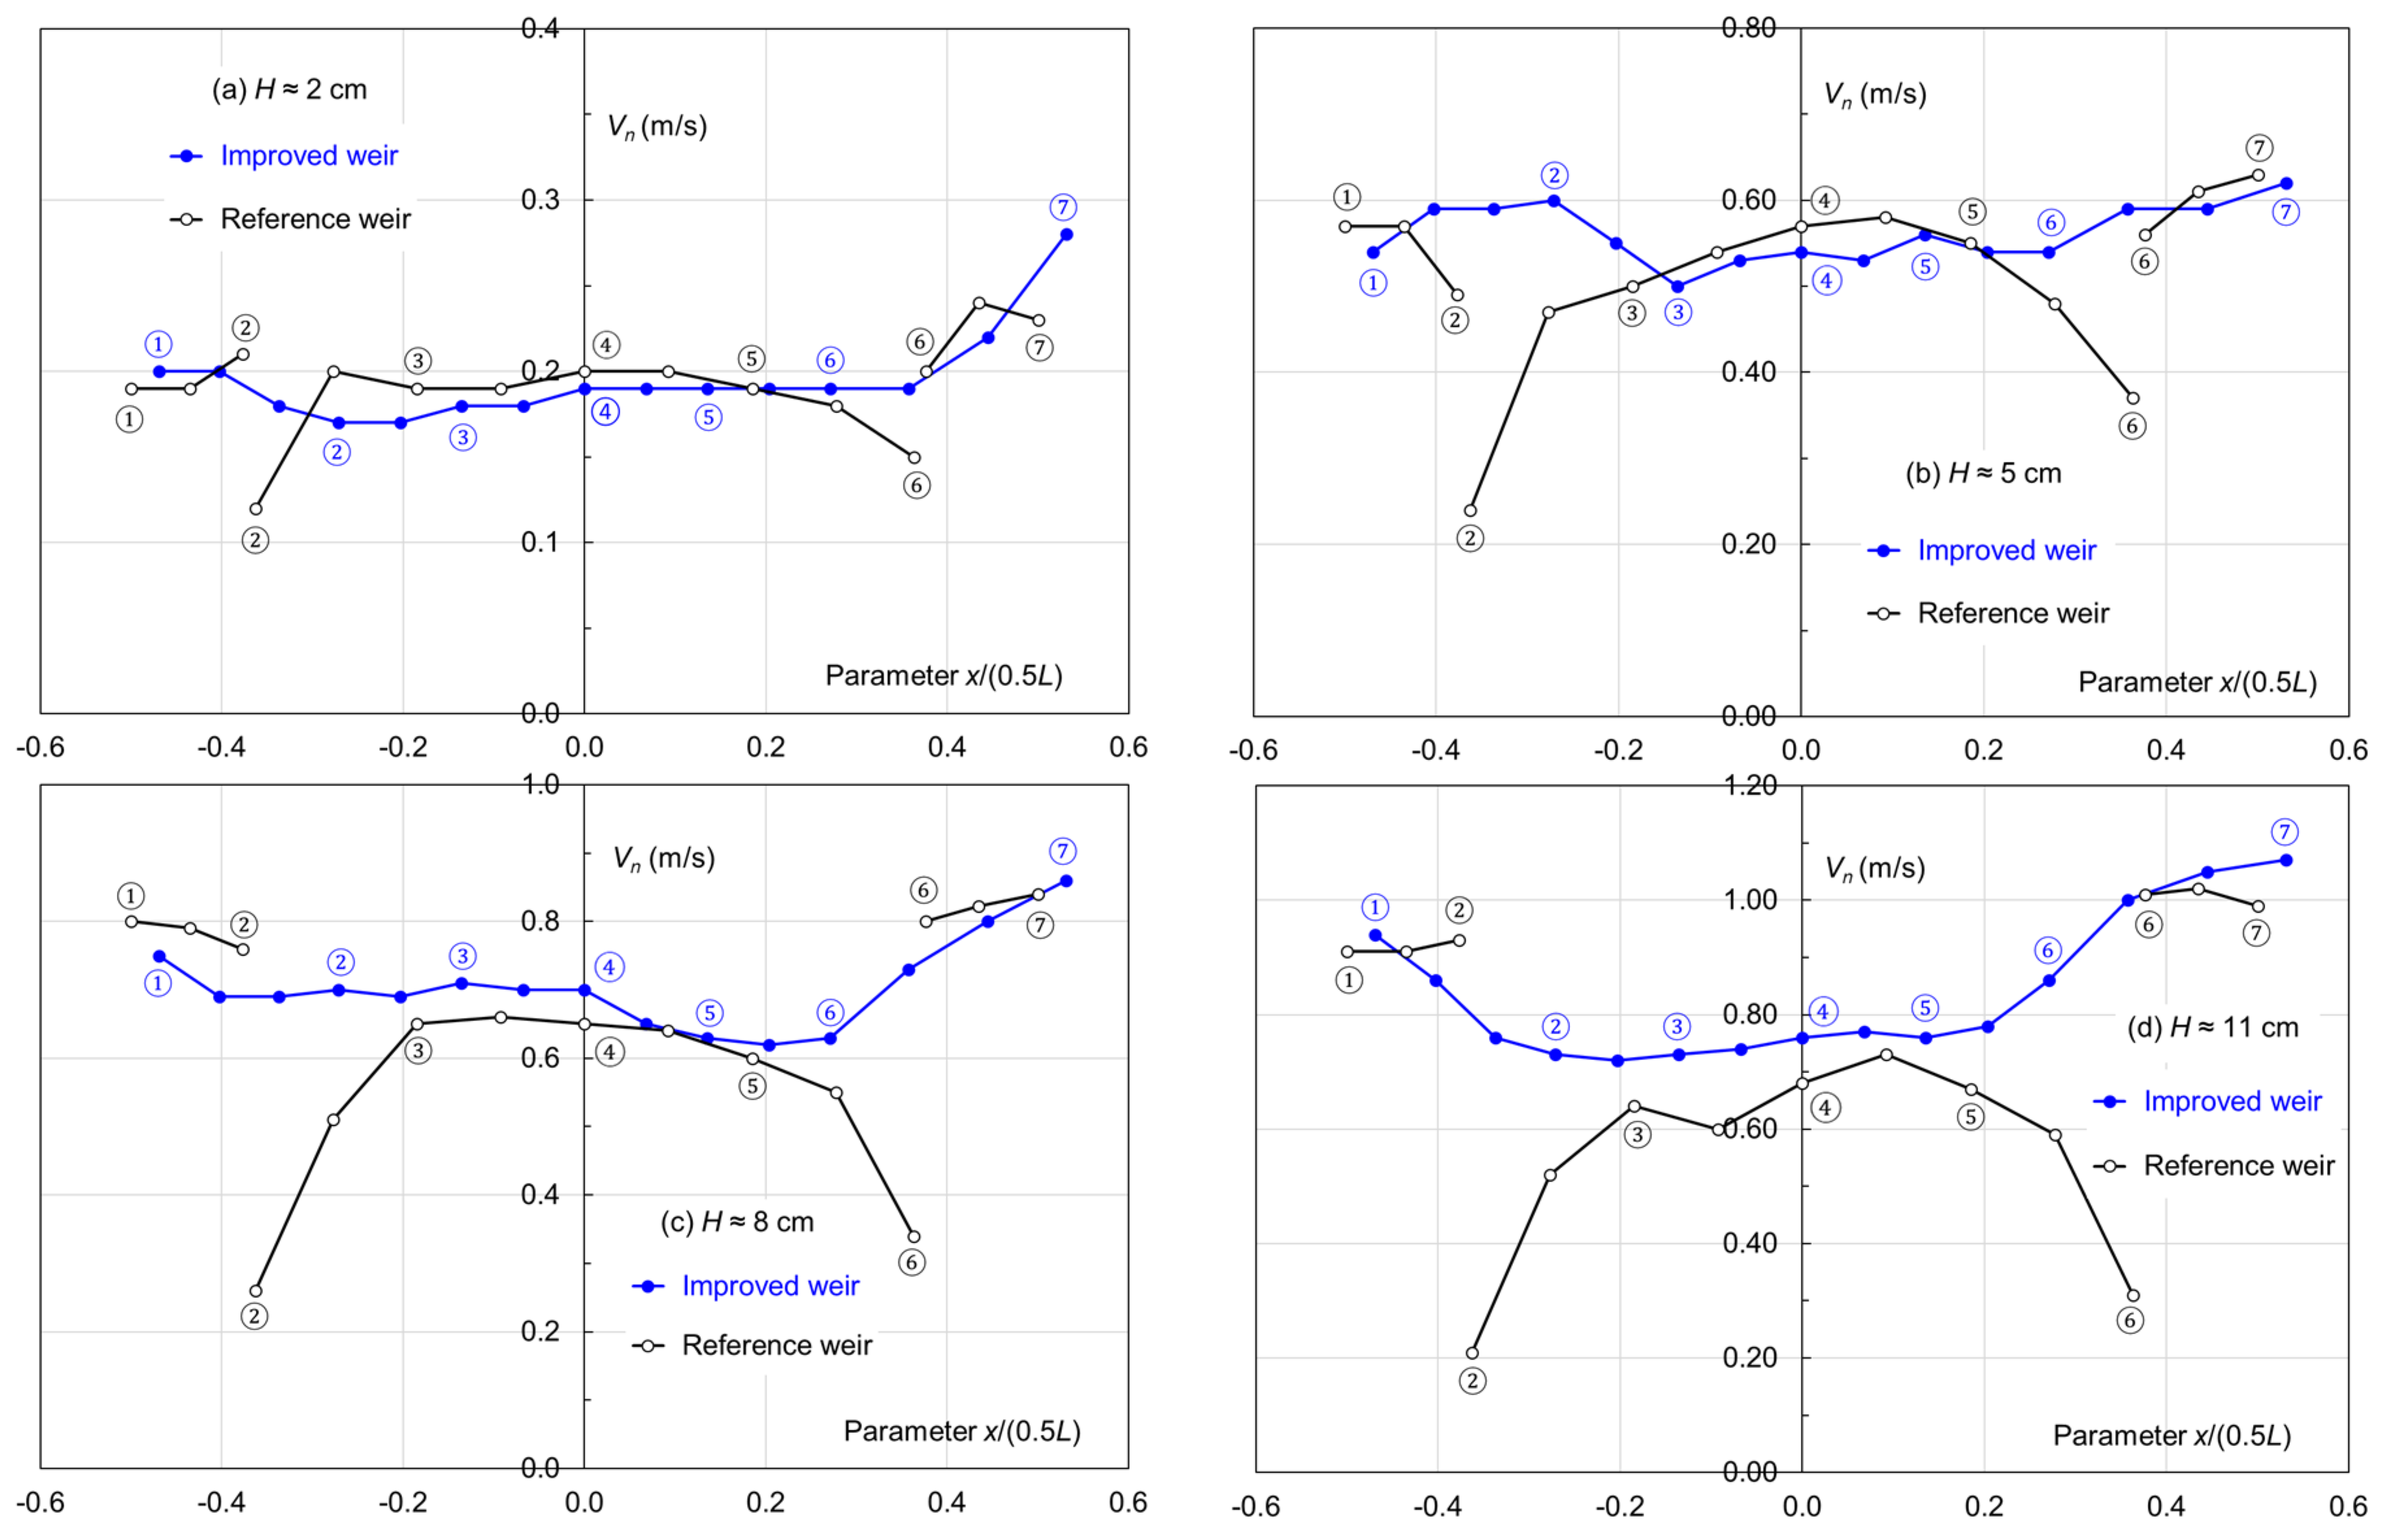
Figure 15 and
Figure 16 compare the
h/H and
Vn variations along the crest, both as a function of
x/(0.5
L). For the reference weir, points ② and ⑥ are at vertices of the rectangular crest and
Vn is measured on both sides of each vertex. Four water levels are chosen to demonstrate the flow changes, i.e.,
H ≈ 2.0, 5.0, 8.0, and 11.0 cm. It should be noted that the comparisons are made between the two weirs at the same water head, rather than different flow cases of the same weir.
The tests show that, at low flows (
H < 3 cm), the difference in crest flow depth is little between the two weirs, with nearly horizontal water levels along the side walls (between points ② and ⑥) (
Figure 15a). With an increase in flow discharge, the water depth drops downstream of point ② of the reference weir, with a significant drop at high flows (
Figure 15b–d). The flow depth at point ② is the largest and at point ⑥ the lowest, which holds true for all the examined flow cases, inclusive of
H = 14 and 16 cm (not shown here). The flow acceleration forms a “hump”. With an increasing water head, the hump moves farther downstream on the crest. At
H ≈ 11 cm, the hump is not that obvious anymore. As the improved weir has a streamlined crest without any singularity, the spatial change in crest flow becomes relatively smooth. Downstream of the vertex at point ②, the flow depth is always larger than along the reference weir, which is favorable with respect to flow capacity.
For the reference weir, each corner of its cranked crest is a singularity, also affecting the crest flow velocity (
Figure 16). In the inlet key, the water tends to move in the downstream direction, which leads to low velocity normal to the sidewall downstream of point ② and upstream of point ⑥. This flow pattern deteriorates with an increase in flow discharge (due to the inertia effect). The near-crest flow distribution becomes highly uneven between points ② and ⑥. Negatively affecting the weir overflow, this is perhaps the most unfavorable aspect of the conventional weir. With its elliptical overhangs, the improved weir modifies this flow pattern. Depending on the water head, its crest velocity is at the same level as the reference weir or higher. The improvement is presumably better explained with CFD simulations, whereby the full velocity profile at a given crest location is mapped.
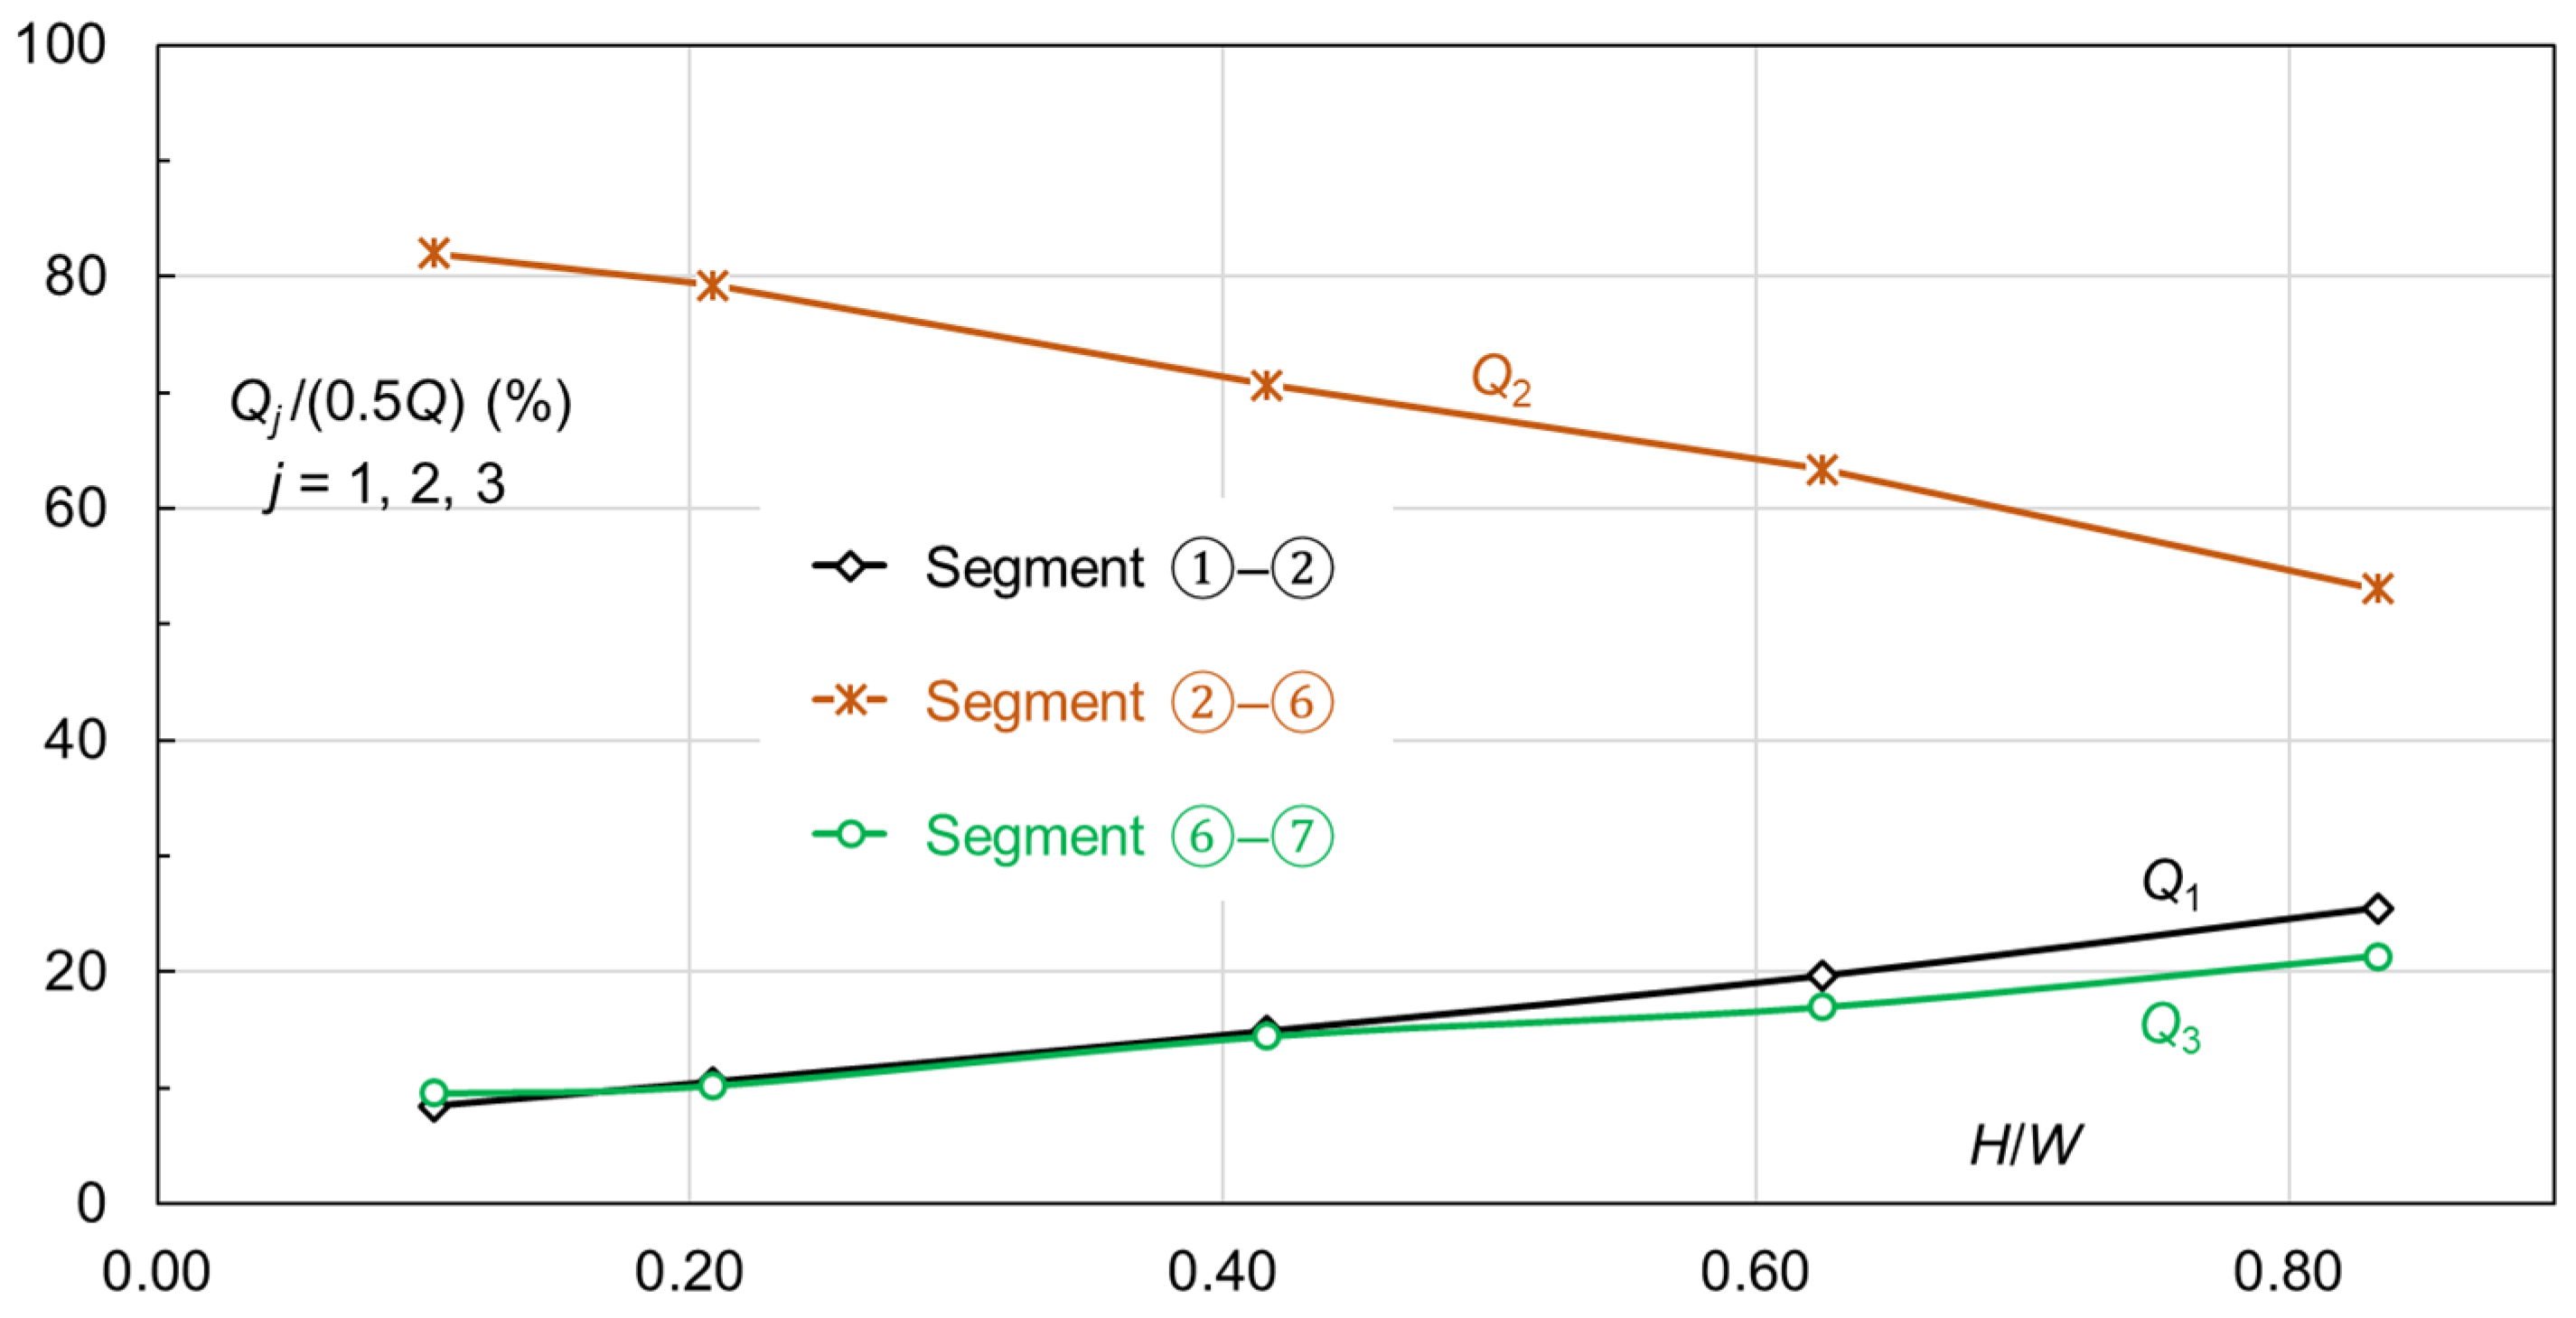
Hu et al. [
43] performed numerical studies of the flow characteristics of a reference weir and examined its spatial flow distribution along the crest. The flow rate over half of the developed crest length (between ① and ⑦) is 0.5
Q. Let
Qj (
j = 1, 2, 3) denote the flow rates along crest segments ①–②, ②–⑥, and ⑥–⑦, respectively. Thus,
Q1 +
Q2 +
Q3 = 0.5
Q.
Figure 17 summarises their results. From low to high within the
H/
W range examined,
Q1 and
Q3 go up by 17% and 12%, while
Q2 goes down by 29%. The gradual increment over segments ①–② and ⑥–⑦ is owing to the stepped-up flow depth and velocity. The decline over segment ②–⑥ is attributable to the augmented inertia effect in the inlet key (in the flow direction) that leads to a considerable drop in water depth and aggravated normal flow profile along the sidewall. The submergence effect also plays a role if the flow exceeds a certain limit.
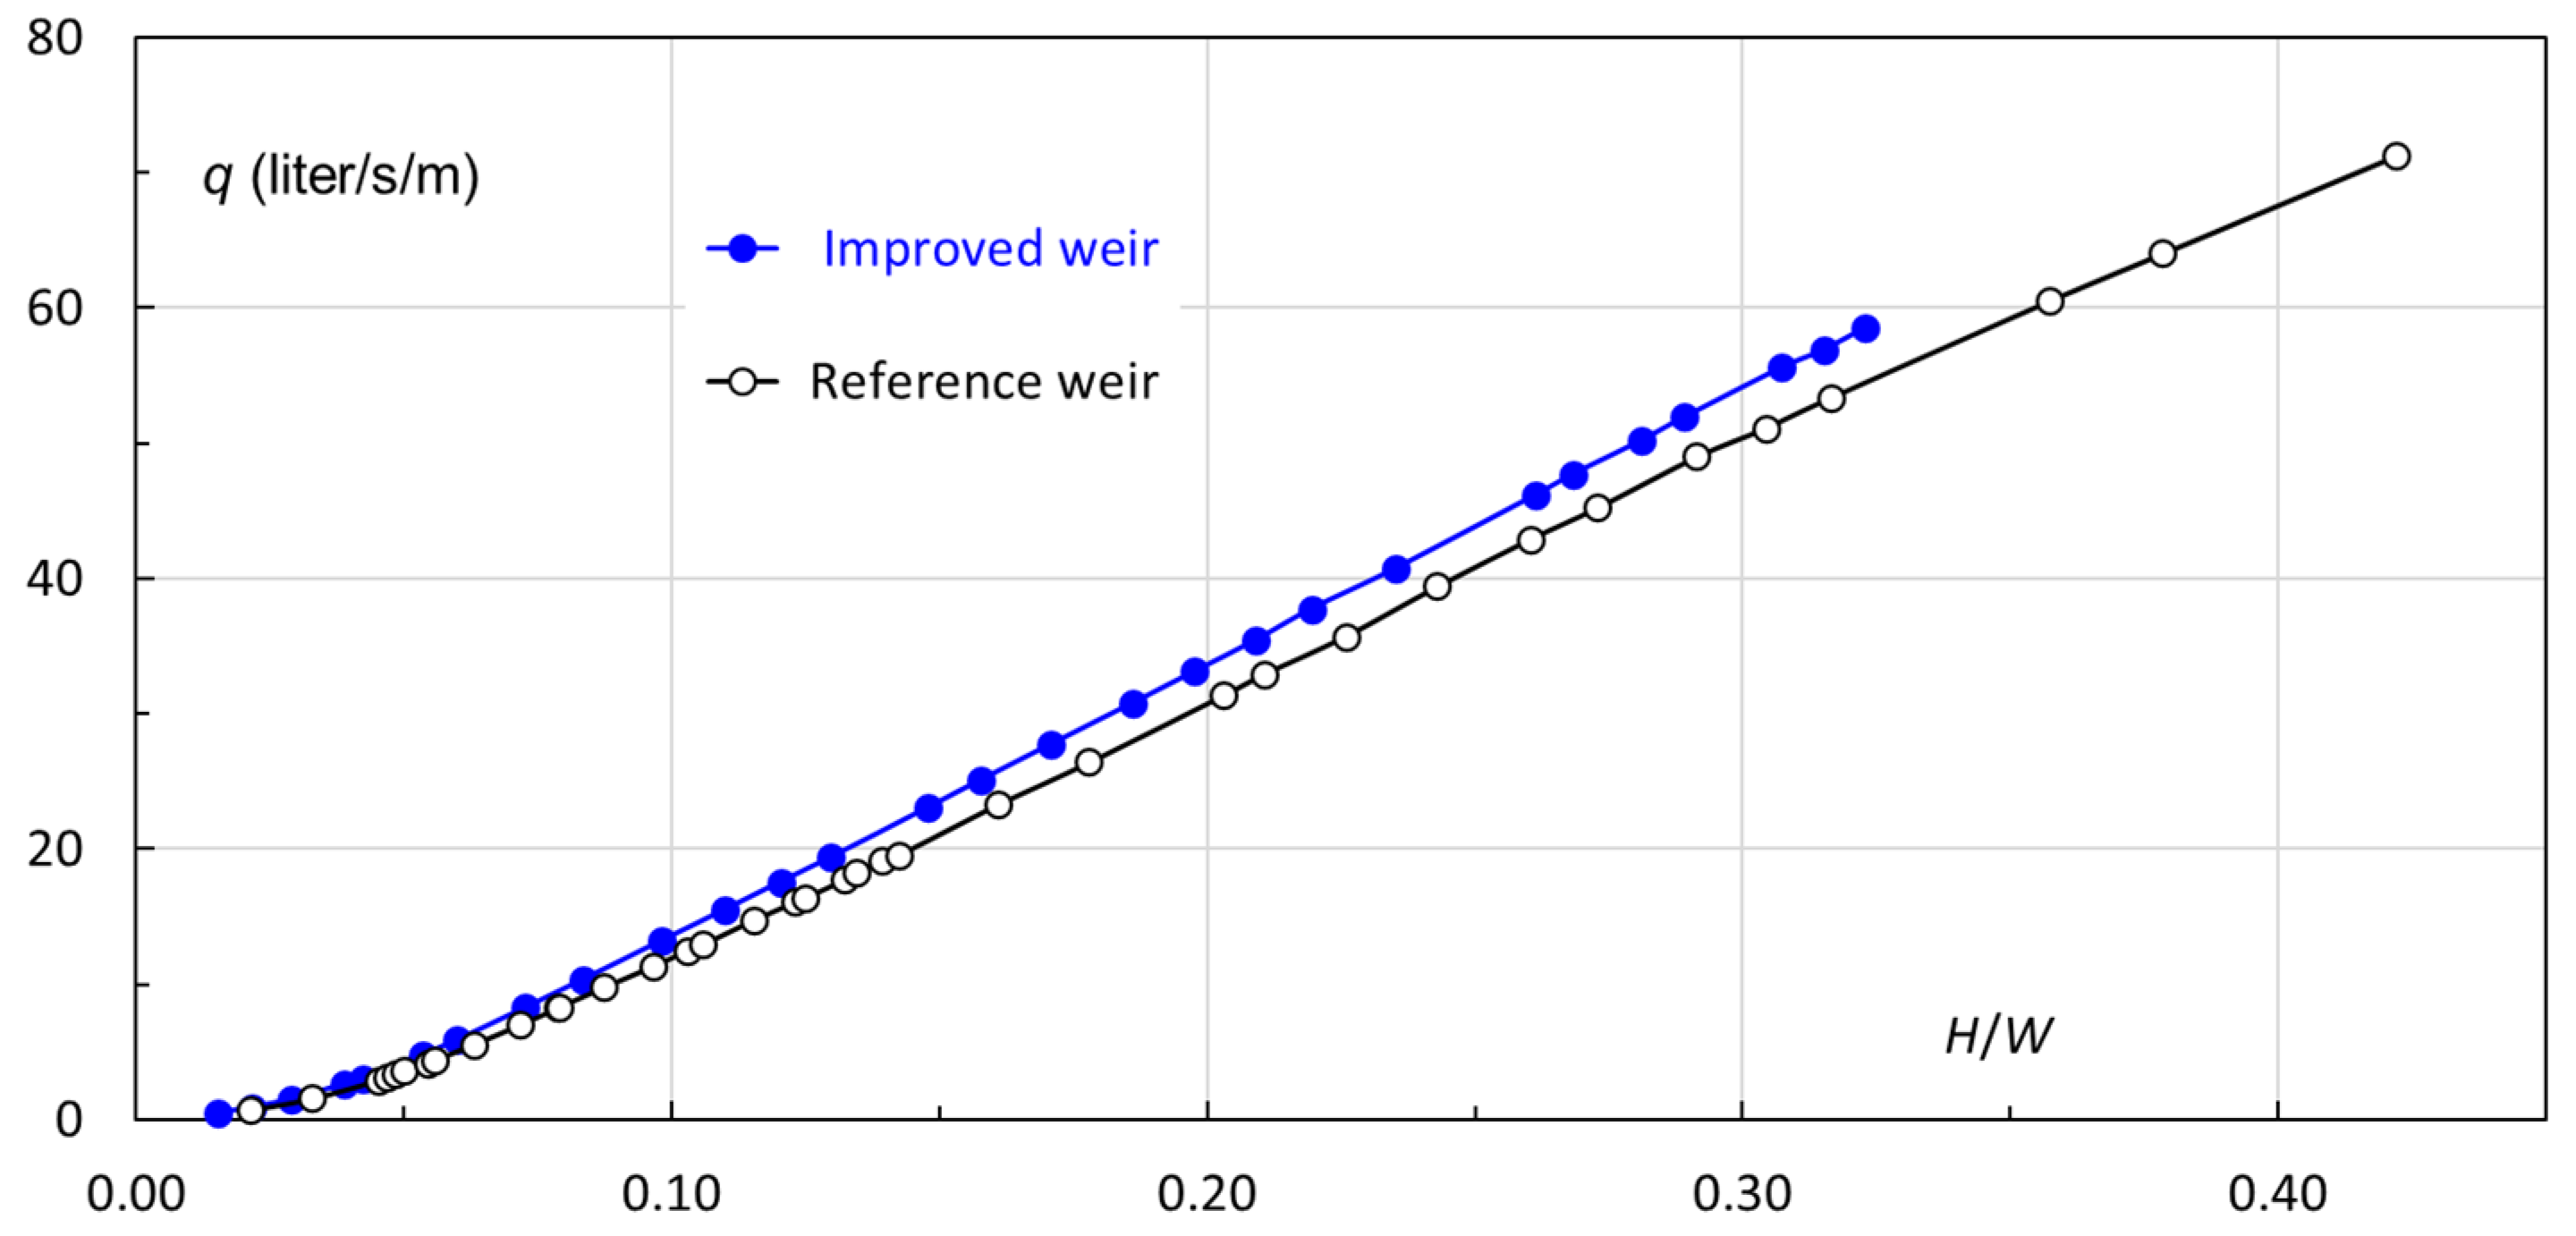
The flow rate per developed crest length is defined as
q =
Q/
L, referring to the averaged quantity without distinguishing among locations on the crest.
Figure 18 compares, as a function of
H/
W, the difference in
q between the two weirs. This implies that, at the same reservoir water stage, the unit crest length of the improved weir discharges more effectively than that of the reference one.
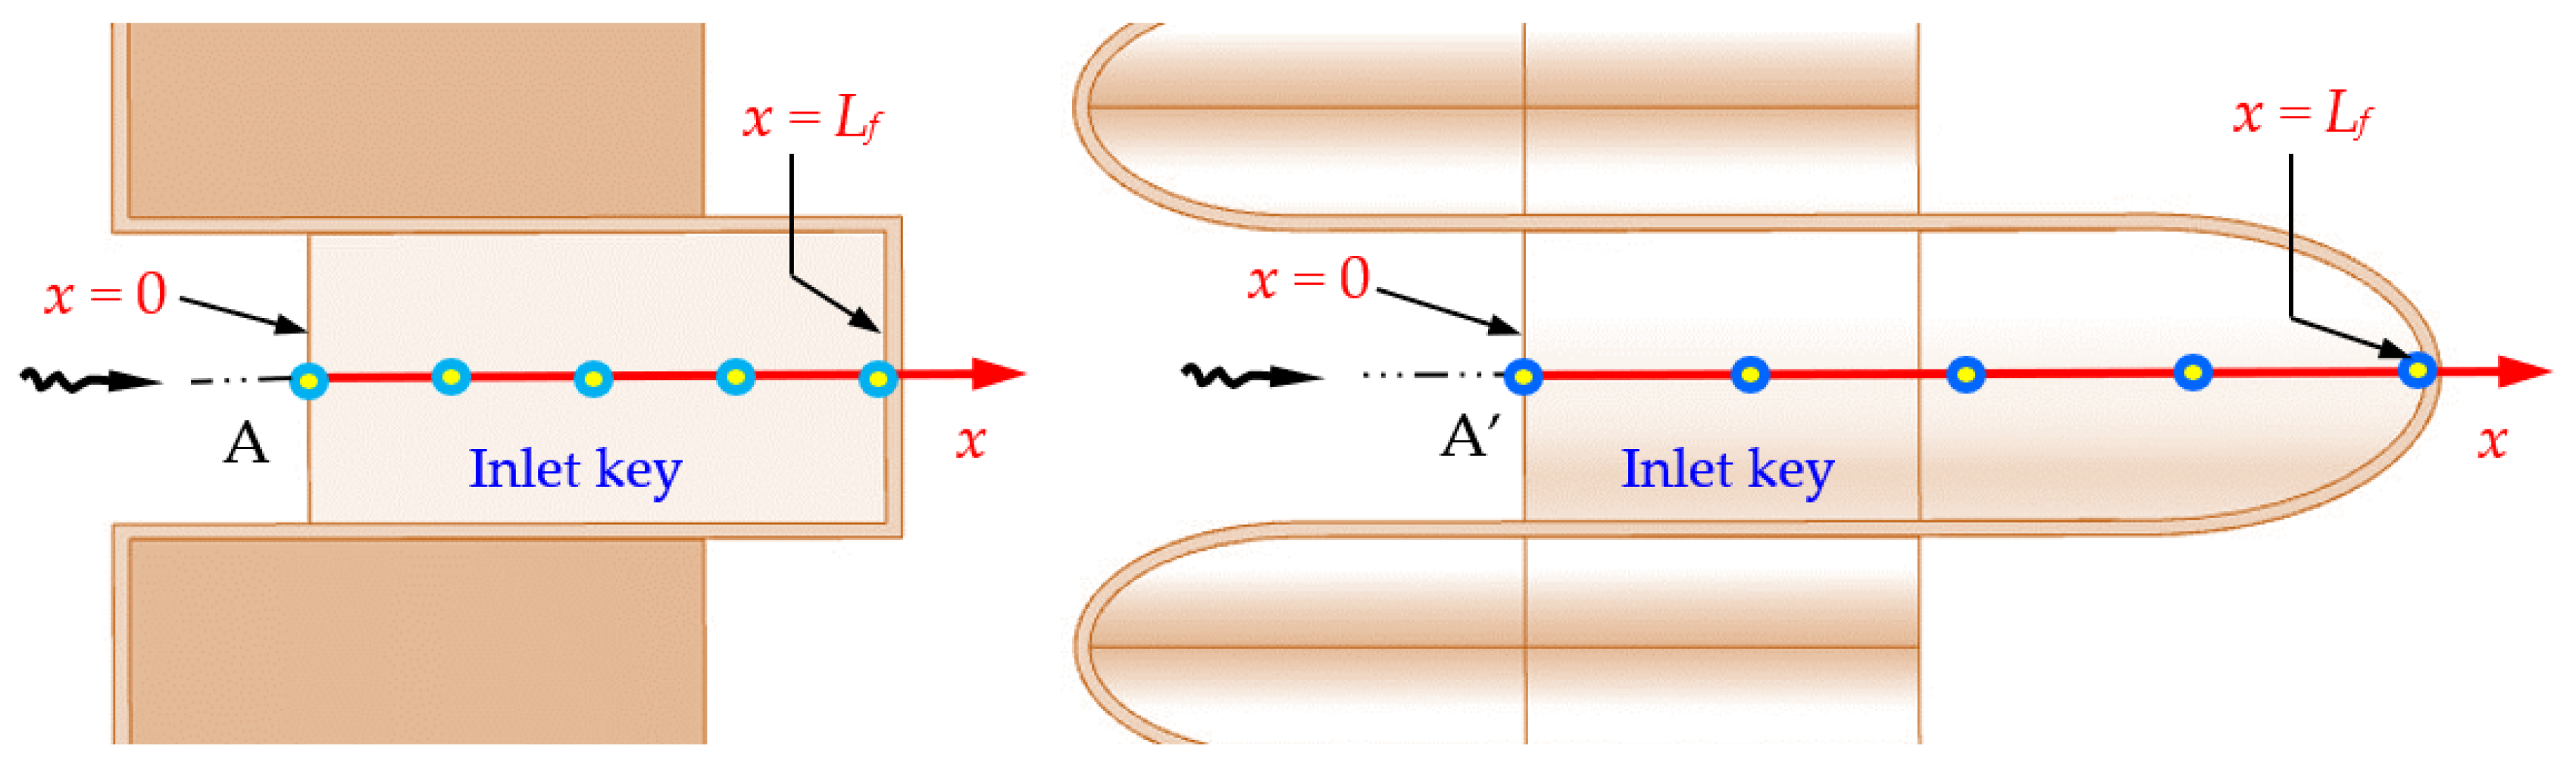
4.3. Inlet Key Floor Velocity
At the same reservoir water level, the improved weir provides enhanced flow capacity, giving rise to more inflow and a higher velocity in the inlet key. With the downward semi-circle as the floor, the passage area (volume) of the inlet key becomes larger, leading to a slowdown of the flow. Thus, one question arises, i.e., how the geometrical modification affects the inlet key flow velocity. The increase in flow rate and the enlargement of the inlet key are two factors that act in opposite directions. An essential proxy of inflow conditions is the near-floor velocity (
Vf) of the inlet key.
Figure 19 illustrates the measurement points along the inlet key’s center plane for each weir.
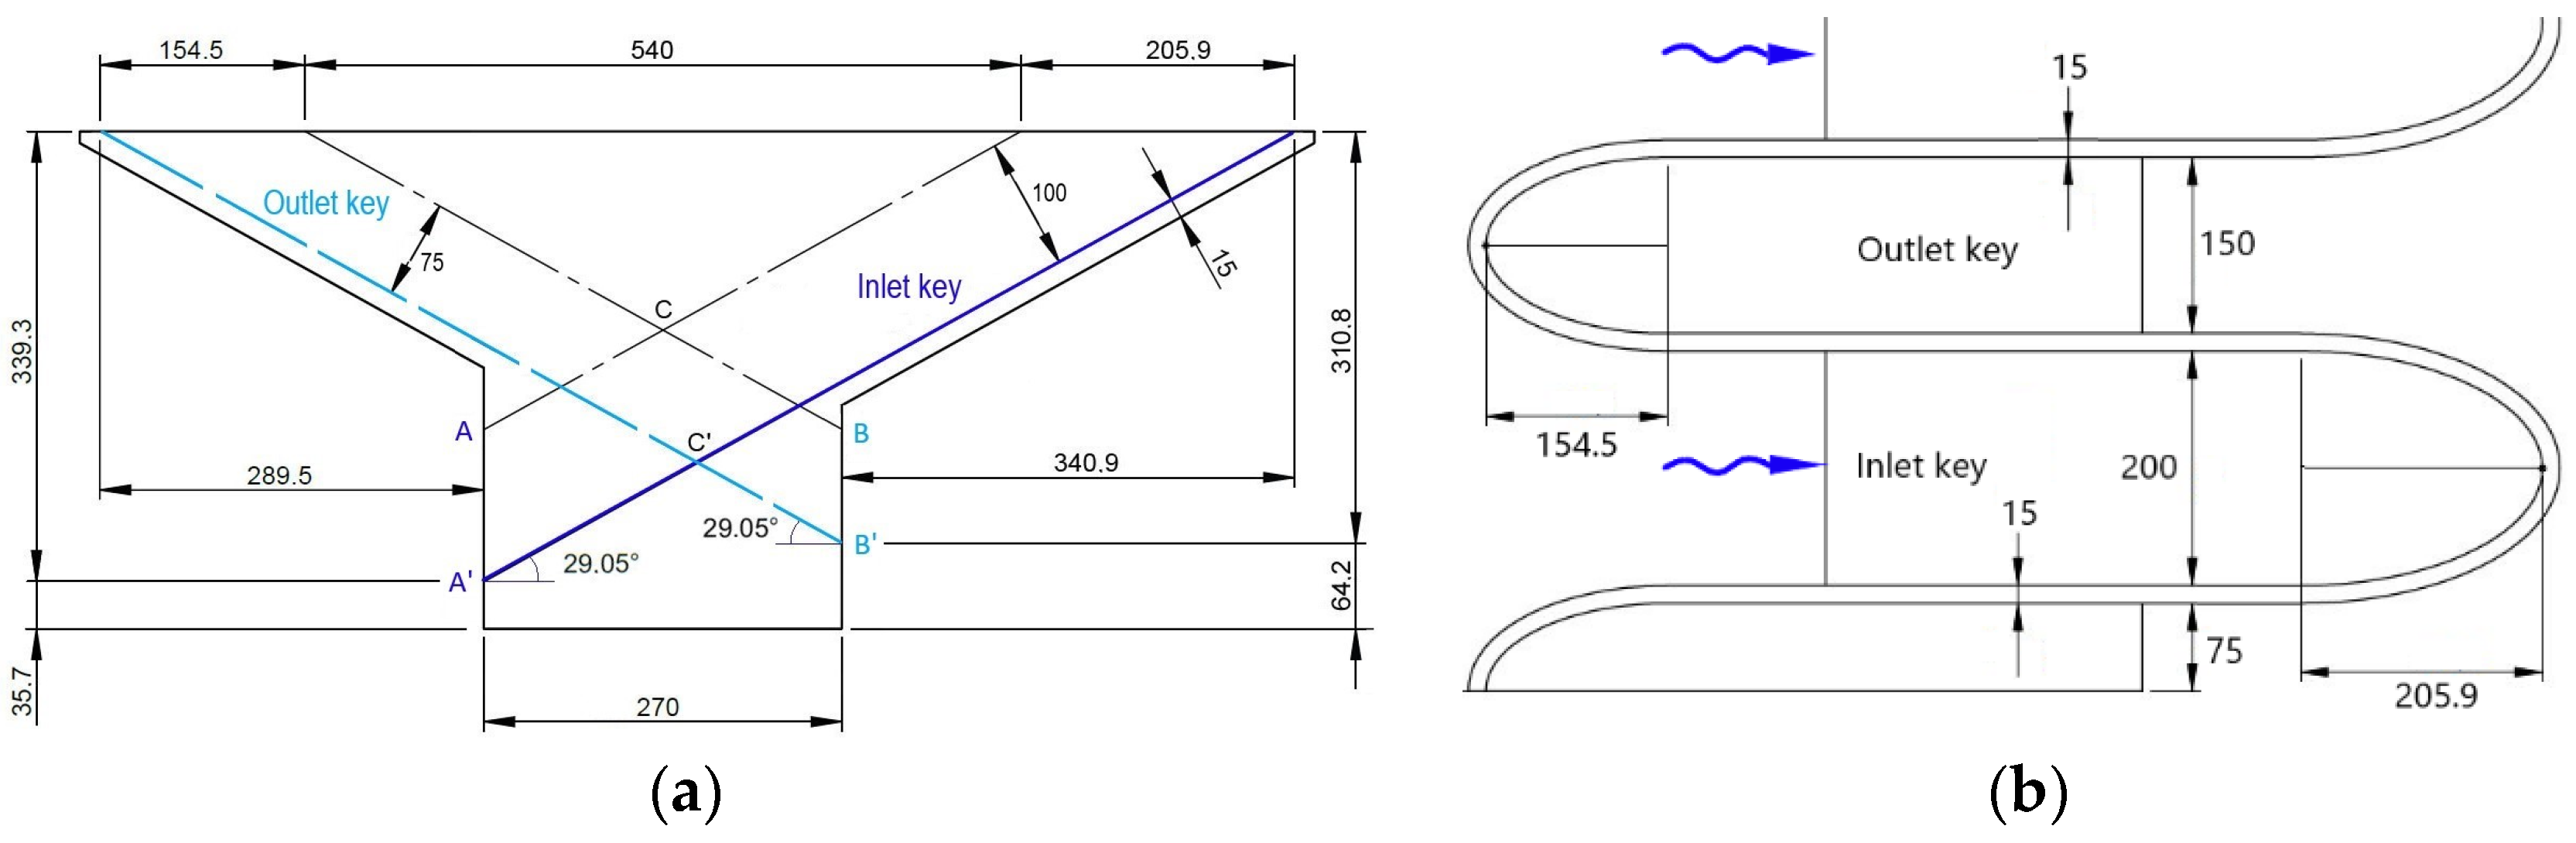
For the reference weir, its inlet key height is
Pi = 1.5
Pm = 22.5 cm, and its sloping floor length is
Lf = 1.5
Pm/sin
α = 46.33 cm. For the improved one, its inlet key height is
Pi = 1.5
Pm +
AA’ = 1.5
Pm + 0.5
Wi/cos
α = 33.9 cm, and its floor length is
Lf = 1.5
Pm/sin
α + 0.5
Wi/(sin
αcos
α) = 69.88 cm. The
Vf measurements are made at the same upstream water levels.
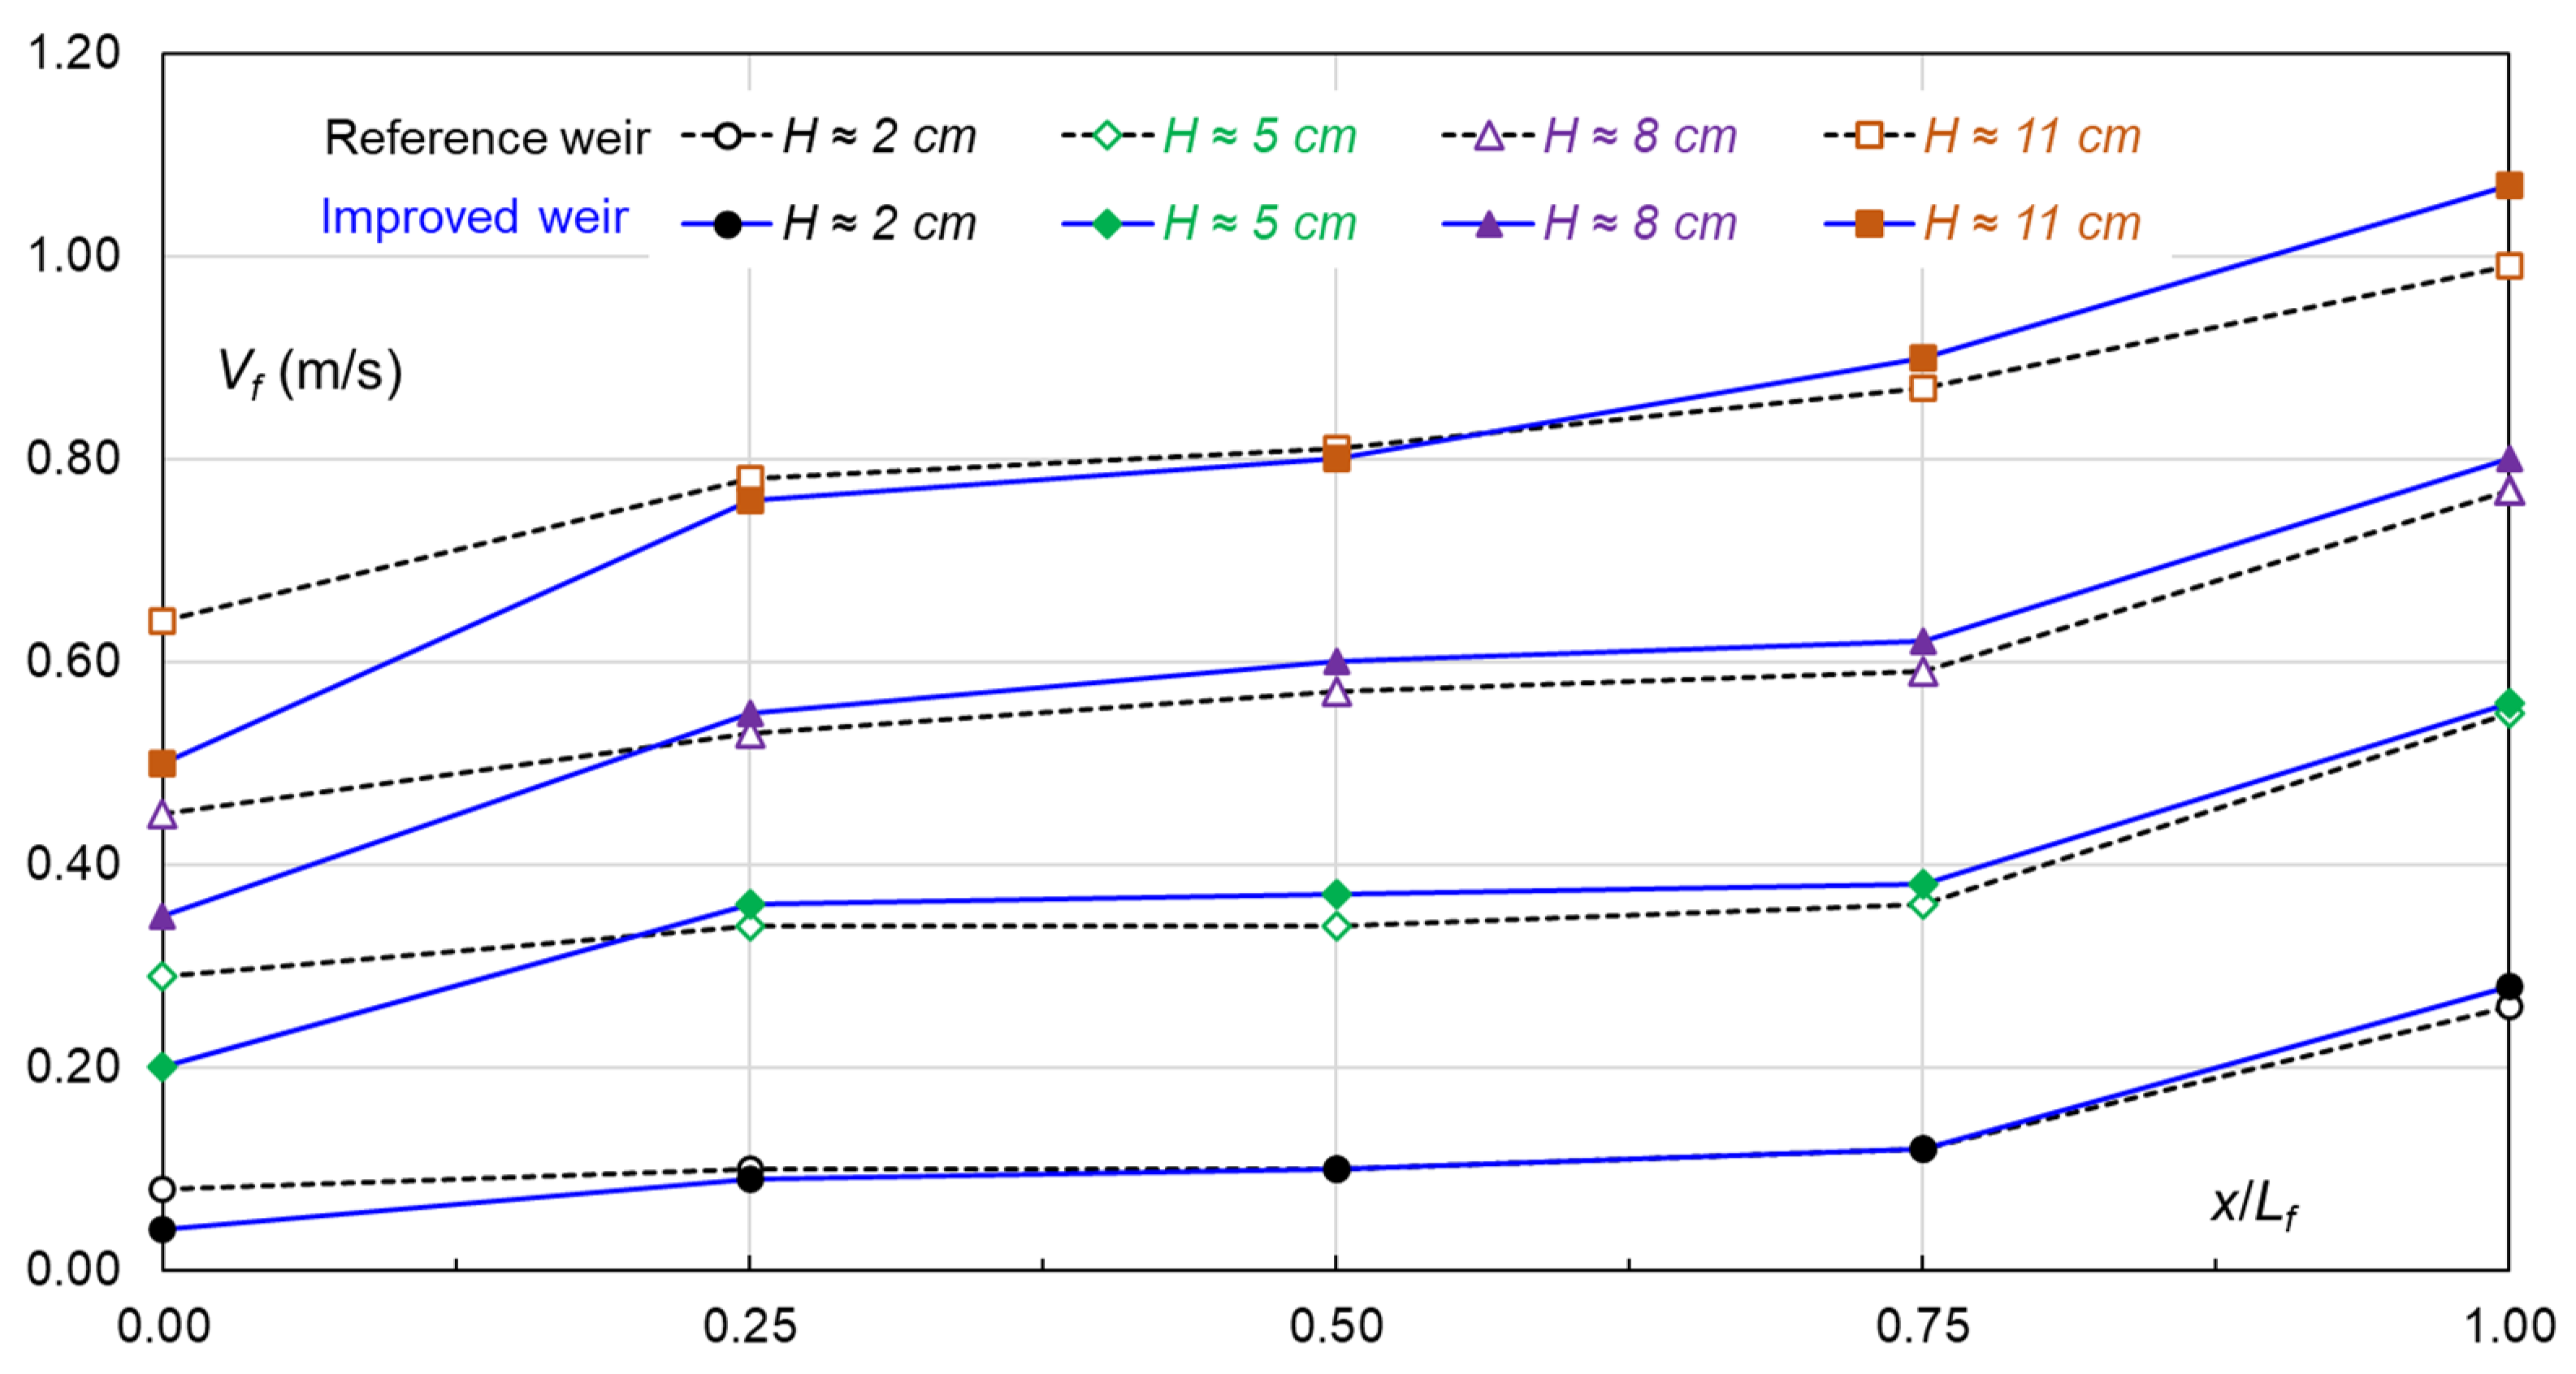
Figure 20 compares
Vf as a function of
x/
Lf.
The results show that Vf of the improved weir becomes, irrespective of upstream water level, lower in the first part of the inlet key, which is expected. In the middle part, it is roughly at the same level as in the reference weir. In the last part towards the crest, Vf is slightly higher. One can say that the two weirs are similar with respect to bottom velocity and the experiments do not demonstrate any significant differences, which mirrors the interplay among the contributing factors. The bottom velocity has practical implications in terms of sediment transport over the weirs.
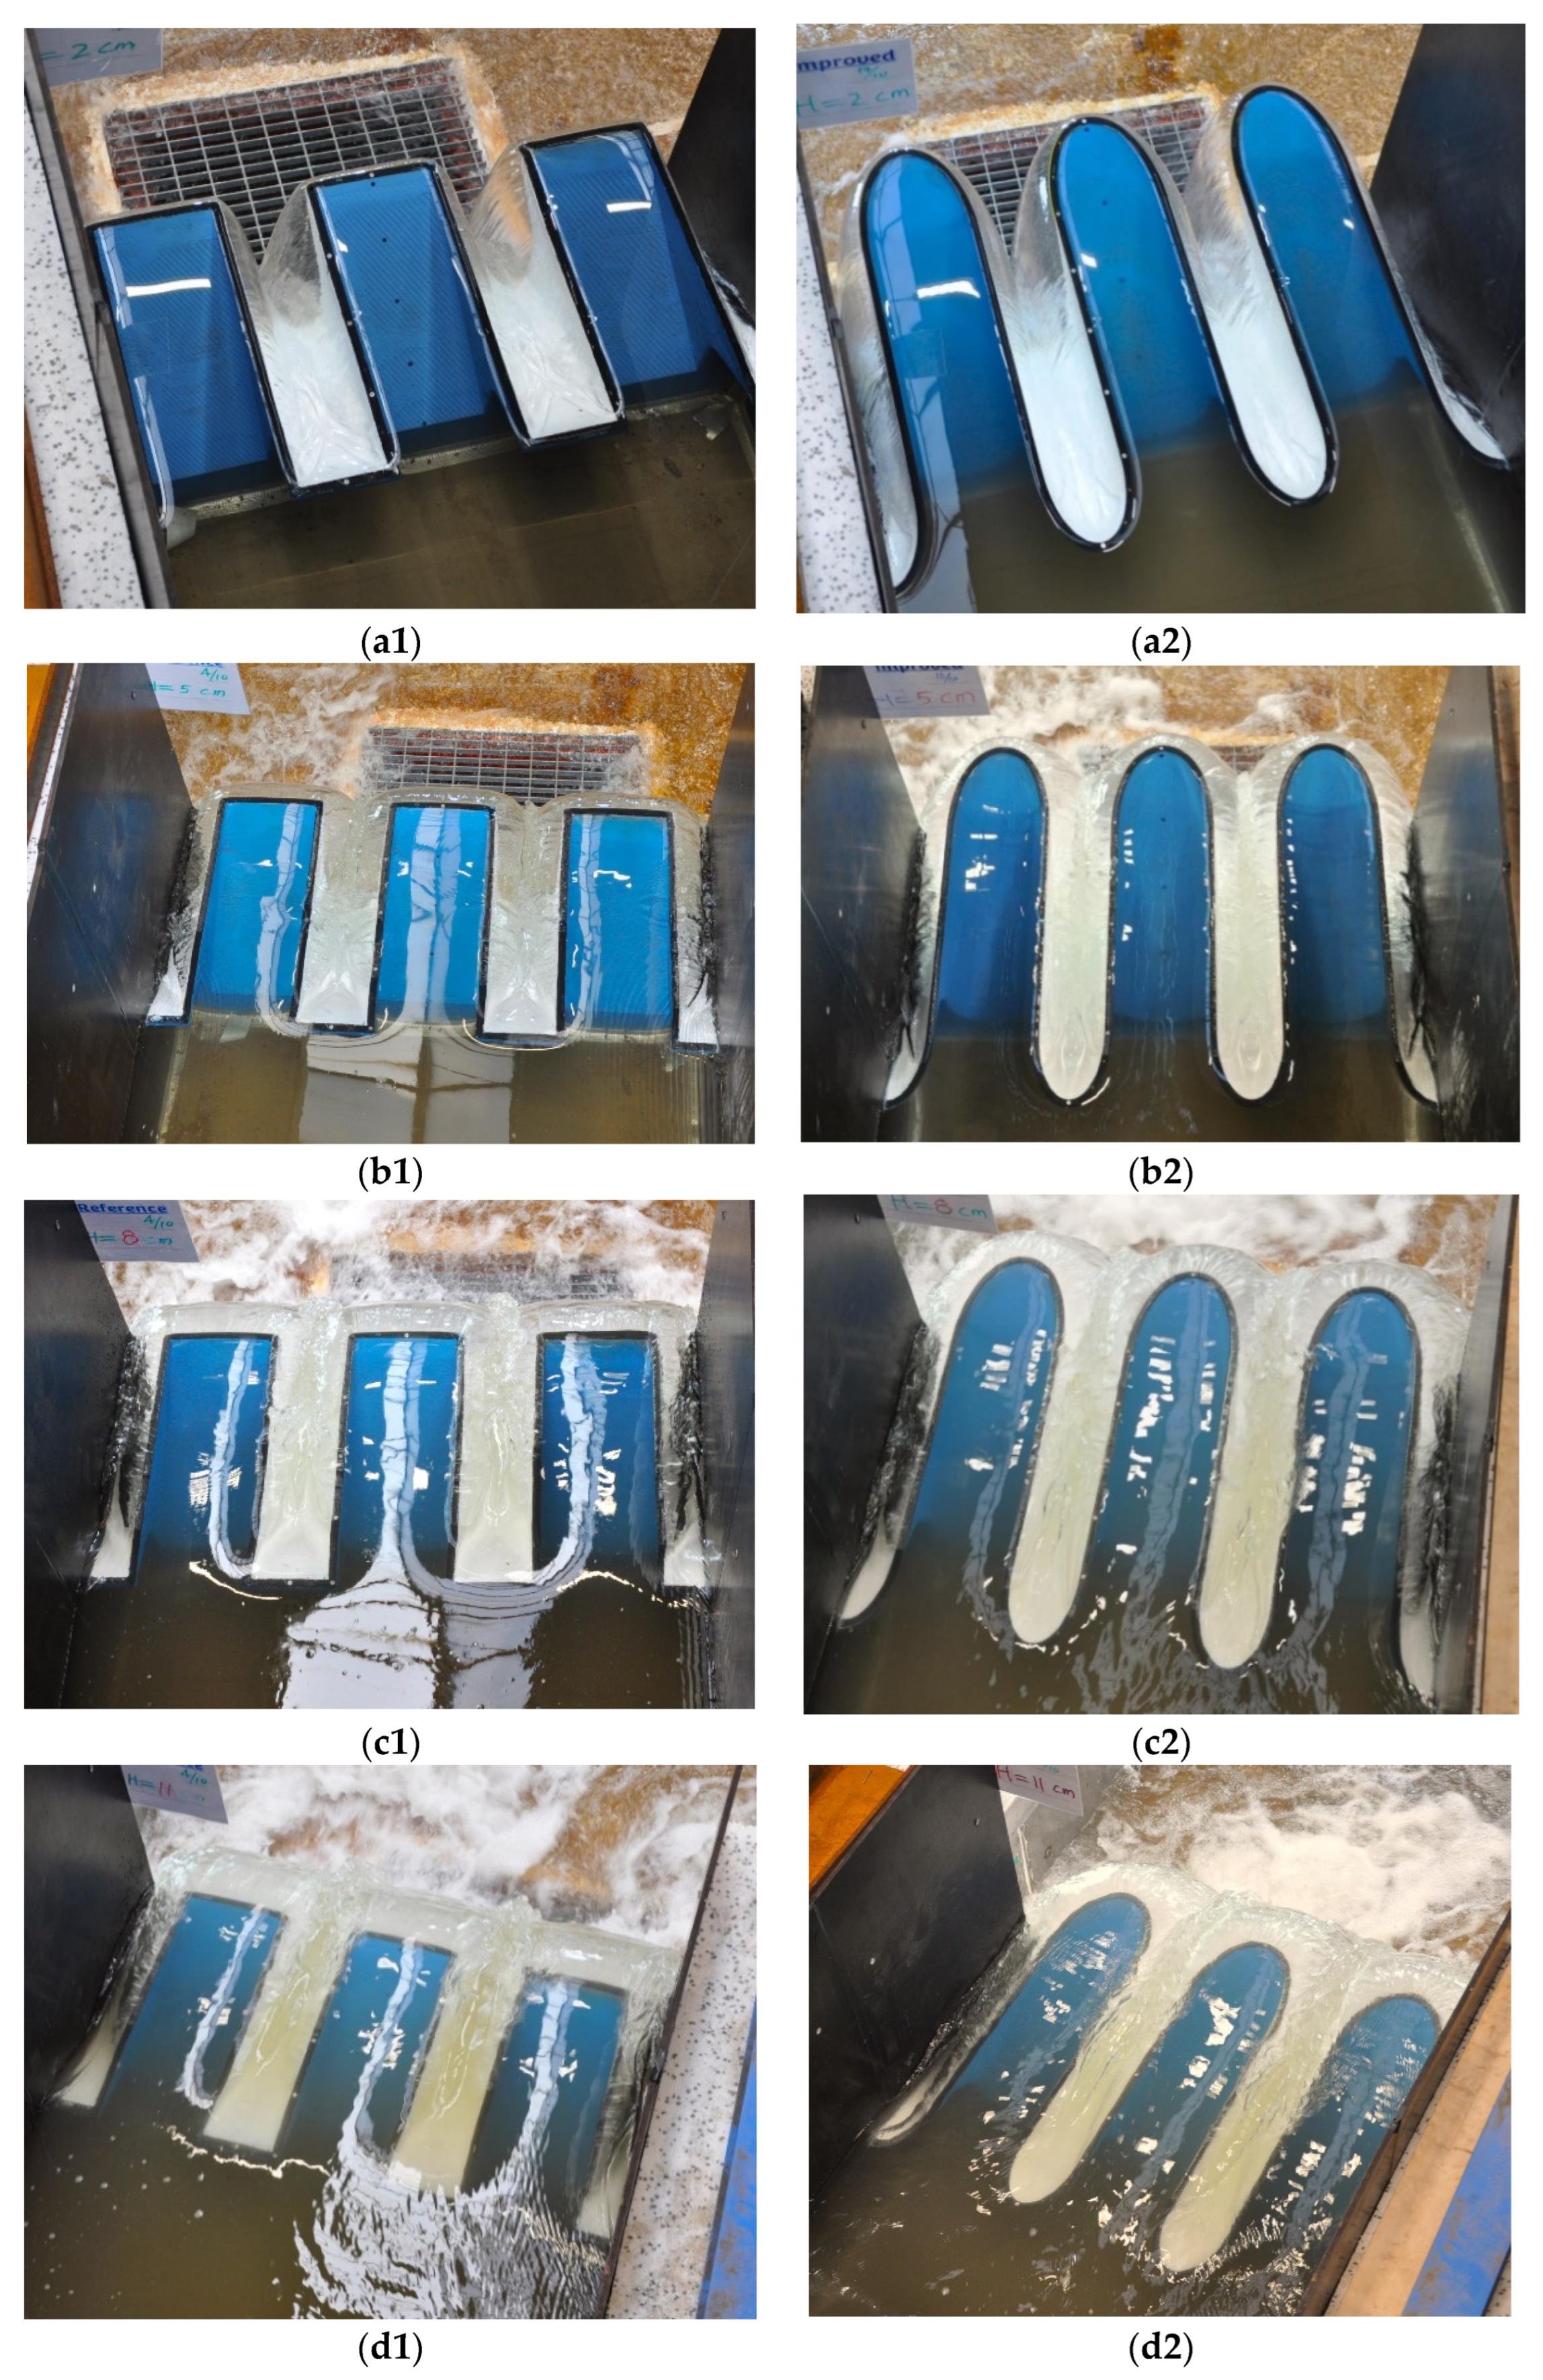
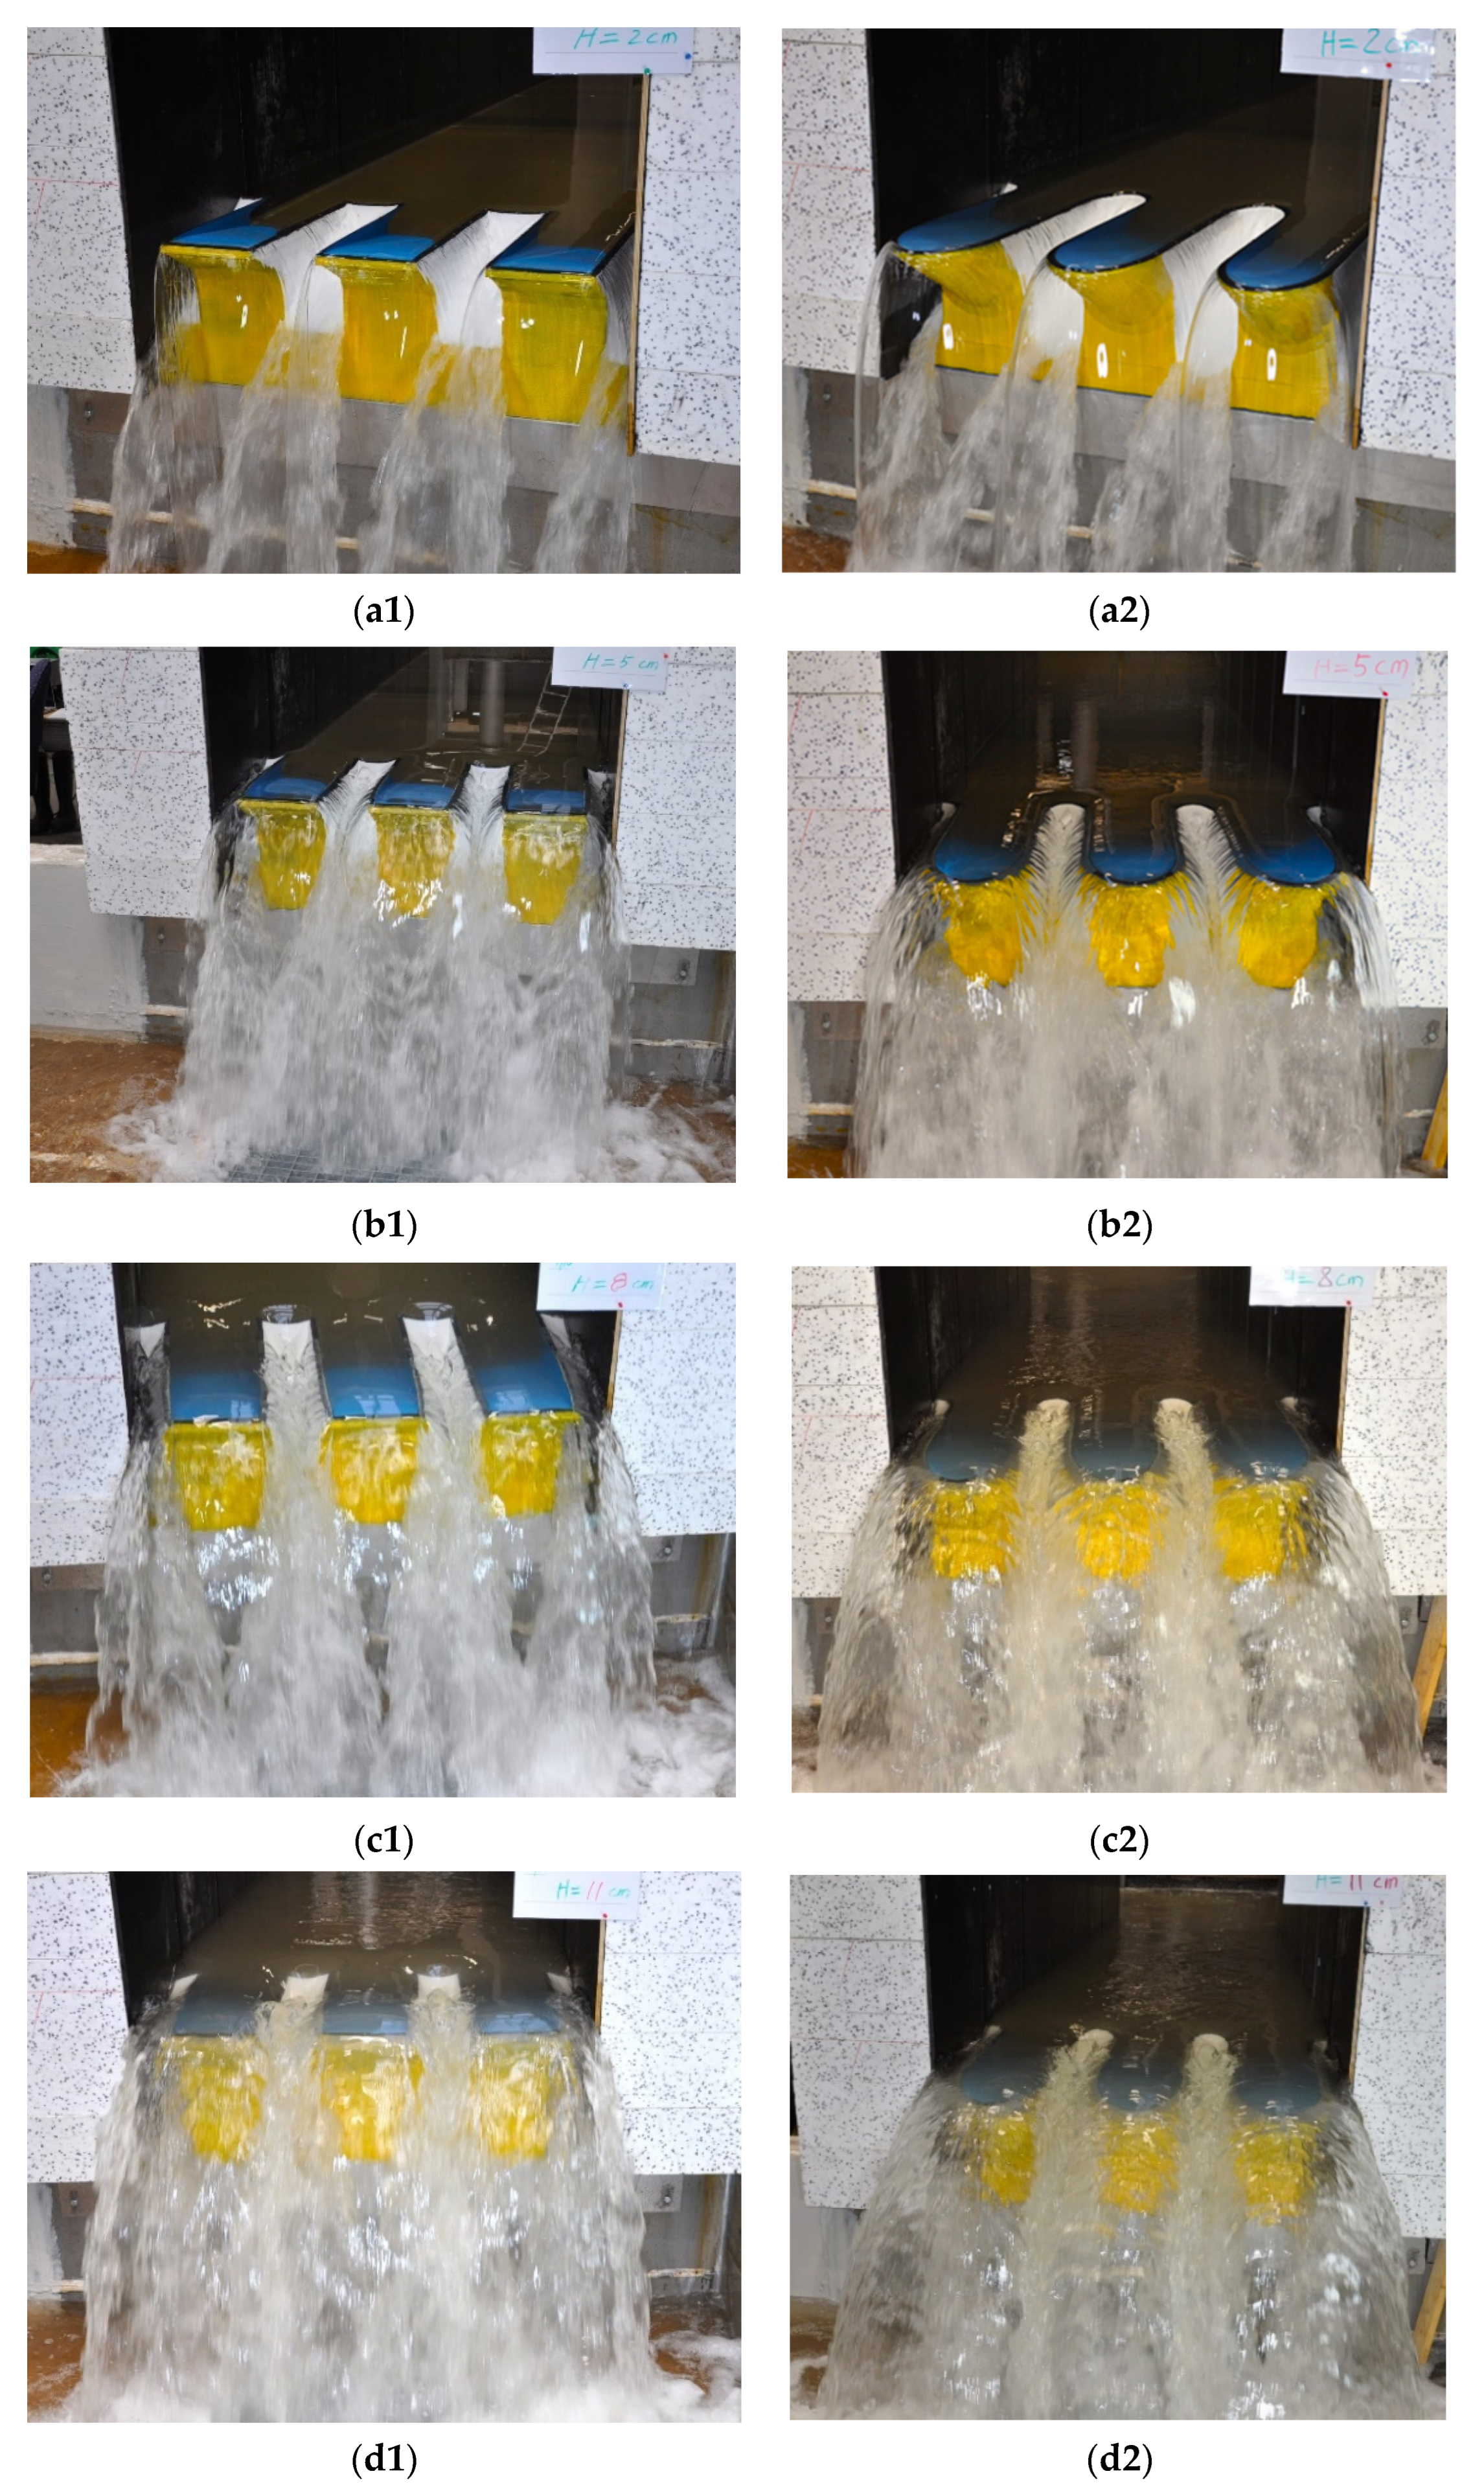
4.4. Overflow and Falling Jet Behaviors
In the tests, the falling jets are aerated with atmospheric pressure on both sides, and there is no jet stability issue involved. With respect to energy dissipation, outflows in the outlet keys and jet behavior have practical implications.
Figure 21 and
Figure 22 compare the overflow and falling jet patterns from low to high flows. The left columns refer to the reference weir and the right ones refer to the improved one. The comparisons are made at the same water levels.
The tests for each weir are performed from low to high flows and then repeated vice versa. The observations show that the two weirs behave in a similar manner regarding the flow behavior in the outlet key. For the reference and improved weirs, the submergence effect starts to take effect from
H = 8.0–8.2 cm and 7.8–8.0 cm, respectively, which merits attention considering the substantial increase in the flow rate of the latter. A rooster comb is also built up locally in the upper part. Exceeding this limit, the overflows from the sidewalls form a “ridge” along the middle of the surface water in the key, which propagates downstream and even beyond the falling jets (e.g., at
H ≈ 11 cm in
Figure 21).
Compared with the reference key, the improved layout extends by an additional distance
So into the reservoir, thus providing more favorable approach conditions. In a similar way, it stretches out by an extra distance
Si downstream. The experiments demonstrate that the falling jets impact the laboratory floor farther downstream. It is also observed that, in combination with the higher crest flow velocity, the elliptical crest form also spreads the jets more sidewards, which is evident in
Figure 22. In other words, at the same water head, the jets fan out more sidewise towards the impact location.
4.5. Discussions—Contributing Factors to Improvement
Along with the experimental results, the reasons for the enhanced flow behaviors of the improved weir are sought in the following aspects.
(a) The improved weir stretches out additionally both up- and downstream and significantly prolongs the developed crest length. The elliptical upstream overhang inclusive of the crest (that part of the outlet key protruding into the reservoir) eliminates the corner singularities of the reference weir, and the along-crest flow depth and velocity become more favorable. As a result, both the crest discharge coefficient (C) and the unit crest discharge (q) are higher at the same head (H).
(b) The upstream overhang is also elliptically shaped along the vertical direction. Compared to the reference weir, it mitigates the side-contraction effects and improves the inflow into the inlet keys. Seldom do we see any existing PK weirs with a streamlined overhang upstream. In this regard, the improved weir provides an appreciable enhancement. The vertical nose beneath the overhang usually covers a short vertical distance. Even rounded (often with a half circle or an ogive), its contribution is not as significant as the streamlined overhang, because the overhang height dominates the approach flow depth in front of the inlet key.
(c) With a lower floor in the inlet key, the improved weir augments the inflow passage area (volume) and facilitates the approaching flow to the crest. Compared to the reference weir, the increase in the cross-sectional area (normal to the floor) is half of the floor circle (radius
Ri), equaling
. The experimental study of a large conventional weir by Machiels, et al. [
42] shows that a control section appears in the inlet key if the upstream head becomes significant. This control section decreases the effective crest length and is unfavorable for the discharge capacity. Therefore, there is an interest in increasing the inlet cross-section to limit high velocities and mitigating this control section. Along with the streamlined upstream overhang, the larger inlet key area of the improved weir effectively counteracts this weakness.
(d) The lower floor of the outlet key enlarges the outflow cross-sectional area (volume) and alleviates the submergence effect in it. Its contribution takes effect first at high flows. This floor lowering can be paralleled with the effect of a parapet wall on the crest [
25,
32]. In comparison with the reference weir, the cross-sectional area (normal to the floor) expands by
. For both weirs, the submergence effect appears first at around
H = 8.0 cm.
(e) The downstream overhang extends more downstream, pushing the jet farther away from the weir. Together with the elliptical shape, it facilitates the spreading out of the falling jet on its way to the receiving tailwater, which is favorable with respect to energy dissipation.
All these factors are attributed to the enhanced performance of the improved PK weir.
4.6. Alternative Layouts
In the improved weir, the sloping floor of either key is shaped with a semi-circle in the cross-section, thus leading to an elliptical crest apex. If one wishes, modifying only the down- or upstream overhang with an elliptical weir is still a partial achievement.
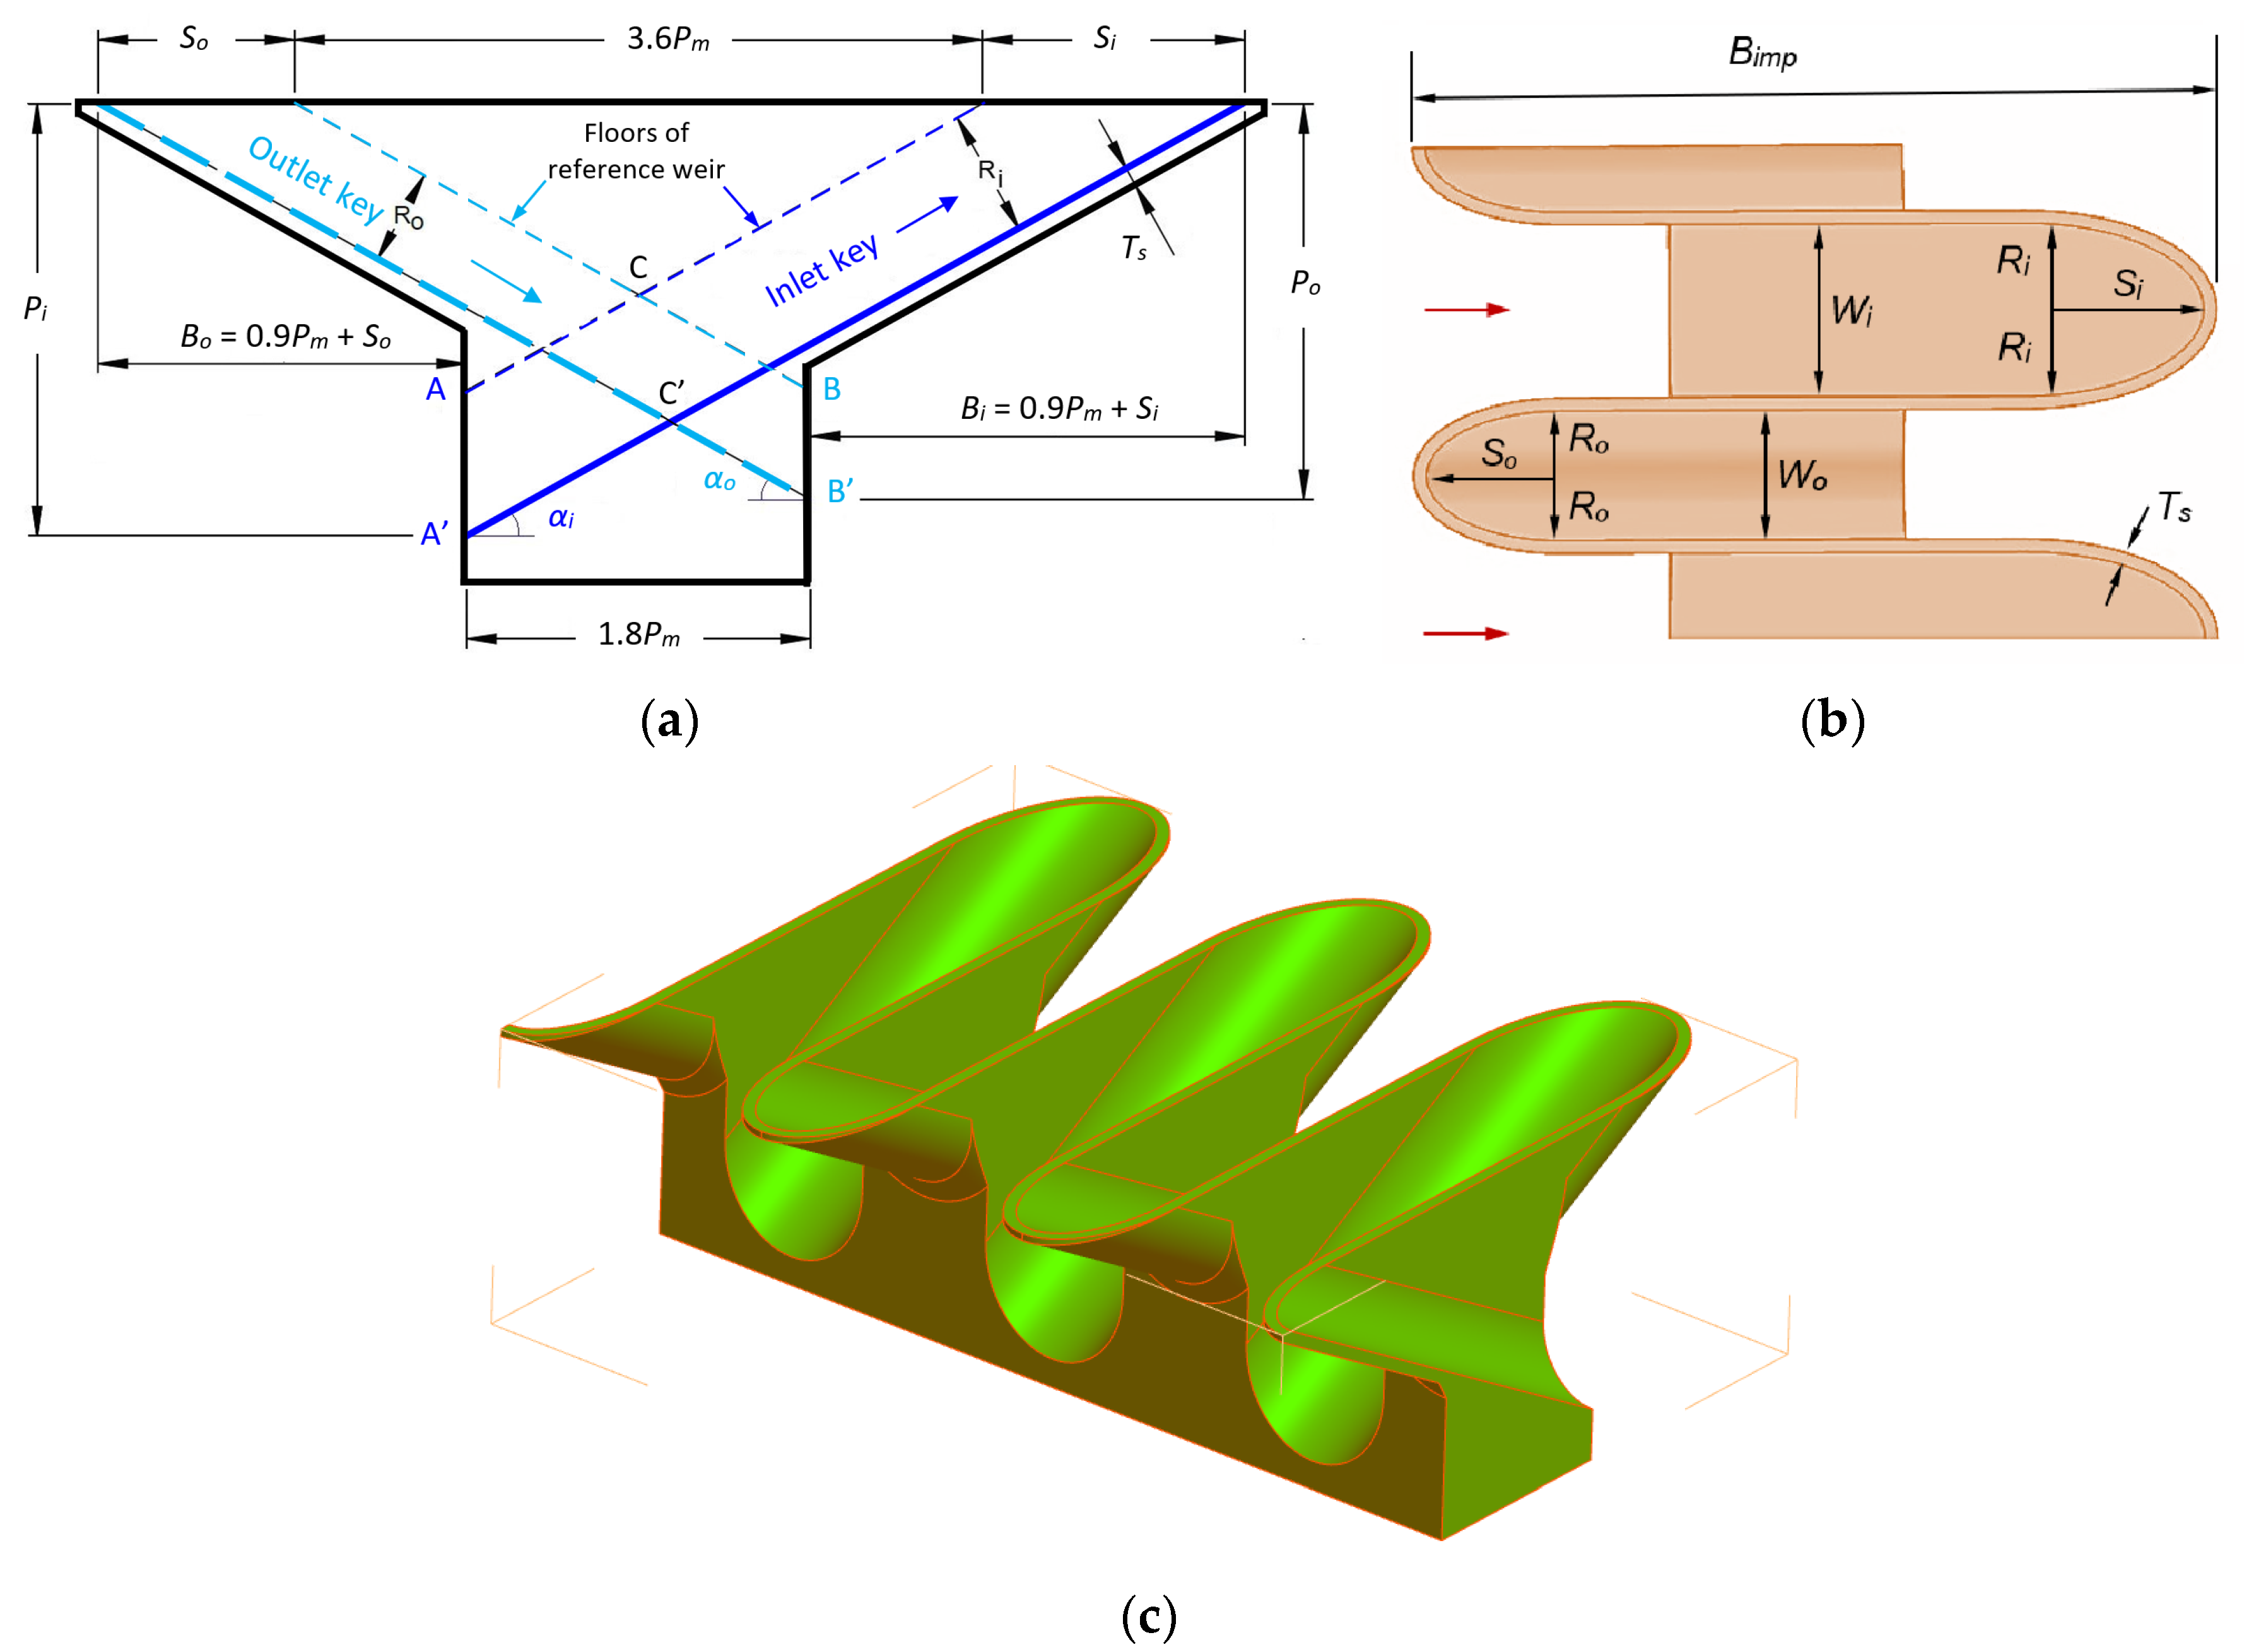
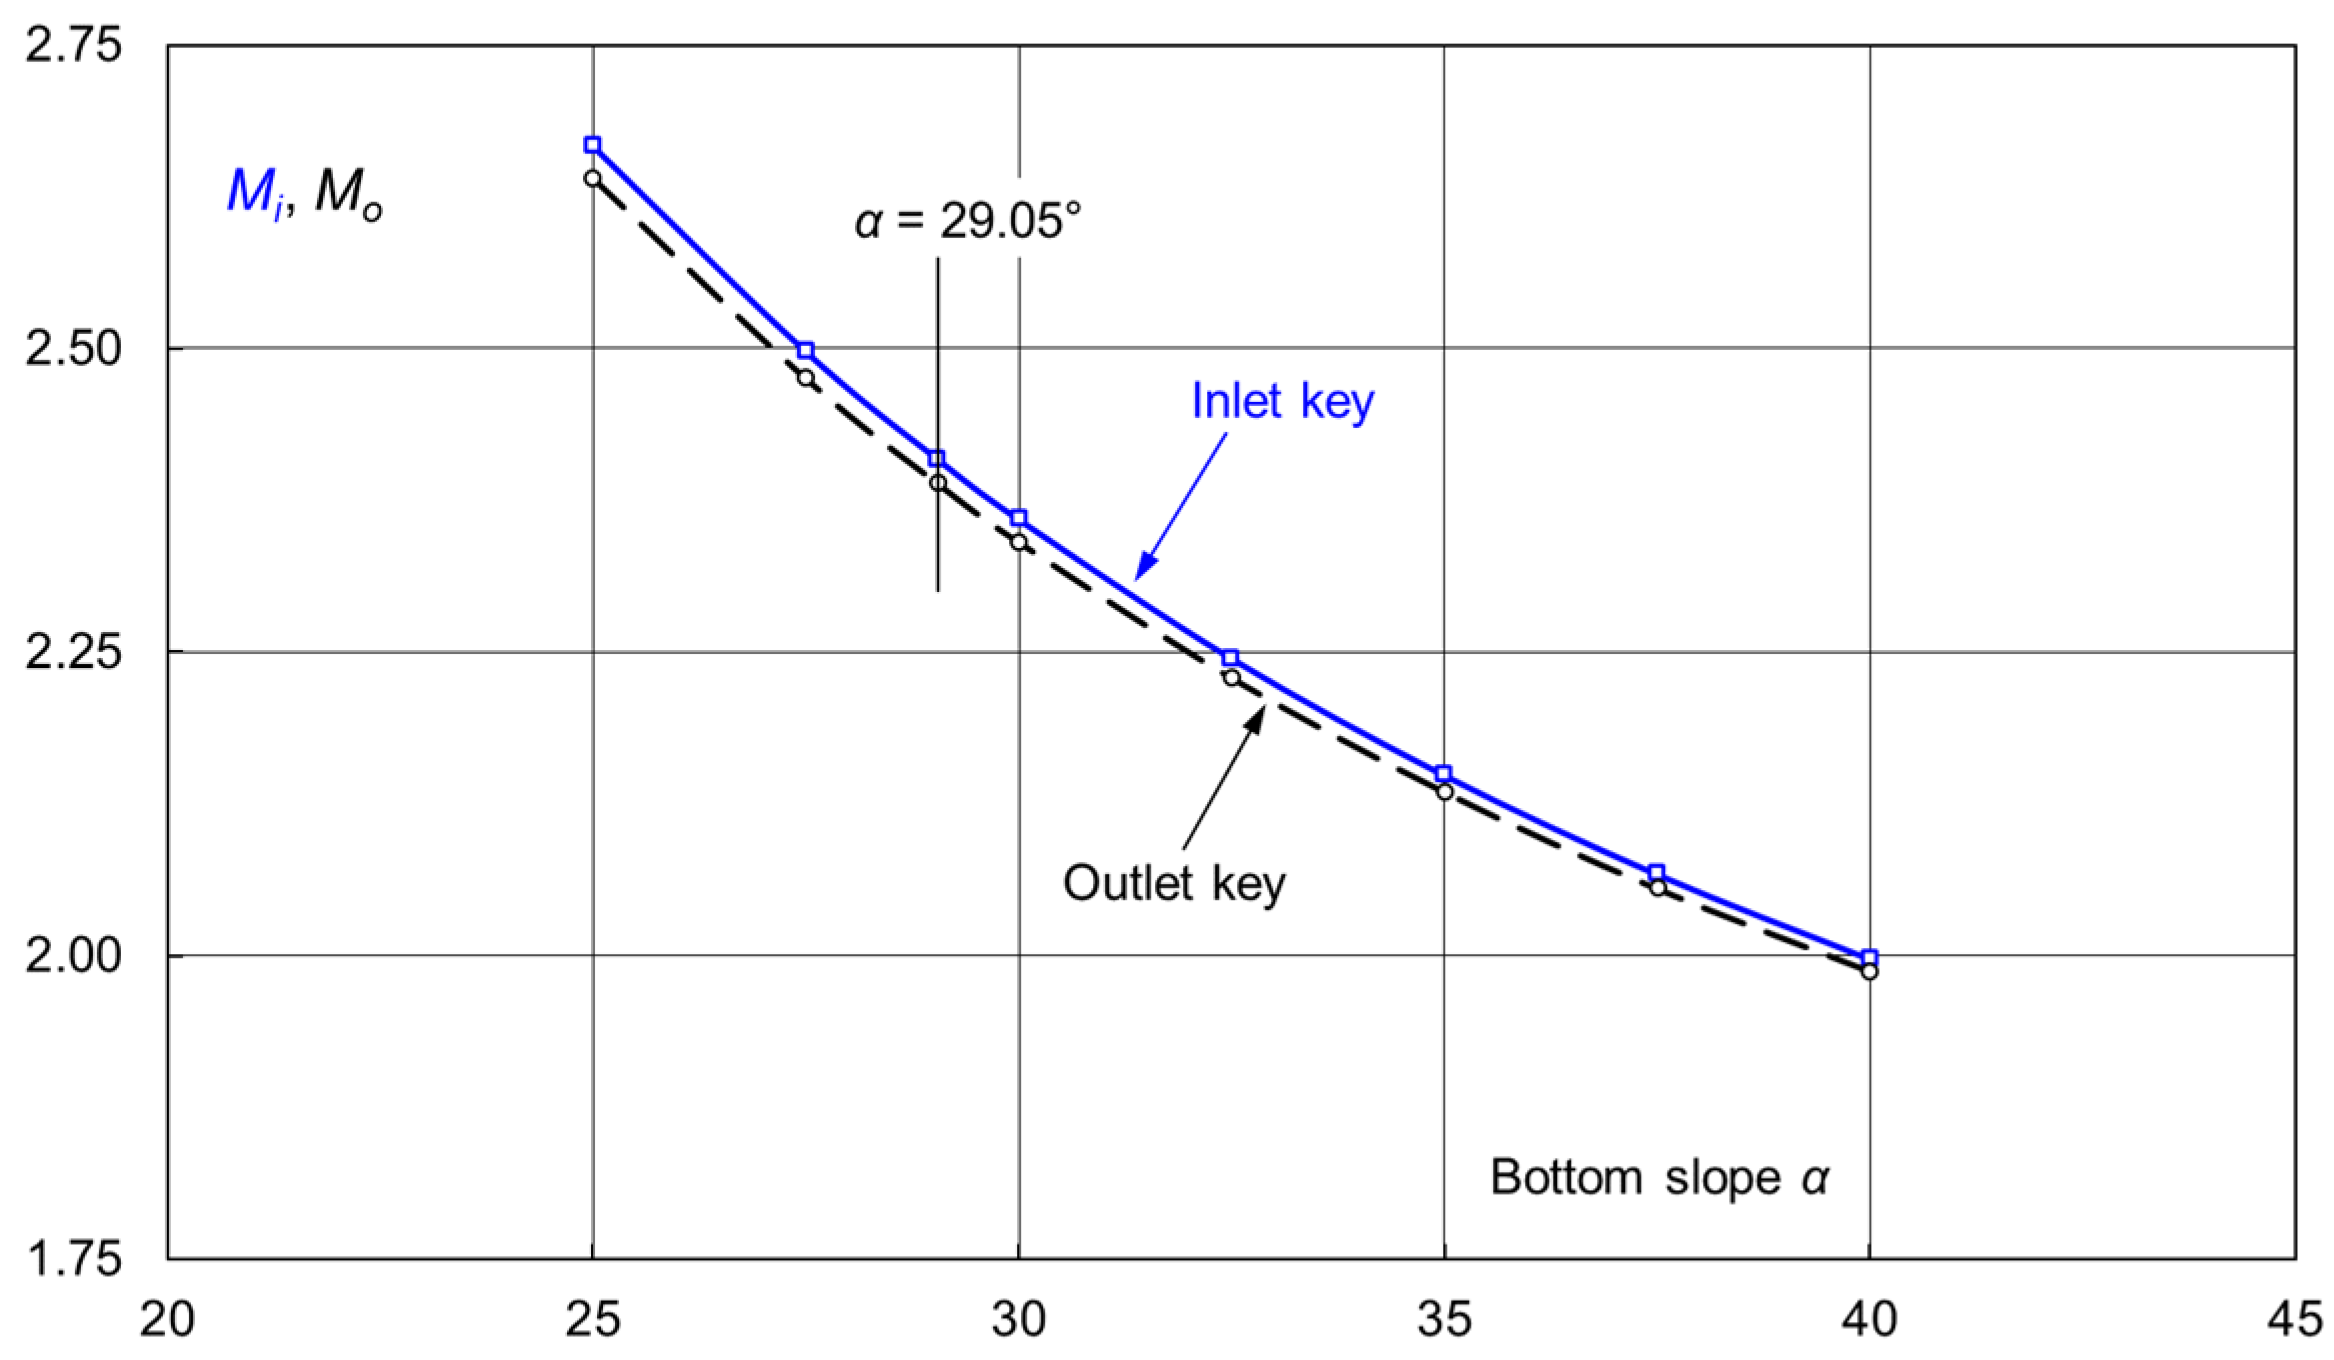
Another way to form the apex crest is to use a semi-circle with a
Ri = 0.5
Wi radius for the inlet key and a
Ro = 0.5
Wo radius for the outlet key. The A and B positions in both keys (
Figure 2) remain unchanged. Thus, the floor of either key is assigned a smooth transitional surface from a semi-circle at the crest to a linear edge at the A and B positions. With this layout,
M =
Mi =
Mo = 0.5π. The corresponding edge-to-edge crest length (
Bimp), the developed crest length (
Limp), and the incremental crest length (Δ
L) are as follows.
Compared to the reference weir of the same size, this weir is characterized by a
β = Δ
L/
Lref = 14.9% longer crest. The results are summarized in
Table 7.
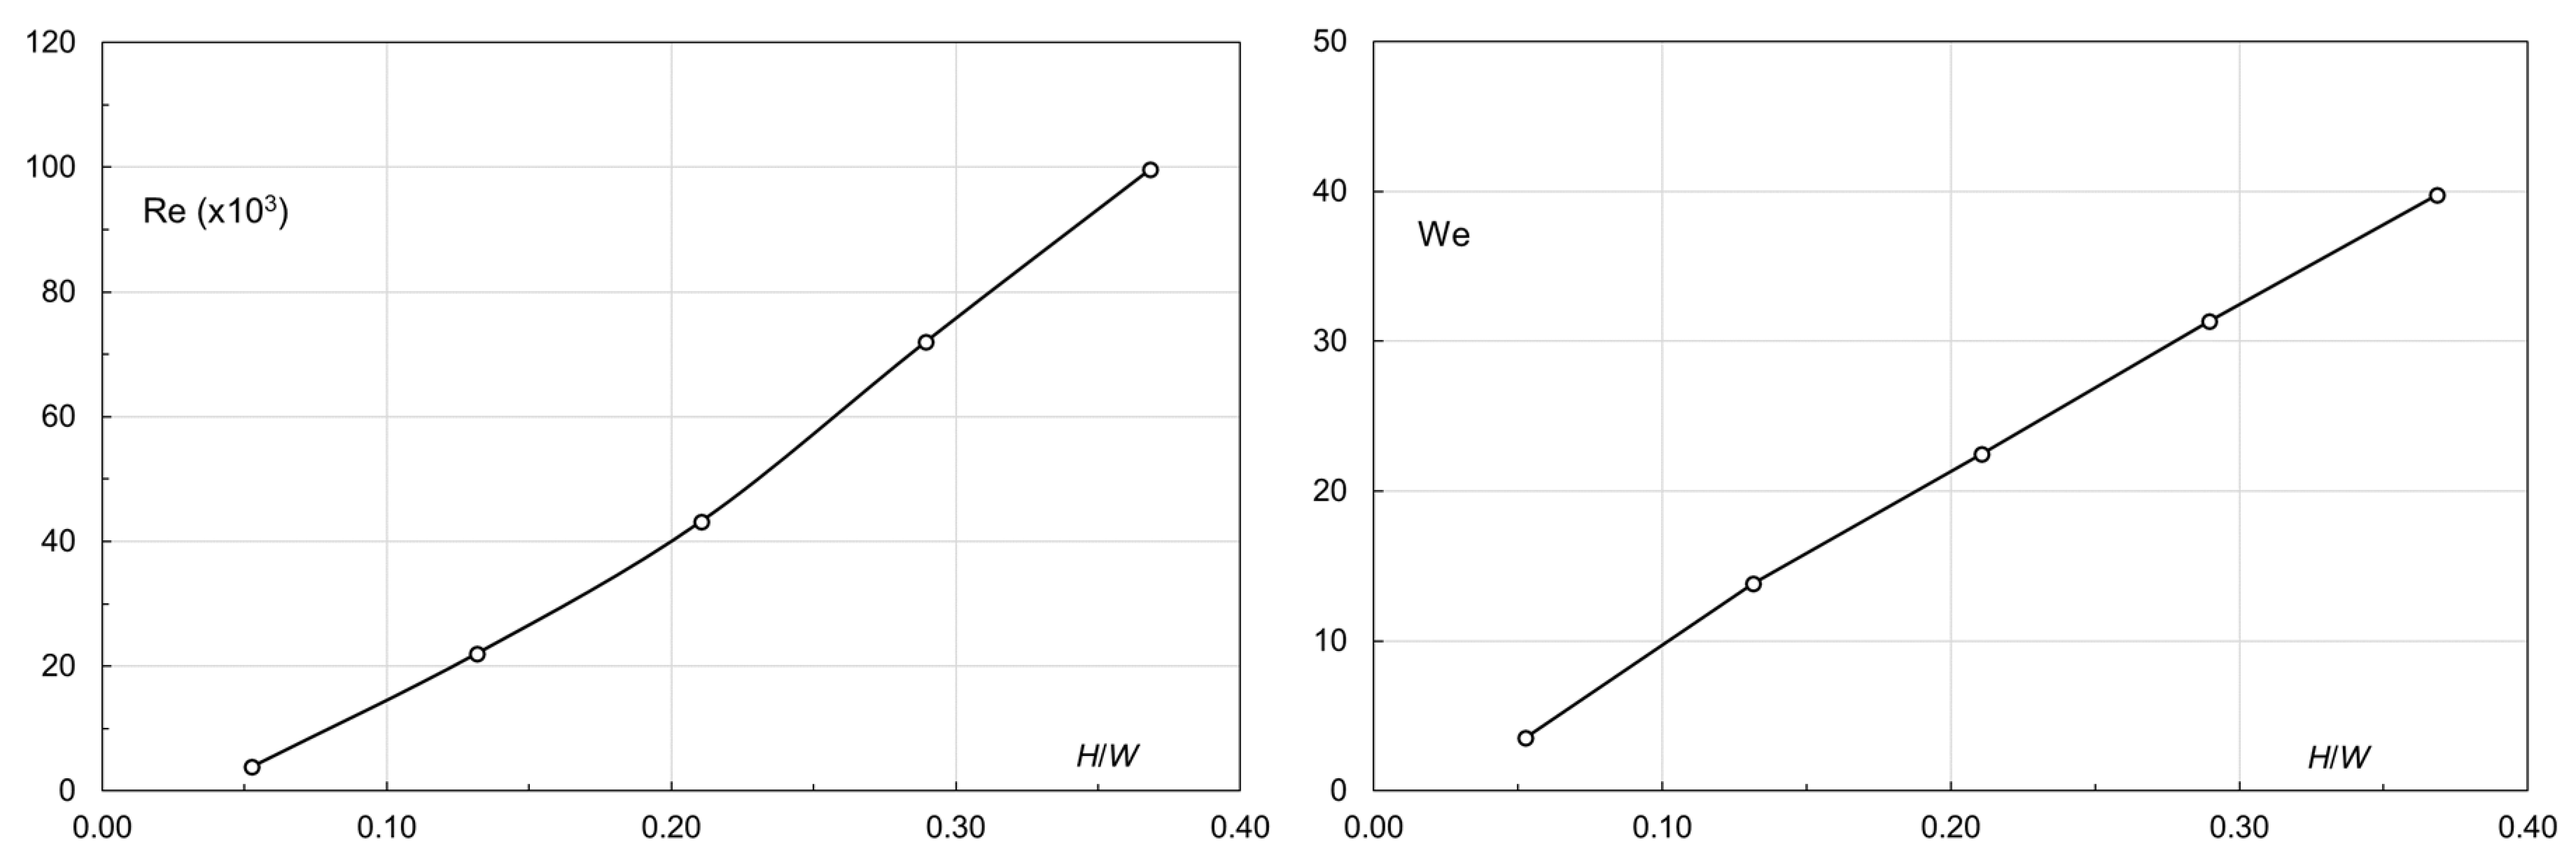
4.7. Effects of Viscous and Surface-Tension Forces
Scale effects caused by viscous and surface-tension forces are an issue of discussion in laboratory model tests, especially at low flows. Here, the crest flows at point ⑦ of the reference weir (
Figure 14) are chosen to illustrate this. First, define Reynolds number Re = (
Vnh)/
υ and Weber number We =
Vn/(
σ/ρh)
0.5, where
υ = water kinematic viscosity,
σ = surface tension coefficient, and
ρ = water density. At a water temperature of 20 °C,
υ = 1.0035 × 10
−6, and
σ = 0.0728, the Re and We results at point ⑦ are presented in
Figure 23. Obviously, Re ≤ 1.0 × 10
5 and We ≤ 40 within the
H range examined.
Literature reviews show that discussions of the viscous and surface-tension effects on weir overflows are seldom based on Re and We, but rather on the absolute water head (
H). Inasmuch as tests of low flows in a large model still suffer from these effects, the criterion is not directly related to the model scales. For a standard ogee and a broad-crested weir, Breitschneider [
44] and Ettema [
45] suggest a minimum value
H = 2.5–3.0 cm to avoid the effects on the
Q–
H curves, while Hager and Schwalt [
46] propose a larger value,
H = 5 cm.
The PK crest is an overflow weir of some form in the cross-section (rectangular, rounded, cylindrical, etc.). Irrespective of crest forms, Erpicum et al. [
18] and Pfister et al. [
47] conclude that the limiting water head is
H = 3 cm for the determination of its flow discharge. Note that no flow-velocity limit is involved. To correctly reproduce the flow features of jet formation and trajectory, the limiting value should be
H = 6 cm [
18,
44,
45,
47].
In this study, despite the large PK weir models, the low flows are somewhat underestimated. Even the effect of the surface roughness from the 3D printing plays a certain role in the context. Another aspect is the formation of an air cavity behind the falling jet along the sidewall. However, all these factors should, at a given water head, have the roughly same bearing on the flows of the two weirs. The resulting difference in flow discharge capacity should, even at low flows, mirror the difference in the weir geometries, namely, between the reference and improved weirs.
5. Conclusions
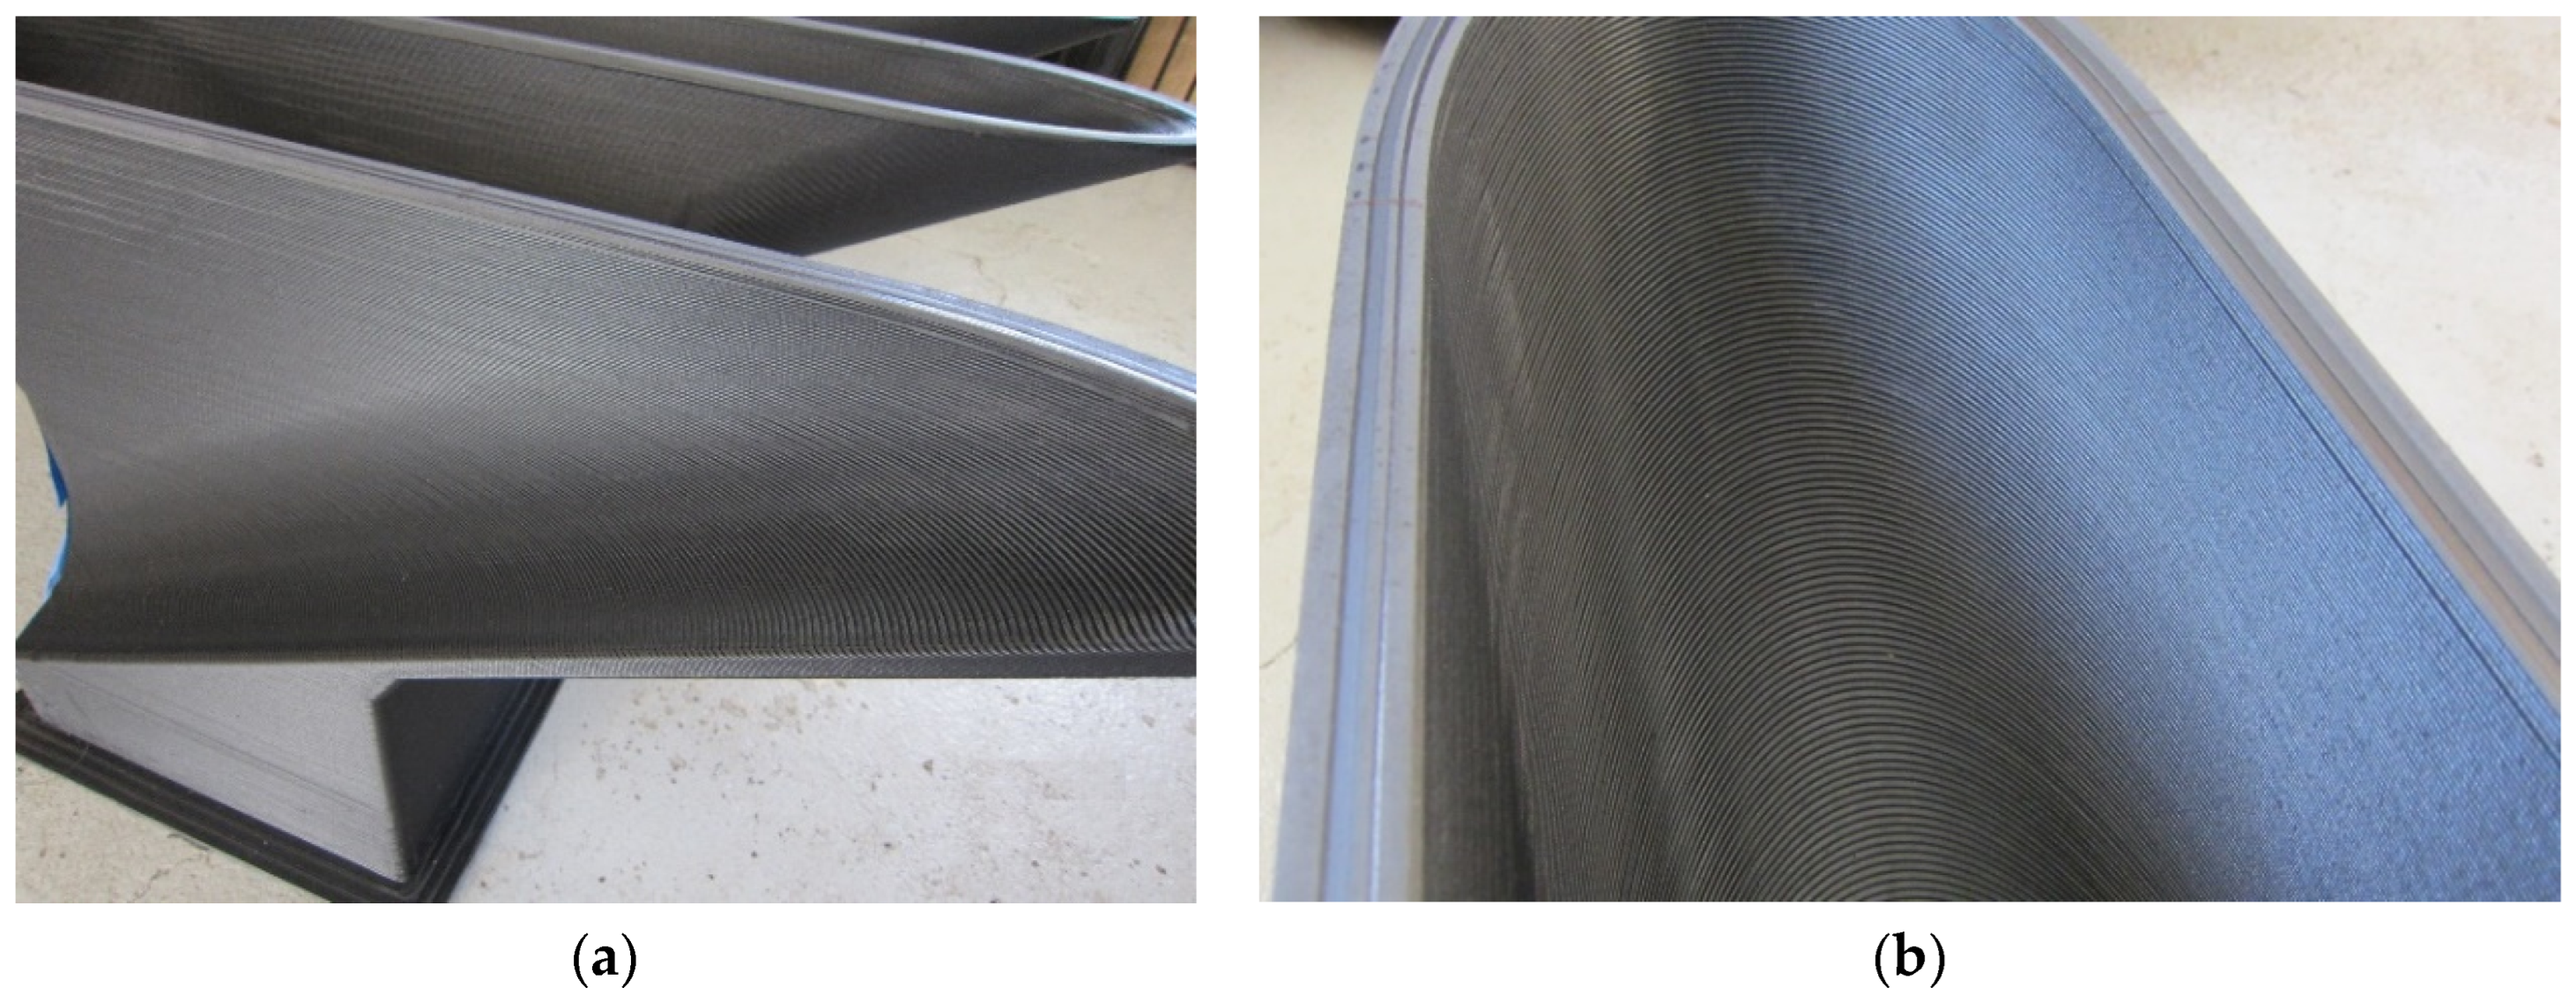
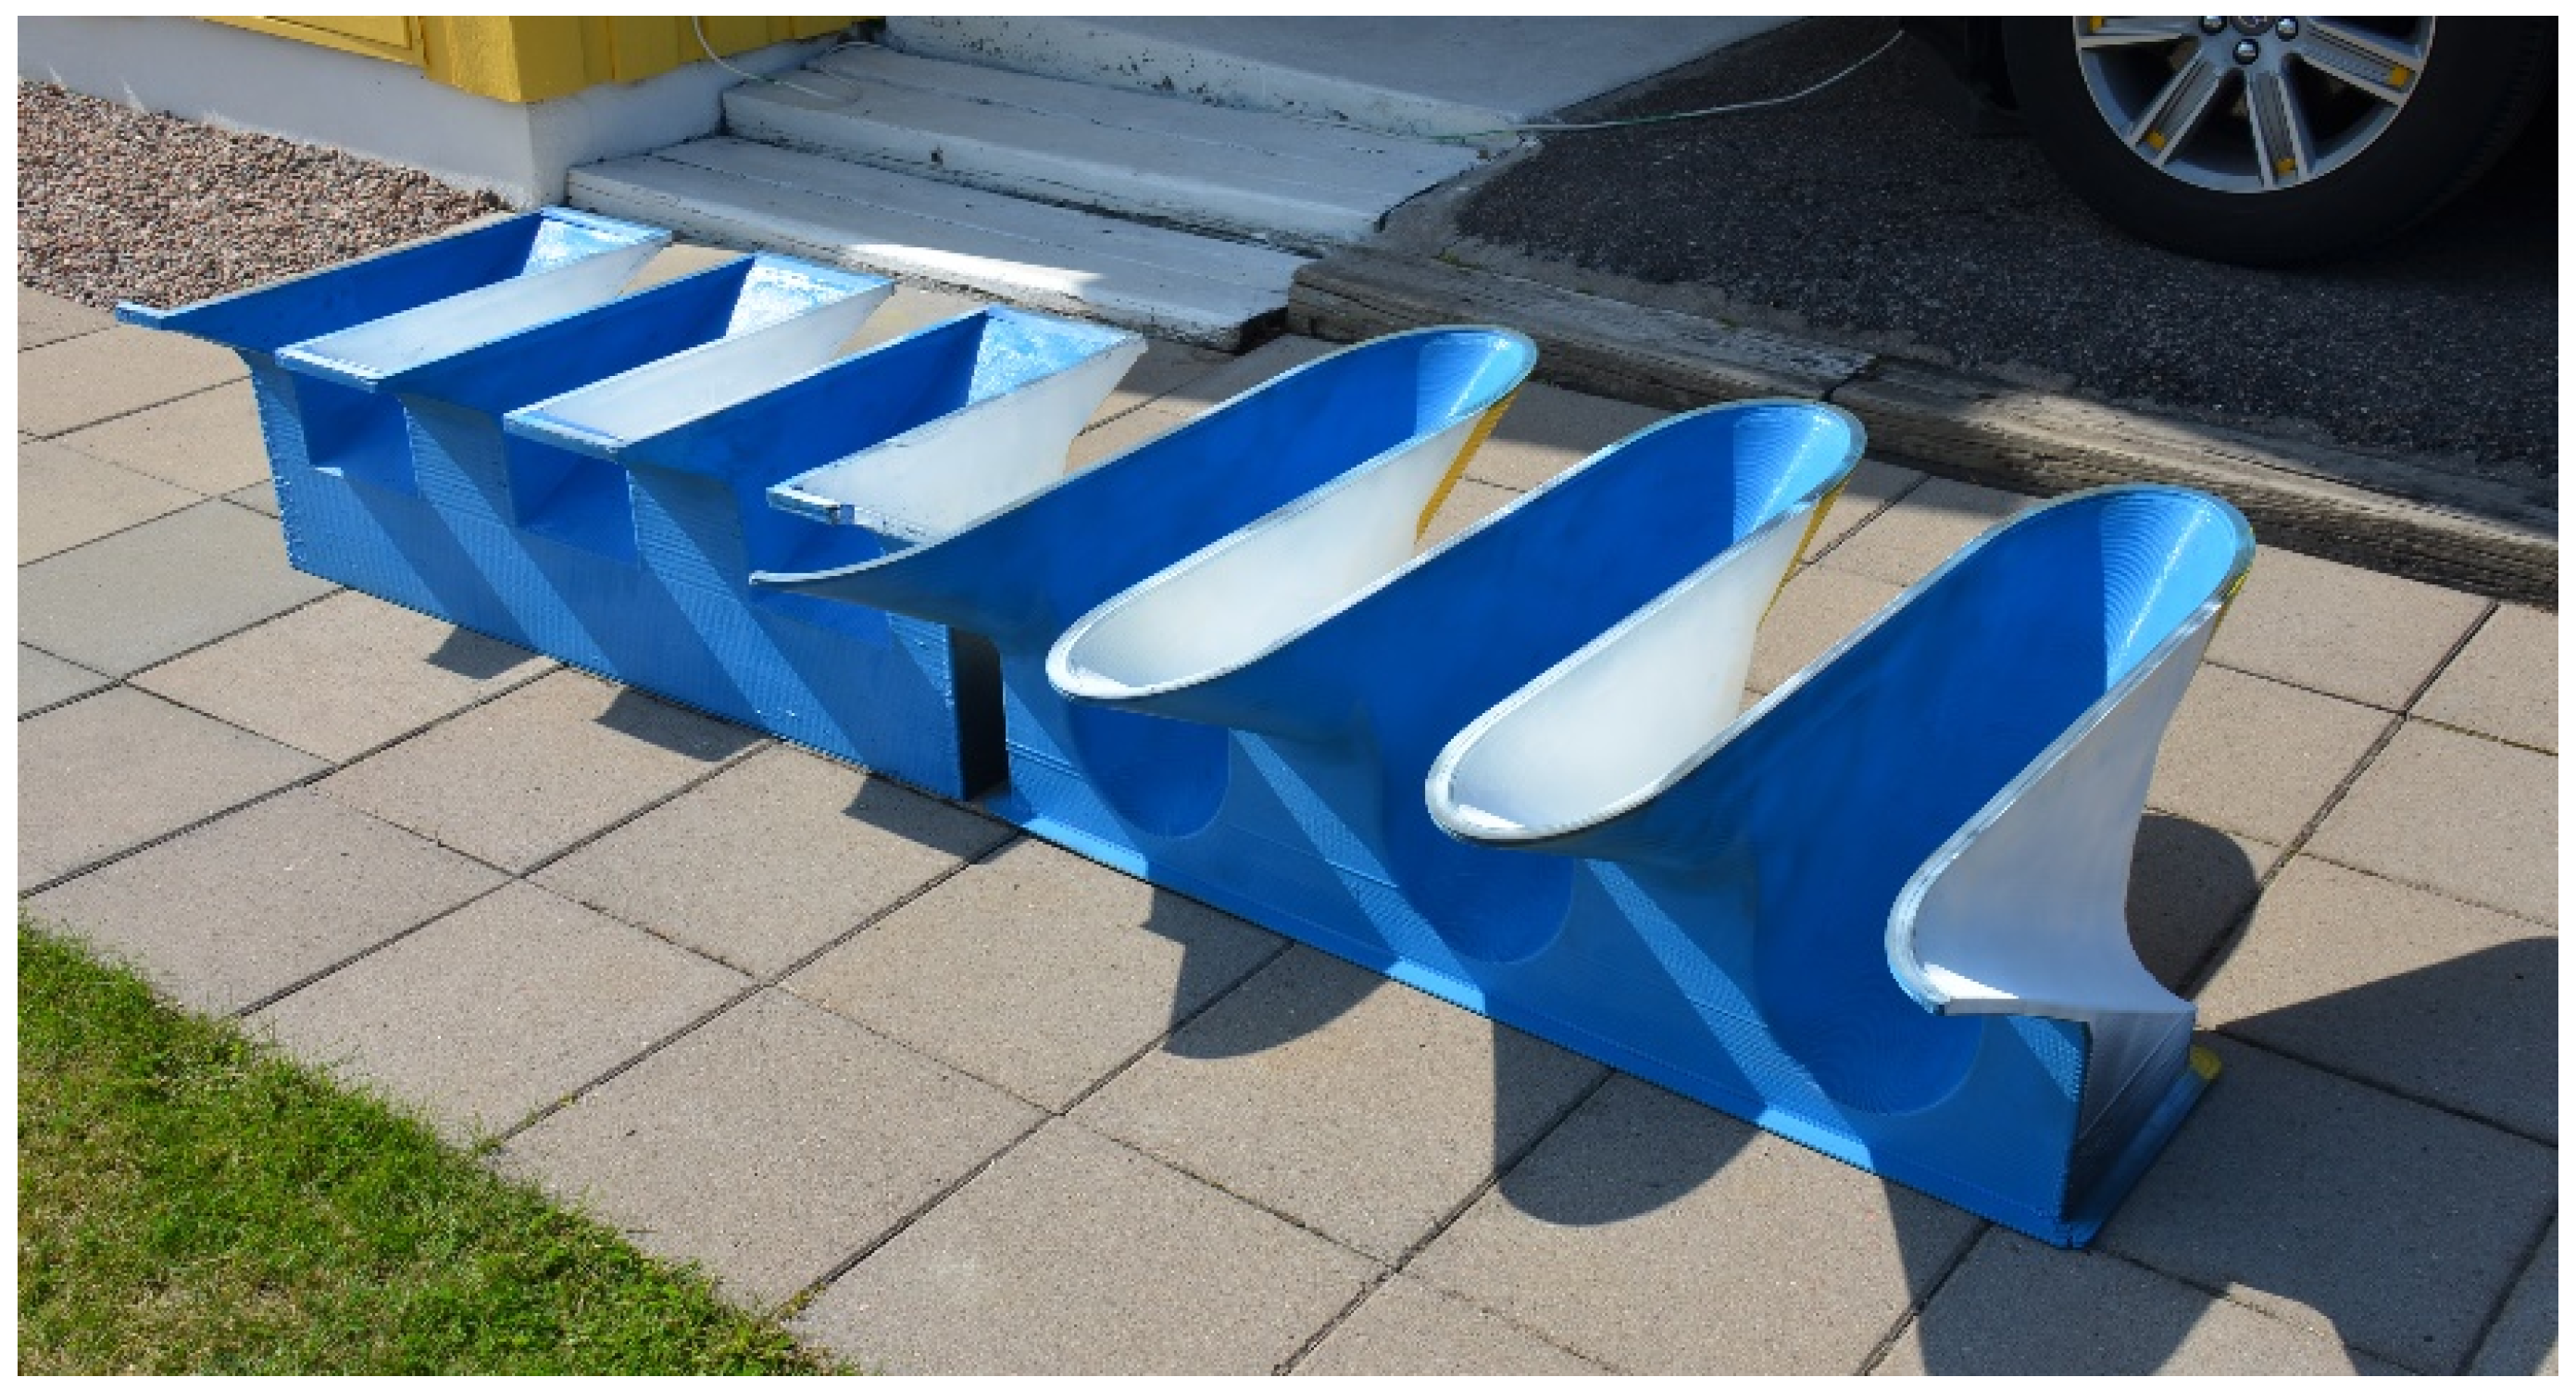
To provide reliable engineering design, it is desirable that a PK weir should effectively discharge floods and possess desirable hydraulic performance. To enhance its flow behavior, the conventional weir in rectangular planform is modified by the incorporation of semi-circular floors in the cross-section into the inlet and outlet keys, thus leading to streamlined overhangs both up- and downstream. The elliptical crest becomes longer. The volumes of both keys are also enlarged. The two models are 3D-printed, with the same surface roughness structure. Laboratory experiments are performed to examine the flow behaviors in terms of flow capacity, crest flows, inlet key flow, falling jets, etc.
Each model is 37.50 cm in height, with a three-cycle width of 114.00 cm. With the dimensions adopted for the study, the developed crest length of the improved weir extends by nearly 36%. The experiments demonstrate that, at the low water heads, the augment in flow discharge is by above 50%, and it declines with an increase in the water head. At the maximal head examined, the flow discharge of the improved weir is ~30% higher, which is still substantial. The discharge coefficient (C) and the unit crest flow rate (q) are also improved.
One drawback of the conventional PK weir is probably its corner singularity, which causes a significant drop in crest flow depth at high water heads and an unfavorable velocity profile. The improved weir amends the inflow conditions and gives rise to relatively uniform flow along the crest, which is manifested from measurements of both flow depth and normal-to-crest velocity. Though the velocity is only mapped near the crest, which does not reveal the change along the crest flow depth, the improvement in crest flow is obvious.
With respect to the changes in flow velocity, the deeper cross-section and the increased flow rate are two factors that act in opposite directions, which is the case for both inlet and outlet keys. Measurements show that the bottom flow velocities in the inlet key are at the same level in the two weirs, except for at the entrance. In the outlet key, the submergence effect appears first at approximately the same water head (8.0 cm) for both weirs, and no telling difference is noticed.
In summary, the noticeable crest extension, the streamlined upstream overhang inclusive of the crest, and the inlet key enlargement act in the same direction, creating more favorable flow conditions that contribute to the discharge enhancement. The upstream overhang, protruding more into the approach flow, also facilitates the inflow. The downward enlargement of the outlet key makes its contribution at high flows when the outflowing surface water becomes submerged. The downstream overhang also extends farther downstream, which promotes the spreading of the jet both in the flow direction and sidewards. All these contributing factors compound the more favorable performance of the improved PK weir.
In the tests, the falling jets are well-aerated from behind, involving no discussions of jet stability due to sub-atmospheric pressure. In practice, the aeration need should be examined. As a technically effective configuration, it is believed that the improved weir will find its engineering applications, especially if the footprint for spillway construction is restricted or the allowed rise in reservoir water level must be confined. A more effective spillway would limit the requirement of dam heightening in a refurbishment project. Even if no dam heightening is needed, a lower reservoir water stage leads to a higher safety margin of structural stability in the case of extreme floods.


