Article

Assessment of Stoplog Gates’ Operational Effectiveness for Improving Discharged-Water Temperatures during the Thermal Stratification Period in a Reservoir

1
State Key Laboratory of Hydraulics and Mountain River Engineering, Sichuan University, Chengdu 610065, China
2
Power Construction Corporation of China Guiyang Engineering Corporation Limited, Guiyang 550081, China
*
Author to whom correspondence should be addressed.
Water 2023, 15(23), 4145; https://doi.org/10.3390/w15234145
Submission received: 19 October 2023 / Revised: 20 November 2023 / Accepted: 27 November 2023 / Published: 29 November 2023
(This article belongs to the Section Water Quality and Contamination)

Abstract

:
The discharge of low-temperature water from the middle and lower layers of thermally stratified dam reservoirs leads to thermal pollution and adversely affects fish production and reproduction in downstream rivers. Selective water withdrawal using stoplog gates is an effective approach to address this issue. However, comprehensively and effectively evaluating the effects of stratified withdrawal and optimizing the scheduling of stoplog gates to provide better ecological services to downstream habitats pose significant challenges for reservoir managers. In this study, an equivalent elevation method (EEM) was developed based on in situ observation data of water temperature. The EEM calculates the equivalent withdrawal elevation (EWE) in the far dam area corresponding to the discharge-water temperature (DWT), facilitating the evaluation of stoplog-gate effects. EEM was applied to a thermally stratified dam reservoir in southwestern China (Guangzhao reservoir, GZ). The results showed a significant positive correlation (r > 0.7, p < 0.05) between DWT and the vertical-water-temperature structure in the far dam area. The average EWEs for the 5-layer, 4-layer, and 3-layer stoplog gates in GZ were 697.2 m, 690.8 m, and 689.9 m, respectively. Utilizing the EEM findings, a scheduling operation scheme was proposed to improve DWT while reducing the number of stoplog-gate operations, thereby increasing their efficiency and saving the cost of invested labor and time. This method provides a reference for reservoir managers in optimizing stoplog-gate-scheduling strategies to mitigate potential risks to aquatic ecosystems caused by abnormal water temperature.

1. Introduction

Due to reservoir-water-temperature stratification, the release of low-temperature water from the middle and bottom layers during the warming period can directly impact the downstream river’s water-temperature pattern [1], leading to adverse effects on downstream habitat, particularly the production and reproduction of fish [2,3]. Currently, the primary approach to addressing this issue is through stratified-water-intake measures [4]. A relatively new design is of selective withdrawal with stoplog doors [5,6], which can adjust the inlet position by stacking different layers of gates in front of it. This method is widely used in large reservoirs such as Guangzhao, Nuozadu, and Wudongde in Southwest China due to its high intake flow rate, adaptability to significant water-level changes, and ability to continuously acquire warm surface water. However, for reservoir managers, the quick and effective evaluation of how stoplog gates operate and their optimized scheduling remain challenging problems.
Currently, most researchers employ simplified empirical formulas [7,8], indoor physical model tests scaled to certain proportions [9,10], and numerical hydrodynamic models, such as CE-QUAL-W2 [11,12] and EFDC [13,14] to investigate the relevant issues and assess the impact of water extraction from stoplog gates. These methods have guided the development of operational programs to some extent by calculating the discharge-water temperature (DWT), processed under certain representative operating conditions. However, because the actual operation of stoplog gates is influenced by various factors, such as changes in reservoir level, hydrodynamic conditions, climatic conditions, and human activities [15,16], it is challenging to accurately reflect the dynamic change process of the reservoir by evaluating the operational effect based on the calculation results of preset working conditions. Moreover, the effectiveness of the stoplog gate in practical applications may not be fully realized when scheduling plans are based on using such methods. For instance, the year-long-observation data of water temperature at the Nuozadu reservoir in Yunnan Province, China, showed that only one layer of the three-layered stoplog gates was actually used to meet the required downstream-fish-breeding water temperature, despite the design manual requiring three layers [17]. In some reservoirs, only one layer of the stoplog gates was used in actual practice due to the lack of scientific guidance on the dispatching process, and the desired effect of improving the water temperature of the outlet reservoir was hardly satisfactory. Therefore, there is significant potential for optimizing the management of stratified-water-intake facilities. An urgent need exists for a fast, real-time, and effective method to evaluate the operational effectiveness of stoplog gates and to follow up and analyze their effectiveness in real time to assist managers in guiding the scheduling of stoplog gates.
Continuous monitoring of water temperature has the advantage of providing real-time and accurate information on the changes in the water-temperature-structure process, in contrast to empirical formulas, physical tests, and numerical models [18,19]. With recent advancements in temperature-sensor accuracy, long-distance transmission, and high-frequency monitoring technologies, water-temperature monitoring in reservoir areas and rivers downstream of dams has become more widespread [15,19,20,21,22]. The use of hourly and daily monitoring data enables a more realistic and accurate reflection of the reservoir’s thermal-change process [16,23,24]. Studies analyzing the impact of stoplog-gate operations on DWT based on water-temperature monitoring have also been conducted [25]. However, related studies have shown that the DWT is affected by the abstraction flow rate, vertical-water-temperature structure, and other factors, and has a certain correlation with the dam elevation [8]. Most of the current analysis methods based on monitoring data only focus on DWT changes and ignore the correspondence with dam elevation [26], and cannot effectively explore the relationships between the monitored data; thus, they cannot fully reflect the effectiveness of the stoplog gate, and are limited in their ability to serve as a reference for scheduling strategies.
In 2019, a selective withdrawal experiment was conducted at the Guangzhao reservoir (GZ) in Southwest China, where different intake channels were used. Simultaneously, data on power plant scheduling and stoplog-gate operation were collected to analyze the response relationship between the DWT and the vertical-water-temperature structure upstream of the dam. Based on the continuous high-frequency monitoring data obtained in the stratified-water-extraction test, the study (1) reveals the change process of the thermal state and DWT in the GZ on the “time and day” scale, (2) establishes the equivalent elevation method (EEM) to evaluate the operational effectiveness of the stoplog gate in GZ, and (3) proposes the optimization of the stoplog-gate scheduling in GZ during the test period. Our work aims to provide a new perspective for evaluating the stoplog-gate operational effectiveness, and then provide a reference method for managers to develop a better stoplog-gate-scheduling scheme.

2. Materials and Methods

2.1. Study Area

GZ (25°57′ N, 105°14′ E) is located in the middle reaches of the Beipan River (Figure 1a) in Guizhou Province, China. The station operates within a watershed area of 13,548 km2 above the dam, and the average annual flow rate is 257 m3/s. The reservoir area spans 51.54 km2, with a normal storage level of 745 m and a total capacity of 3.245 billion m3, corresponding to a normal storage-level capacity of 3.135 billion m3. The reservoir serves as a partial regulating reservoir, with a regulating capacity of 2.037 billion m3.
During the warming period, the discharge of low-temperature water downstream can have further negative impacts on the growth and reproduction of fish populations [27]. The study area is mainly inhabited by temperate-zone fish species, with carp being the dominant population. Their spawning period occurs from March to August each year, and they require a minimum-water-temperature threshold for successful reproduction of 18 °C. The phenomenon of downstream discharge of low-temperature water from March to August every year in GZ can have adverse effects on the growth and reproduction of downstream fish populations.

2.2. Overview of the Stoplog Gate

GZ regulates the water temperature by releasing water in a layered manner using a stacked steel gate system. The hydropower station has two intake channels, each of which is equipped with two water turbines. The six-hole stoplog gate is arranged in front of the inlet of the diversion channel, the inlet floor elevation is 670 m, the stoplog gate is divided into 20 sections, the height of each section is 3 m (Figure 1c), the highest gate-top elevation is 730 m, and the minimum operating water depth at the top of the gate is 15 m. The operation of the stoplog gate is carried out according to the rise and fall of the reservoir water level. The guiding regulation is that the water level should be higher than the operating-stoplog-gate-top elevation of 15 m, as such when the reservoir water level is lower than 745 m (normal storage level), the first section of the stoplog door is lifted, and when the reservoir water level is lower than 742 m, the second section of the stoplog door is lifted, and so on. The scheduling operation of the stoplog gate during the test period of the GZ is shown in Table 1.
Since the deployed vertical-temperature chain fluctuates with the water level, the original water-temperature-monitoring data were collected based on depth from the water surface. In this study, the original data were combined with the process of reservoir-water-level changes and transformed into a process based on elevation. Then, using Equation (1), linear interpolation is employed to calculate the water temperature at a fixed elevation.
T x = T x n + Z x Z x n Z x n + 1 Z x n T x n + 1 T X n        
where T x represents the water temperature at a fixed elevation; Zvn and Zvn+1 represent the elevation of two adjacent points of a fixed elevation on the vertical-temperature chain; Tvn and Tvn+1 represent the adjacent-point water-temperature values; and Z x represents a fixed elevation.

2.3. Selective-Water-Withdrawal Test

To obtain higher precision and frequency monitoring data and analyze the effect of using the GZ stoplog gate, a stratified-water-withdrawal test was carried out in the GZ from 12 April to 30 June 2019. Diversion channels #1 and #2 underwent different water-withdrawal methods, using the stoplog-gate stratified-water-withdrawal method and the original bottom-intake water-withdrawal method, respectively. The vertical-temperature monitoring chain was placed at the drift-stopping row in the reservoir area, and online monitoring points were placed at the discharge outlet of the hydropower station (Figure 1b). The frequency of monitoring the vertical-temperature chain in front of the dam was 1 h, the frequency of monitoring the drainage points of the hydropower station was 0.5 h, and the temperature accuracy was 0.1 °C for both to accurately capture the change process of the vertical-water-temperature structure and the DWT in front of the dam. In addition, information on reservoir scheduling, turbine operation, and the number of stoplog-gate layers in operation are collected simultaneously from the reservoir-management office.

2.4. Statistical Analysis and Stratification Index

2.4.1. Stratification Index

In this study, the (i) vertical-water-temperature gradient [28], (ii) buoyancy frequency [29,30], and (iii) water-stability index [31] were selected as evaluation indicators to quantify the thermal stratification of water bodies and to assess the intensity of stratification stability in reservoirs [32]. The stratification stability index (SI) was selected to quantify the stratification stability of the water column. When the entire water column is homogeneous, the SI value is 0, and when the water column is strongly stratified, the value is larger.
The vertical-water-temperature gradient (VTG, °C/m):
V T G = T z z
The buoyancy frequency (N, 1/s):
N = g ρ 0 ρ z z
The stratification stability index (SI, kg/m2):
S I = Z = Z 0 Z = Z 1 ( Z Z ¯ ) ρ z  
where T(z) is the water temperature at depth z. Where N represents the local stability of the water column, and the trend magnitude of the vertical direction of motion of the flowing water body after being disturbed. In the analysis of this study, the main concern is the effect of gravity and buoyancy; ρ z z is the vertical density gradient; g is the gravitational acceleration; ρ 0 is the average density of the entire water column; and ρ z is the density at depth z, which is assumed to be solely temperature dependent [32]. Where Z is the depth of the water column from the surface, Z0, Z1, and Z are the depths of the surface water, the lower end of the water column, and the centroid of the water column, respectively.

2.4.2. Statistical Analysis

Microsoft Excel version 2016 and Python numpy, pandas, and matplotlib libraries were used for data processing, analysis, and plotting. The correlation analysis was performed using the Spearman correlation coefficient (r):
r = 1 6 D 2 n n 2 1
where D is the difference between the order of the two sets of data, and n is the number of data. When 0.7 < r < 1, there is a strong correlation; 0.4 < r < 0.7, is a moderate correlation; 0.0 < r < 0.4, is weak correlation; and r = 0, no correlation. The significance levels are reported as significant if p < 0.05.

3. Results and Discussion

3.1. Data Analysis

3.1.1. Processes of Thermal Stratification

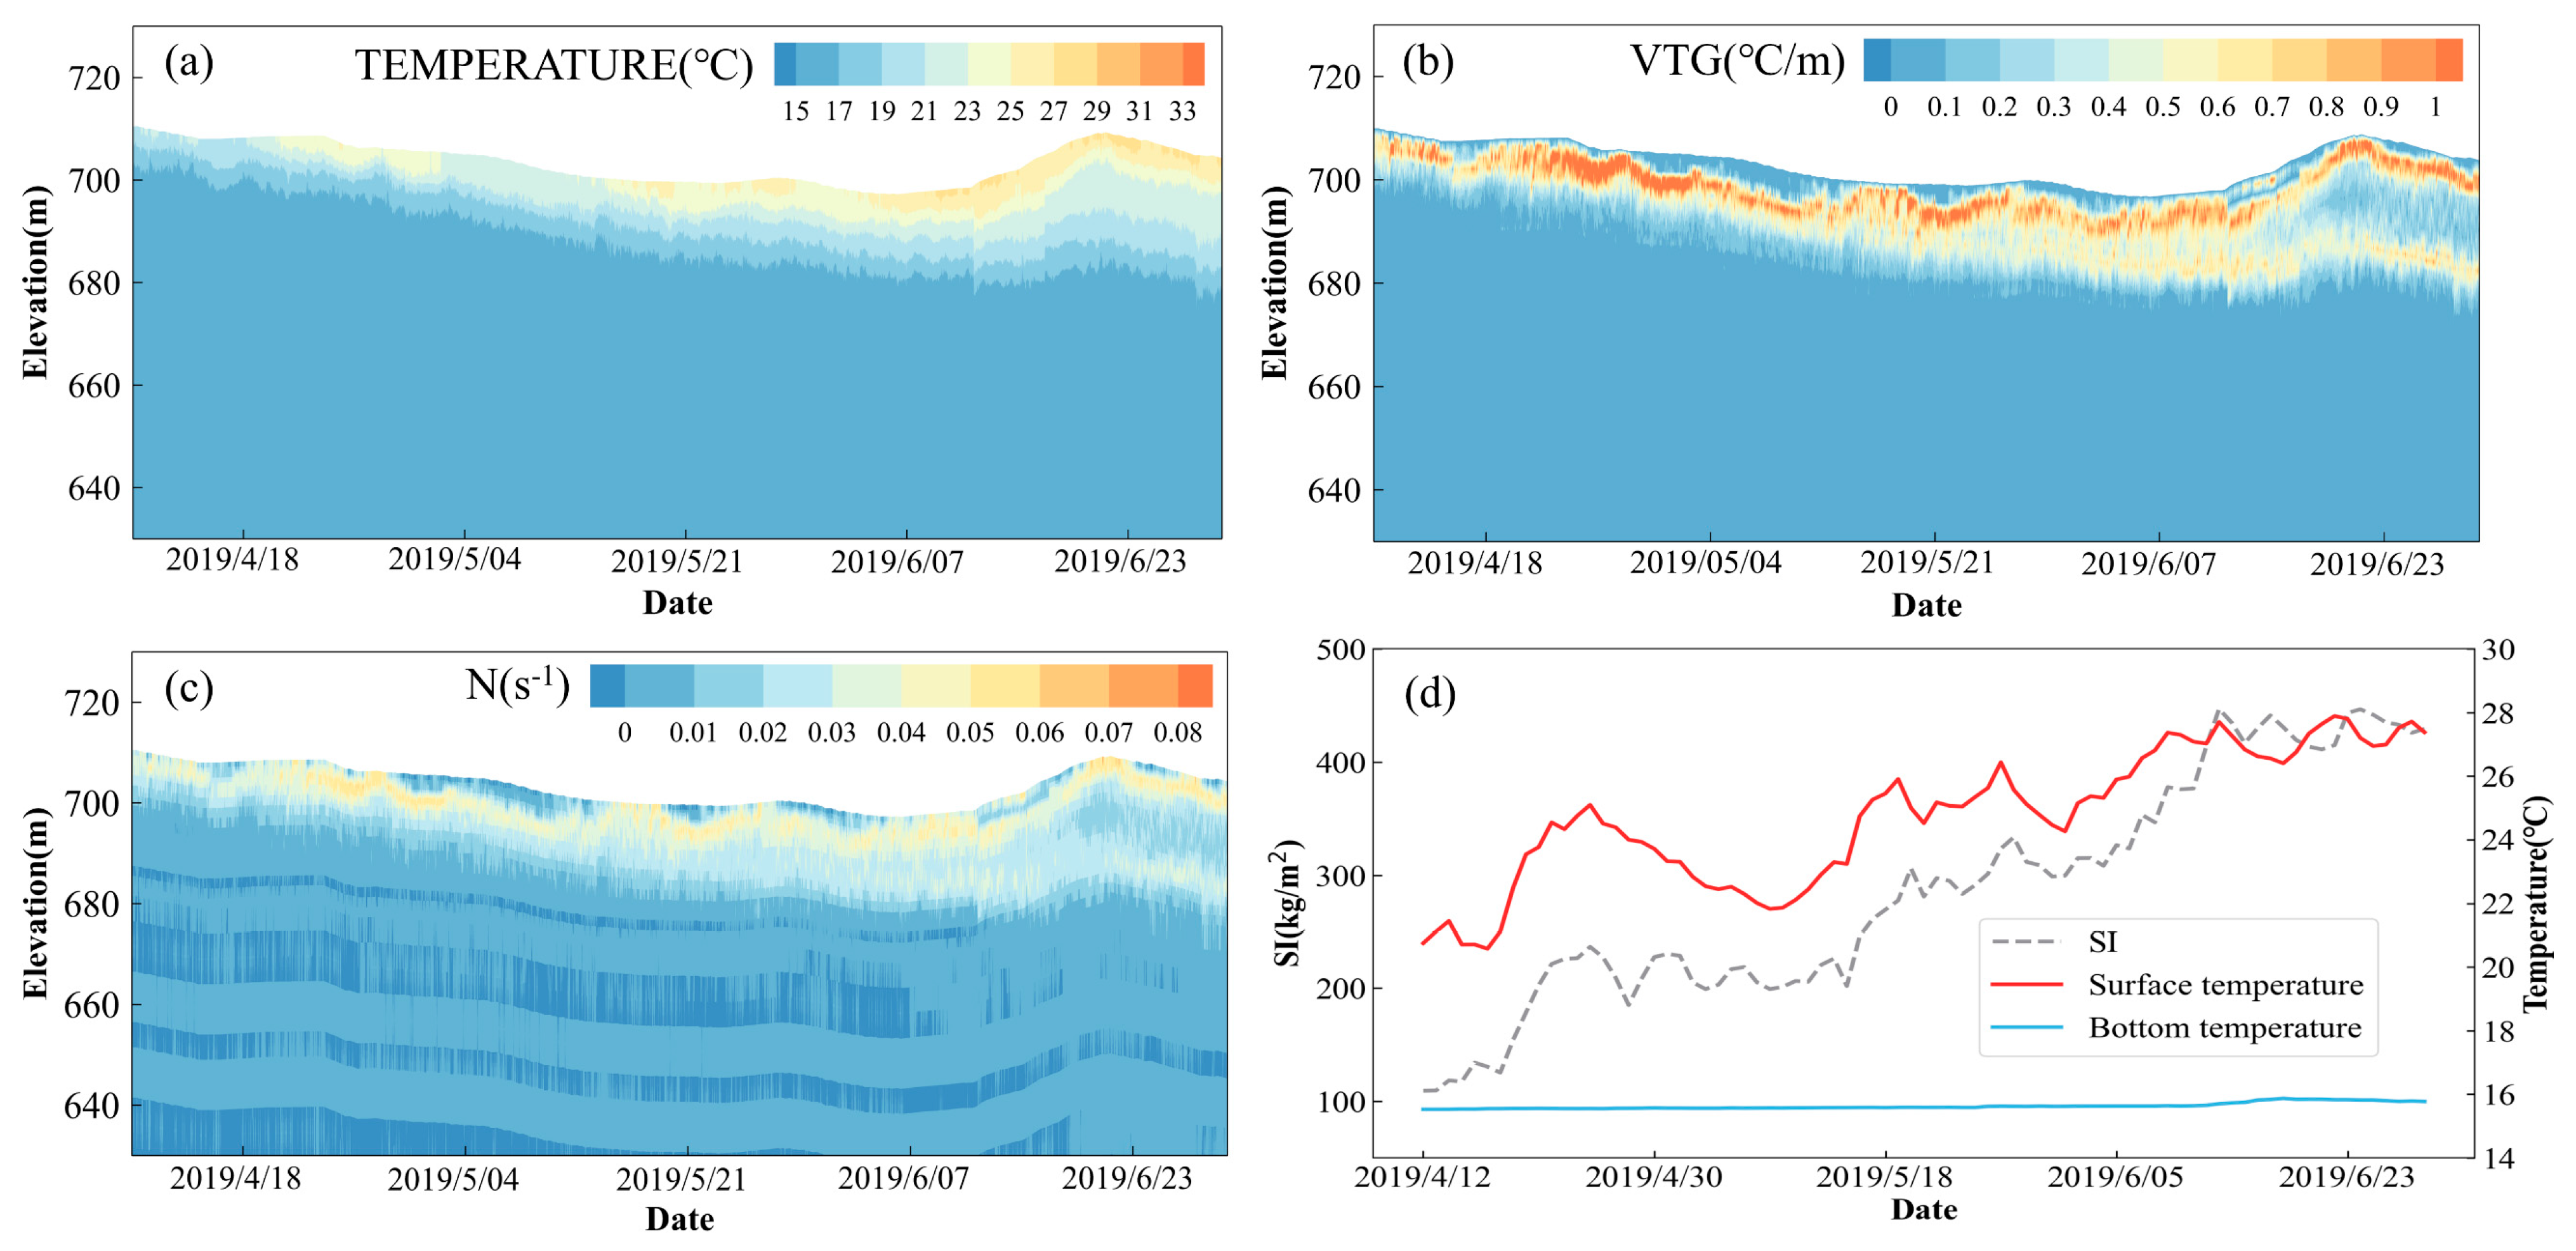
Thermal stratification in reservoirs is a crucial physical process that results in an uneven distribution of water temperature in the vertical profile, thereby influencing the mixing, convection, and distribution of dissolved oxygen in the vertical water column [22]. The changes in the temporal average vertical water temperature, vertical-temperature gradient, and buoyancy frequency in the reservoir area during the test period (Figure 2) showed that the vertical-water-temperature distribution in the reservoir area had a stable stratified structure in general, changing significantly from a surface-water thermocline structure in the early stage to a double-thermocline structure, where the surface and middle thermoclines existed simultaneously.
The variation in reservoir water temperature depends mainly on the balance between the heat balance of each element [19,33]. During the test period, the water body was subject to the effect of temperature and solar radiation heat storage and accumulation; the water temperature gradually increased, and the change weakened with increasing depth. The surface water temperature reached 22.9 °C, 23.9 °C, and 26.8 °C from April to June, respectively, and the bottom water temperature changed less, remaining at approximately 15.6 °C (Figure 2a). The thickness of the high-temperature water layer increased from 2 m at the beginning of the test to 20 m at the end of the test. The greatest vertical-temperature difference occurred mainly in the 20 m of surface water by the end of the test, with the temperature difference at the 10 m surface layer accounting for approximately 57% of the entire vertical-temperature difference, and the temperature difference at the 20 m surface layer accounting for approximately 88% of the entire vertical-temperature difference (Figure 2b). The surface buoyancy frequency within the 20 m layer expanded from 0.02 s−1 to 0.05 s−1, and the location of the peak buoyancy frequency was basically the same as the location of the thermocline (Figure 2c), which was inhibited by buoyancy. The water at the bottom of the reservoir could not exchange and mix with the upper water during the warming period, and the vertical-temperature difference gradually expanded to 7.4 °C, 8.4 °C, and 11.0 °C from April to June, respectively. The daily variation process of the SI value during the test period (Figure 2d) was calculated, and the average values were 176.2 kg/m2, 253.3 kg/m2, and 394.6 kg/m2 in April to June, reflecting that the stability of the reservoir’s vertical water column was further enhanced, and the higher stability also implied stronger stratification.

3.1.2. Process of the DWT

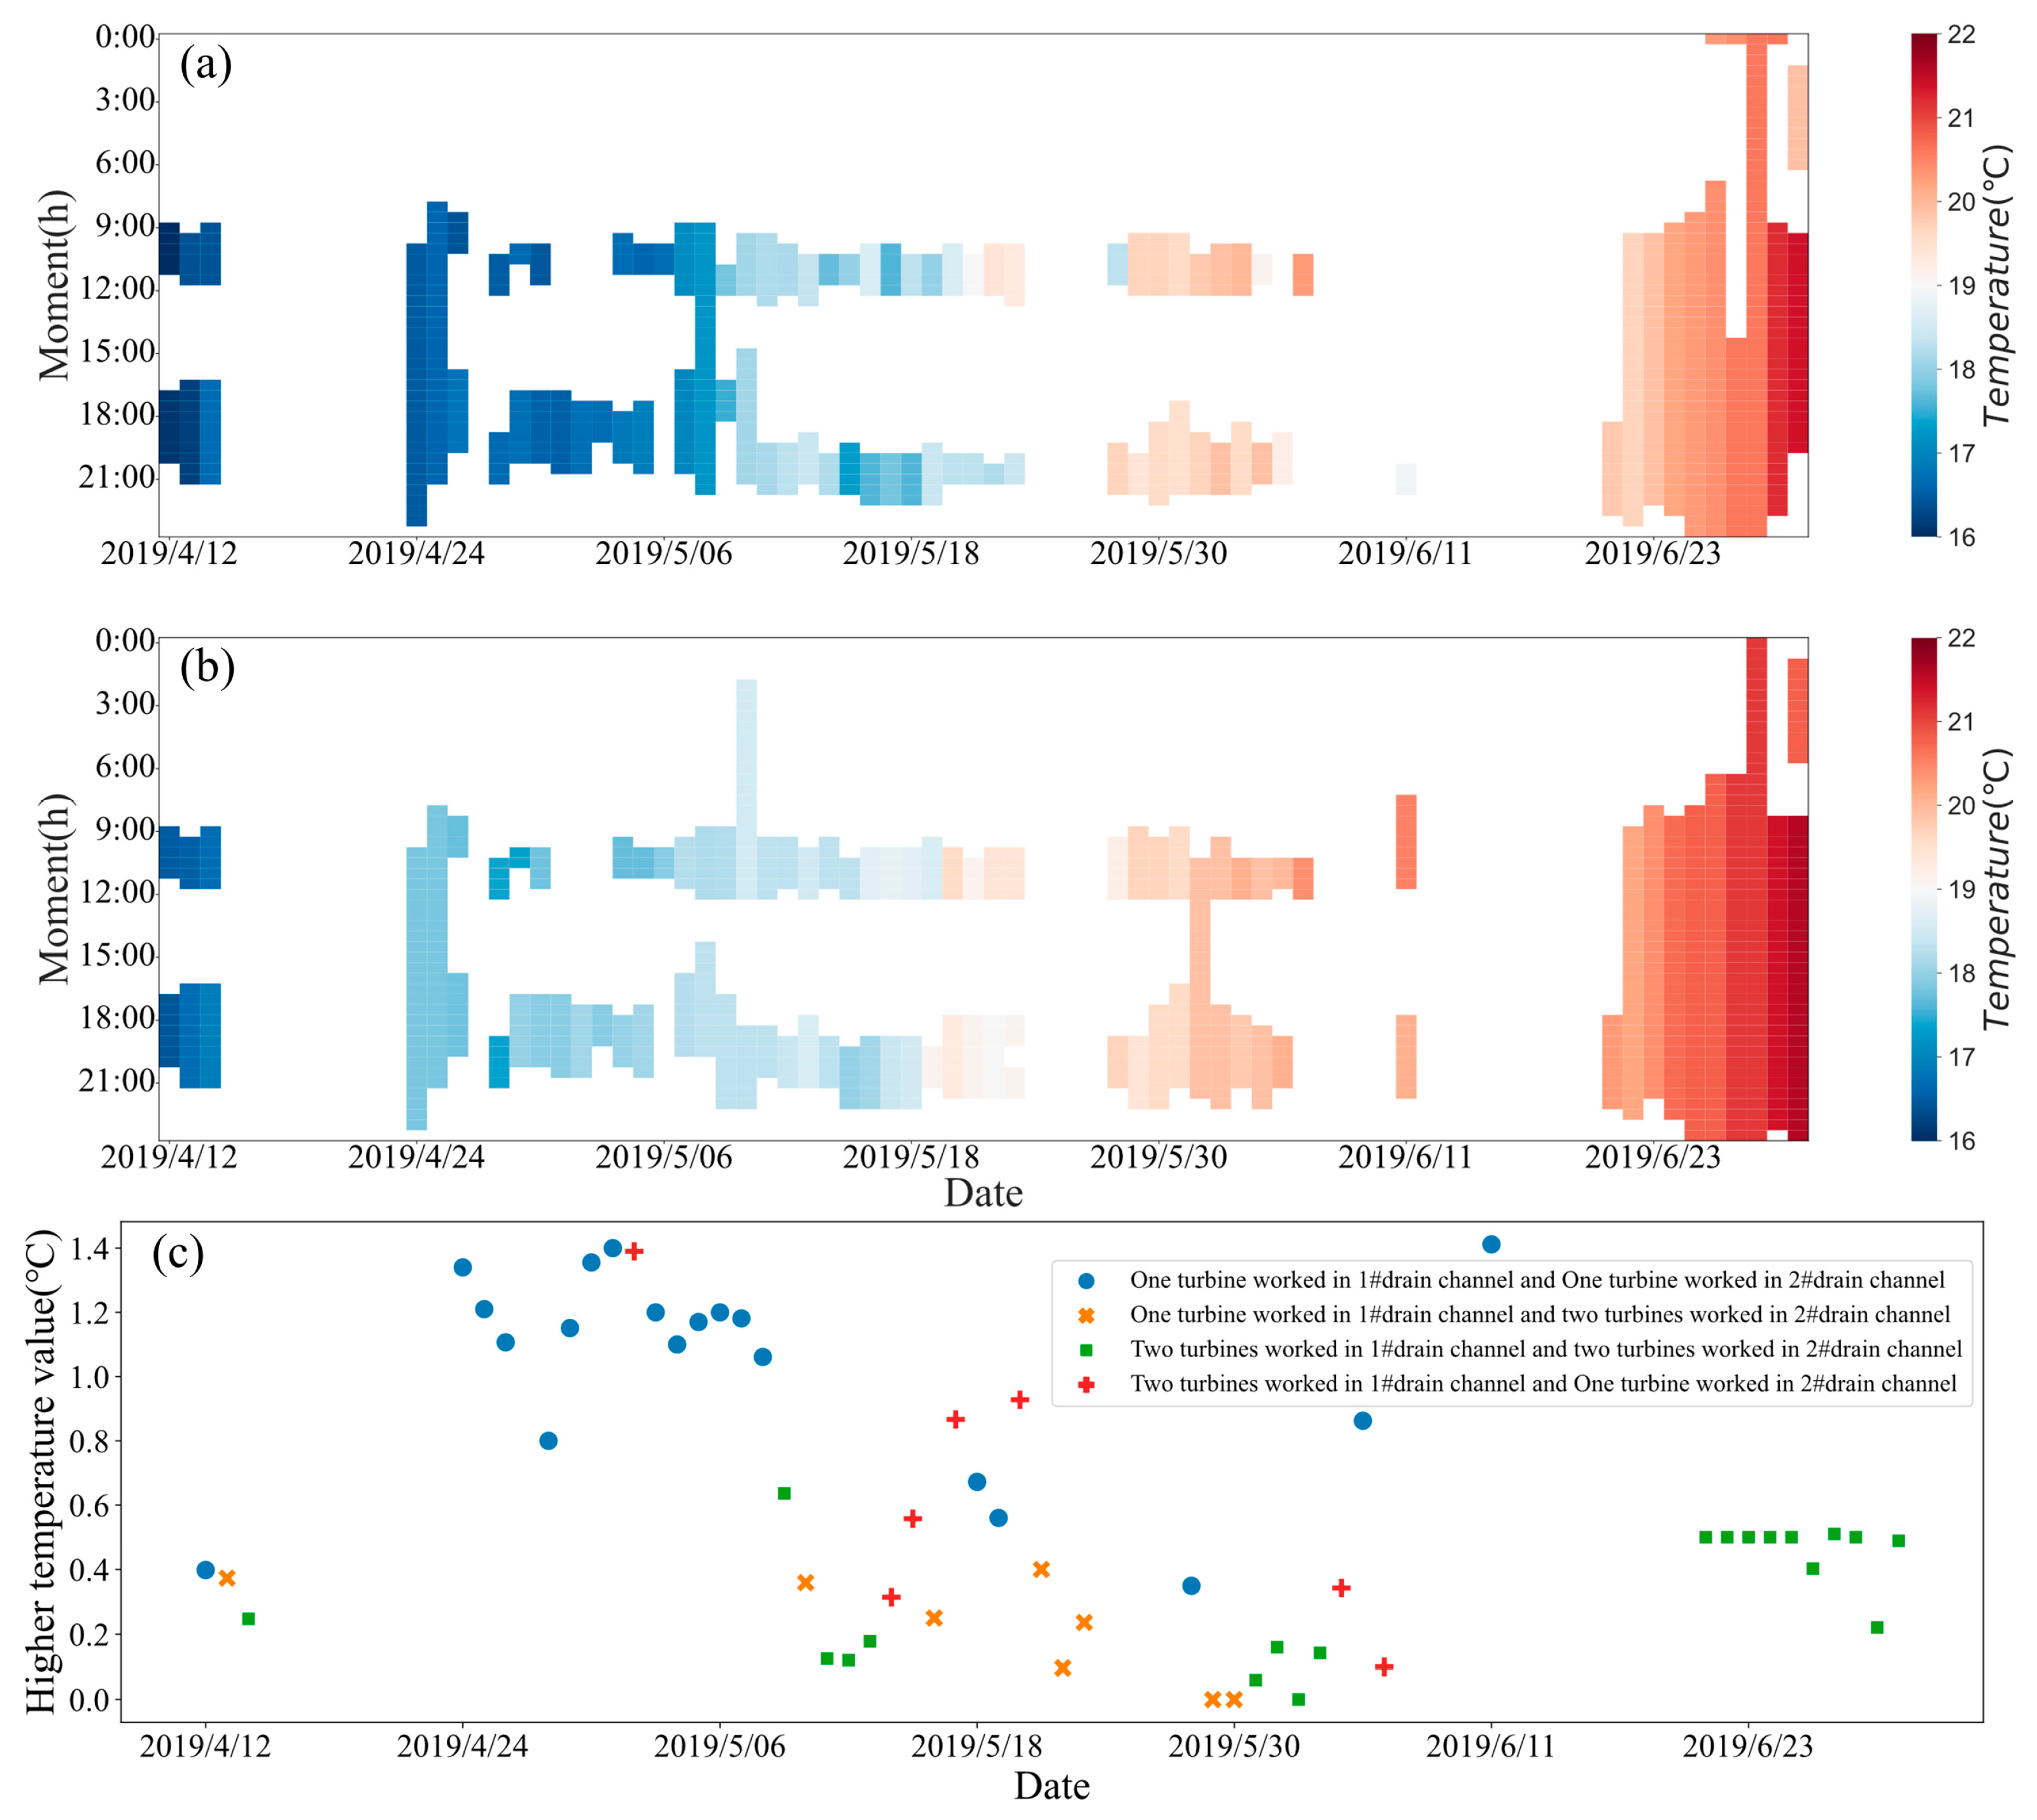
The operating water level of the reservoir during the test period varies between 698.31 m and 710.35 m, and the depth of water withdrawal changes accordingly. Considering the existence of obvious intermittent turbine stoppage in the hydropower station, the invalid data are removed based on the turbine operation during the time period, and the DWT process is extracted from drainage channels 1# (Figure 3b) and 2# (Figure 3a) during the day when there is drainage for power generation, thus forming a comparison dataset. Drainage channel 1# is in operation before the stoplog gate changes from 3 to 5 layers, and due to the stoplog gate acting as a retaining wall, the reservoir in the warming period continuously obtain the surface layer of warm water. The DWT fluctuates between 16.0 and 21.4 °C from April to June, and the average monthly temperature values are 17.4 °C, 18.6 °C, and 20.5 °C. In drainage channel #2, at the original bottom-inlet-water intake, the water-intake depth is deeper, and reservoir stratification as influenced by the discharged lower water temperature is more obvious. The DWT in April–June are 16.5 °C, 18.0 °C, and 20.0 °C, which is cooler compared to the stoplog-gate stratified water withdrawal where the DWTs have different degrees of decline. For the possible impact of discharging low-temperature water on fish in the downstream river, 18 °C was selected as the water-temperature threshold to protect the normal growth and reproduction of fish [34]. The comparative analysis found that the DWT of drainage channel #1 reached 18 °C on 1 May, 10 days earlier than the arrival time of drainage channel #2 on 10 May. The selective withdrawal of water from the stoplog gate of the GZ slightly improved the discharge of lower-temperature water, and the maximum average daily improvement during the test period reached 1.4 °C (Figure 3c).

3.2. Correlation Analysis

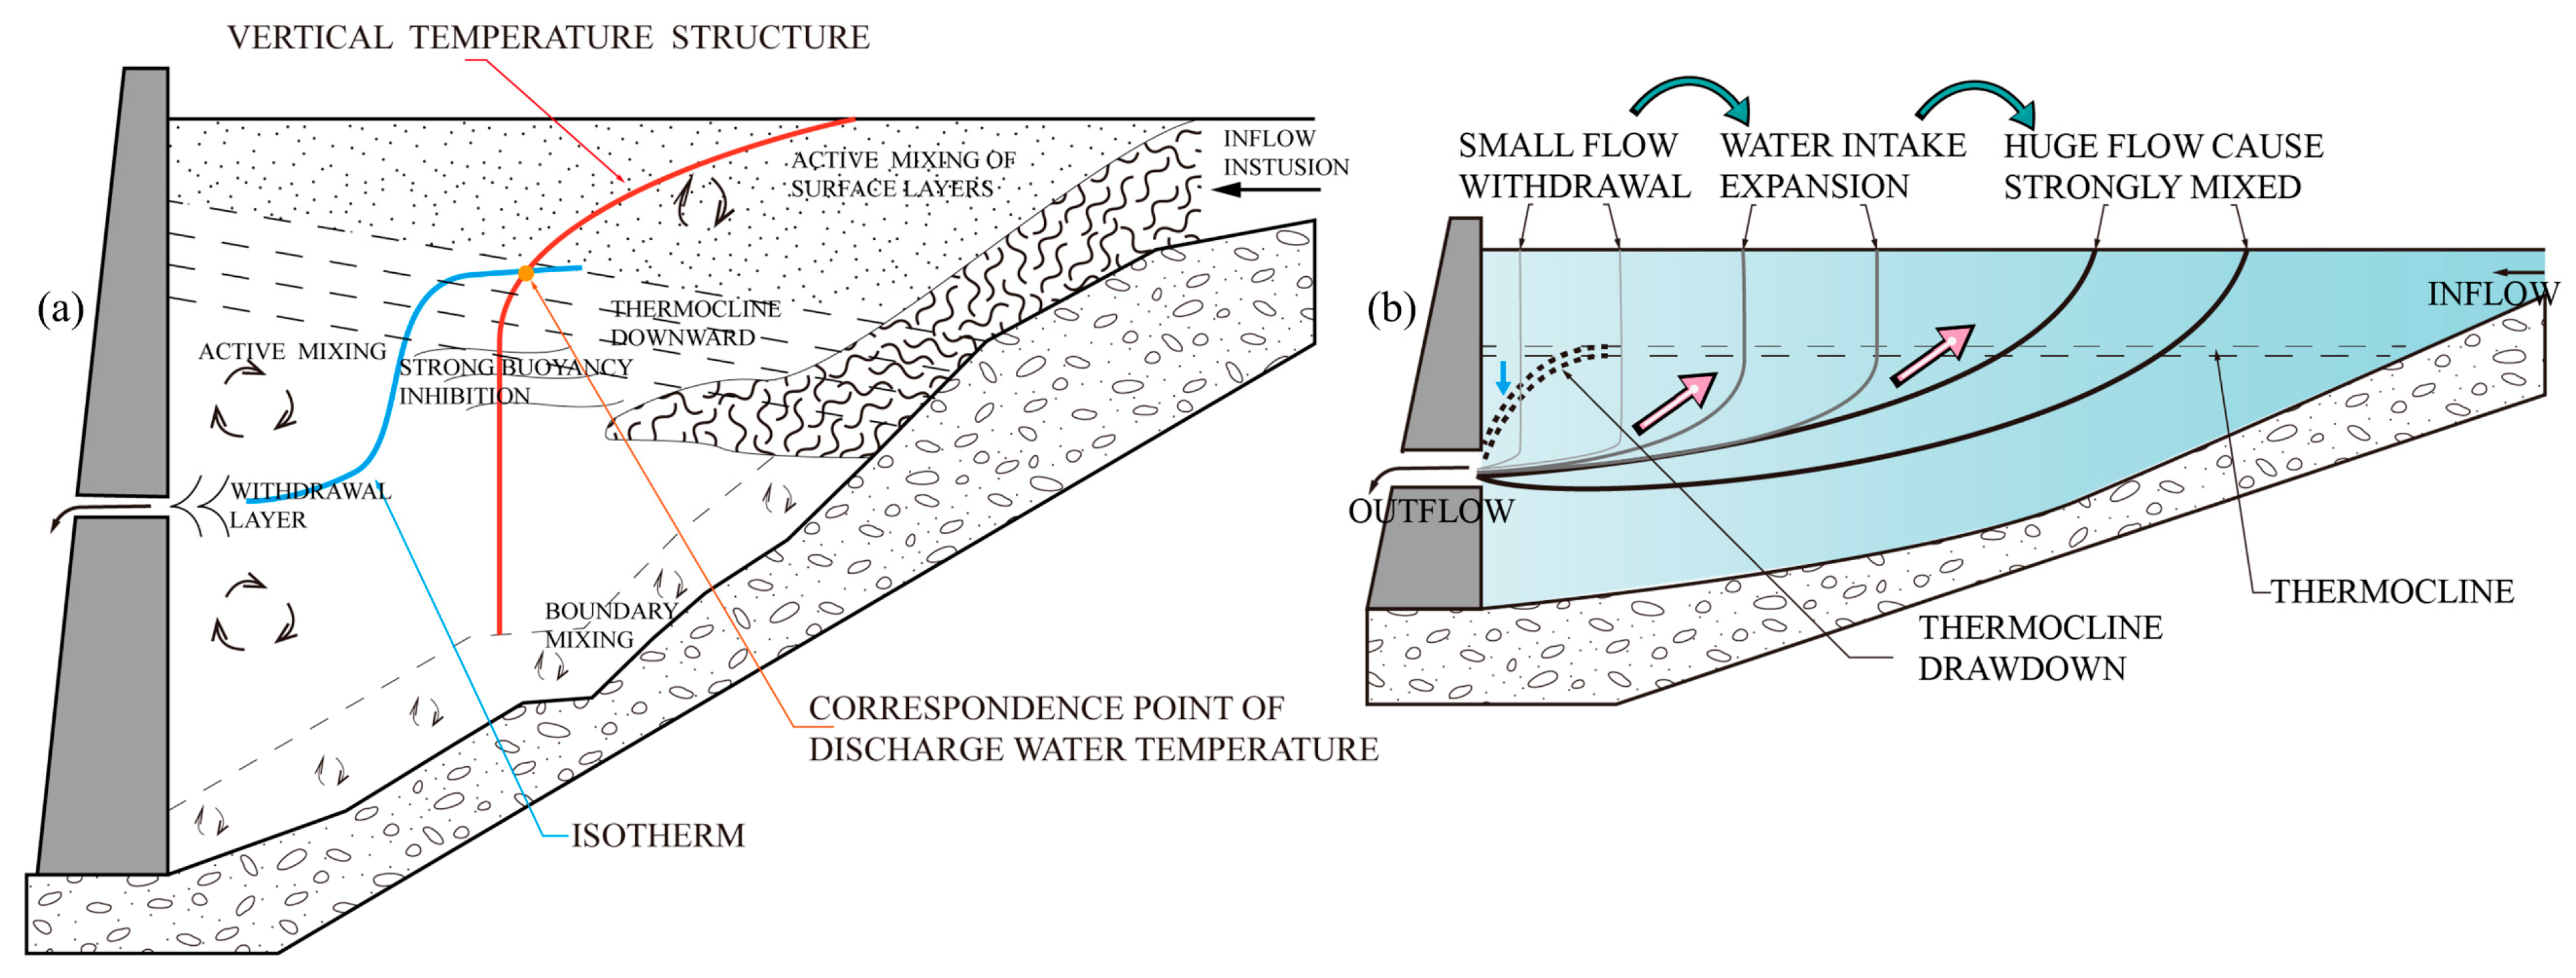
Related studies have shown [7,35,36] that the DWT is coupled by the hydrodynamic and temperature fields in front of the inlet, and there are many possible types of vertical mixing in a certain range in front of the dam during selective withdrawal, such as a downward shift of the oblique thermocline and internal fluctuations due to hydrodynamic pumping [37] (Figure 4a). Meanwhile, some scholars found [8,10] that the vertical-temperature distribution structure is the main factor affecting vertical mixing, and the density difference caused by temperature stratification leads to the emergence of buoyancy hindrance between the fetching layers. When the discharge flow is small, it is difficult for the hydraulic action to break the buoyancy limitation [38], which hinders vertical mixing, making the discharged-water body mainly form a thin horizontal layer in a small area near the outlet. With the increase in the discharge flow, the effect of hydraulic pumping gradually outweighs the persistent buoyancy effect, and the withdrawal layer gradually expands, and is even able to completely counteract the buoyancy effect and produce strong mixing before the dam, where the water body may be extracted from more than one withdrawal layer (Figure 4b).
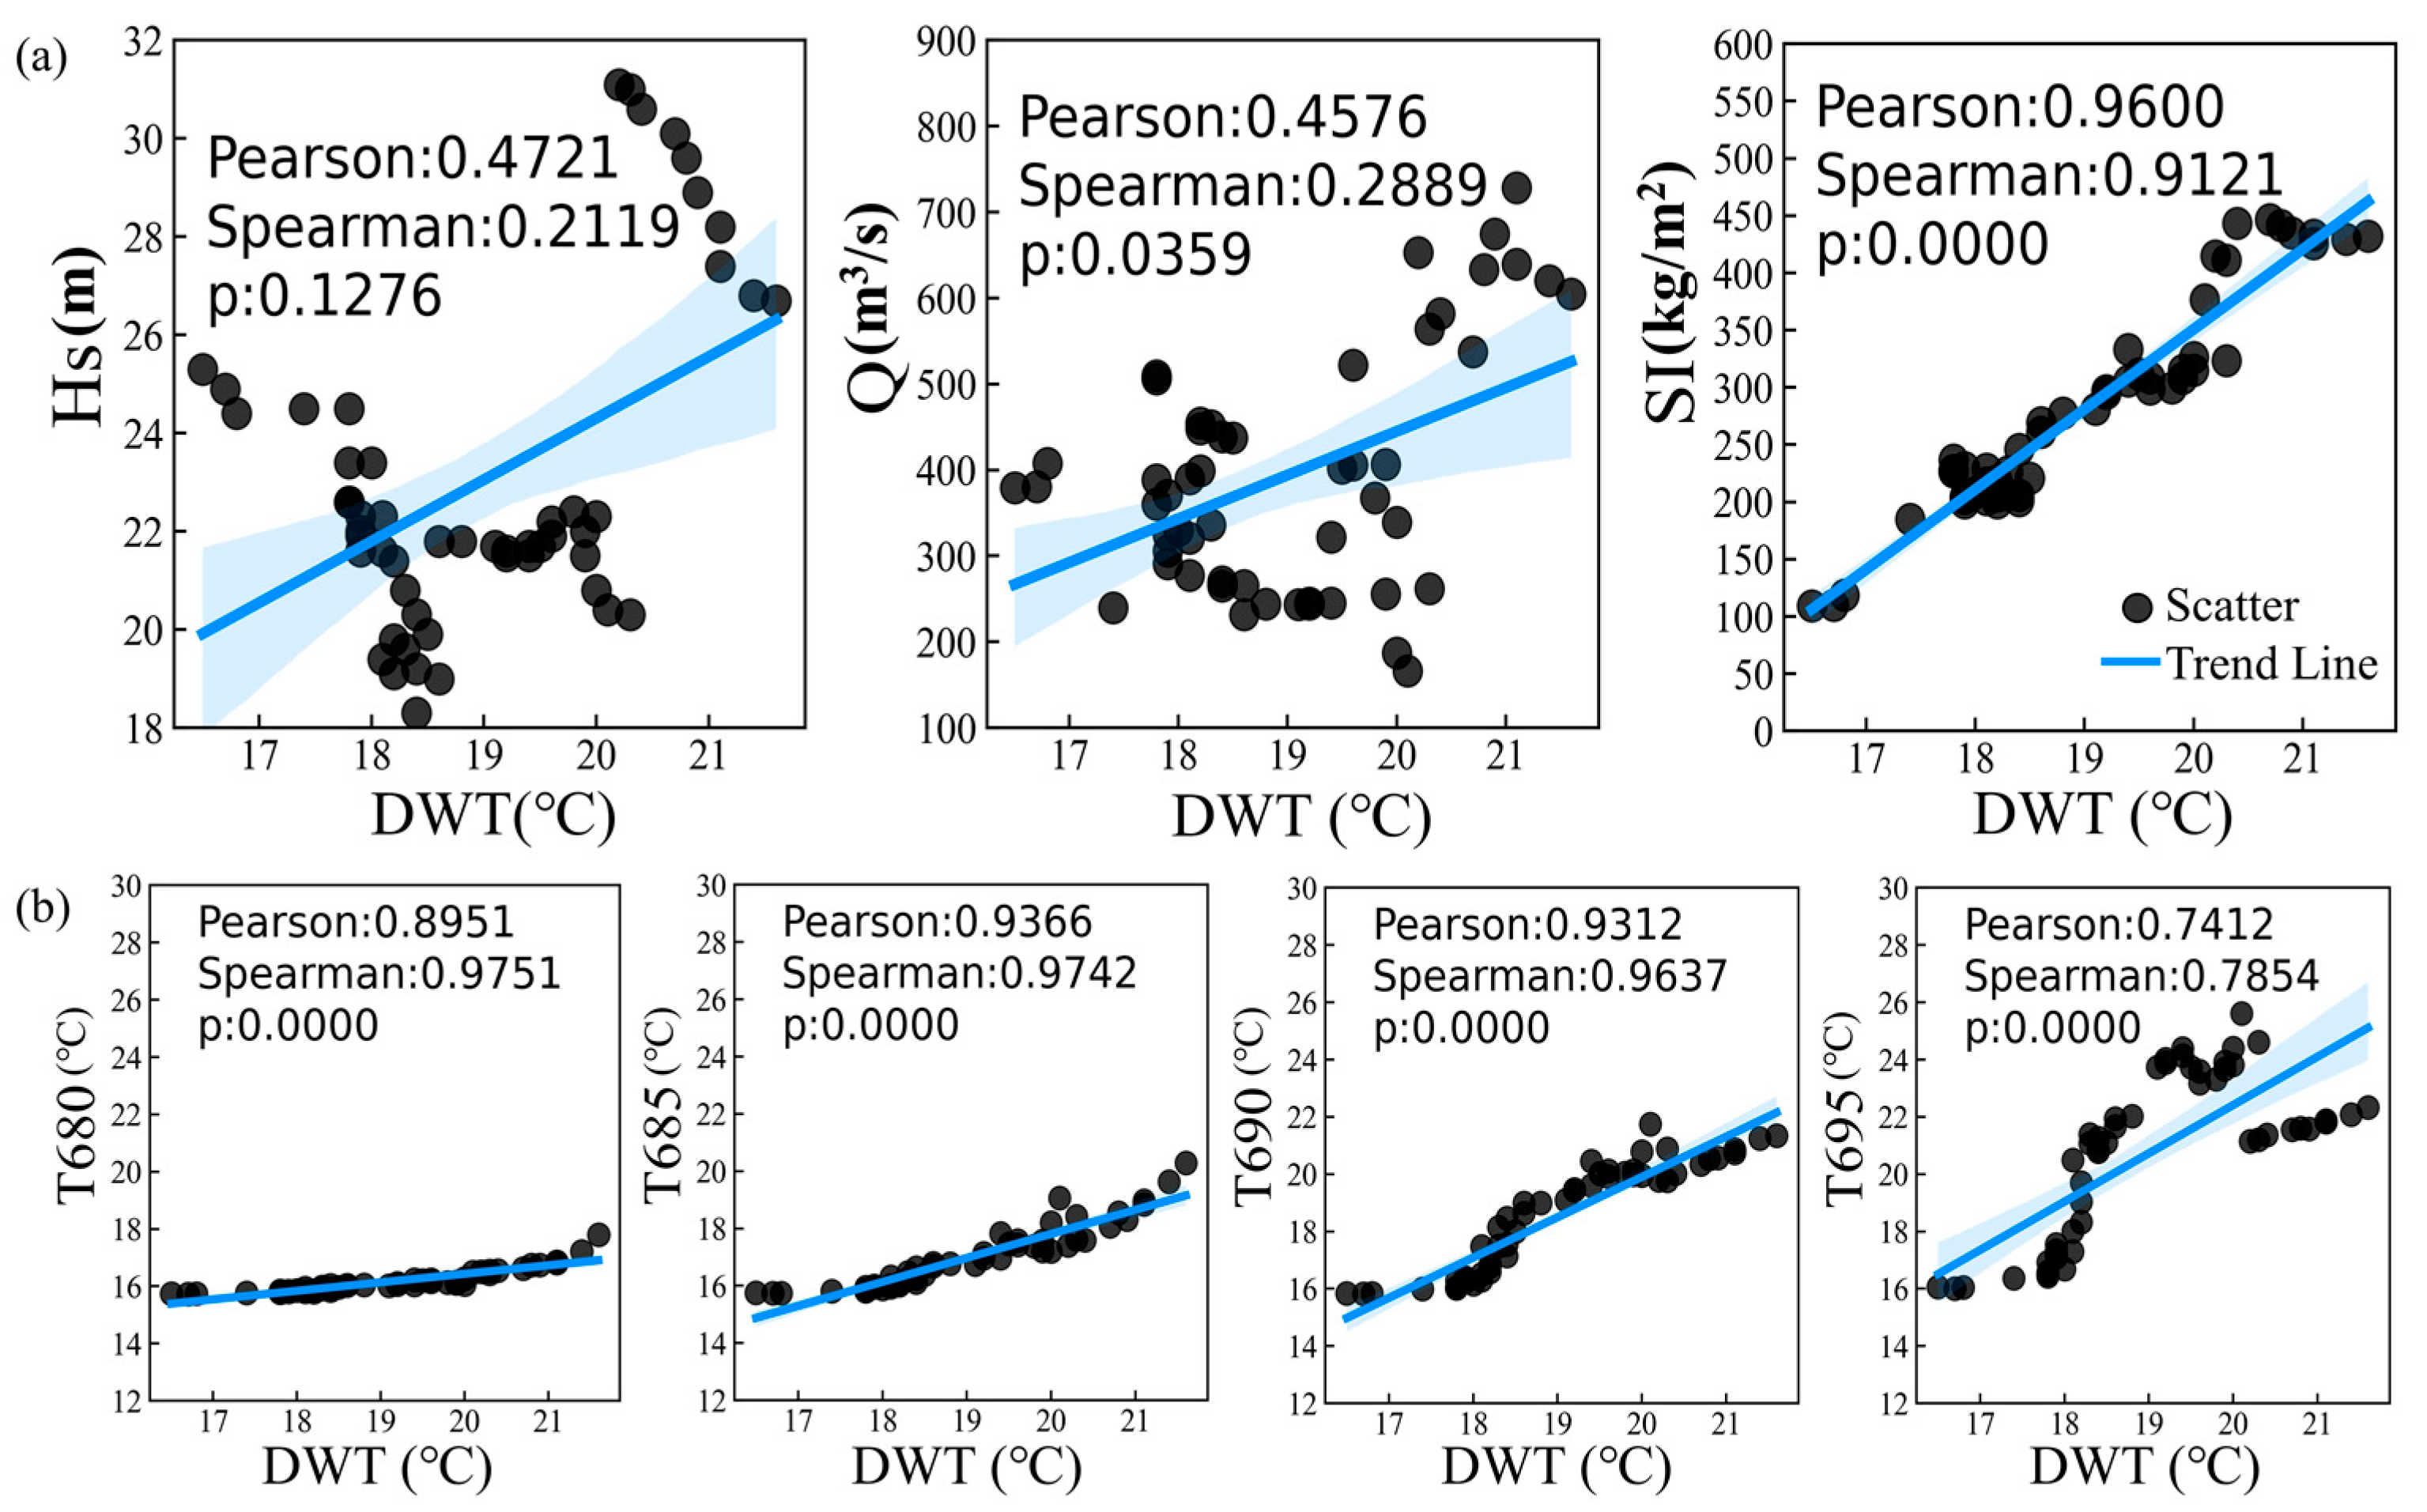
Given that the selective DWT is the result of mixing the water temperature in each intake layer, there is a linear or nonlinear relationship with the inundation depth (Hs), water stability index (SI), intake flow (Q), and vertical-water-temperature structure (Figure 5).
The calculated results indicate that there is no significant correlation between DWT and Hs (p > 0.05). There is a weak correlation between DWT and Q (r = 0.2889, p < 0.05), suggesting that changes in withdrawal flow have a minor effect on DWT. A strong correlation between DWT and SI (r = 0.96, p < 0.05) suggests a strong relationship with the development of the vertical-water-temperature structure (Figure 5a). Further calculations of the water temperature at the elevations where the thermocline is concentrated (T680, T685, T690, T695) in relation to DWT (Figure 5b) showed correlation coefficients of 0.9751, 0.9742, 0.9637, and 0.7854, respectively. The temperatures at these elevations within the thermocline show a significant positive correlation with DWT (r > 0.7, p < 0.05), indicating that the DWT increases as the thermal structure of the reservoir develops.
In the actual operation of the reservoir, changes in boundary conditions such as vertical-stratification strength and withdrawal flow will cause frequent fluctuations in the DWT. Most of the current analysis methods for the application effect of the stoplog gate only focus on the changes in the DWT, ignoring the close connection between the DWT and various factors on the dam, and cannot explore the connections between the monitoring data, which makes it difficult to reflect the water-withdrawal elevation or withdrawal range of each layer of the stoplog gate and has a limited effect on the optimization of scheduling.

3.3. Evaluation of Selective Withdrawal Effects

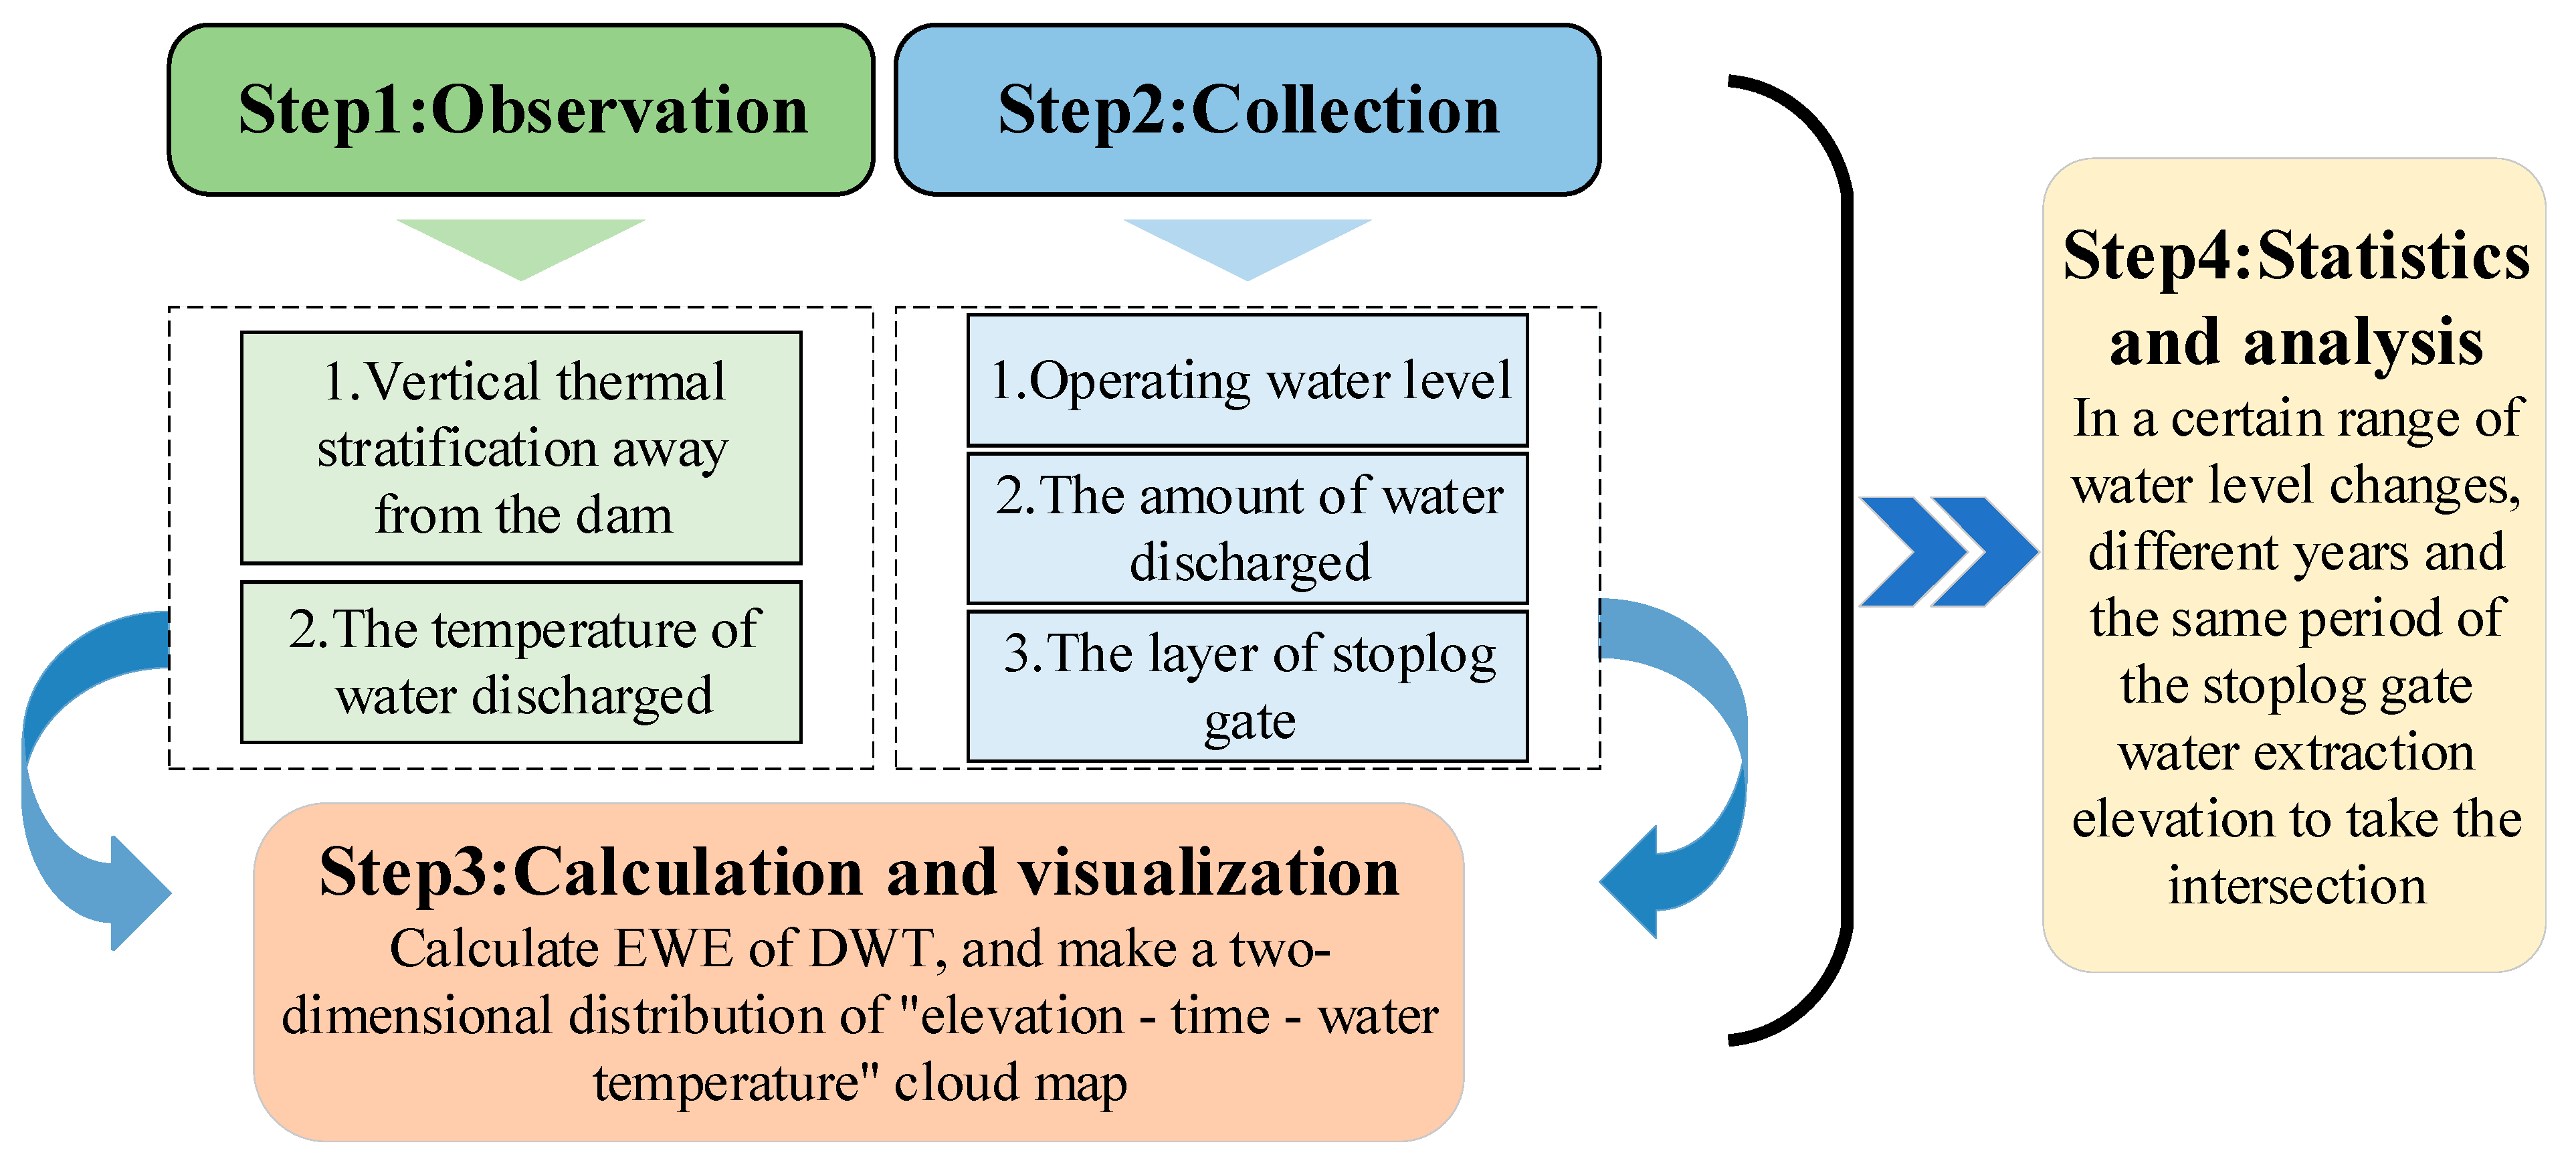
In most cases, considering engineering and ecological constraints such as the difficulty of opening and closing the stoplog gate and the downstream-water-temperature demand, it is difficult for us to observe and evaluate the effectiveness of using the stoplog gate by conducting similar comparative tests of stratified water withdrawal. Here, we introduce the EEM, based on the advantages that the area far from the dam is not easily disturbed by the complex hydraulic relationship in front of the intake, has a stable vertical-water-temperature structure, and the range of the flow layer fluctuates little [38]. Based on real-time monitoring data of the DWT, we aim to identify the elevation of temperature points (Figure 4a) that correspond to the DWT in the remote dam area as the equivalent withdrawal elevation (EWE) to comprehensively characterize the response relationship between the DWT and the vertical-water-temperature structure. This can assist managers in quickly determining the location of the mainstream layer of the reservoir discharge and evaluating and analyzing the effect of stratified water withdrawal at the stoplog gate in the form of withdrawal elevation or withdrawal-layer range. The location of the EWE of the DWT at a certain moment can be determined using interpolation after searching for the temperature interval from the surface to the bottom of the vertical-temperature chain at the corresponding moment. The application process of the EEM is shown in Figure 6.
Z = Z v n + T T v n T v n + 1 T v n Z v n + 1 Z v n
where Z represents the EWE; Zvn and Zvn+1 represent the elevation of two adjacent points on the vertical-temperature chain; Tvn and Tvn+1 represent the adjacent-point water-temperature values; and T represents the DWT.
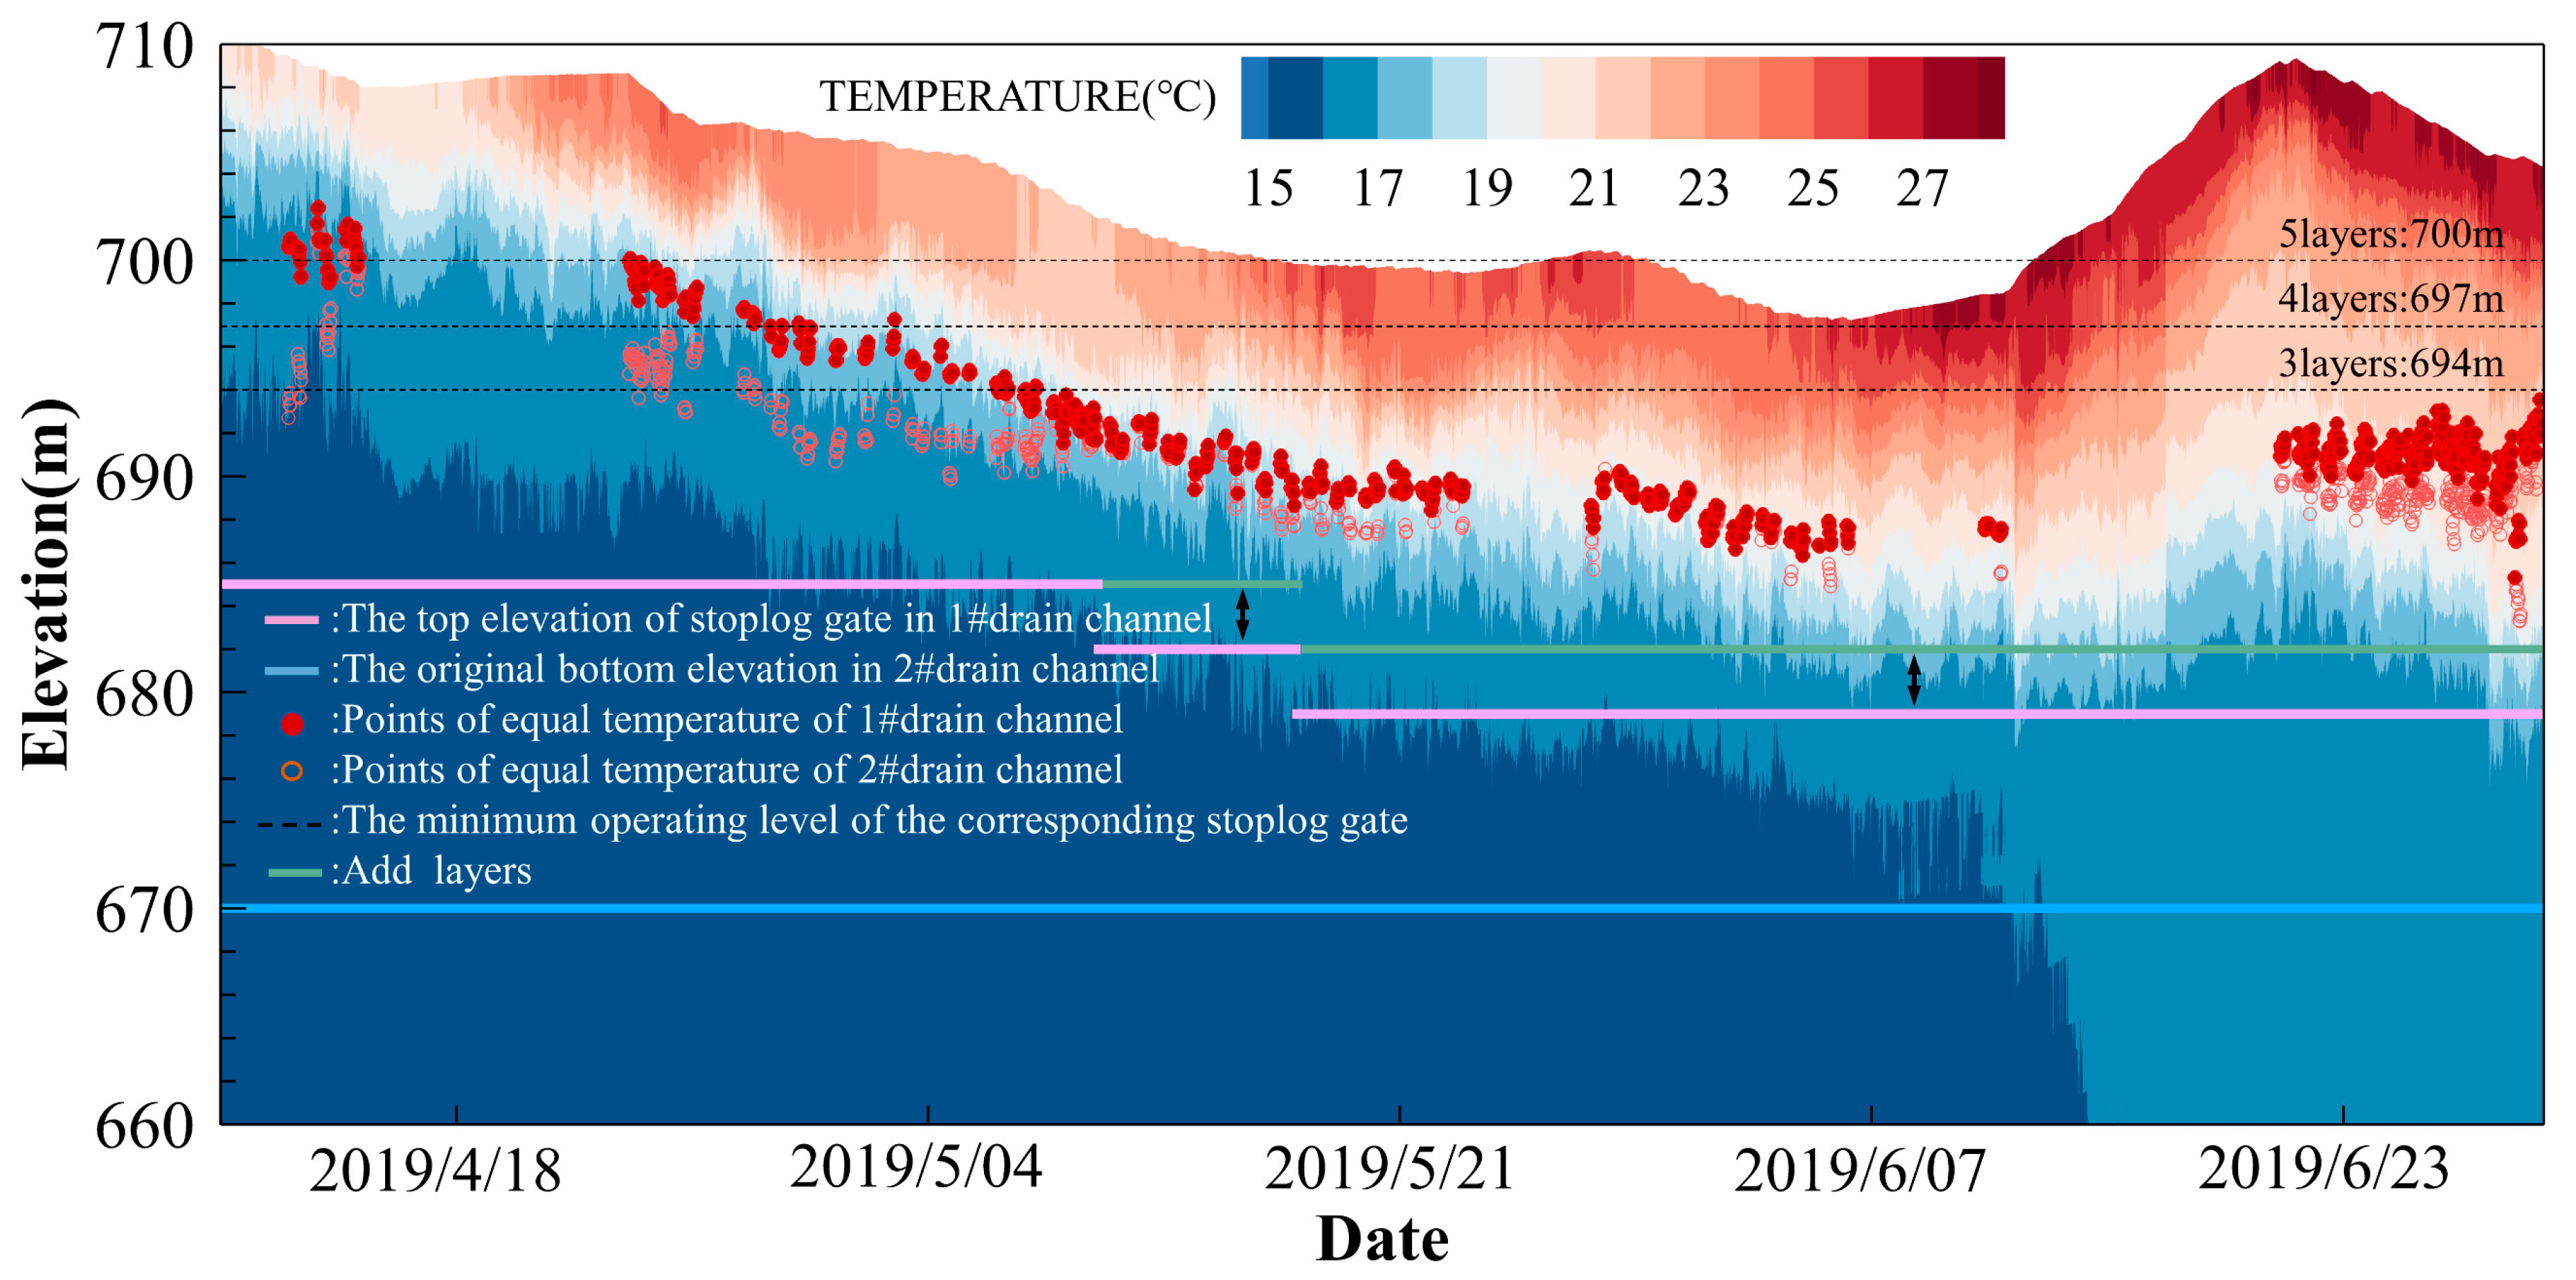
Using the water-temperature data discharged from drainage channels #1 and #2, the vertical-temperature data away from the dam area, and the reservoir scheduling and other related information from 12 April to 30 June 2019, in GZ, the equivalent elevation corresponding to the daily DWT is calculated. Combined with Figure 2a, the two-dimensional distribution cloud map of “elevation–time–water temperature” is further constructed (Figure 7). The results in the figure show that during the test period, the distribution range of water-temperature-elevation points far from the inlet area corresponding to the DWT of the drainage channel, #2 without the use of stoplog-door selective water intake, is 685.5 m–699.8 m, and the average water-intake height is 690.4 m, which is located 20.4 m above the original inlet floor elevation of 670 m. The average elevation of the water-temperature-elevation point corresponding to the DWT of drainage channel #1 using the stoplog gate is 692.2 m, which is 22.2 m above the elevation of 670 m, which is 1.8 m higher than the elevation when there is no stoplog-gate selective water extraction. The effect is especially obvious when the 5-layer stoplog gate is in operation. At this time, the water temperature in the reservoir area shows a strong single-thermocline structure (Figure 2b), and the average vertical-temperature difference is 7.30 °C. The equivalent elevation corresponding to the DWT is located in the range of 692.6 m–700.7 m. The average temperature gradient is 0.38 °C/m, and the average water-intake elevation is 696.6 m, which is 3.4 m higher than the elevation of 693.2 m when there is no stoplog-gate selective water intake.
The EWE is affected by the weakening of vertical convection, and it is difficult to break through the buoyancy limit to reach the higher-water-temperature layer. During the 5-layer stoplog-gate operation time, the water level drops from 710.3 m to 703.3 m; the reservoir water-temperature-stratification intensity changes from weak to strong; the average vertical-temperature difference is 7.30 °C; and the temperature-leap layer gradually moves downward. The diversion channel 1# discharge-water temperature EWE is mainly distributed in the 17 °C–19 °C temperature layer, with an average temperature gradient of 0.54 °C/m and an average buoyancy frequency of 0.03 s−1. As the water level decreases and the thermocline layer descends, the EWE also gradually decreases, resulting in a wide range of changes during the time period. The diversion channel 2# EWE distribution is similar to that of 1#. The water-temperature stratification was further strengthened when the 4-layer and 3-layer stoplog gates were used (Figure 2b), and the lower edge of the thermocline gradually stabilized near an elevation of 685 m. The enhanced stratification strength gradually suppressed the fluctuation range of the EWE. The average temperature gradient of its distribution points was 0.53 °C/m and 0.42 °C/m, and the average buoyancy frequency was 0.03 s−1 (Figure 2c). In addition, four units generated electricity at the same time in the late stage of the test (Figure 3c), and the hydraulic pumping effect brought on by the increased water-withdrawal flow helped to overcome the inhibitory effect of buoyancy. The water-withdrawal elevation of the stoplog gate broke through the lower layer of the double-temperature leap layer (Figure 2b), and the temperature gradient was reduced instead, but the influence of the increased hydraulic effect was limited, and the inhibitory effect caused by the vertical-water-temperature stratification still dominated (Figure 7).
In general, the proposed EEM effectively avoids the complex combination of flow and temperature fields in front of the inlet by finding the DWT that corresponds to the temperature mass of the flow layer in the far dam area and establishing the response relationship between the DWT and the vertical-water-temperature structure of the dam. The EWE during the test period was generally distributed along the edge of the thermocline, with stable elevation fluctuation and a buoyancy frequency of approximately 0.03 s−1 at the distribution points. The vertical stratification has a strong limiting effect on the development of the fetch layer to the surface layer. In practical applications, the EWE form (Table 2) combined with information on the vertical-water-temperature structure and temperature-gradient distribution can effectively reflect the effect of stoplog-gate operation. However, it is worth noting that EEM is mainly applicable to the water-temperature-stratification period of the reservoir, and seeking temperature-mass points in the vertical isothermal situation is not feasible. In the early stage of the test, the #2 water-intake EWE is mainly distributed in the temperature layer of 16 °C–17 °C, which has a large span and a small vertical-temperature gradient, making it easy to produce errors when searching for isothermal mass points, resulting in large fluctuations. The search for temperature masses from the water surface downward causes the average withdrawal elevation of the bottom water intake at this stage to be high (Table 2). Such a situation mainly occurs during the development of the thermocline. Improving the monitoring resolution, accuracy, and frequency can solve this problem effectively.

3.4. Optimization of the Stoplog-Gate Scheduling

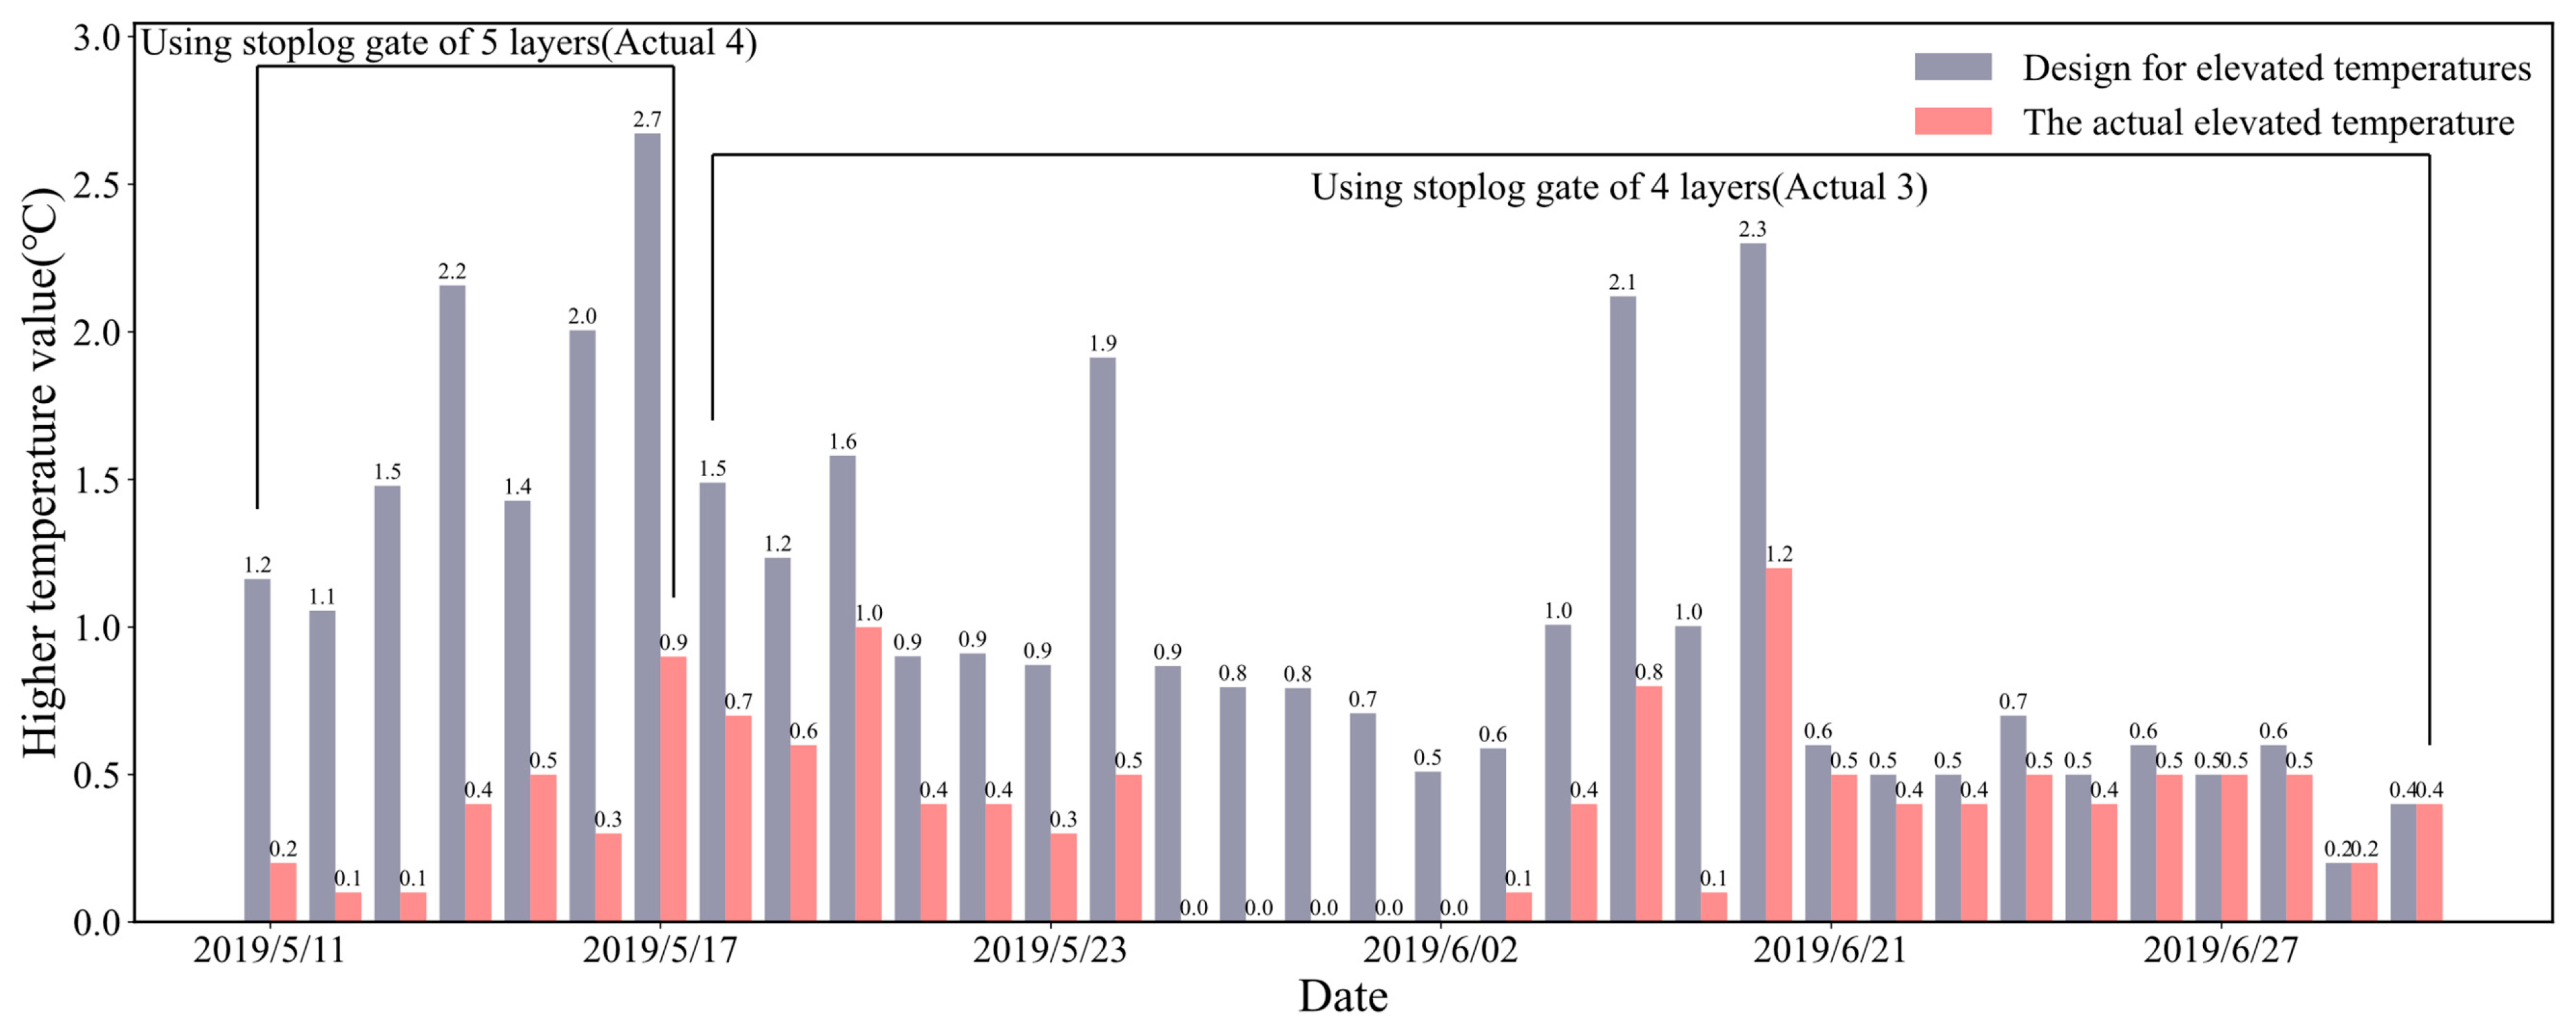
The operation scheme of using a stoplog gate for selective water intake needs to comprehensively consider the constraints of the project. On this basis, priority is given to meeting the water-temperature requirements of downstream-river organisms. At the same time, combined with the principle of avoiding frequent lifting and lowering of the stoplog gate, the optimization scheme of stoplog-gate scheduling for the test period of GZ is proposed according to Section 3.3. During the operation period of the 4-layer and 3-layer laminated beam gates, the operating water level of GZ fluctuates within the ranges of 710.0 m–702.8 m and 699.3 m–710.1 m, respectively. The water level meets the water-level requirements when using 5-layer stoplog gates (submerged depth is 685 m + 15 m) and 4-layer stoplog gates (submerged depth is 682 m + 15 m). We assume that the use time of the 5-layer stoplog gates is extended to 17 May, and the use time of the 4-layer stoplog gates is extended to 30 June. According to the average water-intake elevation of the 5-layer stoplog gate and the 4-layer stoplog gate obtained in Section 3.3, the water-temperature process at the average water-intake elevation during the extended period is compared with the observed DWT process without the stoplog gate. It can be deduced that the use of the 5-layer stoplog gate from 11 May to 17 May can increase the DWT by 1.7 °C, and the use of the 4-layer stoplog gate from 18 May to 30 June can increase the DWT by 0.9 °C (Figure 7). The estimation results show that the optimized stoplog-gate-scheduling scheme is more effective for low-temperature water improvement under the premise of satisfying the inundation depth constraint (Figure 8). However, the average withdrawal elevation of the stoplog gate in the case of high water level and weak stratification in the early stage to predict the DWT process during the next stage of water-level changes and enhanced stratification strength tends to overestimate the effectiveness of the stoplog gate, and it is difficult to achieve the 1.7 °C improvement in actual application. While the operation of the stoplog gate will change the vertical-water-temperature structure to a certain extent, so that the upper layer of water is mixed, the surface-water-temperature downward trend, and oblique temperature-layer-position downward also have a certain impact on the water-extraction elevation. A more appropriate optimization should be based on the evaluation of the effect of stoplog-gate operation in the same period in different years (EEM).
Our proposed EEM has been successfully applied in stratified reservoirs such as GZ in China, demonstrating its suitability for such reservoirs. Although differences in climate and water availability between years may cause some fluctuations in EWE, the method is generally stable and responsive to the vertical-water-temperature structure and is distributed within a certain range of water withdrawal. With growing concern over the ecological issues arising from thermal pollution in reservoirs, data on the vertical-water-temperature structure and discharge-water temperature in front of the reservoir are being accumulated. By continuing high-frequency water-temperature monitoring and using the EEM method, the average withdrawal elevation or withdrawal layer for each layer of the stoplog gate can be calculated within a certain range of water-level changes based on the monitoring data of the water-level-change range, vertical-water-temperature structure, and DWT during the same period in different years. This provides a reference for optimizing the scheduling plan of the stoplog gate.

4. Conclusions

The use of stoplog gates for selective water intake is an effective means to solve the problem of downstream thermal pollution caused by reservoir-water-temperature stratification. However, how to comprehensively and effectively evaluate the stratified-water-intake effect of stoplog gates and further optimize the operation of stoplog gates has always been a complicated problem for reservoir managers. Based on the stratified-water-intake test carried out in GZ, the DWT of two drainage channels (with or without a stoplog gate) is compared and analyzed. EEM is proposed to evaluate and analyze the operational effectiveness of the stoplog gate. The research results provide a new idea for the operational evaluation of stratified-water-intake facilities and provide a reference method for managers to optimize the scheduling scheme of stoplog gates. The main conclusions are as follows:
(1)
The water-temperature distribution in the reservoir area of GZ showed a stable stratification structure during the test period, and the stratification intensity gradually strengthened. The SI varied between 109.36 kg/m2 and 446.85 kg/m2. The DWT of the drainage channel with 3–5 layers of stoplog gates was 1.4 °C higher than that of the drainage channel with the original bottom water inlet, with an average increase of 0.6 °C. This shows that the stoplog gate plays an important role in mitigating the adverse effects of water temperature in GZ.
(2)
We proposed EEM to evaluate and analyze the stratified-water-intake effect of the stoplog gate and analyzed and demonstrated it based on the observation data in the stratified-water-intake test of the GZ. The stratified-water-intake effect is reflected by the water-intake elevation or the water-intake-layer range. For example, the water-intake layer range of the 4-layer stoplog gate is 689.8 m–691.7 m, and the average water-intake elevation is 690.8 m. The results show that this method is simple to use, can reflect the operation of the stoplog door, and has good practicability.
(3)
EEM is used to analyze the monitoring data to statistically interpret the average water-intake elevation or water-intake layer within a certain range of water-level changes when different layers of stoplog gates are operated, which has value as a reference for optimizing stoplog-gate scheduling.

Future Perspectives

EEM requires a continuous layout of monitoring equipment to provide real-time water-temperature data and requires high-accuracy monitoring instruments, which have certain limitations. While strengthening the development and application of monitoring instruments, follow-up work can consider combining the current popular artificial-intelligence model to realize the dynamic visualization of elevation points, analyze the operational effectiveness of stoplog gates in real time, and simultaneously predict the future situation to further guide the operation of stoplog gates.

Author Contributions

Conceptualization, L.L., Y.T., Y.D. and H.W.; Methodology, L.L., Y.T., H.X., Y.D., X.Z. and H.W.; Software, L.L. and X.Z.; Validation, Y.D.; Formal analysis, L.L. and Y.T.; Investigation, L.L., Y.T., Y.D., X.Z. and H.W.; Data curation, H.X. and X.Z.; Writing—original draft, L.L. and H.W.; Writing—review & editing, L.L., Y.T., H.X. and Y.D.; Visualization, L.L.; Supervision, H.X. and Y.D.; Funding acquisition, Y.T. All authors have read and agreed to the published version of the manuscript.

Funding

The financial support for this study was made available from the National Key Research and Development Program of China (2022YFC3202500).

Data Availability Statement

The data that support the findings of this study are available from the corresponding author upon reasonable request.

Conflicts of Interest

Author Hao Xia was employed by the company Power Construction Corporation of China Guiyang Engineering Corporation Limited. The remaining authors declare that the research was conducted in the absence of any commercial or financial relationships that could be construed as a potential conflict of interest.

References

  1. Yigzaw, W.; Li, H.; Fang, X.; Leung, L.R.; Voisin, N.; Hejazi, M.I.; Demissie, Y. A Multilayer Reservoir Thermal Stratification Module for Earth System Models. J. Adv. Model. Earth Syst. 2019, 11, 3265–3283. [Google Scholar] [CrossRef]
  2. Lugg, A.; Copeland, C. Review of cold water pollution in the Murray-Darling Basin and the impacts on fish communities. Ecol. Manag. Restor. 2014, 15, 71–79. [Google Scholar] [CrossRef]
  3. Moore, M.J.; Paukert, C.P.; Brooke, B.L.; Moore, T.L. Lake sturgeon seasonal movements in regulated and unregulated Missouri River tributaries. Ecohydrology 2022, 15, e2362. [Google Scholar] [CrossRef]
  4. Ren, L.; Song, C.; Wu, W.; Guo, M.; Zhou, X. Reservoir effects on the variations of the water temperature in the upper Yellow River, China, using principal component analysis. J. Environ. Manag. 2020, 262, 110339. [Google Scholar] [CrossRef]
  5. He, W.; Wang, H.; Zhang, J.; Xu, H.; Xiao, Y. Diurnal variation characteristics of thermal structure in a deep reservoir and the effects of selective withdrawal. J. Environ. Manag. 2023, 333, 117459. [Google Scholar] [CrossRef] [PubMed]
  6. Zheng, T.; Sun, S.; Liu, H.; Xia, Q.; Zong, Q. Optimal control of reservoir release temperature through selective withdrawal intake at hydropower dam. Water Supply 2017, 17, 279–299. [Google Scholar] [CrossRef]
  7. Gao, X.; Li, G.; Han, Y. Effect of Flow Rate of Side-Type Orifice Intake on Withdrawn Water Temperature. Sci. World J. 2014, 2014, 979140. [Google Scholar] [CrossRef] [PubMed]
  8. He, W.; Lian, J.; Du, H.; Ma, C. Source tracking and temperature prediction of discharged water in a deep reservoir based on a 3-D hydro-thermal-tracer model. J. Hydro-Environ. Res. 2018, 20, 9–21. [Google Scholar] [CrossRef]
  9. Dehghan, A.A.; Dehghani, A.R. Experimental and theoretical investigation of thermal performance of underground cold-water reservoirs. Int. J. Therm. Sci. 2011, 50, 816–824. [Google Scholar] [CrossRef]
  10. Song, Q.; Sun, B.; Gao, X.; Liu, Y. Laboratory investigation on the influence of factors on the outflow temperature from stratified reservoir regulated by temperature control curtain. Environ. Sci. Pollut. Res. 2020, 27, 33052–33064. [Google Scholar] [CrossRef]
  11. Larabi, S.; Schnorbus, M.A.; Zwiers, F. A coupled streamflow and water temperature (VIC-RBM-CE-QUAL-W2) model for the Nechako Reservoir. J. Hydrol. Reg. Stud. 2022, 44, 101237. [Google Scholar] [CrossRef]
  12. Wang, H.; Deng, Y.; Yan, Z.; Yang, Y.; Tuo, Y. Thermal response of a deep monomictic reservoir to selective withdrawal of the upstream reservoir. Ecol. Eng. 2023, 187, 106864. [Google Scholar] [CrossRef]
  13. Çalışkan, A.; Elçi, Ş. Effects of Selective Withdrawal on Hydrodynamics of a Stratified Reservoir. Water Resour. Manag. 2009, 23, 1257–1273. [Google Scholar] [CrossRef]
  14. Zhang, S.; Gao, X. Effects of Selective Withdrawal on Temperature of Water Released of Glen Canyon Dam. In Proceedings of the 2010 4th International Conference on Bioinformatics and Biomedical Engineering (iCBBE), Chengdu, China, 18–20 June 2010; pp. 1–4. [Google Scholar] [CrossRef]
  15. Huang, L.; Wang, J.; Zhu, L.; Ju, J.; Daut, G. The Warming of Large Lakes on the Tibetan Plateau: Evidence From a Lake Model Simulation of Nam Co, China, During 1979–2012: Thermal Simulation in a Tibet Lake. J. Geophys. Res. Atmos. 2017, 122, 13095–13107. [Google Scholar] [CrossRef]
  16. Huang, T.; Li, X.; Rijnaarts, H.; Grotenhuis, T.; Ma, W.; Sun, X.; Xu, J. Effects of storm runoff on the thermal regime and water quality of a deep, stratified reservoir in a temperate monsoon zone, in Northwest China. Sci. Total Environ. 2014, 485–486, 820–827. [Google Scholar] [CrossRef]
  17. Zhang, D.; Wang, D.; Peng, Q.; Lin, J.; Jin, T.; Yang, T.; Sorooshian, S.; Liu, Y. Prediction of the outflow temperature of large-scale hydropower using theory-guided machine learning surrogate models of a high-fidelity hydrodynamics model. J. Hydrol. 2022, 606, 127427. [Google Scholar] [CrossRef]
  18. Vercauteren, N.; Huwald, H.; Bou-Zeid, E.; Selker, J.S.; Lemmin, U.; Parlange, M.B.; Lunati, I. Evolution of superficial lake water temperature profile under diurnal radiative forcing: Lake Temperature Profile Under Radiative Forcing. Water Resour. Res. 2011, 47, W09522. [Google Scholar] [CrossRef]
  19. Yang, P.; Xing, Z.; Fong, D.A.; Monismith, S.G.; Tan, K.M.; Lo, E.Y.M. Observations of vertical eddy diffusivities in a shallow tropical reservoir. J. Hydro-Environ. Res. 2015, 9, 441–451. [Google Scholar] [CrossRef]
  20. Chang, F.; Hou, P.; Wen, X.; Duan, L.; Zhang, Y.; Zhang, H. Seasonal Stratification Characteristics of Vertical Profiles and Water Quality of Lake Lugu in Southwest China. Water 2022, 14, 2554. [Google Scholar] [CrossRef]
  21. Yang, X.; Li, Y.; Wang, B.; Xiao, J.; Yang, M.; Liu, C.-Q. Effect of hydraulic load on thermal stratification in karst cascade hydropower reservoirs, Southwest China. J. Hydrol. Reg. Stud. 2020, 32, 100748. [Google Scholar] [CrossRef]
  22. Zhang, Y.; Wu, Z.; Liu, M.; He, J.; Shi, K.; Wang, M.; Yu, Z. Thermal structure and response to long-term climatic changes in Lake Qiandaohu, a deep subtropical reservoir in China. Limnol. Oceanogr. 2014, 59, 1193–1202. [Google Scholar] [CrossRef]
  23. Liu, M.; Zhang, Y.; Shi, K.; Zhu, G.; Wu, Z.; Liu, M.; Zhang, Y. Thermal stratification dynamics in a large and deep subtropical reservoir revealed by high-frequency buoy data. Sci. Total Environ. 2019, 651, 614–624. [Google Scholar] [CrossRef] [PubMed]
  24. Qi, C.J.; Lu, B.H. Study of the Temporal and Spatial Distribution of Water Temperature in Ertan Reservoir Based on Prototype Observation. Adv. Mater. Res. 2013, 864–867, 2278–2287. [Google Scholar] [CrossRef]
  25. Fu, J.; Li, J.; Rui, J.; Tang, Y. Raising discharge water temperature by using water-level-selection with stoplog gate. J. Tianjin Univ. Sci. Technol. 2014, 47, 589–595. (In Chinese) [Google Scholar] [CrossRef]
  26. Yan, Z.; Lu, J.; Wang, X.; Xu, H.; Chang, H.; Kuang, L.; Huang, Y. Analysis Method of the Influence of Layered Water Intake by Stoplog Gates on Discharge Water Temperature. Water Power 2023, 49, 6–9. (In Chinese) [Google Scholar] [CrossRef]
  27. Wang, Y.; Zhang, N.; Wang, D.; Wu, J. Impacts of cascade reservoirs on Yangtze River water temperature: Assessment and ecological implications. J. Hydrol. 2020, 590, 125240. [Google Scholar] [CrossRef]
  28. Xie, Q.; Liu, Z.; Fang, X.; Chen, Y.; Li, C.; MacIntyre, S. Understanding the Temperature Variations and Thermal Structure of a Subtropical Deep River-Run Reservoir before and after Impoundment. Water 2017, 9, 603. [Google Scholar] [CrossRef]
  29. Dake, J.M.K.; Harleman, D.R.F. Thermal stratification in lakes: Analytical and laboratory studies. Water Resour. Res. 1969, 5, 484–495. [Google Scholar] [CrossRef]
  30. Song, Q.; Sun, B.; Gao, X.; Zhang, C. PIV experimental investigation of the outflow temperature from nonlinearly stratified reservoir regulated by floating intake. Exp. Therm. Fluid Sci. 2019, 109, 109893. [Google Scholar] [CrossRef]
  31. Sahoo, G.B.; Forrest, A.L.; Schladow, S.G.; Reuter, J.E.; Coats, R.; Dettinger, M. Climate change impacts on lake thermal dynamics and ecosystem vulnerabilities: Climate change impacts. Limnol. Oceanogr. 2016, 61, 496–507. [Google Scholar] [CrossRef]
  32. Yang, Y.; Chen, M.; Deng, Y.; Schladow, S.G.; Li, J.; Tuo, Y.-C. Impact of climate change on thermal and mixing regimes in a deep dimictic reservoir on the Qinghai-Tibetan Plateau, China. J. Hydrol. 2021, 603, 127141. [Google Scholar] [CrossRef]
  33. Wang, L.; Xu, B.; Zhang, C.; Fu, G.; Chen, X.; Zheng, Y.; Zhang, J. Surface water temperature prediction in large-deep reservoirs using a long short-term memory model. Ecol. Indic. 2022, 134, 108491. [Google Scholar] [CrossRef]
  34. Wang, J.; Li, C.; Duan, X.; Chen, D.; Feng, S.; Luo, H.; Peng, Q.; Liao, W. Variation in the significant environmental factors affecting larval abundance of four major Chinese carp species: Fish spawning response to the Three Gorges Dam. Freshw. Biol. 2014, 59, 1343–1360. [Google Scholar] [CrossRef]
  35. He, W.; Ma, C.; Zhang, J.; Lian, J.; Wang, S.; Zhao, W. Multi-objective optimal operation of a large deep reservoir during storage period considering the outflow-temperature demand based on NSGA-II. J. Hydrol. 2020, 586, 124919. [Google Scholar] [CrossRef]
  36. Schneider, M.L.; Wilhelms, S.C.; Yates, L.I. SELECT Version 1.0 Beta: A One-Dimensional Reservoir Selective Withdrawal Model Spreadsheet; Defense Technical Information Center: Fort Belvoir, VA, USA, 2004. [Google Scholar] [CrossRef]
  37. Anohin, V.V.; Imberger, J.; Romero, J.R.; Ivey, G.N. Effect of Long Internal Waves on the Quality of Water Withdrawn from a Stratified Reservoir. J. Hydraul. Eng. 2006, 132, 1134–1145. [Google Scholar] [CrossRef]
  38. Fischer, H.B. (Ed.) Mixing in Inland and Coastal Waters; Academic Press: New York, NY, USA, 1979. [Google Scholar]
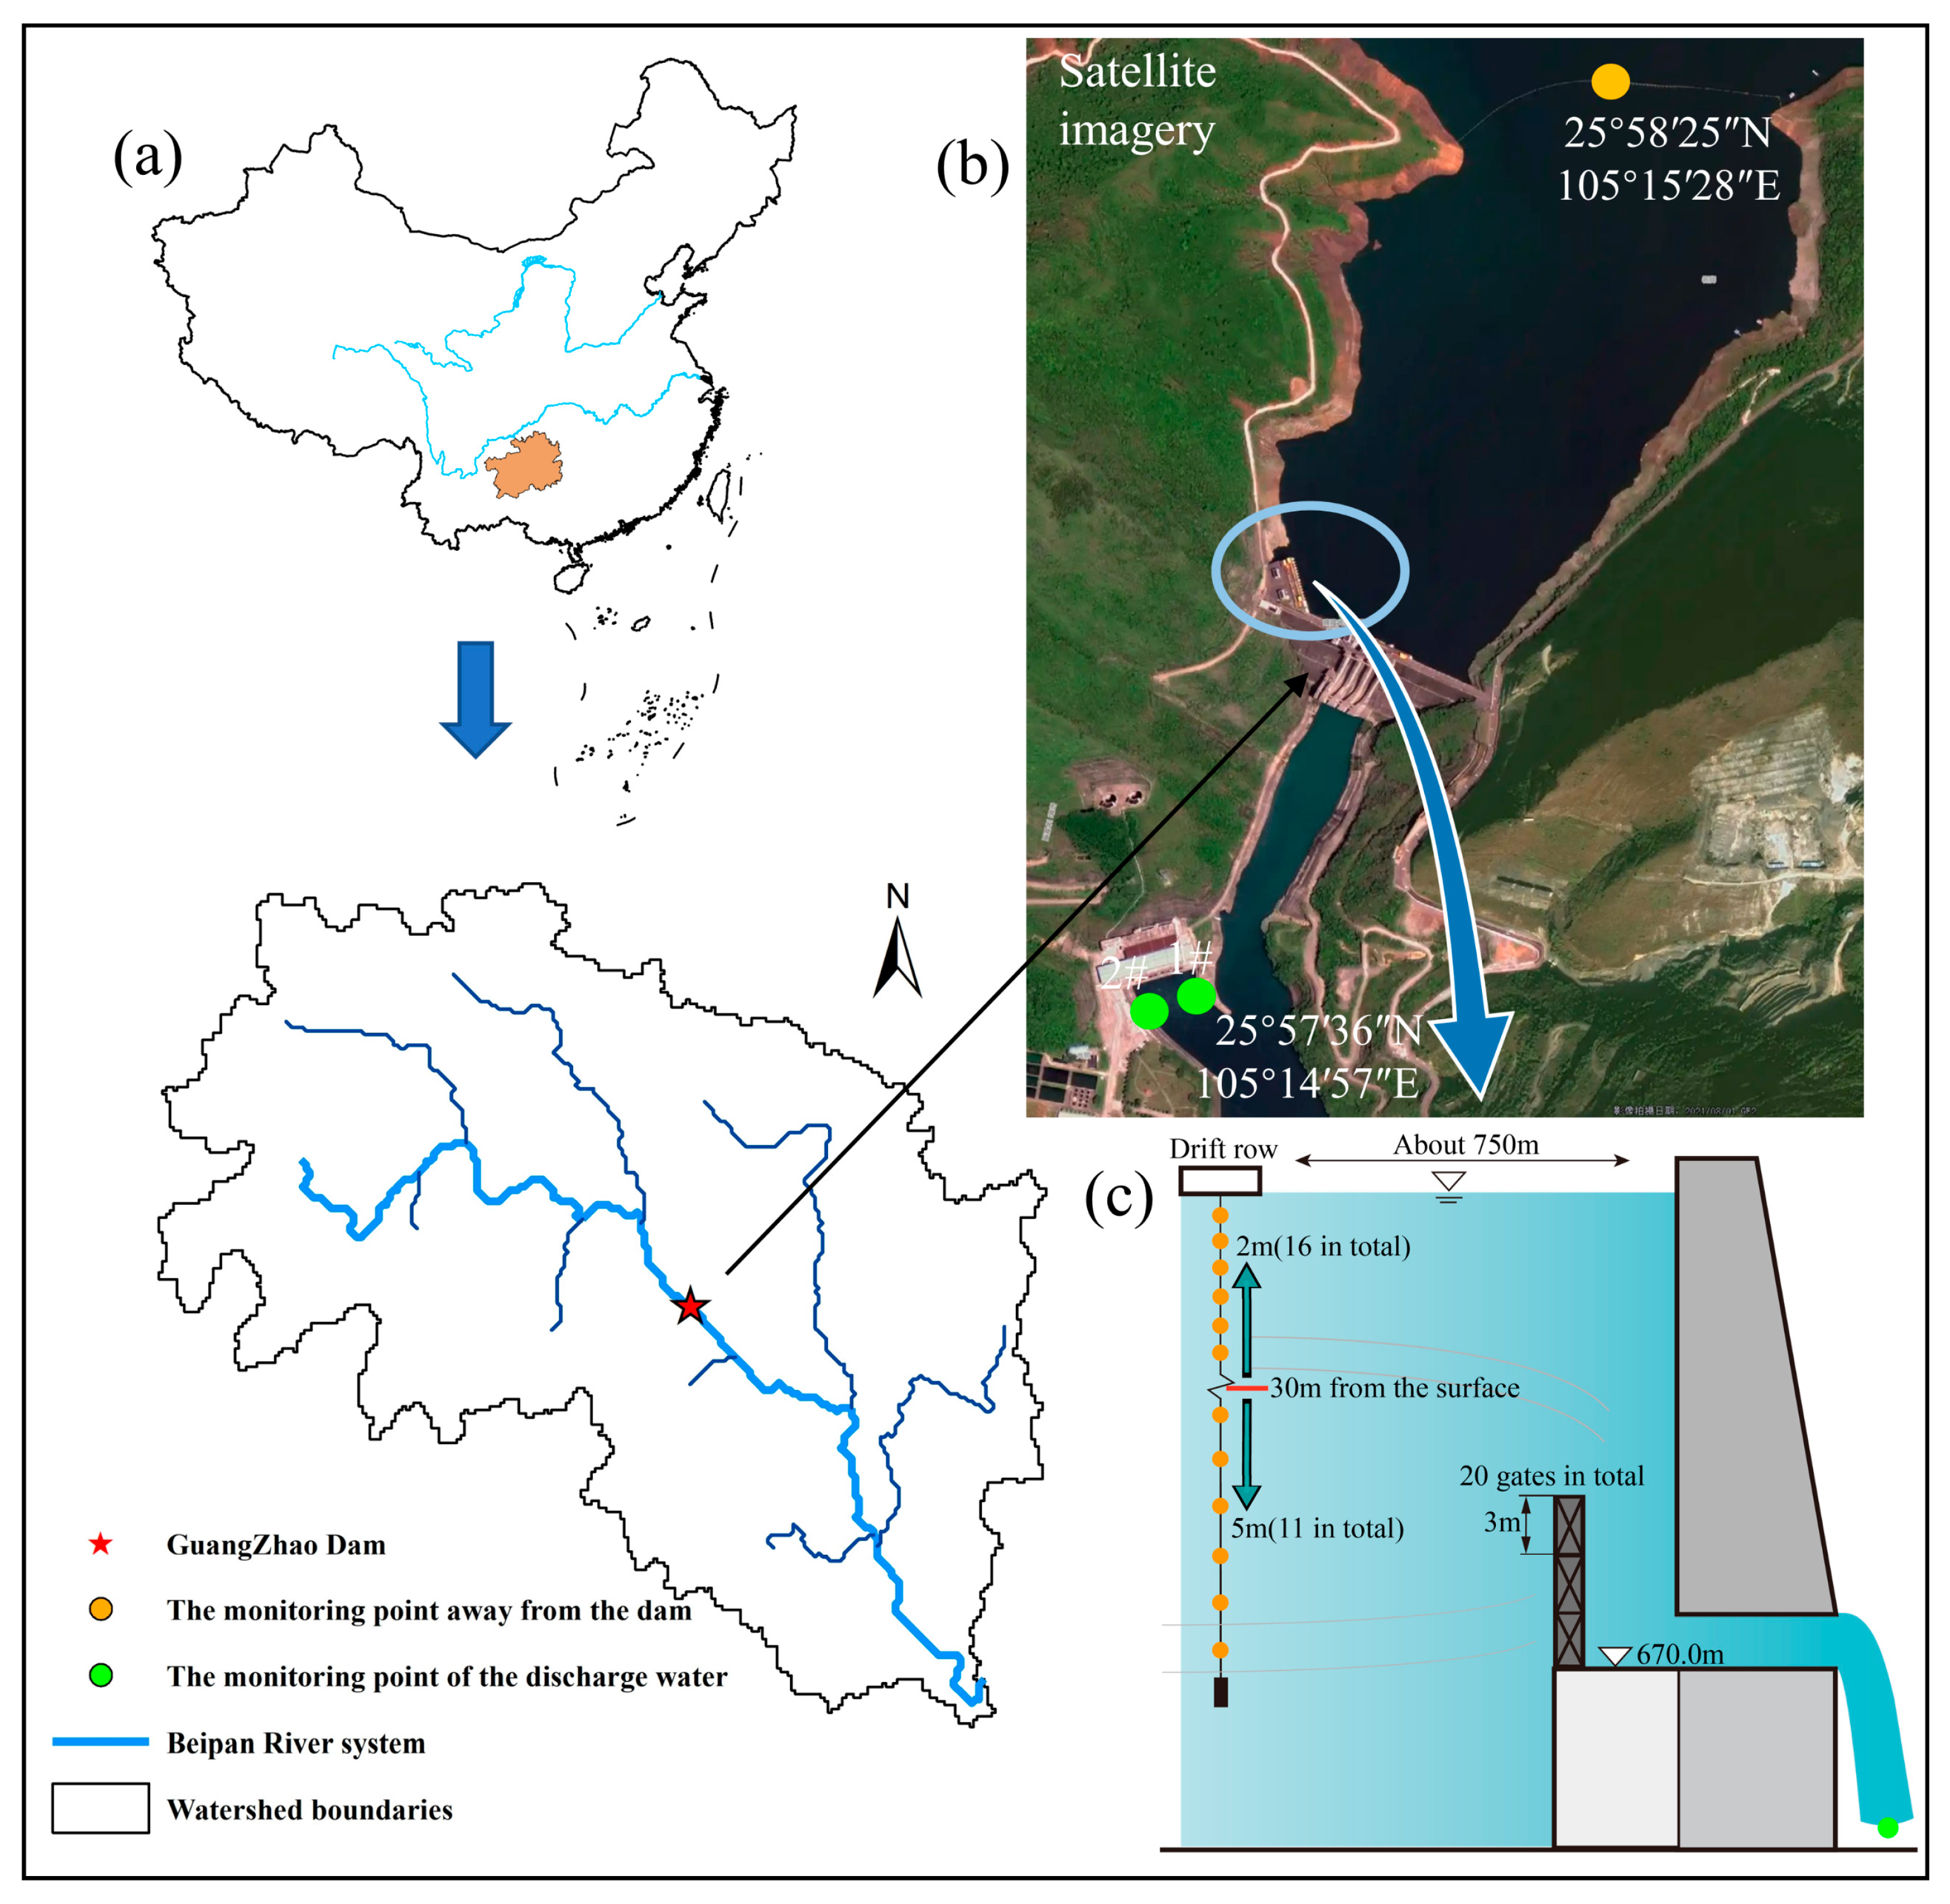
Figure 1. (a) Location of GZ, southwestern China. (b) Locations of observation points in satellite imagery. (c) Overview of the stoplog gate and the deployment of water-temperature observation points.
Water 15 04145 g001
Figure 2. (a) The vertical-water-temperature processes observed at the drift row during the test period. (b) The vertical-temperature gradient, (c) the buoyancy frequency, and (d) the water stratification stability index (SI) calculated from the vertical-water-temperature-change process.
Water 15 04145 g002
Figure 3. (a) Time-averaged discharge-water temperature from drainage channel #2 using the original bottom inlet; (b) time-averaged discharge-water temperature from drainage channel #1 using the stoplog gate; (c) the effect of the stoplog gate on the improvement of withdrawal-water temperature.
Water 15 04145 g003
Figure 4. (a) Possible vertical mixing in front of the dam and the EWE. (b) Changes in withdrawal flow patterns: with the increase in discharge flow, the water-intake layer gradually expands, and the mixing in front of the water intake gradually becomes stronger.
Water 15 04145 g004
Figure 5. Correlation analysis of the DWT with (a) Hs, Q, SI, and (b) Tx (x represents the elevation of GZ).
Water 15 04145 g005
Figure 6. The EEM operation procedure.
Water 15 04145 g006
Figure 7. The EWE corresponding to the DWT form the drainage channel with or without stoplog-gate use during the test period.
Water 15 04145 g007
Figure 8. Improvements from increasing the number of layers in the stoplog gate.
Water 15 04145 g008
Table 1. Operation of the stoplog gate in GZ during the test period.
Stoplog Gate LayerUsage TimeTop Elevation of the Stoplog GateMinimum Operating Water LevelRange of Daily Average Reservoir Levels over the Service Life
5 layers12 April–10 May 2019685.00 m700.00 m703.3–710.3 m
4 layers11 May–17 May 2019682.00 m697.00 m700.9–702.8 m
3 layers18 May–30 June 2019679.00 m694.00 m698.3–709.2 m
Table 2. Average abstraction elevation during the test period for different layers of the stoplog gate.
Stoplog Gate LayerWater LevelAverage Abstraction Elevation with the Stoplog GateAverage Temperature Gradient and Buoyancy FrequencyAverage DWT (with the Stoplog Gate)Average Abstraction Elevation without the Stoplog GateAverage Temperature Gradient and Buoyancy FrequencyAverage DWT (without the Stoplog Gate)
5 layers711 m–709 m700.4 m0.33 °C/m 0.02 s−116.9 °C697.1 m0.12 °C/m 0.01 s−116.4 °C
709 m–707 m697.8 m0.57 °C/m 0.03 s−117.8 °C693.9 m0.17 °C/m 0.01 s−116.6 °C
707 m–705 m695.4 m0.54 °C/m 0.03 s−118.0 °C692.1 m0.23 °C/m 0.02 s−116.9 °C
705 m–703 m693.1 m0.54 °C/m 0.03 s−118.2 °C691.7 m0.47 °C/m 0.03 s−117.6 °C
4 layers703 m–701 m690.8 m0.53 °C/m 0.03 s−118.4 °C690.1 m0.49 °C/m 0.03 s−118.0 °C
3 layers701 m–699 m689.2 m0.53 °C/m 0.03 s−119.2 °C688.5 m0.52 °C/m 0.03 s−118.8 °C
711 m–709 m691.3 m0.32 °C/m 0.03 s−120.4 °C689.7 m0.37 °C/m 0.03 s−119.9 °C
709 m–707 m691.4 m0.21 °C/m 0.02 s−120.9 °C689.2 m0.24 °C/m 0.02 s−120.5 °C
707 m–705 m690.7 m0.18 °C/m 0.02 s−121.4 °C688.6 m0.23 °C/m 0.02 s−121.0 °C
Disclaimer/Publisher’s Note: The statements, opinions and data contained in all publications are solely those of the individual author(s) and contributor(s) and not of MDPI and/or the editor(s). MDPI and/or the editor(s) disclaim responsibility for any injury to people or property resulting from any ideas, methods, instructions or products referred to in the content.