Article

Managing the Taste and Odor Compound 2-MIB in a River-Reservoir System, South Korea

1
Water Environment Research Department, National Institute of Environmental Research, Incheon 22689, Republic of Korea
2
Geum River Environment Research Center, National Institute of Environmental Research, Okcheon 29027, Republic of Korea
*
Author to whom correspondence should be addressed.
Water 2023, 15(23), 4107; https://doi.org/10.3390/w15234107
Submission received: 30 October 2023 / Revised: 20 November 2023 / Accepted: 24 November 2023 / Published: 27 November 2023
(This article belongs to the Special Issue Water Quality Modeling and Monitoring II)

Abstract

:
High concentrations of 2-methylisoborneol (2-MIB) were reported during winter in the Paldang reservoir and North Han River, South Korea. The causes of the unusual taste and odor problems in the regulated river-reservoir system were not understood; however, a short-term solution is to flush out 2-MIB-rich water to secure water sources for over 20 million people. Approximately 150 million tons of water was released from upstream dams for 12 days (late November to early December 2018) to reduce the elevated levels of 2-MIB. Simultaneously, the spatio-temporal variations of the measured concentration of sample 2-MIB from five sites were simulated using a multi-dimensional hydrodynamics-based solute transport model to monitor the flushing effect. A modified environmental fluid dynamics code (EFDC) was adopted as the primary model framework. Five scenarios on the kinetic constants related to the characteristics of 2-MIB transport and behavior, such as conservative, net decay, and net production, were applied, and the results were compared. We found that the simulation errors on the elapsed times to satisfy the Korean drinking water monitoring standard (≤20 ngL−1) were smallest with the conservative dye transport option, indicating that the physical and biochemical characteristics of 2-MIB may not play an essential role.

1. Introduction

Taste and odor problems caused by algae, such as actinobacteria and cyanobacteria, in water supply sources are drawing attention as a global environmental problem [1,2,3]. In the St. Lawrence River in Canada, the taste and odor issue affected approximately 0.5 million residents along a stretch of 200 km [4]. In Taihu Lake, China, cyanobacteria-induced taste and odor compounds also affected the quality of drinking water [5]. Taste and odor compounds have also been reported in Biwa Lake and Ogawara Lake in Japan [6,7] and Tri An and Dau Tieng Reservoirs in Vietnam [8]. In South Korea, taste and odor compounds occur primarily in summer because high water temperature and abundant solar radiation are favorable for the proliferation of cyanobacteria [9]. Byun et al. [10,11] reported on the occurrence of cyanobacteria in the North Han River basin and its relationship with factors such as precipitation, environmental variables, odor compounds, and correlations among microorganisms. They also mentioned that taste and odor compounds in the Paldang Reservoir are significantly influenced by cyanobacteria and odor-producing compounds observed in the North Han River basin [3]. However, in recent years, a wide range of fluctuations in temperature and rainfall, possibly linked to climate change, have complex effects on their occurrence. High concentrations of geosmin were detected up to a maximum of 1640 ngL−1 in the Paldang reservoir, used as a water supply source for over 20 million people, in November and December 2011 [12,13]. High concentrations of taste and odor compounds occurred in six water treatment plants around the reservoir [12,14]. In September 2014, a concentration of 2-MIB at 75 ngL−1 was detected in the North Han River. [11,12]. Byun et al. [10] reported on the occurrence of cyanobacteria in the North Han River basin and its relationship with factors such as precipitation, environmental variables, odor compounds, and correlations among microorganisms [11]. They also mentioned that taste and odor compounds in the Paldang Reservoir are significantly influenced by cyanobacteria and odor-producing compounds observed in the North Han River basin [3]. In October 2017, 110 and 67 ngL−1 of 2-MIB were measured in the Cheongpyeong and Paldang reservoirs, respectively [11]. Since then, taste and odor compounds have been continuously reported, and civil complaints about taste and odor are made more frequently. In November 2018, similar complaints were reported in the same area, indicating the occurrence of high concentrations of 2-MIB [3,7,15,16,17].
Geosmin and 2-MIB are non-toxic and are not harmful to the human body [18]. However, they psychologically influence substances that induce undesirable taste and odor even when present in minimal quantities in water [19]. They are mainly produced when algae occur in surface water, which is used as raw water for the domestic supply [14]. These tastes and odors cause avoidance of tap water by users, and subsequent complaints arise [9,20,21]. Consumers use the taste and odor of drinking water as measures of water quality. Thus, water treatment plants endeavor to eliminate taste and odor [22]. The minimum detectable concentration of geosmin and 2-MIB in water that induces taste and odor is 4–20 ngL−1 [23]. In Japan, the recommendation criteria for geosmin and 2-MIB concentration in water supply sources are 10 ngL−1. Moreover, the concentration limit for geosmin and 2-MIB in the drinking water monitoring standard was ≤20 ngL−1 in South Korea in 2008. Hence, it is necessary to prevent taste and odor problems that arise from the source water used for domestic water supply [24]. Predictive tools are required to determine the likely occurrence of undesirable tastes and odors for the cost-effective operations of water treatment plants. If one can predict changes in the concentration of taste and odor compounds, water treatment plants can commence the necessary treatment processes before receiving user complaints [25].
It has been reported that the concentration of geosmin or 2-MIB produced by bacterial metabolism decreases through mechanisms such as photolysis [26], sorption [27], and biodegradation [28,29]. Process-based numerical models for predicting taste and odor compounds can simulate spatio-temporal fluctuations in various environmental conditions. When coupled with a hydrodynamics model, most models treat state variables as reactive materials, incorporating internal processes. For example, an ecological module of the row-column advanced model has been applied to simulate 2-MIB concentrations in the Qingcaosha Reservoir, China [29]. In South Korea, Chung et al. (2016) [30] simulated geosmin in the North Han River using the CE-QUAL-W2 model. Taste and odor compounds (geosmin and 2-MIB) and phytoplankton groups were simultaneously simulated in the Jinyang reservoir using the ELCOM-CAEDYM model [31]. However, our understanding of the internal kinetic processes of taste and odor compounds remains limited, and studies on quantifying the main parameters that regulate reaction rate are rare.
In November 2018, 2-MIB-free water was additionally discharged from the Soyang dam, located in the upper reach of the North Han River, to promptly alleviate the elevated levels of 2-MIB in the Paldang reservoir and the lower reaches of the North Han River. This study aimed to test the hypothesis that the 2-MIB behaves as a conservative solute during the winter flushing period. If the hypothesis were not valid, we intended to suggest a net source or sink process embracing the internally complex kinetics appropriately within the framework of first-order kinetics. Another objective was to evaluate the usefulness of solute transport models linked with flow dynamics models for 2-MIB management in river reservoir systems in winter flushing conditions.

2. Materials and Methods
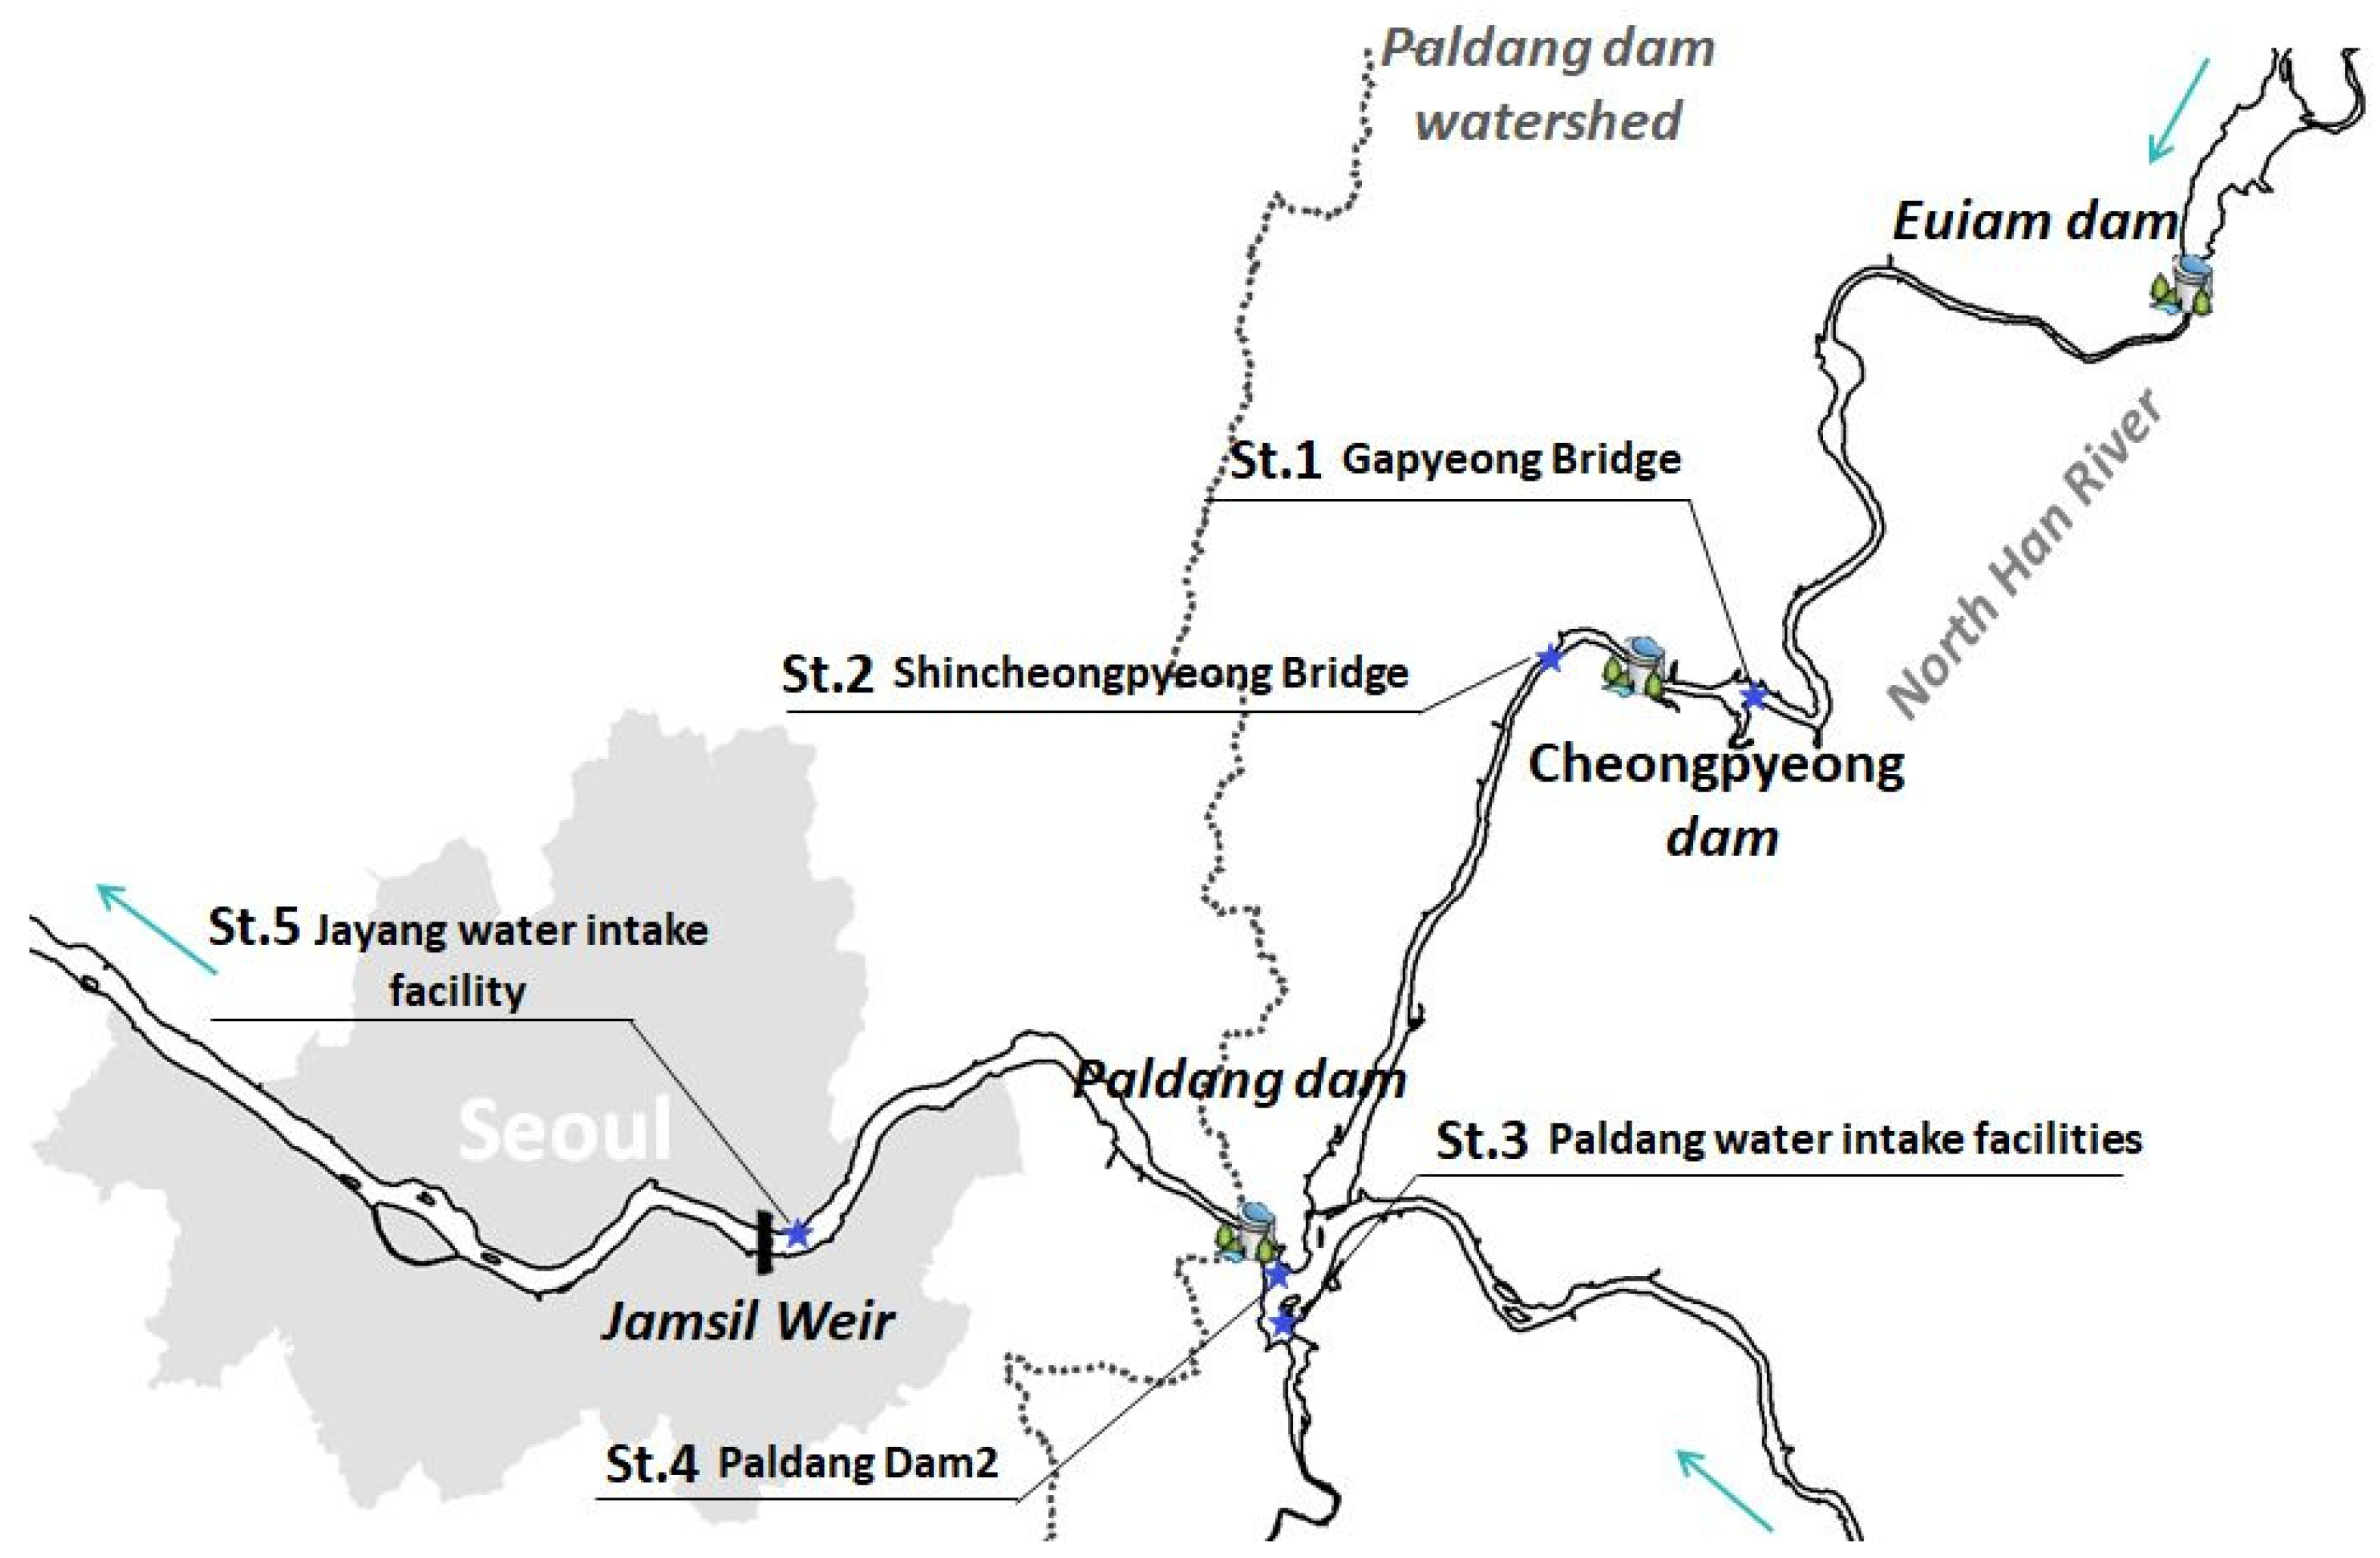
2.1. Study Area

The Han River is the second-longest river in South Korea. The North and South Han Rivers merge at the Paldang Reservoir, which was created by constructing the Paldang Dam. The water passes through South Korea’s capital, Seoul, and flows to the west coast (Figure 1). The Paldang Reservoir is a river-type artificial lake with a total watershed area of approximately 23,800 km2 and a total storage of approximately 244 million tons. The basin perimeter is approximately 1334 km, and the average water depth is approximately 6.6 m. In particular, the reservoir is used not only as an industrial and agricultural reservoir but also as a significant water source for Seoul and other metropolitan populations [32]. The North Han River flows from the upper reaches of the Chuncheon and Soyang reservoirs through the Euiam and Cheongpyeong reservoirs to the Paldang reservoir (Figure 1). The multi-purpose dams located at the outlet of reservoirs regulate the river flow to mainly supply water resources, generate hydroelectric power, and control flooding. The 30-year (1991–2020) average rainfall and temperature at Gapyeong weather station (#505) near Cheongpyeong Dam are 1374.8 mm and 10.2 °C, respectively [33].
This study focused on the Paldang reservoir and North Han River, where 2-MIB occurred frequently, to evaluate the flushing effect caused by multi-dam cooperation.

2.2. Occurrences of 2-MIB and Flushing Events in 2018

The Ministry of Environment (MOE) periodically measures the concentrations of 2-MIB and geosmin in the Paldang reservoir. Byun et al. [3] presented the concentrations of geosmin and 2-MIB in the North Han River and Paldang Reservoir in November 2018. They reported that the occurrence pattern of geosmin and 2-MIB was similar to the appearance of cyanobacteria and changes in the amount of actinobacteria. Figure 2 shows the concentrations of 2-MIB observed on 26–28 November 2018, just before additional water discharge from the upstream dams. The green to red color areas in Figure 2 denote the spatial distribution of 2-MIB concentrations exceeding the drinking water monitoring standard of ≤20 ngL−1. It occurred mainly at the river channels between the downstream area of Cheongpyeong reservoir (Figure 2a) and the downstream area of the Paldang dam (Figure 2c) via the Paldang reservoir (Figure 2b). It was expected that the increased 2-MIB levels would decrease gradually with time. Under the ordinary hydrodynamic conditions, flows from the Soyang and Chuncheon dams were 80 and 5.9 m3s−1, respectively. Based on a preliminary numerical modeling result, it would take approximately 27 days to meet the drinking water monitoring standard at water intake facilities such as Paldang and Jayang (Figure 1). Additional water from upstream dams was released over 12 days from 28 November 2018, to reduce the lead time to meet the monitoring standard. The amounts of additional dam water released from Soyang and Chuncheon dams were 144 and 24 m3s−1, respectively, with a total cumulative flow volume of approximately 150 million tons. The 2-MIB concentrations were monitored once a day at several sites, including major water intake facilities in the Paldang reservoir and downstream of the Han River, from 28 November to 9 December 2018, coinciding with the commencement and end of additional dam water releases, respectively. During the actual discharge period, the average temperature was −1.7 (−9.7~5.9) °C (#505) [33]. The average water temperature at the Sinpyeongcheon Bridge site, located downstream of the Soyang Dam and Chuncheon Dam, was also confirmed to be 9 (7.9~10.3) °C (Table 1). Observations of water temperature, pH, DO, and other parameters for the Gapyeong Bridge, Sincheongpyeong Bridge, and Paldang Dam 2 locations are presented in Table 1.

2.3. Model Framework

2.3.1. Model Description

The Environmental Fluid Dynamics Code (EFDC) model was developed in 1992 by the Virginia Institute of Marine Science in the United States as a three-dimensional numerical model that can simulate flow dynamics and mass transport in various water bodies such as coasts, estuaries, wetlands, lakes, and rivers. It has since been developed and managed by the US EPA. The EFDC model consists of four modules: hydrodynamics, water quality, sediment transport, and toxicity. Advection and dispersion, behaviors of suspended solids, salinity and water temperature changes, water quality, eutrophication mechanisms, and toxic pollutant behaviors can be simulated. The governing equations of the EFDC model consist of a continuity equation, horizontal and vertical momentum equations, a density state equation, and a mass conservation equation. The EFDC model can selectively use a Cartesian or curvilinear-orthogonal grid horizontally and it uses the Sigma coordinate system vertically. The details can be found in Tetra Tech, Inc. (Fairfax, VI, USA) (2007) [34]. In this study, we used the EFDC-NIER model as the modeling framework, revised in 2010 by the National Institute of Environmental Research (NIER), to add additional functionalities for simulating hydraulic structures and algal blooms [35]. Previous case studies have reported on the analysis of flow dynamics characteristics according to changes in estuary and multifunctional weir operating conditions, and their impact on water quality and algal bloom phenomena in South Korea, using the EFDC-NIER model [36,37,38,39,40,41,42].

2.3.2. Model Configuration and Application

In this study, three numerical models were linked (Figure 1). Model I covers the river-reservoir areas between the Euiam and Cheongpyeong reservoirs. The two-dimensional model domain consists of 5045 horizontal grids (Δx = 45.4 to 157.1 m, Δy = 21.9 to 194.1 m). A constant roughness height of 0.04 m was applied to the study site [35]. Water release data from Chuncheon and Soyang dams and flow data estimated/measured at the outlets of Gongji Stream, Gapyeong Stream, and Hongcheon River were used for the upstream and lateral boundary conditions, and changes in water level at Cheongpyeong reservoir was assigned to construct the downstream boundary condition [35]. Model II, developed for operational water quality forecasting in the Han River watershed, covers the river-reservoir areas from the Cheongpyeong and Chungju dams to the Paldang reservoir. It has 3300 horizontal grids with an average size of 139.4–130.7 m. The model domain is three-dimensional and is divided into 11 layers in a vertical direction, with a total of 36,300 grids. The inflow boundary conditions reflected 11 influx tributaries, including the Chungju Dam, Cheongpyeong Dam, Dal Stream, and Seom River, and a change in water level at the Paldang reservoir was used for the downstream boundary condition [36]. Model III covers the riverine area from Paldang dam to Jamsil underwater weir in the Han River, which comprised of 2984 horizontal grids (Δx = 63.6–425.7 m, Δy = 67.4–720.7 m) in a two-dimensional structure. The model dimension was selected with respect to the portion of the river channel. Long river channels are dominant in Models I and III (2D), but the model domain of Model II (3D) consists of reservoir only—the entire area is affected by the stage of Paldang Reservoir. Meteorological data (atmospheric pressure, dry and wet air temperatures, short-wave solar radiation, and wind direction/speed) observed at Seoul and Yangpyeong weather stations located near the study sites were used for the atmospheric forcing conditions (aser.inp and wser.inp). Annual/daily averaged flow measured at water intake facilities and wastewater treatment plants (sources and sinks) and those measured at the boundaries were used to form the qser.inp file. The configurations of the three models used in this study are listed in Table 2. The simulation time steps of three EFDC-NIER models were identical to 10 s.

2.3.3. Simulation of 2-MIB Transport and Behavior

This study regarded the spatial distribution of 2-MIB concentration from the North Han River to the Paldang reservoir as a dye in the water column. Based on the daily monitoring data (Han River Environment Research Center, unpublished) indicating that 2-MIB concentration was not detected in the inflows from major tributaries such as Gapyeong Stream and Hongcheon River, as well as waters additionally released from the Soyang and Chuncheon dams during most of the flushing period, we considered that external inputs may not be significant during the simulation period. The dye simulation module, linked with the 2D/3D EFDC flow dynamics models, was used to replicate the spatio-temporal variations of 2-MIB concentration and flushing. The dye can be simulated as a conservative or a reactive solute with the first-order decay in the original EFDC model. NIER modified the source code to include a simulation option for net production with first-order kinetics [35]. In this study, the transport and behavior of 2-MIB during the winter flushing period were assumed to be conservative (K0) or reactive with net decay (Kdecay) or net production (Kprod). The degradation rate constants of taste and odor compounds from domestic and foreign literature were used (summarized in Table 3). Chong et al. [31] applied a degradation rate constant of 0.14 d−1 to predict the occurrence of taste and odor compounds such as 2-MIB and geosmin using a two-dimensional model in a reservoir. Ho et al. [28] reported degradation rate constants of 0.075 d−1 and 0.064 d−1 for geosmin and 2-MIB, respectively, as biological functions. Chen and Zhu (2018) [29] also applied the maximum degradation rate of 0.064 d−1 for 2-MIB in water at 20 °C. We applied 0.064 d−1 and 0.14 d−1 as the kinetic constants in this study. The first-order production and decay constants were selected as the net source and sink reaction options of the EFDC-NIER model, respectively. The kinetic constants were 0.064 d−1 (Kprod1) and 0.14 d−1 (Kprod2) of net production, −0.064 d−1 (Kdecay1) and −0.14 d−1 (Kdecay2) of net decay, and conservative (K0). These five scenarios were applied to the model, and the results were compared (Figure 3).

2.4. Assessment of Model Performance

The five scenarios were organized for kinetic constants of 2-MIB using the EFDC-NIER model, and the reproducibility of the events of 2018 was compared. The model results for the five scenarios were evaluated using the root-mean-square error (RMSE). The RMSE checks the goodness of fit between modeled and observed values. The RMSE is calculated as follows:
R M S E = i = 1 n ( O i P i ) 2 n
where n is the number of measurement and prediction pairs, Oi is the observed value, and Pi is the predicted value.

3. Results and Discussion

3.1. Monitoring Data

To reduce the concentration of 2-MIB occurring in the North Han River and Paldang Reservoir, an additional flow of 144 m3s−1 was released from the Chuncheon and Soyang dams located upstream of the North Han River on 28 November 2018, and the flushing continued for 12 days. Changes in the concentration of 2-MIB were monitored at five locations during the flushing period (St.1–5 in Figure 4).
The red dot in Figure 3 indicates the monitoring data. Site 1 (St.1) at Gapyeong Bridge is located upstream of the Cheongpyeong dam. The flushing effect occurred at this location because it was the closest to the dam where the additional dam waters were released (Figure 3a). The concentration of 2-MIB on the first day of flushing at St.1 was 22 ngL−1. However, it decreased to 14 ngL−1 on the following day. As a result, it decreased to ≤20 ngL−1, the national drinking water monitoring standard [43]. The flushing effect continued on the third day of additional discharge, and the concentration of 2-MIB was reduced to 6 ngL−1. However, the 2-MIB concentration remained stable at 8 ngL−1 from day 4 to 5 after additional discharge. The concentration of 2-MIB on the first day of flushing at Shincheongpyeong Bridge (St.2) was 40 ngL−1, and the 2-MIB concentration (39 ngL−1) was similar on day 2 (Figure 3b). From the third day after the additional water discharge from the dams, the concentration of 2-MIB showed a continuous decreasing trend, indicating the flushing effect. The concentration of 2-MIB on the third day of monitoring was 25 ngL−1, which was approximately 38% lower than the observed value on the first day. The concentration fell below the monitoring standard (≤20 ngL−1) approximately four days after the flushing, and it took approximately 2–3 days more than the St.1.
The changes in concentration of 2-MIB at St.3 (Paldang water intake facilities) were opposite to those at St.1 and St.2 (Figure 3c). The concentration of 2-MIB at St.3 was 42 ngL−1 on the start date of the additional water discharge from the dams. However, it increased by approximately 50% to 62 ngL−1 the following day. The elevated 2-MIB concentrations stayed constant for approximately three days. This trend was supposed to be caused by flushing as an initial inundation effect. The 2-MIB levels remaining in the North Han River before joining the Paldang reservoir were much higher than 42 ngL−1 (yellow to orange areas in Figure 2b), and St.3 located downstream was besieged with the elevated 2-MIB plume during the initial period of flushing. On the sixth day, the 2-MIB concentration decreased. Approximately seven days after the additional discharge from the dams, the 2-MIB concentration at St.3 was within the monitoring standard, approximately 6 and 3 days longer than those of St.1 and St.2 located upstream, respectively. The initial concentration of 2-MIB at St.4 (Paldang Dam 2) was approximately 50 ngL−1. After maintaining the concentration of 2-MIB for four days, it began to drop on the fifth day due to the flushing effect (Figure 3d). The concentration of 2-MIB at St.4 decreased by approximately 60% to 20 ngL−1, within the monitoring standard from day eight onward. The concentration of 2-MIB at St.5 (Jayang water intake facility) located downstream of Paldang dam gradually decreased (Figure 3e) and was within the monitoring standard from day 10 onward.

3.2. 2-MIB Transport and Behaviour in Winter Flushing

Five scenarios for the kinetic constants related to the characteristics of 2-MIB transport and behavior during the winter flushing period were tested in this study. For the cases of net production, the first-order kinetic constants of 0.064 d−1 (Kprod1) and 0.14 d−1 (Kprod2) were used. For the net decay cases, −0.064 d−1 (Kdecay1) and −0.14 d−1 (Kdecay2) were used, and K0 was set to 0 for the conservative condition. Furthermore, the time required for each monitoring site to reach the monitoring standard of ≤20 ngL−1 of 2-MIB was compared (Figure 3). Among all the sites, the flushing impact was fastest at St.1. In the conservative (K0) simulation, the concentration of 2-MIB decreased to approximately 18 ngL−1 on day one after the additional water discharge from the dam was started. On days 2 and 3, it rapidly decreased due to the flushing effect to 8 ngL−1, approximately 60% lower than the initial concentration of 2-MIB (Figure 3a). Using the kinetic constants Kprod1 and Kprod2 increased the concentrations to the maximum of 20 and 22 ngL−1, respectively, until the flushing effect occurred. Kdecay1 and Kdecay2 were reduced to 17 and 15 ngL−1 at the maximum, respectively.
The RMSE value was lowest at 2.4 ngL−1 for Kdecay2 and second lowest at 2.5 ngL−1 for K0 (Table 4). The RMSE of St.2 was lowest at 5.5 ngL−1 under the K0 condition. The RMSEs of Kprod1, Kdecay2, Kdecay1, and Kprod2 were 5.9, 6.4, 7.9, and 9.4 ngL−1, respectively. The monitoring standard of the concentration of 2-MIB under K0 and Kprod1 conditions was reached in approximately four days, consistent with the monitoring results. The elapsed time to achieve the monitoring standard of the concentration of 2-MIB for the conditions Kdecay1 and Kdecay2 was three days, approximately one day earlier than the monitoring results. In the Kprod2 condition, it took two days more compared to the elapsed monitoring time, and the concentration reduced to below the monitoring standard only six days from the start of flushing.
Although most scenarios reasonably simulated the temporal variations in 2-MIB concentration, showing an increase on day two after flushing and a subsequent decrease until day 5 (Figure 3c,d) were reasonably simulated in most scenarios; St.3 and St.4 exhibited the lowest RMSE values of 8.1 and 5.8 ngL−1 under the K0 condition, respectively, with simulation errors for the time to meet the monitoring standard being less than one day. The concentration of 2-MIB under the Kprod2 condition showed a difference of approximately 20–30 ngL−1 compared to the K0 condition. The monitoring standard for the concentration of 2-MIB in water was not satisfied until December 9, when the flushing ended. Conversely, the RMSE at St.5 was low under the net production conditions. However, the elapsed times to meet the monitoring standard for the concentration of 2-MIB in drinking water were almost identical for all the scenarios, consistent with the monitoring data (Figure 3e). The black ellipse in Figure 3e indicates that, unlike the monitoring results, the simulation results of scenarios show a different trend from the monitoring results. Unlike the monitoring results, the simulation results initially exhibit a decrease in 2-MIB concentration, followed by a recovery, due to flushing a high concentration (49 ngL−1) of 2-MIB, which directly moves downstream of the Paldang dam, as shown in Figure 2c. This discrepancy may be due to the uncertainty in developing the initial condition of 2-MIB. Specifically, small patches with high 2-MIB concentration were not captured in the field monitoring.
For the overall evaluation, the RMSE values calculated at each site were averaged for each scenario, and the results were compared. It was lowest at 7.0 ngL−1 in the K0 condition (Table 4). These simulation results show that under the flushing condition caused by the additional dam water release in winter, the behavior of 2-MIB in the river-reservoir system is more affected by the advection of flow than by biogeochemical reactions such as internal decay and production. When cyanobacteria or actinobacteria die or precipitate on the water surface of reservoirs or lakes, instead of growing, they generate metabolites such as 2-MIB in the sediments due to microbial decomposition and are released in an anaerobic state [29]. They simulated the behavioral characteristics of 2-MIB by applying parameters such as its production rate from dead cyanobacteria and the half-life constant of its release from sediments. However, this study shows that the reactive characteristics of 2-MIB may not be emphasized to simulate mass transport under winter flushing conditions in river reservoir systems. Moreover, we found that this flow dynamics-linked solute (dye) transport modeling approach can be useful to manage 2-MIB at river-reservoir systems in winter flushing conditions.

4. Conclusions

This study monitored flushing-induced spatio-temporal changes in the concentration of 2-MIB in the early winter of 2018 in the North Han River and Paldang Reservoir. Using the modified EFDC model, we tested a hypothesis that the behavior of 2-MIB can be assumed as a conservative solute during winter flushing and evaluated the usefulness of a flow dynamics-based solute (dye) transport modeling approach for 2-MIB management at river-reservoir systems in winter flushing conditions.
Field monitoring data indicated that the concentration of 2-MIB decreased to ≤20 ngL−1, the South Korean water quality monitoring standard, during the flushing period at all the monitoring sites. From St.1 (Gapyeong Bridge) to St.5 (Jayang water intake facility), the elapsed times to satisfy the monitoring standard after flushing were 2, 4, 7, 8, and 10 days, respectively, which were reasonably simulated using the conservative dye transport module of the EFDC-NIER modeling framework. Moreover, the simulation results show that the physical and biochemical characteristics of 2-MIB due to internally complex processes may not play an important role in understanding the river reservoir system’s transport and behavior during the winter flushing period. Therefore, flushing can manage 2-MIB outbreaks in winter if environmental flow is available at upstream dams. The numerical modeling system developed in this study can be used to estimate the amount of flushing required to meet the monitoring standard and predict the elapsed time in advance. Finally, additional verifications on the hypothesis and simulation conditions, such as 2-MIB concentration exceeding 80 ng/L and the possible presence of other taste and odor compounds tested in this study, are necessary to extend the model’s applicability to other regions or seasons.

Author Contributions

Conceptualization, M.K. and J.-H.M.; methodology, M.K.; software, K.K.; validation, D.-W.K.; formal analysis, M.P.; investigation, D.-W.K.; resources, K.K. and J.-H.M.; data curation, M.K.; writing—original draft preparation, M.K.; writing—review and editing, J.-H.M.; visualization, D.-W.K.; supervision, J.-H.M.; project administration, M.K. and J.-H.M.; funding acquisition, K.K. All authors have read and agreed to the published version of the manuscript.

Funding

This research was funded by the National Institute of Environmental Research (NIER), which is funded by the Ministry of Environment (MOE) of the Republic of Korea, grant number NIER-2018-01-01-090.

Data Availability Statement

Data are contained within the article.

Acknowledgments

This research was funded by the National Institute of Environmental Research of the Republic of Korea.

Conflicts of Interest

The authors declare no conflict of interest.

References

  1. Lu, K.-Y.; Chiu, Y.-T.; Burch, M.; Senoro, D.; Lin, T.-F. A molecular-based method to estimate the risk associated with cyanotoxins and odor compounds in drinking water sources. Water Res. 2019, 164, 114938. [Google Scholar] [CrossRef] [PubMed]
  2. Asquith, E.A.; Evans, C.A.; Geary, P.M.; Dunstan, R.H.; Cole, B. The role of Actinobacteria in taste and odour episodes involving geosmin and 2-methylisoborneol in aquatic environments. J. Water Supply Res. Technol.-AQUA 2013, 62, 452–467. [Google Scholar] [CrossRef]
  3. Byun, J.-H.; Kim, H.-N.; Kang, T.-G.; Kim, B.-H.; Byeon, M.-S. Study of the cause of the generation of odor compounds (geosmin and 2-methylisoborneol) in the Han River system, the drinking water source. Water Supply 2023, 23, 1081–1093. [Google Scholar]
  4. Ridal, J.J.; Watson, S.B.; Hickey, M.B. A comparison of biofilms from macrophytes and rocks for taste and odor producers in the St. Lawrence River. Water Sci. Technol. 2007, 55, 15–21. [Google Scholar] [CrossRef]
  5. Zhang, Y.; Zhang, N.; Xu, B.; Kumirska, J.; Qi, F. Occurrence of earthy-musty taste and odors in the Taihu Lake, China: Spatial and seasonal patterns. RSC Adv. 2016, 6, 79723–79733. [Google Scholar] [CrossRef]
  6. Niiyama, Y.; Tuji, A.; Takemoto, K.; Ichise, S. Pseudanabaena foetida sp. nov. and P. subfoetida sp. nov. (Cyanophyta/Cyanobacteria) producing 2-methylisoborneol from Japan. Fottea 2016, 16, 1–16. [Google Scholar] [CrossRef]
  7. Shizuka, K.; Maie, N.; Kakino, W.; Taruya, H.; Tanji, H. Forecasting a 2-methylisoborneol outbreak in a brackish lake. Environ. Monit. Assess. 2021, 193, 379. [Google Scholar] [CrossRef]
  8. Pham, T.-L.; Bui, M.H.; Driscoll, M.; Shimizu, K.; Motoo, U. First report of geosmin and 2-methylisoborneol (2-MIB) in Dolichospermum and Oscillatoria from Vietnam. Limnolgy 2020, 22, 43–56. [Google Scholar] [CrossRef]
  9. Kim, K.T.; Park, Y.-G. Geosmin and 2-MIB removal by full-scale drinking water treatment processes in the Republic of Korea. Water 2021, 13, 628. [Google Scholar] [CrossRef]
  10. Byun, J.H.; Cho, I.H.; Hwang, S.J.; Park, M.H.; Byeon, M.S.; Kim, B.H. Relationship between a Dense Bloom of Cyanobacterium Anabaena spp. and Rainfalls in the North Han River System of South Korea. Korean J. Ecol. Environ. 2014, 47, 116–126. [Google Scholar] [CrossRef]
  11. Byun, J.-H.; Hwang, S.J.; Kim, B.-H.; Park, J.-R.; Lee, J.-K.; Lim, B.-J. Relationship between a dense population of cyanobacteria and odorous compounds in the North Han River system in 2014 and 2015. Korean J. Ecol. Environ. 2015, 48, 263–271. [Google Scholar] [CrossRef]
  12. You, K.-A.; Byeon, M.-S.; Youn, S.-J.; Hwang, S.-J.; Rhew, D.-H. Growth characteristics of blue-green algae (Anabaena spiroides) causing tastes and odors in the North-Han River, Korea. Korean J. Ecol. Environ. 2013, 46, 135–144. [Google Scholar] [CrossRef]
  13. Lee, J.E.; Park, R.; Yu, M.; Byeon, M.; Kang, T. qPCR-based monitoring of 2-Methylisoborneol/Geosmin-producing cyanobacteria in drinking water reservoirs in South Korea. Microorganisms 2023, 11, 2332. [Google Scholar] [CrossRef] [PubMed]
  14. Ham, Y.-W.; Ju, Y.-G.; Oh, H.-K.; Lee, B.-W.; Kim, H.-K.; Kim, D.-G.; Hong, S.-K. Evaluation of removal characteristics of taste and odor-causing compounds and organic matters using ozone/granular activated carbon (O3/GAC) process. J. Korean Soc. Water Environ. 2012, 26, 237–247. [Google Scholar]
  15. Kim, K.; Lee, S.; Seo, K.; Hwang, S.-J. Molecular identification of Pseudanabaena strains and analysis of 2-MIB production potential in the North Han River system. Korean J. Ecol. Environ. 2020, 53, 344–354. [Google Scholar] [CrossRef]
  16. Jeong, J.-Y.; Lee, S.-H.; Yun, M.-R.; Oh, S.-E.; Kim, T.-H.; Yoon, M.-H.; Park, H.-D. Draft genome sequence of putative 2-methylisoborneol-producing Pseudanabaena yagii strain GIHE-NHR1, isolated from the North Han River in South Korea. Microbiol. Resour. Announc. 2020, 9, e00431-20. [Google Scholar] [CrossRef]
  17. Jeong, J.-Y.; Lee, S.-H.; Yun, M.-R.; Oh, S.-E.; Lee, K.-H.; Park, H.-D. 2-methylisoborneol (2-MIB) excretion by Pseudanabaena yagii under low temperature. Microorganisms 2021, 9, 2486. [Google Scholar]
  18. Manganelli, M.; Testai, E.; Tazart, Z.; Scardala, S.; Codd, G.A. Co-Occurrence of taste and odor compounds and cyanotoxins in cyanobacterial blooms: Emerging risks to human health? Microorganisms 2023, 11, 872. [Google Scholar] [CrossRef]
  19. Wang, F.; Li, X.; Liu, T.; Li, X.; Cui, Y.; Xu, L.; Huo, S.; Zou, B.; Qian, J.; Ma, A.; et al. Removal of taste and odor compounds from water: Methods, mechanism and prospects. Catalysts 2023, 13, 1356. [Google Scholar] [CrossRef]
  20. Fan, C.-C.; Chiu, Y.-T.; Lin, T.-F. A simple alternative method for preservation of 2-Methylisoborneol in water samples. Int. J. Environ. Res. Public Health 2018, 15, 1015. [Google Scholar] [CrossRef]
  21. Kim, J.-K.; Lee, S.-H.; Bang, H.-H.; Hwang, S.-O. Characteristics of algae occurrence in Lake Paldang. J. Korean Soc. Environ. Eng. 2009, 31, 325–331. [Google Scholar]
  22. Bae, B.-U.; Lee, Y.-J.; Lim, M.-G. Comparison of taste and odor in raw water from the main Daecheong Reservoir and its regulating reservoir downstream. J. Korean Soc. Water Environ. 2008, 24, 598–602. [Google Scholar]
  23. Lloyd, S.W.; Lea, J.M.; Zimba, P.V.; Grimm, C.C. Rapid analysis of geosmin and 2-methylisoborneol in water using solid-phase microextraction procedures. Water Res. 1998, 32, 2140–2146. [Google Scholar] [CrossRef]
  24. Lee, I.; Lee, K.-L.; Lim, T.-H.; Park, J.-J.; Cheon, S. Determination of geosmin and 2-MIB in Nakdong River using headspace solid-phase microextraction and GC-MS. Anal Sci. Technol. 2013, 26, 326–332. [Google Scholar] [CrossRef]
  25. Dzialowski, A.R.; Smith, V.H.; Huggins, D.G.; Denoyelles, F.; Lim, N.C.; Baker, D.S.; Beury, J.H. Development of predictive models for geosmin-related taste and odor in Kansas, USA, drinking water reservoirs. Water Res. 2009, 43, 2829–2840. [Google Scholar] [CrossRef]
  26. Huang, X.; Wang, S.; Wang, G.; Zhu, S.; Ye, Z. Kinetic and mechanistic investigation of geosmin and 2-methylisoborneol degradation using UV-assisted photoelectrochemical. Chemosphere 2022, 290, 133325. [Google Scholar] [CrossRef]
  27. Bong, T.; Kang, J.-K.; Yargeau, V.; Nam, H.-L.; Lee, S.-H.; Choi, J.-W.; Kim, S.-B.; Park, J.-A. Geosmin and 2-methylisoborneol adsorption using different carbon materials: Isotherm, kinetic, multiple linear regression, and deep neural network modeling using a real drinking water source. J. Clean. Prod. 2021, 314, 127967. [Google Scholar] [CrossRef]
  28. Ho, L.; Hoefel, D.; Bock, F.; Saint, C.P.; Newcombe, G. Biodegradation rates of 2-methylisoborneol (MIB) and geosmin through sand filters and in bioreactors. Chemosphere 2007, 66, 2210–2218. [Google Scholar] [CrossRef]
  29. Chen, Y.; Zhu, J. Observation and Simulation of 2-methylisoborneol in the Qingcaosha Reservoir, Changjiang estuary. J. Oceanol. Limnol. 2018, 36, 1586–1596. [Google Scholar] [CrossRef]
  30. Chung, S.-W.; Chong, S.-A.; Park, H.-S. Development and applications of a predictive model for geosmin in North Han River, Korea. Procedia Eng. 2016, 154, 521–528. [Google Scholar] [CrossRef]
  31. Chong, S.; Lee, H.; An, K.-G. Predicting taste and odor compounds in a shallow reservoir using a three–dimensional hydrodynamic ecological model. Water 2018, 10, 1396. [Google Scholar] [CrossRef]
  32. Ministry of Environment (MOE). White Paper of Algae in Lake Paldang; NIER: Incheon, Republic of Korea, 2016.
  33. Korea Meteorological Administration (KMA). Available online: https://data.kma.go.kr/climate/average30Years/selectAverage30YearsKoreaList.do?pgmNo=188 (accessed on 21 September 2023).
  34. Tetra Tech, Inc. The Environmental Fluid Dynamics Code User Manual US EPA Version 1.01; US EPA: Fairfax, VI, USA, 2007.
  35. National Institute of Environmental Research. An Advanced Research on the Water Quality Forecasting System and the Numerical Models (I); NIER: Incheon, Republic of Korea, 2013.
  36. Kim, K.; Park, M.; Min, J.-H.; Ryu, I.; Kang, M.-R.; Park, L.J. Simulation of algal bloom dynamics in a river with the ensemble Kalman filter. J. Hydrol. 2014, 519, 2810–2821. [Google Scholar] [CrossRef]
  37. Shin, C.M.; Kim, D.; Song, Y. Analysis of hydraulic characteristics of Yeongsan River and estuary using EFDC model. J. Korean Soc. Water Environ. 2019, 35, 580–588. [Google Scholar]
  38. Park, S.; Kim, K.; Shin, C.; Min, J.-H.; Na, E.H.; Park, L.J. Variable update strategy for improved water quality forecast accuracy in multivariate data assimilation using the ensemble Kalman filter. Water Res. 2020, 176, 115711. [Google Scholar] [CrossRef] [PubMed]
  39. Ahn, J.M.; Kim, J.; Park, L.J.; Jeon, J.; Jong, J.; Min, J.-H.; Kang, T. Predicting cyanobacterial harmful algal blooms (CyanoHABs) in a regulated river using a revised EFDC model. Water 2021, 13, 439. [Google Scholar] [CrossRef]
  40. Kim, D.; Shin, C. Algal bloom characteristics of Yeongsan River based on weir and estuary dam operating conditions using EFDC-NIER model. Water 2021, 13, 2295. [Google Scholar] [CrossRef]
  41. Pyo, J.; Kwon, Y.S.; Min, J.-H.; Nam, G.; Song, Y.-S.; Ahn, J.M.; Park, S.; Lee, J.; Cho, K.H.; Park, Y. Effect of hydrospectral image-based initial conditions on improving short-term algal Simulation of hydrodynamic and water quality models. J. Environ. Manag. 2021, 294, 112988. [Google Scholar] [CrossRef]
  42. Ahn, J.M.; Kim, J.; Kwak, S.; Kang, T. Optimized Microcystis prediction model using EFDC-NIER and LH-OAT method. KSCE J. Civil Eng. 2023, 27, 1066–1076. [Google Scholar] [CrossRef]
  43. Ministry of Environment (MOE). Drinking Water Quality Monitoring Guideline; NIER: Sejong-si, Republic of Korea, 2017.
Figure 1. The location map shows the study area and the model domains.
Water 15 04107 g001
Figure 2. Spatial distribution of 2–MIB concentrations measured on 26–28 November 2018, served as the initial condition of the flow dynamics–linked dye transport model.
Water 15 04107 g002
Figure 3. Dye simulation results of five scenarios on 2-MIB concentrations measured at five monitoring sites: (a) Gapyeong Bridge; (b) Shincheongpyeong Bridge; (c) Paldang water intake facilities; (d) Paldang Dam 2; (e) Jayang water intake facility.
Water 15 04107 g003
Figure 4. A location map showing the monitoring sites (St.1 to 5).
Water 15 04107 g004
Table 1. Average water quality measurements during the flushing period at Gapyeong Bridge, Sincheongpyeong Bridge, and Paldang Dam 2 Locations (28 November to 10 December 2018).
LocationWater Temperature
(°C)
DO
(mg/L)
TN
(mg/L)
TP
(mg/L)
TOC
(mg/L)
Chl-a
(mg/m3)
Gapyeong Bridge9.311.21.80.0121.94.8
(8.0~10.2)(10.6~11.7)(1.6~1.9)(0.008~0.017)(1.8~2.0)(3.0~6.3)
Shincheongpyeong Bridge9.011.31.7630.0131.98.2
(7.9~10.3)(10.9~11.7)(1.6~1.9)(0.009~0.016)(1.8~2.3)(4.0~7.4)
Paldang Dam27.711.52.2770.0161.78.2
(6.8~9.1)(10.2~12.0)(2.1~2.7)(0.014~0.020)(1.6~1.8)(6.6~13.9)
Table 2. Configuration of three EFDC-NIER models used in this study.
Model IModel IIModel III
Dimension2-D3-D2-D
Model grid5045 (80.3 × 81.3 m)3300 (139.4 × 130.7 m) ×11 layers2984 (87.0 × 295.0 m)
Weather data (Aser. INP)YangpyengYangpyengSeoul
Simulation time step10 s10 s10 s
Boundary conditions
(Qser/Pser/Dser. INP)
Five upstream flows (WAMIS) and one downstream pressure
(Chungpyung reservoir stage)
11 upstream flows
and one downstream pressure
(Paldang reservoir stage)
One upstream flows
and one downstream pressure
(Han River estuary)
Sources and sinksTwo water intake facilities and
3 WWTPs
Four water intake facilities and
5 WWTPs
4 WWTPs and
2 TMS stations
Table 3. Literature review on the first-order kinetics parameters of taste and odor compounds.
Degradation Rate ConstantsEquationsReferences
Geosmin2-MIB
0.0750.064Pseudo-1st-orderHo et al. [28]
0.68 1st-orderChung et al. [30]
0.064MonodChen and Zhu, [29]
0.140.141st-orderChong et al. [31]
Table 4. Model fit (RMSE values) for the dye simulation results with the five scenarios.
Description1st-Order Net DecayConservative1st-Order Net Production
ConstantsKdecay2Kdecay1K0Kprod1Kprod2
Values (day−1)−0.14−0.06400.140.064
St.12.42.82.53.14.8
St.26.47.95.55.99.4
St.311.015.18.110.624.3
St.49.713.95.88.122.4
St.516.620.313.310.28.4
average9.212.07.07.613.9
Disclaimer/Publisher’s Note: The statements, opinions and data contained in all publications are solely those of the individual author(s) and contributor(s) and not of MDPI and/or the editor(s). MDPI and/or the editor(s) disclaim responsibility for any injury to people or property resulting from any ideas, methods, instructions or products referred to in the content.

