Article

Nutrient Loadings and Exchange between the Curonian Lagoon and the Baltic Sea: Changes over the Past Two Decades (2001–2020)

by
Rimutė Stakėnienė
1,
Kęstutis Jokšas
1,2,
Jūratė Kriaučiūnienė
3,
Darius Jakimavičius
3 and
Eva Raudonytė-Svirbutavičienė
1,*
1
Nature Research Centre, Akademijos Str. 2, 08412 Vilnius, Lithuania
2
Faculty of Chemistry and Geosciences, Vilnius University, Naugarduko Str. 24, 03225 Vilnius, Lithuania
3
Laboratory of Hydrology, Lithuanian Energy Institute, Breslaujos Str. 3, 444003 Kaunas, Lithuania
*
Author to whom correspondence should be addressed.
Water 2023, 15(23), 4096; https://doi.org/10.3390/w15234096
Submission received: 20 October 2023 / Revised: 15 November 2023 / Accepted: 24 November 2023 / Published: 26 November 2023

Abstract

:
The Baltic Sea faces prolonged eutrophication due to nutrient pollution, with the Nemunas River regulating nutrient input via the Curonian Lagoon. In this study, we aimed to assess the seasonal variations and changes over the past two decades in nutrient concentrations within the Curonian Lagoon–Baltic Sea transitional zone, and to identify the main factors affecting these trends. We observed slightly reduced nutrient levels in the lagoon and the Klaipėda Strait and increased nitrogen loadings in the Baltic Sea nearshore over time. Between 2007 and 2009, the average total nitrogen (TN) concentrations in the Klaipeda Strait and the Baltic Sea were 1.60 ± 0.25 and 0.54 ± 0.04 mg/L, respectively, while the average total phosphorus (TP) concentrations in the Klaipeda Strait and the Baltic Sea were 0.061 ± 0.04 and 0.03 ± 0.01 mg/L, respectively. Between 2018 and 2020, TN concentrations in the Strait and the Sea were 1.2 ± 0.36 and 0.65 ± 0.32 mg/L, respectively, while the average TP concentrations in the Klaipeda Strait and the Baltic Sea were 0.025 ± 0.002 and 0.021 ± 0.002 mg/L, respectively. The average annual amount of TN and TP entering the Curonian Lagoon from the sea was 2736 t and 162 t, respectively. Significantly higher nutrient influx to the Baltic Sea was recorded reaching 32,302 t for TN and 1278 t for TP. Nutrient concentrations correlated with water temperature, salinity, and dissolved oxygen, influenced by seasonal runoff patterns and climate change. Over time, there have been noticeable shifts in environmental conditions, including rising temperatures, decreasing oxygen levels, salinity changes, increased evaporation, and reduced precipitation.

1. Introduction

Inorganic nitrogen (N) and phosphorus (P)-based compounds are nutrients that impact the degree of eutrophication in water bodies [1]. The excess of these nutrients can lead to flourishing of harmful algae, altered water turbidity, oxygen depletion, and alterations in biodiversity. Eutrophication caused by excessive nutrient inputs is a major environmental concern for the Baltic Sea that has persisted for an extended period [2,3,4,5]. Over the past century, the amount of nutrients entering the Baltic Sea from the land and the atmosphere has tripled: in recent years, it has risen to approximately 770 kt and 45 kt of nitrogen and phosphorus per year, respectively [6]. To address the problem of eutrophication, governments are taking measures by controlling the entry of nutrients into the marine environment. Investments in municipal and industrial wastewater treatment and management have led to improvements in the quality of inland waters [5,7]. In recent years, water protection policies have focused on addressing the impact of agriculture, which is currently a major source of nutrients in water bodies [8,9]. It was previously shown that the specific nutrient load from agricultural areas can be as much as 12 times higher for phosphorus and 6 times higher for nitrogen compared with forested areas [10]. In Lithuania, agriculture may be responsible for up to 75–90% of the total nitrogen (TN) and around 70% of the total phosphorus (TP) load in the Nemunas River Basin [11,12].
The long-term trends indicate that the inflow of nutrients from the river-drained areas, especially agricultural areas, is still high [13]. According to research data from 2011 to 2018, 1438 kt of nitrogen enters the Baltic Sea annually, the main source of this nutrient being rivers [5]. Achieving a good ecological status in the Baltic Sea remains challenging, as factors such as peatland destruction and climate change diminish the effectiveness of current measures [13]. Despite ongoing efforts, good environmental conditions for the Baltic Sea had not been achieved by 2021. Therefore, the countries around the Baltic Sea accepted an updated action plan for improving its environmental conditions by 2030 [14]. According to the Baltic Sea Action Plan (BSAP), Lithuania has committed to reduce its nitrogen and phosphorus inputs to the Baltic Sea by limiting its nutrient input to no more than 25,878 t of TN and no more than 703 t of TP per year [14]. Despite this, studies have shown that the actual pollution from Lithuania remains higher than the maximum allowed. From 1995 to 2019, the average annual loads of TN and TP to the central part of the Baltic Sea from Lithuania were 38,289 t and 1351 t, respectively (Environmental Protection Agency data). While Lithuania has achieved its target reduction for phosphorus loads, the reduction of nitrogen loads is still in progress [15,16].
The Nemunas River is one of the largest rivers that affects the influx of nutrients into the Baltic Sea. The Nemunas flows into the shallow (average depth 3.8 m) freshwater Curonian Lagoon, and a constant exchange of water masses between the sea and the lagoon occurs through the narrow Klaipėda Strait that serves as a transitional zone linking the two water bodies. The productivity of estuaries depends on the nutrient input from upstream and specific hydrometeorological conditions [3,17]. Coastal ecosystems are crucial for reducing nutrient loading due to their high productivity and biogeochemical activity [18,19]. Biogeochemical processes typically function to alter, capture, and remove nutrients originating from upstream rivers [19,20]. Therefore, variations in nutrient levels within the Curonian Lagoon reflect the interplay between hydrometeorological factors and biogeochemical processes occurring in the Nemunas River Basin. Human activities in the Klaipėda Strait, such as port maintenance, can also affect the water column of the basin [21]. Nutrients enter the coastal waters of the Baltic Sea through the entire transit zone of the Nemunas–Curonian Lagoon, reflecting the cumulative effect of biogeochemical and anthropogenic factors.
One of the key factors that influence the amount of biogenic materials transported between the Curonian Lagoon and the Baltic Sea is the variation in the water balance elements of the lagoon. Elements of the water balance in the Curonian Lagoon have been affected by both climate change and anthropogenic activities. The development of the Klaipėda State Seaport involved dredging of the Klaipėda Strait and reconstruction of the port quays. As a result, the permeability of the Klaipėda Strait has been altered, leading to changes in the flow structure and sediment transport in the northern part of the Lagoon as well as the Strait itself [22]. The Curonian Lagoon’s long-term water balance has been calculated previously, with the first calculations by E. Červinskas in 1956 [23] and the most recent by D. Jakimavičius et al. in 2010 for the period 1960–2007 [24]. This article extends these calculations up to 2020 to provide a more comprehensive picture of the water balance in the Lagoon. The obtained results will enable the assessment of biogenic transport in the Curonian Lagoon–Baltic Sea transit zone during recent decades. The aim of this research is to evaluate the seasonal characteristics of the concentration distribution of nutrients, specifically nitrogen and phosphorus, in the transitional zone of the Nemunas River–Curonian Lagoon–Baltic Sea. We also aimed to evaluate the changes in the amount of N and P entering the Baltic Sea through the Klaipėda Strait over the past two decades, based on the data obtained from the water balance measurements.

2. Materials and Methods

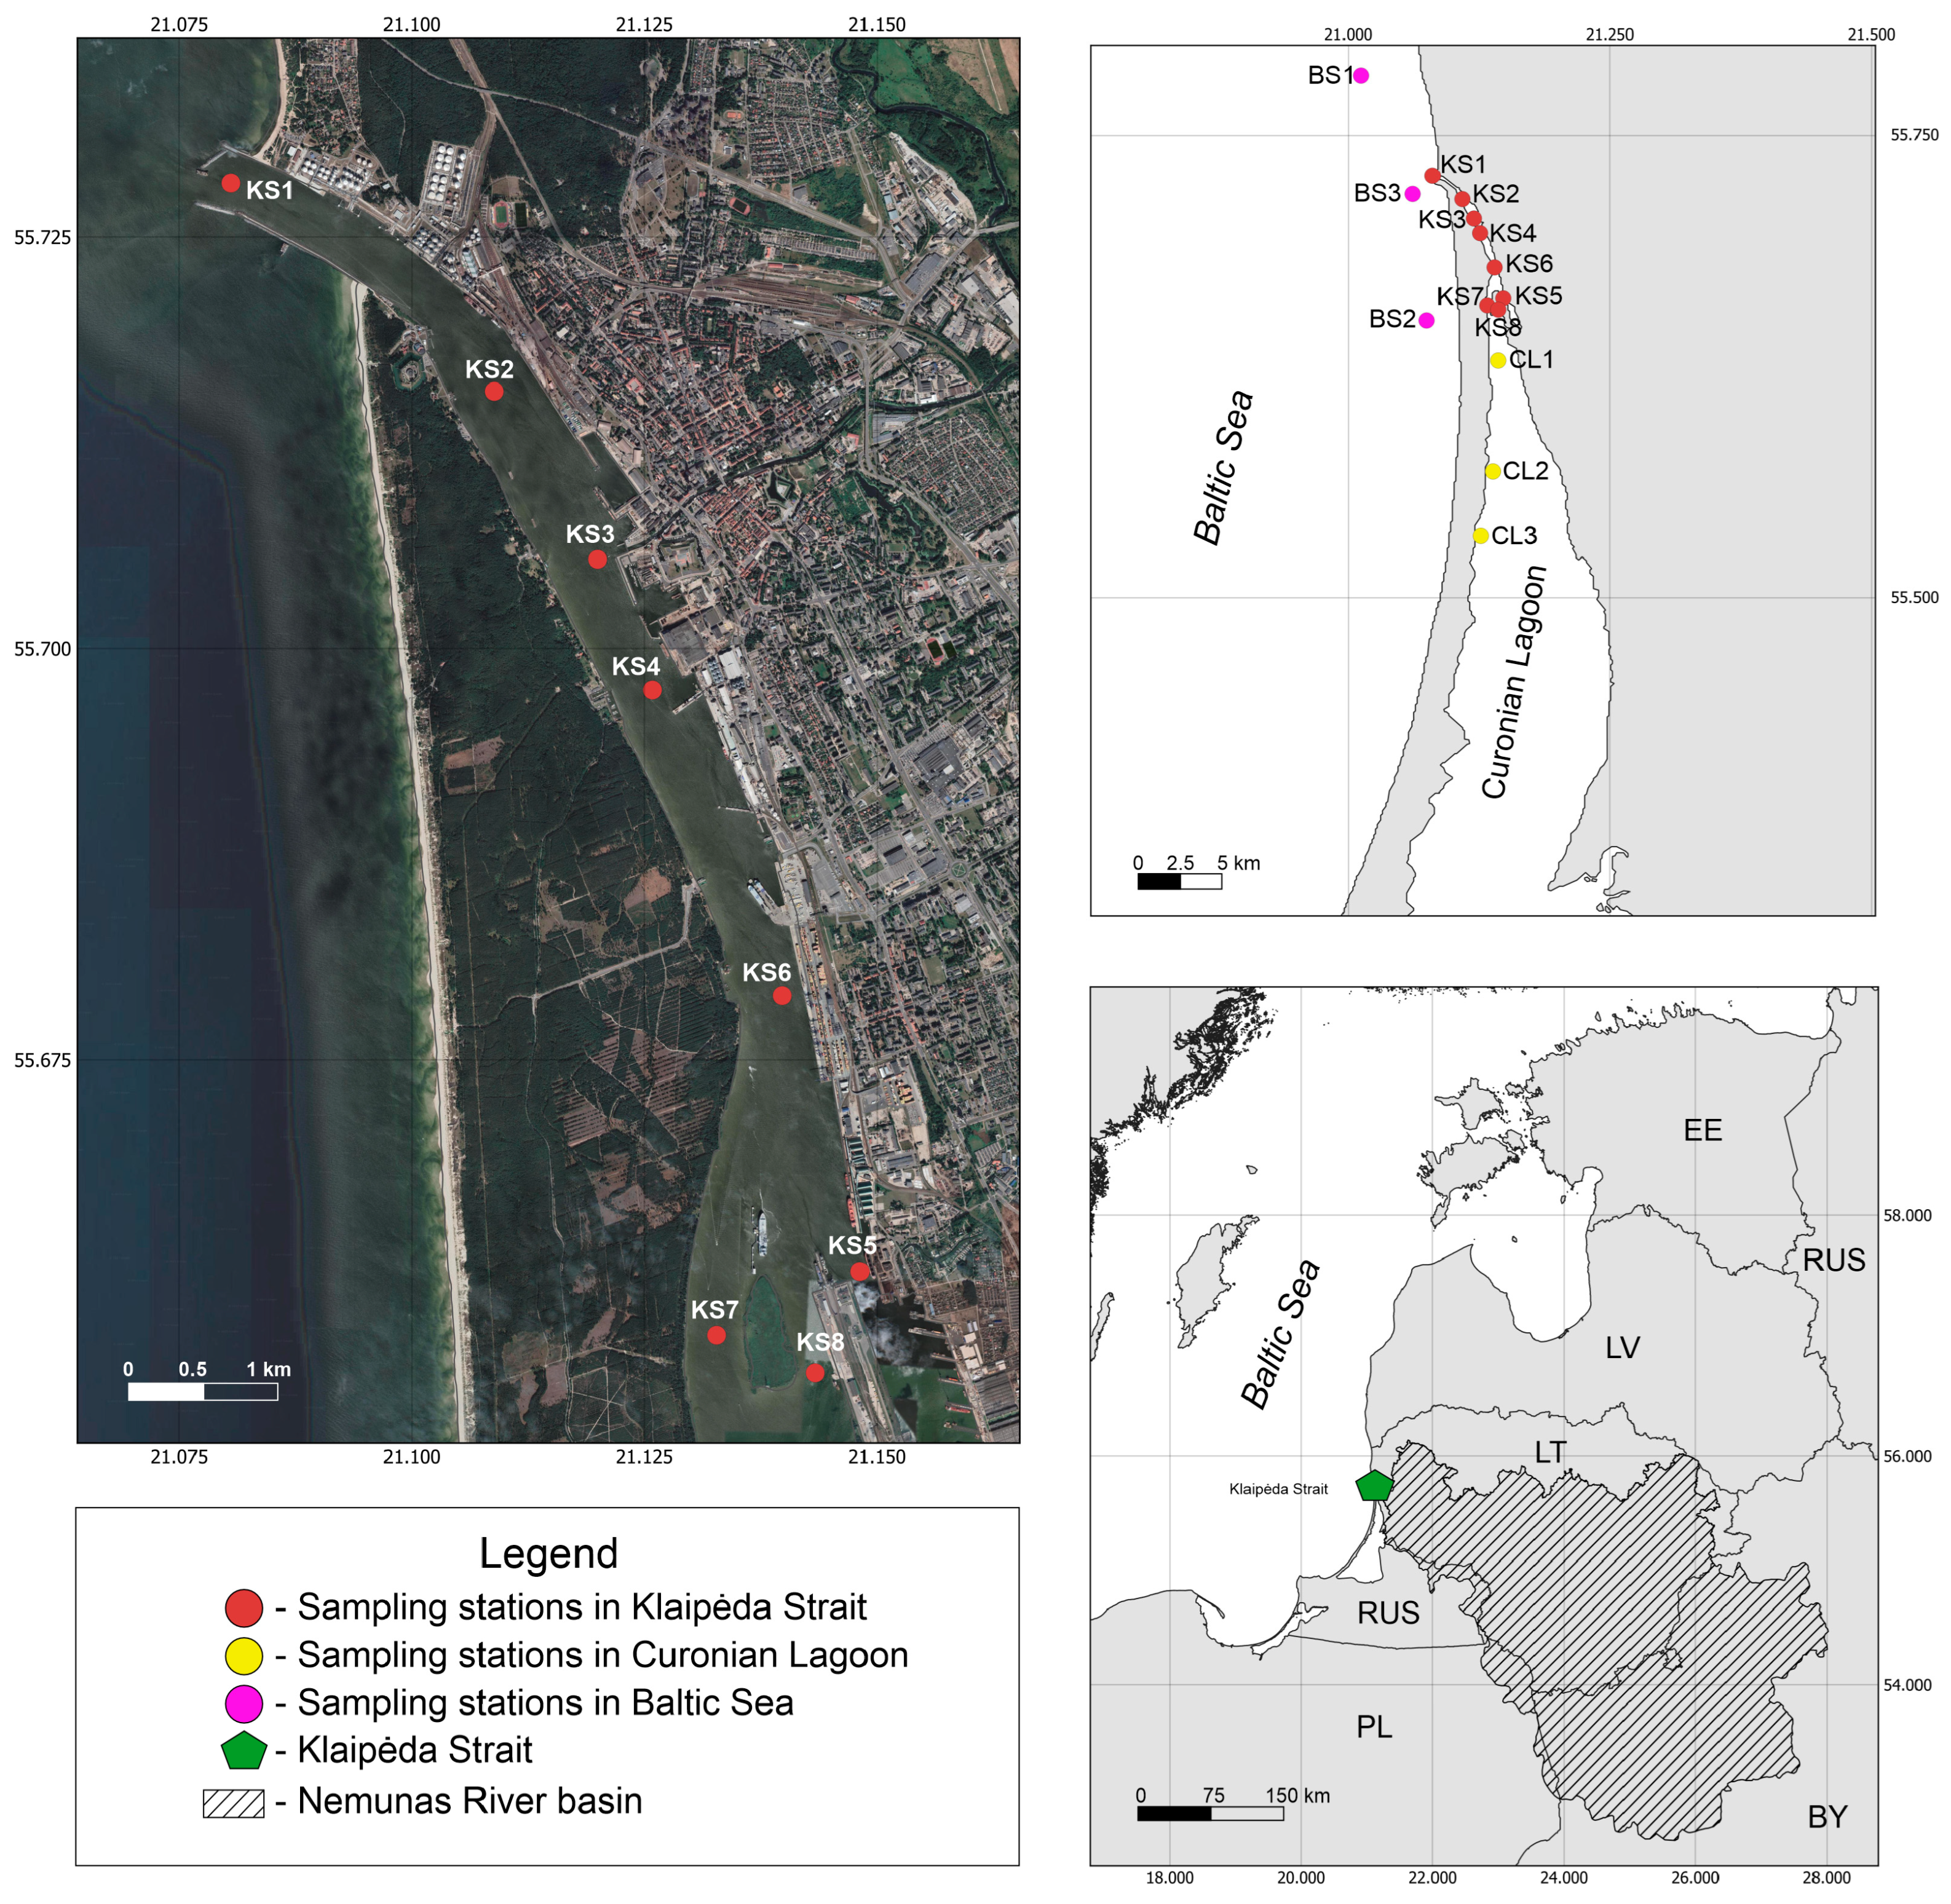
2.1. Study Area and Sampling

The area of this study includes the Lithuanian part of the Curonian Lagoon (CL), the Klaipėda Strait (KS), and the Baltic Sea nearshore (BS, Figure 1). The Curonian Lagoon is a shallow semi-enclosed freshwater lagoon separated from the Baltic Sea by the Curonian Spit [25]. The circulation of water in the Curonian Lagoon is primarily influenced by the discharge of the Nemunas River and the direction of the wind [26]. The movement of water from south to north occurs because of the Nemunas River’s flow and the differences in water levels between the lagoon and the sea, and this current extends from the Nemunas Delta to the Klaipėda Strait [27]. Approximately 22 km3 of fresh water enters the lagoon each year as river runoff [28]. Moreover, the Nemunas River transports around 342,000 metric t of particulate matter into the lagoon through its tributaries [29]. The southern and central parts of the Curonian Lagoon are freshwater (<0.5 psu), while the northern part is oligohaline with irregular salinity (from 0 to 8 psu) fluctuations [25]. The northern part of the Curonian Lagoon connects the lagoon with the Baltic Sea through the Klaipėda Strait, which is characterized by a large technogenic and anthropogenic load [29,30,31].
Field investigations were carried out during seasonal expeditions (4 surveys per year) in winter (February), spring (May), summer (August), and autumn (November) of 2007–2009 and 2018–2020. The water was collected from the surface (0–0.5 m) and near-bottom (0.5–1 m above the bottom) water layers. Three sites were situated in the northern part of the Curonian Lagoon (CL1–3), eight sites (KS1–8) in the Klaipėda Strait, and three sites (BS1–3) in the nearshore of the Baltic Sea (Figure 1). Locations of sampling sites were chosen so that samples from different environments with varying salinity and other properties (lagoon, strait, and sea) were provided. All the data provided in this study originate from our extensive, long-term observations; no other sources were used in this study.
To calculate water balance and amount of biogenic elements (TN and TP) in the Klaipeda Strait (KS1, KS2, KS3) and in the nearshore Baltic Sea (BS1–3), seasonal data from 2001 to 2020 were used. Three sites were situated in CL—Curonian Lagoon, KS—Klaipėda Strait, BS—Baltic Sea.
The following data were used for estimation of water balance in the Curonian Lagoon in the period 2001–2020: river runoff, water levels of the Curonian Lagoon, air temperature, precipitation amount, and duration of ice cover on the Curonian Lagoon. Daily data from 6 water gauging stations (WGSs: Šešupė at Kudirkos Naumiestis, Nemunas at Smalininkai, Jūra at Tauragė, Šešuvis at Skirgailai, Minija at Kartena, Akmenos–Danės at Kretinga) were used to calculate river inflow to the Curonian Lagoon. For the calculation of volume change, daily data of the water level at Nida were used. Monthly mean precipitation, air temperature, and duration of ice cover data from Nida and Klaipėda MS were used to calculate the precipitation amount that fell in the Curonian Lagoon and evaporation from the Curonian Lagoon.

2.2. Methodology for Calculation of the Curonian Lagoon Water Balance Elements

The water balance elements of the Curonian Lagoon (inflow from the Baltic Sea to the Curonian Lagoon and outflow from the Curonian Lagoon to the Baltic Sea) are necessary for the assessment of biogenic transport in the lagoon–sea transit zone. The water balance of the Curonian Lagoon analyzed in this work is described by the following equation [32]:
(QR + P − E) + (QS − QL) = ΔV
where QR is river inflow to the Curonian Lagoon, P is precipitation in the Curonian Lagoon, E is evaporation from the Curonian Lagoon, QS is inflow from the Baltic Sea to the Curonian Lagoon, QL is outflow from the Curonian Lagoon to the Baltic Sea, and ΔV is change in the volume of the Curonian Lagoon.
River inflow to the Curonian Lagoon was calculated by using the discharge of the Nemunas, Šešupė, Šešuvis, Jūra, Minija, and Akmena–Danė rivers. Discharge at the WGS, where measurements were taken, was recalculated for the river mouth (multiplying by appropriate coefficients obtained according to the catchment area ratio between WGS and river mouth).
Precipitation and evaporation were determined according to the data of Klaipėda and Nida meteorological stations (MS). Precipitation was estimated using the precipitation data from two MS and Thiessen polygon methods. Evaporation was calculated applying the Thornthwaite equation [33].
For the calculation of volume change, daily data of river inflow and mean water level of the lagoon at Nida were used. The water surface area of the lagoon was assessed according to the relation between water level and surface area. According to the daily data of volume variation and total river inflow, water exchange between the sea and the lagoon was calculated. These discharges were computed by deducting total river inflow from the volume change. Negative discharge means that water flows from the Curonian Lagoon to the Baltic Sea, and positive shows the opposite flow direction.
Two components of water balance (QL and QS) were used for calculation of nutrient amounts from the Curonian Lagoon to the Baltic Sea and from the sea to the lagoon.

2.3. Analysis of Water Samples

Water samples were collected, stored, and handled in accordance with the standards LST EN ISO 5667-3:2006 and LST EN ISO 5667-1:2007/AC:2007 [34,35].
An echo sounder was used for measuring the depth in the monitoring stations. Water samples were collected from the surface and subsurface layers using a Niskin bathometer. In field conditions, the salinity (S), dissolved oxygen concentration (O2), and water temperature (T) were measured using a Multi 340i multimeter by WTW. Standard hydrochemical methods were employed to measure other water parameters. Phosphate (P/PO43−) and TP in the water were determined using a spectrometric method with ammonium molybdate, following the guidelines of LST EN ISO 6878:2004 [36]. The organic phosphorus (OP) concentration was calculated from the difference between TP and inorganic phosphorus (P/PO43−) concentrations.
The concentration of ammonium (N/NH4+) in the water was determined using ion exchange chromatography, following the guidelines of LST EN ISO 14911:2000 [37]. Nitrites (N/NO2) in the water were measured using a molecular absorption spectrometric method as specified in LAND 39-2000. Nitrates (N/NO3) content in water was determined using a spectrometric method with sulfosalicylic acid, following the procedures outlined in ISO 7890-3:1988 [38]. TN in water was measured through oxidative mineralization using peroxodisulphate, in accordance with ISO 11905-1:1997 [39]. The organic nitrogen was calculated from the difference between TN and inorganic nitrogen (N/NH4+, N/NO3; N/NO2) concentrations. For spectrometric analysis, a GENESYS 10S UV-VIS spectrophotometer (Thermo Fisher Scientific, Waltham, MA, USA) was used, whereas for chromatographic determination of the analytes, an ion chromatography system (ICS) DIONEX ICS 1000 (Thermo Fisher Scientific, Waltham, MA, USA) was used.

2.4. Statistical Analysis

Relationships between the various parameters were analyzed using Statistica 8.0 software (StatSoft, Inc., Tulsa, OK, USA). Principal component analysis (PCA) was employed to identify factors that connect the variables of nutrients and the analyzed water indicators (temperature T, salinity S, dissolved oxygen O2) in the Baltic Sea and the Curonian Lagoon including the Klaipeda Strait. Data from 2018 to 2020 were used for PCA analysis. The PCA technique enabled exploration of relationships and patterns within the data, highlighting the key components that contribute to the overall variability of the water characteristics. Before the PCA, raw data were mean-centered and scaled. PCA was performed using Varimax rotation as a preferable transformation technique, and three PCs with eigenvalues >1 were selected.

3. Results and Discussion

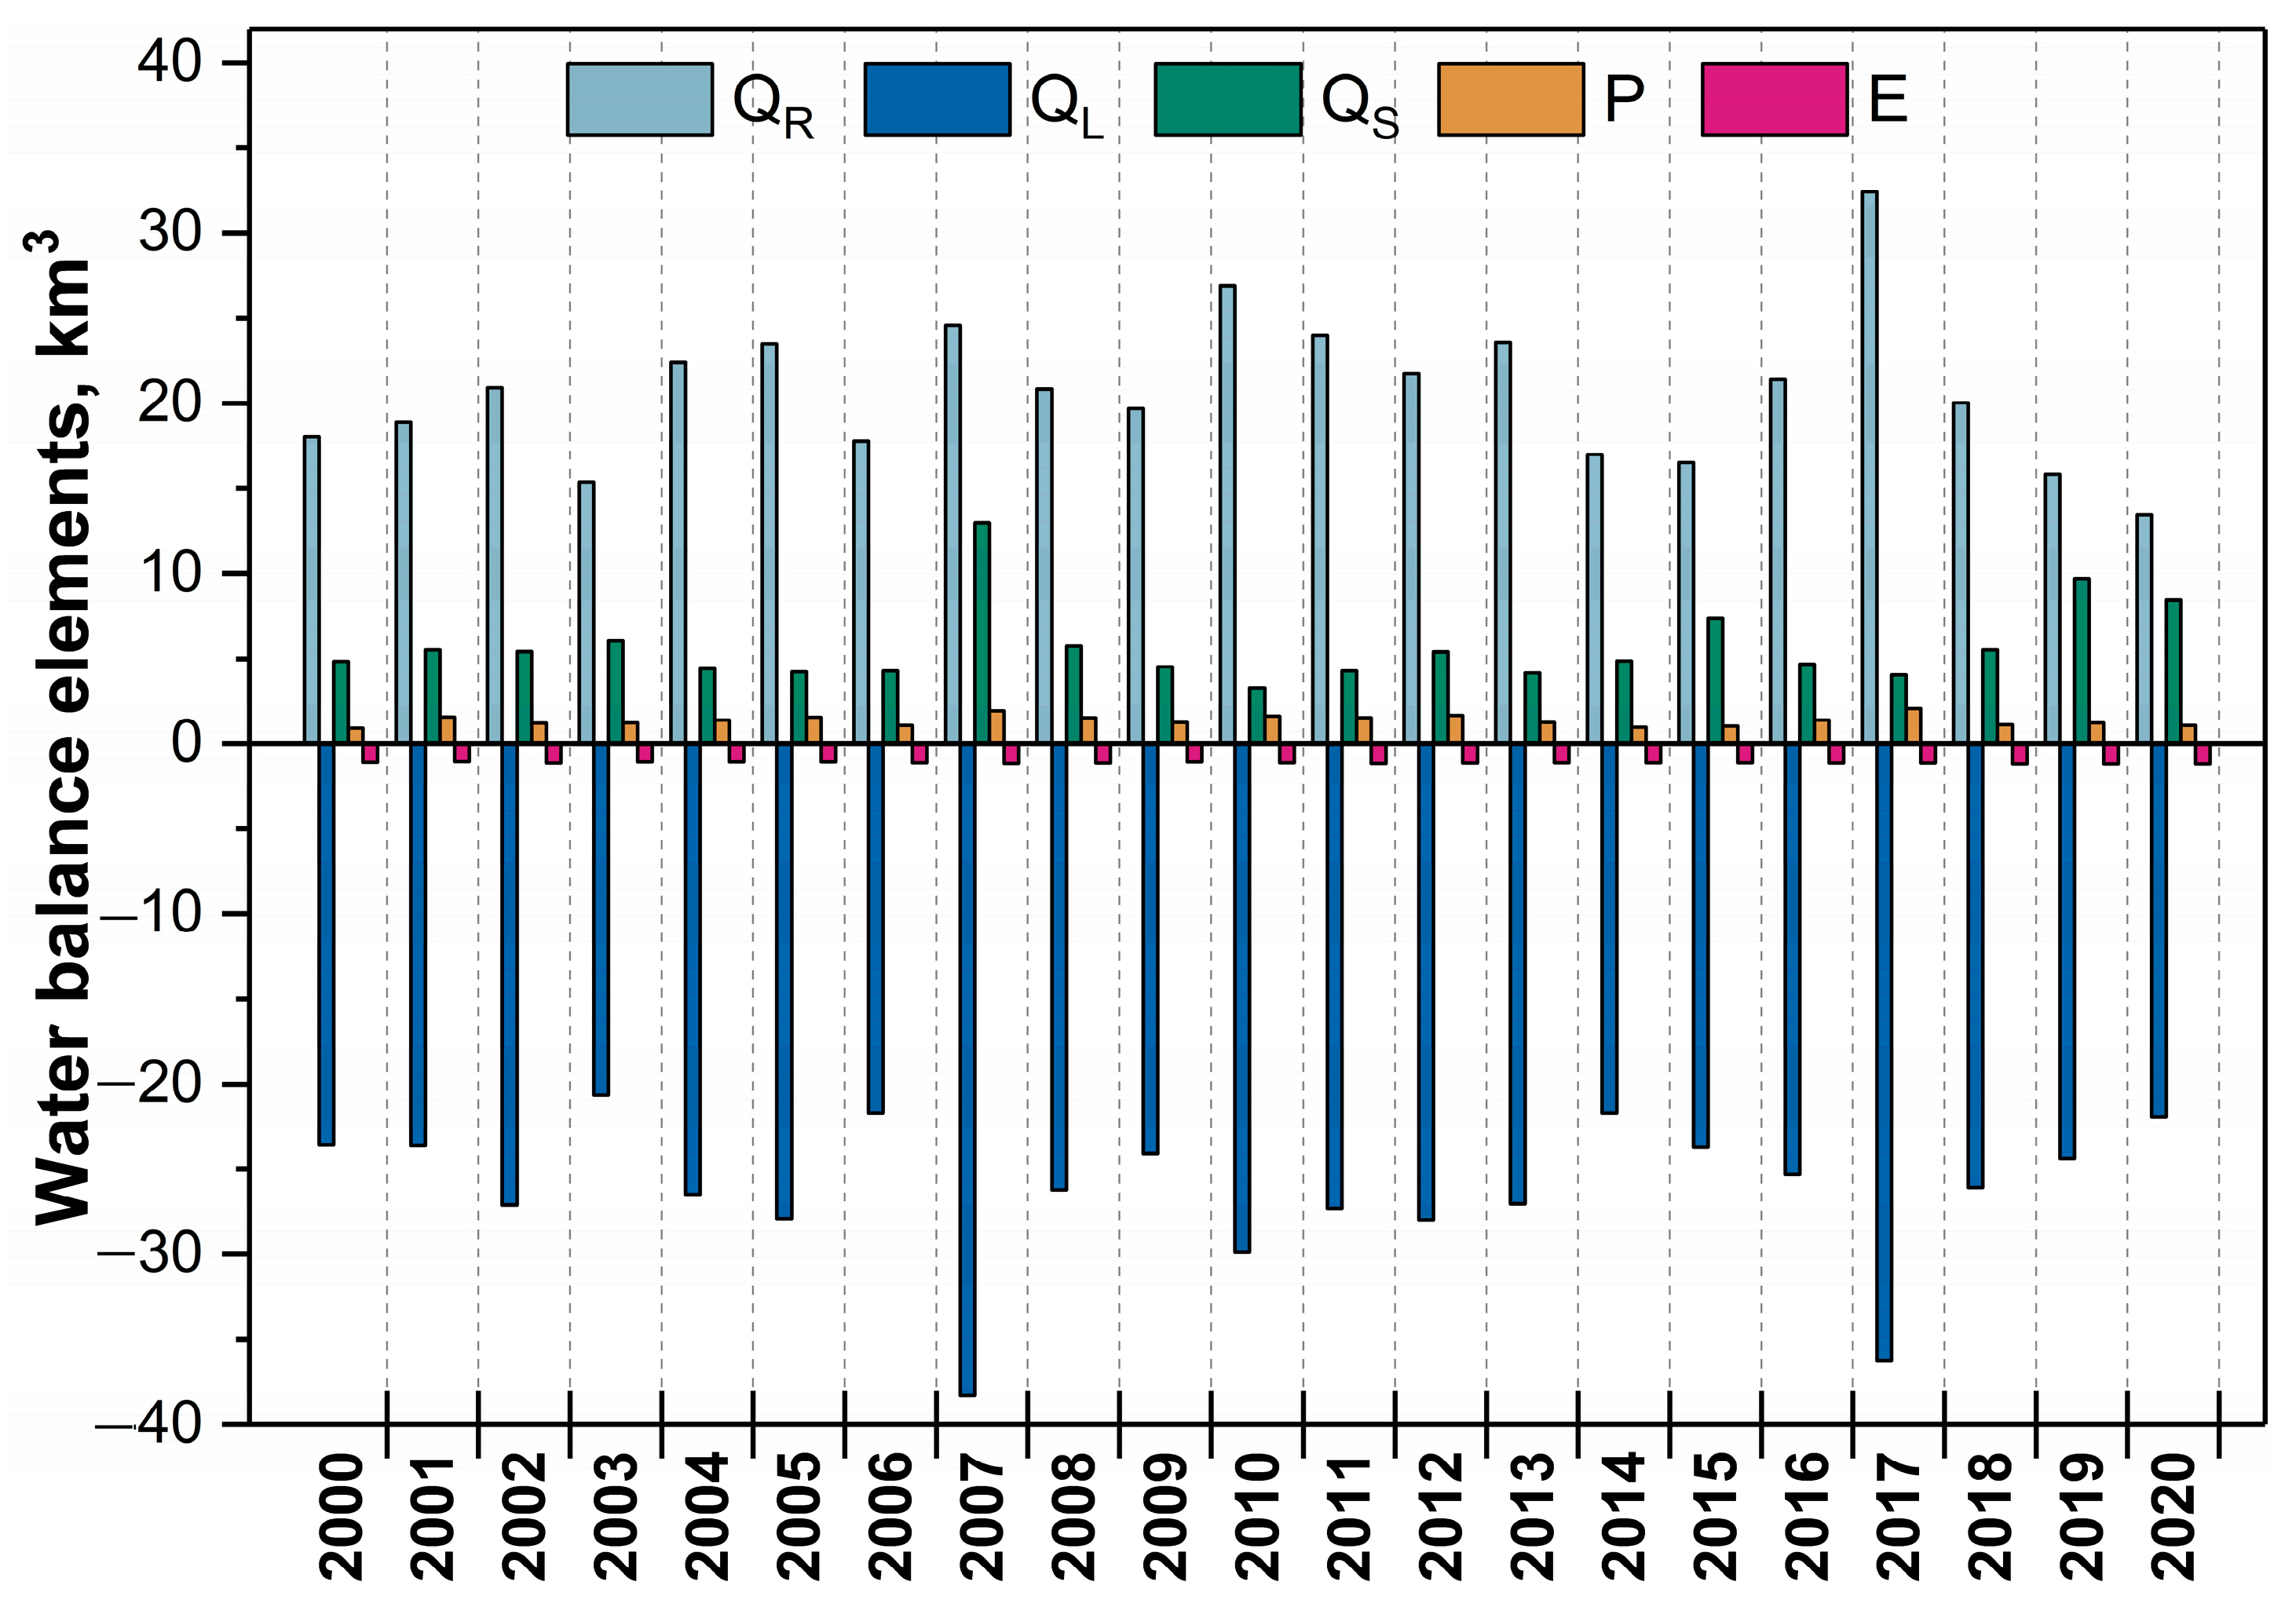
3.1. Changes of the Water Balance Component of the Curonian Lagoon in the Period of 2001–2020

The water circulation patterns in the Curonian Lagoon, particularly in its northern part at the Klaipėda Strait, are affected by the difference in water levels between the Curonian Lagoon and the Baltic Sea. The intensity of circulation is determined by the permeability of the strait, which increases progressively with each deepening of the Klaipėda port water area [24,40,41,42,43]. When the water level in the lagoon surpasses that of the Baltic Sea, water flows from the lagoon towards the sea. Long-term water level observations indicated that approximately 18% of the time, the water of the Baltic Sea flows into the Curonian Lagoon [44].
The water balance of the Curonian Lagoon was calculated using the methodology presented above. Water balance incomes consist of rivers inflow (QR), inflow from the sea (QS), and precipitation (P), while water balance losses consist of outflow from the lagoon (QL) and evaporation (E) (Figure 2).
As presented in Figure 2, evaporation and precipitation make up a very small part of the water balance. In the period 2001–2020, the average annual evaporation and precipitation were 1.095 km3/year and 1.387 km3/year, respectively. River inflow was calculated at daily intervals. The average annual river inflow was 20.848 km3 and it varied from 13.422 km3 (2020) to 32.434 km3 (2017). The average runoff from the Curonian Lagoon to the Baltic Sea in this period was 26.383 km3/year and varied from 20.651 km3 (2003) to 38.268 km3 (2007). The average inflow from the Baltic Sea to the Curonian Lagoon was 5.748 km3/year and varied from 3.276 km3 to 12.967 km3 in individual years. Annual evaporation increased but precipitation slightly decreased in the investigated period.

3.2. Characteristics of the Curonian Lagoon–Baltic Sea Transitional Zone in the Past Decade: Salinity, Water Temperature, and Dissolved Oxygen

Estuaries are known to experience high salinity fluctuations, which are linked to flocculation and sedimentation processes in the water column [1]. Alterations in physicochemical parameters, such as temperature and salinity, affect marine populations and their abundance, which in turn have an impact on the nutrient consumption and loadings in the water [3,45].
The average water column temperature in the study area was found to be higher in 2018–2020 than in the previous period 2007–2009 (Table 1). In Lithuania, the average multi-year air temperature from 1981 to 2010 was 6.9 °C. Including the most recent decade (1991–2020), the average temperature has already risen to 7.4 °C. According to the Lithuanian Hydrometeorological Service, 2020 was the warmest year in the country’s history of meteorological observations, with an average annual air temperature of 9.2 °C.
Such a rise in temperature is related to the increased production which in turn affects concentration of dissolved oxygen. Significantly lower concentrations of dissolved oxygen were recorded in the whole study area between 2018 and 2020 compared with the measurements conducted in 2007–2009 (Table 1). Numerous studies have already demonstrated that dissolved oxygen concentration in hypertrophic systems depends highly on production and respiration rates. Elevated nutrient availability stimulates the growth of phytoplankton and aquatic plants, enhancing their primary productivity. This, in turn, can lead to an increase in dissolved oxygen (DO) concentration through the process of photosynthesis. However, the heightened production of organic matter also results in the proliferation of heterotrophs, which consume oxygen during respiration, consequently reducing DO levels. Consequently, in such biologically active systems, the primary drivers of the oxygen regime are photosynthesis and respiration (Harper, 1992). This is primarily because the rates of change in DO caused by photosynthesis and respiration significantly outweigh the processes of oxygen exchange across the atmosphere–water interface and the dispersion of oxygen within the water column [46].
Climatic factors can also affect the concentrations of biogenic substances and their loads in water bodies [17,47,48,49]. The level of dissolved oxygen in the Baltic Sea could also have been affected by changes in salinity [50] and biogenic oxidation processes that have impact on the biogeochemical cycle of nitrogen and phosphorus and their concentrations in the water column [51,52]. The Baltic Sea is a semi-enclosed body of water with limited exchange of water with the North Sea through narrow straits. Such limited exchange affects the water circulation and nutrient dynamics in the Baltic Sea, which exacerbates the ecological changes in the Baltic Sea, including nutrient imbalances and oxygen depletion [2,53].
The t-test for dependent samples was employed to determine whether there were statistically significant differences (p < 0.05 and p < 0.01) between the means of selected indicator measurements during two distinct periods, namely 2007–2009 and 2018–2020. The comparison of O2, T, and D measurements was conducted separately in the Klaipėda Strait (KS) and in the Baltic Sea (BS).
In the Klaipėda Strait (KS), the means of all three indicators, i.e., O2, T, and D, during different periods (2007–2009 and 2018–2020) differed significantly (p < 0.01; respective means are marked with two asterisks). Meanwhile, in the Baltic Sea, significant (p < 0.05; marked with one asterisk) differences in the means were found for dissolved oxygen in the surface water layer, temperature in the bottom layer, and dissolved oxygen and temperature in the water column (p < 0.01). Changes in the average salinity in the Baltic Sea were insignificant (p > 0.05).
The salinity values recorded in the Klaipeda Strait and Curonian Lagoon during the period 2018–2020 were higher compared with the previous periods analyzed—2007–2009 (Table 1) and 1986–2005 (average value of 2.5 psu recorded in the Klaipeda Strait, and 1.2 psu in the lagoon [28]). The rise in salinity levels observed in the strait and lagoon can be attributed to the enhanced permeability of the strait, as well to an upsurge in seawater movement [24,40,41,42]. In the autumn of 2019 and 2020, a significant inflow of seawater was observed in the whole Curonian Lagoon, with salinity values reaching up to 6.3 psu.
The winter seasons of 2018–2020 were characterized by the lowest salinity values. The water salinity in the Curonian Lagoon averaged less than 0.5 psu in this period, whereas in the Klaipėda Strait, salinity values reached 0.9 psu and 1.9 psu in the surface and bottom layer, respectively. Similarly, the coastal waters of the Baltic Sea (BS) showed the lowest salinity in the winter season, with an average of 5.7 psu at the surface and 6.7 psu at the bottom. In May, which is when our spring measurements were taken, the amount of continental runoff had significantly decreased. As a result, the average salinity values in both the strait and lagoon were already high, especially near the bottom (4.0 and 1.9 psu at the surface and 6.0 and 2.0 psu at the bottom, respectively). The salinity in the coastal waters of the Baltic Sea reached 6.6 psu at the surface and 6.9 psu at the bottom.
The dynamics of salinity in the Klaipėda Strait are largely influenced by the specific hydrometeorological factors at each sampling location, with seasonal changes still playing a significant role, although their impact has been reduced due to global warming and, as a consequence, reduced seasonal differences. Typically, higher salinity values are observed during the cold season, while the spring flood is expected to dilute the water in both the lagoon and the strait, leading to a decrease in salinity. The opposite trends observed in our study could be associated with the effects of the climate. While the majority of freshwater runoff, resulting in a regular decrease in water salinity, still typically occurs in spring (March–April), river runoff may also increase in other seasons. Elevated temperatures during the cold period lead to a shift in precipitation from snow to rain. This causes precipitation to reach rivers at a faster rate, resulting in earlier river floods [24]. An increased inflow from the rivers could be responsible for the decreased salinity in the study area. The Lithuanian Hydrometeorological Service has reported positive temperature anomalies of 3.6–5 °C during February 2019–2020, coinciding with the period of our study. Moreover, irregular seasonal fluctuations in sediment pollution levels were previously observed in the Klaipeda Strait [30]. According to Zemlys et al. (2013), strong winds blowing from the north and northwest might cause barotropic inflow, resulting in an intrusion of the salty water into the Curonian Lagoon [43].

3.3. Spatial and Temporal Variations in Nutrient Concentrations

It has already been observed that the loads originating from rivers can exhibit significant short-term variability, which in turn affects the levels of both dissolved and particulate substances [54]. However, in this research, our focus was on examining the average concentrations over each period, rather than delving into short-term fluctuations, with the aim of providing a more accurate representation of long-term trends.
The t-test for dependent samples was employed to determine whether there were statistically significant differences (p < 0.01 and p < 0.05) between the means of selected indicator measurements during two distinct periods, namely 2007–2009 and 2018–2020. Comparisons of N/NH4+, N/NO2, N/NO3, TN, P/PO43−, and TP measurements were conducted separately in the Klaipėda Strait (KS) and in the Baltic Sea (BS).
In the Klaipėda Strait (KS), the means of all indicators N/NH4+, N/NO2, N/NO3, TN, P/PO43−, and TP differed significantly (p < 0.01, respective means are marked with two asterisks). Meanwhile, in the Baltic Sea, significant differences in the means were found for N/NH4+, N/NO2, N/NO3, TN (p < 0.05, marked with one asterisk), and TP (p < 0.01, marked with two asterisks). Changes in the average concentrations of P/PO43− in the Baltic Sea were insignificant (p > 0.05).
Notable decreases in the average concentrations of TN, N/NO3, N/NO2, TP, and PO43− were recorded in recent years (2018–2020, Table 2). This trend was obvious in both the Curonian Lagoon and the Klaipėda Strait. Similarly, the Warnow estuary in the southern Baltic Sea was characterized by decreasing concentrations of TP over the period 2000–2018 [55]. Along the coast of the Baltic Sea, the average concentrations of phosphorus-based compounds were lower, while nitrogen concentrations showed a slight increase (Table 2). It is worth noting that concentrations of ammonium ions slightly increased in both the lagoon and in the Baltic Sea (Table 2). In the Klaipėda Strait, the percentage of ammonium ions in the total amount of TN doubled, while along the seacoast, it increased by 1.2 times. The latest HELCOM documents indicate that ammonium emissions to the Baltic Sea have either remained at similar levels or even increased in certain areas [14]. It is important to highlight that even though the nitrite concentration is relatively low, a slight increase was observed over the past three years along the Baltic Sea coastline when compared with earlier research findings (Table 3). This increase could be attributed to natural nutrient biogeocycles, yet we cannot discount the possibility of pollution and eutrophication contributing to this trend [56].
In many EU countries, ammonia emissions are increasing mainly due to the use of mineral and natural fertilizers associated with livestock farming [57]. This highlights the urgent need for more effective mitigation measures in agriculture [14,58].
Our findings are in agreement with a long-term study conducted from 2011 to 2018 in the Baltic Sea that reported relatively high TN concentrations in the water column (0.59 ± 0.48 mg/L, [5]). Substantially higher levels of TN and TP were found in the western Baltic region, particularly in the Greifswalder Lagoon and Rugen Lagoon, where TN averaged between 10 and 16 mgN/l and TP ranged from 0.17 to 0.09 mgP/L [59]. Relatively high TN concentrations were also reported in the Vistula (2 mgN/L) and Oder (3 mgN/L) rivers, which drain the territory of Poland. Such elevated nitrogen levels were linked to the well-developed agriculture in the country [60]. The estimated average nitrate values within the transit zone of the Curonian Lagoon–Baltic Sea ranged from 0.14 to 0.72 mgN/L. These figures exhibit a noteworthy similarity to those observed in the western Baltic lagoons, specifically the Greifswalder Lagoon and Rugen Lagoon chain, during the period 2010–2016, where N/NO3 concentrations were recorded at 0.95 and 0.32 mg/L, respectively [59]. However, it is important to note that the Curonian Lagoon–Baltic Sea values are notably lower compared with Mecklenburg Bay (2.4 mgN/L) and the Warnow River (3.95 mgN/L) [59]. Notably higher nitrate levels were also recorded in catchment in north-western England, where values reached 9.6 mgN/L [61].
It was previously noted that P loadings in Lithuanian waters might be reduced; however, reducing N loadings is hardly possible. The reason is relatively high levels of N present in groundwater and soil [16,62].
Furthermore, the reduction of nutrient concentrations in the water body is affected by various factors, including the incorporation of dissolved substances into primary production, their sedimentation and accumulation in bottom sediments (sediment burial), removal by filter feeders, and release into the atmosphere [63,64,65]. It is worth noting that the Curonian Lagoon exhibits autotrophic characteristics due to high rates of primary production. These characteristics, such as the low N:P ratio, high summer temperatures, and calm weather conditions, induce the growth of N2-fixing cyanobacteria, thereby limiting the lagoon’s ability to accumulate nutrients and act as a sink [16].
It is important to note that there has been no significant decrease in TN concentration in the Baltic Sea, despite enormous efforts to reduce external inputs from surface waters. The inflow of nutrients from sedimentary sources (internal sources) also plays a significant role in the eutrophication of the Baltic Sea [66,67,68,69].

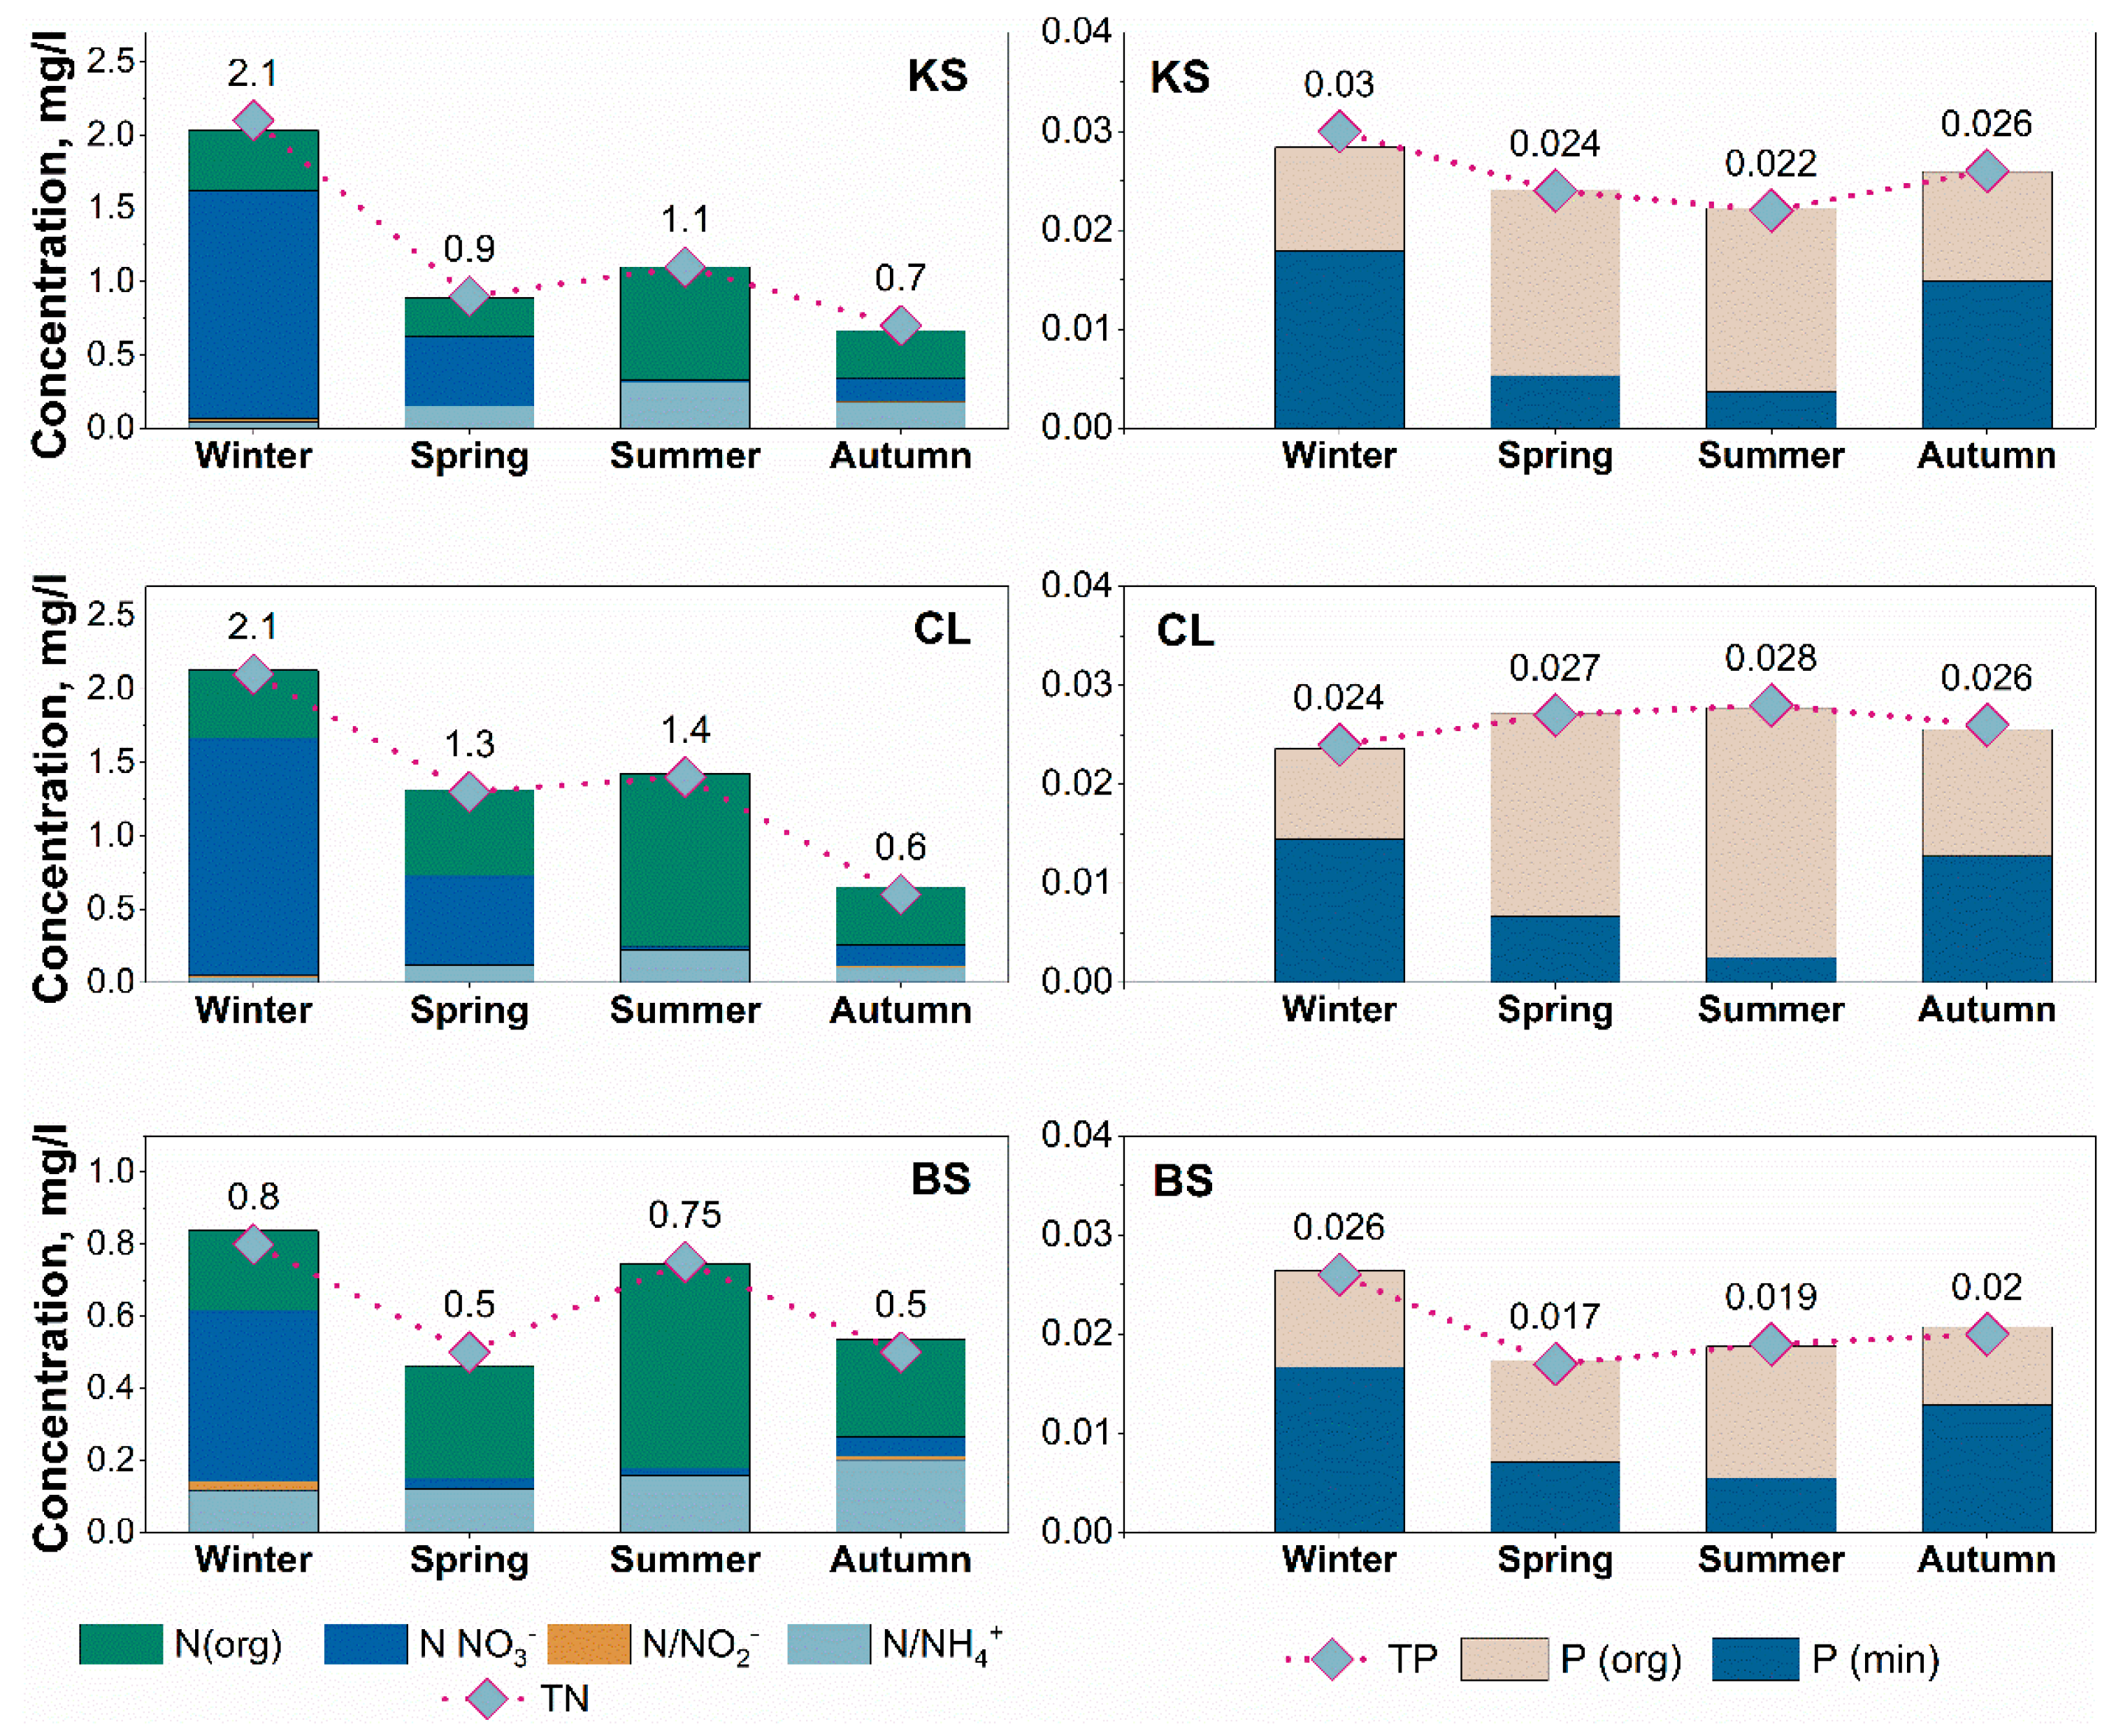
3.4. Seasonal Changes in N and P Concentrations and Distribution over the Course of Three Years (2018–2020)

Usually, the highest concentrations of TN are observed during the cold period when the low ambient temperature would limit production. The dominant form of nitrogen in the water column is mineral nitrogen (N/NH4+; N/NO3; N/NO2), primarily nitrates (N/NO3). During the period 2018–2020, the average nitrate concentrations in the winter season were 1.62 mg/L, 1.55 mg/L, and 0.47 mg/L in CL, KS, and BS, respectively. The maximum N/NO3 value, reaching 2.97 mg/L, was recorded in the CS. In a previous study, even higher N/NO3 concentrations (up to 8.6 mg/L) were found [15].
In natural aquatic environments, nitrate is permanently reduced to dinitrogen by denitrifying bacteria via biological denitrification [70]. With the warming weather, nitrate consumption increases due to more intense production, following the typical pattern observed in natural waters [71,72,73]. Consequently, the concentration of N/NO3 reaches its minimum values (Figure 3). During this period, organic nitrogen plays a significant role as the main component of TN [74,75]. During the summer season, the proportion of organic nitrogen in the Curonian Lagoon reached 83%, 70% in the Klaipėda Strait, and 76% in the Baltic Sea nearshore. It has been demonstrated that organic nitrogen constitutes 85–90% of the reactive nitrogen that enters the Curonian Lagoon from the Nemunas River during spring–summer [15]. The highest average values of ammonium ions (0.22 mg/L in CL, 0.31 mg/L in KS) were recorded during summer. Similar trends were previously observed in the southern part of the Curonian Lagoon in July [73].
Different trends were observed along the coast of the Baltic Sea, where the highest concentrations of ammonia ions (up to 0.20 mg/L) were observed in autumn. Similar findings were reported in seasonal studies of the North Sea, where the highest concentrations of ammonium ions corresponded to the phytoplankton bloom in autumn [71]. The relatively warmer marine environment during autumn promotes the blooming of biota and the continuous remineralization of organic matter into ammonium [76]. In our research period from 2018 to 2020, the average autumn water temperature on the seacoast (11.2 °C) was one degree higher than in the lagoon (10.2). In natural waters, ammonium ions are typically oxidized to nitrites and nitrates through the nitrification process under aerobic conditions (presence of oxygen). However, in warmer weather, nitrification processes can slow down or even stop, leading to the accumulation of ammonium ions in the water, resulting in increased pollution [51].
As the weather cooled, TN concentrations decreased, and the composition of TN components changed in autumn across all studied water areas: organic nitrogen decreased, while the content of mineral nitrogen increased again (Figure 3).
The concentration of nitrites (N/NO2) in water bodies remained very low throughout all seasons due to their inherent instability in water. During the period of 2018–2020, N/NO2 often fell below the detection limits and accounted for only 0–3% of TN content (Figure 3). The highest concentrations of nitrites were typically observed during the colder periods of winter and autumn, following the end of the growing season when organic matter decomposition is more prominent.
The seasonal patterns of total P concentrations exhibit similarities to the distribution of TN along the Baltic Sea coast and in the strait, while a slightly different pattern was observed in the lagoon (Figure 3). The highest TP values in the sea and in the strait were recorded during winter. In contrast, relatively small seasonal fluctuations in TP concentrations were recorded in the lagoon, even though notable changes occurred in the inorganic and organic phosphorus components. Throughout all the seasons, except for spring, the percentage of organic phosphorus in the TP content was the highest in CL compared with the other studied water areas. This highlights the high influence of organic phosphorus in the lagoon environment.
The variations in phosphorus content may be attributed to the Curonian Lagoon’s role as a nutrient filter [16]: the lagoon effectively retains inorganic P while allowing for less retention of inorganic N. Prior research demonstrated that, under specific conditions, especially in the initial days of flowering, there is a notable increase in P regeneration from the sediments in the lagoon [77]. In fact, during summer, this regeneration can surpass the input from the Nemunas River, potentially making the lagoon a net source of P to the Baltic Sea [15].

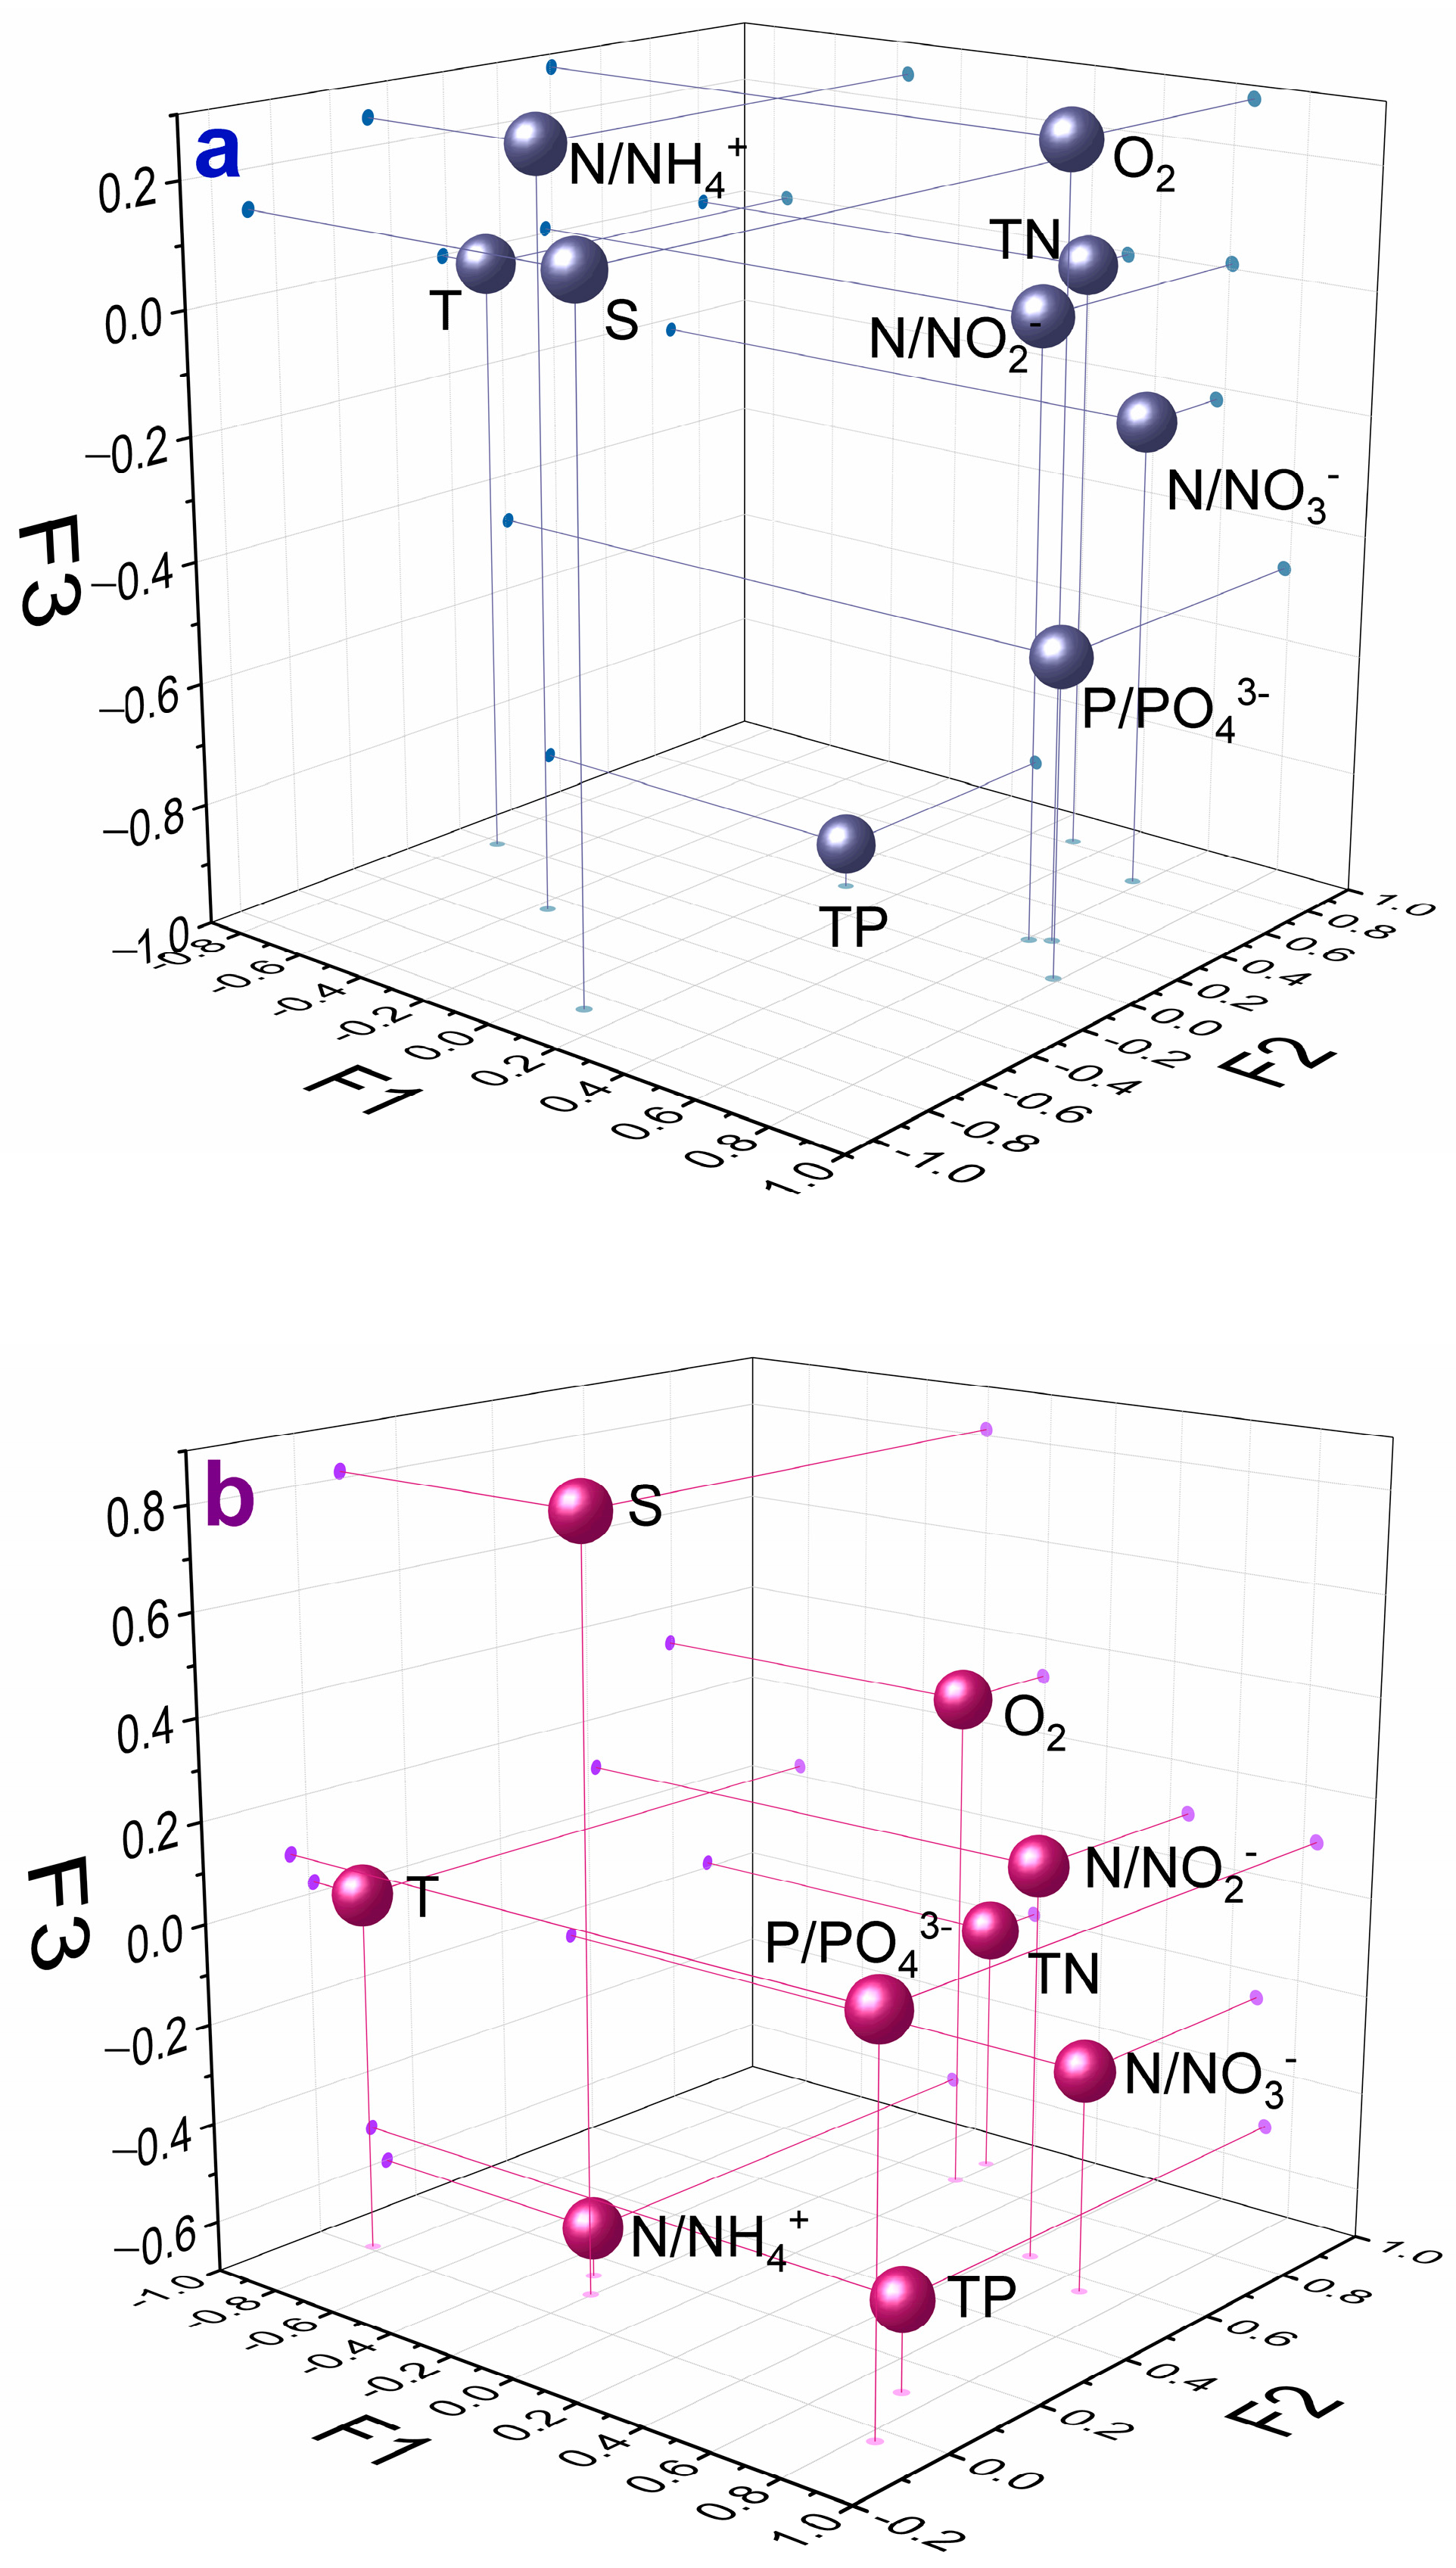
3.5. Relationship between Nutrient Loadings and Water Characteristics

In this study, principal component analysis (PCA) was applied to reveal the interrelations between various parameters (TN; N/NH4+; N/NO3 N/NO2, TP, P/PO43− concentrations, water temperature, salinity, and dissolved oxygen). The results are presented in Figure 4.
In the case of the Curonian Lagoon, three factors (F1, F2, F3) were obtained; their total variances were 28, 25 and 14%, respectively. For further interpretation of the results, only values higher than 0.7 were considered.
The first principal component (F1, Figure 4a) stands out with the highest loadings of phosphates, nitrates, nitrites, and dissolved oxygen. This factor also exhibited the highest negative loading of water temperature. This component could be related to the seasonal environmental and climatic changes: the concentration of dissolved oxygen increases with the lower temperature while the bio-productivity decreases and mineral compounds of nitrogen and phosphorus tend to accumulate in water.
Factor 2 (F2) exhibits the highest loadings of TN and nitrates, along with a significant negative loading of salinity. This factor could be associated with the flow dynamics, including the outflow of fresh water from the Nemunas River and the influx of salty seawater into the Curonian Lagoon. Such flow patterns have recently become more regular due to the warming climate and anthropogenic factors [42]. The presence of salty water alters the solubility and distribution of various compounds in both water and sediments [78,79]. Moreover, changes in salinity within lagoons and estuaries have a significant impact on local populations [80].
The third factor (F3) is characterized by a negative loading of nutrients, particularly TP, along with a relatively significant positive loading of dissolved oxygen and ammonium ions. F3 could be associated with natural biogeochemical processes, such as nitrification and denitrification. The transformations and cycle of nutrients between the bottom sediments and water in the Curonian Lagoon have been extensively investigated in previous studies [81,82]. The process of nitrification takes place solely under aerobic conditions. In aquatic environments, nitrogen-fixing bacteria, primarily cyanobacteria, convert atmospheric nitrogen into ammonium forms. If the oxidation of ammonium to nitrites and nitrates by nitrifying bacteria is disrupted, an increase in ammonium ions is likely to occur. Furthermore, phosphorus plays a crucial role as one of the primary biogenic substances that determine the productivity of a water body. Labile phosphorus-based compounds undergo a faster transition from organic to mineral forms compared with other biogenic substances like carbon and nitrogen [83].
In the examination of the coastal water column in the Baltic Sea, the PCA analysis also produced three factors (Figure 4b) that accounted for variances of 30%, 24%, and 17%, respectively. The first factor (F1) exhibited notable positive loadings for phosphates, nitrates, TP, and dissolved oxygen, as well as negative loadings for temperature. Just like in the case of Curonian Lagoon, F1 indicates the influence of seasonal environmental changes.
F2 was loaded with TN and N/NO3. Significant loadings of nitrites and ammonium ions were also observed. This factor corresponds to ongoing natural biogeochemical processes, specifically the nitrogen and phosphorus cycles in nature, which are intricately linked to the dissolved oxygen levels in the water column [66]. Due to the distinct physical characteristics (such as depth, waves, and water mass) of lagoons and marine water bodies, biogeochemical processes within the different water masses do not occur simultaneously. Instead, there is a certain time delay, with processes initiating earlier in lagoons during spring and extending longer in the marine environment during autumn. As a result, phenomena like water blooming, biomass growth, and related changes in nitrogen and phosphorus concentrations occur earlier in lagoons compared with the open sea.
Water salinity exhibited the highest positive loading in F3, while TN, TP, and ammonia showed negative loadings. It is noteworthy that biogenic substances carried by the currents of the Curonian Lagoon and passing through the Klaipėda Strait play a significant role in influencing the concentrations of these substances along the seacoast.

3.6. Nutrient Transport Flows between the Curonian Lagoon and the Baltic Sea Based on Curonian Lagoon Water Balance Data

We utilized the water balance data of the Curonian Lagoon, considering both the inflow from the lagoon to the Baltic Sea and the inflow from the sea to the lagoon, along with the seasonal values of TN and TP. Based on this information, we conducted an estimation of the nutrient quantities (t) passing through the Klaipėda Strait into the Baltic Sea and vice versa during the period 2001–2020.
Nutrient loadings and their exchange between the Curonian Lagoon and the Baltic Sea strongly depend on the water balance elements (outflow from the Curonian Lagoon to the Baltic Sea and inflow from the Baltic Sea to the Curonian Lagoon). Therefore, it is very important to choose the most appropriate methods for calculating water balance elements. The water exchange between the sea and the lagoon can be evaluated in three ways: (1) by direct measurements [23]; (2) by mathematical modeling [28,84]; and (3) by the water balance method [85]. The first method is rarely used in practice as it is very time-consuming and complicated due to the navigation of ships in the strait. Mathematical modelling using hydrodynamic equations may not accurately describe the water exchange between the sea and the lagoon. Therefore, we used a water balance method to estimate the water exchange between the sea and the lagoon on a daily time step, using hydrometeorological observation data. The Curonian Lagoon water balance for the period 2001–2020 reflects the impact of recent climate change and anthropogenic activities (the development of Klaipėda Seaport including dredging of the fairway and the construction of berths) on nutrient loadings and their exchange between the Curonian Lagoon and the Baltic Sea.
The average concentrations of TN and TP present at the sea gate in the Klaipėda Strait (Table 3) and the water inflow into the sea are two parameters that determine the quantity of nutrients entering the Baltic Sea. Conversely, the calculated seasonal TN and TP concentrations (refer to Table 3) and seawater inflow along the Baltic Sea coast impact the amount of nutrients that enter the Curonian Lagoon through the strait. The nutrient content TN was calculated by multiplying the TN concentration by the seawater inflow or outflow. These calculations were performed on a monthly basis, and the annual nutrient load was determined by summing up the monthly values.
Figure 5 and Figure 6 illustrate the quantities of nutrients entering the Baltic Sea from 2001 to 2020. The average annual amount of TN entering the Baltic Sea was 32,302 t, with a maximum of 44,625 t recorded in 2007 and a minimum of 23,046 t in 2014 (Figure 5a). Relative errors of the monthly discharge of the water inflow into the sea were evaluated using data for the period 2001–2020. The error for monthly discharge into the sea is set at 2.9%. Therefore, the annual amount of TN entering the Baltic Sea may vary between 31,365 t and 33,239 t.
The annual amount of TN varied by almost twofold over the studied period, indicating significant fluctuations in nutrient loads. These variations depend on the inflow to the Baltic Sea and the seasonal concentration of TN. A strong correlation (0.90) was observed between the annual amount of TN and the values of the annual inflow (Figure 5a). However, the TN content is influenced not only by the annual inflow but also by the seasonal distribution of runoff. The concentration of TN exhibits substantial variations across different seasons. For instance, the average concentration in winter is 2.32 mg/L, while in summer it is 0.90 mg/L (Table 3). Hence, a higher inflow during the winter and spring months results in the transportation of a greater quantity of TN to the Baltic Sea. In 2007, the highest discharge of water was recorded, reaching 38.3 km3, and the winter season runoff accounted for 28% of the total annual runoff. This exceptional combination of increased runoff and high concentration of TN led to a substantial nutrient load being transported to the sea, totaling 44,625 t. This highlights the significant impact of both the quantity of water inflow and the concentration of nutrients on the overall nutrient load in the Baltic Sea during that particular year.
Some nitrogen could also be transported from the Baltic Sea to the Curonian Lagoon with the currents in the Klaipėda Strait (Figure 5b). From 2001 to 2020, the average annual amount of TN entering the Curonian Lagoon was estimated at 2736 t, with a maximum of 6245 t occurring in 2007, and a minimum of 1599 t in 2010. Relative error of the monthly discharge of seawater inflow into the lagoon is set at 6.6%. Therefore, the annual TN amount entering the lagoon quantity may vary between 2555 t and 2916 t. A remarkably high correlation coefficient (0.99) indicates a strong relationship between the inflow to the Klaipėda Strait and the total amount of nitrogen entering the lagoon from the sea (Figure 5b). The seasonal concentrations of TN along the Baltic Sea coast exhibit minimal variation (Table 3). Hence, the flux of nutrients from the sea to the lagoon is primarily influenced by the rates of seawater runoff.
During the period from 2001 to 2020, the amount of TN carried from the Curonian Lagoon to the Baltic Sea was approximately 12 times higher than the amount of TN that entered the lagoon from the Baltic Sea. This significant difference in nutrient transport can be attributed to the flow dynamics and water exchange between the two bodies of water. Water flows from the sea to the lagoon for an average of only 75 days per year. Based on water balance data from 2001 to 2020, the average annual inflow from the lagoon to the sea was 26.4 km3, while the inflow from the sea to the lagoon was significantly lower (5.7 km3). Moreover, higher seasonal concentration of N (approx. 2.5 times higher) in the Klaipėda Strait compared with the Baltic coast contributed to the greater flow of nutrients towards the sea. These findings highlight the predominant role of the Curonian Lagoon as a source of TN to the Baltic Sea ecosystem.
Figure 6a illustrates the quantities of TP entering the Baltic Sea from 2001 to 2020. The average annual amount of TP entering the Baltic Sea is 1278 t, with a maximum of 1808 t recorded in 2017 and a minimum of 968 t in 2014. After estimating the relative error in monthly discharge, the annual amount of TP entering the Baltic Sea may vary between 1241 t and 1315 t.
A significant positive correlation (0.98) was observed between the annual amount of TP and the values of the annual inflow to the sea (Figure 6a). In contrast to TN, TP content does not vary significantly across the seasons. Hence, the annual inflow is the main parameter affecting the TP content in the Baltic Sea.
The average annual amount of TP entering the Curonian Lagoon from the Baltic Sea was estimated at 162 t, with a maximum of 425 t in 2007 and a minimum of 97 t in 2010. After estimating the relative error in monthly discharge, the annual amount of TP entering the lagoon may vary between 397 t and 453 t. A high correlation coefficient (0.98) indicates a strong relationship between the inflow to the Klaipėda Strait and the total amount of P entering the lagoon from the sea (Figure 6b). The magnitude of TP transported from the sea to the lagoon is closely tied to the volume of seawater runoff, given that the P concentrations exhibit minimal variations during the winter, spring, summer, and autumn seasons.
Between 2001 and 2020, almost eight times more TP was transported from the Curonian Lagoon to the Baltic Sea compared with the reverse flow from the sea to the lagoon. The primary factor contributing to this difference was the variance in annual water inflow from and to the sea, which amounted to 26.4 km3/year and 5.7 km3/year, respectively.
When comparing the nutrient balance calculations with the data obtained for the Nemunas River Basin between 2012–2016—TN (44,208 ± 12,677 t/year) and TP (1547 ± 266 t/year) [62]—the most recent data indicate lower nutrient inputs into the Baltic Sea via the Klaipėda Seaport gate. It is important to acknowledge that differences exist between the analyzed periods and the calculation methods employed.
Comparing the TN quantities discharged into the sea, as calculated through the water balance method, with the data published by the Environmental Protection Agency for the period 1995–2019, we observed that the water balance method yielded lower estimates for nutrient flow into the Baltic Sea (32,302 t compared with 38,289 t). The amount of TN transported to the Baltic Sea, as determined in this study, closely aligns with the target value for TN set for Lithuania by HELCOM ([14], 25,827 t). To refine the calculation of nutrient flow as outlined in the article, we suggest focusing on clarifying the TN influx into both the sea and the Curonian Lagoon.
The quantities of TP entering the Baltic Sea were consistently calculated using both data from Environmental Protection Agency (EPA) and water balance methods, with estimates of 1351 t and 1278 t of TP per year, respectively.

4. Conclusions

The climate warming trend in the Baltic Sea–Curonian Lagoon transit zone had notable effects during 2018–2020, impacting temperature, salinity, and dissolved oxygen levels. This in turn had effects on the loadings of the nutrients in the transition zone. In recent years (2018–2020), the Klaipėda Strait has shown decreased average concentrations of nutrients (except ammonium) compared with the previous period (2007–2009). Along the Baltic Sea nearshore, phosphorus levels have decreased while the levels of nitrogen, ammonium, and nitrites have slightly increased.
In the colder months, the transit zone exhibited the highest concentrations of TN, with nitrates being the predominant form. Conversely, during the warmer season, organic nitrogen is prevalent, constituting 70–83% of the TN content. In the summer, both the Klaipėda Strait and the Curonian Lagoon contained the highest proportions of ammonium, accounting for 15% and 28% of the TN content, respectively. The highest ammonium levels (38% of TN content) in the Baltic Sea were recorded in autumn.
Between 2001 and 2020, the average annual amount of TN entering the Curonian Lagoon from the sea was 2736 t, contrasting with a notably higher influx from the lagoon to the sea, which reached 32,302 t. The annual average TP load into the Baltic Sea reached 1278 t, whereas the average annual TP input from the Baltic Sea into the Curonian Lagoon was estimated at 162 t.
The study highlights the effects of climate change, nutrient dynamics, and the importance of ongoing monitoring for the Baltic Sea–Curonian Lagoon transit zone. It emphasizes the need for adaptive management, collaboration among scientists and policymakers, and further studies to comprehend eutrophication’s influence on marine ecosystems.
Future studies focusing on more comprehensive ecological assessments to evaluate the impact of changing nutrient levels and environmental conditions on the health and biodiversity of the marine ecosystem are essential. For instance, multi-factor analysis and development of predictive models simulating future scenarios based on different climate change and nutrient management strategies would add valuable information to the topic.

Author Contributions

Conceptualization, R.S., J.K. and E.R.-S.; methodology, J.K. and R.S.; software, D.J.; validation, K.J.; formal analysis, R.S. and D.J.; investigation, R.S. and J.K.; resources, K.J. and J.K.; data curation, J.K. and R.S.; writing—original draft preparation, R.S., J.K. and E.R.-S.; writing K.J., and D.J.; visualization, E.R.-S.; supervision, K.J. and E.R.-S.; project administration, K.J.; funding acquisition, K.J. All authors have read and agreed to the published version of the manuscript.

Funding

This research received no external funding.

Data Availability Statement

Data are contained within the article.

Conflicts of Interest

The authors declare no conflict of interest.

References

  1. Asmala, E.; Virtasalo, J.J.; Scheinin, M.; Newton, S.; Jilbert, T. Role of particle dynamics in processing of terrestrial nitrogen and phosphorus in the estuarine mixing zone. Limnol. Oceanogr. 2022, 67, 1–12. [Google Scholar] [CrossRef]
  2. Andersen, J.H.; Halpern, B.S.; Korpinen, S.; Murray, C.; Reker, J. Baltic Sea biodiversity status vs. cumulative human pressures. Estuar. Coast. Shelf Sci. 2015, 161, 88–92. [Google Scholar] [CrossRef]
  3. Carstensen, J.; Conley, D.J.; Almroth-Rosell, E.; Asmala, E.; Bonsdorff, E.; Fleming-Lehtinen, V.; Gustafsson, B.G.; Gustafsson, C.; Heiskanen, A.-S.; Janas, U.; et al. Factors regulating the coastal nutrient filter in the Baltic Sea. Ambio 2020, 49, 1194–1210. [Google Scholar] [CrossRef] [PubMed]
  4. Preisner, M.; Smol, M.; Szołdrowska, D. Trends, insights and effects of the Urban Wastewater Treatment Directive (91/271/EEC) implementation in the light of the Polish coastal zone eutrophication. Environ. Manag. 2021, 67, 342–354. [Google Scholar] [CrossRef]
  5. Lønborg, C.; Markager, S. Nitrogen in the Baltic Sea: Long-term trends, a budget and decadal time lags in responses to declining inputs. Estuar. Coast. Shelf Sci. 2021, 261, 107529. [Google Scholar] [CrossRef]
  6. Gustafsson, B.G.; Schenk, F.; Blenckner, T.; Eilola, K.; Meier, H.E.M.; Müller-Karulis, B.; Neumann, T.; Ruoho-Airola, T.; Savchuk, O.P.; Zorita, E. Reconstructing the Development of Baltic Sea Eutrophication 1850–2006. AMBIO 2012, 41, 534–548. [Google Scholar] [CrossRef]
  7. Räike, A.; Pietiläinen, O.P.; Rekolainen, S.; Kauppila, P.; Pitkänen, H.; Niemi, J.; Raateland, A.; Vuorenmaa, J. Trends of phosphorus, nitrogen and chlorophyll a concentrations in Finnish rivers and lakes in 1975–2000. Sci. Total Environ. 2003, 310, 47–59. [Google Scholar] [CrossRef] [PubMed]
  8. Wojciechowska, E.; Nawrot, N.; Matej-Łukowicz, K.; Gajewska, M.; Obarska-Pempkowiak, H. Seasonal changes of the concentrations of mineral forms of nitrogen and phosphorus in watercourses in the agricultural catchment area (Bay of Puck, Baltic Sea, Poland). Water Supply 2018, 19, 986–994. [Google Scholar] [CrossRef]
  9. Barquet, K.; Järnberg, L.; Rosemarin, A.; Macura, B. Identifying barriers and opportunities for a circular phosphorus economy in the Baltic Sea region. Water Res. 2020, 171, 115433. [Google Scholar] [CrossRef]
  10. Vuorenmaa, J.; Rekolainen, S.; Lepistö, A.; Kenttämies, K.; Kauppila, P. Losses of Nitrogen and Phosphorus from Agricultural and Forest Areas in Finland during the 1980s and 1990s. Environ. Monit. Assess. 2002, 76, 213–248. [Google Scholar] [CrossRef]
  11. Šileika, A.; Wallin, M.; Gaigalis, K. Assessment of nitrogen pollution reduction options in the river Nemunas (Lithuania) using FyrisNP model. J. Environ. Eng. Landsc. Manag. 2013, 21, 141–151. [Google Scholar] [CrossRef]
  12. Česonienė, L.; Šileikienė, D.; Marozas, V.; Čiteikė, L. Influence of Anthropogenic Loads on Surface Water Status: A Case Study in Lithuania. Sustainability 2021, 13, 4341. [Google Scholar] [CrossRef]
  13. Räike, A.; Taskinen, A.; Knuuttila, S. Nutrient export from Finnish rivers into the Baltic Sea has not decreased despite water protection measures. Ambio 2020, 49, 460–474. [Google Scholar] [CrossRef] [PubMed]
  14. HELCOM. Baltic Sea Action Plan 2021 Update. 2021. Available online: https://helcom.fi/wp-content/uploads/2021/10/Baltic-Sea-Action-Plan-2021-update.pdf (accessed on 23 November 2023).
  15. Vybernaite-Lubiene, I.; Zilius, M.; Giordani, G.; Petkuviene, J.; Vaiciute, D.; Bukaveckas, P.A.; Bartoli, M. Effect of algal blooms on retention of N, Si and P in Europe’s largest coastal lagoon. Estuar. Coast. Shelf Sci. 2017, 194, 217–228. [Google Scholar] [CrossRef]
  16. Vybernaite-Lubiene, I.; Zilius, M.; Bartoli, M.; Petkuviene, J.; Zemlys, P.; Magri, M.; Giordani, G. Biogeochemical Budgets of Nutrients and Metabolism in the Curonian Lagoon (South East Baltic Sea): Spatial and Temporal Variations. Water 2022, 14, 164. [Google Scholar] [CrossRef]
  17. Čerkasova, N.; Umgiesser, G.; Ertürk, A. Modelling framework for flow, sediments and nutrient loads in a large transboundary river watershed: A climate change impact assessment of the Nemunas River watershed. J. Hydrol. 2021, 598, 126422. [Google Scholar] [CrossRef]
  18. Bouwman, A.F.; Bierkens, M.F.P.; Griffioen, J.; Hefting, M.M.; Middelburg, J.J.; Middelkoop, H.; Slomp, C.P. Nutrient dynamics, transfer and retention along the aquatic continuum from land to ocean: Towards integration of ecological and biogeochemical models. Biogeosciences 2013, 10, 4785–4800. [Google Scholar] [CrossRef]
  19. Asmala, E.; Carstensen, J.; Conley, D.J.; Slomp, C.P.; Stadmark, J.; Voss, M. Efficiency of the coastal filter: Nitrogen and phosphorus removal in the Baltic Sea. Limnol. Oceanogr. 2017, 62, S222–S238. [Google Scholar] [CrossRef]
  20. Nelson, J.L.; Zavaleta, E.S. Salt marsh as a coastal filter for the oceans: Changes in function with experimental increases in nitrogen loading and sea-level rise. PLoS ONE 2012, 7, e38558. [Google Scholar] [CrossRef]
  21. Stakeniene, R.; Galkus, A.; Jokšas, K. Pollution of Klaipėda Port Waters. Pol. J. Environ. Stud. 2011, 20, 445–459. [Google Scholar]
  22. Kriauciuniene, J.; Gailiusis, B. Changes of Sediment Transport Induced by Reconstruction of Klaipeda Seaport Entrance Channel. Environ. Res. Eng. Manag. 2004, 2, 3–9. [Google Scholar]
  23. Červinskas, E. Issue of average annual water balance of Curonian Lagoon. Work. Acad. Sci. B 1956, 5, 67–76. [Google Scholar]
  24. Jakimavičius, D.; Jakimavičius, M. Long-term water balance of the Curonian Lagoon in the context of antropogenic factors and climate change. Baltica 2010, 23, 33–46. [Google Scholar]
  25. Remeikaitė-Nikienė, N.; Lujaniene, G.; Garnaga-Budrė, G.; Jokšas, K.; Garbaras, A.; Skipitytė, R.; Bariseviciute, R.; Silobritiene, B.; Stankevičius, A. Distribution of Trace Elements and Radionuclides in the Curonian Lagoon and the Baltic Sea; IEEE: Vilnius, Lithuania, 2012. [Google Scholar]
  26. Gasiūnaitė, Z.R.; Daunys, D.; Olenin, S.; Razinkovas, A. The Curonian Lagoon. In Ecology of Baltic Coastal Waters; Schiewer, U., Ed.; Springer: Berlin/Heidelberg, Germany, 2008; pp. 197–215. [Google Scholar]
  27. Žaromskis, R. Oceans, Seas, Estuaries; Debesija: Vilnius, Lithuania, 1996. (In Lithuania) [Google Scholar]
  28. Jakimavičius, D.; Kriaučiūnienė, J.; Šarauskienė, D. Impact of climate change on the Curonian Lagoon water balance components, salinity and water temperature in the 21st century. Oceanologia 2018, 60, 378–389. [Google Scholar] [CrossRef]
  29. Jokšas, K.; Galkus, A.; Stakėnienė, R. The Only Lithuanian Seaport and Its Environment; Institute of Geology and Geography: Vilnius, Lithuania, 2003.
  30. Raudonytė-Svirbutavičienė, E.; Jokšas, K.; Stakėnienė, R. On the effectiveness of tributyltin ban part II: Temporal and spatial trends of organotin pollution in intense sediment accumulation areas and dumping sites of the Baltic Sea. J. Hazard. Mater. Adv. 2023, 10, 100294. [Google Scholar] [CrossRef]
  31. Jokšas, K.; Stakėnienė, R.; Raudonytė-Svirbutavičienė, E. On the effectiveness of tributyltin ban: Distribution and changes in butyltin concentrations over a 9-year period in Klaipėda Port, Lithuania. Ecotoxicol. Environ. Saf. 2019, 183, 109515. [Google Scholar] [CrossRef] [PubMed]
  32. Gailiušis, B.; Kovalenkovienė, M.; Jurgelėnaitė, A. Water balance of the Curonian Lagoon. Energetika 1992, 2, 67–73. [Google Scholar]
  33. Thornthwaite, C.W. An Approach toward a Rational Classification of Climate. Geogr. Rev. 1948, 38, 55–94. [Google Scholar] [CrossRef]
  34. ISO 5667-3:2006; Water Quality—Sampling—Part 3: Guidance on the Preservation and Handling of Water Samples. International Organization for Standardization: Geneva, Switzerland, 2003.
  35. ISO 5667-1:2007; Water Quality—Sampling—Part 1: Guidance on the Design of Sampling Programmes and Sampling Techniques. International Organization for Standardization: Geneva, Switzerland, 2006.
  36. ISO 6878:2004; Water Quality—Determination of Phosphorus—Ammonium Molybdate Spectrometric Method (ISO 6878:2004). International Organization for Standardization: Geneva, Switzerland, 2004.
  37. ISO 14911:2000; Water Quality—Determination of Dissolved Li+, Na+, NH4+, K+, Mn2+, Ca2+, Mg2+, Sr2+ and Ba2+ using Ion Chromatography—Method for Water and Waste Water (ISO 14911:1998). International Organization for Standardization: Geneva, Switzerland, 1999.
  38. ISO 7890-3:1988; Water quality—Determination of Nitrate—Part 3: Spectrometric Method using Sulfosalicylic Acid. International Organization for Standardization: Geneva, Switzerland, 1988.
  39. ISO 11905-1:1997; Water quality—Determination of nitrogen—Part 1: Method using Oxidative Digestion with Peroxodisulfate. International Organization for Standardization: Geneva, Switzerland, 1997.
  40. Gailiušis, B.; Kovalenkovienė, M.; Kriaučiūnienė, J. Hydrological aspects of development of Klaipėda harbour. Energetika 1996, 3, 73–78. [Google Scholar]
  41. Dailidienė, I.; Davulienė, L. Salinity trend and variation in the Baltic Sea near the Lithuanian coast and in the Curonian Lagoon in 1984–2005. J. Mar. Syst. 2008, 74, S20–S29. [Google Scholar] [CrossRef]
  42. Jakimavičius, D.; Kriaučiūnienė, J. The climate change impact on the water balance of the Curonian Lagoon. Water Resour. 2013, 40, 120–132. [Google Scholar] [CrossRef]
  43. Zemlys, P.; Ferrarin, C.; Umgiesser, G.; Gulbinskas, S.; Bellafiore, D. Investigation of saline water intrusions into the Curonian Lagoon (Lithuania) and two-layer flow in the Klaipėda Strait using finite element hydrodynamic model. Ocean Sci. 2013, 9, 573–584. [Google Scholar] [CrossRef]
  44. Gailiušis, B.; Jablonskis, J.; Kovalenkovienė, M. The Lithuanian Rivers. Hydrography and Runoff; LEI: Kaunas, Lithuania, 2001; p. 792. [Google Scholar]
  45. Liénart, C.; Garbaras, A.; Qvarfordt, S.; Walve, J.; Karlson, A.M.L. Spatio-temporal variation in stable isotope and elemental composition of key-species reflect environmental changes in the Baltic Sea. Biogeochemistry 2022, 157, 149–170. [Google Scholar] [CrossRef]
  46. Baxa, M.; Musil, M.; Kummel, M.; Hanzlík, P.; Tesařová, B.; Pechar, L. Dissolved oxygen deficits in a shallow eutrophic aquatic ecosystem (fishpond)—Sediment oxygen demand and water column respiration alternately drive the oxygen regime. Sci. Total Environ. 2021, 766, 142647. [Google Scholar] [CrossRef]
  47. Marcinkowski, P.; Grygoruk, M. Long-Term Downstream Effects of a Dam on a Lowland River Flow Regime: Case Study of the Upper Narew. Water 2017, 9, 783. [Google Scholar] [CrossRef]
  48. Povilaitis, A.; Šileika, A.; Deelstra, J.; Gaigalis, K.; Baigys, G. Nitrogen losses from small agricultural catchments in Lithuania. Agric. Ecosyst. Environ. 2014, 198, 54–64. [Google Scholar] [CrossRef]
  49. Plunge, S.; Gudas, M.; Povilaitis, A. Expected climate change impacts on surface water bodies in Lithuania. Ecohydrol. Hydrobiol. 2022, 22, 246–268. [Google Scholar] [CrossRef]
  50. Rabalais, N.N.; Cai, W.-J.; Carstensen, J.; Conley, D.J.; Fry, B.; Hu, X.; QuiÑOnes-Rivera, Z.; Rosenberg, R.; Slomp, C.P.; Turner, R.E.; et al. Eutrophication-Driven Deoxygenation in the Coastal Ocean. Oceanography 2014, 27, 172–183. [Google Scholar] [CrossRef]
  51. Hietanen, S.; Jäntti, H.; Buizert, C.; Jürgens, K.; Labrenz, M.; Voss, M.; Kuparinen, J. Hypoxia and nitrogen processing in the Baltic Sea water column. Limnol. Oceanogr. 2012, 57, 325–337. [Google Scholar] [CrossRef]
  52. Markus Meier, H.E.; Dieterich, C.; Gröger, M. Natural variability is a large source of uncertainty in future projections of hypoxia in the Baltic Sea. Commun. Earth Environ. 2021, 2, 50. [Google Scholar] [CrossRef]
  53. Rak, D.; Walczowski, W.; Dzierzbicka-Głowacka, L.; Shchuka, S. Dissolved oxygen variability in the southern Baltic Sea in 2013–2018. Oceanologia 2020, 62, 525–537. [Google Scholar] [CrossRef]
  54. Cozzi, S.; Ibáñez, C.; Lazar, L.; Raimbault, P.; Giani, M. Flow Regime and Nutrient-Loading Trends from the Largest South European Watersheds: Implications for the Productivity of Mediterranean and Black Sea’s Coastal Areas. Water 2019, 11, 1. [Google Scholar] [CrossRef]
  55. Rönspieß, L.; Dellwig, O.; Lange, X.; Nausch, G.; Schulz-Bull, D. Spatial and seasonal phosphorus dynamics in a eutrophic estuary of the southern Baltic Sea. Estuar. Coast. Shelf Sci. 2020, 233, 106532. [Google Scholar] [CrossRef]
  56. Andersen, J.H.; Carstensen, J.; Conley, D.J.; Dromph, K.; Fleming-Lehtinen, V.; Gustafsson, B.G.; Josefson, A.B.; Norkko, A.; Villnäs, A.; Murray, C. Long-term temporal and spatial trends in eutrophication status of the Baltic Sea. Biol. Rev. 2017, 92, 135–149. [Google Scholar] [CrossRef] [PubMed]
  57. Murawska, A.; Prus, P. The Progress of Sustainable Management of Ammonia Emissions from Agriculture in European Union States Including Poland—Variation, Trends, and Economic Conditions. Sustainability 2021, 13, 1035. [Google Scholar] [CrossRef]
  58. Hellsten, S.; Dalgaard, T.; Rankinen, K.; Tørseth, K.; Bakken, L.; Bechmann, M.; Kulmala, A.; Moldan, F.; Olofsson, S.; Piil, K.; et al. Abating N in Nordic agriculture—Policy, measures and way forward. J. Environ. Manag. 2019, 236, 674–686. [Google Scholar] [CrossRef] [PubMed]
  59. Kuss, J.; Nausch, G.; Engelke, C.; von Weber, M.; Lutterbeck, H.; Naumann, M.; Waniek, J.; Schulz-Bull, D. Changes of Nutrient Concentrations in the Western Baltic Sea in the Transition Between Inner Coastal Waters and the Central Basins: Time Series From 1995 to 2016 With Source Analysis. Front. Earth Sci. 2020, 8, 106. [Google Scholar] [CrossRef]
  60. Pastuszak, M.; Bryhn, A.C.; Håkanson, L.; Stålnacke, P.; Zalewski, M.; Wodzinowski, T. Reduction of nutrient emission from Polish territory into the Baltic Sea (1988–2014) confronted with real environmental needs and international requirements. Oceanol. Hydrobiol. Stud. 2018, 47, 140–166. [Google Scholar] [CrossRef]
  61. Neal, C.; Davies, H.; Neal, M. Water quality, nutrients and the water framework directive in an agricultural region: The lower Humber Rivers, northern England. J. Hydrol. 2008, 350, 232–245. [Google Scholar] [CrossRef]
  62. Vybernaite-Lubiene, I.; Zilius, M.; Saltyte-Vaisiauske, L.; Bartoli, M. Recent Trends (2012–2016) of N, Si, and P Export from the Nemunas River Watershed: Loads, Unbalanced Stoichiometry, and Threats for Downstream Aquatic Ecosystems. Water 2018, 10, 1178. [Google Scholar] [CrossRef]
  63. Sundbäck, K.; Linares, F.; Larson, F.; Wulff, A.; Engelsen, A. Benthic nitrogen fluxes along a depth gradient in a microtidal fjord: The role of denitrification and microphytobenthos. Limnol. Oceanogr. 2004, 49, 1095–1107. [Google Scholar] [CrossRef]
  64. Brion, N.; Jans, S.; Chou, L.; Rousseau, V. Nutrient loads to the Belgian Coastal Zone; ULB: Brussels, Belgium, 2006; pp. 17–43. [Google Scholar]
  65. Eyre, B.D.; Maher, D.T.; Sanders, C. The contribution of denitrification and burial to the nitrogen budgets of three geomorphically distinct Australian estuaries: Importance of seagrass habitats. Limnol. Oceanogr. 2016, 61, 1144–1156. [Google Scholar] [CrossRef]
  66. Carstensen, J.; Conley, D.J.; Bonsdorff, E.; Gustafsson, B.G.; Hietanen, S.; Janas, U.; Jilbert, T.; Maximov, A.; Norkko, A.; Norkko, J.; et al. Hypoxia in the Baltic Sea: Biogeochemical Cycles, Benthic Fauna, and Management. AMBIO 2014, 43, 26–36. [Google Scholar] [CrossRef] [PubMed]
  67. Noffke, A.; Sommer, S.; Dale, A.W.; Hall, P.O.J.; Pfannkuche, O. Benthic nutrient fluxes in the Eastern Gotland Basin (Baltic Sea) with particular focus on microbial mat ecosystems. J. Mar. Syst. 2016, 158, 1–12. [Google Scholar] [CrossRef]
  68. Sommer, S.; Clemens, D.; Yücel, M.; Pfannkuche, O.; Hall, P.O.; Almroth-Rosell, E.; Schulz-Vogt, H.N.; Dale, A.W. Major bottom water ventilation events do not significantly reduce basin-wide benthic N and P release in the eastern Gotland basin (Baltic Sea). Front. Mar. Sci. 2017, 4, 18. [Google Scholar] [CrossRef]
  69. Ehrnsten, E.; Savchuk, O.P.; Gustafsson, B.G. Modelling the effects of benthic fauna on carbon, nitrogen and phosphorus dynamics in the Baltic Sea. Biogeosciences 2022, 19, 3337–3367. [Google Scholar] [CrossRef]
  70. Yang, Q.-Z.; Zhou, B.; Liu, J.-W.; Shen, W.-R.; Jia, X.-D.; He, X.-J.; Zhao, H.-Z. Nitrate removal from water via self-flocculation of genetically engineered bacteria. Chem. Eng. Sci. 2021, 242, 116750. [Google Scholar] [CrossRef]
  71. Suratman, S.; Jickells, T.; Weston, K.; Fernand, L. Seasonal variability of inorganic and organic nitrogen in the North Sea. Hydrobiologia 2008, 610, 83–98. [Google Scholar] [CrossRef]
  72. Bowes, M.J.; Smith, J.T.; Neal, C.; Leach, D.V.; Scarlett, P.M.; Wickham, H.D.; Harman, S.A.; Armstrong, L.K.; Davy-Bowker, J.; Haft, M.; et al. Changes in water quality of the River Frome (UK) from 1965 to 2009: Is phosphorus mitigation finally working? Sci. Total Environ. 2011, 409, 3418–3430. [Google Scholar] [CrossRef]
  73. Aleksandrov, S.; Krek, A.; Bubnova, E.; Danchenkov, A. Eutrophication and effects of algal bloom in the south–western part of the Curonian Lagoon alongside the Curonian Spit. Baltica 2018, 31, 1–12. [Google Scholar] [CrossRef]
  74. Bradley, P.B.; Sanderson, M.P.; Frischer, M.E.; Brofft, J.; Booth, M.G.; Kerkhof, L.J.; Bronk, D.A. Inorganic and organic nitrogen uptake by phytoplankton and heterotrophic bacteria in the stratified Mid-Atlantic Bight. Estuar. Coast. Shelf Sci. 2010, 88, 429–441. [Google Scholar] [CrossRef]
  75. Morando, M.; Capone, D.G. Direct Utilization of Organic Nitrogen by Phytoplankton and Its Role in Nitrogen Cycling Within the Southern California Bight. Front. Microbiol. 2018, 9, 2118. [Google Scholar] [CrossRef] [PubMed]
  76. Baird, D.; Ulanowicz, R.E.; Boynton, W.R. Seasonal Nitrogen Dynamics in Chesapeake Bay: A Network Approach. Estuar. Coast. Shelf Sci. 1995, 41, 137–162. [Google Scholar] [CrossRef]
  77. Petkuviene, J.; Zilius, M.; Lubiene, I.; Ruginis, T.; Giordani, G.; Razinkovas-Baziukas, A.; Bartoli, M. Phosphorus Cycling in a Freshwater Estuary Impacted by Cyanobacterial Blooms. Estuaries Coasts 2016, 39, 1386–1402. [Google Scholar] [CrossRef]
  78. Ghorbanizadeh, S.; Rostami, B. Surface and Interfacial Tension Behavior of Salt Water Containing Dissolved Amphiphilic Compounds of Crude Oil: The Role of Single-Salt Ionic Composition. Energy Fuels 2017, 31, 9117–9124. [Google Scholar] [CrossRef]
  79. Atkinson, C.A.; Jolley, D.F.; Simpson, S.L. Effect of overlying water pH, dissolved oxygen, salinity and sediment disturbances on metal release and sequestration from metal contaminated marine sediments. Chemosphere 2007, 69, 1428–1437. [Google Scholar] [CrossRef] [PubMed]
  80. Dainys, J.; Jakubavičiūtė, E.; Gorfine, H.; Pūtys, Ž.; Virbickas, T.; Jakimavičius, D.; Šarauskienė, D.; Meilutytė-Lukauskienė, D.; Povilaitis, A.; Bukantis, A.; et al. Predicted climate change effects on European perch (Perca fluviatilis L.)—A case study from the Curonian Lagoon, south-eastern Baltic. Estuar. Coast. Shelf Sci. 2019, 221, 83–89. [Google Scholar] [CrossRef]
  81. Zilius, M.; Vybernaite-Lubiene, I.; Vaiciute, D.; Petkuviene, J.; Zemlys, P.; Liskow, I.; Voss, M.; Bartoli, M.; Bukaveckas, P.A. The influence of cyanobacteria blooms on the attenuation of nitrogen throughputs in a Baltic coastal lagoon. Biogeochemistry 2018, 141, 143–165. [Google Scholar] [CrossRef]
  82. Bartoli, M.; Nizzoli, D.; Zilius, M.; Bresciani, M.; Pusceddu, A.; Bianchelli, S.; Sundbäck, K.; Razinkovas-Baziukas, A.; Viaroli, P. Denitrification, Nitrogen Uptake, and Organic Matter Quality Undergo Different Seasonality in Sandy and Muddy Sediments of a Turbid Estuary. Front. Microbiol. 2020, 11, 612700. [Google Scholar] [CrossRef]
  83. Reitzel, K.; Ahlgren, J.; DeBrabandere, H.; Waldebäck, M.; Gogoll, A.; Tranvik, L.; Rydin, E. Degradation rates of organic phosphorus in lake sediment. Biogeochemistry 2007, 82, 15–28. [Google Scholar] [CrossRef]
  84. Cieśliński, R.; Chlost, I.; Szydłowski, M. Impact of new, navigable canal through the Vistula spit on the hydrologic balance of the Vistula lagoon (Baltic Sea). J. Mar. Syst. 2024, 241, 103908. [Google Scholar] [CrossRef]
  85. Dubra, J. Water balance. In the Curonian Lagoon; Mokslas: Vilnius, Lithuania, 1978; Volume 2. [Google Scholar]
Figure 1. Study area and sampling stations.
Water 15 04096 g001
Figure 2. Changes in the water balance components of the Curonian Lagoon in the period of 2001–2020. Here, QR—river inflow, QS—inflow from the sea, P—precipitation, QL—outflow from the lagoon; E—evaporation.
Water 15 04096 g002
Figure 3. Seasonal distribution of nitrogen and phosphorus—based compounds in the Klaipėda Strait (KS), Curonian Lagoon (CL), and the Baltic Sea nearshore (BS) in 2018—2020.
Water 15 04096 g003
Figure 4. Principal component analysis of nitrogen (TN; N/NH4+; N/NO3 N/NO2) and phosphorus (TP and P/PO43−) concentrations and water parameters (T—temperature, S—salinity, and O2—dissolved oxygen) in the water of the Curonian Lagoon (a) and the Baltic Sea (b).
Water 15 04096 g004
Figure 5. The average annual TN amount (t) and the annual inflow (km3) entering (a) the Baltic Sea and (b) the Curonian Lagoon. Here, TN—total nitrogen; QL—outflow from the Curonian Lagoon to the Baltic Sea; Qs—inflow from the Baltic Sea to the Curonian Lagoon.
Water 15 04096 g005
Figure 6. The average annual TP amount (t) and the annual inflow (km3) entering (a) the Baltic Sea and (b) the Curonian Lagoon. Here, TP—total phosphorus; QL—outflow from the Curonian Lagoon to the Baltic Sea; Qs—inflow from the Baltic Sea to the Curonian Lagoon.
Water 15 04096 g006
Table 1. Average changes in salinity psu, temperature, and oxygen concentration in the study area during the periods 2007–2009 and 2018–2020 1.
AreaWater LayerS, psu T, °C O2, mg/L
2007–2009
(n = 312)
2018–2020
(n = 388)
2007–2009
(n = 312)
2018–2020
(n = 388)
2007–2009
(n = 312)
2018–2020
(n = 388)
CLSurface-1.54 ± 0.78
(n = 38)
-11.87 ± 1.44
(n = 38)
-8.64 ± 2.05
(n = 38)
KSSurface1.0 ± 0.40 **
(n = 84)
3.32 ± 0.52 **
(n = 84)
9.62 ± 0.86 **
(n = 84)
11.49 ± 1.59 **
(n = 84)
9.19 ± 0.69 **
(n = 84)
8.44 ± 1.63 **
(n = 84)
BSSurface6.41 ± 0.05
(n = 72)
6.40 ± 0.50
(n = 72)
10.65 ± 0.16
(n = 72)
11.74 ± 2.53
(n = 72)
9.92 ± 0.22 *
(n = 72)
9.06 ± 2.32 *
(n = 72)
CLNear-bottom-1.74 ± 1.0
(n = 38)
-11.54 ± 1.87
(n = 38)
-8.26 ± 2.14
(n = 38)
KSNear-bottom2.81 ± 0.67 **
(n = 84)
4.59 ± 0.75 **
(n = 84)
9.03 ± 0.69 **
(n = 84)
10.86 ± 2.19 **
(n = 84)
9.06 ± 1.14 **
(n = 84)
8.4 ± 2.07 **
(n = 84)
BSNear-bottom7.02 ± 0.01
(n = 72)
7.06 ± 0.29
(n = 72)
9.07 ± 0.21 *
(n = 72)
10.56 ± 3.48 *
(n = 72)
9.31 ± 0.49
(n = 72)
8.57 ± 2.12
(n = 72)
CLWater column-1.64 ± 0.89
(n = 76)
-11.71 ± 1.65
(n = 76)
-8.45 ± 2.10
(n = 76)
KSWater column1.9 ± 0.54 **
(n = 168)
3.96 ± 0.63 **
(n = 168)
9.32 ± 0.76 **
(n = 168)
11.17 ± 1.89 **
(n = 168)
9.13 ± 0.91 **
(n = 168)
8.4 ± 1.85 **
(n = 168)
BSWater column6.71 ± 0.02
(n = 144)
6.7 ± 0.36
(n = 144)
9.86 ± 0.11 **
(n = 144)
11.15 ± 3.00 **
(n = 144)
9.61 ± 0.35 **
(n = 144)
8.81 ± 2.22 **
(n = 144)
Note(s): 1 Here, * p > 0.05; ** p > 0.01; S—salinity; T—temperature; O2—oxygen concentration; CL—Curonian Lagoon; KS—Klaipėda Strait, BS—Baltic Sea nearshore; n—the number of samples.
Table 2. Average concentrations of biogenic elements in the study area during 2007–2009 and 2018–2020 1.
AreaN/NH4+,
mg/L
N/NO2,
mg/L
N/NO3,
mg/L
TN,
mg/L
P/PO43−,
mg/L
TP,
mg/L
2007–2009
CLn.d.n.d.n.d.n.d.n.d.n.d.
KS (n = 168)0.11 ± 0.09 **0.013 ± 0.01 **0.718 ± 0.27 **1.60 ± 0.25 **0.020 ± 0.001 **0.061 ± 0.04 **
BS (n = 144)0.11 ± 0.03 *0.004 ± 0.002 *0.20 ± 0.08 *0.54 ± 0.04 *0.013 ± 0.0070.03 ± 0.01 **
2018–2020
N/NH4+,
mg/L
N/NO2,
mg/L
N/NO3,
mg/L
TN,
mg/L
P/PO43−,
mg/L
TP,
mg/L
CL (n = 56)0.12 ± 0.060.008 ± 0.060.60 ± 0.141.38 ± 0.220.009 ± 0.0020.026 ± 0.002
KS (n = 168)0.17 ± 0.06 **0.008 ± 0.06 **0.55 ± 0.19 **1.2 ± 0.36 **0.01 ± 0.002 **0.025 ± 0.002 **
BS (n = 144)0.15 ± 0.01 *0.010 ± 0.01 *0.14 ± 0.06 *0.65 ± 0.32 *0.011 ± 0.0040.021 ± 0.002 **
Note(s): 1 Here, * p > 0.05; ** p > 0.01.
Table 3. Average seasonal concentrations of TN and TP, mg/L, during 2001–2020 in the Klaipėda Strait and the nearshore of the Baltic Sea.
WinterSpringSummerAutumn
TN, mg/L
KS2.09 ± 0.831.39 ± 0.990.90 ± 0.360.81 ± 0.29
BS0.63 ± 0.280.54 ± 0.180.53 ± 0.250.46 ± 0.23
TP, mg/L
KS0.051 ± 0.0030.051 ± 0.0720.047 ± 0.0410.064 ± 0.069
BS0.026 ± 0.0100.027 ± 0.0200.038 ± 0.01700.028 ± 0.008
Disclaimer/Publisher’s Note: The statements, opinions and data contained in all publications are solely those of the individual author(s) and contributor(s) and not of MDPI and/or the editor(s). MDPI and/or the editor(s) disclaim responsibility for any injury to people or property resulting from any ideas, methods, instructions or products referred to in the content.

