
Optimal Selection of Sampling Points for Detecting SARS-CoV-2 RNA in Sewer System Using NSGA-II Algorithm


Abstract
:1. Introduction
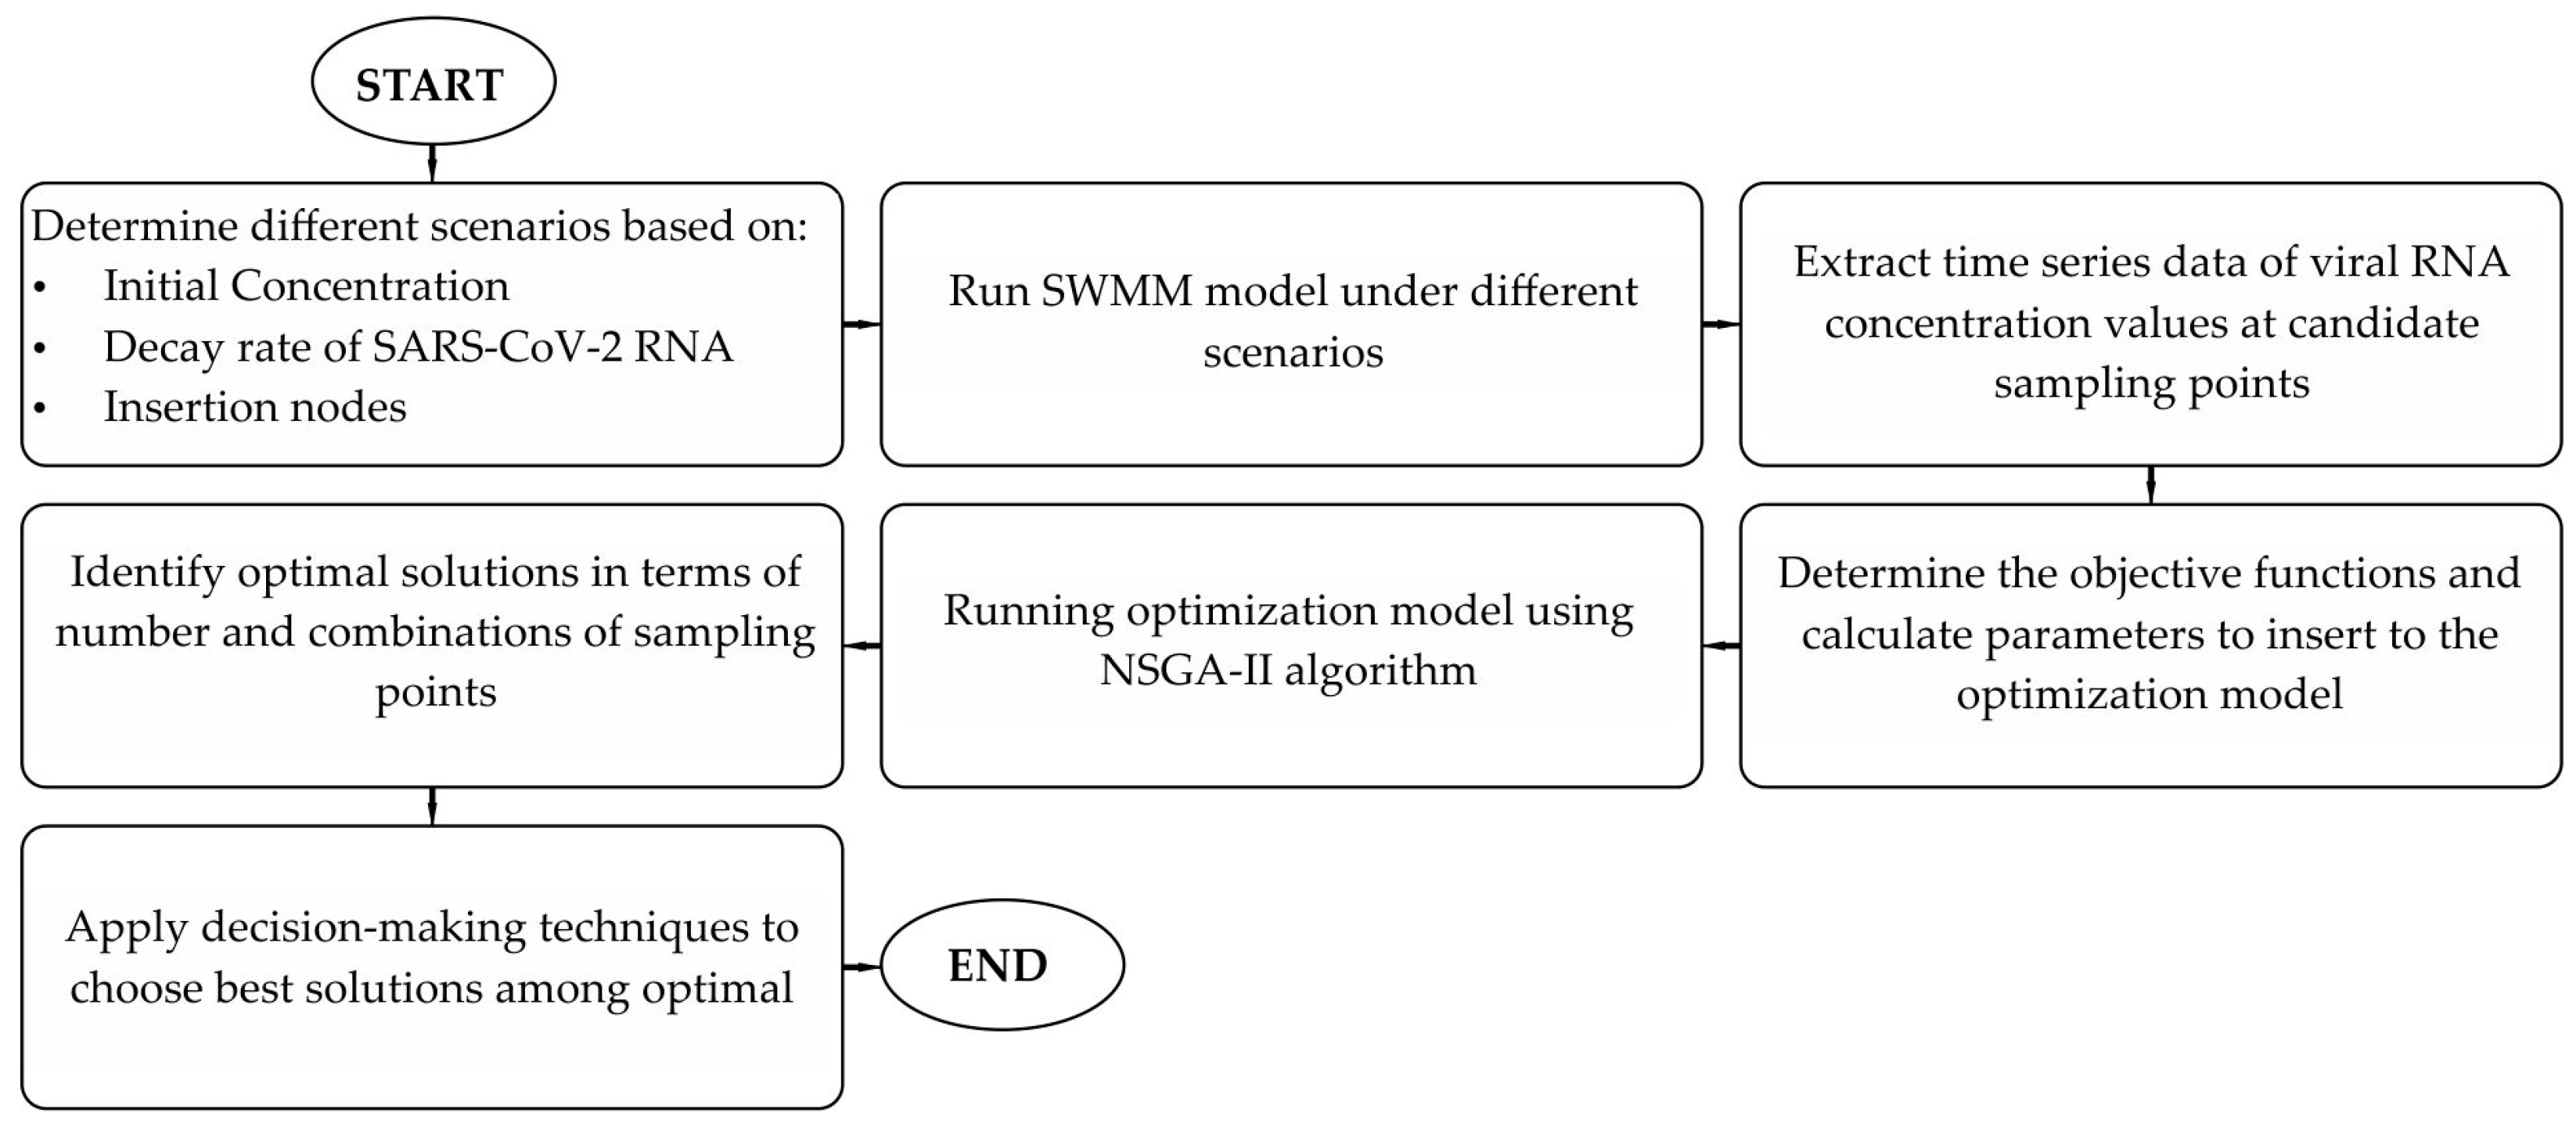
2. Materials and Methods
2.1. SWMM
2.2. Optimization
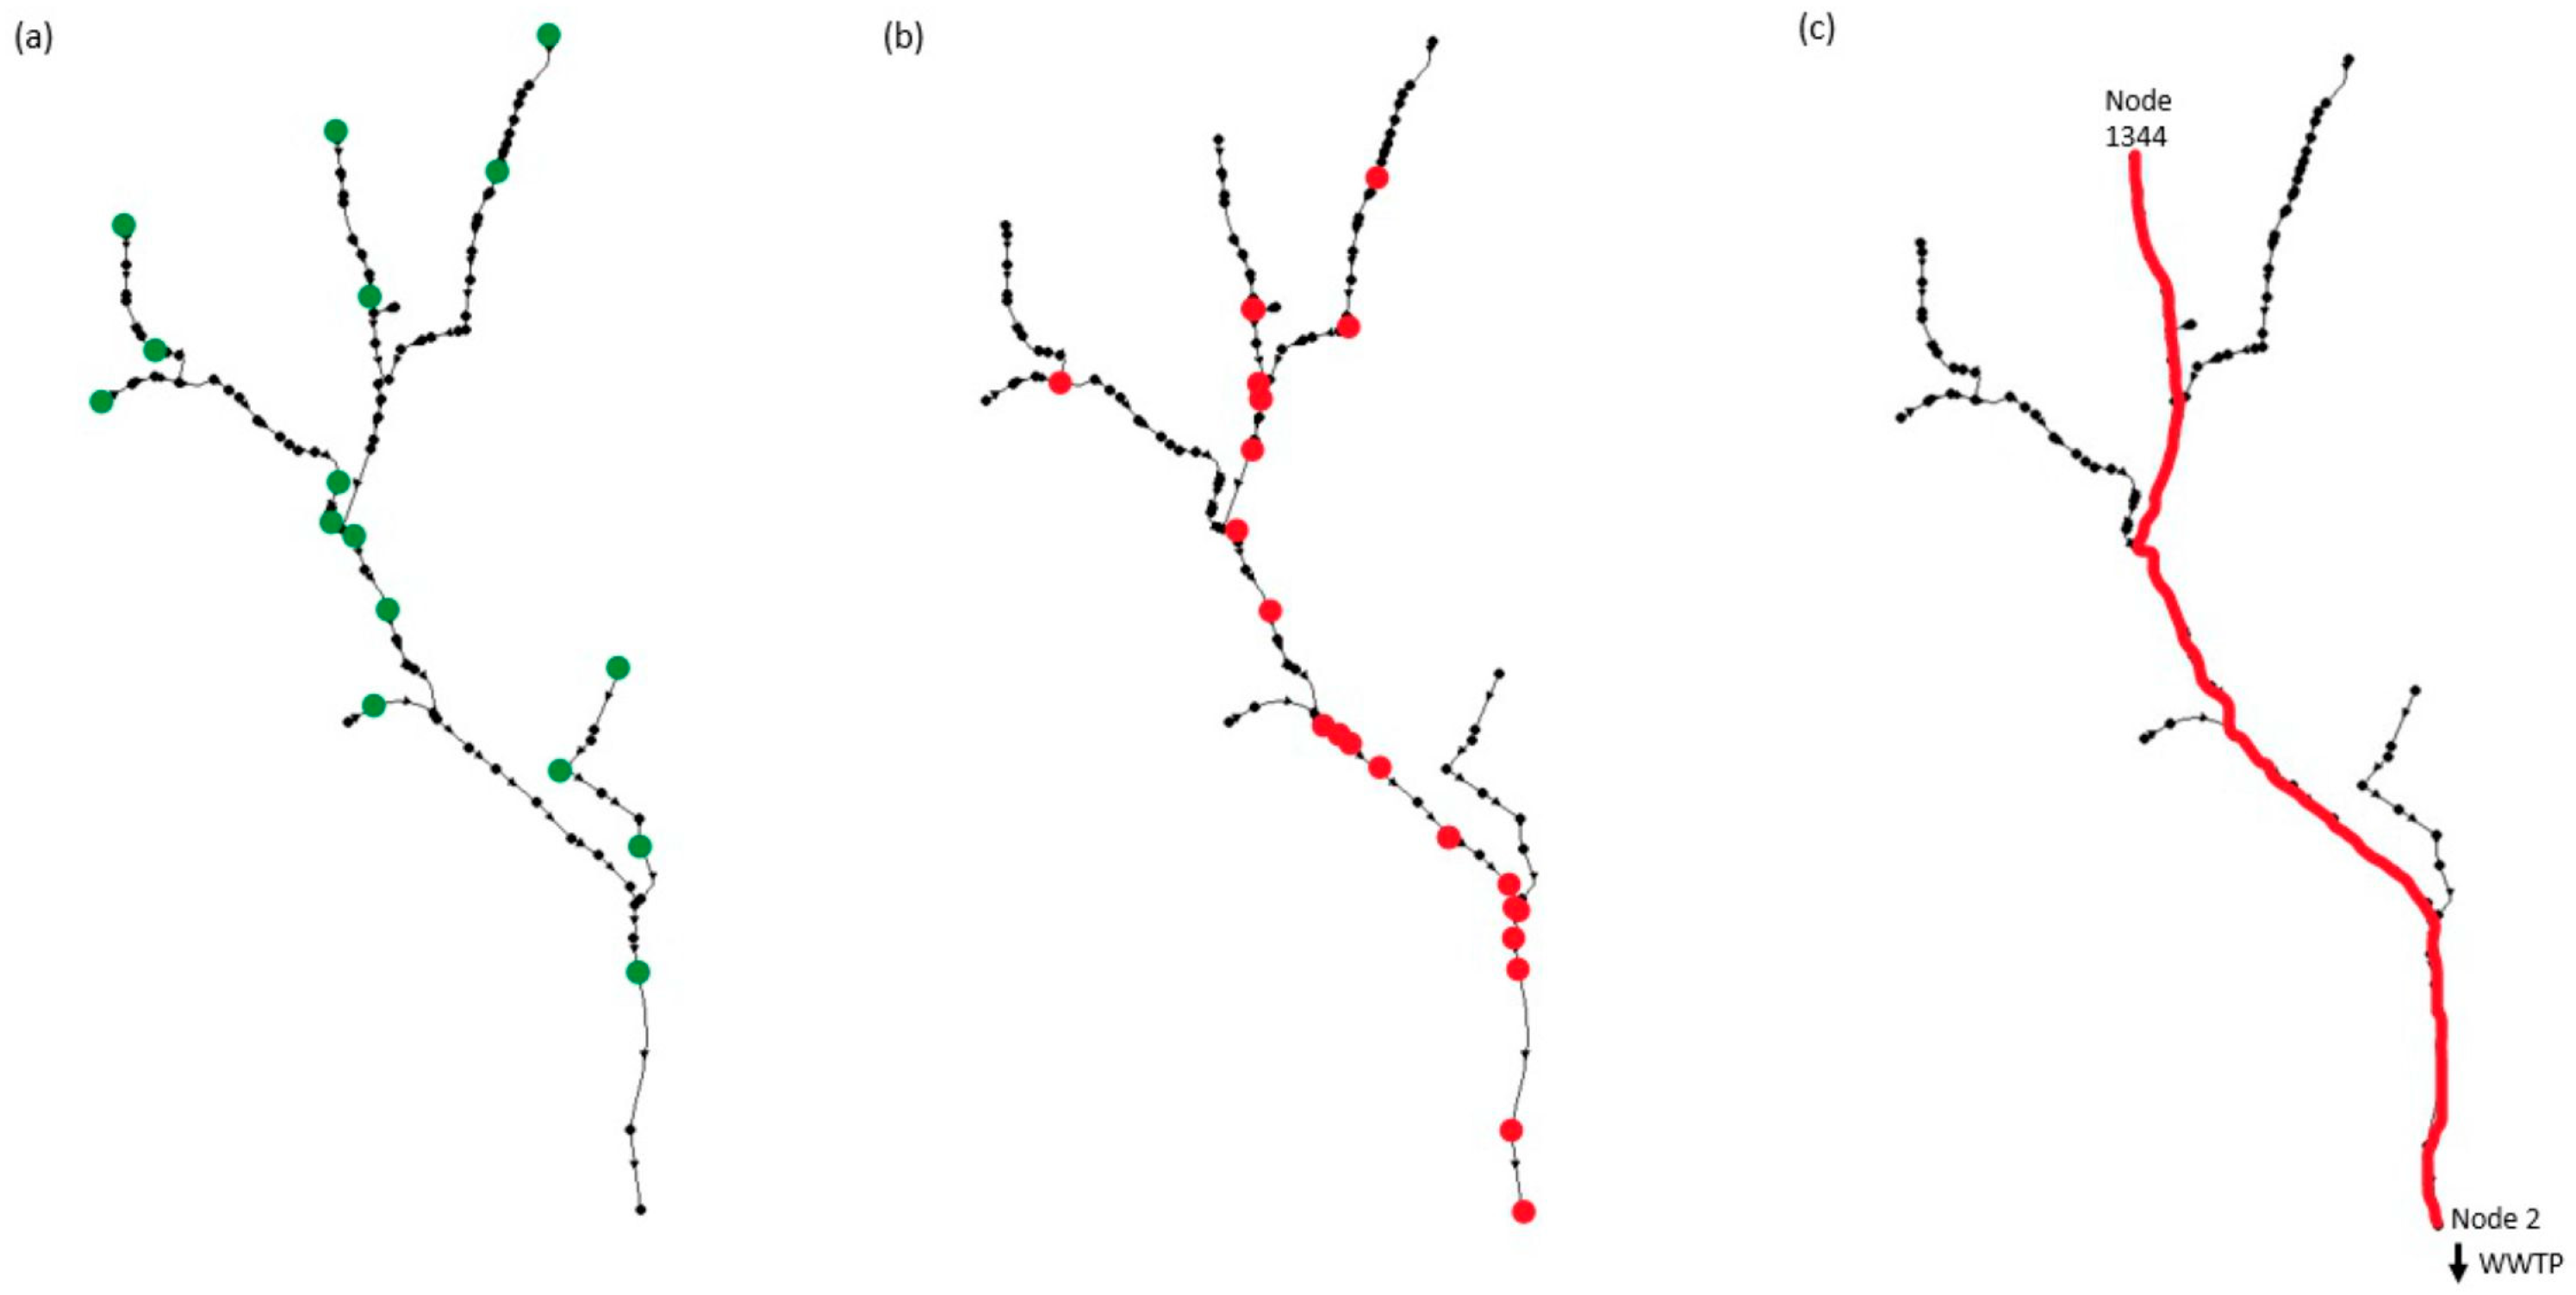
2.3. Study Area
3. Results and Discussion
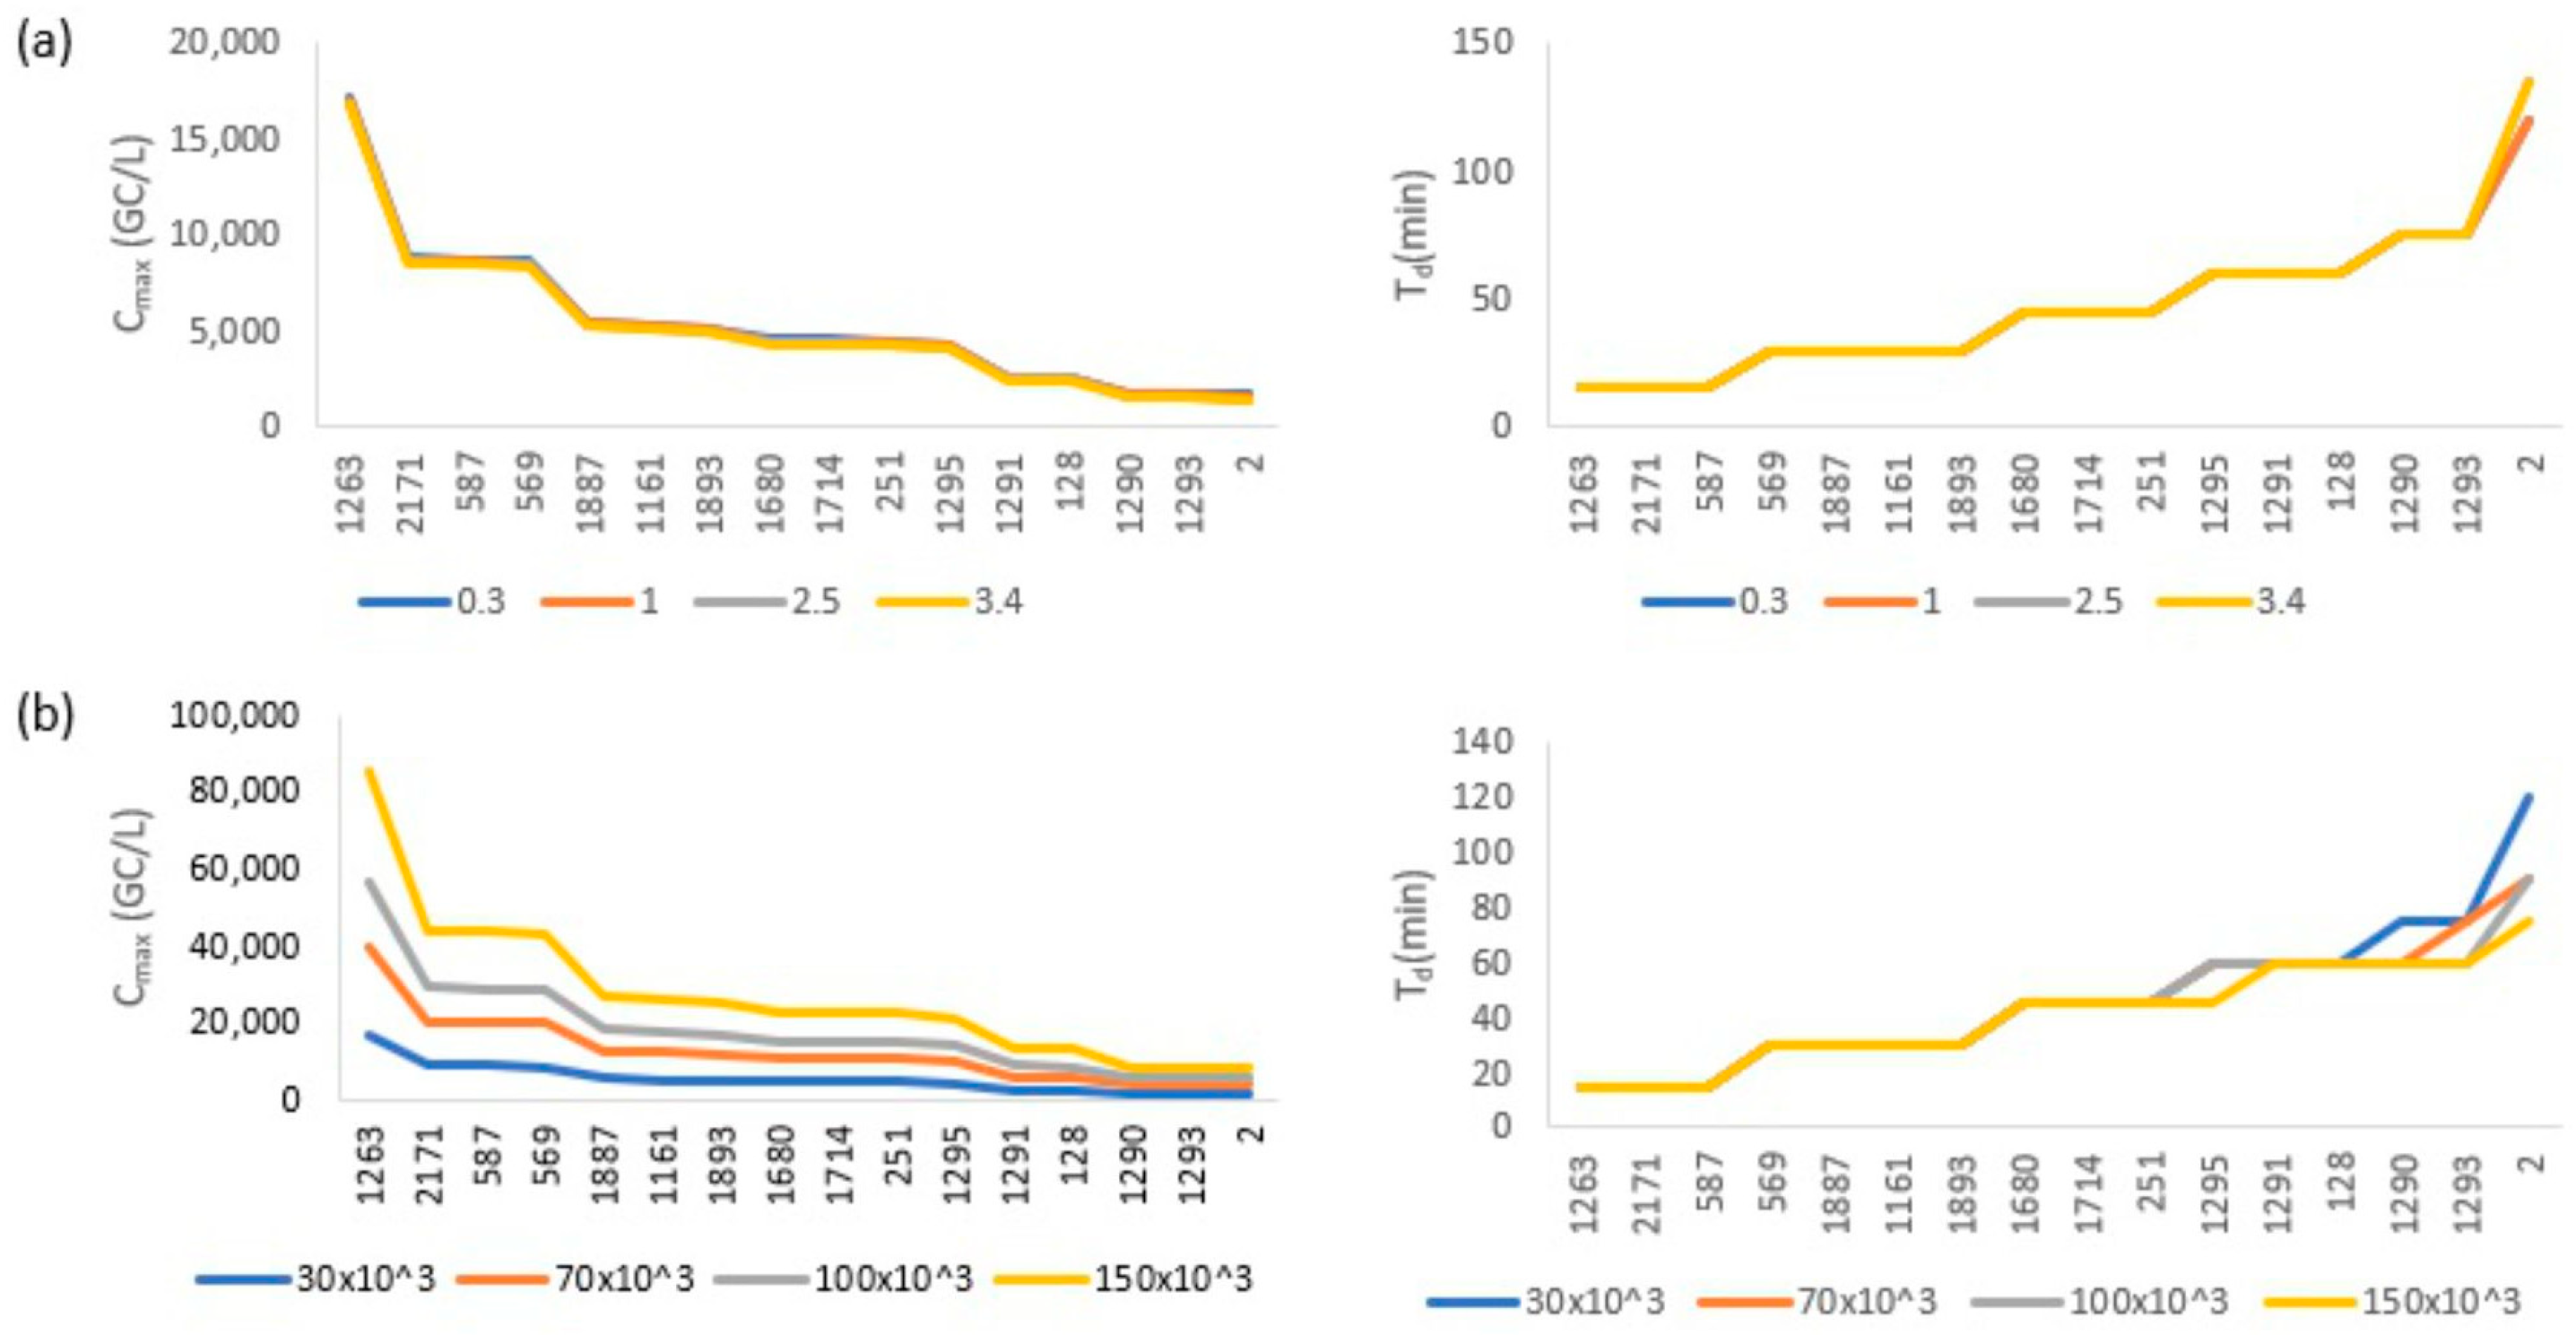
3.1. Simulation Results and Sensitivity Analysis
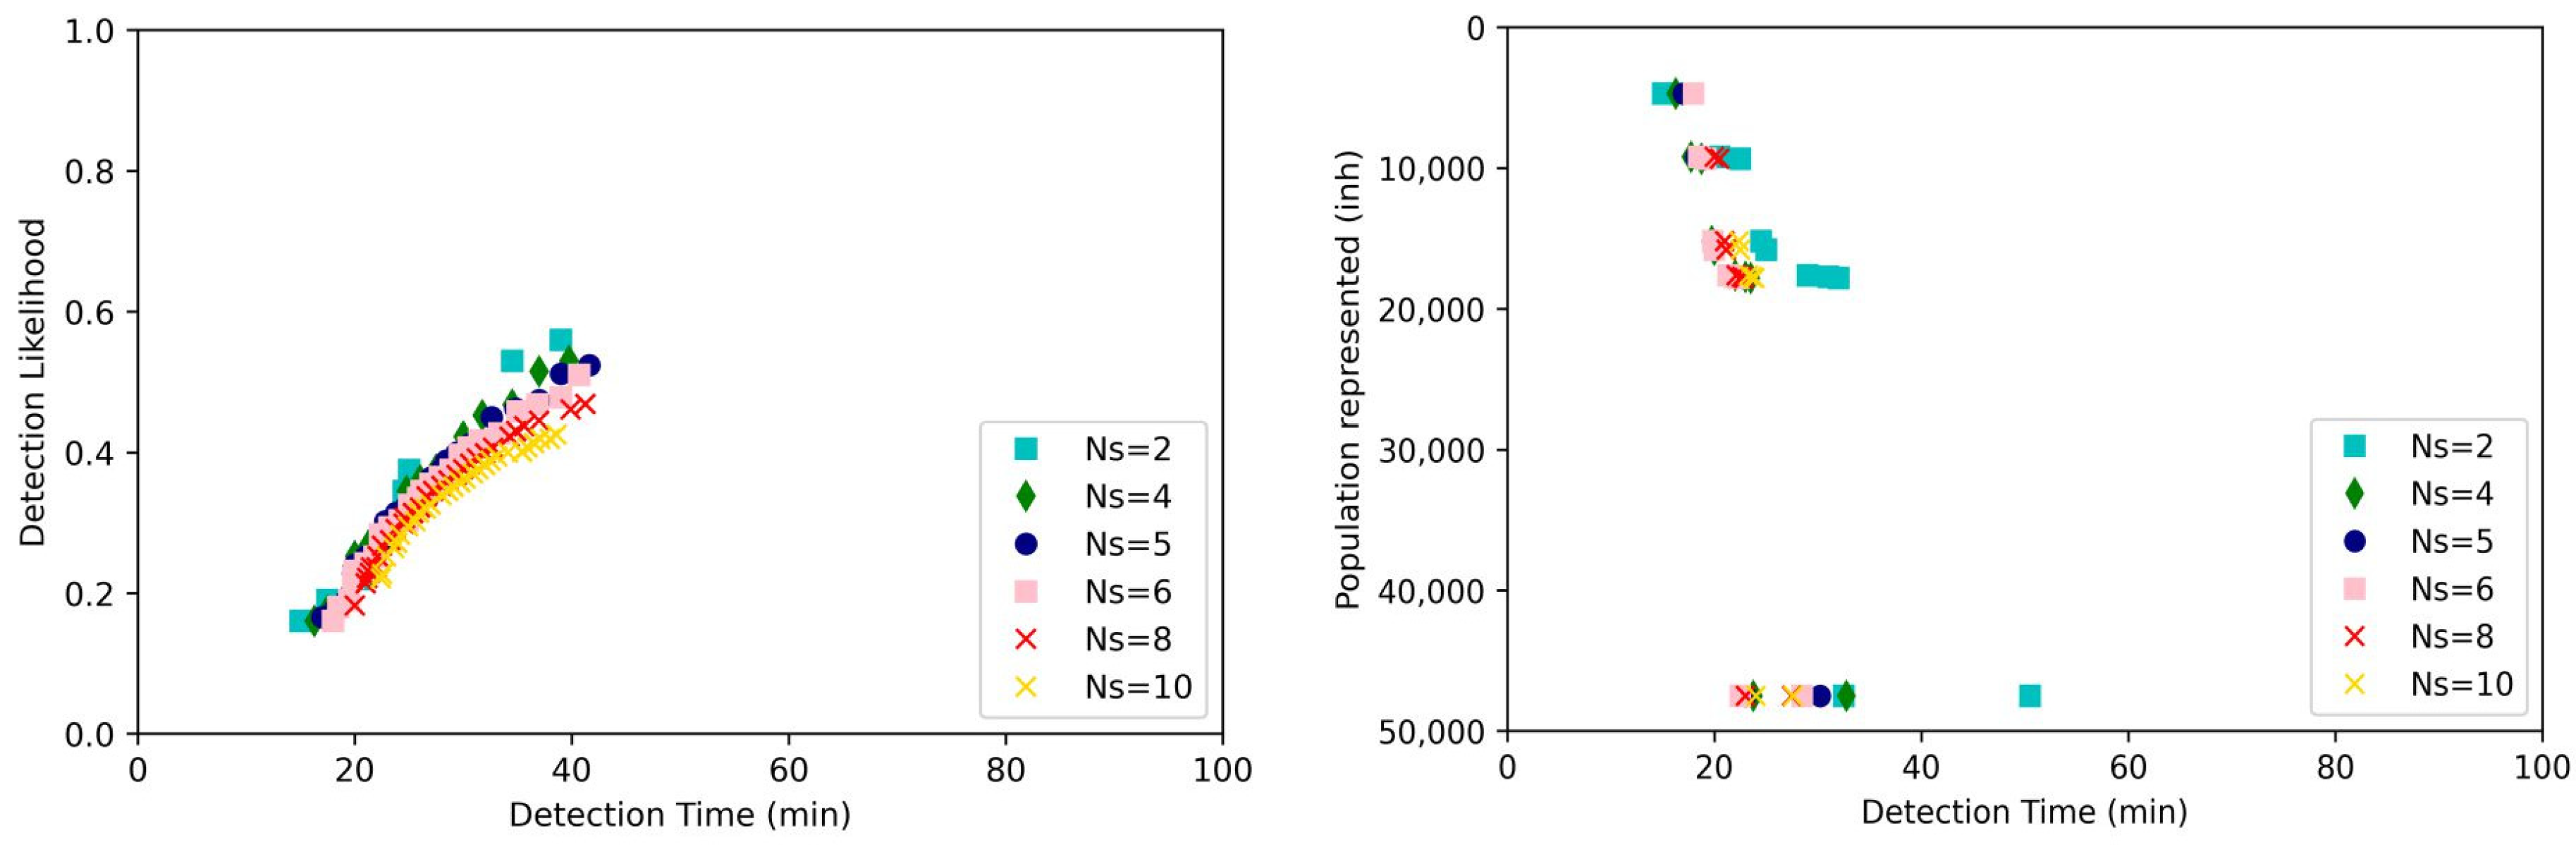
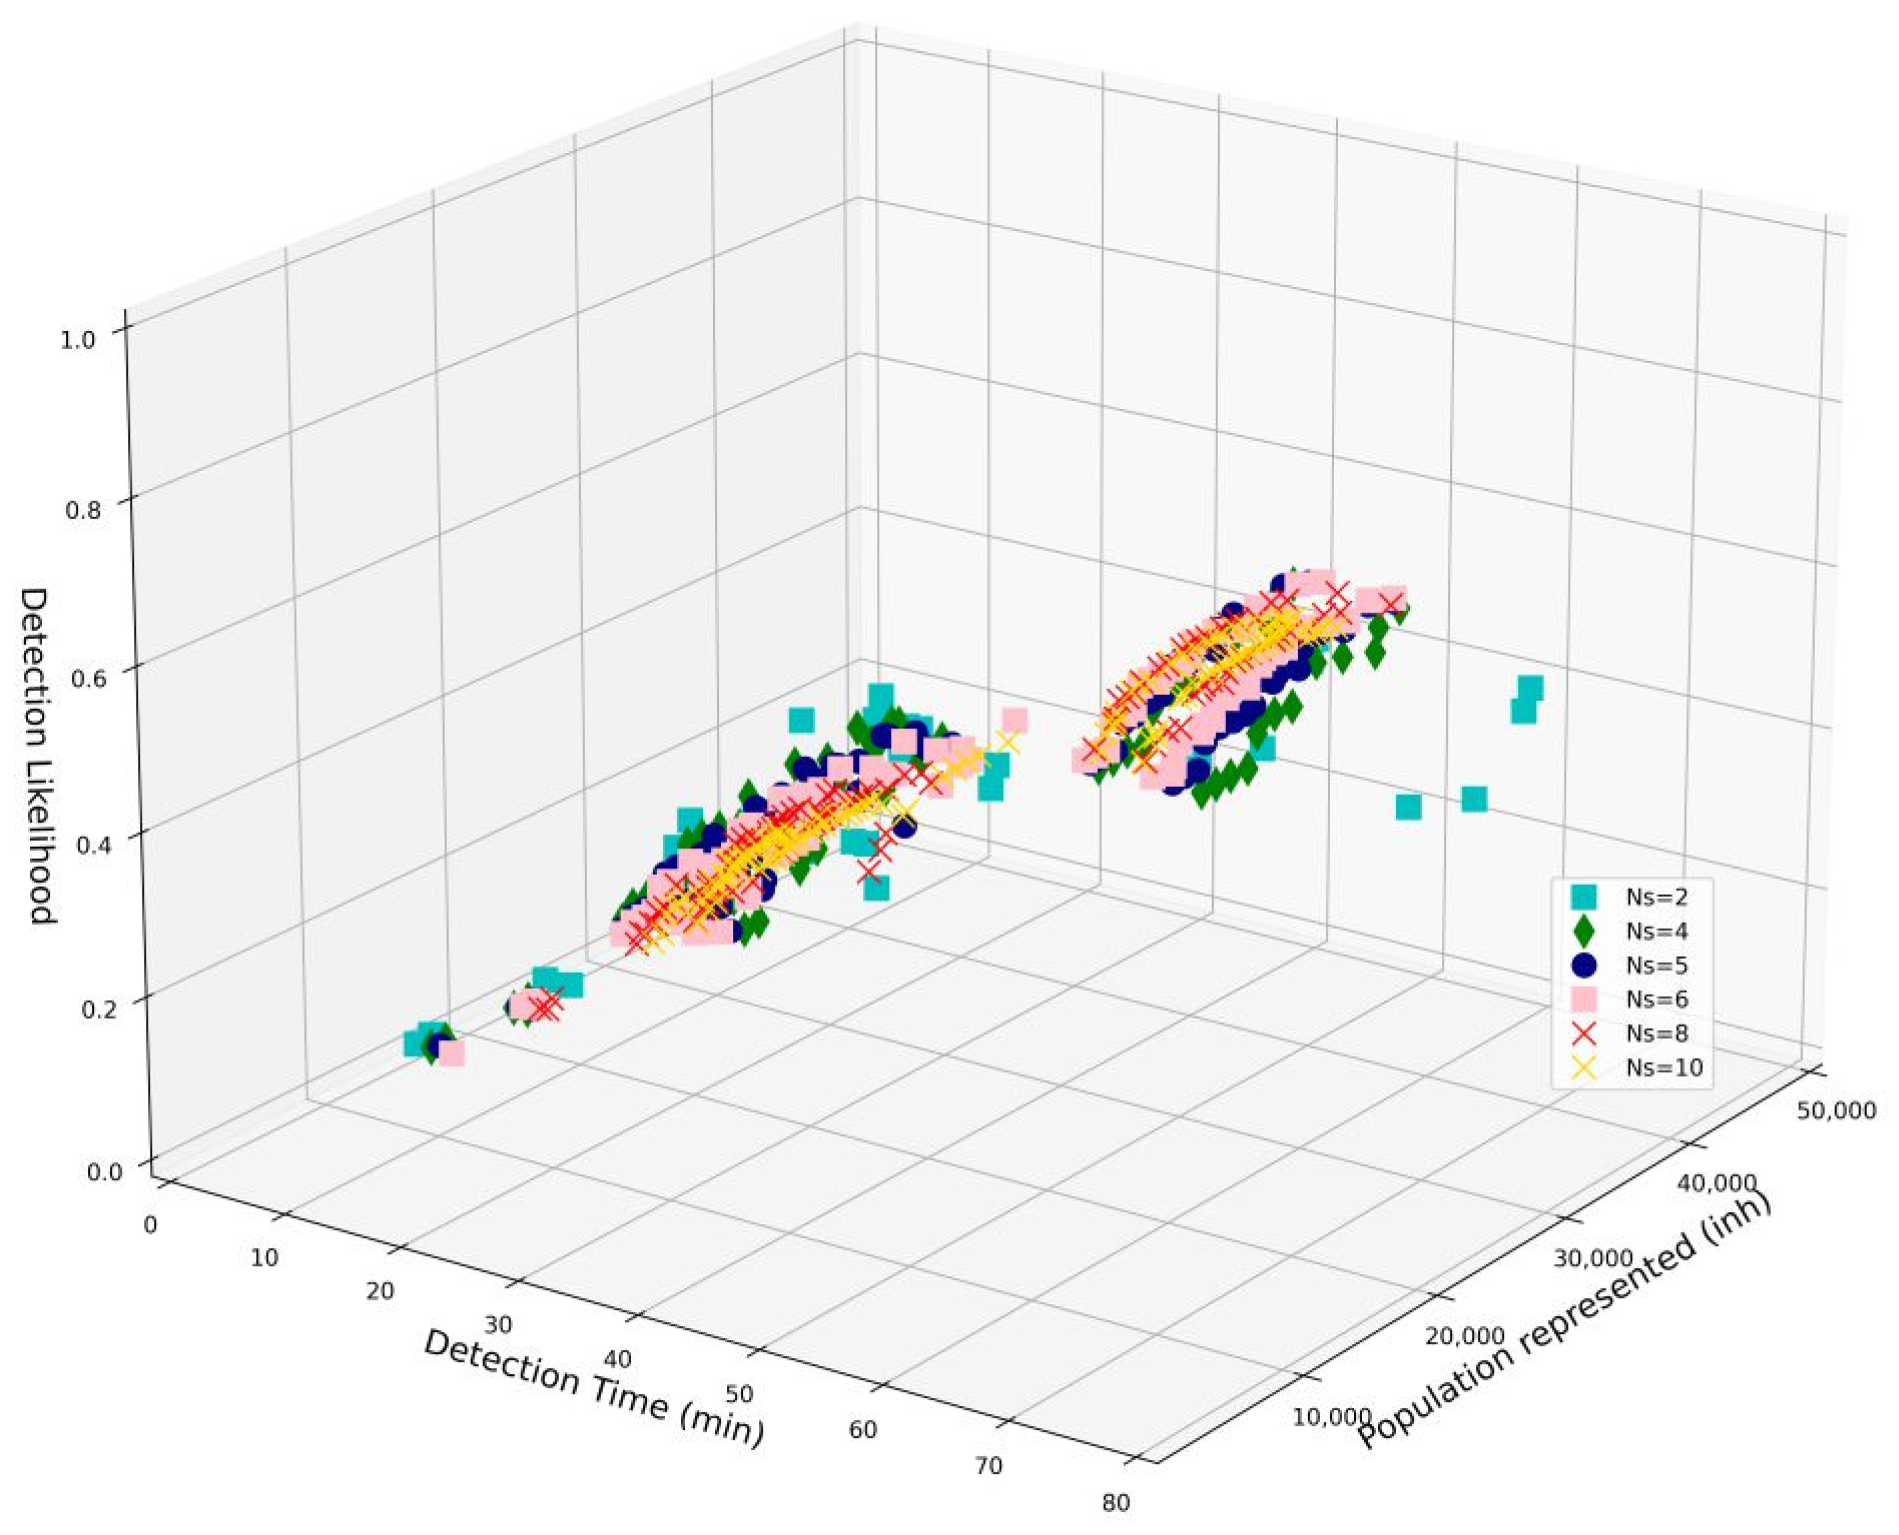
3.2. Optimization Results
3.3. Decision Making
4. Conclusions
Author Contributions
Funding
Data Availability Statement
Acknowledgments
Conflicts of Interest
References
- Ibáñez, M.; Borova, V.; Boix, C.; Aalizadeh, R.; Bade, R.; Thomaidis, N.S.; Hernández, F. UHPLC-QTOF MS Screening of Pharmaceuticals and Their Metabolites in Treated Wastewater Samples from Athens. J. Hazard. Mater. 2017, 323, 26–35. [Google Scholar] [CrossRef]
- Galani, A.; Alygizakis, N.; Aalizadeh, R.; Kastritis, E.; Dimopoulos, M.; Thomaidis, N.S. Environment Patterns of Pharmaceuticals Use during the Fi Rst Wave of COVID-19 Pandemic in Athens, Greece as Revealed by Wastewater-Based Epidemiology. Sci. Total Environ. 2021, 798, 149014. [Google Scholar] [CrossRef] [PubMed]
- Birošová, L.; Mackuľak, T.; Bodík, I.; Ryba, J.; Škubák, J.; Grabic, R. Pilot Study of Seasonal Occurrence and Distribution of Antibiotics and Drug Resistant Bacteria in Wastewater Treatment Plants in Slovakia. Sci. Total Environ. 2014, 490, 440–444. [Google Scholar] [CrossRef] [PubMed]
- Han, J.; He, S. Urban Flooding Events Pose Risks of Virus Spread during the Novel Coronavirus (COVID-19) Pandemic. Sci. Total Environ. 2021, 755, 142491. [Google Scholar] [CrossRef] [PubMed]
- Rousis, N.I.; Denardou, M.; Alygizakis, N.; Galani, A.; Bletsou, A.A.; Damalas, D.E.; Maragou, N.C.; Thomas, K.V.; Thomaidis, N.S. Assessment of Environmental Pollution and Human Exposure to Pesticides by Wastewater Analysis in a Seven-Year Study in Athens, Greece. Toxics 2021, 9, 260. [Google Scholar] [CrossRef] [PubMed]
- Lodder, W.J.; Buisman, A.M.; Rutjes, S.A.; Heijne, J.C.; Teunis, P.F.; de Roda Husman, A.M. Feasibility of Quantitative Environmental Surveillance in Poliovirus Eradication Strategies. Appl. Environ. Microbiol. 2012, 78, 3800–3805. [Google Scholar] [CrossRef] [PubMed]
- Ivanova, O.E.; Yarmolskaya, M.S.; Eremeeva, T.P.; Babkina, G.M.; Baykova, O.Y.; Akhmadishina, L.V.; Krasota, A.Y.; Kozlovskaya, L.I.; Lukashev, A.N. Environmental Surveillance for Poliovirus and Other Enteroviruses: Long-Term Experience in Moscow, Russian Federation, 2004–2017. Viruses 2019, 11, 424. [Google Scholar] [CrossRef]
- Suffredini, E.; Iaconelli, M.; Equestre, M.; Valdazo-González, B.; Ciccaglione, A.R.; Marcantonio, C.; Della Libera, S.; Bignami, F.; La Rosa, G. Genetic Diversity Among Genogroup II Noroviruses and Progressive Emergence of GII.17 in Wastewaters in Italy (2011–2016) Revealed by Next-Generation and Sanger Sequencing. Food Environ. Virol. 2018, 10, 141–150. [Google Scholar] [CrossRef]
- Hou, C.; Hua, Z.; Xu, P.; Xu, H.; Wang, Y.; Liao, J.; Di, B. Estimating the Prevalence of Hepatitis B by Wastewater-Based Epidemiology in 19 Cities in China. Sci. Total Environ. 2020, 740, 139696. [Google Scholar] [CrossRef]
- Wang, X.W.; Li, J.; Guo, T.; Zhen, B.; Kong, Q.; Yi, B.; Li, Z.; Song, N.; Jin, M.; Xiao, W.; et al. Concentration and Detection of SARS Coronavirus in Sewage from Xiao Tang Shan Hospital and the 309th Hospital of the Chinese People’s Liberation Army. Water Sci. Technol. 2005, 52, 213–221. [Google Scholar] [CrossRef]
- Ahmed, W.; Angel, N.; Edson, J.; Bibby, K.; Bivins, A.; O’Brien, J.W.; Choi, P.M.; Kitajima, M.; Simpson, S.L.; Li, J.; et al. First Confirmed Detection of SARS-CoV-2 in Untreated Wastewater in Australia: A Proof of Concept for the Wastewater Surveillance of COVID-19 in the Community. Sci. Total Environ. 2020, 728, 138764. [Google Scholar] [CrossRef] [PubMed]
- D’Aoust, P.M.; Graber, T.E.; Mercier, E.; Montpetit, D.; Alexandrov, I.; Neault, N.; Baig, A.T.; Mayne, J.; Zhang, X.; Alain, T.; et al. Catching a Resurgence: Increase in SARS-CoV-2 Viral RNA Identified in Wastewater 48 h before COVID-19 Clinical Tests and 96 h before Hospitalizations. Sci. Total Environ. 2021, 770, 145319. [Google Scholar] [CrossRef] [PubMed]
- Wurtzer, S.; Marechal, V.; Mouchel, J.M.; Maday, Y.; Teyssou, R.; Richard, E.; Almayrac, J.L.; Moulin, L. Evaluation of Lockdown Effect on SARS-CoV-2 Dynamics through Viral Genome Quantification in Waste Water, Greater Paris, France, 5 March to 23 April 2020. Eurosurveillance 2020, 25, 2000776. [Google Scholar] [CrossRef] [PubMed]
- Westhaus, S.; Weber, F.A.; Schiwy, S.; Linnemann, V.; Brinkmann, M.; Widera, M.; Greve, C.; Janke, A.; Hollert, H.; Wintgens, T.; et al. Detection of SARS-CoV-2 in Raw and Treated Wastewater in Germany—Suitability for COVID-19 Surveillance and Potential Transmission Risks. Sci. Total Environ. 2021, 751, 141750. [Google Scholar] [CrossRef] [PubMed]
- Petala, M.; Dafou, D.; Kostoglou, M.; Karapantsios, T.; Kanata, E.; Chatziefstathiou, A.; Sakaveli, F.; Kotoulas, K.; Arsenakis, M.; Roilides, E.; et al. A Physicochemical Model for Rationalizing SARS-CoV-2 Concentration in Sewage. Case Study: The City of Thessaloniki in Greece. Sci. Total Environ. 2020, 755, 142855. [Google Scholar] [CrossRef] [PubMed]
- Galani, A.; Aalizadeh, R.; Kostakis, M.; Markou, A.; Alygizakis, N.; Lytras, T.; Adamopoulos, P.G.; Peccia, J.; Thompson, D.C.; Kontou, A.; et al. SARS-CoV-2 Wastewater Surveillance Data Can Predict Hospitalizations and ICU Admissions. Sci. Total Environ. 2022, 804, 150151. [Google Scholar] [CrossRef] [PubMed]
- Hata, A.; Hara-Yamamura, H.; Meuchi, Y.; Imai, S.; Honda, R. Detection of SARS-CoV-2 in Wastewater in Japan during a COVID-19 Outbreak. Sci. Total Environ. 2021, 758, 143578. [Google Scholar] [CrossRef] [PubMed]
- Hasan, S.W.; Ibrahim, Y.; Daou, M.; Kannout, H.; Jan, N.; Lopes, A.; Alsafar, H.; Yousef, A.F. Detection and Quantification of SARS-CoV-2 RNA in Wastewater and Treated Effluents: Surveillance of COVID-19 Epidemic in the United Arab Emirates. Sci. Total Environ. 2021, 764, 142929. [Google Scholar] [CrossRef]
- Albastaki, A.; Naji, M.; Lootah, R.; Almeheiri, R.; Almulla, H.; Almarri, I.; Alreyami, A.; Aden, A.; Alghafri, R. First Confirmed Detection of SARS-CoV-2 in Untreated Municipal and Aircraft Wastewater in Dubai, UAE: The Use of Wastewater Based Epidemiology as an Early Warning Tool to Monitor the Prevalence of COVID-19. Sci. Total Environ. 2021, 760, 143350. [Google Scholar] [CrossRef]
- Gonzalez, R.; Curtis, K.; Bivins, A.; Bibby, K.; Weir, M.H.; Yetka, K.; Thompson, H.; Keeling, D.; Mitchell, J.; Gonzalez, D. COVID-19 Surveillance in Southeastern Virginia Using Wastewater-Based Epidemiology. Water Res. 2020, 186, 116296. [Google Scholar] [CrossRef]
- Wu, F.; Xiao, A.; Zhang, J.; Moniz, K.; Endo, N.; Armas, F.; Bonneau, R.; Brown, M.A.; Bushman, M.; Chai, P.R.; et al. SARS-CoV-2 Titers in Wastewater Foreshadow Dynamics and Clinical Presentation of New COVID-19 Cases. medRxiv 2020, 1–44. [Google Scholar] [CrossRef]
- Weidhaas, J.; Aanderud, Z.T.; Roper, D.K.; VanDerslice, J.; Gaddis, E.B.; Ostermiller, J.; Hoffman, K.; Jamal, R.; Heck, P.; Zhang, Y.; et al. Correlation of SARS-CoV-2 RNA in Wastewater with COVID-19 Disease Burden in Sewersheds. Sci. Total Environ. 2021, 775, 145790. [Google Scholar] [CrossRef] [PubMed]
- Medema, G.; Heijnen, L.; Elsinga, G.; Italiaander, R.; Brouwer, A. Presence of SARS-Coronavirus-2 RNA in Sewage and Correlation with Reported COVID-19 Prevalence in the Early Stage of the Epidemic in the Netherlands. Environ. Sci. Technol. Lett. 2020, 7, 511–516. [Google Scholar] [CrossRef] [PubMed]
- Randazzo, W.; Truchado, P.; Cuevas-Ferrando, E.; Simón, P.; Allende, A.; Sánchez, G. SARS-CoV-2 RNA in Wastewater Anticipated COVID-19 Occurrence in a Low Prevalence Area. Water Res. 2020, 181, 115942. [Google Scholar] [CrossRef] [PubMed]
- Nemudryi, A.; Nemudraia, A.; Wiegand, T.; Surya, K.; Buyukyoruk, M.; Cicha, C.; Vanderwood, K.K.; Wilkinson, R.; Wiedenheft, B. Temporal Detection and Phylogenetic Assessment of SARS-CoV-2 in Municipal Wastewater. Cell Rep. Med. 2020, 1, 100098. [Google Scholar] [CrossRef] [PubMed]
- Petala, M.; Kostoglou, M.; Karapantsios, T.; Dovas, C.; Lytras, T.; Paraskevis, D.; Roilides, E.; Koutsolioutsou-Benaki, A.; Panagiotakopoulos, G.; Sypsa, V.; et al. Relating SARS-CoV-2 Shedding Rate in Wastewater to Daily Positive Tests Data: A Consistent Model Based Approach. Sci. Total Environ. 2021, 807, 150838. [Google Scholar] [CrossRef] [PubMed]
- Chassalevris, T.; Chaintoutis, S.C.; Koureas, M.; Petala, M.; Moutou, E.; Beta, C.; Kyritsi, M.; Hadjichristodoulou, C.; Kostoglou, M.; Karapantsios, T.; et al. SARS-CoV-2 Wastewater Monitoring Using a Novel PCR-Based Method Rapidly Captured the Delta-to-Omicron ΒA.1 Transition Patterns in the Absence of Conventional Surveillance Evidence. Sci. Total Environ. 2022, 844, 156932. [Google Scholar] [CrossRef]
- Tiacharoen, V.; Denpetkul, T.; Kosoltanapiwat, N.; Maneekan, P.; Thippornchai, N.; Saeoueng, A.; Jittmittraphap, A.; Sattabongkot, J.; Leaungwutiwong, P. Detection of SARS-CoV-2 and Variants in Hospital Wastewater in a Developing Country. Water 2022, 14, 3798. [Google Scholar] [CrossRef]
- Wu, F.; Zhang, J.; Xiao, A.; Gu, X.; Lee, L.; Armas, F.; Kauffman, K.; Hanage, W.; Matus, M.; Ghaeli, N.; et al. SARS-CoV-2 Titers in Wastewater Are Higher than Expected from Clinically Confirmed Cases. mSystems 2020, 5, e00614-20. [Google Scholar] [CrossRef]
- Chen, Y.; Chen, L.; Deng, Q.; Zhang, G.; Wu, K.; Ni, L.; Yang, Y.; Liu, B.; Wang, W.; Wei, C.; et al. The Presence of SARS-CoV-2 RNA in the Feces of COVID-19 Patients. J. Med. Virol. 2020, 92, 833–840. [Google Scholar] [CrossRef]
- Hvitved-Jacobsen, T.; Vollertsen, J.; Nielsen, A.H. Sewer Processes Microbial and Chemical Process Engineering of Sewer Networks, 2nd ed.; Taylor & Francis: New York, NY, USA, 2013. [Google Scholar]
- Ye, Y.; Ellenberg, R.M.; Graham, K.E.; Wigginton, K.R. Survivability, Partitioning, and Recovery of Enveloped Viruses in Untreated Municipal Wastewater. Environ. Sci. Technol. 2016, 50, 5077–5085. [Google Scholar] [CrossRef] [PubMed]
- Gundy, P.M.; Gerba, C.P.; Pepper, I.L. Survival of Coronaviruses in Water and Wastewater. Food Environ. Virol. 2009, 1, 10–14. [Google Scholar] [CrossRef]
- Nghiem, L.D.; Morgan, B.; Donner, E.; Short, M.D. The COVID-19 Pandemic: Considerations for the Waste and Wastewater Services Sector. Case Stud. Chem. Environ. Eng. 2020, 1, 100006. [Google Scholar] [CrossRef]
- Naddeo, V.; Liu, H. Editorial Perspectives: 2019 Novel Coronavirus (SARS-CoV-2): What Is Its Fate in Urban Water Cycle and How Can the Water Research Community Respond? Environ. Sci. Water Res. Technol. 2020, 6, 1213–1216. [Google Scholar] [CrossRef]
- Kostoglou, M.; Petala, M.; Karapantsios, T.; Dovas, C.; Roilides, E.; Metallidis, S.; Papa, A.; Stylianidis, E.; Papadopoulos, A.; Papaioannou, N. SARS-CoV-2 Adsorption on Suspended Solids along a Sewerage Network: Mathematical Model Formulation, Sensitivity Analysis, and Parametric Study. Environ. Sci. Pollut. Res. 2021, 29, 11304–11319. [Google Scholar] [CrossRef] [PubMed]
- Hart, O.E.; Halden, R.U. Modeling Wastewater Temperature and Attenuation of Sewage-Borne Biomarkers Globally. Water Res. 2020, 172, 115473. [Google Scholar] [CrossRef]
- Hart, O.E.; Halden, R.U. Computational Analysis of SARS-CoV-2/COVID-19 Surveillance by Wastewater-Based Epidemiology Locally and Globally: Feasibility, Economy, Opportunities and Challenges. Sci. Total Environ. 2020, 730, 138875. [Google Scholar] [CrossRef] [PubMed]
- Ahmed, W.; Bertsch, P.M.; Bibby, K.; Haramoto, E.; Hewitt, J.; Huygens, F.; Gyawali, P.; Korajkic, A.; Riddell, S.; Sherchan, S.P.; et al. Decay of SARS-CoV-2 and Surrogate Murine Hepatitis Virus RNA in Untreated Wastewater to Inform Application in Wastewater-Based Epidemiology. Environ. Res. 2020, 191, 110092. [Google Scholar] [CrossRef]
- Bivins, A.; Greaves, J.; Fischer, R.; Yinda, K.C.; Ahmed, W.; Kitajima, M.; Munster, V.J.; Bibby, K. Persistence of SARS-CoV-2 in Water and Wastewater. Environ. Sci. Technol. Lett. 2020, 7, 937–942. [Google Scholar] [CrossRef]
- Hokajärvi, A.M.; Rytkönen, A.; Tiwari, A.; Kauppinen, A.; Oikarinen, S.; Lehto, K.M.; Kankaanpää, A.; Gunnar, T.; Al-Hello, H.; Blomqvist, S.; et al. The Detection and Stability of the SARS-CoV-2 RNA Biomarkers in Wastewater Influent in Helsinki, Finland. Sci. Total Environ. 2021, 770, 145274. [Google Scholar] [CrossRef]
- Yang, S.; Dong, Q.; Li, S.; Cheng, Z.; Kang, X.; Ren, D.; Xu, C.; Zhou, X.; Liang, P.; Sun, L.; et al. Persistence of SARS-CoV-2 RNA in Wastewater after the End of the COVID-19 Epidemics. J. Hazard. Mater. 2022, 429, 128358. [Google Scholar] [CrossRef] [PubMed]
- Katsifarakis, K.L.; Karpouzos, D.K. Genetic Algorithms and Water Resources Management: An Established, yet Evolving Relationship. In Hydrology, Hydraulics and Water Resources Management; WIT Press: Billerica, MA, USA, 2012; Volume 56, pp. 7–37. ISBN 0-932955-87-8. [Google Scholar]
- Ostfeld, A.; Uber, J.G.; Salomons, E.; Berry, J.W.; Hart, W.E.; Phillips, C.A.; Watson, J.-P.; Dorini, G.; Jonkergouw, P.; Kapelan, Z.; et al. The Battle of the Water Sensor Networks (BWSN): A Design Challenge for Engineers and Algorithms. J. Water Resour. Plan. Manag. 2008, 134, 556–568. [Google Scholar] [CrossRef]
- Anagnostopoulou, E. Optimal Design of Quality Sensors Placement in Water Distribution Systems. Master’s Thesis, National Technical University of Athens, Athens, Greece, 2015. [Google Scholar]
- Brentan, B.; Carpitella, S.; Barros, D.; Meirelles, G.; Certa, A.; Izquierdo, J. Water Quality Sensor Placement: A Multi-Objective and Multi-Criteria Approach. Water Resour. Manag. 2021, 35, 225–241. [Google Scholar] [CrossRef]
- Jafari, H.; Nazif, S.; Rajaee, T. A Multi-Objective Optimization Method Based on NSGA-III for Water Quality Sensor Placement with the Aim of Reducing Potential Contamination of Important Nodes. Water Supply 2022, 22, 928–944. [Google Scholar] [CrossRef]
- Banik, B.; Alfonso, L.; Di Cristo, C.; Leopardi, A. Greedy Algorithms for Sensor Location in Sewer Systems. Water 2017, 9, 856. [Google Scholar] [CrossRef]
- Banik, B.K.; Alfonso, L.; Di Cristo, C.; Leopardi, A.; Mynett, A. Evaluation of Different Formulations to Optimally Locate Sensors in Sewer Systems. J. Water Resour. Plann. Manag. 2017, 143, 04017026. [Google Scholar] [CrossRef]
- Banik, B.K.; Alfonso, L.; Torres, A.S.; Mynett, A.; Di Cristo, C.; Leopardi, A. Optimal Placement of Water Quality Monitoring Stations in Sewer Systems: An Information Theory Approach. Procedia Eng. 2015, 119, 1308–1317. [Google Scholar] [CrossRef]
- Lee, J.H. Determination of Optimal Water Quality Monitoring Points in Sewer Systems Using Entropy Theory. Entropy 2013, 15, 3419–3434. [Google Scholar] [CrossRef]
- Alfonso, L.; He, L.; Lobbrecht, A.; Price, R. Information Theory Applied to Evaluate the Discharge Monitoring Network of the Magdalena River. J. Hydroinform. 2013, 15, 211–228. [Google Scholar] [CrossRef]
- Psarrou, E.; Tsoukalas, I.; Makropoulos, C. A Monte-Carlo-Based Method for the Optimal Placement and Operation Scheduling of Sewer Mining Units in Urban Wastewater Networks. Water 2018, 10, 200. [Google Scholar] [CrossRef]
- Domokos, E.; Sebestyén, V.; Somogyi, V.; Trájer, A.J.; Gerencsér-Berta, R.; Horváth, B.O.; Tóth, E.G.; Jakab, F.; Kemenesi, G.; Abonyi, J. Identification of Sampling Points for the Detection of SARS-CoV-2 in the Sewage System. Sustain. Cities Soc. 2021, 76, 103422. [Google Scholar] [CrossRef]
- Rossman, L.A. Storm Water Management Model User’s Manual Version 5.1; U.S. Environmental Protection Agency (EPA): Cincinnaty, OH, USA, 2015.
- Lowe, S.A. Sanitary Sewer Design Using EPA Storm Water Management Model (SWMM). Comput. Appl. Eng. Educ. 2010, 18, 203–212. [Google Scholar] [CrossRef]
- Rossman, L.A.; Huber, W.C. Storm Water Management Model Reference Manual Vollume III—Water Quality; U.S. Environmental Protection Agency (EPA): Cincinnaty, OH, USA, 2016.
- Li, X.; Zhang, S.; Shi, J.; Luby, S.P.; Jiang, G. Uncertainties in Estimating SARS-CoV-2 Prevalence by Wastewater-Based Epidemiology. Chem. Eng. J. 2021, 415, 129039. [Google Scholar] [CrossRef] [PubMed]
- McDonnell, B.; Ratliff, K.; Tryby, M.; Wu, J.; Mullapudi, A. PySWMM: The Python Interface to Stormwater Management Model (SWMM). J. Open Source Softw. 2020, 5, 2292. [Google Scholar] [CrossRef] [PubMed]
- Deb, K.; Pratap, A.; Agarwal, S.; Meyarivan, T. A Fast and Elitist Multiobjective Genetic Algorithm: NSGA-II. IEEE Trans. Evol. Comput. 2002, 6, 182–197. [Google Scholar] [CrossRef]
- Blank, J.; Deb, K. Pymoo: Multi-Objective Optimization in Python. IEEE Access 2020, 8, 89497–89509. [Google Scholar] [CrossRef]
- IMEdD LAB. Available online: https://lab.imedd.org/covid19/?lang=en (accessed on 8 May 2023).
- Pecson, B.M.; Darby, E.; Haas, C.N.; Amha, Y.M.; Bartolo, M.; Danielson, R.; Dearborn, Y.; Di Giovanni, G.; Ferguson, C.; Fevig, S.; et al. Reproducibility and Sensitivity of 36 Methods to Quantify the SARS-CoV-2 Genetic Signal in Raw Wastewater: Findings from an Interlaboratory Methods Evaluation in the U.S. Environ. Sci. Water Res. Technol. 2021, 7, 504–520. [Google Scholar] [CrossRef]
- Tchobanoglous, G.; Burton, F.L.; Stensel, D.H. Wastewater Engineering: Treatment and Reuse, 4th ed.; Metcalf & Eddy Inc.: Wakefield, MA, USA, 2003. [Google Scholar]
- Guo, Y.; Liu, Y.; Gao, S.; Zhou, X.; Sivakumar, M.; Jiang, G. Effects of Temperature and Water Types on the Decay of Coronavirus: A Review. Water 2023, 15, 1051. [Google Scholar] [CrossRef]
- Hwang, C.L.; Lai, Y.J.; Liu, T.Y. A New Approach for Multiple Objective Decision Making. Comput. Oper. Res. 1993, 20, 889–899. [Google Scholar] [CrossRef]
- Wang, Z.; Rangaiah, G.P. Application and Analysis of Methods for Selecting an Optimal Solution from the Pareto-Optimal Front Obtained by Multiobjective Optimization. Ind. Eng. Chem. Res. 2017, 56, 560–574. [Google Scholar] [CrossRef]
- Zionts, S.; Wallenius, J. An Interactive Multiple Objective Linear Programming Method for a Class of Underlying Nonlinear Utility Functions. Manag. Sci. 1983, 29, 519–529. [Google Scholar] [CrossRef]
- Vallejo, J.A.; Trigo-Tasende, N.; Rumbo-Feal, S.; Conde-Pérez, K.; López-Oriona, Á.; Barbeito, I.; Vaamonde, M.; Tarrío-Saavedra, J.; Reif, R.; Ladra, S.; et al. Modeling the Number of People Infected with SARS-CoV-2 from Wastewater Viral Load in Northwest Spain. Sci. Total Environ. 2022, 811, 152334. [Google Scholar] [CrossRef] [PubMed]


| Optimization Combination | Ns | Solutions | Td (min) | PS (inh) | DL |
|---|---|---|---|---|---|
| WWTP | 1 | 86 | 47,494 | 0.25 | |
| TOPSIS | |||||
| C1 | 4 | 1872, 1161, 1893, 1295 | 39.75 | 0.53 | |
| 4 | 1872, 1161, 251, 1295 | 37 | 0.52 | ||
| 4 | 1872, 1161, 1295, 1290 | 34.5 | 0.47 | ||
| 4 | 1937, 1872, 1161, 1295 | 34.5 | 0.47 | ||
| C2 | 6 | 1263, 1680, 1714, 1291, 128, 2 | 28.5 | 47,496 | |
| 6 | 1263, 2171, 1680, 1714, 1291, 128 | 22.5 | 47,494 | ||
| 4 | 1263, 1680, 128, 2 | 32.75 | 47,496 | ||
| 4 | 1263, 2171, 1680, 128 | 23.75 | 47,494 | ||
| C3 | 4 | 1161, 1680, 1295, 2 | 44.75 | 47,496 | 0.39 |
| 4 | 1872, 251, 1295, 2 | 47.75 | 47,496 | 0.44 | |
| 4 | 1937, 2171, 1680, 1295 | 31.5 | 47,494 | 0.31 | |
| 4 | 1680, 1295, 1291, 2 | 39 | 47,496 | 0.30 | |
| SAW | |||||
| C3 | 4 | 1872, 2171, 1161, 1295 | 40.5 | 47,494 | 0.47 |
| 5 | 1872, 2171, 1161, 1893, 1295 | 41.8 | 47,494 | 0.47 | |
| 5 | 1872, 2171, 1161, 251, 1295 | 39.6 | 47,494 | 0.46 | |
| 6 | 1872, 2171, 1161, 1893, 251, 1295 | 40.8 | 47,494 | 0.47 | |
| Sorted based on DL | |||||
| C3 | 4 | 1872, 1161, 1893, 1295 | 39.75 | 17,731 | 0.53 |
| 4 | 2185, 1872, 1161, 1295 | 40.25 | 17,814 | 0.53 | |
| 5 | 2185, 1872, 1161, 1893, 1295 | 41.6 | 17,814 | 0.52 | |
| 4 | 1872, 1887, 1161, 1295 | 43 | 18,532 | 0.52 |
Disclaimer/Publisher’s Note: The statements, opinions and data contained in all publications are solely those of the individual author(s) and contributor(s) and not of MDPI and/or the editor(s). MDPI and/or the editor(s) disclaim responsibility for any injury to people or property resulting from any ideas, methods, instructions or products referred to in the content. |
© 2023 by the authors. Licensee MDPI, Basel, Switzerland. This article is an open access article distributed under the terms and conditions of the Creative Commons Attribution (CC BY) license (https://creativecommons.org/licenses/by/4.0/).
Share and Cite
Gkatzioura, A.; Zafeirakou, A. Optimal Selection of Sampling Points for Detecting SARS-CoV-2 RNA in Sewer System Using NSGA-II Algorithm. Water 2023, 15, 4076. https://doi.org/10.3390/w15234076
Gkatzioura A, Zafeirakou A. Optimal Selection of Sampling Points for Detecting SARS-CoV-2 RNA in Sewer System Using NSGA-II Algorithm. Water. 2023; 15(23):4076. https://doi.org/10.3390/w15234076
Chicago/Turabian StyleGkatzioura, Argyro, and Antigoni Zafeirakou. 2023. "Optimal Selection of Sampling Points for Detecting SARS-CoV-2 RNA in Sewer System Using NSGA-II Algorithm" Water 15, no. 23: 4076. https://doi.org/10.3390/w15234076
APA StyleGkatzioura, A., & Zafeirakou, A. (2023). Optimal Selection of Sampling Points for Detecting SARS-CoV-2 RNA in Sewer System Using NSGA-II Algorithm. Water, 15(23), 4076. https://doi.org/10.3390/w15234076