1. Introduction
Antimicrobial resistance is a major global concern, complicating the treatment of infectious diseases [
1]. In recent years, technological advancements have fostered the development of novel antimicrobial alternatives. One such promising innovation is Low-Temperature Atmospheric Pressure Plasma (LTAPP), which has demonstrated a significant impact on ESKAPE pathogens [
2]. LTAPP is renowned for its multifaceted properties, including antimicrobial, anti-inflammatory, and tissue repair capabilities, potentially addressing several diseases [
3,
4].
The mechanisms of LTAPP’s antimicrobial action can be categorized as direct and indirect. Direct action involves the immediate application of plasma on pathogens, while the indirect mode exploits the use of liquids, primarily water, treated with plasma [
4]. This indirect approach relies on the unique reactive species generated in the liquid medium due to plasma treatment. A prominent product of this indirect approach is Plasma-Activated Water (PAW) [
5]. PAW is produced by exposing the water to LTAPP, boasting a diverse range of applications from degrading chemical compounds in water to facilitating environmental solutions, nanoparticle production, dispersion, and biological processes [
6,
7,
8,
9]. The rising interest in PAW can be attributed to the plasma’s capacity to generate UV radiation and radicals, catalyzing chemical reactions in liquid mediums [
10]. The unique attributes of PAW are derived from radicals and species, primarily OH and NO, generated by plasma. These radicals serve as precursors to more stable compounds such as hydrogen peroxide (H
2O
2), nitrous acid (HNO
2), and nitric acid (HNO
3) [
11,
12].
PAW presents a significant advantage over direct plasma jets, preventing hazards associated with electric currents, high voltages, thermal damage to tissues, and UV exposure [
13]. Studies have revealed PAW’s potent antimicrobial efficacy, which is attributed to the combined effects of nitrite (NO
2−), nitrate (NO
3−), and hydrogen peroxide (H
2O
2), which are typically produced at lower pH levels [
10]. With its broad-spectrum antimicrobial capabilities, ease of use, and the ability to eradicate microorganisms via non-thermal plasma discharges, PAW has emerged as a promising tool in the fight against infectious diseases [
14].
To further enhance the efficacy and applications of PAW, various production techniques are being explored in the field of plasma science [
5]. Notable among these are the gliding arc and plasma jet techniques, which utilize electrical discharge to create non-thermal plasma under atmospheric conditions [
15]. These techniques are celebrated for their energy efficiency and ability to generate reactive oxygen and nitrogen species (RONS), making them effective mediums for PAW production [
16,
17].
Another promising approach is the utilization of Dielectric Barrier Discharge (DBD) [
18,
19,
20,
21,
22]. DBDs generate non-thermal plasma at atmospheric pressure and are favored for producing a uniform discharge and optimal energy density [
18,
19]. In a DBD setup, at least one electrode is insulated by a dielectric layer, preventing arc discharge transition and fostering a non-uniform electric field, which enables non-thermal plasma generation [
19].
There are many techniques used to generate DBD plasma; the configurations in DBD systems vary according to their design and intended use. Planar DBD systems, known for their flat electrode arrangements, are well suited for surface treatments and film depositions [
19]. Packed-bed DBD and microplasma DBD systems, on the other hand, are tailored for specific applications: the former for pollution control and the latter for medical therapies [
19]. Additionally, cylindrical DBD systems, with their coaxial electrodes, excel in promoting uniform gas flow treatments, useful in processes like the removal of NO
x and SO
2 from flue gas and methane reformation [
23]. These DBD configurations have various applications, including surface modification, materials synthesis, thin film deposition, and the activation of liquids like PAW [
24,
25,
26,
27].
DBD can activate water by exposing it to gas effluent containing reactive species like NO
2−, NO
3−, O
3, H
2O
2, and other free radicals [
20]. These can react with water molecules, altering their properties [
27]. The effectiveness of PAW treatment depends on several factors, including the type and concentration of reactive species in the gas effluent, the exposure duration, and the composition of the water being treated [
28]. The process can be optimized by adjusting DBD discharge parameters, such as voltage, frequency, and gas flow rate. The application of DBD gas effluent in water activation represents an emerging frontier in scientific research, with potential multidisciplinary applications.
In this context, this study focuses on producing PAW using a coaxial DBD reactor, with air as the working gas. This work provides a characterization of the developed system, concentrating on operational parameters. The process includes quantification of power consumption and adjustments to variables such as gas flow rate, activation interval, and volumetric parameters. An assessment of the produced PAW involved physicochemical characterization, examining parameters like pH, redox potential ORP, conductivity, total dissolved solids (TDS), and concentrations of RONS. The PAW showed concentrations of reactive species and physicochemical attributes, differentiating it from systems in the existing literature that require longer processing times and might not achieve these values. Additionally, the potential applications of PAW were explored using microbiological assays, assessing its effectiveness against the Gram-positive bacterium Staphylococcus aureus, the Gram-negative bacterium Escherichia coli, and the fungus Candida albicans. The results suggest that PAW could be useful for the treatment of infectious diseases.
2. Materials and Methods
2.1. DBD Reactor and Electrical Characterization
PAW was synthesized by exposing distilled water to the effluent gas produced by a coaxial DBD reactor [
29]. This reactor consists of two concentric stainless steel tube electrodes: an inner electrode insulated by a dielectric material (silicone), which is polarized by a high-voltage source (ALT0215, Inergiae Co., Ltd., Florianopolis, Brazil), and an outer grounded electrode (
Figure 1). The reactor features a gas inlet positioned at the top and a gas outlet submerged within the sample. This configuration ensures an enhanced interaction between the effluent gas and the sample, optimizing liquid activation. For gas flow control, an air rotameter (FLDA3215ST, Omega Engineering Inc., Stamford, CT, USA) was employed.
Electrical signals from the DBD discharge were captured using a digital oscilloscope (DSOX1202A, Keysight Technologies, Santa Rosa, CA, USA). A high-voltage probe (P6015A, Tektronix Inc., Beaverton, OR, USA) was connected to the inner electrode, while a 10× voltage probe (TPP0051, Tektronix Inc., Beaverton, OR, USA) was linked to the grounded electrode. To measure the discharge current, the voltage was assessed across a 10 Ω resistor positioned in series with the ground.
Optical Emission Spectroscopy (OES) was employed to assess the intensity of reactive species produced by Dielectric Barrier Discharge (DBD) in three distinct gases. The plasma’s optical emissions were accurately captured using an OceanHDX miniature spectrometer (Ocean Insight, Orlando, FL, USA), featuring a broad spectral range of 200 to 1100 nm. To effectively record the light emitted from the discharge, an optical fiber attachment was integrated into the setup.
The gas phase measurement of O3 was performed by coupling the Ozone Analyzer—High Range—UV-106H (2B Technologies, Broomfield, CO, USA) to the gas outlet of the reactor, varying all the studied gas flows and with a measurement interval between 0 and 10 min.
2.2. Water Activation Process and Samples
The experimental variables were grouped into three primary categories: volume (mL), ranging from 25 to 150 mL with increments of 25 mL; gas flow rate (L/min), with values spanning from 1 to 6 L/min; and activation time (min), covering a spectrum from 2 to 10 min in 2-min steps. Each combination of these variables constitutes a distinct experimental condition for examining PAW generation. Therefore, every defined volume was tested across the complete array of activation times and gas flow rates.
The deionized (DI) water employed as the starting material exhibited the following characteristics: pH = 7.37, ORP = 19.7 mV, conductivity = 0.024 mS/cm, and TDS = 10.95 mg/L, which were determined using a Metrohm 913 pH meter.
Reactive species produced in the PAW were identified and quantified using UV-VIS spectrophotometry on the Evolution 201 UV-VIS Spectrophotometer (Thermo Fisher Scientific Inc., Waltham, MA, USA). Deconvoluting each spectrum revealed the presence of NO
2−, NO
3−, H
2O
2, HNO
2, and O
3 [
30,
31]. Following the methodology described by Liu et al. [
32], and utilizing standard concentrations of NO
2−, NO
3−, and H
2O
2 [
32], the concentrations of Reactive Oxygen and Nitrogen Species (RONS) were determined based on the absorbance at wavelengths of 230 nm and 235 nm, as gleaned from the UV-VIS spectra for each experiment. In addition, test strips (Bartovation, New York, NY, USA) for NO
2−, NO
3−, and H
2O
2 were employed to quantify these species and validate the determined concentrations. With the concentration of NO
2− defined along with pH measurements, using Equation (1) it is possible to determine the concentration of HNO
2 in PAW [
28,
33]:
where [NO
2−] is the NO
2− concentration, pH is the pH of the PAW, and pKa (3.38) is the acidity constant of HNO
2.
2.3. Microbiological Assays—Assessment of Antimicrobial Activity of PAW
The antibacterial and antifungal efficacy of the synthesized PAW was assessed against S. aureus (ATCC 6538), E. coli (ATCC 10799), and C. albicans (SC 5314).
The microorganisms were plated on Petri dishes using Brain Heart Infusion Agar (BHI) or Saboraud Dextrose Agar, and then incubated at 37 °C for 24 h. Subsequently, standardized suspensions containing 106 cells/mL of each microbial species were prepared in a sterile saline solution (NaCl 0.9%). These suspensions were obtained using a spectrophotometer (AJX-1600, Micronal, São Paulo, SP, Brazil) adopting the following parameters: S. aureus, wavelength (λ) of 490 nm and optical density (O.D.) of 0.374; E. coli, λ = 490 nm and O.D. = 0.050; and C. albicans, λ = 530 nm and O.D. = 0.138.
The antimicrobial activity of PAW was evaluated using two distinct test groups: (a) sterilized PAW and (b) sterilized deionized water, which served as a negative control. Microbiological assays were conducted 40 min post activation. Following the activation process, PAW samples were promptly relocated to sterile containers and stored in a sealed thermal box. This step was critical to negate potential alterations induced by environmental factors, such as ambient temperature or light. It is pertinent to note that the physicochemical properties of PAW were continuously monitored for a duration of 2 h, which surpasses the 40 min interval prior to microbiological testing, thus ensuring the optimal antimicrobial performance of PAW during assays.
PAW was sterilized using a 0.22 µm filter. A 250 µL aliquot of the microbial suspension was put in contact with 1750 µL of PAW in test tubes for 10 and 30 min. Afterwards, serial dilutions of the final suspension were prepared in sterile saline solution (0.9% NaCl). An aliquot of 10 µL from each dilution was then cultured on Brain Heart Infusion (BHI) agar for S. aureus and E. coli and on Sabouraud Dextrose Agar for C. albicans.
These plates were incubated at 37 °C for 24 h and, after this period, the colonies were counted and the value of colony-forming units per milliliter (CFU/mL) was calculated. Each experiment was performed in triplicate on three different occasions (
n = 9). The reduction percentage was then calculated using Equation (3):
Results were analyzed and graphed using GraphPad Prism v8.0 software. The antimicrobial effects on S. aureus and E. coli were compared using a paired t-test. As the data for C. albicans were not normally distributed, they were compared using Mann–Whitney’s test. The significance level was set at 5%.
3. Results
3.1. Electrical Characterization of Coaxial DBD Plasma
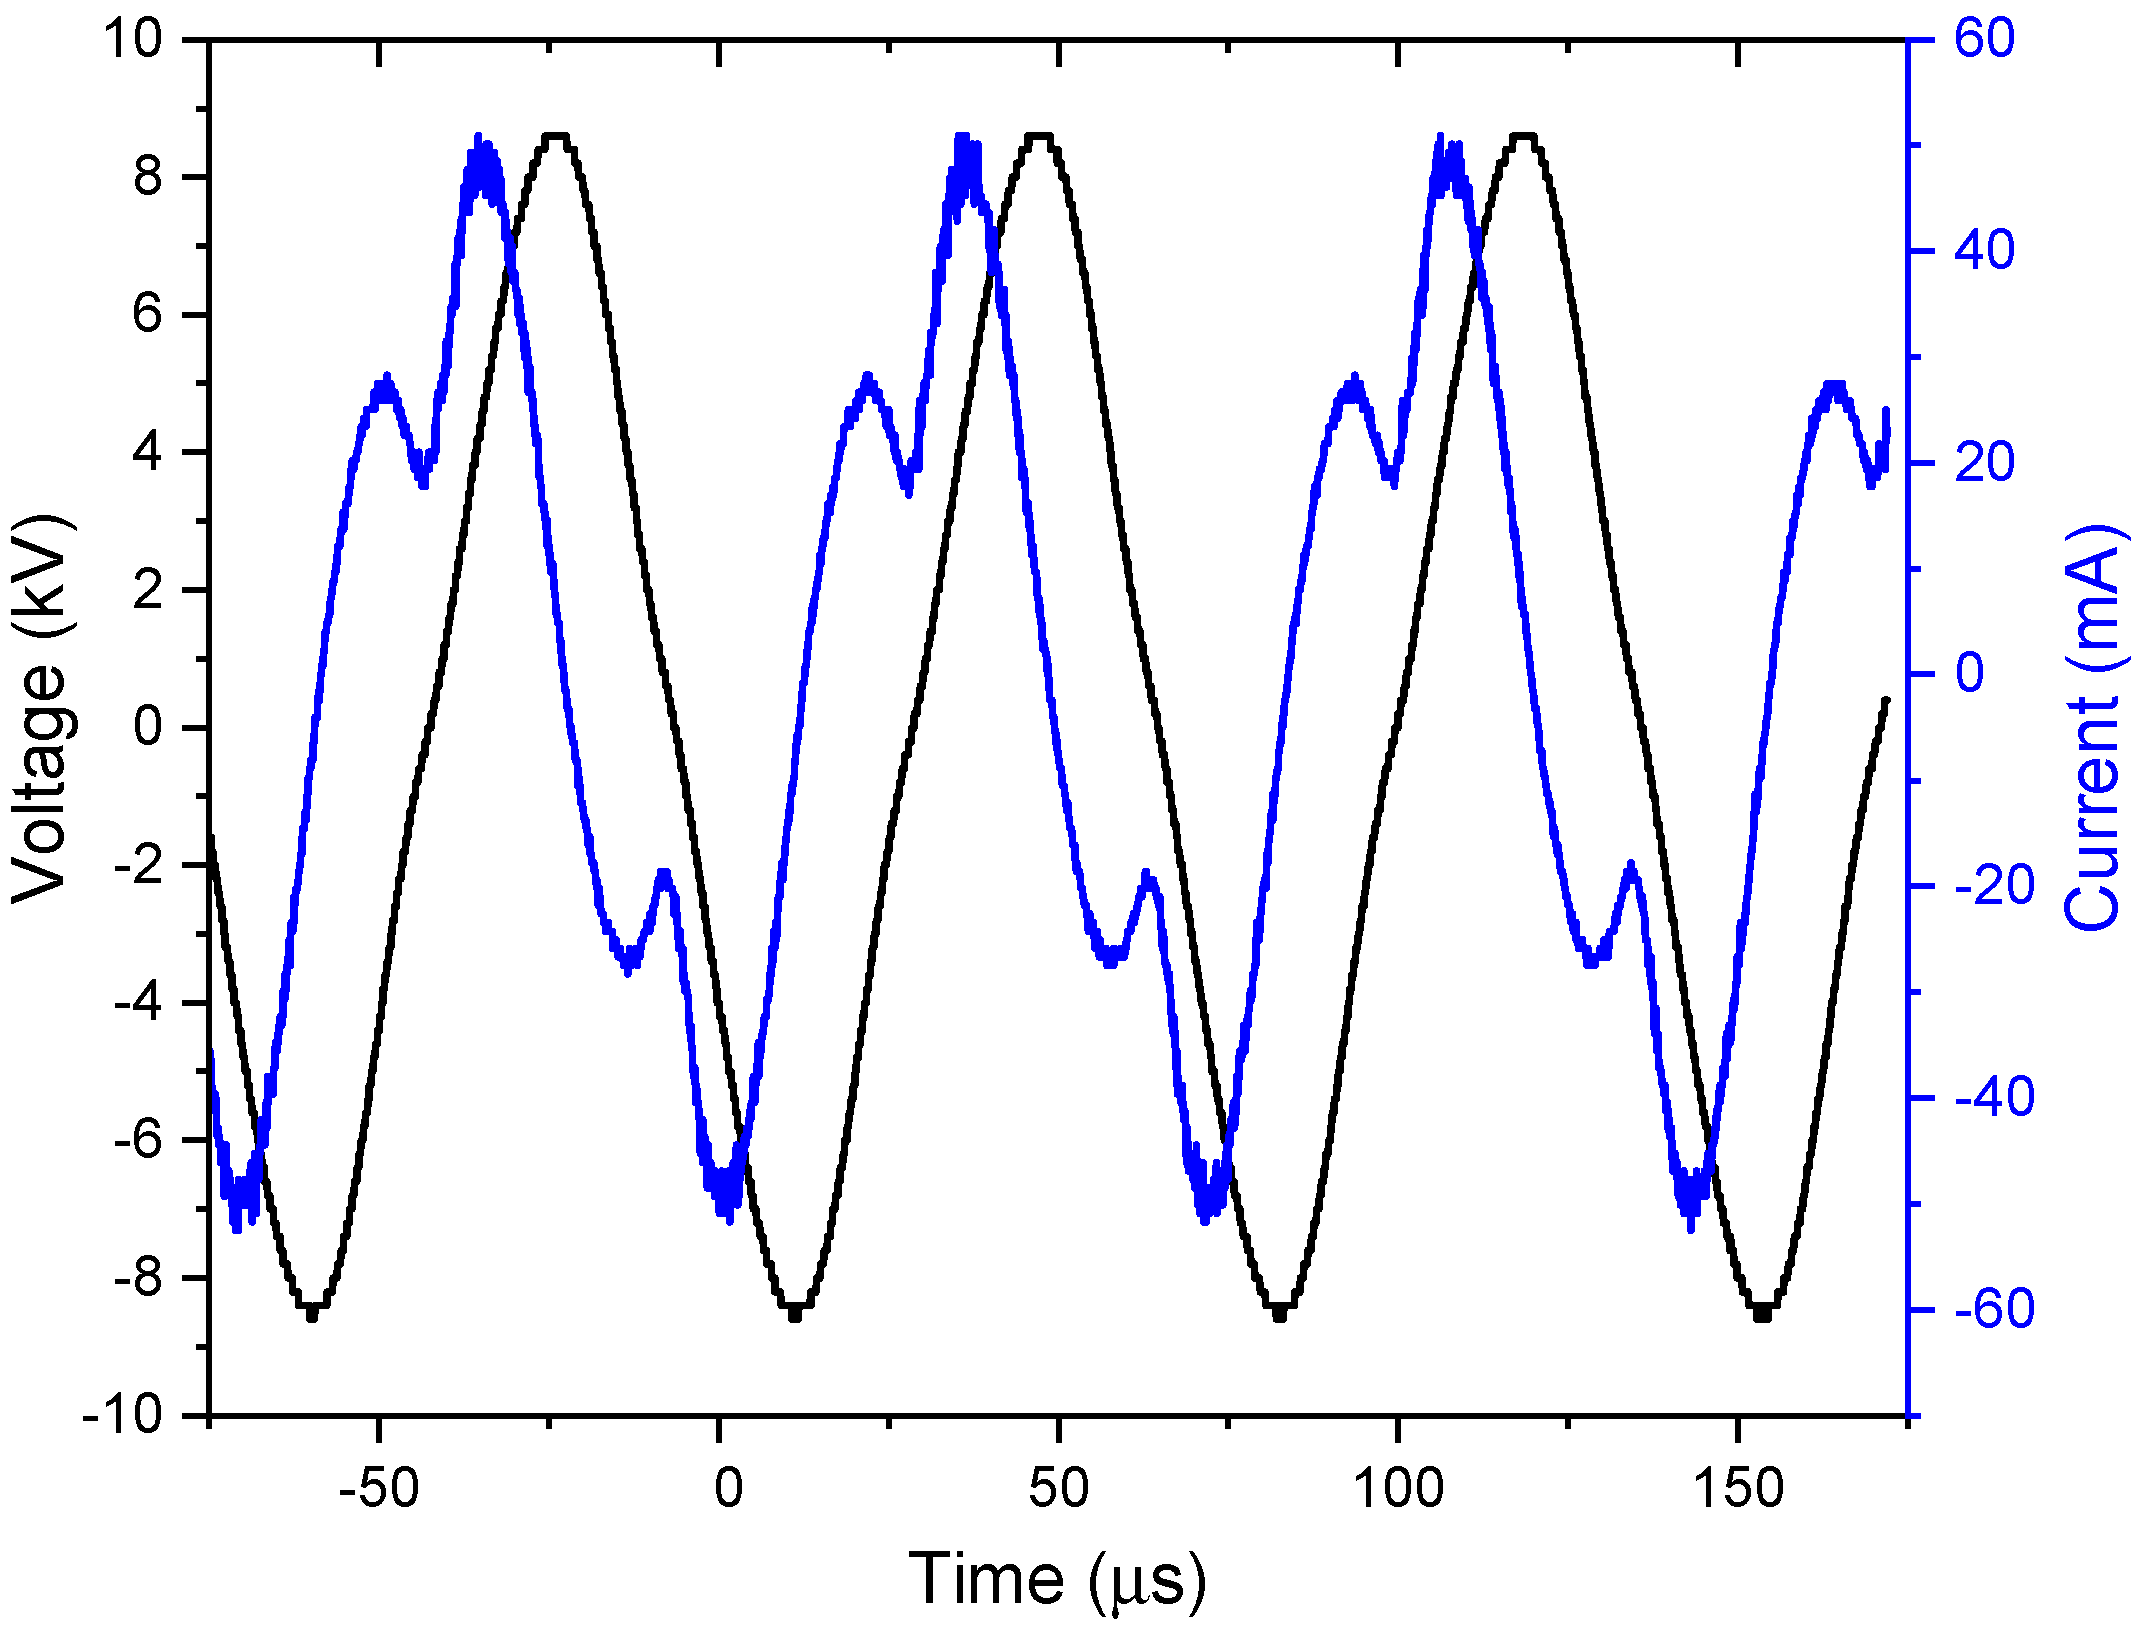
The voltage–current waveform of DBD air plasma is shown in
Figure 2. The observed peak-to-peak voltage was 17.2 kV and the peak-to-peak current was 102 mA.
The average power (
Pm) was determined using the following equation:
The value recorded for Pm was 50.7 W. It is important to emphasize that for all the gas flow rates studied in this work, the voltage–current characteristics changed only slightly, resulting in an average plasma power of approximately (50.7 ± 1.0) W.
3.2. Optical Emission Spectroscopy of the DBD
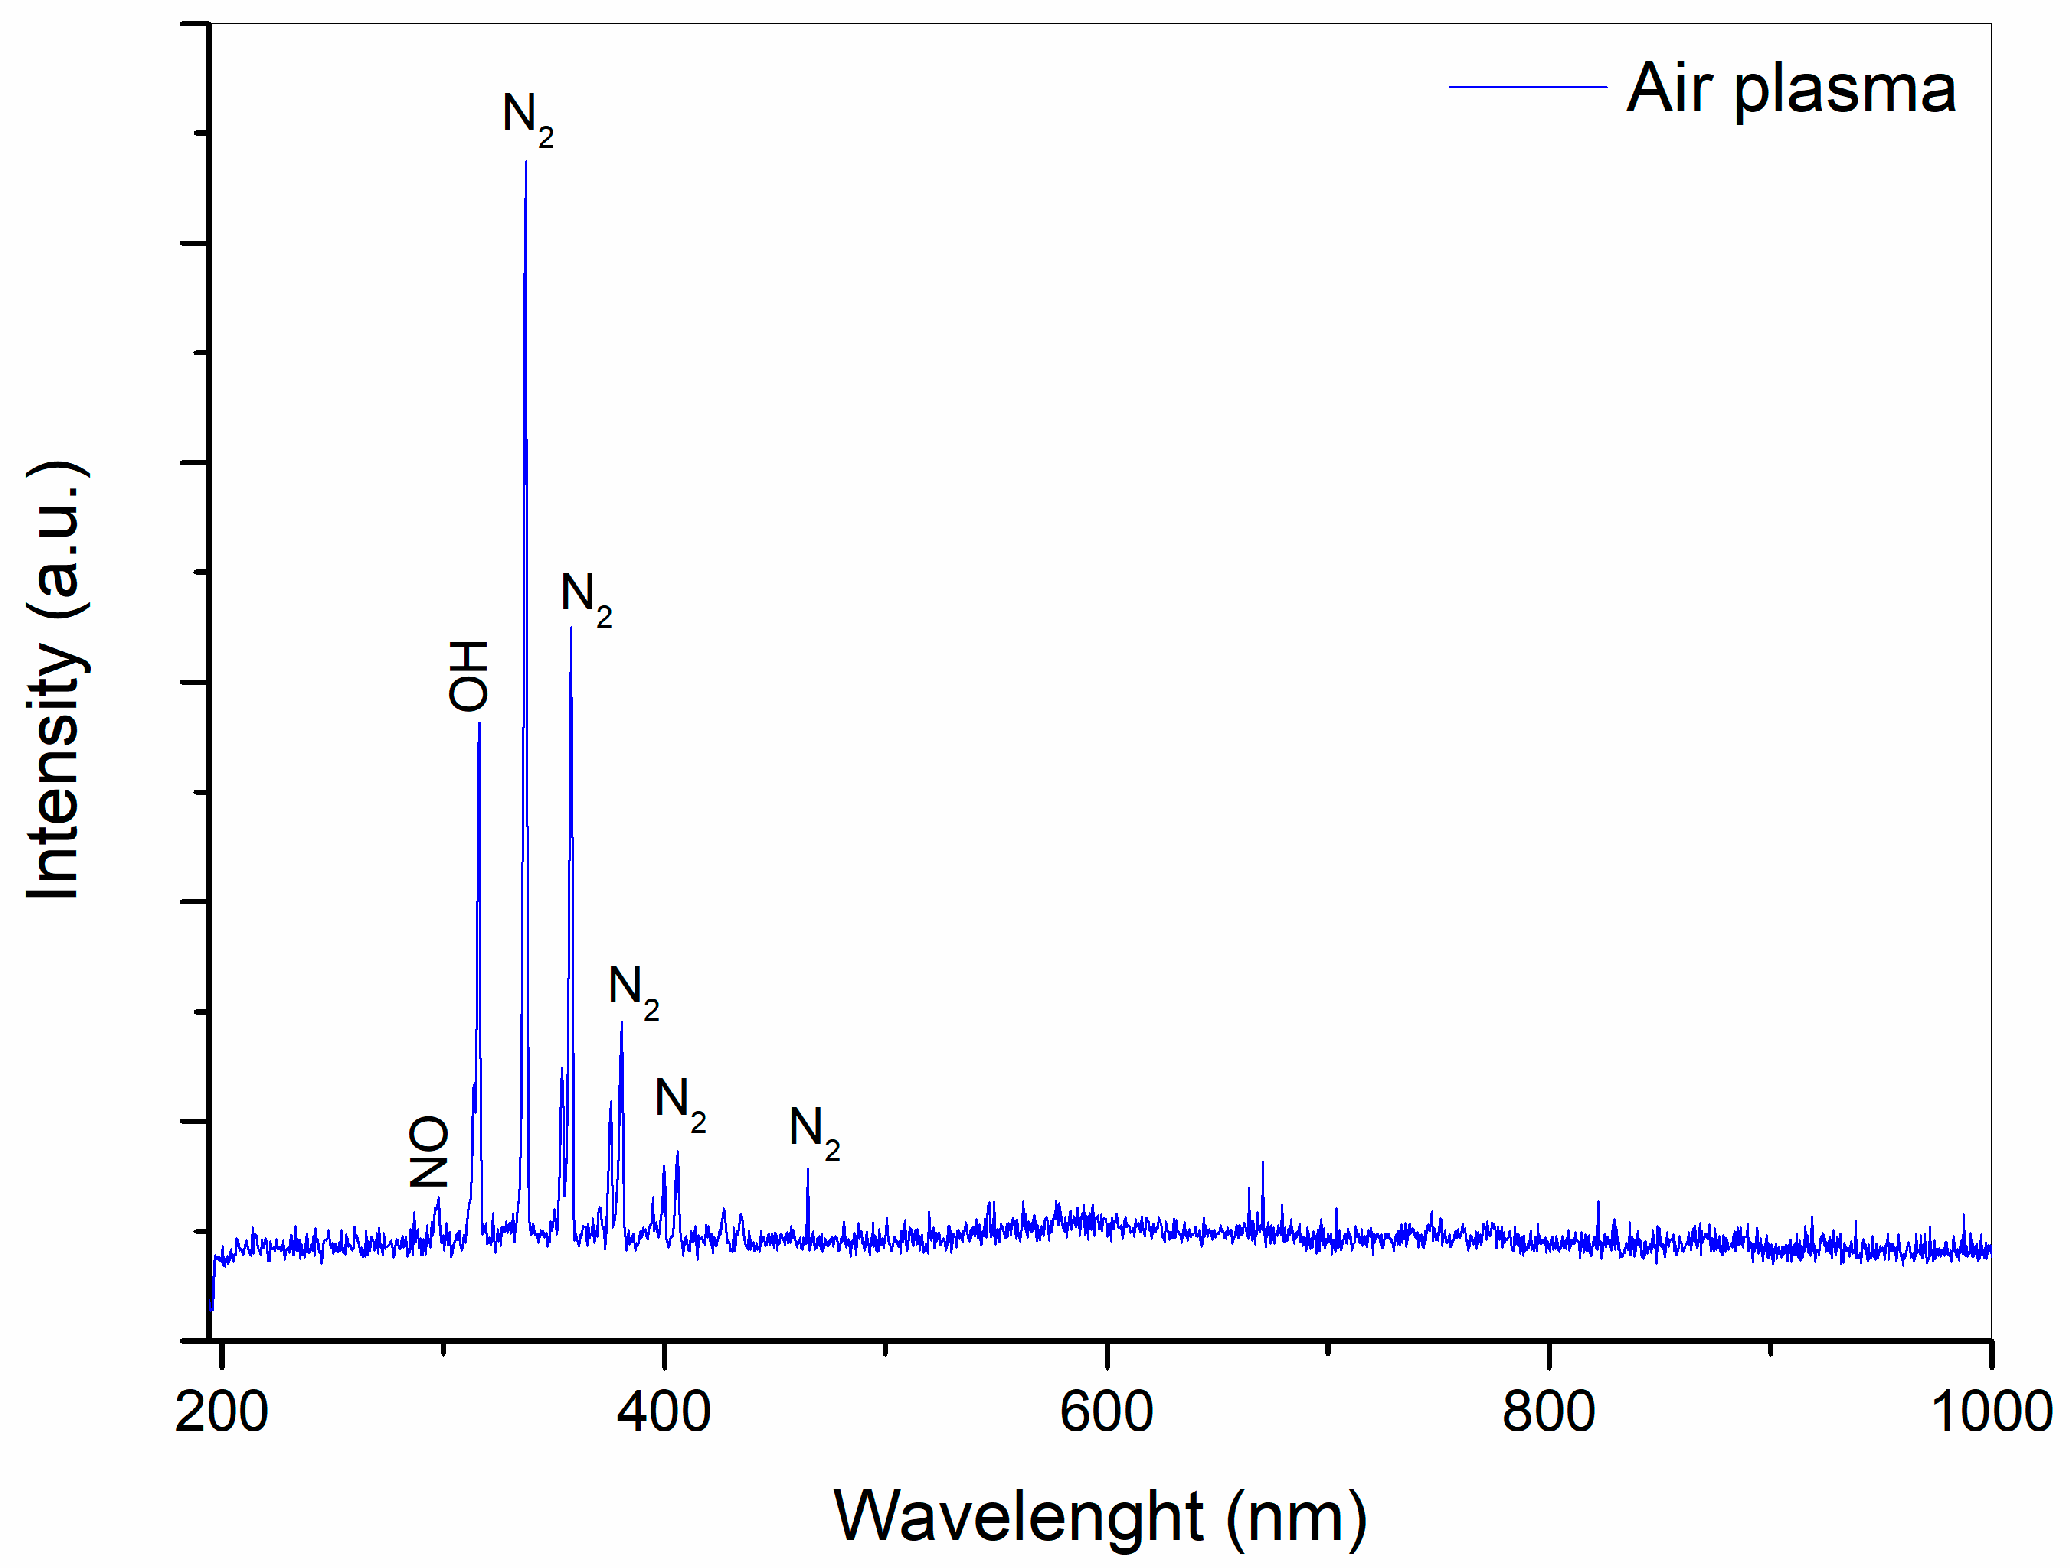
The emission spectra of DBD in air are shown in
Figure 3. A low-intensity peak at 296 nm is visible in the spectra, attributed to NO [
34]. The band at 317 nm corresponds to OH emission [
35]. Emission lines located between 330 and 406 nm are associated with the N
2 s positive transition (C3Π → B3Π) [
36]. A similar spectrum was previously recorded during air discharge by DBD plasma [
37]. The OES results indicate the presence of nitrogen, NO
x, and OH species. In a study by Zhou et al. [
35], it was demonstrated that the formation of RONS in water was primarily due to the reactivity of the plasma. Based on this analysis, it is possible that in the current study, the negative and positive ions reacting with water molecules could result in changes to the physicochemical properties of the water.
3.3. Coaxial DBD Reactor Mapping
To optimize the efficiency of the coaxial DBD reactor, we adjusted parameters including gas flow rate, activation time, and activated volume, aiming to understand their impact on liquid activation. By analyzing pH, ORP, conductivity, TDS, and RONS concentrations, we were able to discern the effect of these variables on the chemical properties of PAW, providing insights for potential refinements.
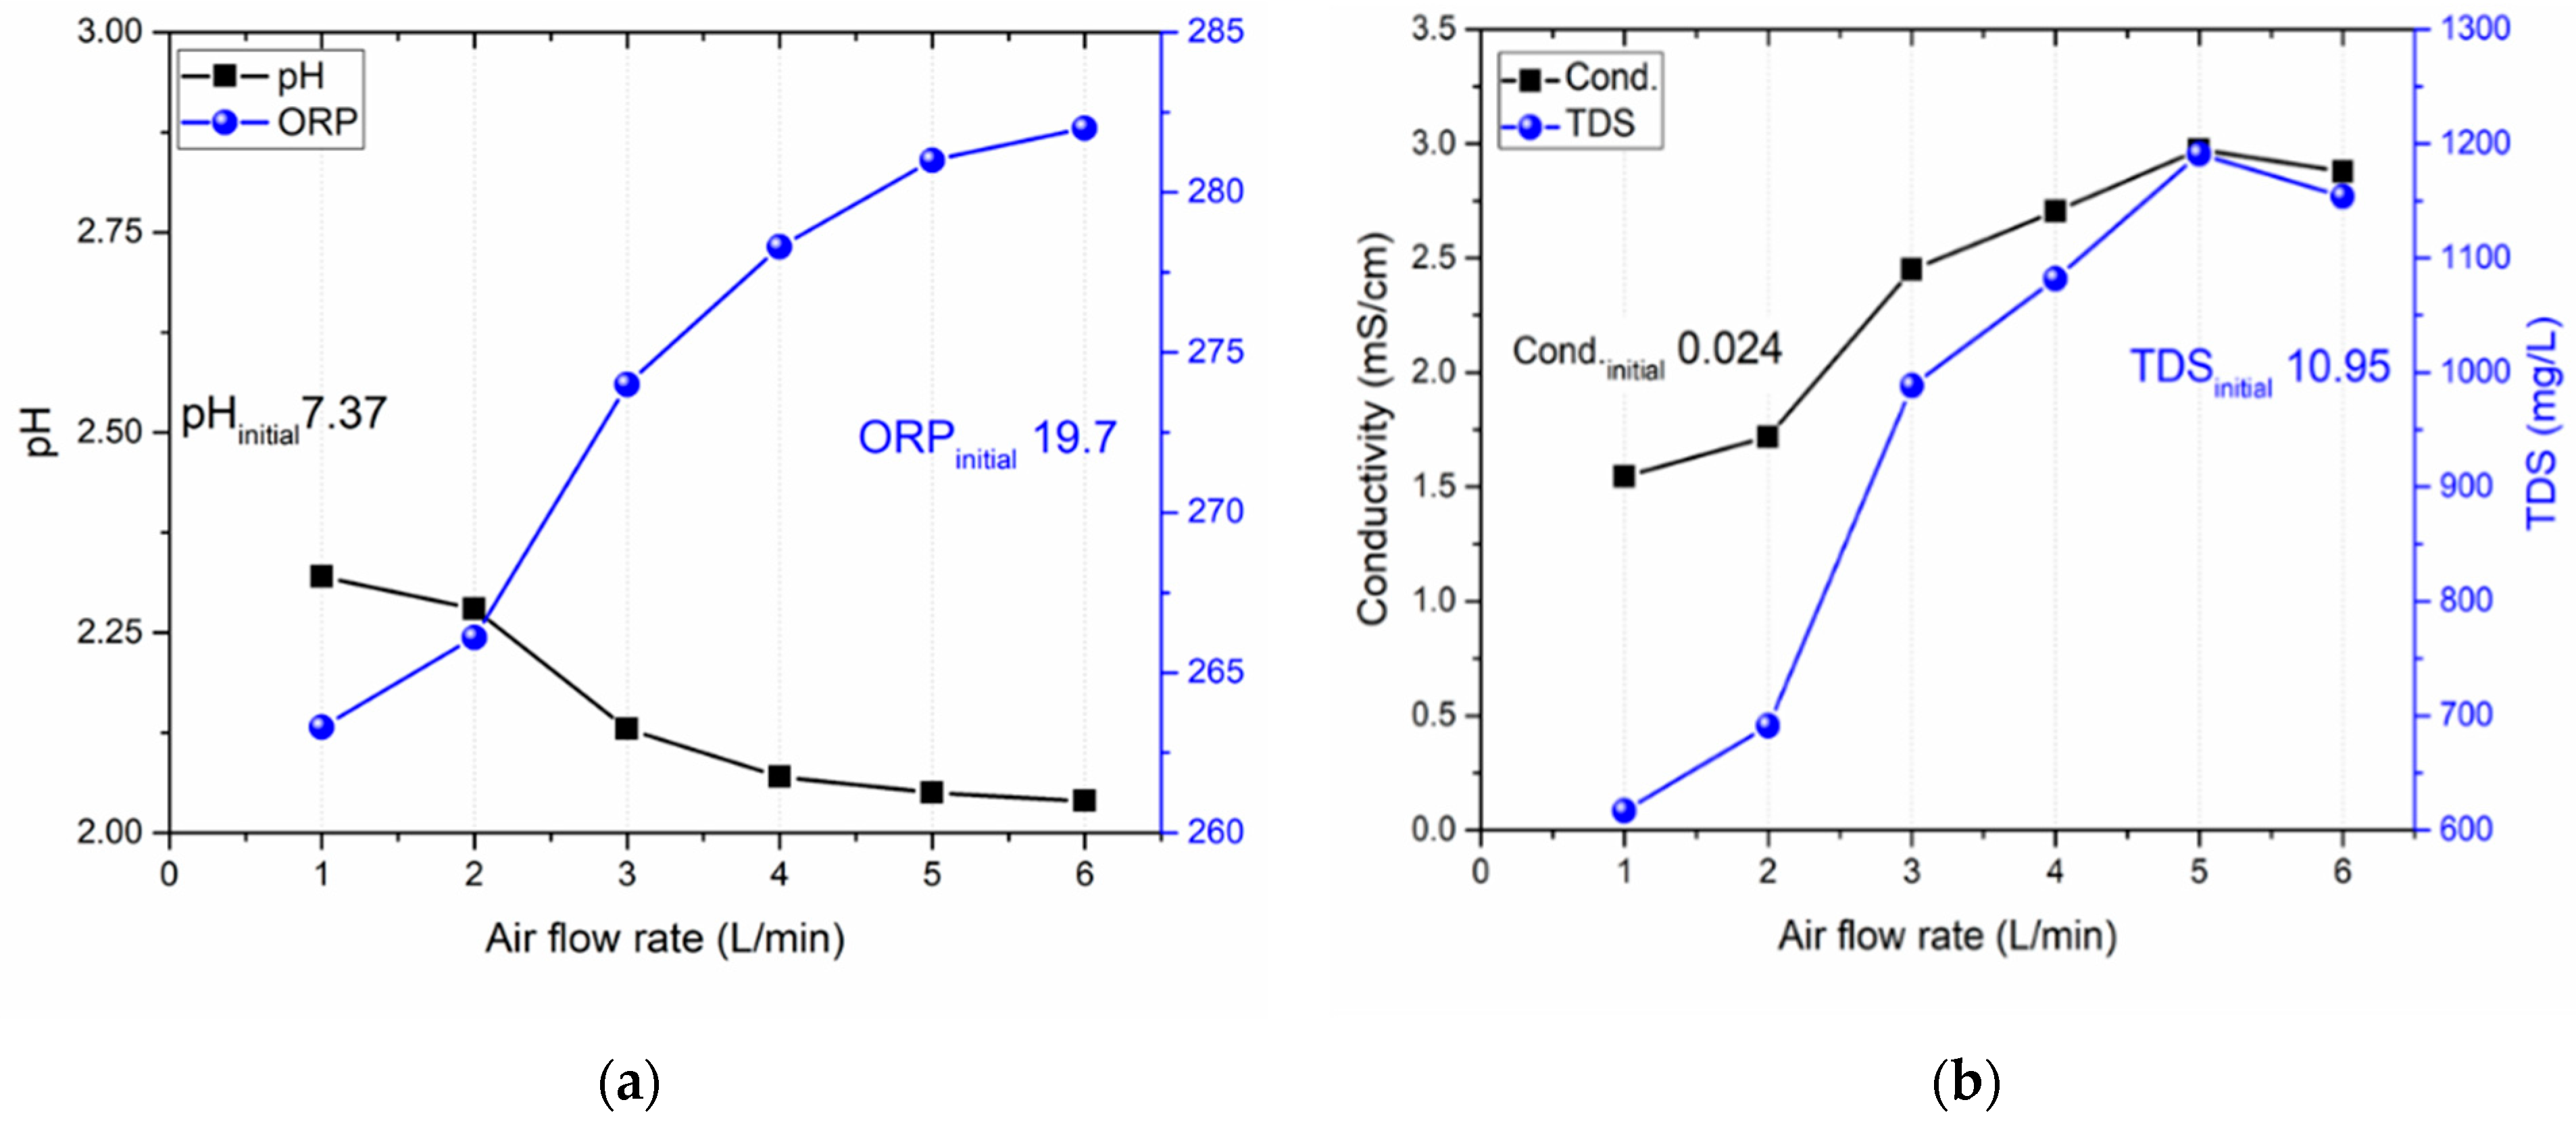
3.4. Impact of Gas Flow Rate on Activation
Initially, we examined the influence of the gas flow rate during activation, utilizing a 25 mL volume and an activation time of 10 min.
Figure 4a displays the observed pH and ORP values, whereas
Figure 4b illustrates the conductivity and TDS measurements.
The appropriate selection of gas flow rate is essential for the efficient production of RONS in the DBD plasma. These species interact with water, resulting in its acidification. A flow rate that is too low may not produce sufficient reactive species, potentially compromising the efficiency of the plasma process [
10,
16,
38]. Data from a test at the lowest gas flow rate of 1 L/min indicate a pH of approximately 2.3, accompanied by reduced ORP (262 mV), conductivity (1.5 mS/cm), and TDS (600 mg/L) values. With an increase in gas flow rate, pH values were observed to decrease, stabilizing around 5 L/min. In parallel, conductivity and TDS values also appeared to stabilize at this rate.
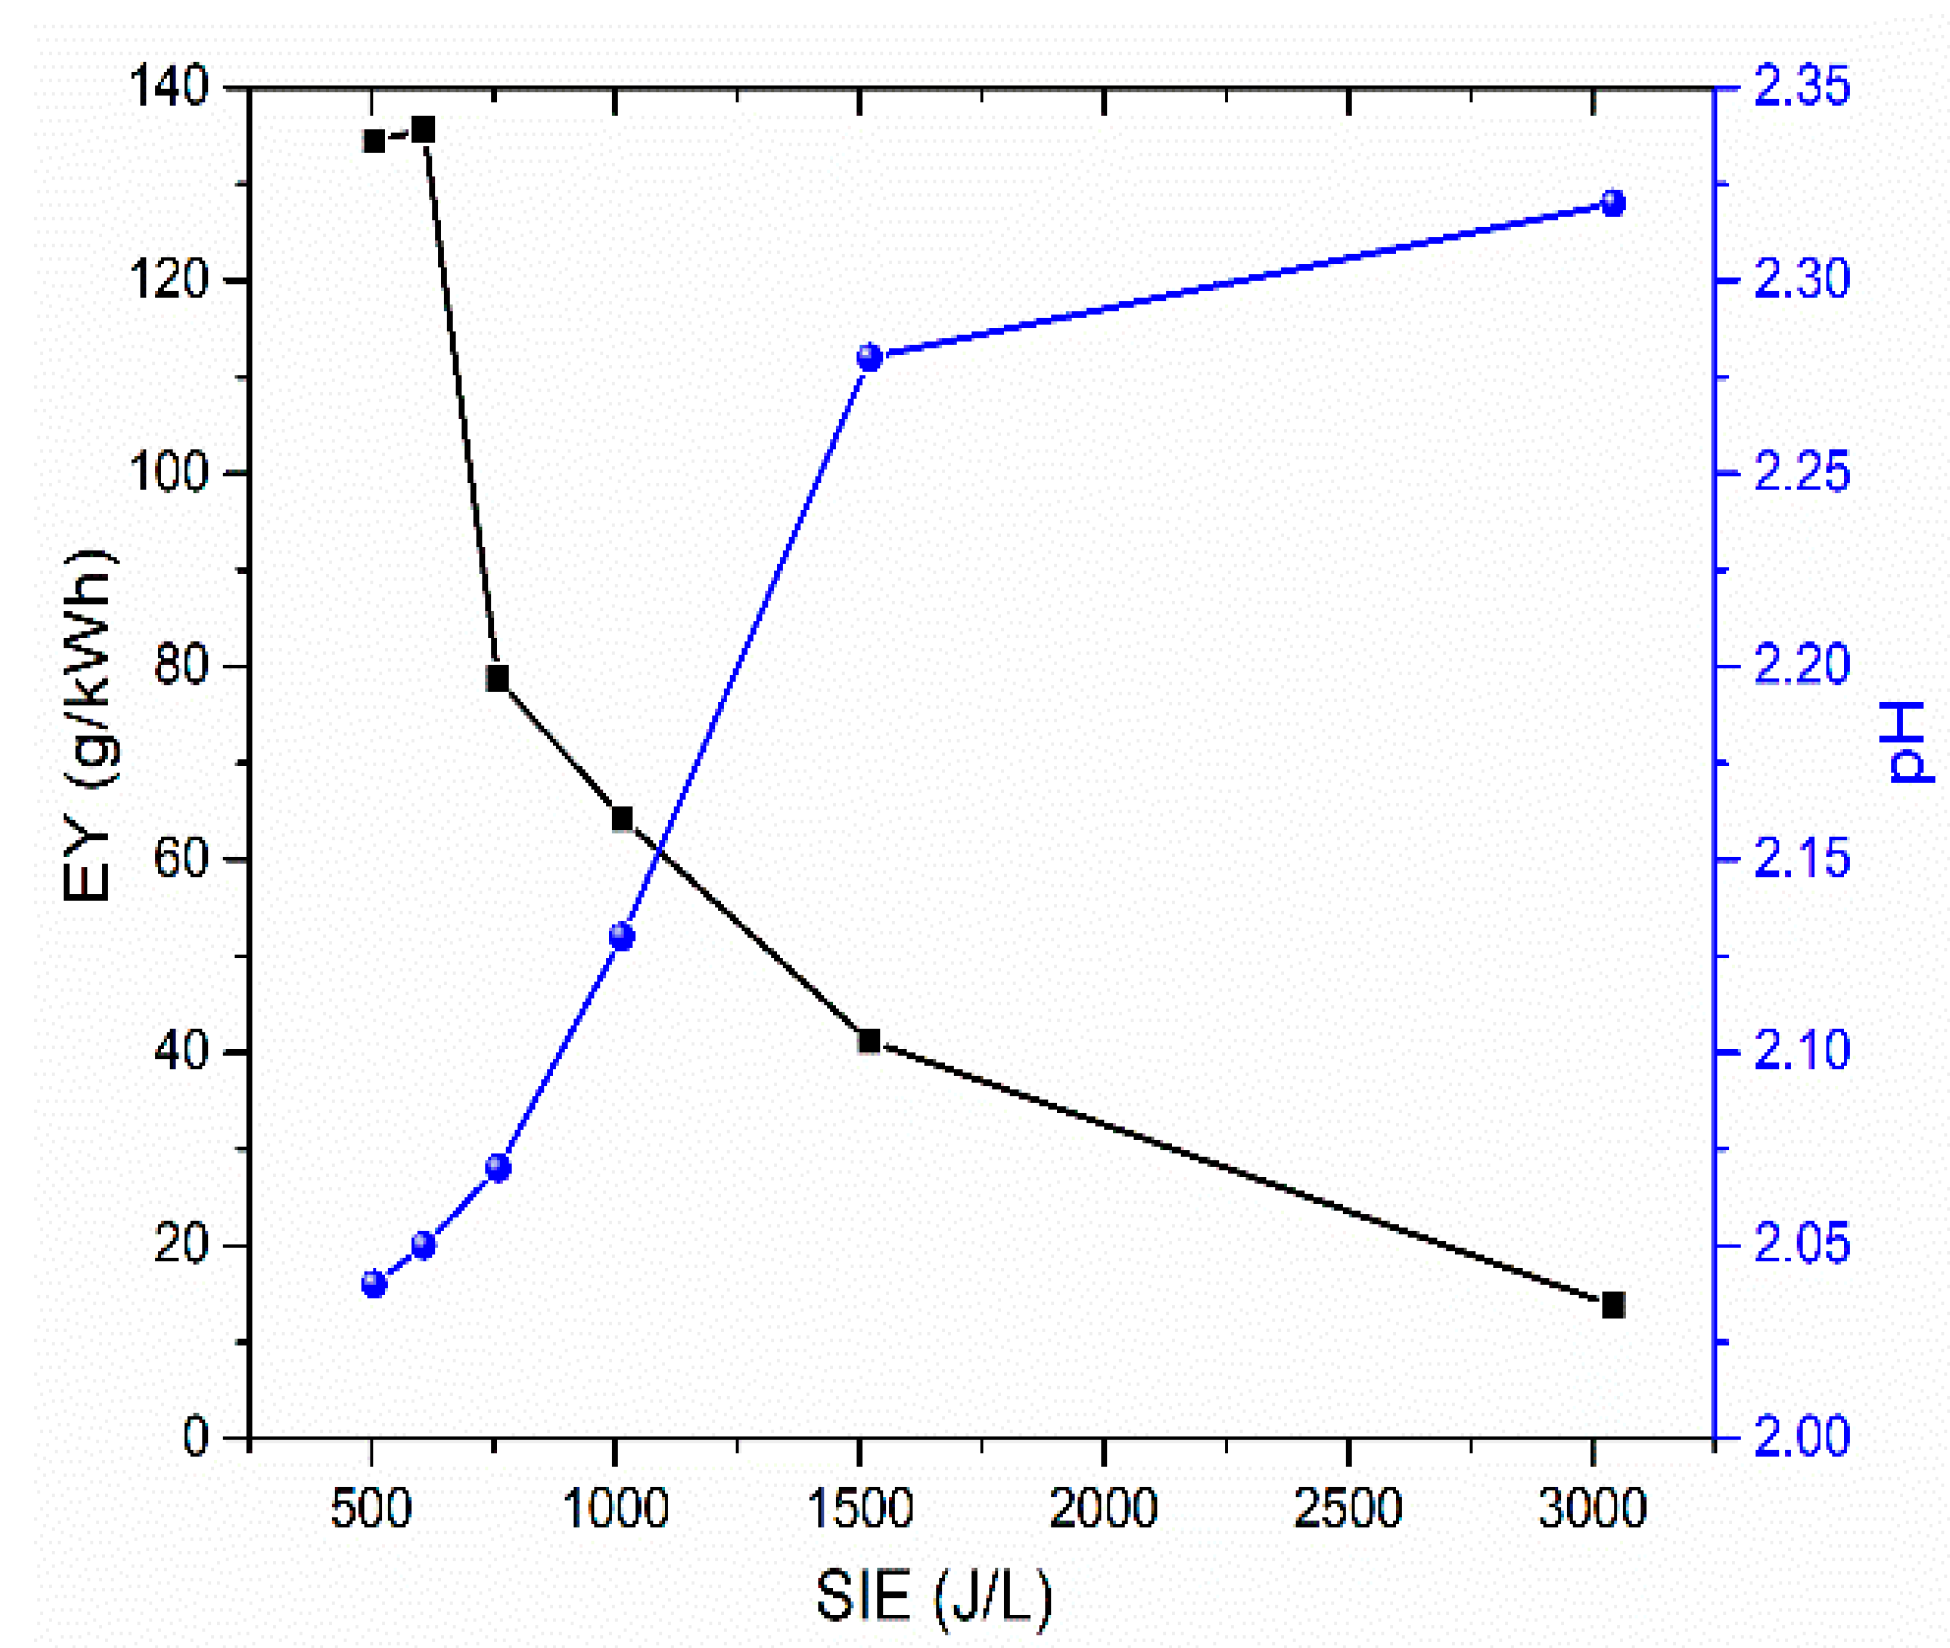
In DBD plasma studies, the specific input energy (SIE) is commonly used to evaluate the power-to-gas-flow-rate ratio [
39]. DBD systems are known for their effectiveness in ozone production and, when operated with atmospheric air flow, for generating NO
x species [
40]. The efficiency yield (EY) serves as a parameter to measure ozone generation efficiency. It is defined as the ratio of the ozone concentration produced during discharges to the SIE [
40].
Figure 5 displays the EY (and pH) in relation to the SIE, using data from
Figure 3. An ozone meter (V-106 H, 2B Technologies, Broomfield, CO, USA) situated at the DBD exhaust measured the ozone concentration. The findings indicate that a superior EY is linked to a reduced SIE, suggesting a more significant air flow. Consistent with this, Yuan et al. [
40] observed that for DBD systems operated in air, the concentration of NO
2 peaks at a lower SIE value. Primary reactions involve the oxidation of NO by oxygen atoms, represented by the reaction NO + O + M → NO
2 + M and by ozone NO + O
3 → NO
2 + O
2 [
41]. However, Jogi et al. [
42] noted that when the SIE exceeds 400 J/L, a modest decrease in NO
2 concentration is evident. This reduction is attributed to the reaction NO
2 + O → NO + O
2, which becomes more prevalent at higher SIEs, thereby limiting the accumulation of NO
2 [
42]. Understanding that water acidification through plasma-derived species predominantly engages reactive nitrogen species, this analysis aptly supports the detected pH decrease with declining SIE (or augmented air flow).
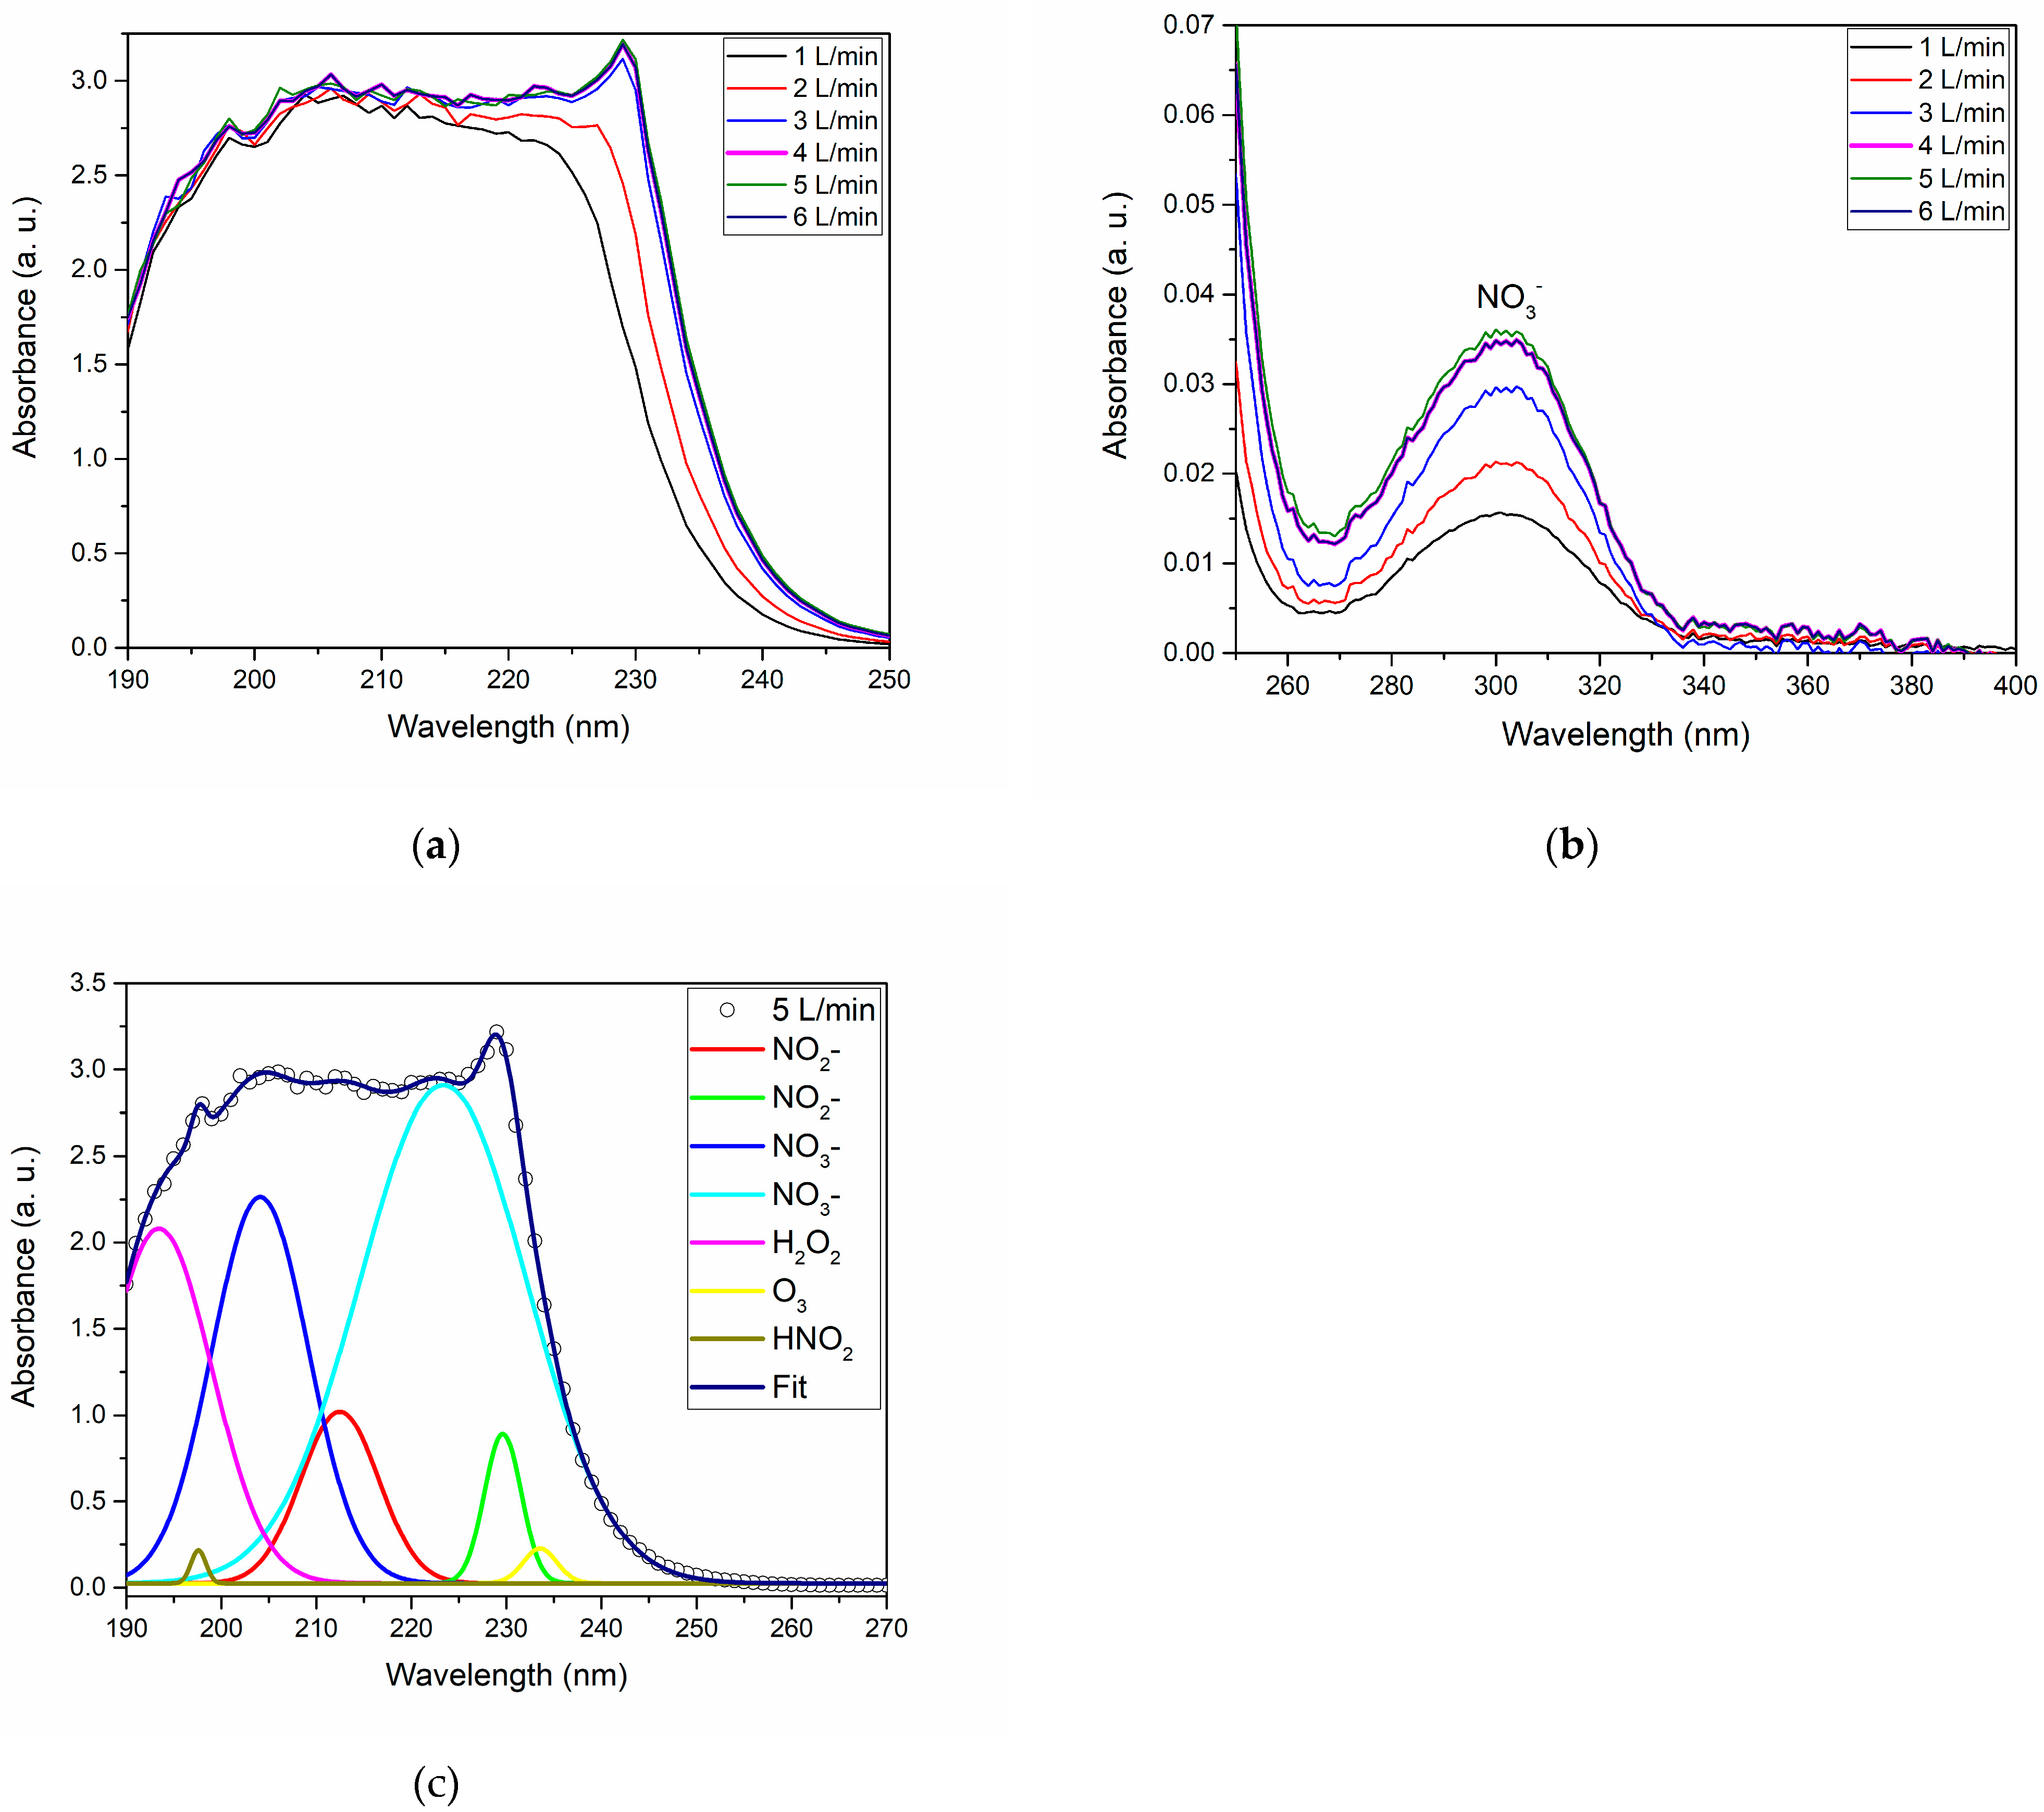
Exploration of PAW was enhanced by comparing UV-VIS analysis with air flow dynamics. Through UV-VIS spectrophotometry and spectral deconvolutions, the presence of key reactive species, specifically NO
2−, NO
3−, H
2O
2, O
3, and HNO
2, was identified.
Figure 6 presents a comprehensive visualization of these findings.
Figure 6a,b showcase the deep and near-UV absorption spectra of PAW, highlighting the pronounced impact of varying gas flow rates. The identification of reactive species such NO
2−, NO
3−, H
2O
2, O
3, and HNO
2 was achieved through the deconvolution of the deep UV absorption spectra, depicted in
Figure 6c. These species arise from diverse reaction pathways, including both transient and persistent reactive species generated in the plasma phase [
10,
16]. A distinct peak around 300 nm in
Figure 6b solidifies the consistent presence of NO
3− across various gas flow rates [
43].
To determine the concentrations of NO
2−, NO
3−, and H
2O
2, UV-VIS spectrophotometry was employed. Standard curves from Z. Liu et al. [
32] provided the reference benchmarks. The alignment of band intensities from these standards with the PAW spectra, particularly at wavelengths of 230 nm and 235 nm, facilitated the precise quantification of NO
2−, NO
3−, and H
2O
2 in the PAWs. Cross-referencing these values with test strip results further reinforced the accuracy of the quantification approach.
Upon determining the NO
2− concentration, nitrous acid (HNO
2) concentration was extrapolated using Equation (1) [
28,
33]. As detailed by Tachibana et al. [
33], the balance between HNO
2 and NO
2− concentrations hinges on the solution’s pH, considering that HNO
2 has an acidity constant (pKa) of 3.38 at room temperature. Hence, the quantified concentrations of NO
2−, NO
3−, H
2O
2, and HNO
2 are tabulated in
Table 1.
A distinct trend is observed, showcasing rising concentrations of NO
2−, NO
3−, and HNO
2 with gas flow, peaking notably at 5 L/min. This trend indicates the enhanced generation of these species and illustrates the relationship between air flow and chemical dynamics. These nitrogen compounds emerge as typical byproducts in PAW systems when nitrogen or air is used as the feed gas. With an increase in gas flow, a rise in NO
2− concentration becomes evident, leading to a surge in nitrous acid under more acidic conditions. This chemical shift causes the solution to become more acidic. The spectral region between 230 and 280 nm, as highlighted in
Figure 6b, supports O
3 presence, suggesting that ozone production is most effective at a flow rate of 5 L/min.
Additionally, the presence of ozone in PAW intensifies due to its strong oxidizing properties. Interactions with water produce Reactive Oxygen Species (ROS), and reactions with nitrogen oxides yield Reactive Nitrogen Species (RNS). The growing concentrations of NO2−, NO3−, and HNO2 not only validate a significant generation of ozone but also serve as indirect indicators of the ozone yield.
Ultimately, the varying concentrations of these reactive species in PAW enhance its therapeutic and antimicrobial capabilities, triggering oxidative stress and showcasing strong antimicrobial effects across various applications [
44,
45,
46].
3.5. Impact of Operational Parameters on Reactive Species Production
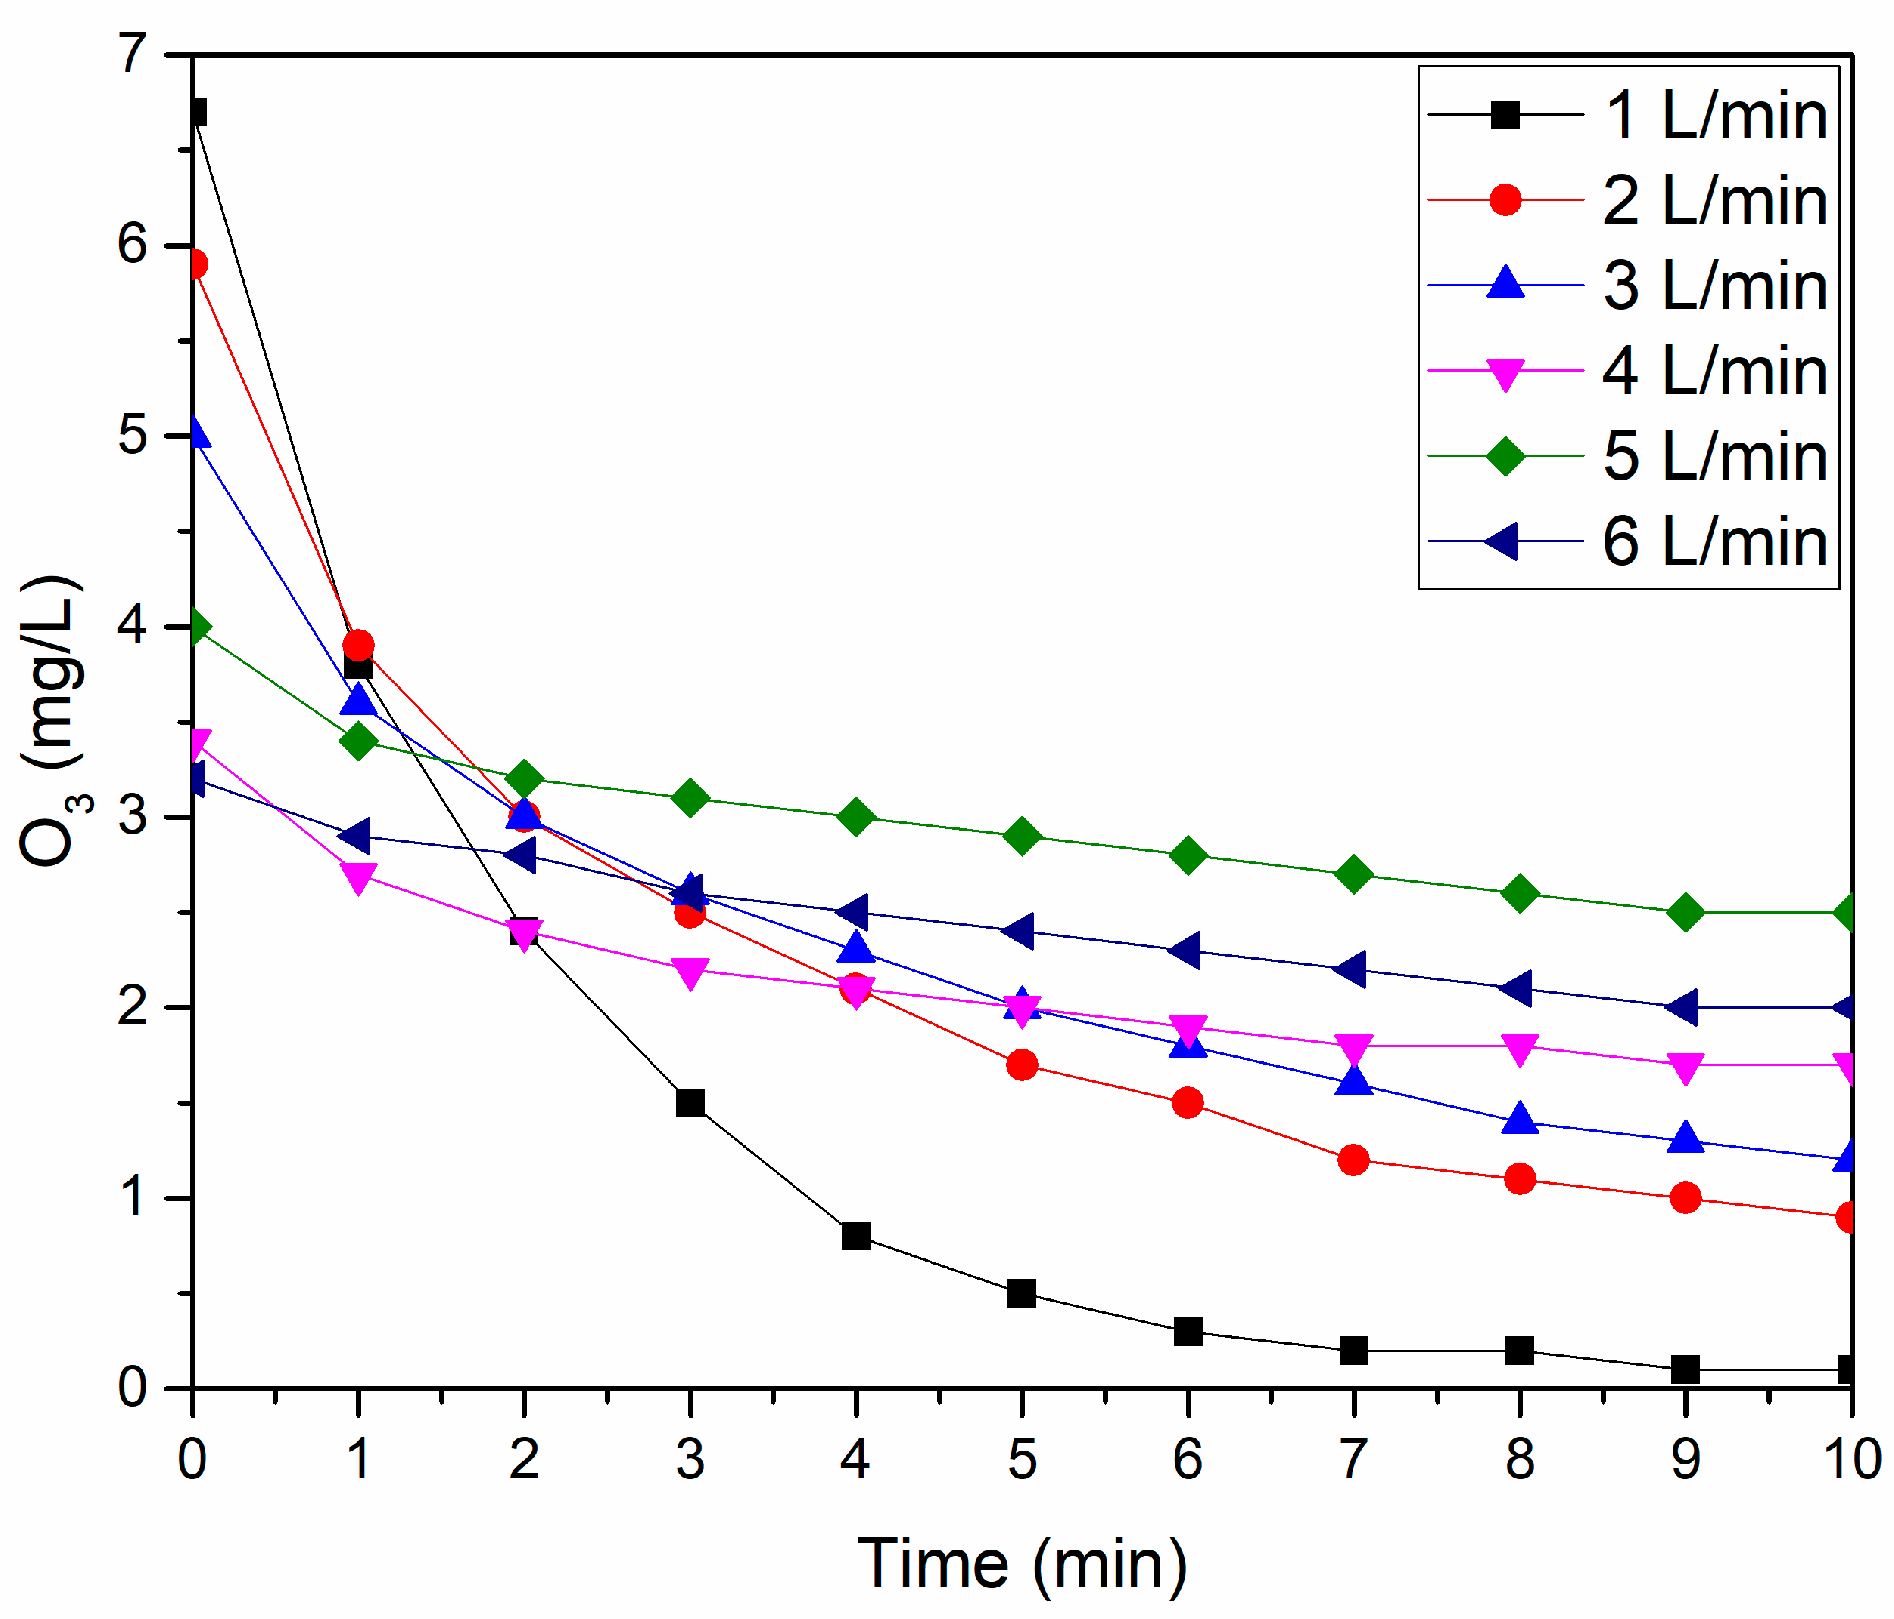
In a DBD reactor operating at a power of 50 W, a balanced production of ozone and nitrogen oxides (NO
x) was observed under varying operational conditions. This finding is substantiated by measurements of O
3 production across all investigated gas flows, as depicted in
Figure 7.
Notably, at a gas flow of 5 L/min, the system demonstrated enhanced ozone generation efficiency. This observation holds even in the context of ozone-dominated and NOx-dominated regimes in DBDs, which are influenced by the power level.
The 50 W operational power in the DBD reactor is significant. Although considered moderate, it efficiently initiates the formation reactions of both NO
x and O
3. A critical aspect to note is that as the operation time increases, there is a tendency for O
3 production to decrease [
40]. This decrease is attributed to the heating of the system and consequent warming of the gas, as shown in
Figure 7.
In DBD systems, the applied power directly impacts the types and quantities of reactive species generated [
40]. In this scenario, the energy level is adequate for producing NO
x and O
3 without disproportionately favoring the formation of one over the other.
A notable aspect of the produced PAW is its high RONS content, even at higher gas flows which imply shorter residence times. This phenomenon is primarily due to the reaction of ozone with NO, leading to NO
2 formation, as described by the reaction O
3 + NO → NO
2 + O
2. When NO
2 is dissolved in water, it further reacts to form nitrous acid (HNO
2) and nitric acid (HNO
3), through the reactions NO
2 + H
2O → HNO
2 + H
+ + OH
− and 2NO
2 + H
2O → HNO
3 + HNO
2, respectively. These acids can then dissociate in water, forming nitrite (NO
2⁻) and nitrate (NO
3⁻) ions. These reactions may explain why we did not observe lines related to O
3 in the OES analyses, as presented in
Figure 3.
The pH of the aqueous medium also plays a crucial role in these reactions. A lower pH, indicative of a more acidic medium, tends to promote the formation of HNO2 and NO2⁻. Nitrous acid is more stable and less likely to dissociate into nitrates in such acidic conditions. Conversely, at higher pH levels, the formation of HNO3 and NO3⁻ is favored, as nitric acid remains stable in less acidic environments and readily dissociates into nitrate ions. This fact also serves as a basis to justify the concentrations of RONS found in the produced PAW.
3.6. Influence of Activation Time
The temporal duration of plasma exposure, commonly referred to as the activation time, significantly influences the characteristics of PAW. By modulating this time factor, it is feasible to adjust the specific activation level of PAW. This versatility broadens its application spectrum, encompassing areas such as microbial disinfection and medicinal therapeutics [
45,
47,
48]. Taking into account that an air flow rate of 5 L/min had previously exhibited peak performance, it was retained as the baseline for this investigative phase. A consistent volume of 25 mL was used for each test.
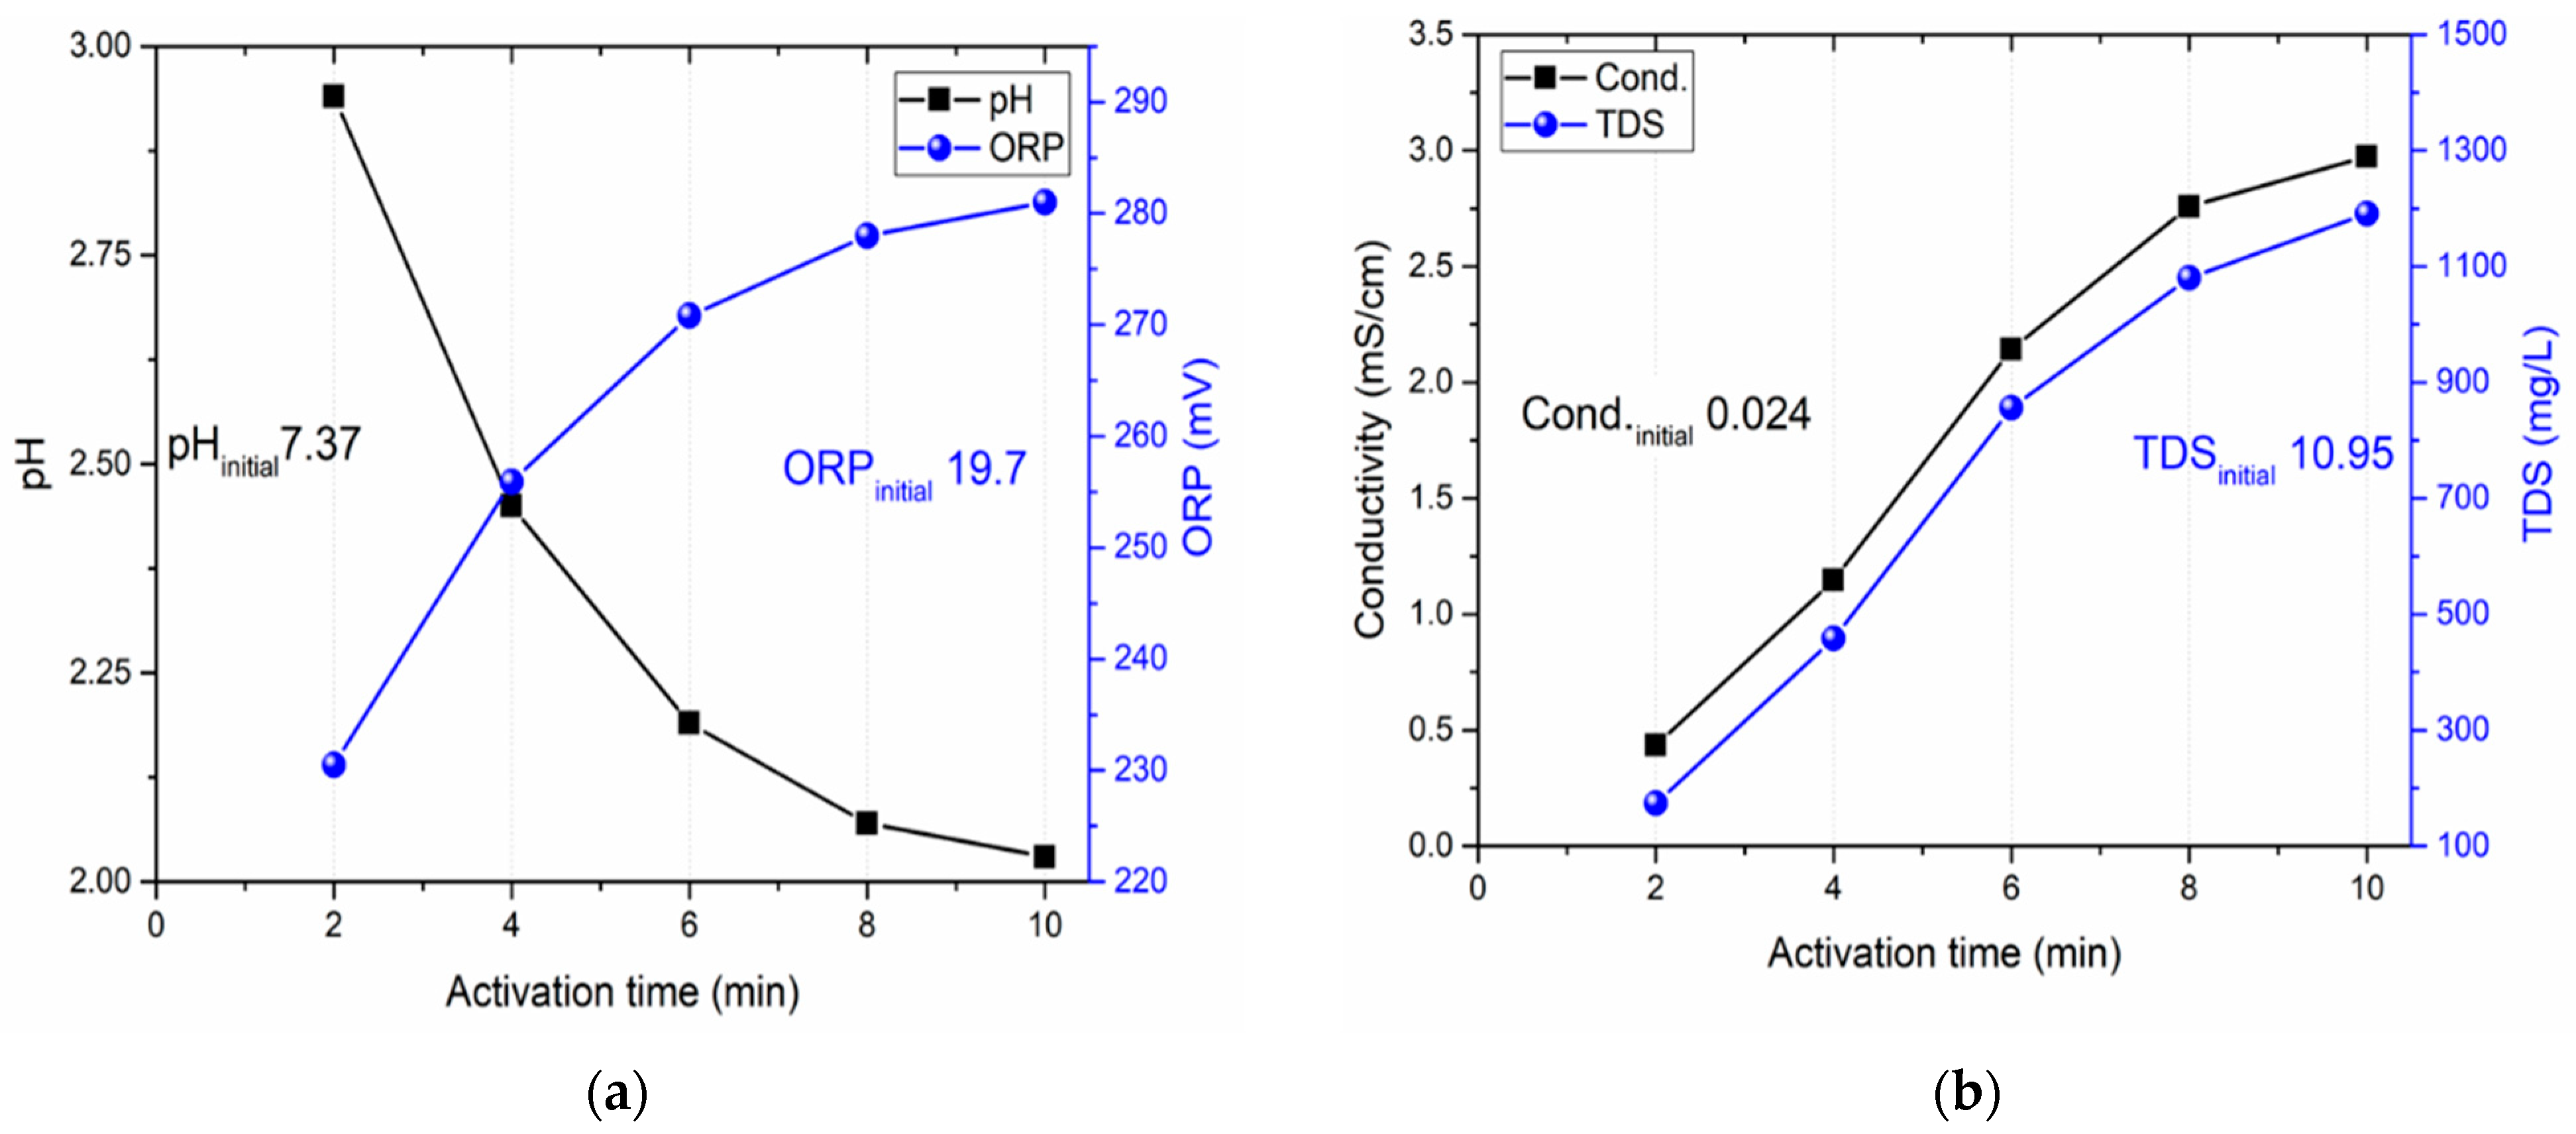
Figure 8a provides a visual representation of the pH and ORP values for PAW at varying activation times. Meanwhile,
Figure 8b displays the results for conductivity and total dissolved solids (TDS).
Analysis of the gathered data revealed that after a 2 min activation, the PAW had a pH below 3, an ORP around 230 mV, conductivity at 0.5 mS/cm, and TDS of 150 mg/L. These findings are significant; for instance, a reduced pH can enhance PAW’s antimicrobial capabilities [
44]. A heightened ORP indicates increased oxidizing potential, bolstering PAW’s effectiveness against microorganisms [
49]. This elevated ORP corresponds to a more oxidizing medium that can deactivate enzymes and damage cells, effectively combating pathogens [
48].
Moreover, the conductivity of PAW can influence its antimicrobial properties. The ions in the water can potentially affect microbial cell membrane permeability, aiding in the disinfection process [
46]. TDS, on the other hand, may further augment PAW’s antimicrobial potency; certain ions exhibit bactericidal effects, and high TDS levels can create a hostile environment for microbes, reducing their viability [
49]. Notably, a consistent set of PAW parameters was achieved after 8 min of activation, with pH, ORP, conductivity, and TDS values stabilizing at 2.12, 276 mV, 3 mS/cm, and 1200 mg/L, respectively.
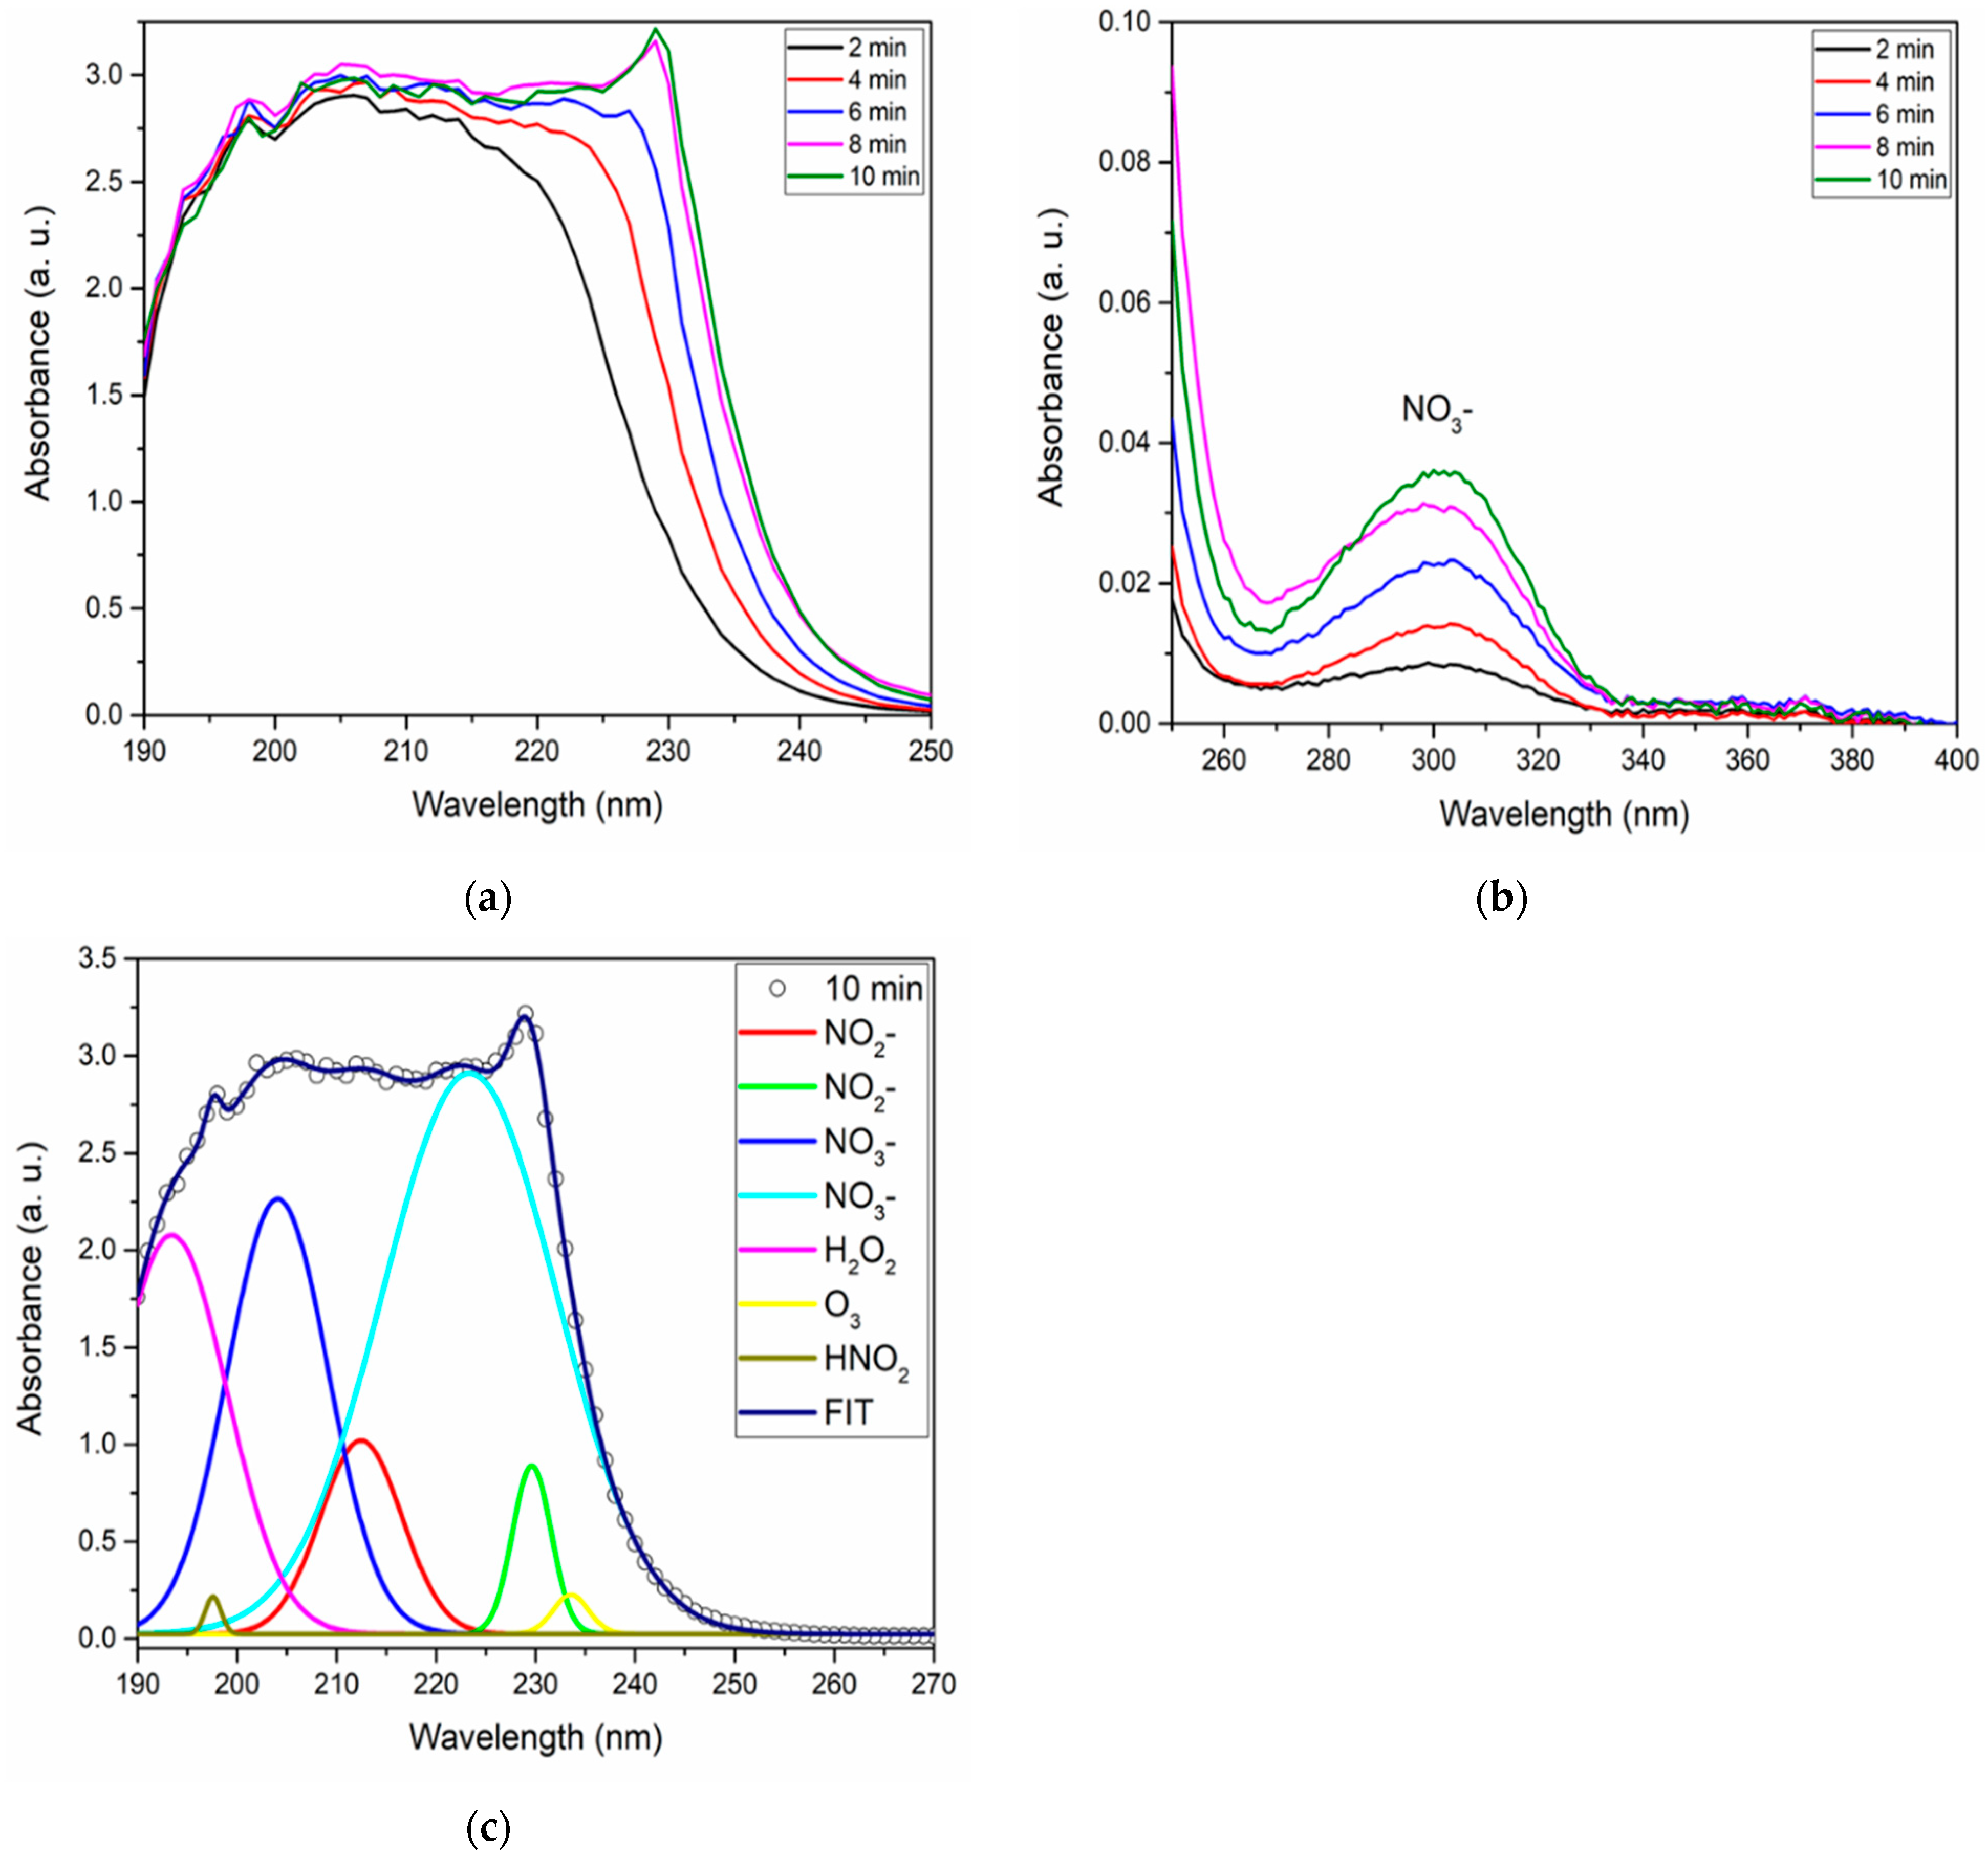
It is worth emphasizing that these attributes arise due to the presence of Reactive Oxygen and Nitrogen Species (RONS) in PAW. To verify their presence, techniques like UV-VIS spectrophotometry, deconvolution, and various test strips for NO
2−, NO
3−, and H
2O
2 were employed. The outcomes are illustrated in
Figure 9.
The absorption spectra for different activation intervals, both in the deep and near-UV realms, are detailed in
Figure 9a,b. A notable observation in the near-UV spectrum (
Figure 9b) is the consistent presence of NO
3− [
10,
50], bearing a resemblance to the pattern observed with changes in gas flow rate. However, it manifests with heightened intensity around the 10 min activation mark.
The quantification of the species NO
2−, NO
3−, H
2O
2, and HNO
2 (
Table 2) was conducted, revealing that as the activation time increases, the concentration of NO
2−, NO
3−, H
2O
2, and HNO
2 also increases, reaching values of 5 mg/L for NO
2−, 500 mg/L for NO
3−, 3 mg/L for H
2O
2, and 106.89 for HNO
2.
Drawing a parallel to the research conducted by Laurita et al. [
10], where they evaluated the concentration of specific reactive species in multiple liquids employing air DBD plasma, our findings, particularly for deionized water post a 10 min activation, seem to be in alignment, with concentrations reaching 217 mg/L for NO
3−, 4.6 mg/L for NO
2−, and 10 mg/L for H
2O
2.
3.7. Influence DI Water Volume
The subsequent phase of this research delved into the influence of the DI water volume on the activation process.
Figure 10a illustrates the pH and ORP measurements, while
Figure 10b depicts the data related to conductivity and total dissolved solids (TDS).
The smaller volume (25 mL) of activation results in a greater decrease in the pH and an increase in the water’s Oxygen Reduction Potential (ORP). This occurs due to the concentration effect of Reactive Oxygen and Nitrogen Species (RONS) [
10]. When the volume is increased, maintaining the parameters of the same reactor, the same amount of RONS is distributed, resulting in a lower concentration of these species compared to the smaller volume. This leads to a less pronounced chemical reaction and a lower impact on the pH of the activated water, although the pH is maintained under 2.8 for all volumes. Therefore, the higher concentration of plasma species, such as Reactive Nitrogen Species (RNS) like NO
3− ions and NO
2− ions in the smaller volume (25 mL) contributes to a more significant reduction in pH, reaching the value of 2.05, and higher values of ORP reaching values of 282 mV. The effect of lower pH and higher ORP assists in the antimicrobial effect of PAW [
49].
The concentration effect also applies to conductivity and total dissolved solids (TDS) when considering a smaller volume of activated water. With a reduced volume, the concentration of dissolved ions and other solutes increases, leading to higher conductivity and TDS measurements. This concentration effect arises because the same amount of dissolved substances is present in a smaller volume, resulting in a more concentrated solution. Therefore, the smaller volume (25 mL) of activated water exhibits higher values of conductivity (2.97 mS/cm) and TDS (1191 mg/L) compared to the larger volume (150 mL), which reach the values of 0.618 mS/cm for conductivity and 247 mg/L for TDS under the same plasma activation conditions. Even so, when we observe the results, it is possible to identify a tendency toward stabilization of the parameters pH, ORP, conductivity, and TDS from the volume of 100 mL.
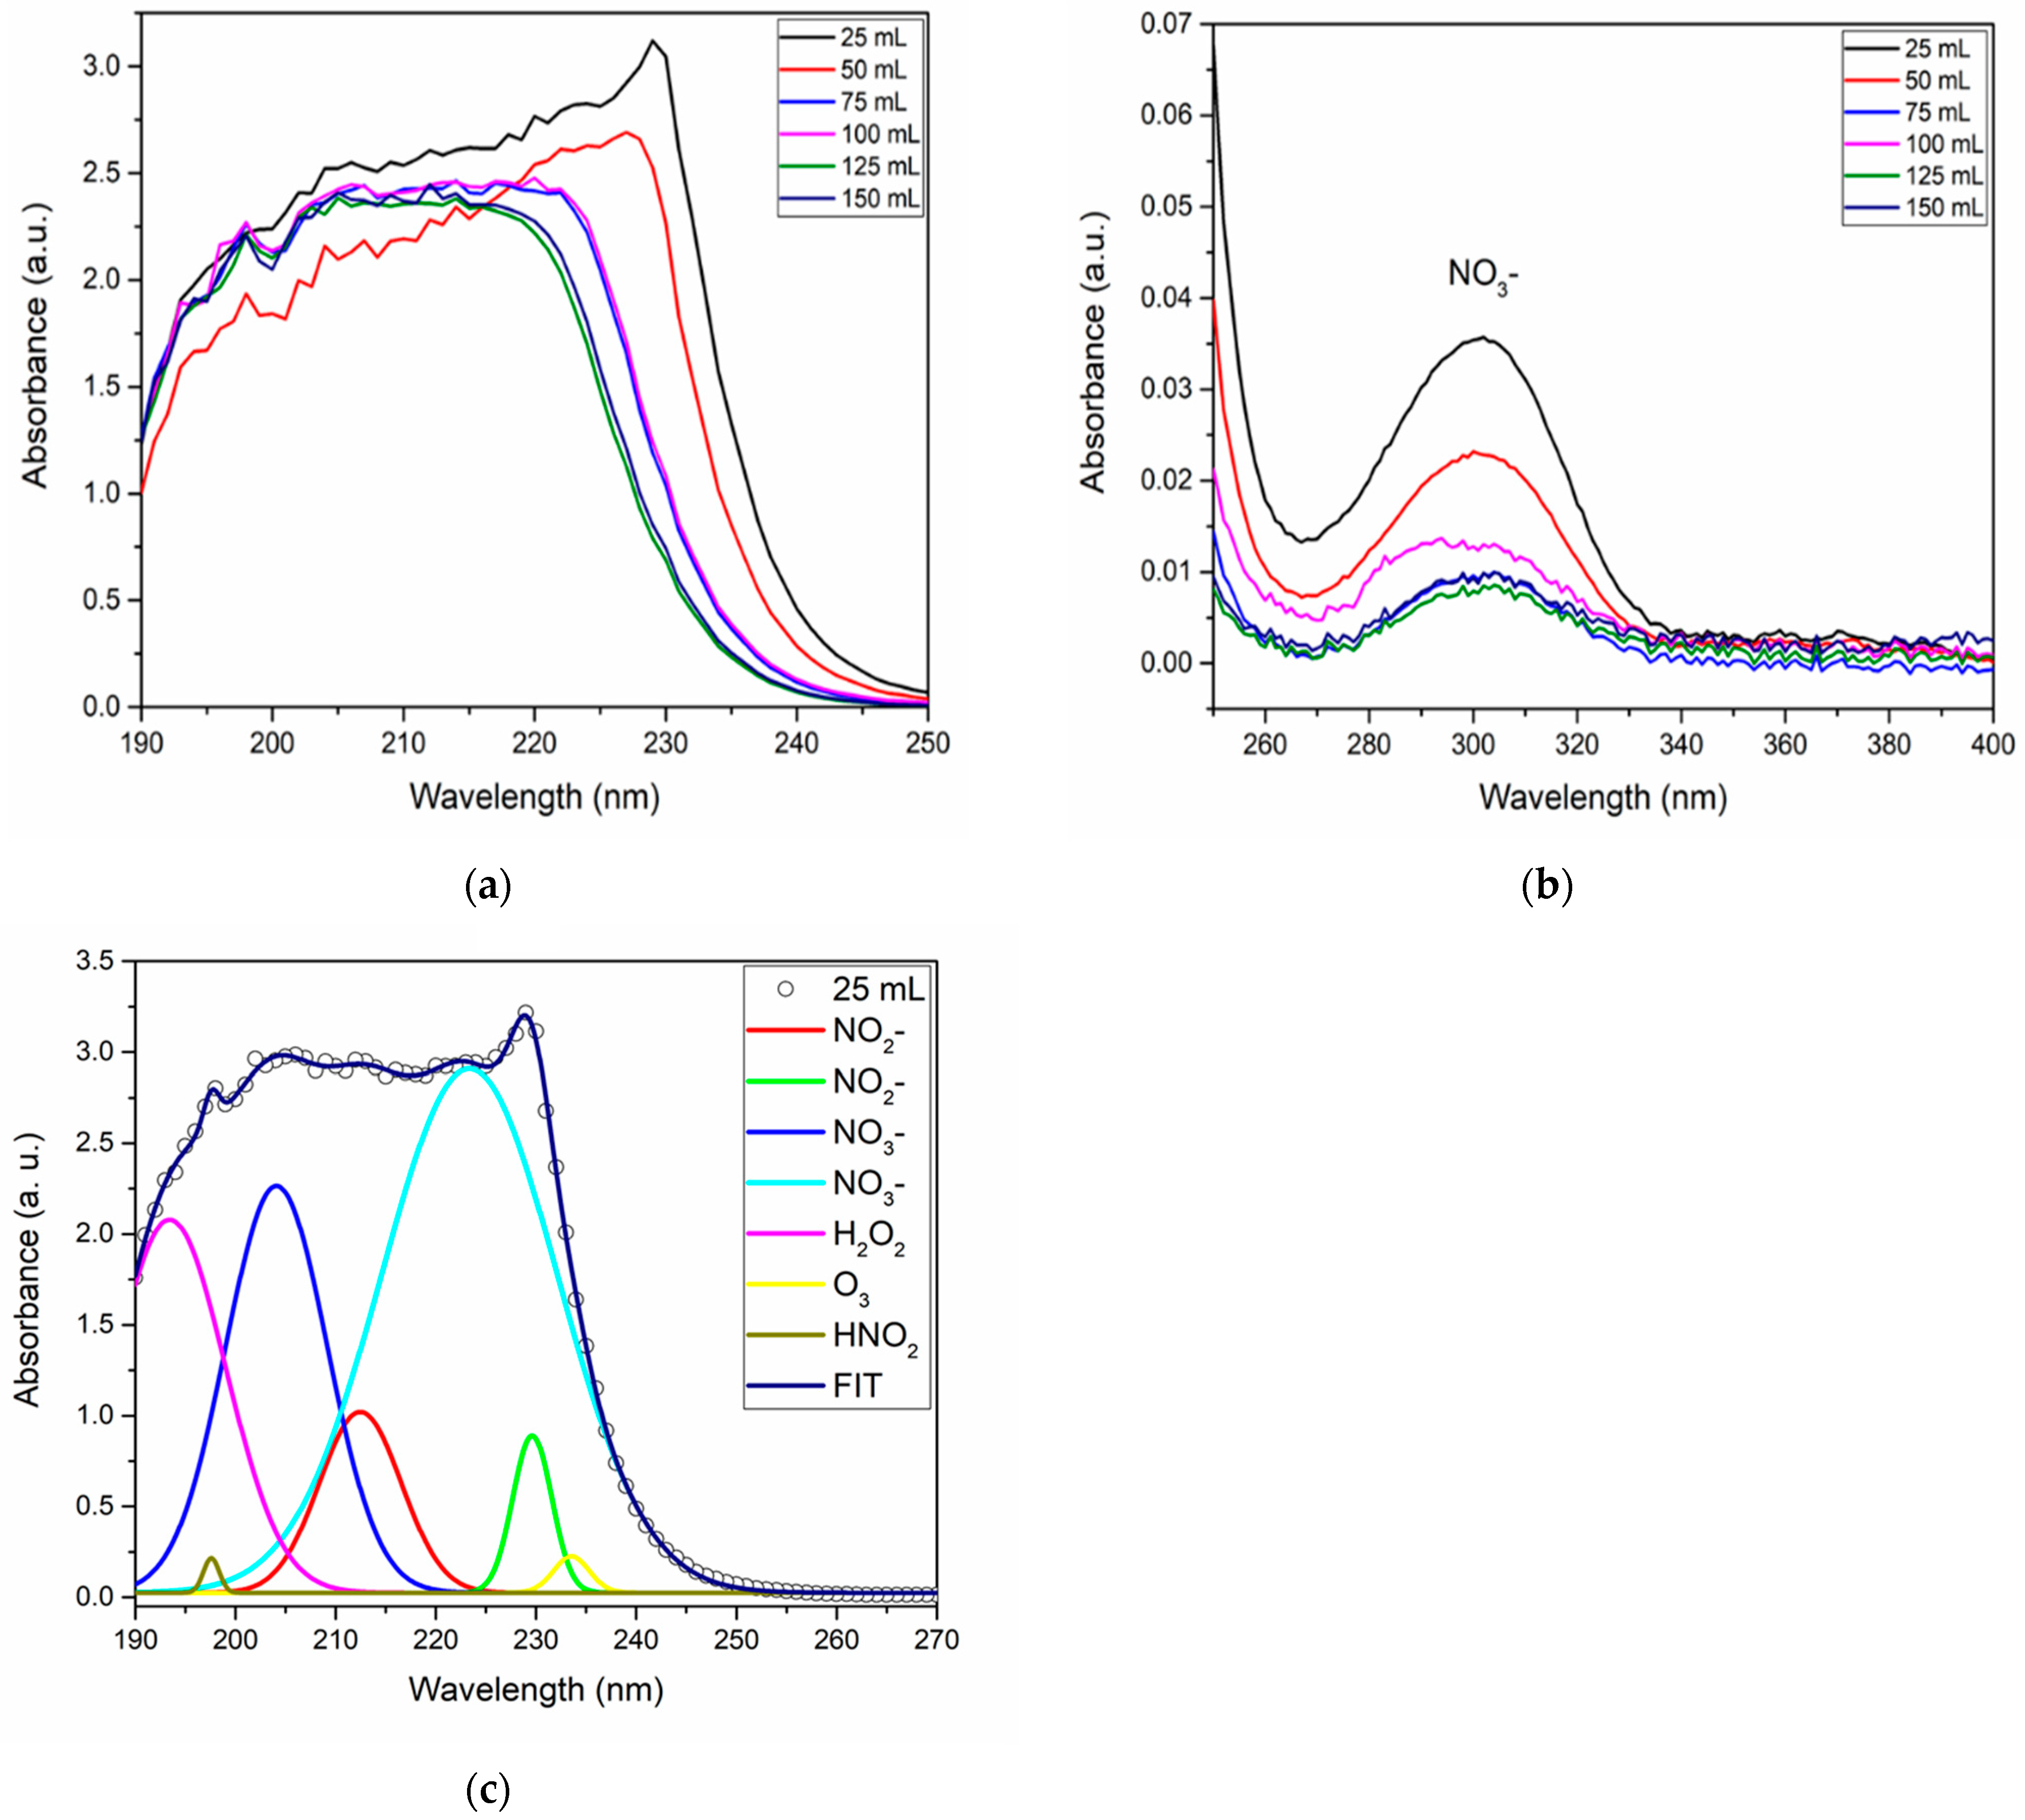
To determine the characteristics of PAW concerning the concentration of RONS present in the activated volumes, characterizations were performed using UV-VIS spectrophotometry, deconvolutions, and test strips for all samples. These results are presented in
Figure 11.
Figure 11a shows the spectra corresponding to the activation volumes studied for the deep UV absorption region. The NO
3− is maintained, as
Figure 11b shows near-UV absorption [
10,
50]. For this test, a higher intensity was observed for the PAW volume of 25 mL. The deconvolution (
Figure 11c) of deep UV spectra was performed to identify the presence of NO
2−, NO
3, H
2O
2, HNO
2, and O
3. The quantification of NO
2−, NO
3−, H
2O
2, and HNO
2 concentrations were made and are presented in
Table 3.
We can note that with the increase in activation volume, the concentration of NO2−, NO3−, and H2O2 decreased, beginning from 5 mg/L for NO2−, 500 mg/L for NO3−, and 3 mg/L for H2O2 for the volume of 25 mL and finishing at 1 mg/L for NO2−, 125 mg/L NO3−, and 0.5 mg/L for H2O2.
To compare with a previous study, Rathore et al. [
51] carried out experiments with varied activation volumes (up to 20 L), obtaining the maximum concentration values of NO
3ˉ ions, NO
2ˉ ions, H
2O
2, and dissolved O
3 after 10 h of plasma-water exposure, given as 93.5 mg/L, 7.5 mg/L, 4.7 mg/L, and 4.7 mg/L, respectively. Another study conducted by Oehmigen et al. [
52] investigated the acidification for antimicrobial activity using a surface dielectric barrier discharge.
The experiments were carried out with variations in volume (5 and 10 mL) and activation time (10 and 30 min). The lowest pH obtained was 2.7. Additionally, the effect of volume was observed, with the highest concentration of reactive species being found for the smaller volume of 5 mL, reaching 113 mg/L for NO3−, 1.5 mg/L for NO2−, and 18 mg/L of H2O2. The authors also reported that the concentration of NO2− returned to 0 after 30 min. These results prove that for small volumes, the concentration effect plays an important role in the quantities of the RONS in the PAW when the operational parameters of the system (reactor) remained the same.
3.8. Microbiological Assays
The PAW evaluated in the microbiological assays was obtained under the best conditions: a flow gas rate of 5 L/min, activating time of 10 min, and an activation volume of 25 mL. Under these conditions, the PAW reached the lowest pH (2.05) and higher ORP, TDS, and conductivity values. Also, higher concentrations of RONS were reached under these conditions.
The microorganisms selected for the study are significant causative agents of infections and have notable relevance due to their resistance to conventional treatments [
53,
54]. Moreover, they are also related to nosocomial infections.
S. aureus and
E. coli were chosen as representative strains of the major bacterial groups, Gram-positive and Gram-negative, respectively.
C. albicans, a fungal species, was included due to its opportunistic nature and the capacity to cause a range of infections, from superficial to systemic [
55].
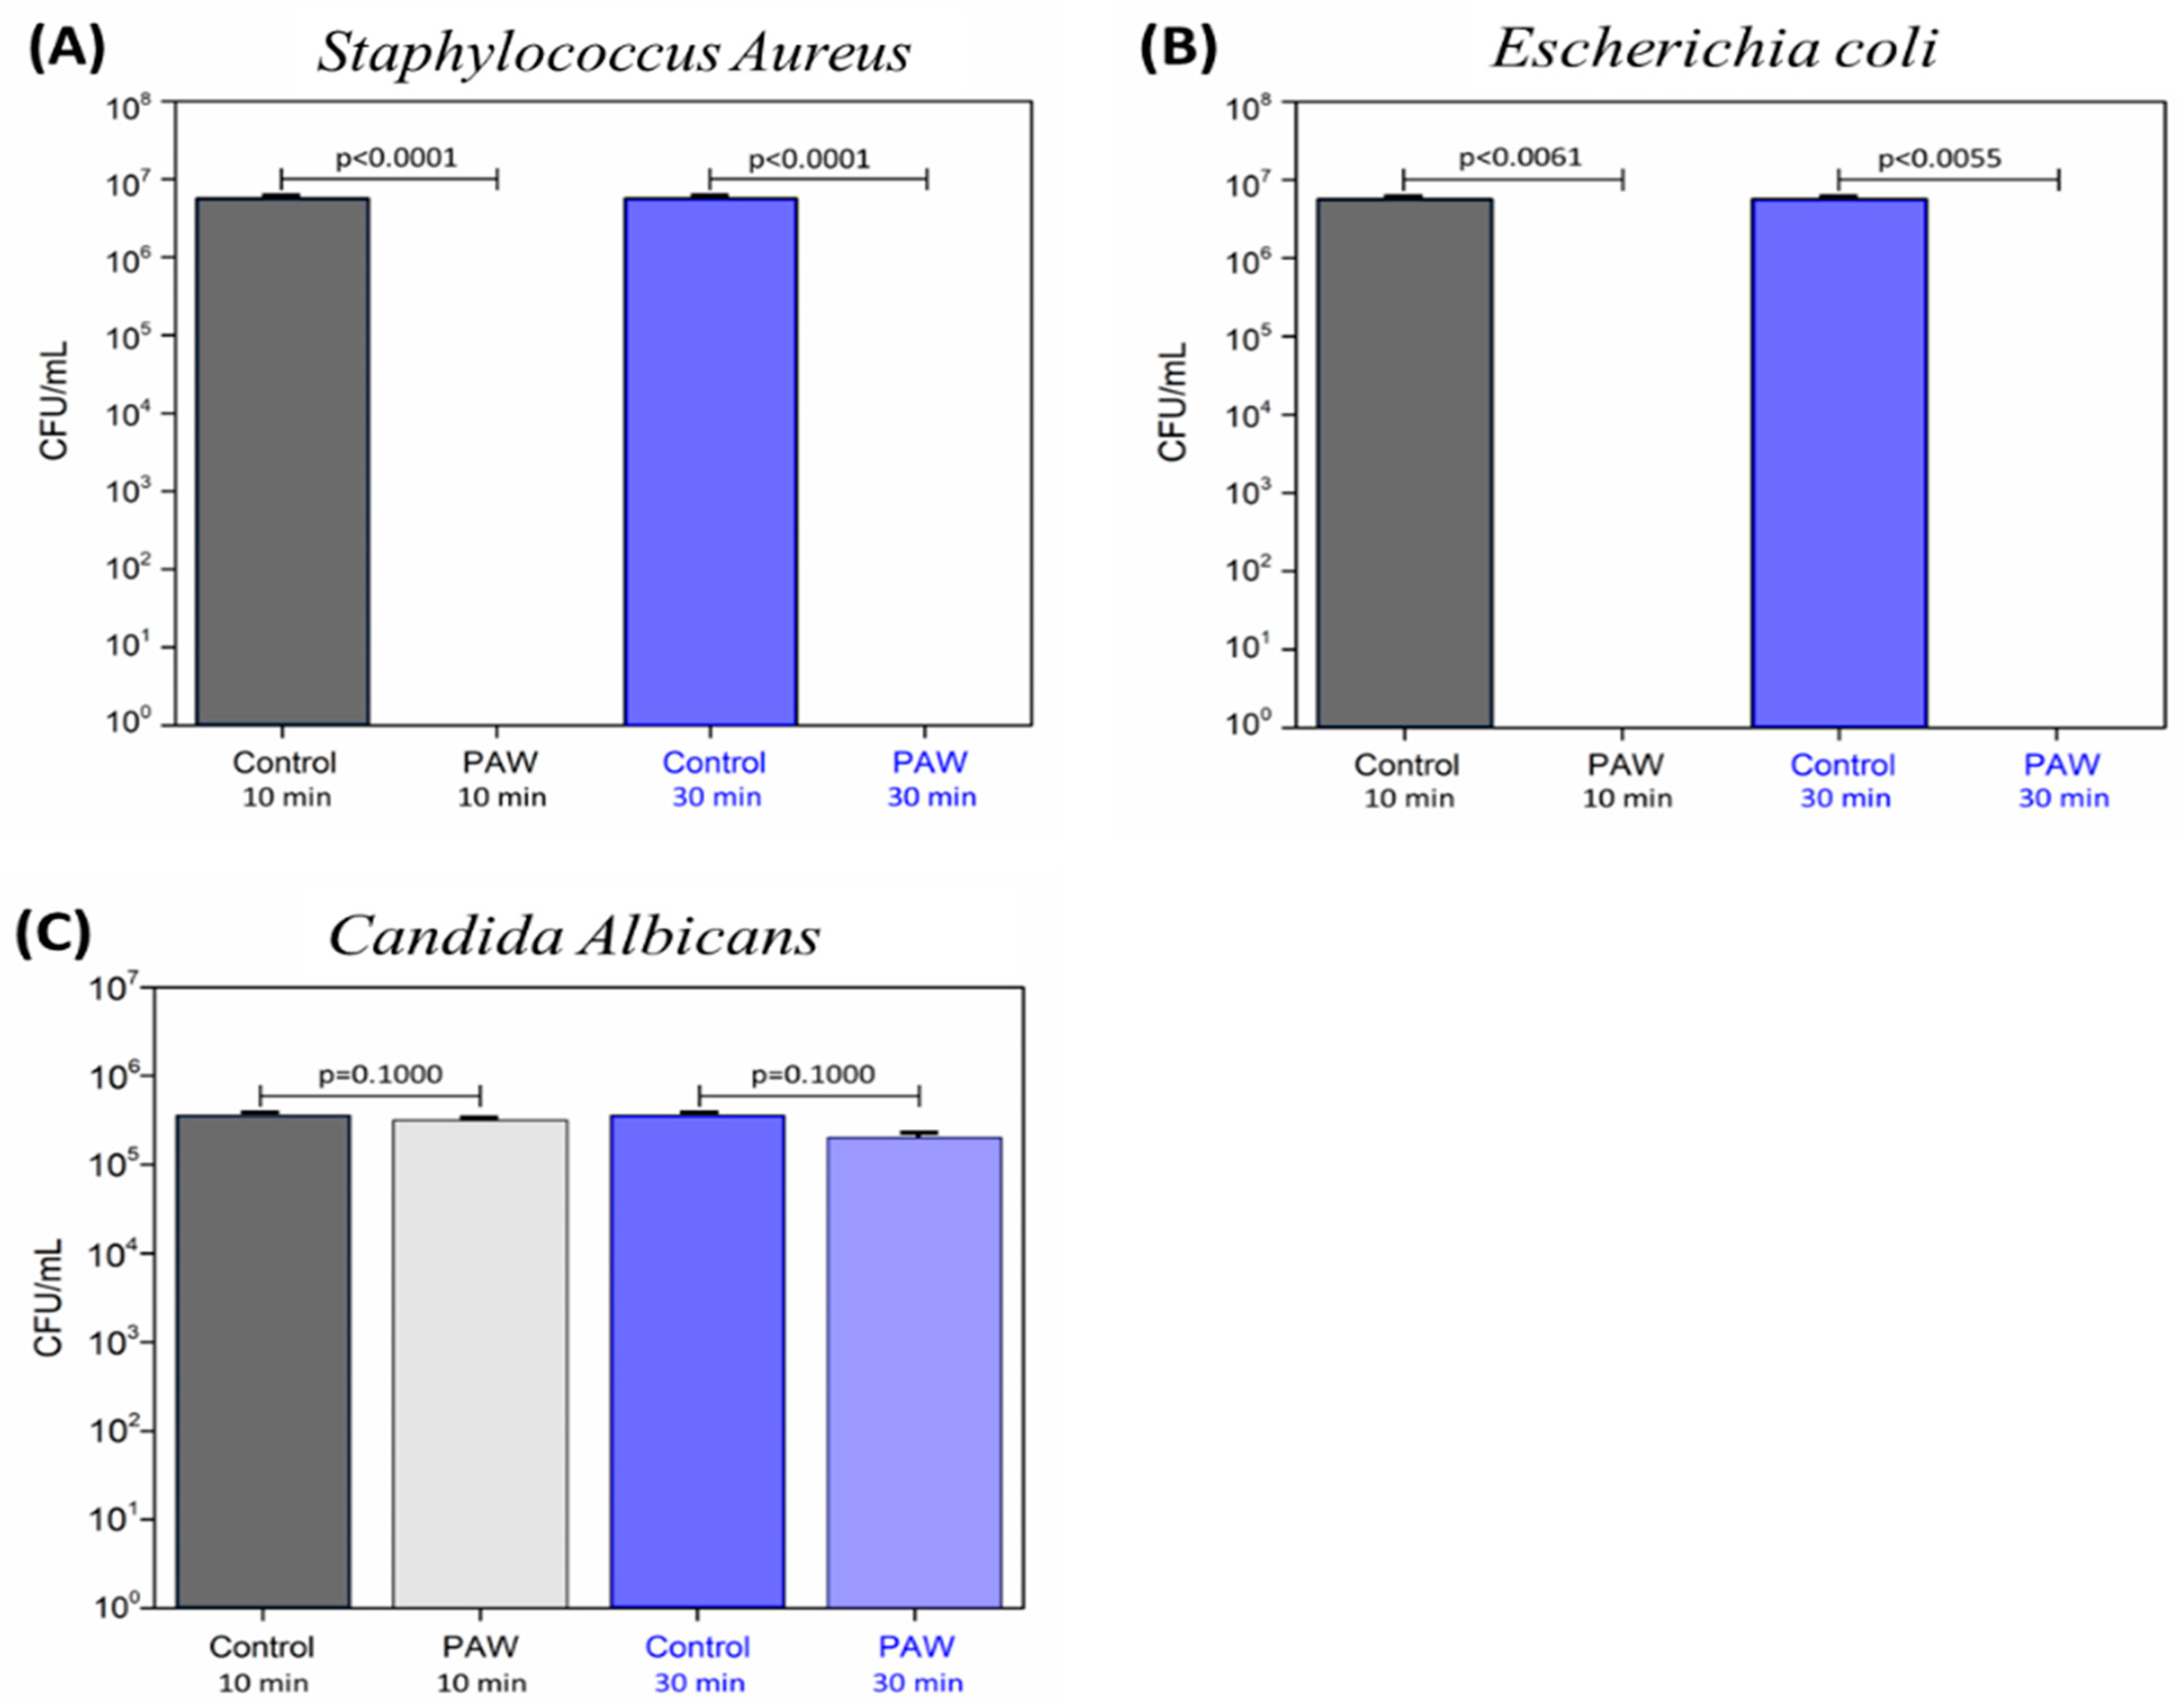
The results of inhibition of viable cells for
S. aureus,
E. coli, and
C. albicans are presented in
Figure 12A–C, respectively. The exposure time for each microorganism was 10 and 30 min.
Exposure to PAW (pH = 2.05) both for 10 and 30 min significantly reduced the viability of
S. aureus (
Figure 12A) compared to the control (pH = 7.37). A total inhibition of viable cells (99.99% of reduction) was obtained for both exposure times (
p < 0.0001 and
p = 0.0017, respectively).
For
E. coli (
Figure 12B), there was also a significant reduction in CFU/mL with no recovery of viable cells (99.99% reduction) after both 10 and 30 min to PAW (pH = 2.05) of contact (
p = 0.0061 and
p = 0.0055, respectively), compared to the control group (pH = 7.37).
Based on these results, a significant reduction in CFU/mL was observed for both
S. aureus and
E. coli. Although Gram-positive bacteria tend to be less susceptible to non-thermal plasma jets [
2], this feature was not observed for PAW, probably due to the different reactive species formed in PAW. The different reactive species may act differently on the microbial cell structures. According to Zhao et al. [
45], in Gram-negative bacteria, the action of reactive species of PAW occurs in the cell wall. In contrast, in Gram-positive bacteria, they act on intracellular components, causing damage that leads to the process of cell death.
The effects of low pH and the concentrations of reactive species present in water, such as NO
2−, NO
3−, and H
2O
2, activated by plasma, are of fundamental significance in the inactivation or demise of microorganisms, as these species damage their cellular membranes and components. In these contexts, Zhang et al. [
21] reported a study on the inactivation of Staphylococcus aureus using atmospheric helium dielectric barrier discharge. The treatment was conducted in the gas–liquid phase for different durations. Following discharge treatments lasting 1, 3, 5, and 8 min, the initial damage resulted in residual bacterial inactivation rates of 9.3%, 37.2%, 81.8%, and 86.7%, respectively. In this study, the pH values did not fall below 4.0, and the concentrations of NO
3− and H
2O
2 were approximately 20 mg/L and 90 mg/L, respectively. Although H
2O
2 is an effective agent against microorganisms, it alone is not capable of achieving complete microbial reduction, as explained in the current study [
44].
Another study conducted by Zhou et al. [
35] is a comparative investigation involving Plasma-Activated Water (PAW) and a solution containing an equivalent concentration of reactive species to those present in PAW, for the treatment of Escherichia coli. The application of PAW resulted in a reduction exceeding four logarithmic units, whereas exposure to an equivalent single dose of hydrogen peroxide (H
2O
2), nitrate (NO
3−), or nitrite (NO
2−) failed to attain a similar level of reduction. Remarkably, peroxynitrite emerged as a pivotal bioactive species, particularly under acidic conditions, originating from synergistic plasma effects, including the reactions of H
2O
2, NO
3−, NO
2−, and other short-lived species like OH radicals within PAW.
Following the discussion of the results of the present study, for
C. albicans (
Figure 12C), after 10 min contact with Plasma-Activated Water (PAW), a reduction percentage of 12.05% (
p = 0.1000) was achieved when compared to the control group (pH = 7.37). After 30 min of exposure, the reduction percentage was 37.50% (
p = 0.1000). However, the decrease in CFU/mL observed did not show statistical significance.
Fungal cells seem to be more resistant to plasma-activated liquids when compared to bacteria, probably due to their more complex cell structure. No significant reduction in cell viability when
C. albicans was exposed to tap water activated by plasma generated in a gliding arc system (pH 3.5). The association between LTAPP and PAW has been recently suggested to improve the effectiveness against fungal species and should be evaluated in future studies [
56]. According to Sherrington et al. [
57],
C. albicans can survive in environments with a pH ranging from 2 to 10, as it can colonize sites such as the stomach, vagina, and oral mucosa in the host. Further studies exploring the efficacy of PAW against this fungus are still necessary. When compared to bacterial cells,
C. albicans exhibits different characteristics and virulence factors, which can also vary among clinically relevant strains belonging to the same genus and species [
55].
4. Conclusions
This study methodically determined the optimal operating conditions for a coaxial DBD reactor in producing high-quality PAW. It was observed that DBD discharges, when facilitated with an air flow, exhibited an elevated capacity to produce PAW with substantial concentrations of nitrogen-based species. Through the manipulation of gas flow rate, activation time, and volume, the best conditions were identified. The prime conditions consisted of a gas flow rate of 5 L/min, an activation time of 10 min, and a PAW volume of 25 mL. Under these parameters, there was a pronounced elevation in the concentrations of NO2−, NO3−, H2O2, and HNO2. The resulting PAW possessed distinct physicochemical properties such as a pH of 2.06, an ORP of 275 mV, conductivity of 3 mS/cm, and TDS of 1200 mg/L. Furthermore, the assessments of SIE and EY played a pivotal role in this research. These metrics reflected the efficiency of the DBD reactor in terms of energy input and the corresponding yield, solidifying its potential for sustainable PAW production. In terms of antimicrobial efficiency, the PAW demonstrated significant efficacy. The viability of both Gram-positive (S. aureus) and Gram-negative (E. coli) bacteria saw a substantial reduction, while the fungus C. albicans showed a more moderate decline in viability. In conclusion, the coaxial DBD reactor stands out as a promising tool for crafting high-quality PAW with notable antimicrobial properties. This study underscores the importance of further research to confirm the safety and broad-spectrum applications of PAW, while also emphasizing the potential of optimizing the DBD method, especially in the context of energy efficiency and yield via SIE and EY metrics.


 ,
, 


