
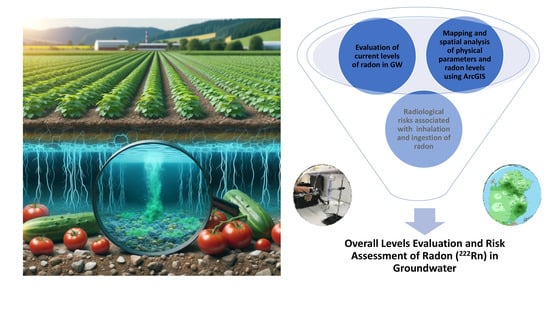
Evaluation of the Radon Levels in the Groundwater Wells of Qatar: Radiological Risk Assessment

 , and
, and
Abstract
:
1. Introduction
2. Materials and Methods
2.1. Sampling Locations Selection
2.2. Physical-Chemical Properties Measurement

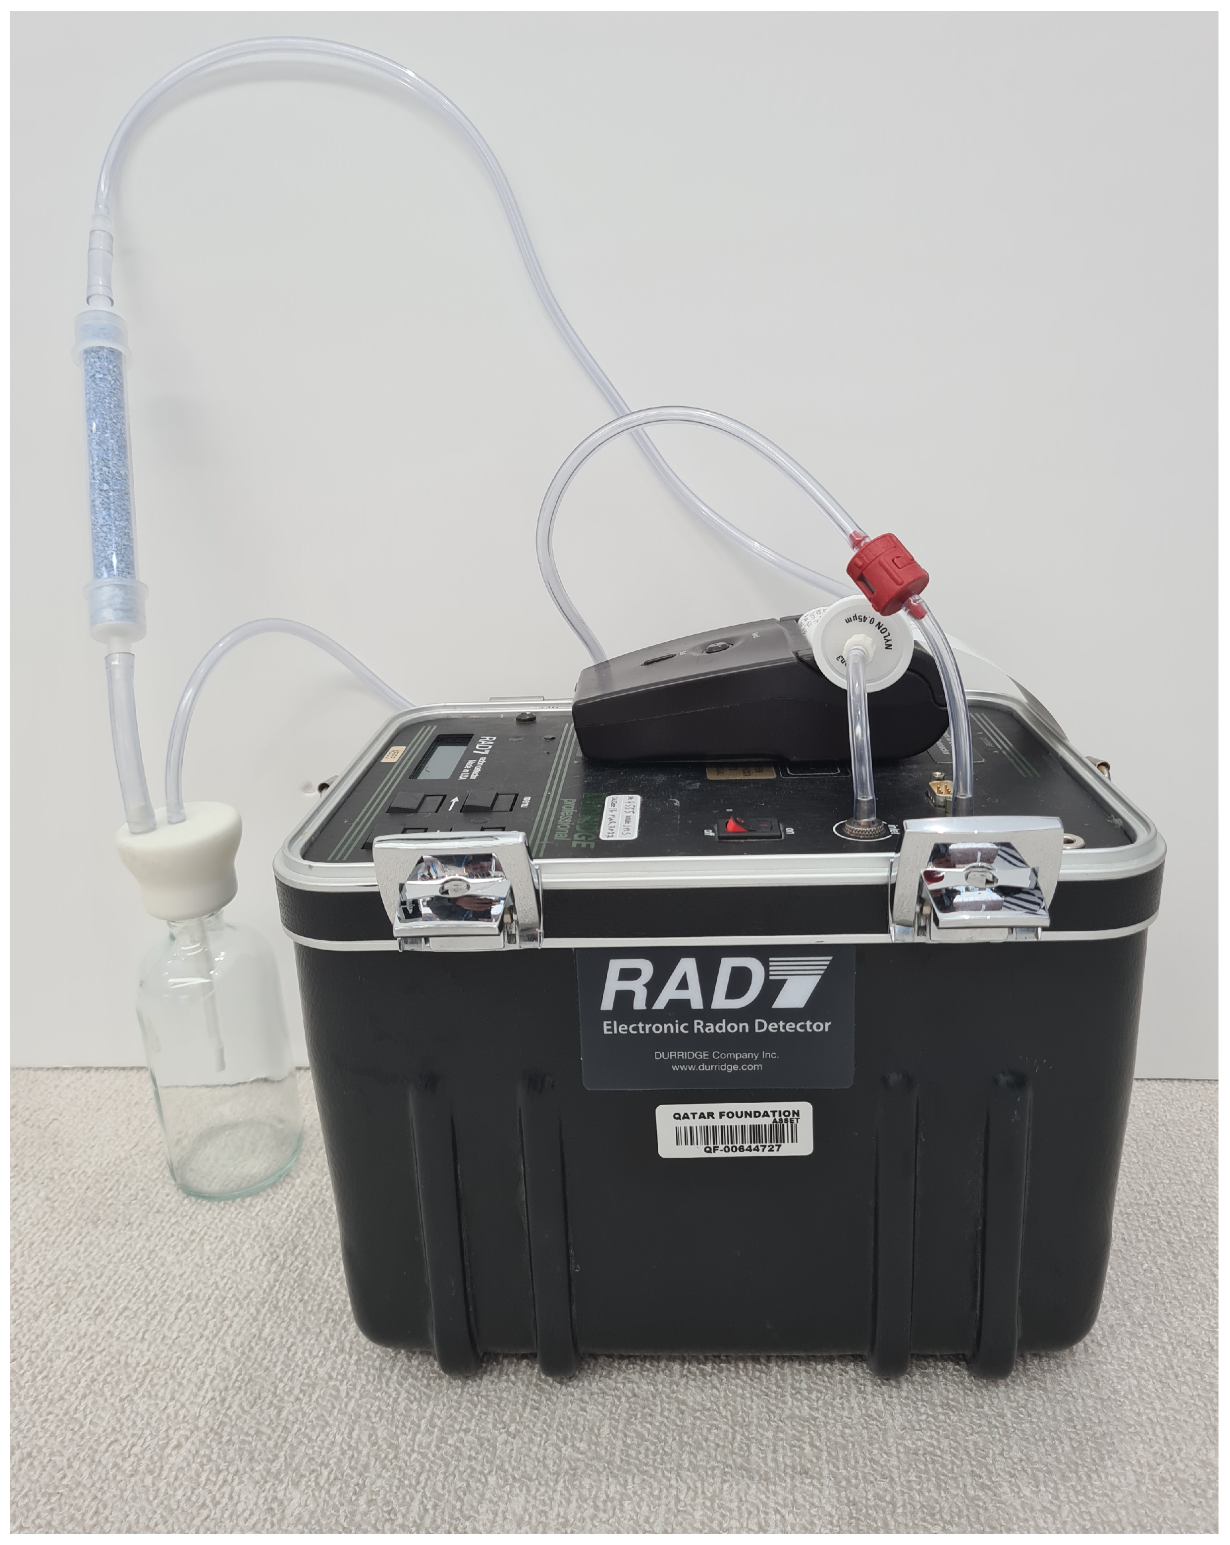
2.3. Radon Levels Measurements
2.4. Sampling Procedure
2.5. Radiological Risk Assessment
3. Results and Discussions
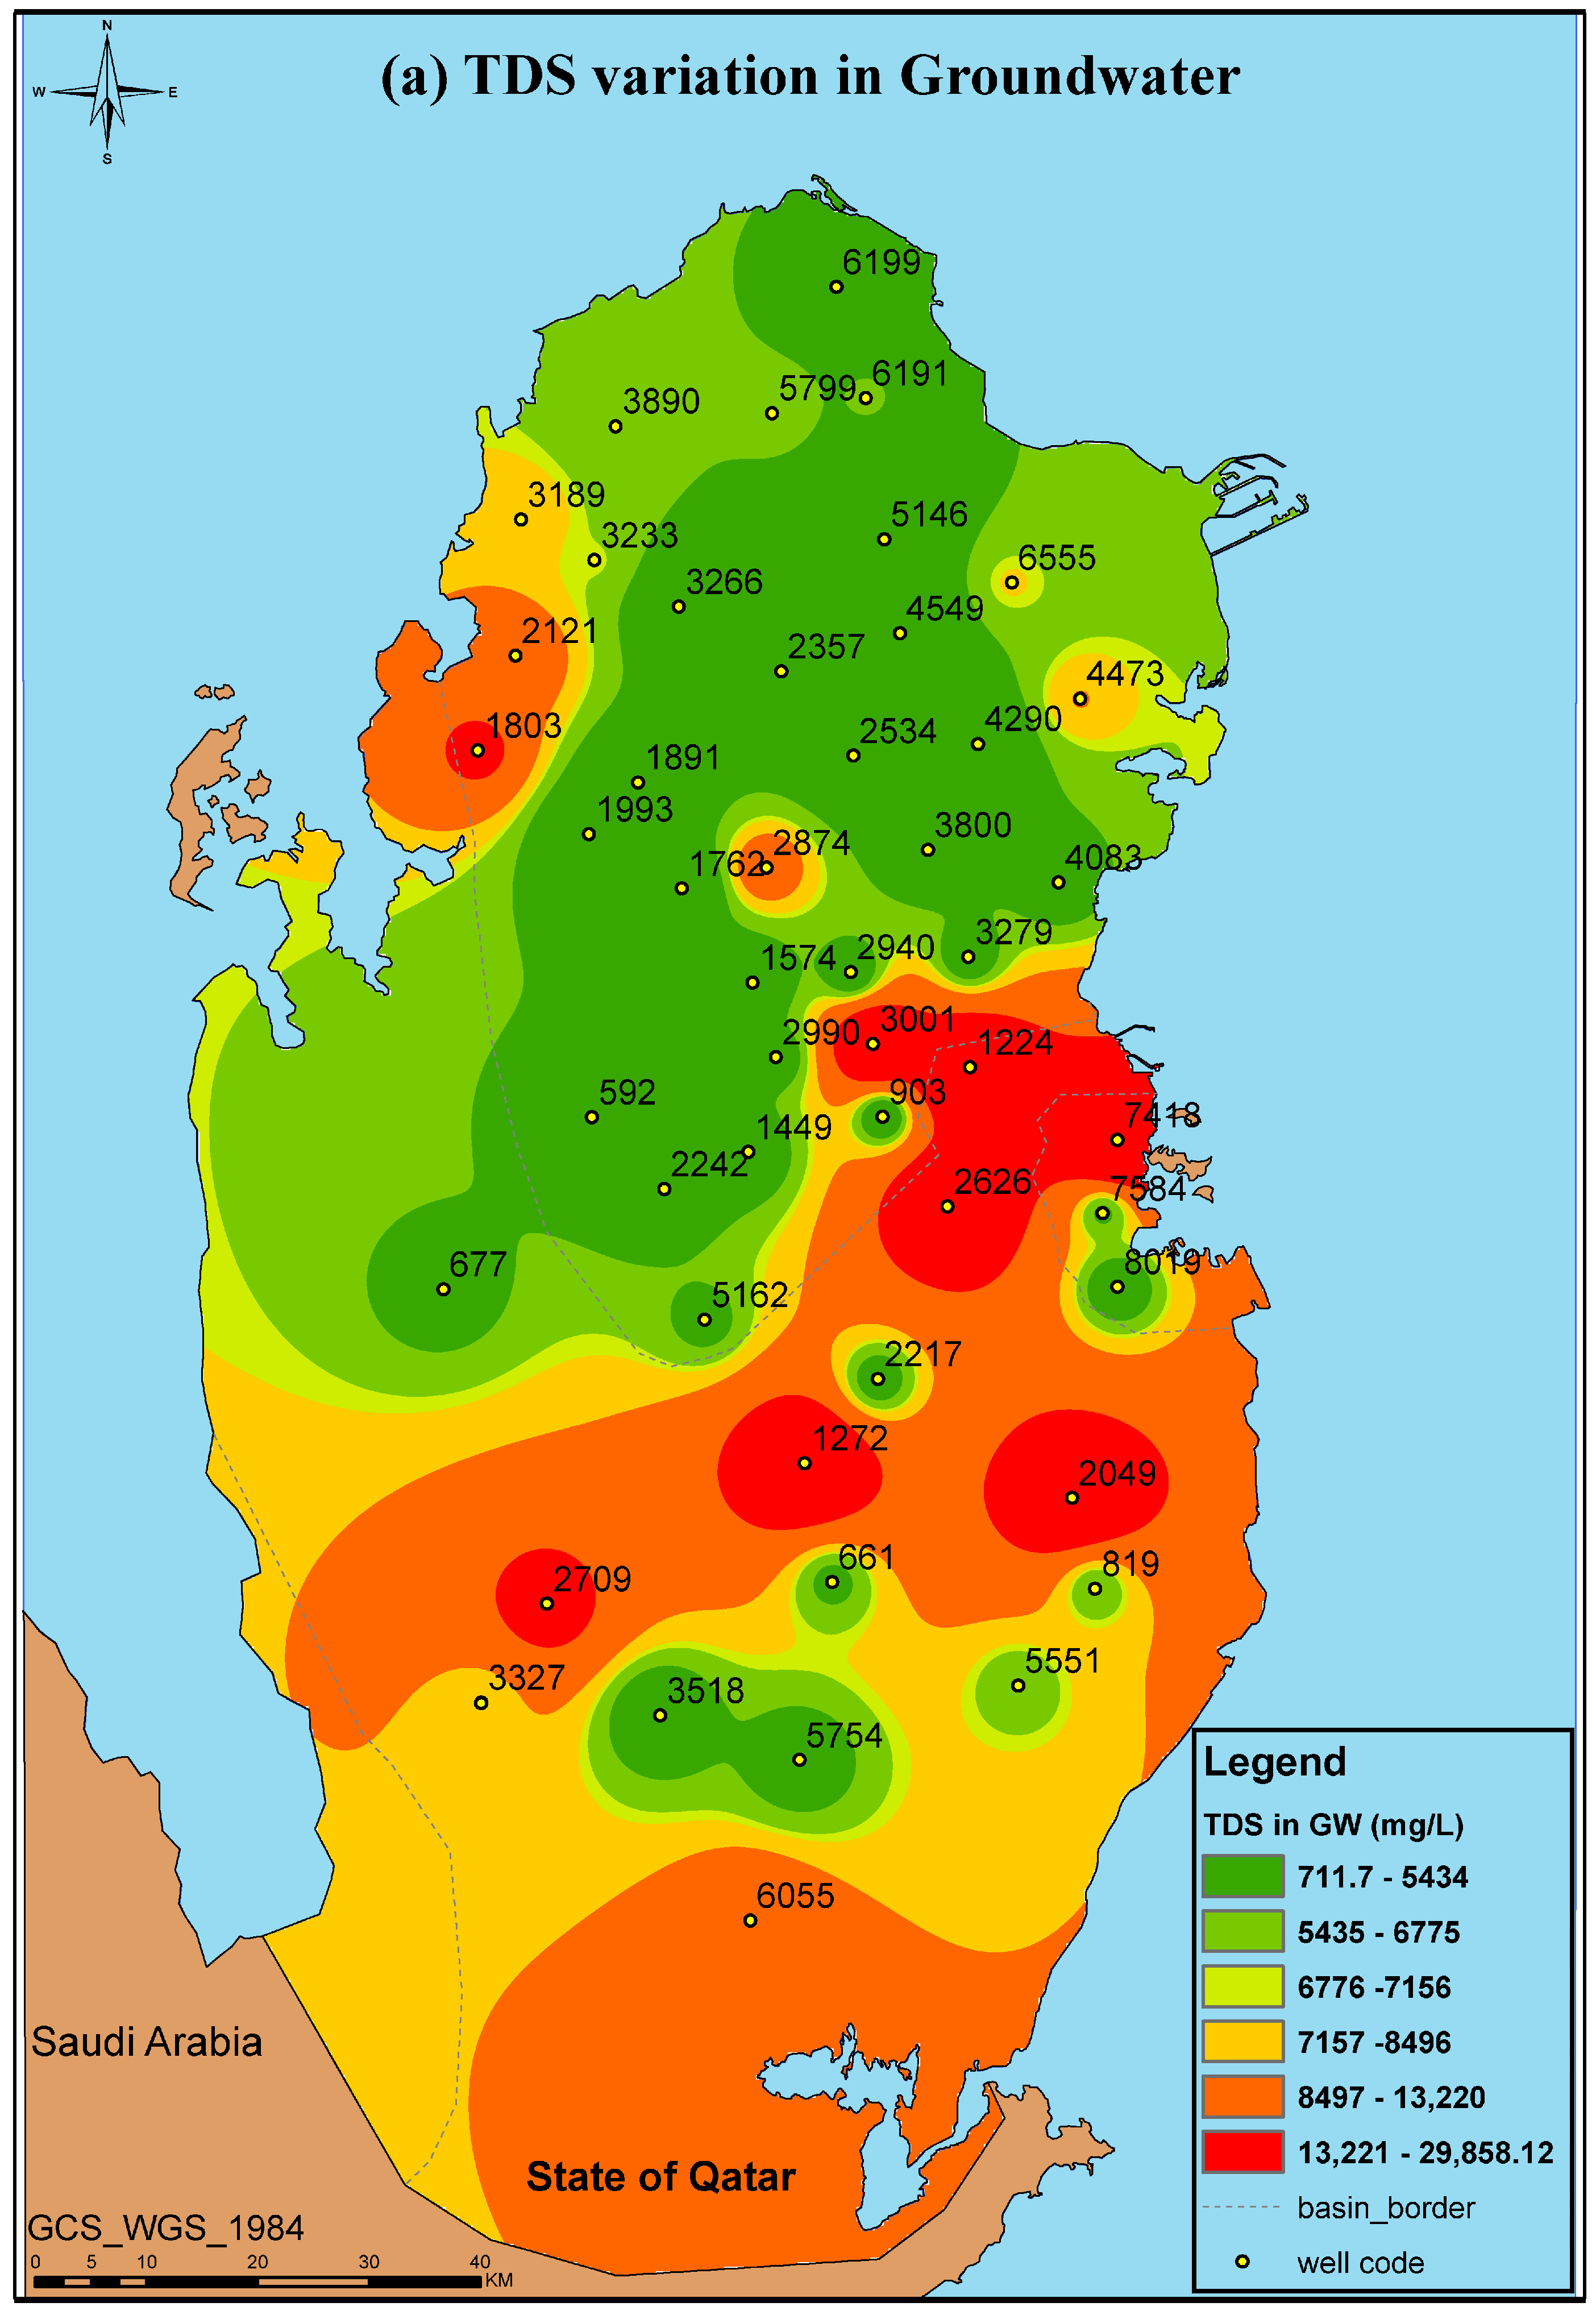
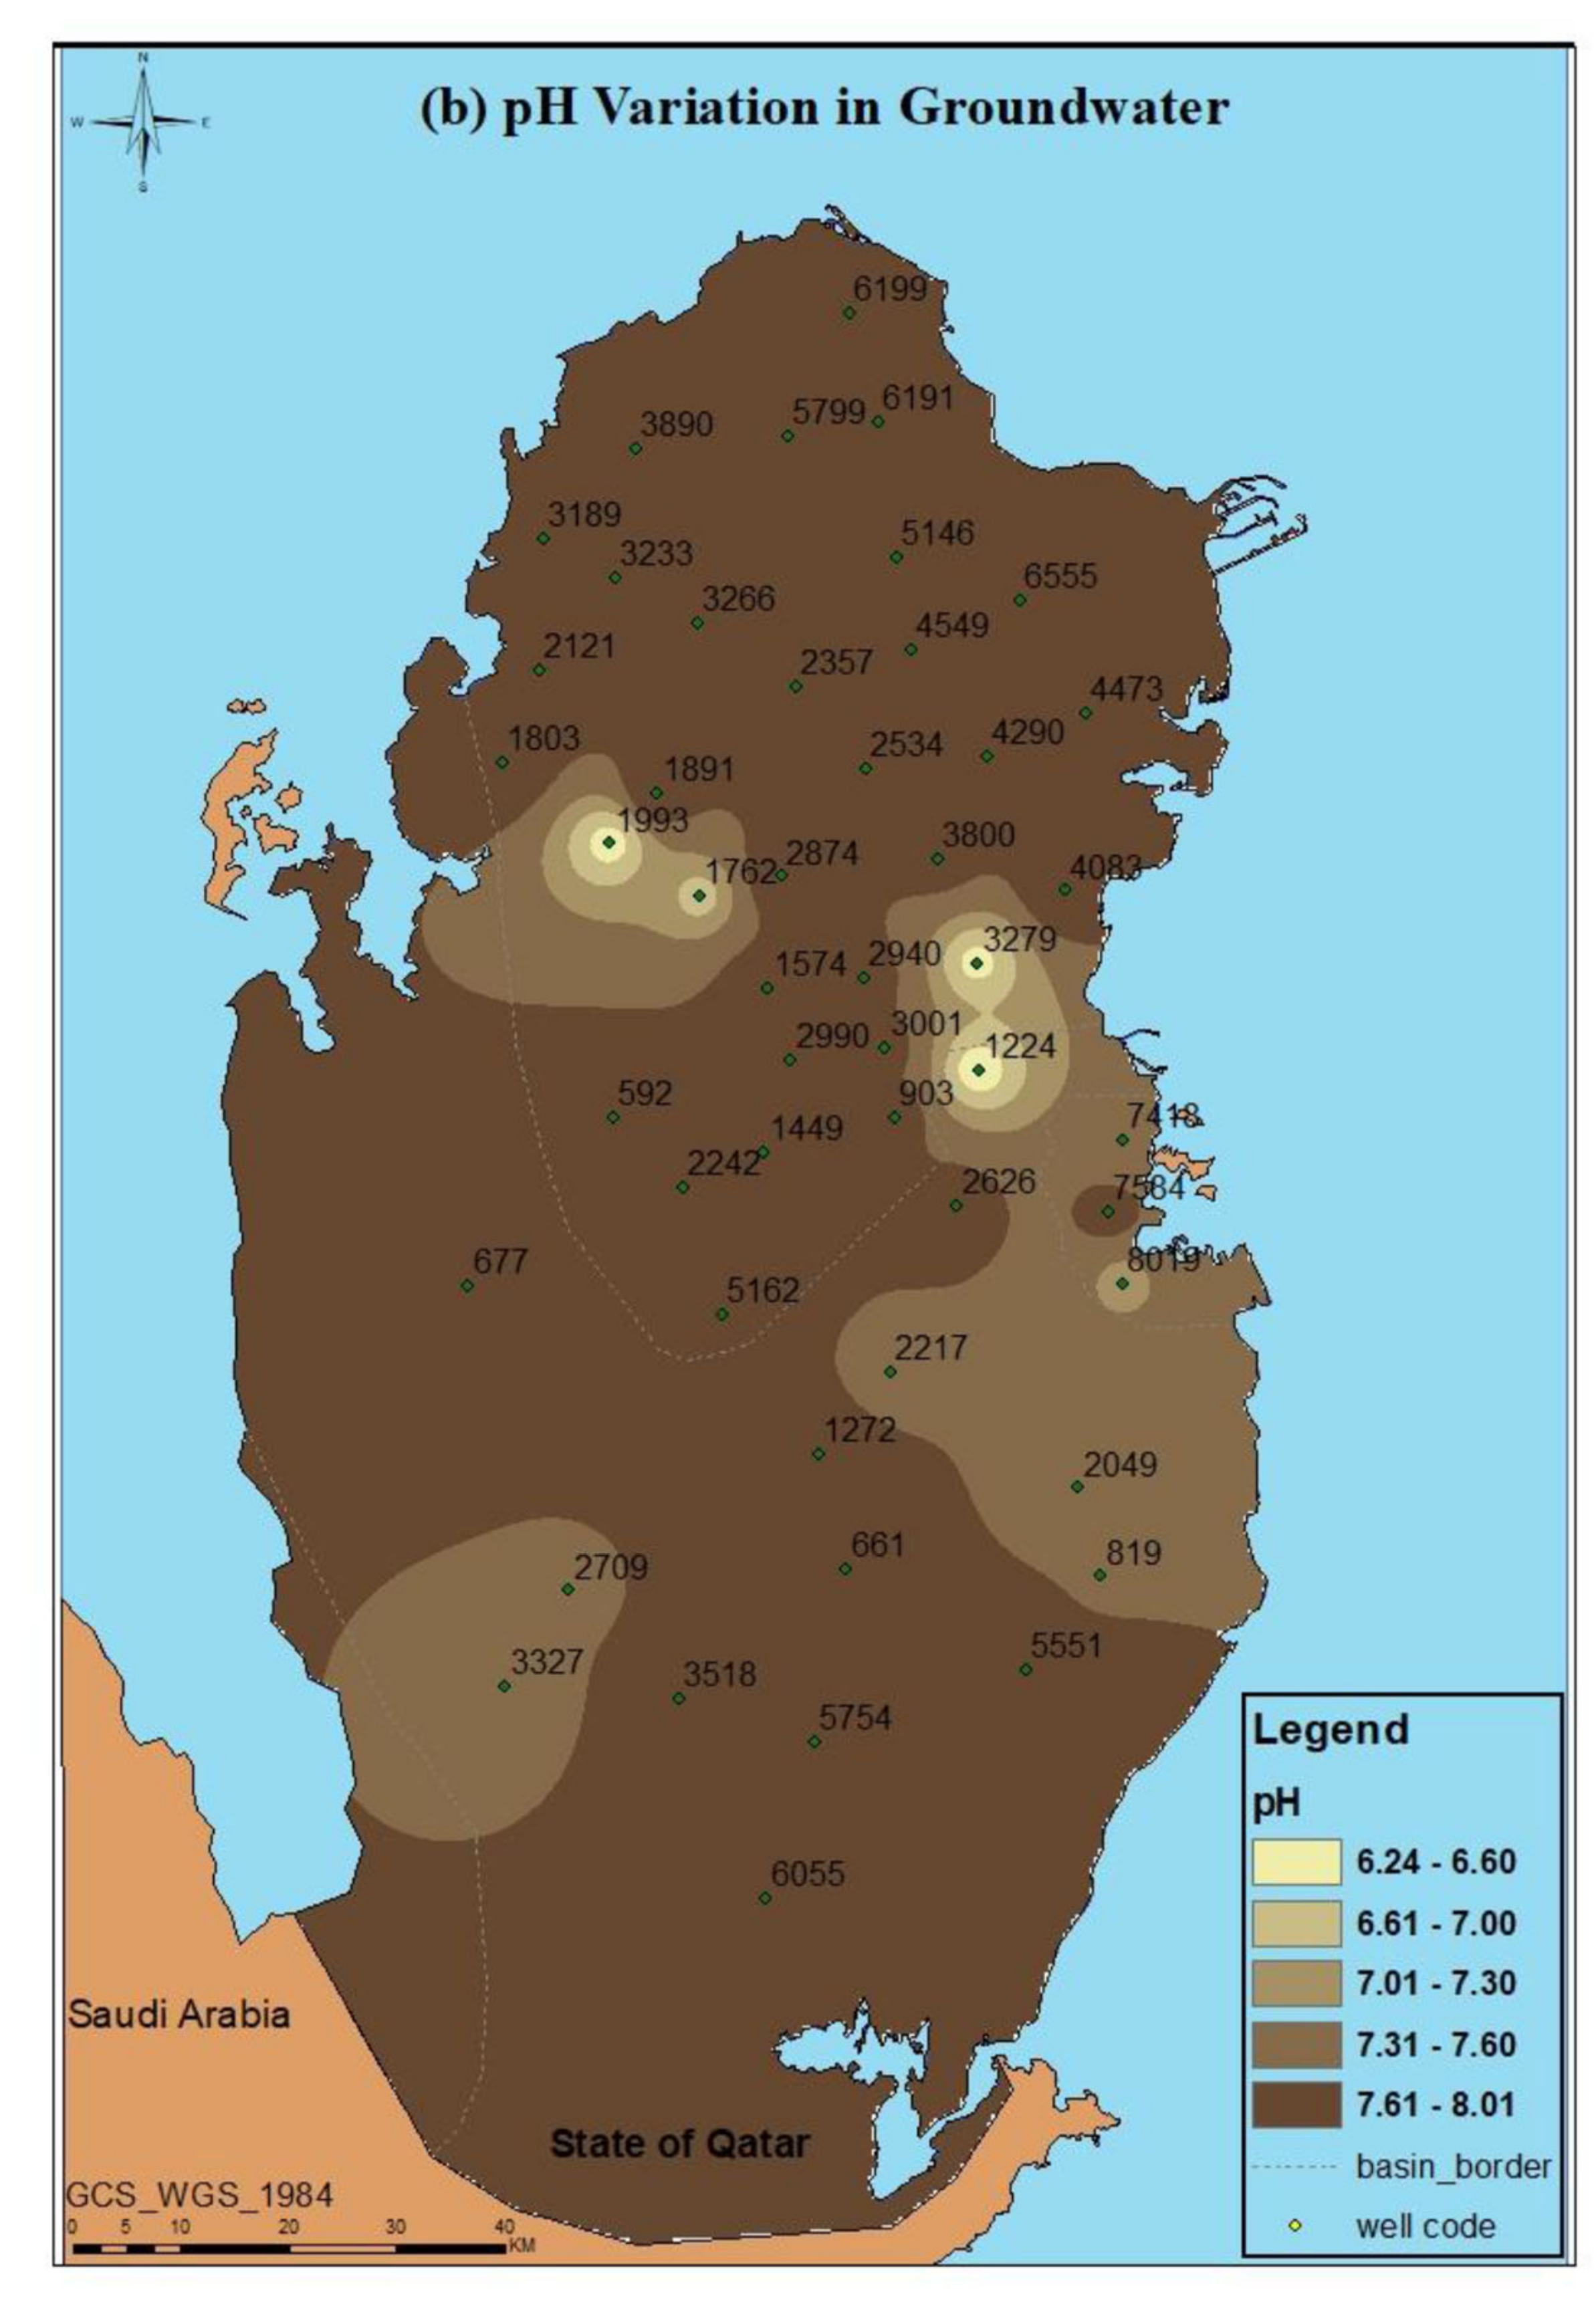
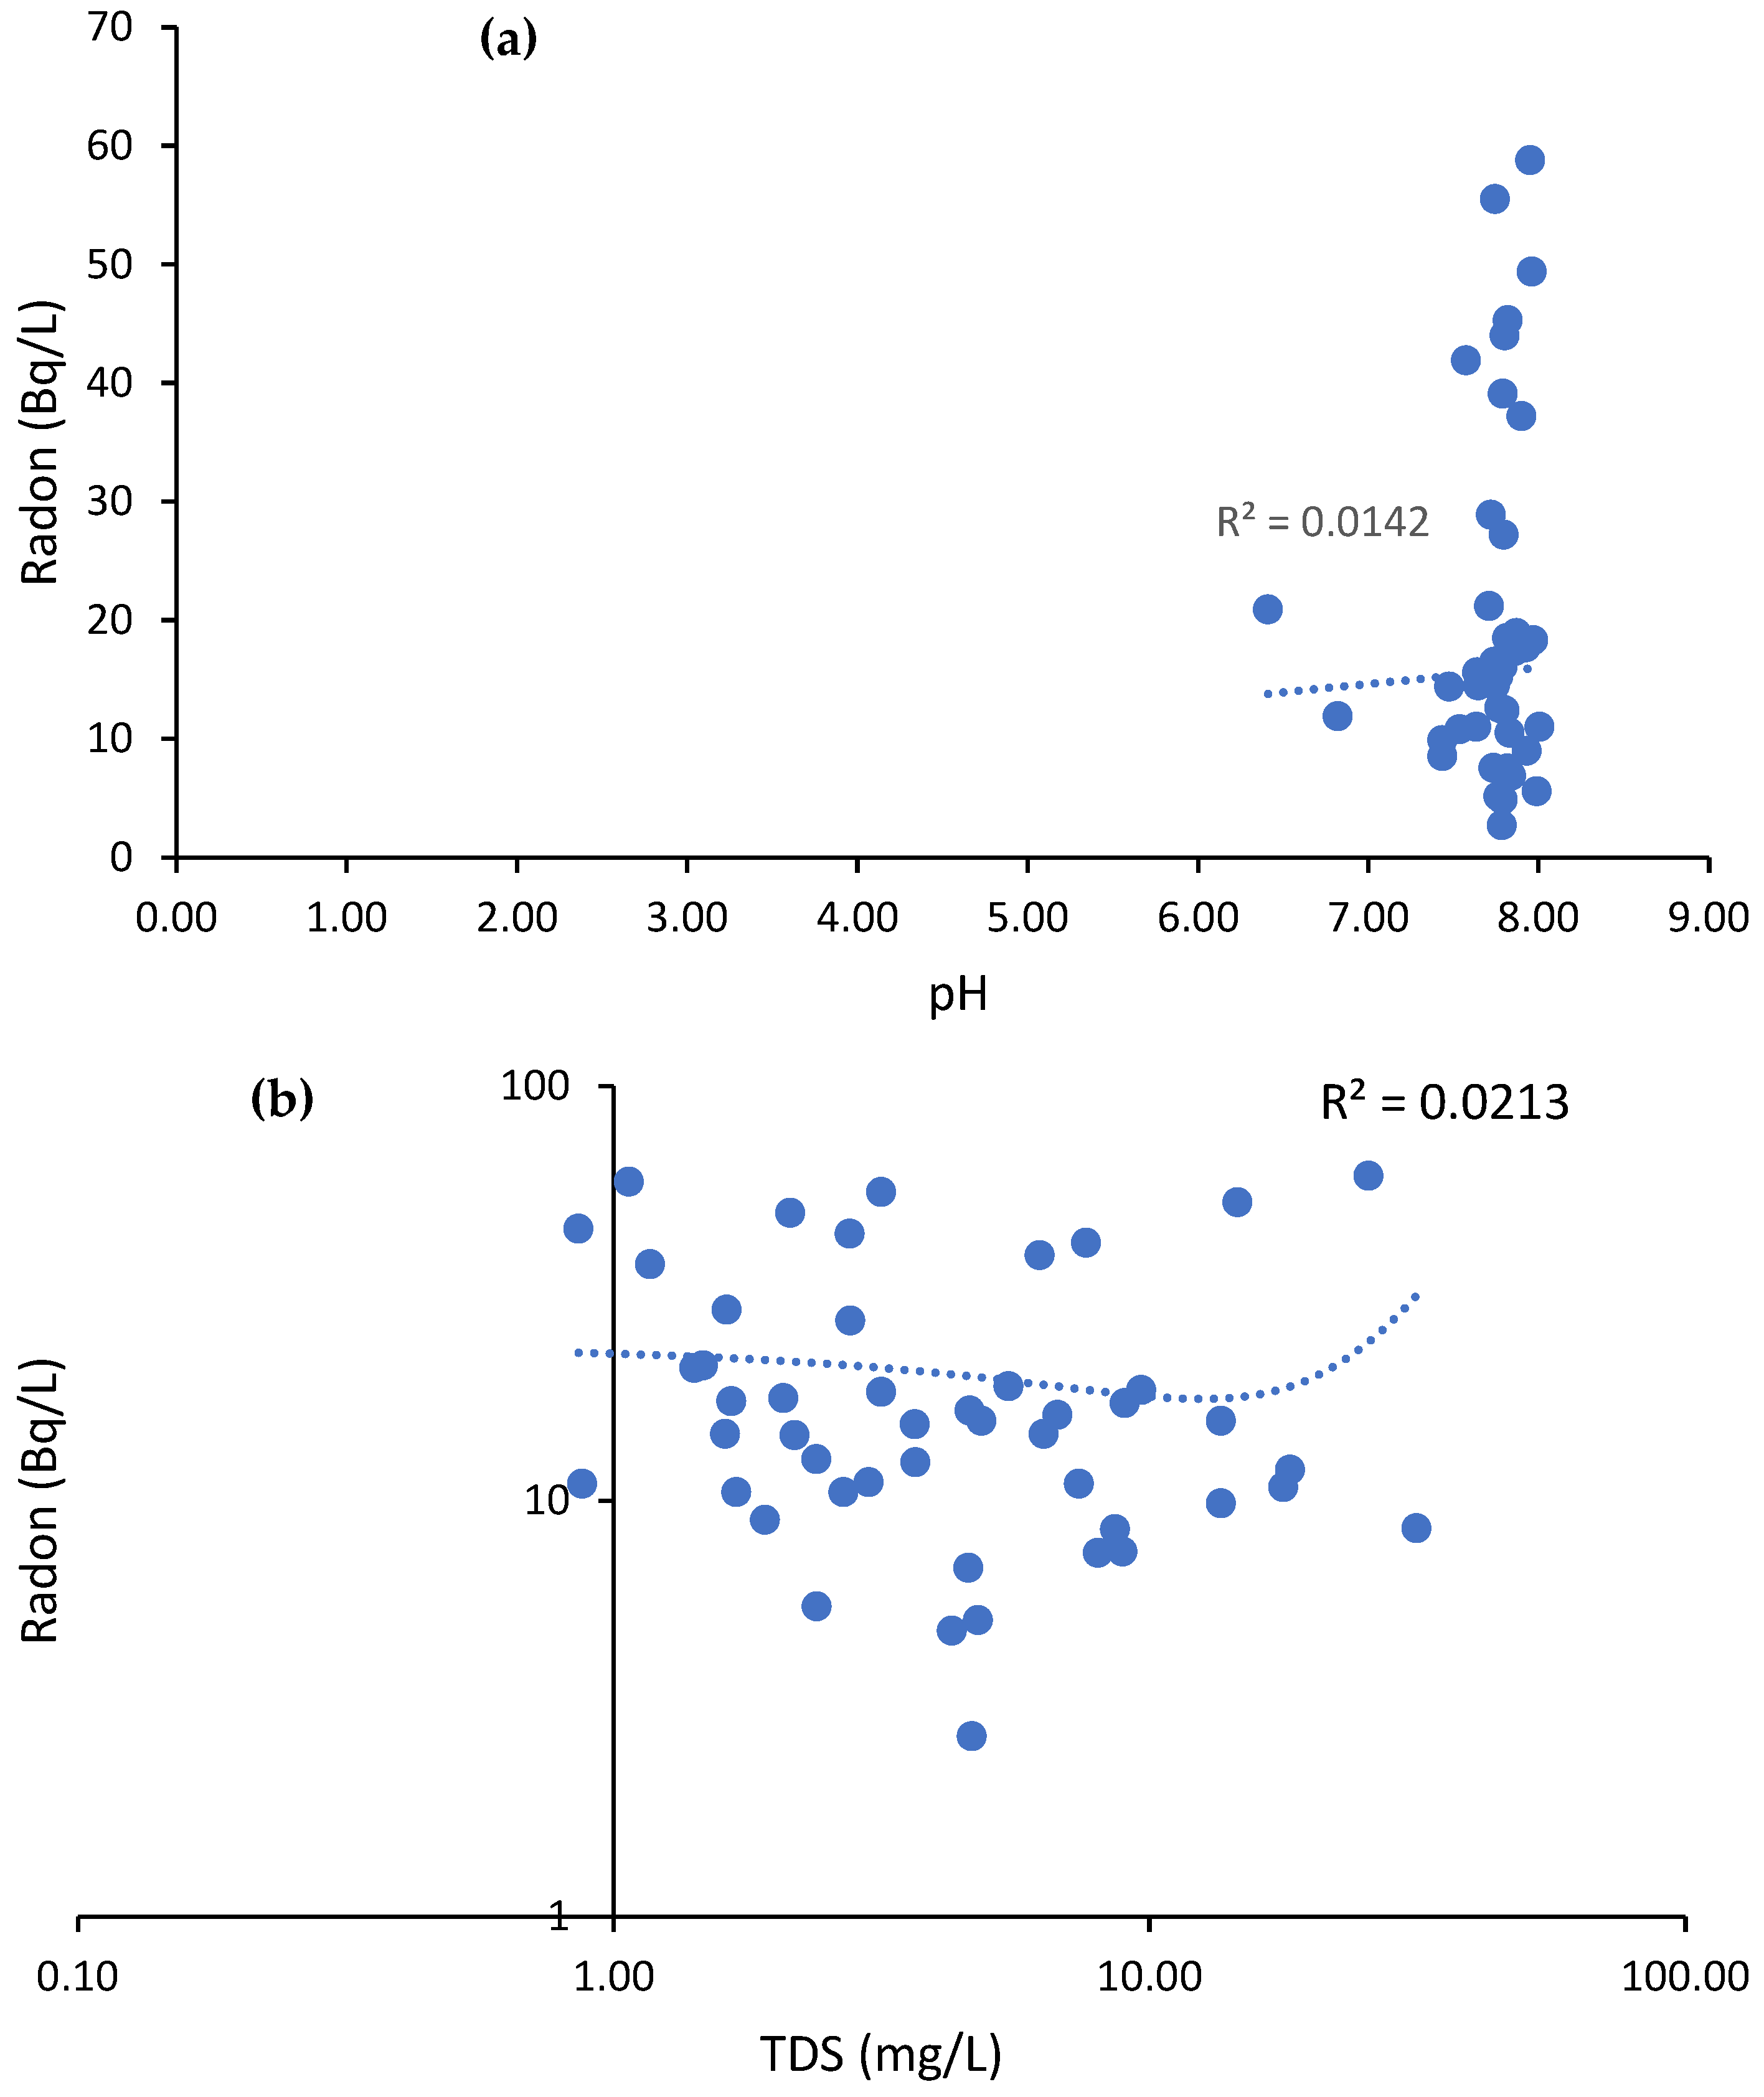
3.1. Physico-Chemical Parameters (pH and SEC)
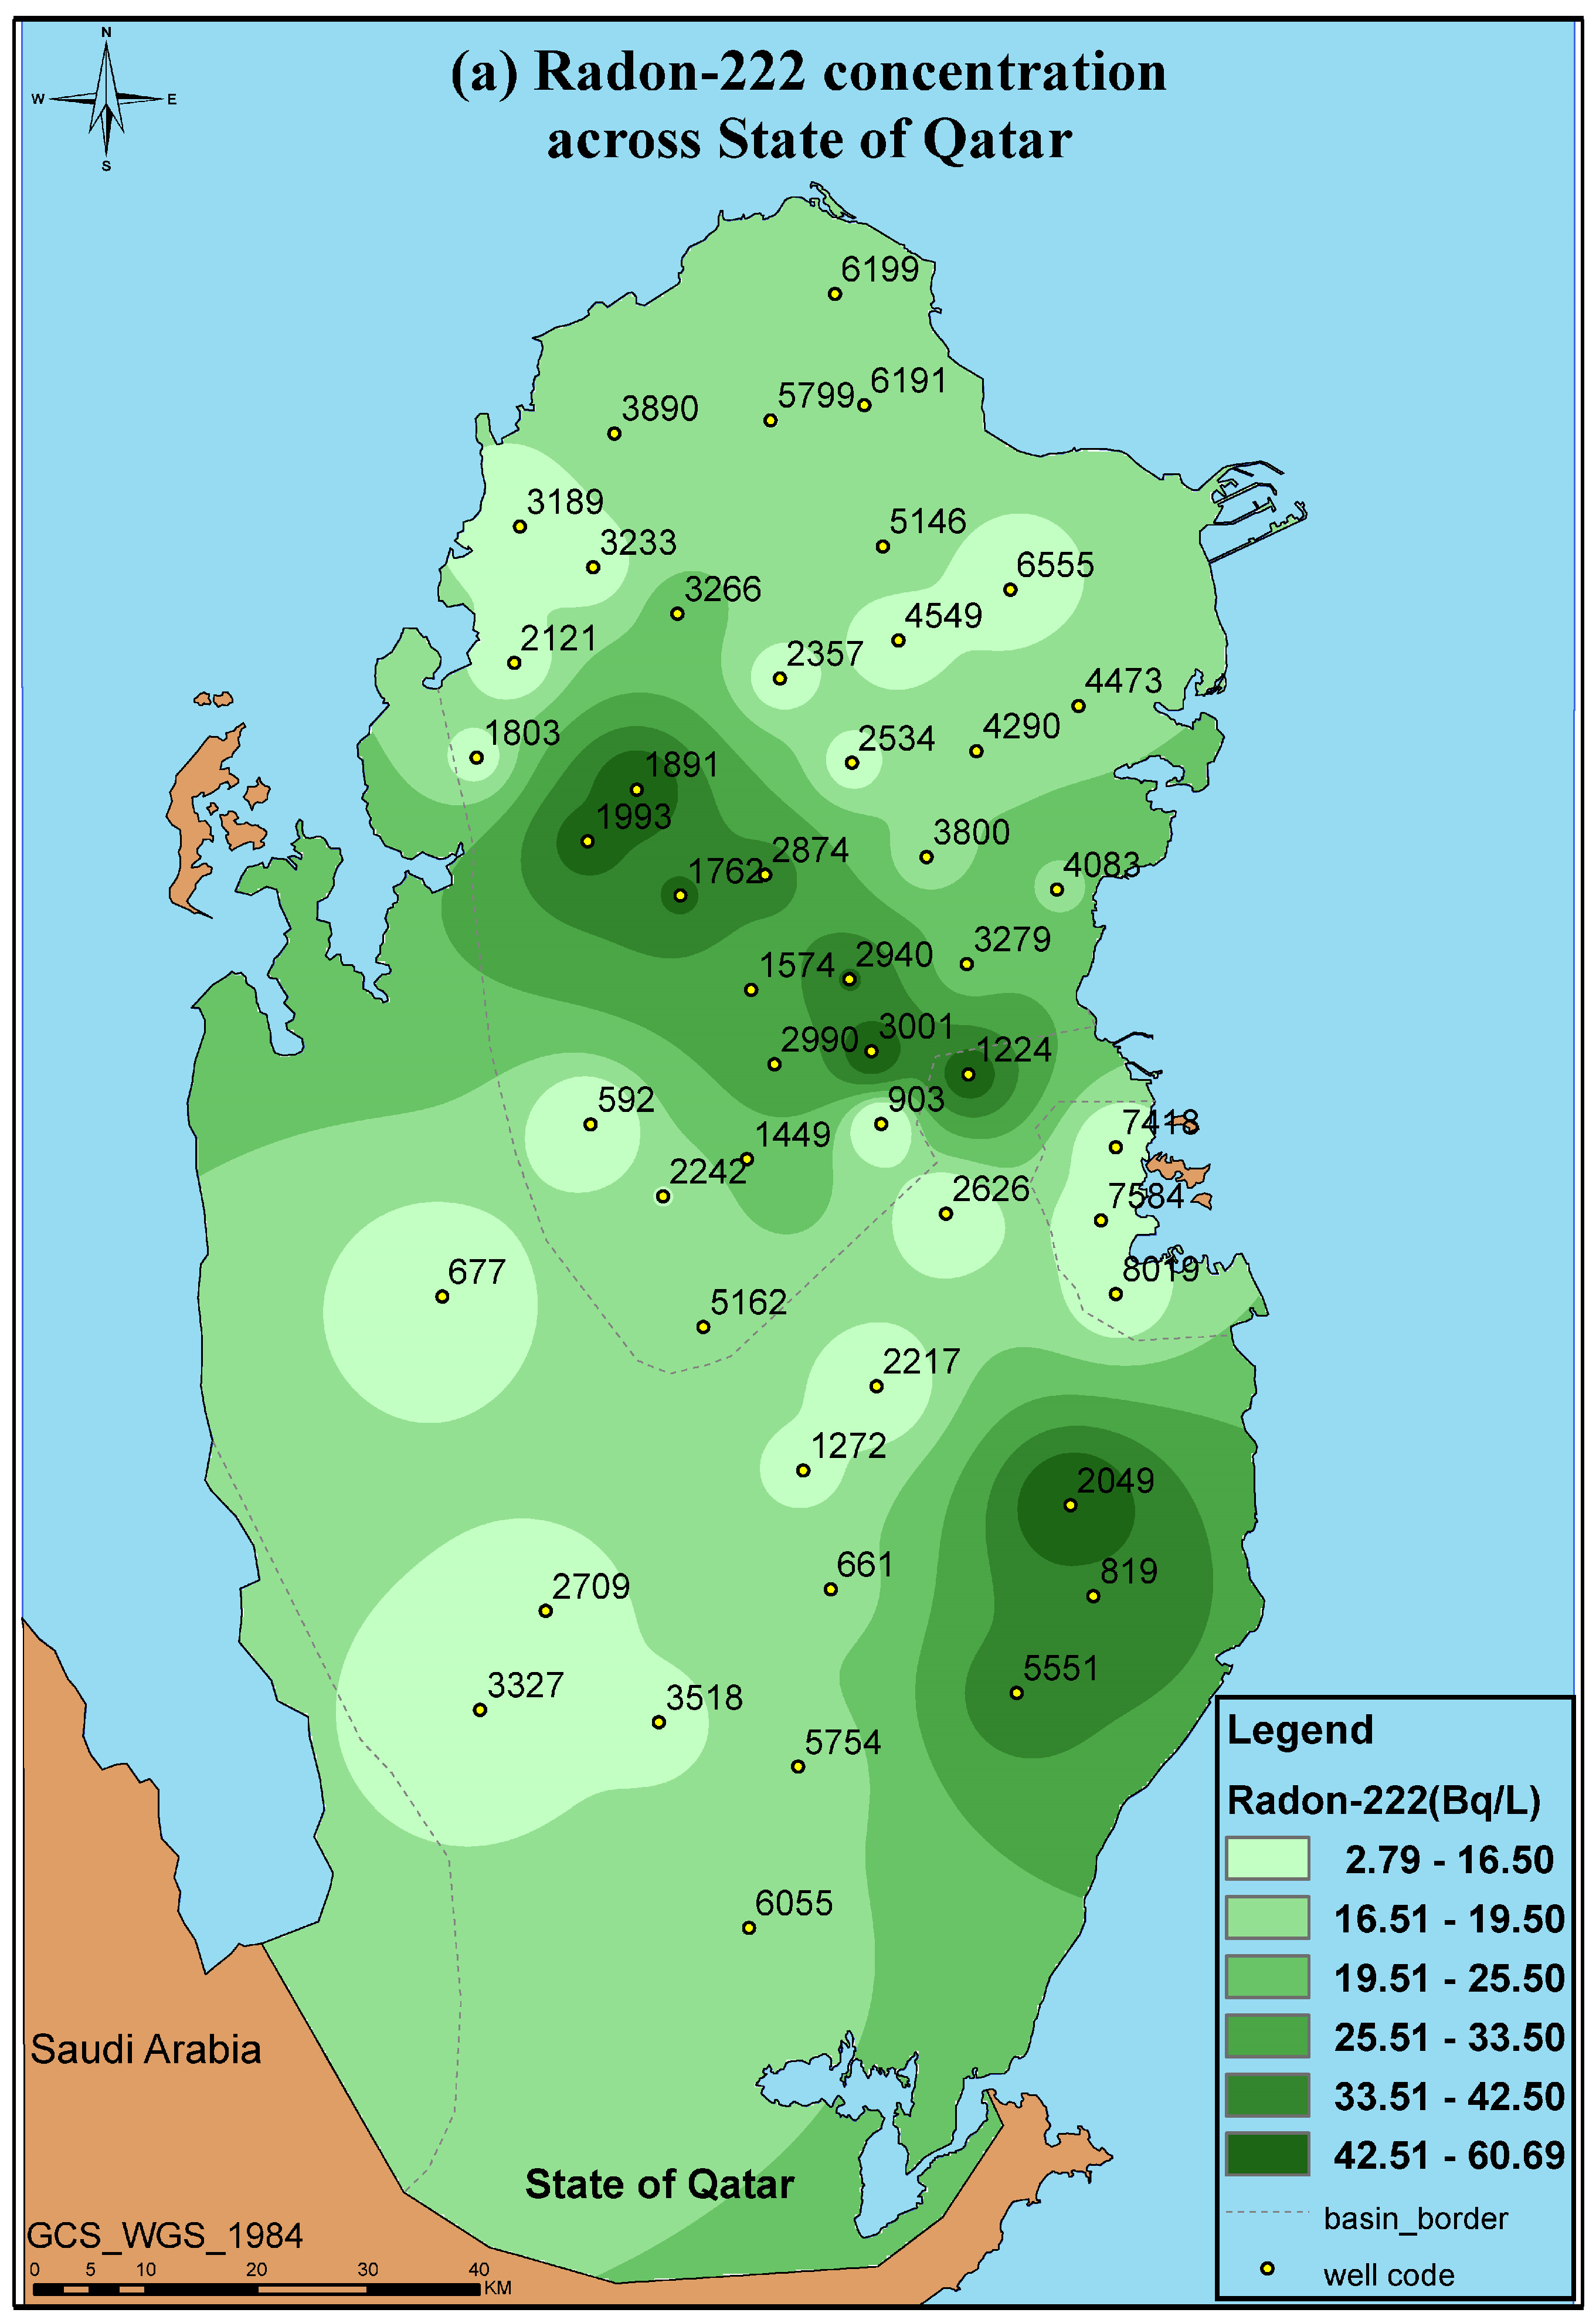
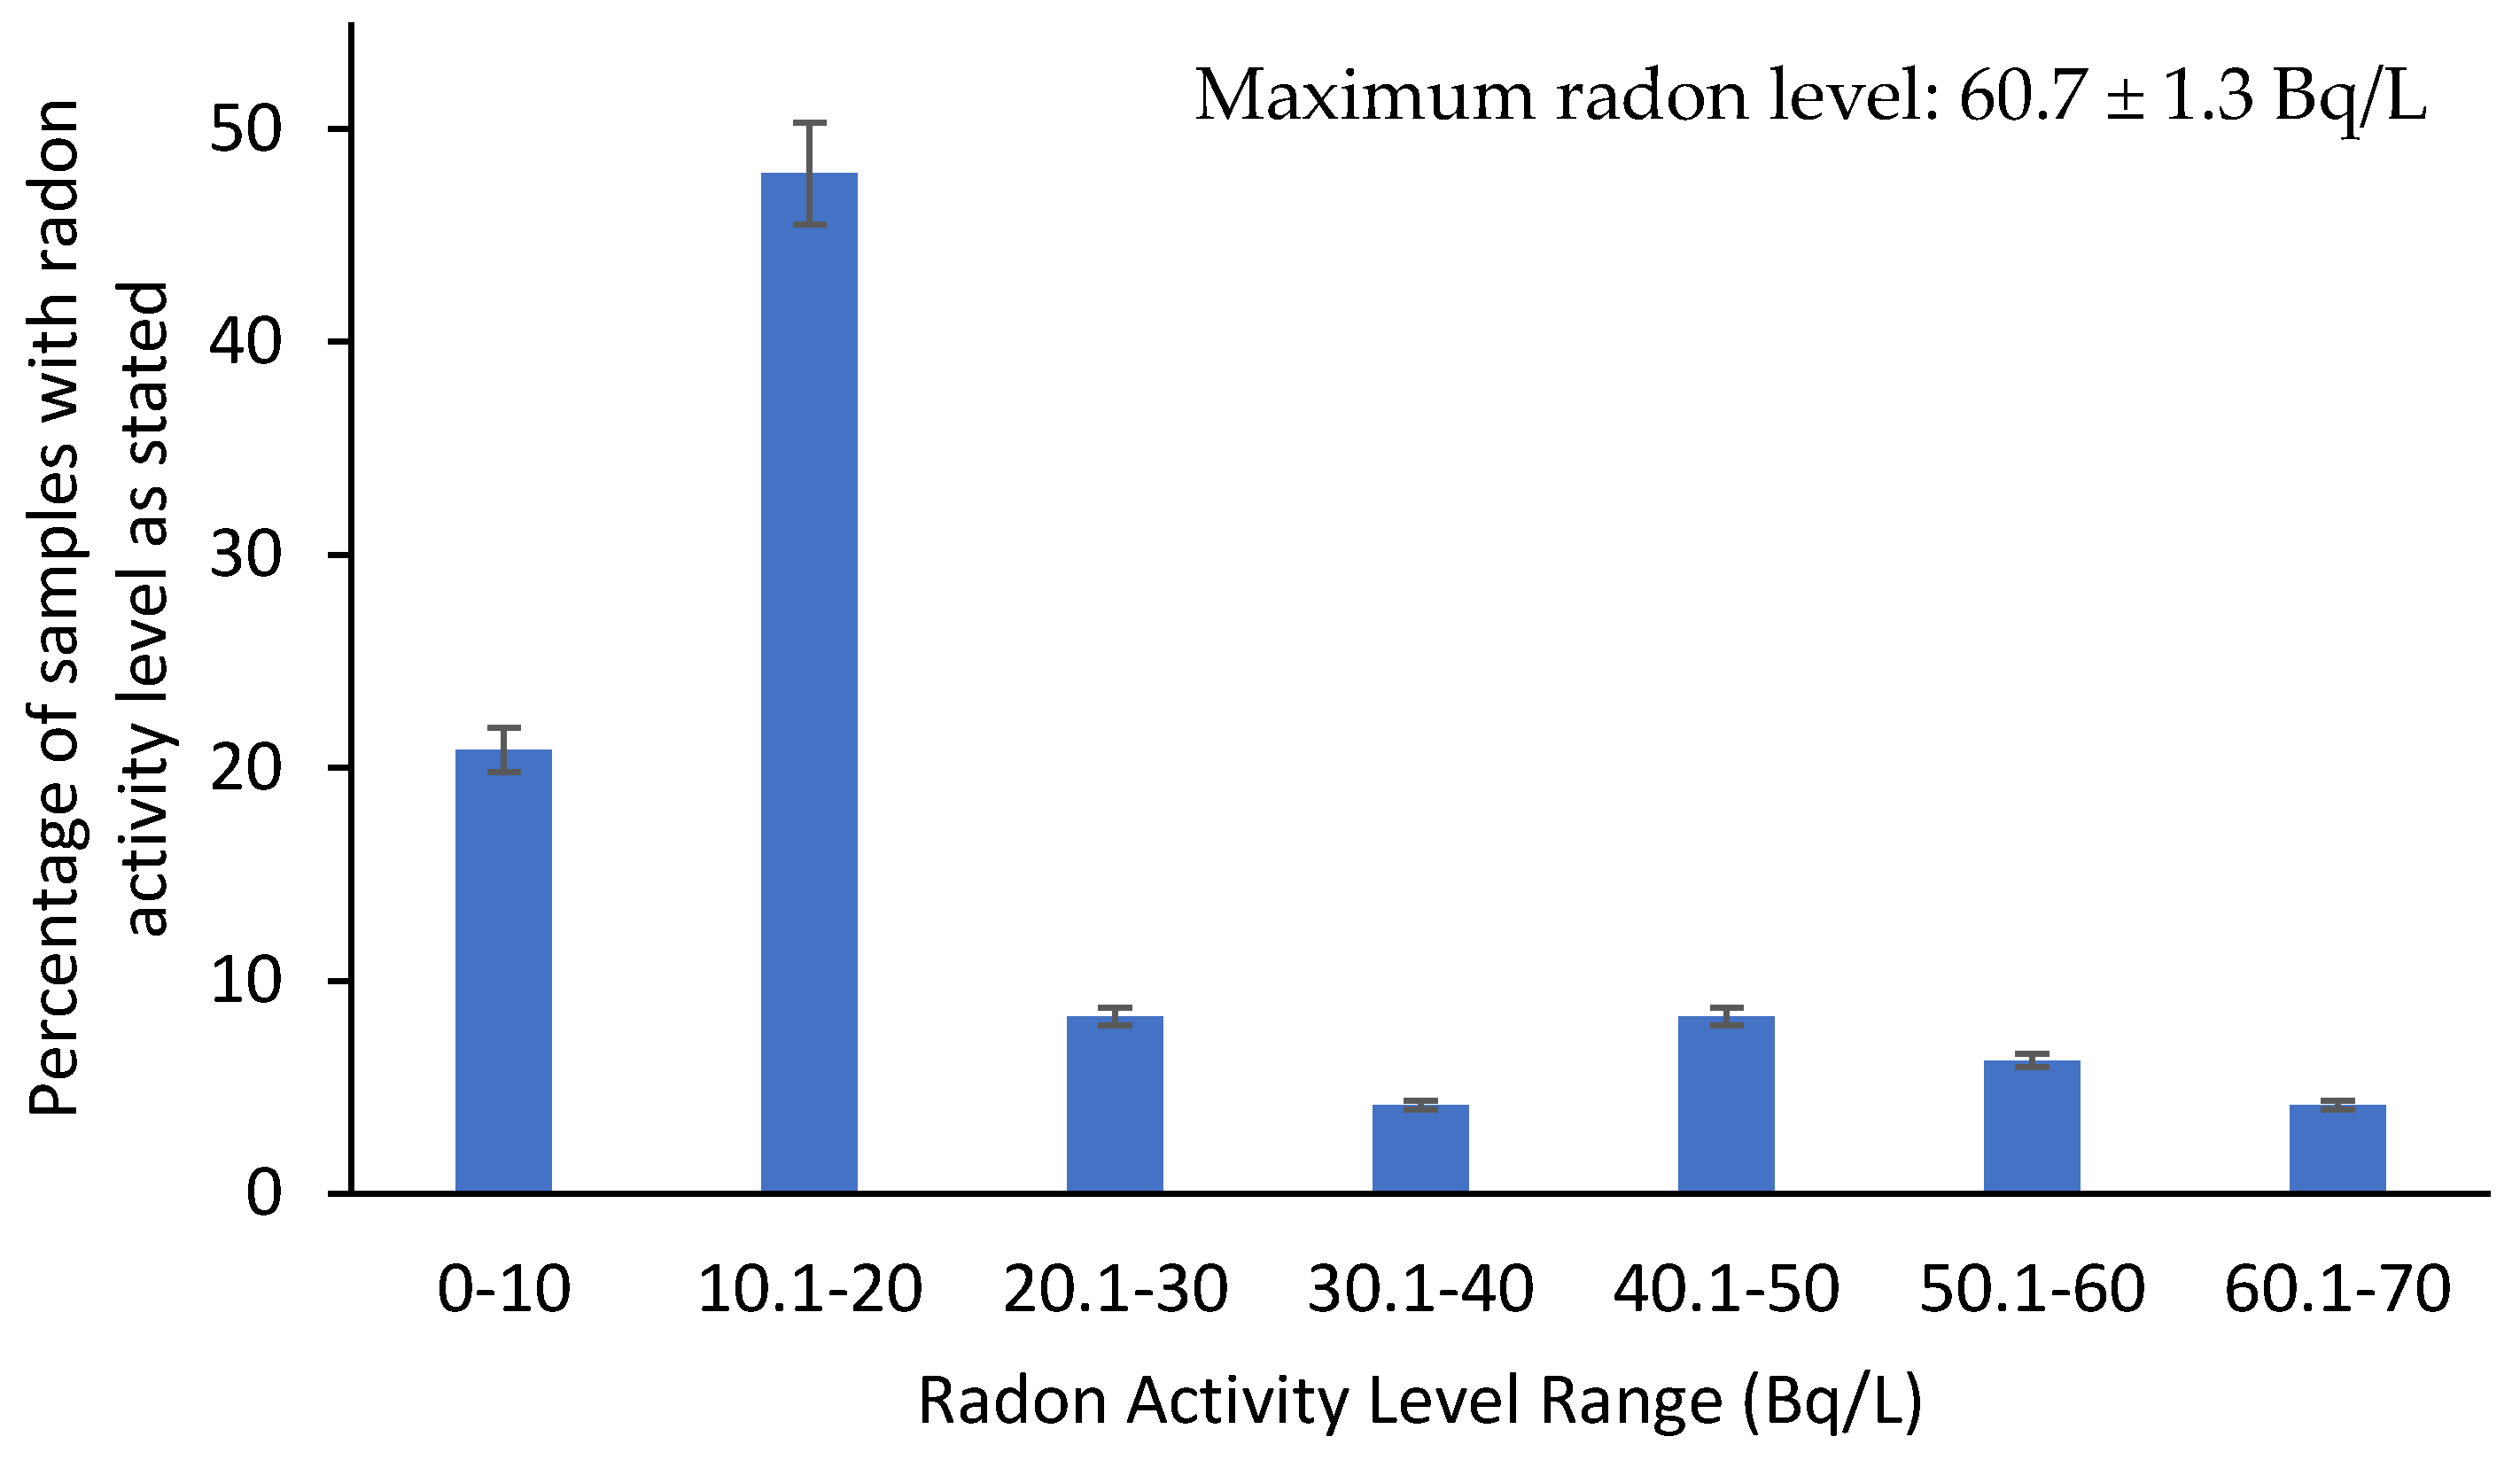
3.2. Radon Measurements

| Number of Samples Measured | 48 |
| Min | 2.710 ± 0.205 |
| Max | 60.700 ± 1.3400 |
| Mean | 20.647 |
| Standard Deviation | 15.724 |
| US EPA’s MCL Standard (Bq/L) [76] | 11 |
| Number of Exceedances | 32 |
| UNSCEAR Standard (Bq/L) [58] | 40 |
| Number of Exceedances | 8 |
| WHO Drinking Water Standard (Bq/L) [66] | 100 |
| Number of Exceedances | - |
3.3. Radiological Risk Assessment
4. Conclusions
- Forty-eight groundwater samples were collected from different parts of Qatar and analyzed for their physical parameters and radon level.
- The radon levels observed ranged between 2.710 ± 0.205 and 60.700 ± 13.400 Bq/L.
- The mean value calculated at 20.647 Bq/L is higher than the EPA’s maximum contaminant level (MCL) for radon in public drinking water of 11.1 Bq/L.
- The radon radiological hazard through inhalation is higher than the ingestion dose.
- The estimated average of the total annual effective dose due to radon inhalation and ingestion was 0.056.3 mSv/y which is well below the reference level of the WHO (0.1 mSv/y).
Author Contributions
Funding
Data Availability Statement
Acknowledgments
Conflicts of Interest
References
- Yu, K.N.; Guan, Z.J.; Stokes, M.J.; Young, E.C.M. The assessment of the natural radiation dose committed to the Hong Kong people. J. Environ. Radioact. 1992, 17, 31–48. [Google Scholar] [CrossRef]
- Omori, Y.; Hosoda, M.; Takahashi, F.; Sanada, T.; Hirao, S.; Ono, K.; Furukawa, M. Japanese population dose from natural radiation. J. Radiol. Prot. 2020, 40, R99. [Google Scholar] [CrossRef]
- Alabdula’aly, A.I. Occurrence of radon in groundwater of Saudi Arabia. J. Environ. Radioact. 2014, 138, 186–191. [Google Scholar] [CrossRef] [PubMed]
- Stoulos, S.; Manolopoulou, M.; Papastefanou, C. Assessment of natural radiation exposure and radon exhalation from building materials in Greece. J. Environ. Radioact. 2003, 69, 225–240. [Google Scholar] [CrossRef] [PubMed]
- Crameri, R.; Burkart, W. The radon problem. International Journal of Radiation Applications and Instrumentation. Part C Radiat. Phys. Chem. 1989, 34, 251–259. [Google Scholar]
- Khan, H.; Qureshi, I.; Tufail, M. Passive dosimetry of radon and its daughters using solid state nuclear track detectors (SSNTDs). Radiat. Prot. Dosim. 1993, 46, 149–170. [Google Scholar]
- Harley, N.; Samet, J.M.; Cross, F.T.; Hess, T.; Muller, J.; Thomas, D. Contribution of radon and radon daughters to respiratory cancer. Environ. Health Perspect. 1986, 70, 17–21. [Google Scholar] [CrossRef]
- Vimercati, L.; Fucilli, F.; Cavone, D.; De Maria, L.; Birtolo, F.; Ferri, G.M.; Soleo, L.; Lovreglio, P. Radon levels in indoor environments of the university hospital in Bari-Apulia region Southern Italy. Int. J. Environ. Res. Public Health 2018, 15, 694. [Google Scholar] [CrossRef]
- Landrigan, P.J.; Etzel, R.A. Textbook of Children’s Environmental Health; Oxford University Press: New York, NY, USA, 2013. [Google Scholar]
- White, S.C.; Pharoah, M.J. Oral Radiology-E-Book: Principles and Interpretation; Elsevier Health Sciences: Amsterdam, The Netherlands, 2014. [Google Scholar]
- Molinari, J.; Snodgrass, W. The chemistry and radiochemistry of radium and the other elements of the uranium and thorium natural decay series. Environ. Behav. Radium 1990, 1, 11–56. [Google Scholar]
- Little, J.B. What are the risks of low-level exposure to α radiation from radon? Proc. Natl. Acad. Sci. USA 1997, 94, 5996–5997. [Google Scholar] [CrossRef]
- Baalousha, H.; McPhee, H.; Anderson, M. Estimation of natural groundwater recharge in Qatar using GIS. In Proceedings of the MODSIM2015, 21st International Congress on Modelling and Simulation, MSSANZ, Canberra, Australia, 29 November–4 December 2015. [Google Scholar]
- Ahmad, A.Y.; Al-Ghouti, M.A.; Khraisheh, M.; Zouari, N. Hydrogeochemical characterization and quality evaluation of groundwater suitability for domestic and agricultural uses in the state of Qatar. Groundw. Sustain. Dev. 2020, 11, 100467. [Google Scholar] [CrossRef]
- Baalousha, H. Vulnerability Assessment of Groundwater Aquifers in Qatar. In Proceedings of the Qatar Foundation Annual Research Conference, Doha, Qatar, 22–23 Mar 2016; Hamad bin Khalifa University Press: Ar-Rayyan, Qatar, 2016; p. EEPP1703. [Google Scholar] [CrossRef]
- Manawi, Y.; Simson, S.; Lawler, J.; Kochkodan, V. Removal of Molybdenum from Contaminated Groundwater Using Carbide-Derived Carbon. Water 2023, 15, 49. [Google Scholar] [CrossRef]
- Baalousha, H.; Ackerer, P. Karst Aquifer in Qatar and Its Bearing on Natural Rainfall Recharge; SAO/NASA Astrophysics Data System: Hancock, IN, USA, 2017. [Google Scholar]
- Sezer, N.; Evis, Z.; Koç, M. Management of desalination brine in Qatar and the GCC countries. In Proceedings of the 10th International Conference on Sustainable Energy and Environmental Protection, Bled, Slovenia, 27–30 June 2017; pp. 105–115. [Google Scholar]
- Manawi, Y.; Kochkodan, V.; Hussein, M.A.; Khaleel, M.A.; Khraisheh, M.; Hilal, N. Can carbon-based nanomaterials revolutionize membrane fabrication for water treatment and desalination? Desalination 2016, 391, 69–88. [Google Scholar] [CrossRef]
- Baalousha, H.M.; Ouda, O.K. Domestic water demand challenges in Qatar. Arab. J. Geosci. 2017, 10, 537. [Google Scholar] [CrossRef]
- Manawi, Y.; Fard, A.K.; Hussien, M.A.; Benamor, A.; Kochkodan, V. Evaluation of the current state and perspective of wastewater treatment and reuse in Qatar. Desalination Water Treat. 2017, 71, 1–11. [Google Scholar] [CrossRef]
- Ogunbiyi, O.; Saththasivam, J.; Al-Masri, D.; Manawi, Y.; Lawler, J.; Zhang, X.; Liu, Z. Sustainable brine management from the perspectives of water, energy and mineral recovery: A comprehensive review. Desalination 2021, 513, 115055. [Google Scholar] [CrossRef]
- Manawi, Y.M.; Ihsanullah; Samara, A.; Al-Ansari, T.; Atieh, M.A. A review of carbon nanomaterials’ synthesis via the chemical vapor deposition (CVD) method. Materials 2018, 11, 822. [Google Scholar] [CrossRef]
- Manawi, Y.; Hussien, M.; Buekenhoudt, A.; Zekri, A.; Al-Sulaiti, H.; Lawler, J.; Kochkodan, V. New ceramic membrane for Phosphate and oil removal. J. Environ. Chem. Eng. 2022, 10, 106916. [Google Scholar] [CrossRef]
- Rezaei, A.; Sayadi, M.H.; Zadeh, R.J.; Mousazadeh, H. Assessing the hydrogeochemical processes through classical integration of groundwater parameters in the Birjand plain in eastern Iran. Groundw. Sustain. Dev. 2021, 15, 100684. [Google Scholar] [CrossRef]
- Jeong, J.; Choung, S.; Jeong, D.H.; Kim, M.S.; Kim, H.G.; Kim, J. Development of data-driven models for estimating the probability of high-concentration occurrence of naturally occurring radioactive materials in groundwater. J. Hydrol. 2022, 605, 127346. [Google Scholar] [CrossRef]
- Alabdula’aly, A.I. Occurrence of radon in the central region groundwater of Saudi Arabia. J. Environ. Radioact. 1999, 44, 85–95. [Google Scholar] [CrossRef]
- Aleissa, K.A.; Alghamdi, A.S.; Almasoud, F.I.; Islam, M.S. Measurement of radon levels in groundwater supplies of Riyadh with liquid scintillation counter and the associated radiation dose. Radiat. Prot. Dosim. 2013, 154, 95–103. [Google Scholar] [CrossRef]
- Althoyaib, S.; El-Taher, A. Natural radioactivity measurements in groundwater from Al-Jawa, Saudi Arabia. J. Radioanal. Nucl. Chem. 2015, 304, 547–552. [Google Scholar] [CrossRef]
- El-Taher, A. Annual Effective Dose Exposure in Groundwater from Qassim Area, Saudi. J. Environ. Sci. Technol. 2012, 5, 475–481. [Google Scholar] [CrossRef]
- Farai, I.P.; Muritala, A.A.; Oni, O.M.; Samuel, T.D.; Abraham, A. Radiological indices estimation from radon concentration in selected groundwater supplies in Abeokuta, south western Nigeria. Appl. Radiat. Isot. 2023, 191, 110534. [Google Scholar] [CrossRef] [PubMed]
- Otwoma, D.; Mustapha, A.O. Measurement of 222Rn Concentration in Kenyan Groundwater. Health Phys. 1998, 74, 91–95. [Google Scholar] [CrossRef] [PubMed]
- Al-Alawy, I.; Hasan, A. Radon Concentration And Dose Assessment In Well Water Samples From Karbala Governorate Of Iraq. J. Phys. Conf. Ser. 2018, 1003, 012117. [Google Scholar] [CrossRef]
- Kheder, M.H.; Ahmad, A.M.; Azeez, H.N.; Slewa, M.Y.; Badr, B.A.; Sleeman, S.Y. Radon and uranium concentration in ground water of nineveh plain region in iraq. J. Phys. Conf. Ser. 2019, 1234, 012033. [Google Scholar] [CrossRef]
- Ismail, N.F.; Hashim, S.; Sanusi, M.S.; Abdul Rahman, A.T.; Bradley, D.A. Radon Levels of Water Sources in the Southwest Coastal Region of Peninsular Malaysia. Appl. Sci. 2021, 11, 6842. [Google Scholar] [CrossRef]
- Xinwei, L. Analysis of radon concentration in drinking water in Baoji (China) and the associated health effects. Radiat. Prot. Dosim. 2006, 121, 452–455. [Google Scholar] [CrossRef]
- Alharbi, W.R.; Abbady, A.G.; El-Taher, A. Radon Concentrations Measurement for groundwater Using Active Detecting Method. Am. Sci. Res. J. Eng. Technol. Sci. (ASRJETS) 2015, 14, 1–11. [Google Scholar]
- Somashekar, R.; Ravikumar, P. Radon concentration in groundwater of Varahi and Markandeya river basins, Karnataka State, India. J. Radioanal. Nucl. Chem. 2010, 285, 343–351. [Google Scholar] [CrossRef]
- Elmehdi, H.M.; Dalah, E.Z.; Bakhronov, K. Measurements of Radon concentration in water in the United Arab Emirates and the associated health effects. In Proceedings of the 2019 Advances in Science and Engineering Technology International Conferences (ASET), Dubai, United Arab Emirates, 26 March–10 April 2019. [Google Scholar]
- El-Araby, E.H.; Soliman, H.A.; Abo-Elmagd, M. Measurement of radon levels in water and the associated health hazards in Jazan, Saudi Arabia. J. Radiat. Res. Appl. Sci. 2019, 12, 31–36. [Google Scholar] [CrossRef]
- Al Zabadi, H.; Musmar, S.; Issa, S.; Dwaikat, N.; Saffarini, G. Exposure assessment of radon in the drinking water supplies: A descriptive study in Palestine. BMC Res. Notes 2012, 5, 29. [Google Scholar] [CrossRef]
- Murad, A.; Alshamsi, D.; Hou, X.; Shidi, F.; Kendi, R.; Aldahan, A. Radioactivity in groundwater along the borders of Oman and UAE. J. Radioanal. Nucl. Chem. 2014, 299, 1653–1660. [Google Scholar] [CrossRef]
- Binesh, A.; Mowlavi, A.; Mohammadi, S. Estimation of the effective dose from radon ingestion and inhalation in drinking water sources of Mashhad, Iran. Iran. J. Radiat. Res. 2012, 10, 37–41. [Google Scholar]
- Rahimi, M.; Asadi Mohammad Abadi, A.; Jabari Koopaei, L. Radon concentration in groundwater, its relation with geological structure and some physicochemical parameters of Zarand in Iran. Appl. Radiat. Isot. 2022, 185, 110223. [Google Scholar] [CrossRef]
- Tawfiq, N.F. Uranium and radon concentration in ground water in Aucashat city (Iraq) and the associated health effects. Adv. Appl. Sci. Res. 2013, 4, 167–171. [Google Scholar]
- Akawwi, E. Radon-222 concentrations in the groundwater along eastern Jordan Rift. J. Appl. Sci. 2014, 14, 309–316. [Google Scholar] [CrossRef]
- Deeba, F.; Rahman, S.; Kabir, M. Assessment of Annual Effective Dose Due to Inhalation and Ingestion of Radon From Groundwater at the Southeast Coastal Area, Bangladesh. Radiat. Prot. Dosim. 2021, 194, 169–177. [Google Scholar] [CrossRef]
- Oni, O.M.; Oladapo, O.O.; Amuda, D.B.; Oni, E.A.; Olive-Adelodun, A.O.; Adewale, K.Y.; Fasina, M.O. Radon concentration in groundwater of areas of high background radiation level in southwestern Nigeria. Niger. J. Phys. 2014, 25, 64–67. [Google Scholar]
- Cosma, C.; Moldovan, M.; Dicu, T.; Kovacs, T. Radon in water from Transylvania (Romania). Radiat. Meas. 2008, 43, 1423–1428. [Google Scholar] [CrossRef]
- Cho, J.; Ahn, J.K.; Kim, H.C.; Lee, D.W. Radon concentrations in groundwater in Busan measured with a liquid scintillation counter method. J. Environ. Radioact. 2004, 75, 105–112. [Google Scholar] [CrossRef] [PubMed]
- Rangaswamy, D.R.; Srinivasa, E.; Srilatha, M.C.; Sannappa, J. Measurement of radon concentration in drinking water of Shimoga district, Karnataka, India. J. Radioanal. Nucl. Chem. 2016, 307, 907–916. [Google Scholar] [CrossRef]
- Mehra, R.; Kaur, K.; Bangotra, P. Annual effective dose of radon due to exposure in indoor air and groundwater in Bathinda district of Punjab. Indoor Built Environ. 2015, 25, 848–856. [Google Scholar] [CrossRef]
- El-Sharkawy, A.; Al-Ghamdi, H. Study of the Presence of Radon in Groundwater from Two Regions in Saudi Arabia. J. Water Resour. Prot. 2018, 10, 654. [Google Scholar] [CrossRef]
- Al Sulaiti, H.; Regan, P.; Bradley, D.; Matthews, M.; Santawamaitre, T.; Malain, D. Preliminary Determination of Natural Radioactivity Levels of the State of Qatar using High-Resolution Gamma-ray Spectrometry. In Proceedings of the IX Radiation Physics & Protection Conference, Cairo, Egypt, 15–19 November 2008; pp. 213–223. [Google Scholar]
- Al-Sulaiti, H.; Regan, P.H.; Bradley, D.A.; Malain, D.; Santawamaitre, T.; Habib, A.; Matthews, M.; Bukhari, S.; Al-Dosari, M. A preliminary report on the determination of natural radioactivity levels of the State of Qatar using high-resolution gamma-ray spectrometry. Nucl. Instrum. Methods Phys. Res. Sect. A Accel. Spectrometers Detect. Assoc. Equip. 2010, 619, 427–431. [Google Scholar] [CrossRef]
- Schlumberger Water Services. Studying & Developing the Natural & Artficial Recharge of the Groundwater Aquifer in the State of Qatar—Project Final Report; Ministry of Enivronment (MoE)–Department of Agricultural and Water Research (DAWR): Doha, Qatar, 2009; pp. 1–132. [Google Scholar]
- Charles, M. UNSCEAR Report 2000: Sources and Effects of Ionizing Radiation. J. Radiol. Prot. 2001, 21, 83. [Google Scholar] [CrossRef]
- UNSCEAR. Sources and Effects of Ionizing Radiation; United Nations: New York, NY, USA, 2000. [Google Scholar]
- Sallam, G.A.; Elsayed, E. Estimating relations between temperature, relative humidity as independed variables and selected water quality parameters in Lake Manzala, Egypt. Ain Shams Eng. J. 2018, 9, 1–14. [Google Scholar] [CrossRef]
- Fountain, M.; Kurath, D.; Sevigny, G.; Poloski, A.; Pendleton, J.; Balagopal, S.; Quist, M.; Clay, D. Caustic Recycle from Hanford Tank Waste Using NaSICON Ceramic Membranes. Sep. Sci. Technol. 2008, 43, 2321–2342. [Google Scholar] [CrossRef]
- Hassen, T.B.; El Bilali, H. Water management in the gulf cooperation Council: Challenges and prospects. Curr. Dir. Water Scarcity Res. 2022, 5, 525–540. [Google Scholar]
- Jakovovic, D.; Werner, A.D.; de Louw, P.G.; Post, V.E.; Morgan, L.K. Saltwater upconing zone of influence. Adv. Water Resour. 2016, 94, 75–86. [Google Scholar] [CrossRef]
- United Nations Economic and Social Commission for Western Asia. Upconing Definition; United Nations Economic and Social Commission for Western Asia: Beirut, Lebanon, 2012. [Google Scholar]
- Werner, A.D.; Bakker, M.; Post, V.E.; Vandenbohede, A.; Lu, C.; Ataie-Ashtiani, B.; Simmons, C.T.; Barry, D.A. Seawater intrusion processes, investigation and management: Recent advances and future challenges. Adv. Water Resour. 2013, 51, 3–26. [Google Scholar] [CrossRef]
- Shomar, B. Geochemistry of soil and groundwater in arid regions: Qatar as a case study. Groundw. Sustain. Dev. 2015, 1, 33–40. [Google Scholar] [CrossRef]
- Edition, F. Guidelines for drinking-water quality. WHO Chron. 2011, 38, 104–108. Available online: https://www.scirp.org/(S(i43dyn45te-exjx455qlt3d2q))/reference/referencespapers.aspx?referenceid=2162190 (accessed on 17 October 2023).
- Matiullah, M.; Ahad, A.; Faheem, M.; Nasir, T.; Rahman, S. Measurement of radioactivity in vegetation of the Bahawalpur Division and Islamabad federal capital territory—Pakistan. Radiat. Meas. 2008, 43, S532–S536. [Google Scholar] [CrossRef]
- Ahmad, N.; Khatibeh, A.; Ma’ly, A.; Kenawy, M. Measurement of natural radioactivity in Jordanian sand. Radiat. Meas. 1997, 28, 341–344. [Google Scholar] [CrossRef]
- United Nations Scientific Committee on the Effects of Atomic Radiation. Sources and Effects of Ionizing Radiation, United Nations Scientific Committee on the Effects of Atomic Radiation (UNSCEAR) 2000 Report, Volume I: Report to the General Assembly, with Scientific Annexes-Sources; United Nations: New York, NY, USA, 2000. [Google Scholar]
- Bou-Rabee, F. Soil radioactivity atlas of Kuwait. Environ. Int. 1997, 23, 5–15. [Google Scholar] [CrossRef]
- Saad, H.; Al-Azmi, D. Radioactivity concentrations in sediments and their correlation to the coastal structure in Kuwait. Appl. Radiat. Isot. 2002, 56, 991–997. [Google Scholar] [CrossRef]
- Alazemi, N.; Bajoga, A.; Bradley, D.; Regan, P.; Shams, H. Soil radioactivity levels, radiological maps and risk assessment for the state of Kuwait. Chemosphere 2016, 154, 55–62. [Google Scholar] [CrossRef]
- Al-Kinani, A.T.; Hushari, M.; Alsadig, I.A.; Al-Sulaiti, H. NORM in soil and sludge samples in Dukhan oil Field, Qatar state. Donnish J. Res. Environ. Stud. 2015, 2, 37–43. [Google Scholar]
- Hahn, E.J.; Gokun, Y.; Andrews, W.M., Jr.; Overfield, B.L.; Robertson, H.; Wiggins, A.; Rayens, M.K. Radon potential, geologic formations, and lung cancer risk. Prev. Med. Rep. 2015, 2, 342–346. [Google Scholar] [CrossRef] [PubMed]
- Tayyeb, Z.A.; Kinsara, A.R.; Farid, S.M. A study on the radon concentrations in water in Jeddah (Saudi Arabia) and the associated health effects. J. Environ. Radioact. 1998, 38, 97–104. [Google Scholar] [CrossRef]
- U.S. Environmental Protection Agency. National Primary Drinking Water Regulations; U.S. Environmental Protection Agency: Washington, DC, USA, 2011. Available online: https://www.epa.gov/dwreginfo/drinking-water-regulations#List (accessed on 17 October 2023).
- Till, J.E.; Grogan, H.A. Radiological Risk Assessment and Environmental Analysis; Oxford University Press: Oxford, UK, 2008. [Google Scholar]
- Fatima, I.; Zaidi, J.H.; Arif, M.; Tahir, S.N.A. Measurement of natural radioactivity in bottled drinking water in Pakistan and consequent dose estimates. Radiat. Prot. Dosim. 2006, 123, 234–240. [Google Scholar] [CrossRef]


| Country | Radon Level (Bq/L) | Annual Mean Effective Dose (μSv/y) | Reference |
|---|---|---|---|
| Saudi Arabia | 0.8–9.1 | 2.8–33.4 | [37] |
| China | 12–41 | 30–140 | [36] |
| India | 0.2–27.3 | 0.73–99.7 | [38] |
| Saudi Arabia | 5.5–11 | [53] | |
| United Arab Emirates | 0.05–1.8 | 22.7 | [39] |
| Saudi Arabia | 1.45–9.15 | [29] | |
| Saudi Arabia | 0.9–35.4 | 17 | [27] |
| Saudi Arabia | 1.7–4.3 | 28.9 ± 2.12 | [40] |
| Saudi Arabia | 0.04–67.4 | [3] | |
| Iraq | 2–4.1 | 7.9–15. | [33] |
| Palestine | 1.5–23.4 | [41] | |
| UAE and Oman | 0.2–17 | [42] | |
| Iran | 0.5–49 | 40–43 | [43] |
| Iran | 4.7–31.5 | [44] | |
| Iraq | 8.02–11.7 | 309–451 | [45] |
| Jordan | 6.2 | [46] | |
| Iraq | 0.36–1.5 | [34] | |
| Bangladesh | 0.36–15.7 | 1.0–42.9 | [47] |
| Malaysia | 7.4–89.1 | 0–39.2 | [35] |
| Nigeria | 0.95–112 | [48] | |
| Romania | 0.5–129.3 | [49] | |
| South Korea | 0–300 | [50] | |
| Kenya | 0–371 | [32] |
| Well ID | pH | EC (mS/cm) | TDS (mg/L) |
|---|---|---|---|
| 592 | 7.99 ± 0.31 | 3.68 ± 0.23 | 2392 ± 150 |
| 661 | 7.74 ± 0.11 | 6.60 ± 0.02 | 4620 ± 14 |
| 677 | 7.77 ± 0.04 | 6.84 ± 0.08 | 4785 ± 53 |
| 819 | 7.58 ± 0.13 | 10.88 ± 0.02 | 7616 ± 14 |
| 903 | 7.79 ± 0.00 | 6.66 ± 0.11 | 4659 ± 74 |
| 1224 | 6.24 ± 0.65 | 41.70 ± 20.85 | 14,595 ± 146 |
| 1272 | 7.80 ± 0.15 | 5.23 ± 0.10 | 3658 ± 67 |
| 1449 | 7.82 ± 0.15 | 4.13 ± 0.08 | 2680 ± 51 |
| 1574 | 7.72 ± 0.04 | 2.50 ± 0.06 | 1625 ± 39 |
| 1762 | 7.82 ± 0.10 | 1.32 ± 0.05 | 711.7 ± 34 |
| 1803 | 6.82 ± 0.79 | 26.15 ± 2.15 | 18,305 ± 1505 |
| 1891 | 7.95 ± 0.19 | 1.64 ± 0.04 | 1068 ± 24 |
| 1993 | 7.96 ± 0.14 | 3.29 ± 0.03 | 2135 ± 23 |
| 2049 | 6.36 ± 2.75 | 36.63 ± 21.87 | 25,641 ± 1530 |
| 2121 | 7.44 ± 0.09 | 19.43 ± 0.05 | 13,601 ± 35 |
| 2217 | 7.84 ± 0.00 | 6.56 ± 0.04 | 4592 ± 28 |
| 2242 | 7.48 ± 0.38 | 3.35 ± 0.01 | 2178 ± 6.5 |
| 2357 | 7.83 ± 0.05 | 2.61 ± 0.06 | 1693 ± 34 |
| 2534 | 8.01 ± 0.12 | 1.34 ± 0.01 | 874 ± 9.1 |
| 2626 | 7.79 ± 0.09 | 6.11 ± 0.08 | 4277 ± 56 |
| 2709 | 7.54 ± 0.00 | 25.40 ± 0.10 | 17,780 ± 70 |
| 2874 | 7.90 ± 0.06 | 1.80 ± 0.02 | 1169 ± 12 |
| 2940 | 7.80 ± 0.08 | 4.25 ± 0.02 | 2760 ± 16 |
| 2990 | 7.80 ± 0.00 | 4.26 ± 0.14 | 2767 ± 88 |
| 3001 | 7.75 ± 0.02 | 4.86 ± 0.06 | 3159 ± 39 |
| 3189 | 7.74 ± 0.02 | 12.73 ± 0.20 | 8911 ± 140 |
| 3233 | 7.64 ± 0.02 | 10.56 ± 0.08 | 7390 ± 53 |
| 3266 | 7.71 ± 0.07 | 2.26 ± 0.09 | 1414 ± 6 |
| 3279 | 6.41 ± 3.21 | 4.35 ± 2.18 | 1413 ± 14.1 |
| 3327 | 7.44 ± 0.25 | 12.32 ± 0.37 | 8624 ± 259 |
| 3518 | 7.77 ± 0.12 | 3.68 ± 0.07 | 2389 ± 42 |
| 3800 | 7.75 ± 0.13 | 2.49 ± 0.09 | 1615 ± 55 |
| 3890 | 7.79 ± 0.08 | 9.62 ± 0.14 | 6730 ± 95 |
| 4083 | 7.97 ± 0.13 | 4.86 ± 0.05 | 3159 ± 33 |
| 4290 | 7.86 ± 0.09 | 2.55 ± 0.03 | 1658 ± 20 |
| 4473 | 7.82 ± 0.02 | 13.80 ± 0.19 | 9660 ± 133 |
| 4549 | 7.93 ± 0.10 | 2.95 ± 0.22 | 1918 ± 143 |
| 5146 | 7.93 ± 0.21 | 3.19 ± 0.07 | 2073 ± 46 |
| 5162 | 7.73 ± 0.30 | 6.94 ± 0.01 | 4858 ± 7 |
| 5551 | 7.79 ± 0.09 | 8.92 ± 0.01 | 6240 ± 10.5 |
| 5754 | 7.77 ± 0.11 | 5.22 ± 0.04 | 3651 ± 31.5 |
| 5799 | 7.65 ± 0.06 | 9.08 ± 0.14 | 6352 ± 95 |
| 6055 | 7.64 ± 0.03 | 19.42 ± 0.21 | 13,591 ± 144 |
| 6191 | 7.87 ± 0.07 | 7.80 ± 0.04 | 5465 ± 32 |
| 6199 | 7.83 ± 0.04 | 12.85 ± 0.06 | 8995 ± 42 |
| 6555 | 7.82 ± 0.06 | 11.46 ± 0.19 | 8019 ± 130 |
| 7418 | 7.34 ± 0.12 | 45.05 ± 0.25 | 31,535 ± 175 |
| 7584 | 7.82 ± 0.18 | 7.87 ± 0.04 | 5510 ± 50 |
| 8019 | 7.74 ± 0.03 | 4.61 ± 0.07 | 2993 ± 49 |
| Statistical Analysis | |||
| Min | 6.24 | 1.32 | 711.7 |
| Max | 8.01 | 45.05 | 31,535 |
| Mean | 7.65 | 9.42 | 6094 |
| Standard Deviation | 0.40 | 9.91 | 732 |
| Category | TDS (mg/L) |
|---|---|
| Desirable for drinking | <500 |
| Permissible for drinking | 500–1000 |
| Useful for irrigation | 1000–3000 |
| Unfit for drinking and irrigation | >3000 |
| Very saline | >9000 |
| Well Code | Radon Bq/L | Well Code | Radon Bq/L |
|---|---|---|---|
| 592 | 5.57 ± 0.64 | 3001 | 55.50 ± 1.40 |
| 661 | 16.50 ±0.22 | 3189 | 7.550 ± 1.720 |
| 677 | 5.16 ± 0.69 | 3233 | 11.00 ± 1.710 |
| 819 | 41.90 ± 2.81 | 3266 | 21.200 ± 2.070 |
| 903 | 2.71 ± 0.20 | 3279 | 20.900 ± 0.907 |
| 1224 | 52.40 ± 2.63 | 3327 | 8.550 ± 0.217 |
| 1272 | 12.40 ± 1.50 | 3518 | 12.600 ± 0.422 |
| 1574 | 28.90 ± 0.925 | 3800 | 14.500 ± 1.120 |
| 1762 | 45.30 ± 1.32 | 3890 | 16.100 ± 0.970 |
| 1803 | 11.900 ± 0.948 | 4083 | 18.300 ± 1.880 |
| 1891 | 58.800 ± 2.760 | 4290 | 17.400 ± 1.790 |
| 1993 | 49.400 ± 4.010 | 4473 | 18.500 ± 1.100 |
| 2049 | 60.700 ± 13.400 | 4549 | 9.00 ± 0.441 |
| 2121 | 9.870 ± 0.889 | 5146 | 17.700 ± 2.540 |
| 2217 | 6.900 ± 0.764 | 5162 | 15.600 ± 1.560 |
| 2242 | 14.400 ± 1.380 | 5551 | 39.100 ± 3.220 |
| 2357 | 10.500 ± 0.563 | 5754 | 15.300 ± 1.910 |
| 2534 | 11.00 ± 2.370 | 5799 | 14.500 ± 1.250 |
| 2537 | 10.50 ± 2.370 | 6055 | 15.600 ± 0.485 |
| 2626 | 4.870 ± 0.623 | 6191 | 18.900± 1.040 |
| 2709 | 10.800 ± 1.110 | 6199 | 17.200 ± 1.840 |
| 2874 | 37.200 ± 2.860 | 6555 | 7.500± 0.665 |
| 2940 | 44.00 ± 2.240 | 7418 | 8.590 ± 0.999 |
| 2990 | 27.20 ± 1.40 | 8019 | 11.100 ± 1.030 |
| Well Code | Radon (Bq/L) | Annual Mean Effective Dose (µSv/y) | ||
|---|---|---|---|---|
| Ingestion | Inhalation | Total | ||
| 592 | 5.57 | 1.17 | 14.04 | 15.21 |
| 661 | 16.50 | 3.47 | 41.58 | 45.05 |
| 677 | 5.16 | 1.08 | 13.00 | 14.09 |
| 819 | 41.90 | 8.80 | 105.59 | 114.39 |
| 903 | 2.71 | 0.57 | 6.83 | 7.40 |
| 1224 | 52.40 | 11.00 | 132.05 | 143.05 |
| 1272 | 12.40 | 2.60 | 31.25 | 33.85 |
| 1574 | 28.90 | 6.07 | 72.83 | 78.90 |
| 1762 | 45.30 | 9.51 | 114.16 | 123.67 |
| 1803 | 11.90 | 2.50 | 29.99 | 32.49 |
| 1891 | 58.80 | 12.35 | 148.18 | 160.52 |
| 1993 | 49.40 | 10.37 | 124.49 | 134.86 |
| 2049 | 60.70 | 12.75 | 152.96 | 165.71 |
| 2121 | 9.87 | 2.07 | 24.87 | 26.95 |
| 2217 | 6.90 | 1.45 | 17.39 | 18.84 |
| 2242 | 14.40 | 3.02 | 36.29 | 39.31 |
| 2357 | 10.50 | 2.21 | 26.46 | 28.67 |
| 2534 | 11.00 | 2.31 | 27.72 | 30.03 |
| 2537 | 10.50 | 2.21 | 26.46 | 28.67 |
| 2626 | 4.87 | 1.02 | 12.27 | 13.30 |
| 2709 | 10.80 | 2.27 | 27.22 | 29.48 |
| 2874 | 37.20 | 7.81 | 93.74 | 101.56 |
| 2940 | 44.00 | 9.24 | 110.88 | 120.12 |
| 2990 | 27.20 | 5.71 | 68.54 | 74.26 |
| 3001 | 55.50 | 11.66 | 139.86 | 151.52 |
| 3189 | 7.55 | 1.59 | 19.03 | 20.61 |
| 3233 | 11.00 | 2.31 | 27.72 | 30.03 |
| 3266 | 21.20 | 4.45 | 53.42 | 57.88 |
| 3279 | 20.90 | 4.39 | 52.67 | 57.06 |
| 3327 | 8.55 | 1.80 | 21.55 | 23.34 |
| 3518 | 12.60 | 2.65 | 31.75 | 34.40 |
| 3800 | 14.50 | 3.05 | 36.54 | 39.59 |
| 3890 | 16.10 | 3.38 | 40.57 | 43.95 |
| 4083 | 18.30 | 3.84 | 46.12 | 49.96 |
| 4290 | 17.40 | 3.65 | 43.85 | 47.50 |
| 4473 | 18.50 | 3.89 | 46.62 | 50.51 |
| 4549 | 9.00 | 1.89 | 22.68 | 24.57 |
| 5146 | 17.70 | 3.72 | 44.60 | 48.32 |
| 5162 | 15.60 | 3.28 | 39.31 | 42.59 |
| 5551 | 39.10 | 8.21 | 98.53 | 106.74 |
| 5754 | 15.30 | 3.21 | 38.56 | 41.77 |
| 5799 | 14.50 | 3.05 | 36.54 | 39.59 |
| 6055 | 15.60 | 3.28 | 39.31 | 42.59 |
| 6191 | 18.90 | 3.97 | 47.63 | 51.60 |
| 6199 | 17.20 | 3.61 | 43.34 | 46.96 |
| 6555 | 7.50 | 1.58 | 18.90 | 20.48 |
| 7418 | 8.59 | 1.80 | 21.65 | 23.45 |
| 8019 | 11.10 | 2.33 | 27.97 | 30.30 |
| Statistical Analysis | ||||
| Min | 0.57 | 6.83 | 7.40 | |
| Max | 12.75 | 152.96 | 165.71 | |
| Mean | 4.34 | 52.03 | 56.37 | |
| Standard Deviation | 3.30 | 39.62 | 42.93 | |
Disclaimer/Publisher’s Note: The statements, opinions and data contained in all publications are solely those of the individual author(s) and contributor(s) and not of MDPI and/or the editor(s). MDPI and/or the editor(s) disclaim responsibility for any injury to people or property resulting from any ideas, methods, instructions or products referred to in the content. |
© 2023 by the authors. Licensee MDPI, Basel, Switzerland. This article is an open access article distributed under the terms and conditions of the Creative Commons Attribution (CC BY) license (https://creativecommons.org/licenses/by/4.0/).
Share and Cite
Manawi, Y.; Ahmad, A.; Subeh, M.; Hushari, M.; Bukhari, S.; Al-Sulaiti, H. Evaluation of the Radon Levels in the Groundwater Wells of Qatar: Radiological Risk Assessment. Water 2023, 15, 4026. https://doi.org/10.3390/w15224026
Manawi Y, Ahmad A, Subeh M, Hushari M, Bukhari S, Al-Sulaiti H. Evaluation of the Radon Levels in the Groundwater Wells of Qatar: Radiological Risk Assessment. Water. 2023; 15(22):4026. https://doi.org/10.3390/w15224026
Chicago/Turabian StyleManawi, Yehia, Ayesha Ahmad, Mosab Subeh, Mohammad Hushari, Sayed Bukhari, and Huda Al-Sulaiti. 2023. "Evaluation of the Radon Levels in the Groundwater Wells of Qatar: Radiological Risk Assessment" Water 15, no. 22: 4026. https://doi.org/10.3390/w15224026