Article

Study on the Cavitation Characteristics of Shroud Clearance in Prototype and Model of a Kaplan Turbine

1
College of Water Resources and Civil Engineering, China Agricultural University, Beijing 100083, China
2
Guangxi Datengxia Gorge Water Conservancy Development Co., Ltd., Guiping 537226, China
3
Beijing Engineering Research Center of Safety and Energy Saving Technology for Water Supply Network System, Beijing 100083, China
4
State Key Laboratory of Hydroscience and Engineering, Department of Energy and Power Engineering, Tsinghua University, Beijing 100084, China
*
Author to whom correspondence should be addressed.
Water 2023, 15(22), 3960; https://doi.org/10.3390/w15223960
Submission received: 9 October 2023 / Revised: 9 November 2023 / Accepted: 10 November 2023 / Published: 14 November 2023
(This article belongs to the Special Issue Advances in Hydrodynamics of Water Pump Station System)

Abstract

:
Model tests and model calculations are the most basic means currently available to study the characteristics of the axial-flow pumps and Kaplan turbines in a systematic manner. Large and medium-sized turbine units and axial-flow pumps must rely on model tests and model calculations to ensure the performances of prototype units before designing. The conversions between models and prototypes are mainly carried out through similarity criteria. However, it is difficult to meet all the similarity criteria in the model tests and the similarity conversions, and the hydraulic and cavitation performances of the model and the prototype are often different. In this paper, numerical calculations of shroud clearance cavitation are performed on both the prototype and model using different cavitation coefficients. The results indicate that the prototype and model have a similar clearance cavitation flow regularity when the cavitation coefficient changes, but they have different energy characteristics and cavitation characteristics. In cavitation conditions, the prototype has higher energy characteristics than the model and the critical cavitation coefficient is similar to the model. When the cavitation coefficient is higher than the critical cavitation coefficient, compared to the model, the blade cavitation performance of the prototype is worse, and the clearance cavitation and runner chamber cavitation are more serious. If the cavitation coefficient decreases to the device cavitation coefficient, the runner chamber of the prototype will cavitate, even though the model has not cavitated yet. The comparison of shroud clearance cavitation between the prototype and the model can be used as a reference for the accuracy of similarity conversion results between the model and the prototype. It also has a positive impact on the design and operation of the prototype.

1. Introduction

Cavitation performance is one of the key indicators to evaluate the overall performance of turbine units. Problems caused by cavitation, such as degradation of hydraulic performance, cavitation wear of overcurrent components, and vibration intensification, have been becoming major problems in unit operation [1]. In the Kaplan turbine, the leakage flow and vortex flow in the runner clearance region are very complicated because of the influence of the double coordination of the guide vane and blade, and the clearance cavitation forms are various [2]. Clearance cavitation will not only reduce the hydraulic performance and efficiency of the unit [3] and induce low-pressure pulsation [4] but also cause cavitation damage at the runner chamber, runner hub, and blade tip [5]. Although the damage scope is generally small, the degree of damage is serious. Therefore, it is important to focus on the flow and cavitation characteristics in the shroud clearance region before designing the prototype unit for production.
Model tests and calculations are the most basic means of studying the flow of shroud clearance. Xiao et al. [6] found that the clearance leakage vortex is the main reason for the highest total pressure drop and the highest total pressure loss in an axial turbine runner by the experiment, and the lowest pressure occurs in the region of clearance leakage vortex. Amiri et al. [7] tested and found that the clearance leakage flow enhances the velocity pulsation from the leading edge to the middle on the suction surface of the blade. Ma et al. [8] simulated the shroud clearance flow of a Kaplan turbine, and the results show that increasing the shroud clearance can reduce the cavitation performance in the region of the blade tip, near the blade tip on the suction surface, and the middle on the suction of the blade. In the tubular turbine, increasing the clearance not only enhances the pressure pulsation in the region of the blade tip but also the bladeless region between the runner and the guide vane [9]. Additionally, some scholars have conducted numerical simulations of the shroud clearance flow, and the simulation results are in good agreement with the experimental results [10,11,12,13].
The model tests and the model numerical simulations have improved the understanding of the shroud clearance flow and provided a reference for the prototype. However, some prototype units still have problems such as clearance cavitation in the actual operation, which is because the characteristics of the prototype are predicted by the similarity conversion. The model and prototype should strictly meet all the similarity criteria to fully reflect the actual working conditions of the prototype unit. However, in engineering practice, it is impossible to meet all the similarity criteria simultaneously, and the model test can only approximate the flow of the prototype [14]. To improve the accuracy of the characteristics of the prototype, many scholars have revised the similarity conversion formulas. Some scholars such as Osterwalder [15], Zheng [16], Hutton [17], and Ida et al. [18,19,20] have revised the conversion formula for hydraulic efficiency. Chen et al. [21] analyzed a variety of hydraulic efficiency conversion formulas and found significant differences among them, which had certain applicability and limitations. The correction of the cavitation scale effect has been studied by some scholars. McCormick [22] found that the critical cavitation coefficient is influenced by the Reynolds number and angle of attack when the wing shape is consistent. Based on the assumption that the initial cavitation coefficient of the vortex is proportional to the density of the boundary layer on the compression surface of the hydrofoil, the scale correction model of the cavitation coefficient is established. Ren et al. [23] proposed that, in addition to the diameter of the runner, the head of the unit, Reynolds number, air content in water, water quality factors such as the radius of air nuclei in water, and the tensile strength of water would also affect the scale effect of cavitation, and provided a corresponding correction formula for the scale effect of cavitation. Ni [24] proposed the relationship of the incipient cavitation coefficient between the prototype and the model based on the cavitation dynamics equation, but also emphasized the deficiencies in the process of deduction. Despite the many similar conversion correction formulas between the prototype and model, the results obtained from different correction formulas differ significantly. The same correction formula is not applicable to all hydraulic machines. To establish the conversion relationship between the prototype and the model as accurately as possible, it is necessary to fully understand the differences between the prototype and the model.
In recent years, many scholars have started to improve their understanding of the differences between prototypes and models by comparing both results. Angulo et al. [25] compared the prototype and model cavitation tests of Kaplan turbines and proposed that the model test was consistent with the results of the prototype test in the time and frequency domains, and analyzed the reasons for the differences between test results from the aspects of scale effect and test techniques. In addition, Angulo et al. [26] also conducted air injection tests on the prototype and model of the Kaplan turbine, aiming to evaluate the effect of air injection on reducing pressure pulsation. The beneficial effect of air injection was predicted in both model and prototype tests. However, the prediction effect of the model is relatively weak, and the efficiency loss was overestimated in model tests. The hydraulic performance of the prototype and model in the bucket turbine was predicted using the numerical simulation method by Zeng et al. [27]. The results showed that the hydraulic performance differences between the prototype and the model mainly occurred during the high torque and torque decline stages. Li et al. [28] performed a pump-turbine simulation and discovered that the pressure pulsation of the prototype and the model in the rotor–stator interaction region exhibited a high resemblance. However, the similarity between the two in the downstream of the rotor–stator interaction region and the tailpipe region would be greatly weakened. The results of the model were not sufficient to support the operation of the prototype at this time.
To conclude, it is still challenging to accurately predict the clearance cavitation flow characteristics of the prototype. A complete understanding of the clearance cavitation flow characteristics of the prototype and the model is required. At present, numerical simulation of the prototype and the model is an effective means of understanding the differences between them. Therefore, this paper studies the clearance cavitation flow characteristics of the prototype and the model for the Kaplan turbine by numerical simulation. The differences in the clearance cavitation flow obtained in this paper confirm that model testing or numerical simulation alone cannot accurately predict the cavitation characteristics of the prototype. And the cavitation margin of the prototype still needs to be taken into account. Furthermore, the results of this paper can be used as a reference to correct the similarity conversion formulas between the prototype and the model in the Kaplan turbine.

2. Research Object and Methodology

2.1. Numerical Techniques

The cavitation flow in the Kaplan turbine is simulated by the commercial Computational Fluid Dynamics (CFD) software ANSYS CFX 19.2 (Ansys, Inc., Canonsburg, PA, USA). The fluid in the cavitation flow field is considered a mixture of water and water vapor. The mixture is assumed to be homogeneous in this paper. The continuity equation, the momentum equation, and the mass-transport equation for the homogeneous flow are as follows:
ρ m t + ( ρ m u j ) x j = 0
( ρ m u i ) t + ( ρ m u i u j ) x j = p x i + x j ( μ m + μ t ) u i x j + u j x i 2 3 u k x k δ i j
t α l ρ l + x j α l ρ l u j = m
where ρm and μm can be calculated respectively by Formulas (4) and (5):
ρ m = α l ρ l + ρ v 1 α l
μ m = α l μ l + μ v 1 α l
In Formulas (1) to (5), ρm represents the density of the mixture; ρl and ρv represent the component densities of the water and water vapor, respectively; μm represents the dynamic viscosity of the mixture; μl and μv represent the component dynamic viscosity of the water and water vapor, respectively; αl represents the component volume fraction of the water; ua (a = i, j, k; i, j, k = 1, 2, 3) represent the three direction components of the velocity in the Cartesian coordinate system; xa represent the coordinates; p represents the static pressure; μt represents the turbulent viscosity; δ i j represents the Kronecker delta (if i = j, δ i j = 1 ; if ij, δ i j = 0 ); and m represents the source terms of cavitation, which is used to control the mass transfer rate between the water vapor phase and the water phase.
In the calculation of the cavitation flow field, the turbulence and cavitation models are established to close the equations. The various turbulence models and their advantages and disadvantages in simulating clearance flow are introduced in detail in reference [29]. The SST-CC turbulence model can be used to accurately predict the rotation and streamline curvature characteristics of the clearance leakage vortex flow and the leakage vortex cavitation flow [29]. Therefore, the SST-CC turbulence model is used in this paper. The Zwart–Gerber–Belamri (ZGB) cavitation model is also used for simulation. The ZGB cavitation model has good compatibility with various turbulence models and can be selected directly in ANSYS CFX software 19.2.

2.2. Object of Study

The study is focused on the prototype and model of a Kaplan turbine, with the model being created by scaling the prototype turbine to equal proportions. The basic parameters of the Kaplan turbine are shown in Table 1. Figure 1 shows the three-dimensional modeling of the whole passage, including five parts: spiral casing, stay vanes, guide vanes, runner, and draft tube.

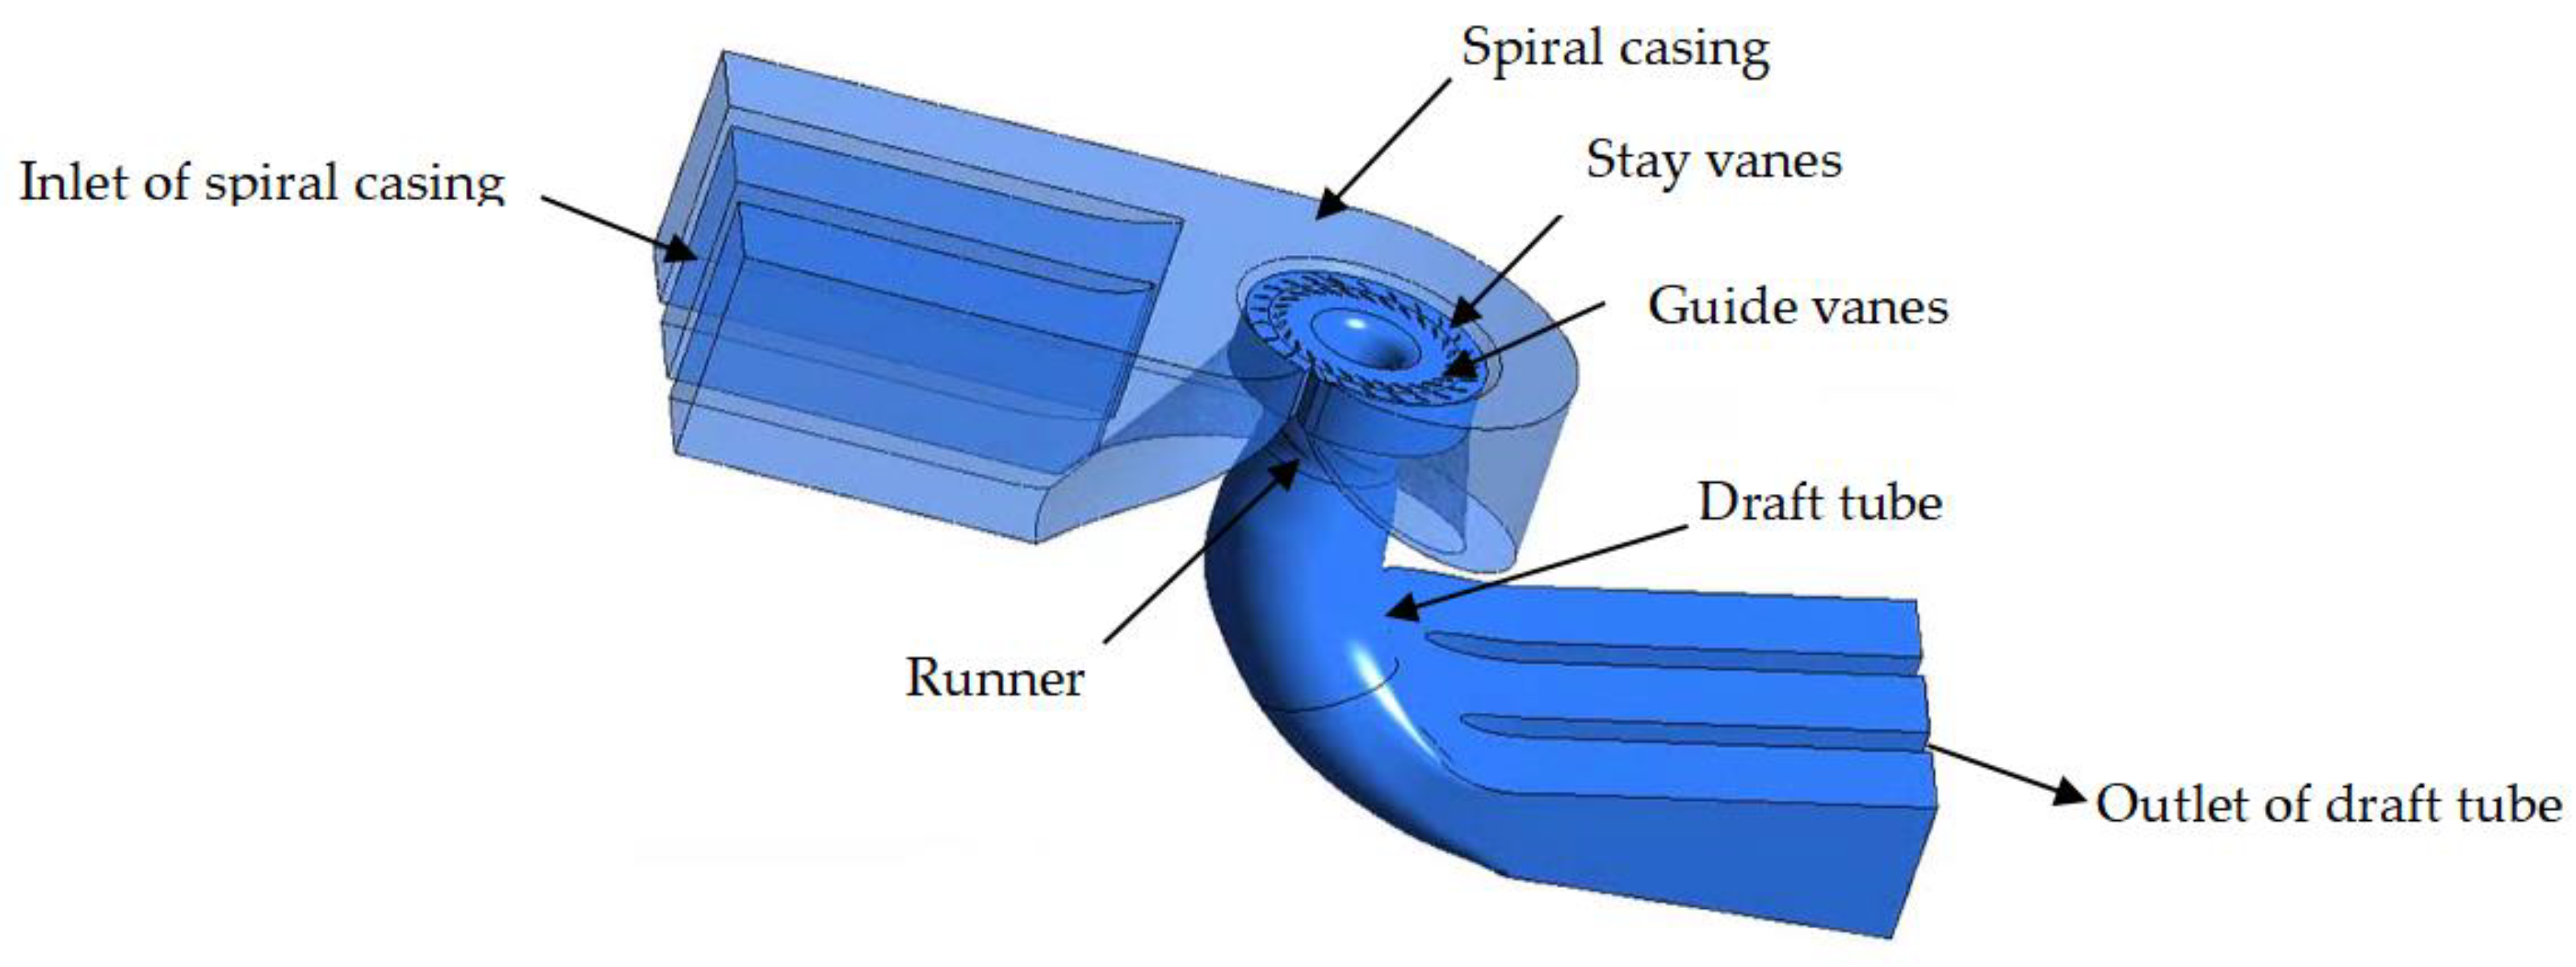
2.3. Computation Domain

Considering the large geometric size of the prototype turbine, the finer meshes mean a large quantity, which can obtain more accurate calculation results. Also, the clearance size is small, and the clearance leakage vortex demands more mesh cells, resulting in an even larger quantity of mesh cells. Huge computing resources and high computing costs will inevitably be incurred due to the increase in the number of mesh cells. Therefore, the single-blade channel is intended to be used as the computing domain in this calculation, as shown in Figure 2.
To verify the rationality of the calculation of the single-blade computing domain, Table 2 shows the results of the runner region of the whole passage and the single-blade computing domain of the model turbine. The operating parameters are as follows: the head is 8 m, the blade angle is 0°, and the guide vane angle is 28°. Since the whole passage includes six blades, for the convenience of comparison, the calculation results of the single-blade computing domain in the table are also converted into the results under six blades. The parameters in Table 2 include the energy characteristics of the runner region and the minimum pressure coefficient (CP) of the clearance leakage vortex cores. The energy characteristics mainly include flow coefficient (Q*), head coefficient (H*), power coefficient (P*), and efficiency (η). As shown by the energy characteristics, the results obtained from the single-blade channel and the whole passage are very close to each other, indicating that the single-blade channel calculation method can predict the energy characteristics of the runner domain very well. As shown by the minimum pressure coefficient of the clearance leakage vortex cores, the pressure coefficient obtained from the single-blade channel calculation is lower, indicating that it can better capture the cavitation phenomenon of the clearance leakage vortex. Therefore, it is valid to use a single-blade computing domain for shroud clearance cavitation flow calculations in this paper.
The parameters in Table 2 are defined as follows:
Q * = Q v D 3 n
H * = H r D 2 n 2
P * = 2 π n T D 5 n 3
η = P * ρ g Q * H *
C P = p p in 1 2 ρ V tip 2
In the formulas, D represents the runner diameter, n represents the spindle speed, Qv represents the volume flow rate, Hr represents the head of the runner domain, T represents the output torque of the spindle, ρ represents the density of water, g represents the gravity acceleration, p represents the minimum pressure at vortex cores, pin represents the average pressure at the inlet of the runner, and Vtip is the circumferential velocity of the runner tip, calculated using the product of the tip radius and the rotational angular velocity of the runner.

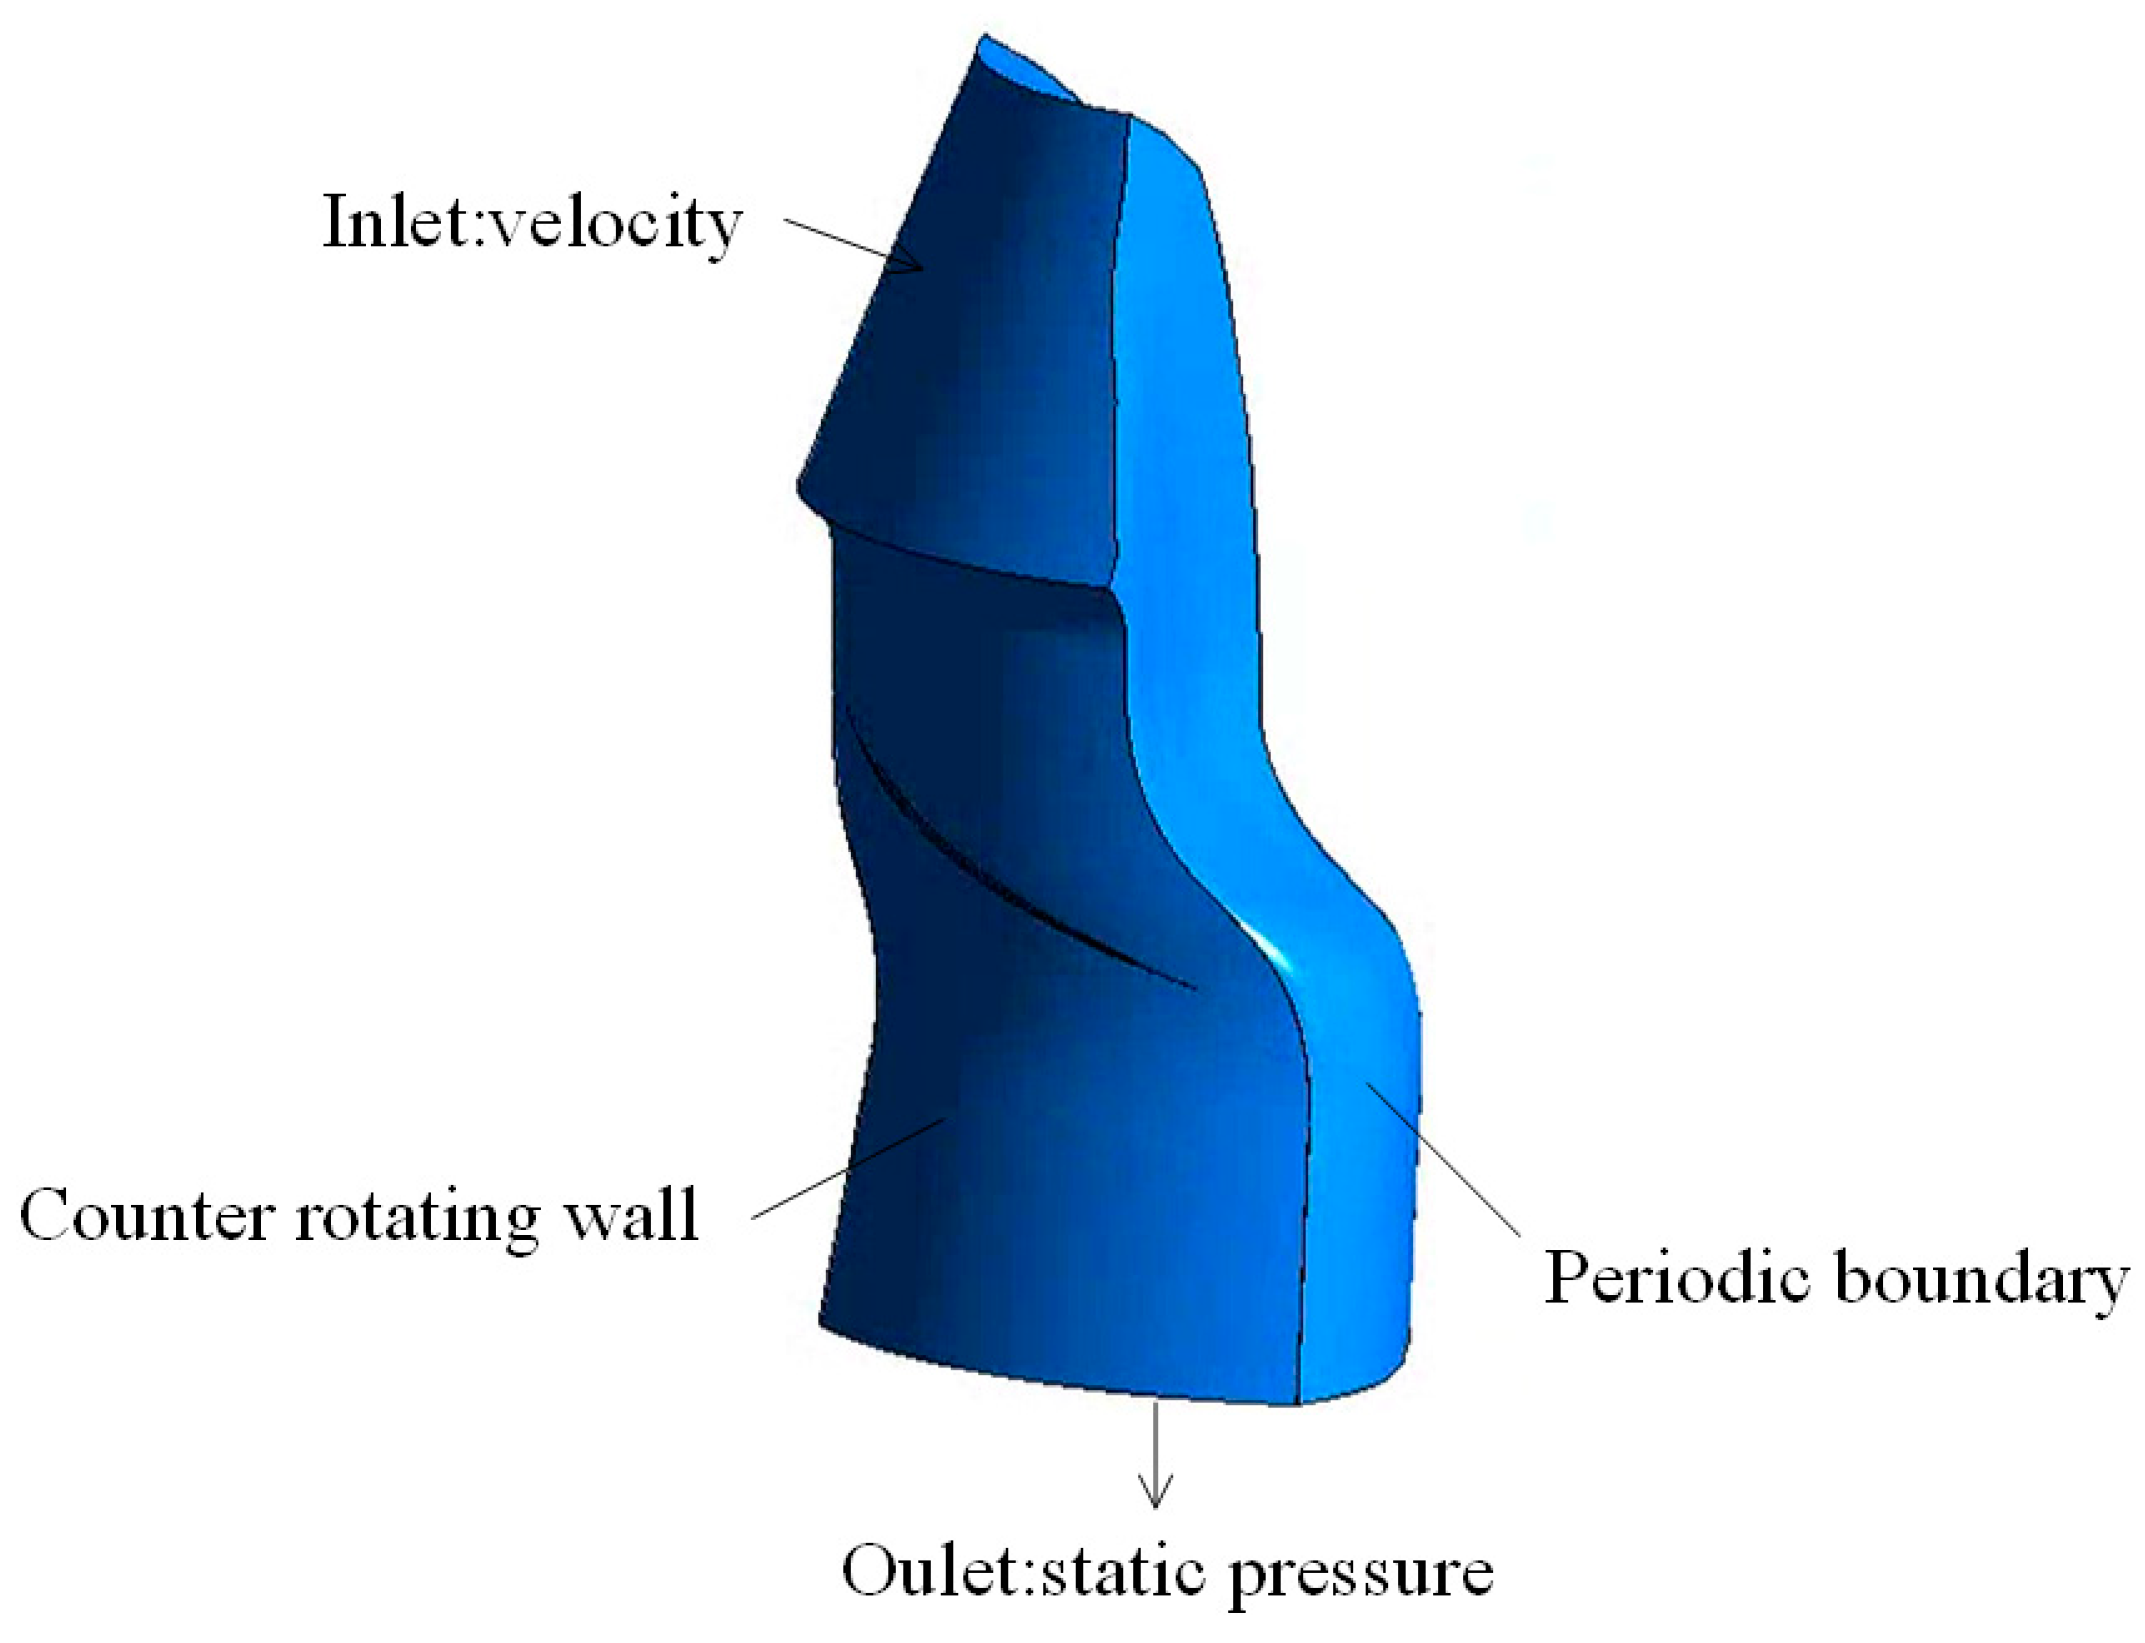
2.4. Operating Conditions and Boundary Conditions

In this paper, the differences in cavitation characteristics of the shroud clearance are studied with the variation of the cavitation coefficient between the prototype and the model. The operating parameters of the prototype and the model are as follows: the blade angle (β) is 0°, the guide vane angle (α) is 28°, the unit flow rate (Q11) is 1.05 m3/s, and the unit speed (n11) is 115.38 r/min. The unit flow rate (Q11), the unit speed (n11), and the cavitation coefficient (N*) are the same for the prototype and the model under similar operating conditions. The three parameters are defined as
Q 11 = Q v D 2 H
n 11 = n D H
N * = H a H v a H s H
In the formula, H represents the head of the unit, and Ha, Hva, and Hs are the atmospheric pressure, the liquid vapor pressure, and the suction height of the turbine, respectively, which are expressed in terms of the height of the liquid column.
Valid boundary conditions for the inlet and outlet are necessary for the calculation of the single-blade calculation domain. To obtain a more accurate understanding of the inlet speed of the runner, the whole passage calculation domain is first calculated in this paper. Three velocity components (axial, circumferential, and radial) are set as boundary conditions for the inlet of the single-blade calculation domain. The specific values are obtained by averaging circumferentially the three velocity components on the inlet face of the runner in the whole passage calculation. The outlet of the single-blade calculation domain is set as a static pressure outlet, the value of which is the average static pressure value on the outlet of the runner in the whole passage calculation. The calculation domain is set to the rotating domain, and the runner chamber is set to the counter-rotating wall, indicating that it is stationary regarding the stationary domain. Both sides of the blade are set to periodic boundary conditions, and the wall surface is used as a smooth no-slip wall surface. The boundary conditions for the main parts are depicted in Figure 2. Gravity is considered in the calculation and is used as the external force source term. The initial value for the cavitation calculation is determined by performing a no-cavitation calculation before the cavitation calculation. The simulation results are obtained after the mass and momentum equations converge and the efficiency of the runner domain becomes stable.

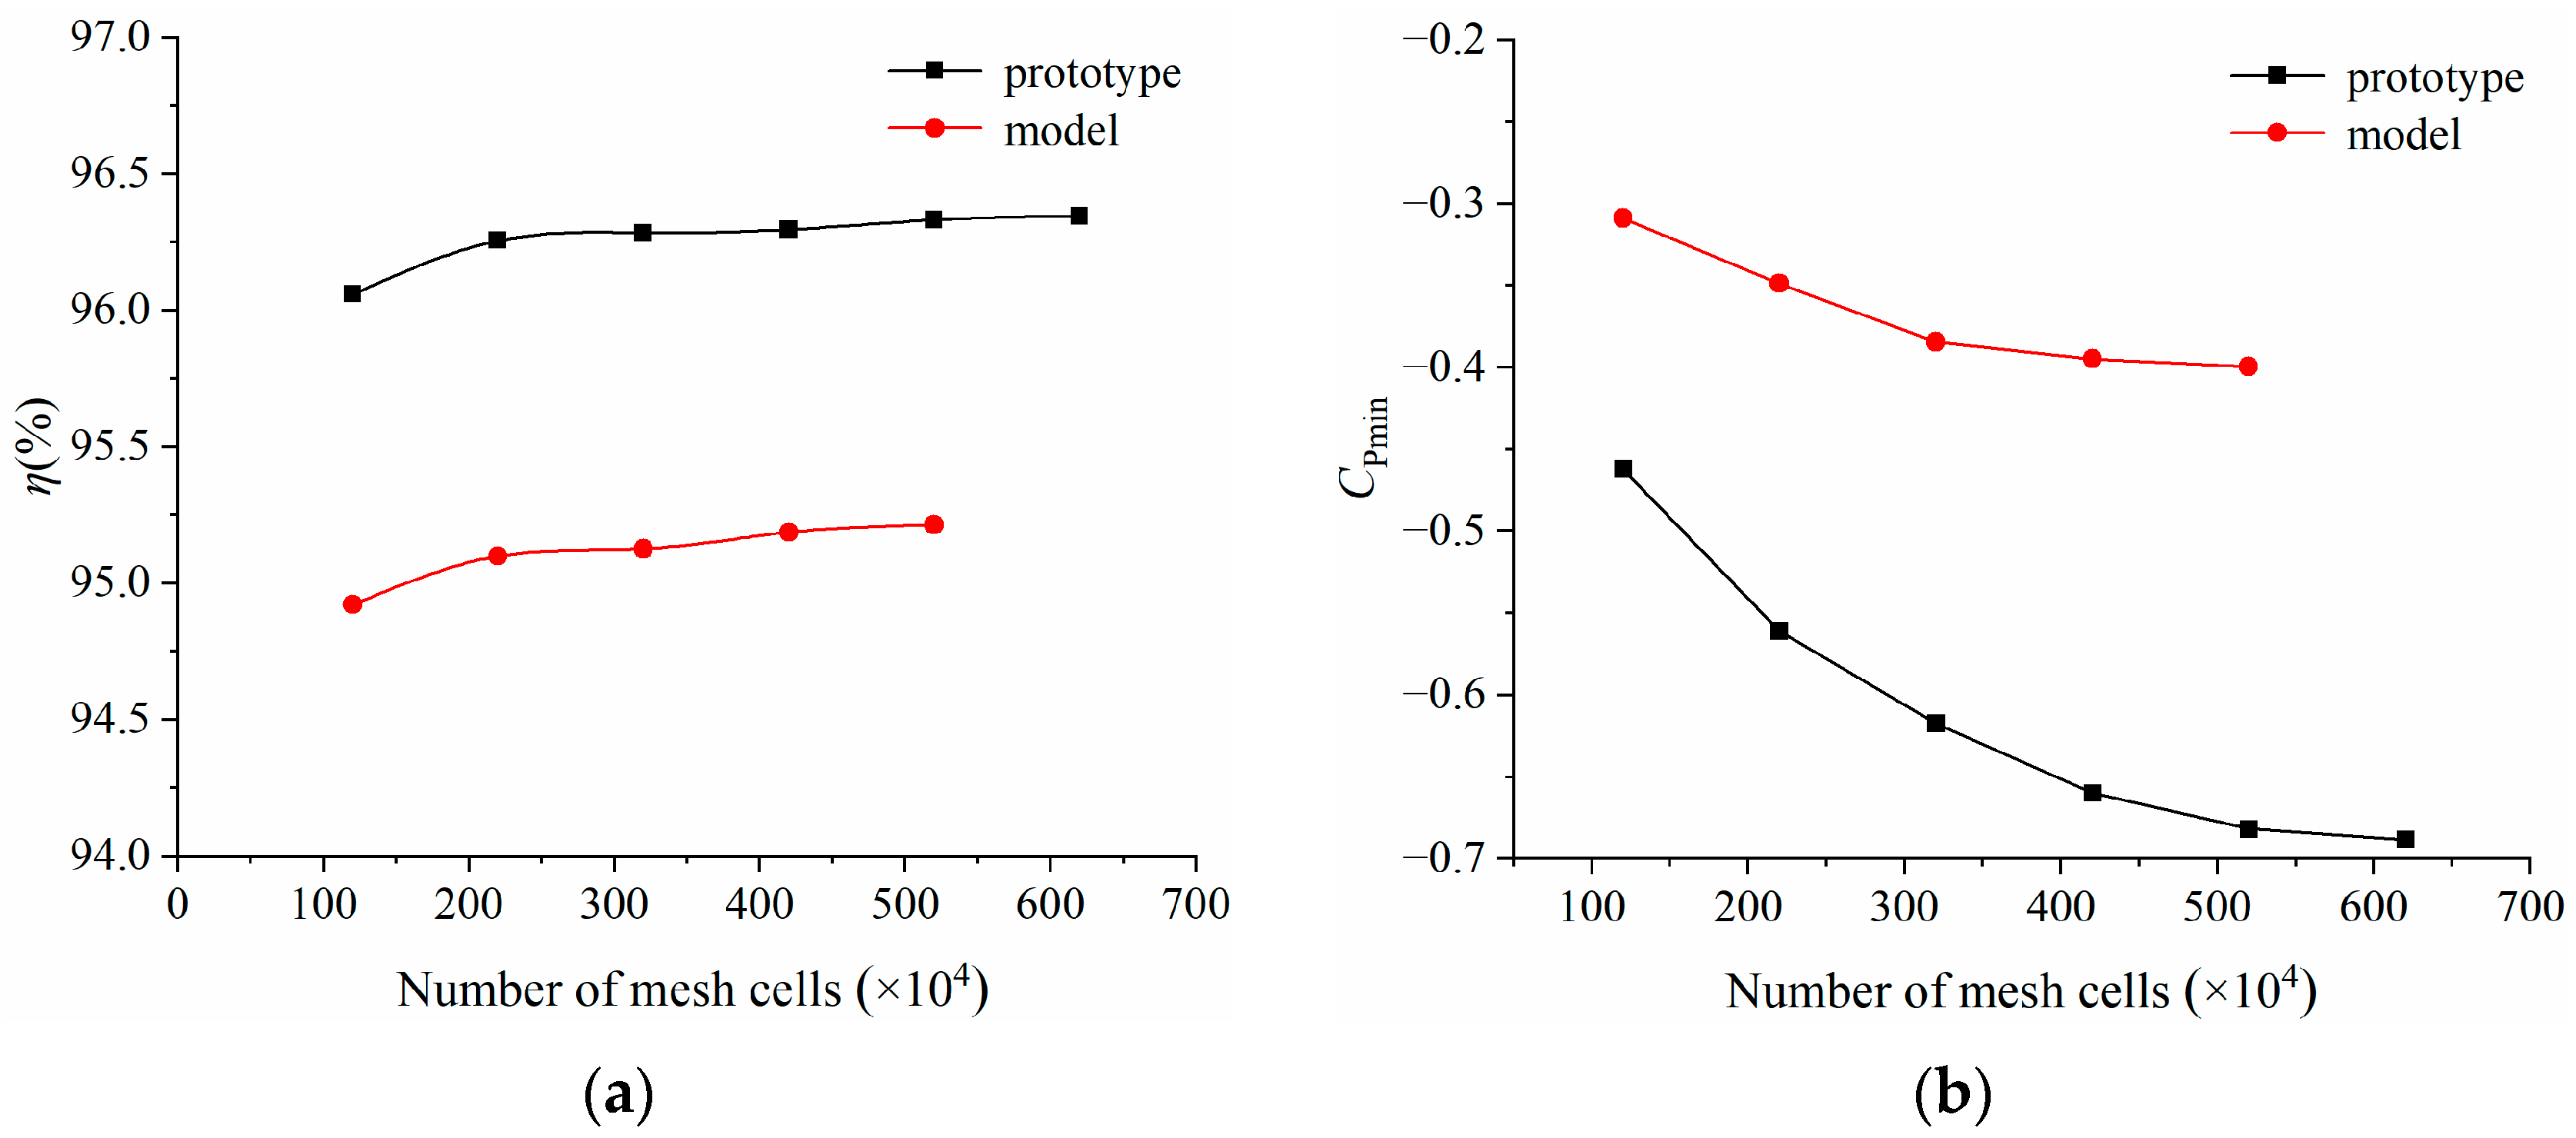
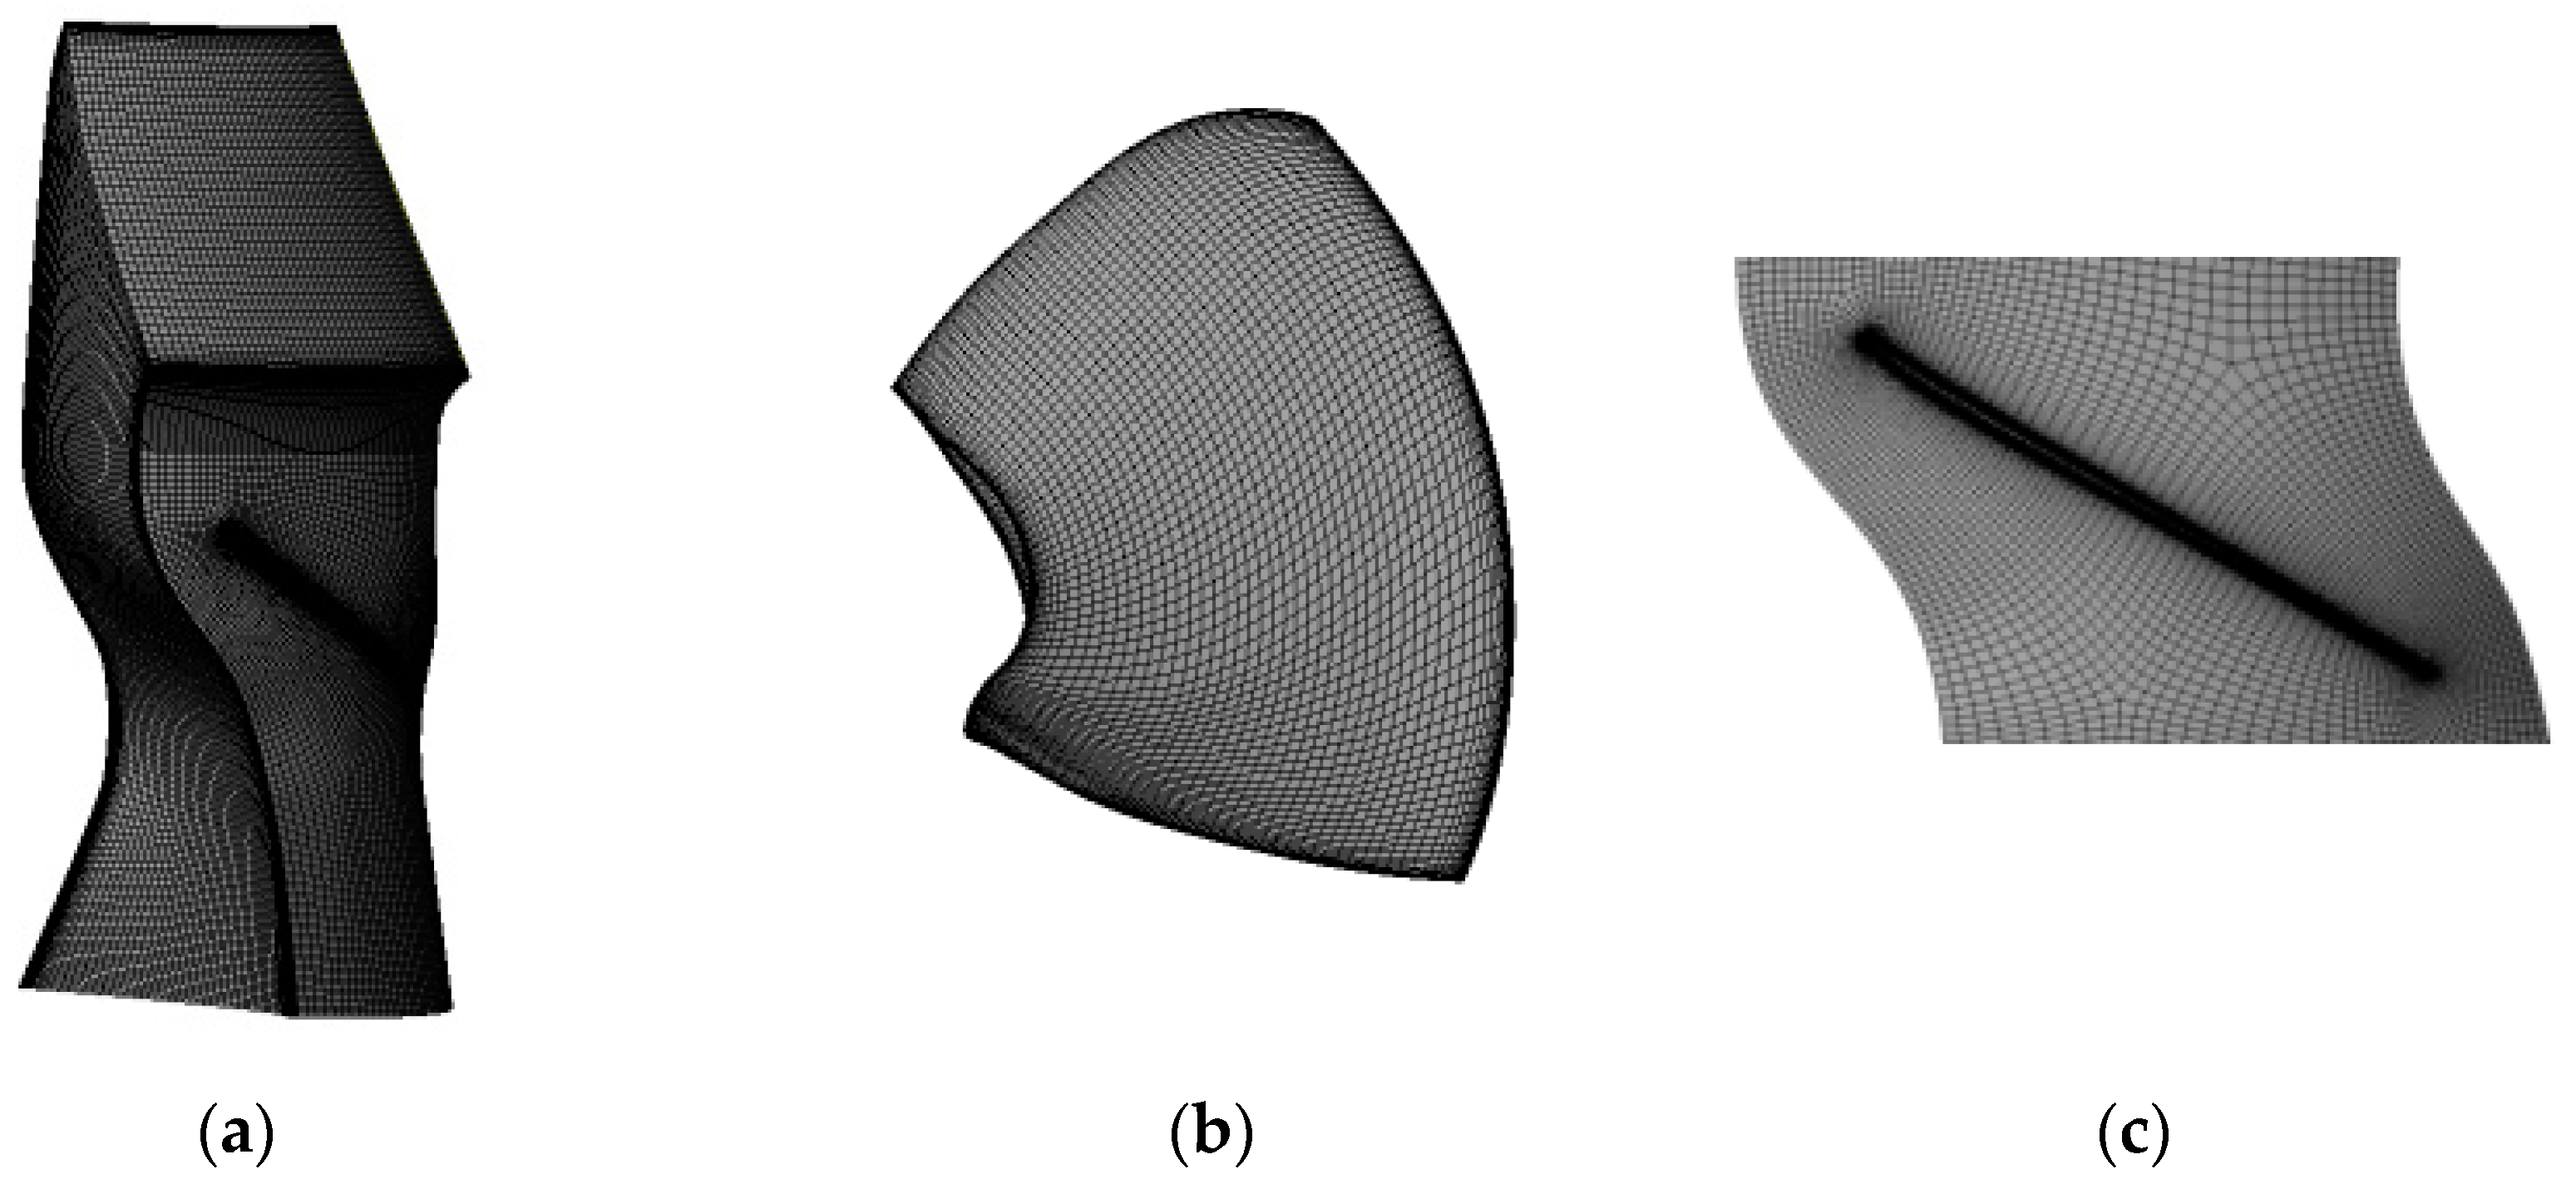
2.5. Mesh Independence Verification

The calculation focuses on the energy characteristics of the runner domain and the flow characteristics of the shroud clearance. The efficiency of the runner domain and the minimum pressure coefficient of the clearance leakage vortex cores are used as evaluation criteria for verifying mesh independence. Using the same calculation settings, six sets of meshes were computed for the prototype and five sets of meshes for the model. The results of different numbers of mesh cells are shown in Figure 3.
Compared to the results of the 4.2 million mesh cells and the 5.2 million mesh cells, the relative error of the model efficiency is about 0.028%, and the relative error of the minimum pressure coefficient of the clearance leakage vortex cores is about 0.37%. Compared to the results of the 5.2 million mesh cells and the 6.2 million mesh cells, the relative error of the prototype efficiency is about 0.014%, and the relative error of the minimum pressure coefficient of the clearance leakage vortex cores is about 0.75%. The evaluation criteria for mesh independence verification in the prototype and the model are not more than 1%. It is evident that the mesh independence validation for the 4.2 million mesh cells in the model and 5.2 million mesh cells in the prototype has been met. In addition, the significant differences between the prototype and the model can be observed in the Section 3. The differences were obtained by comparing the energy characteristics of the runner domain, clearance leakage characteristics, and clearance leakage vortex cavitation characteristics. The calculation results in the Section 3 are obtained by using 5.2 million mesh cells in the prototype and 4.2 million mesh cells in the model. Therefore, the final number of mesh cells in the prototype is 5.2 million, while the number of mesh cells in the model is 4.2 million. The number of mesh layers of shroud clearance is 20. The average Y+ value of the wall of the prototype runner blade is about 100 and that of the model runner blade is about 30. The meshes of the calculation domain, blade, and shroud surface are shown in Figure 4.

3. Calculation Results

3.1. Analysis of Calculation Results

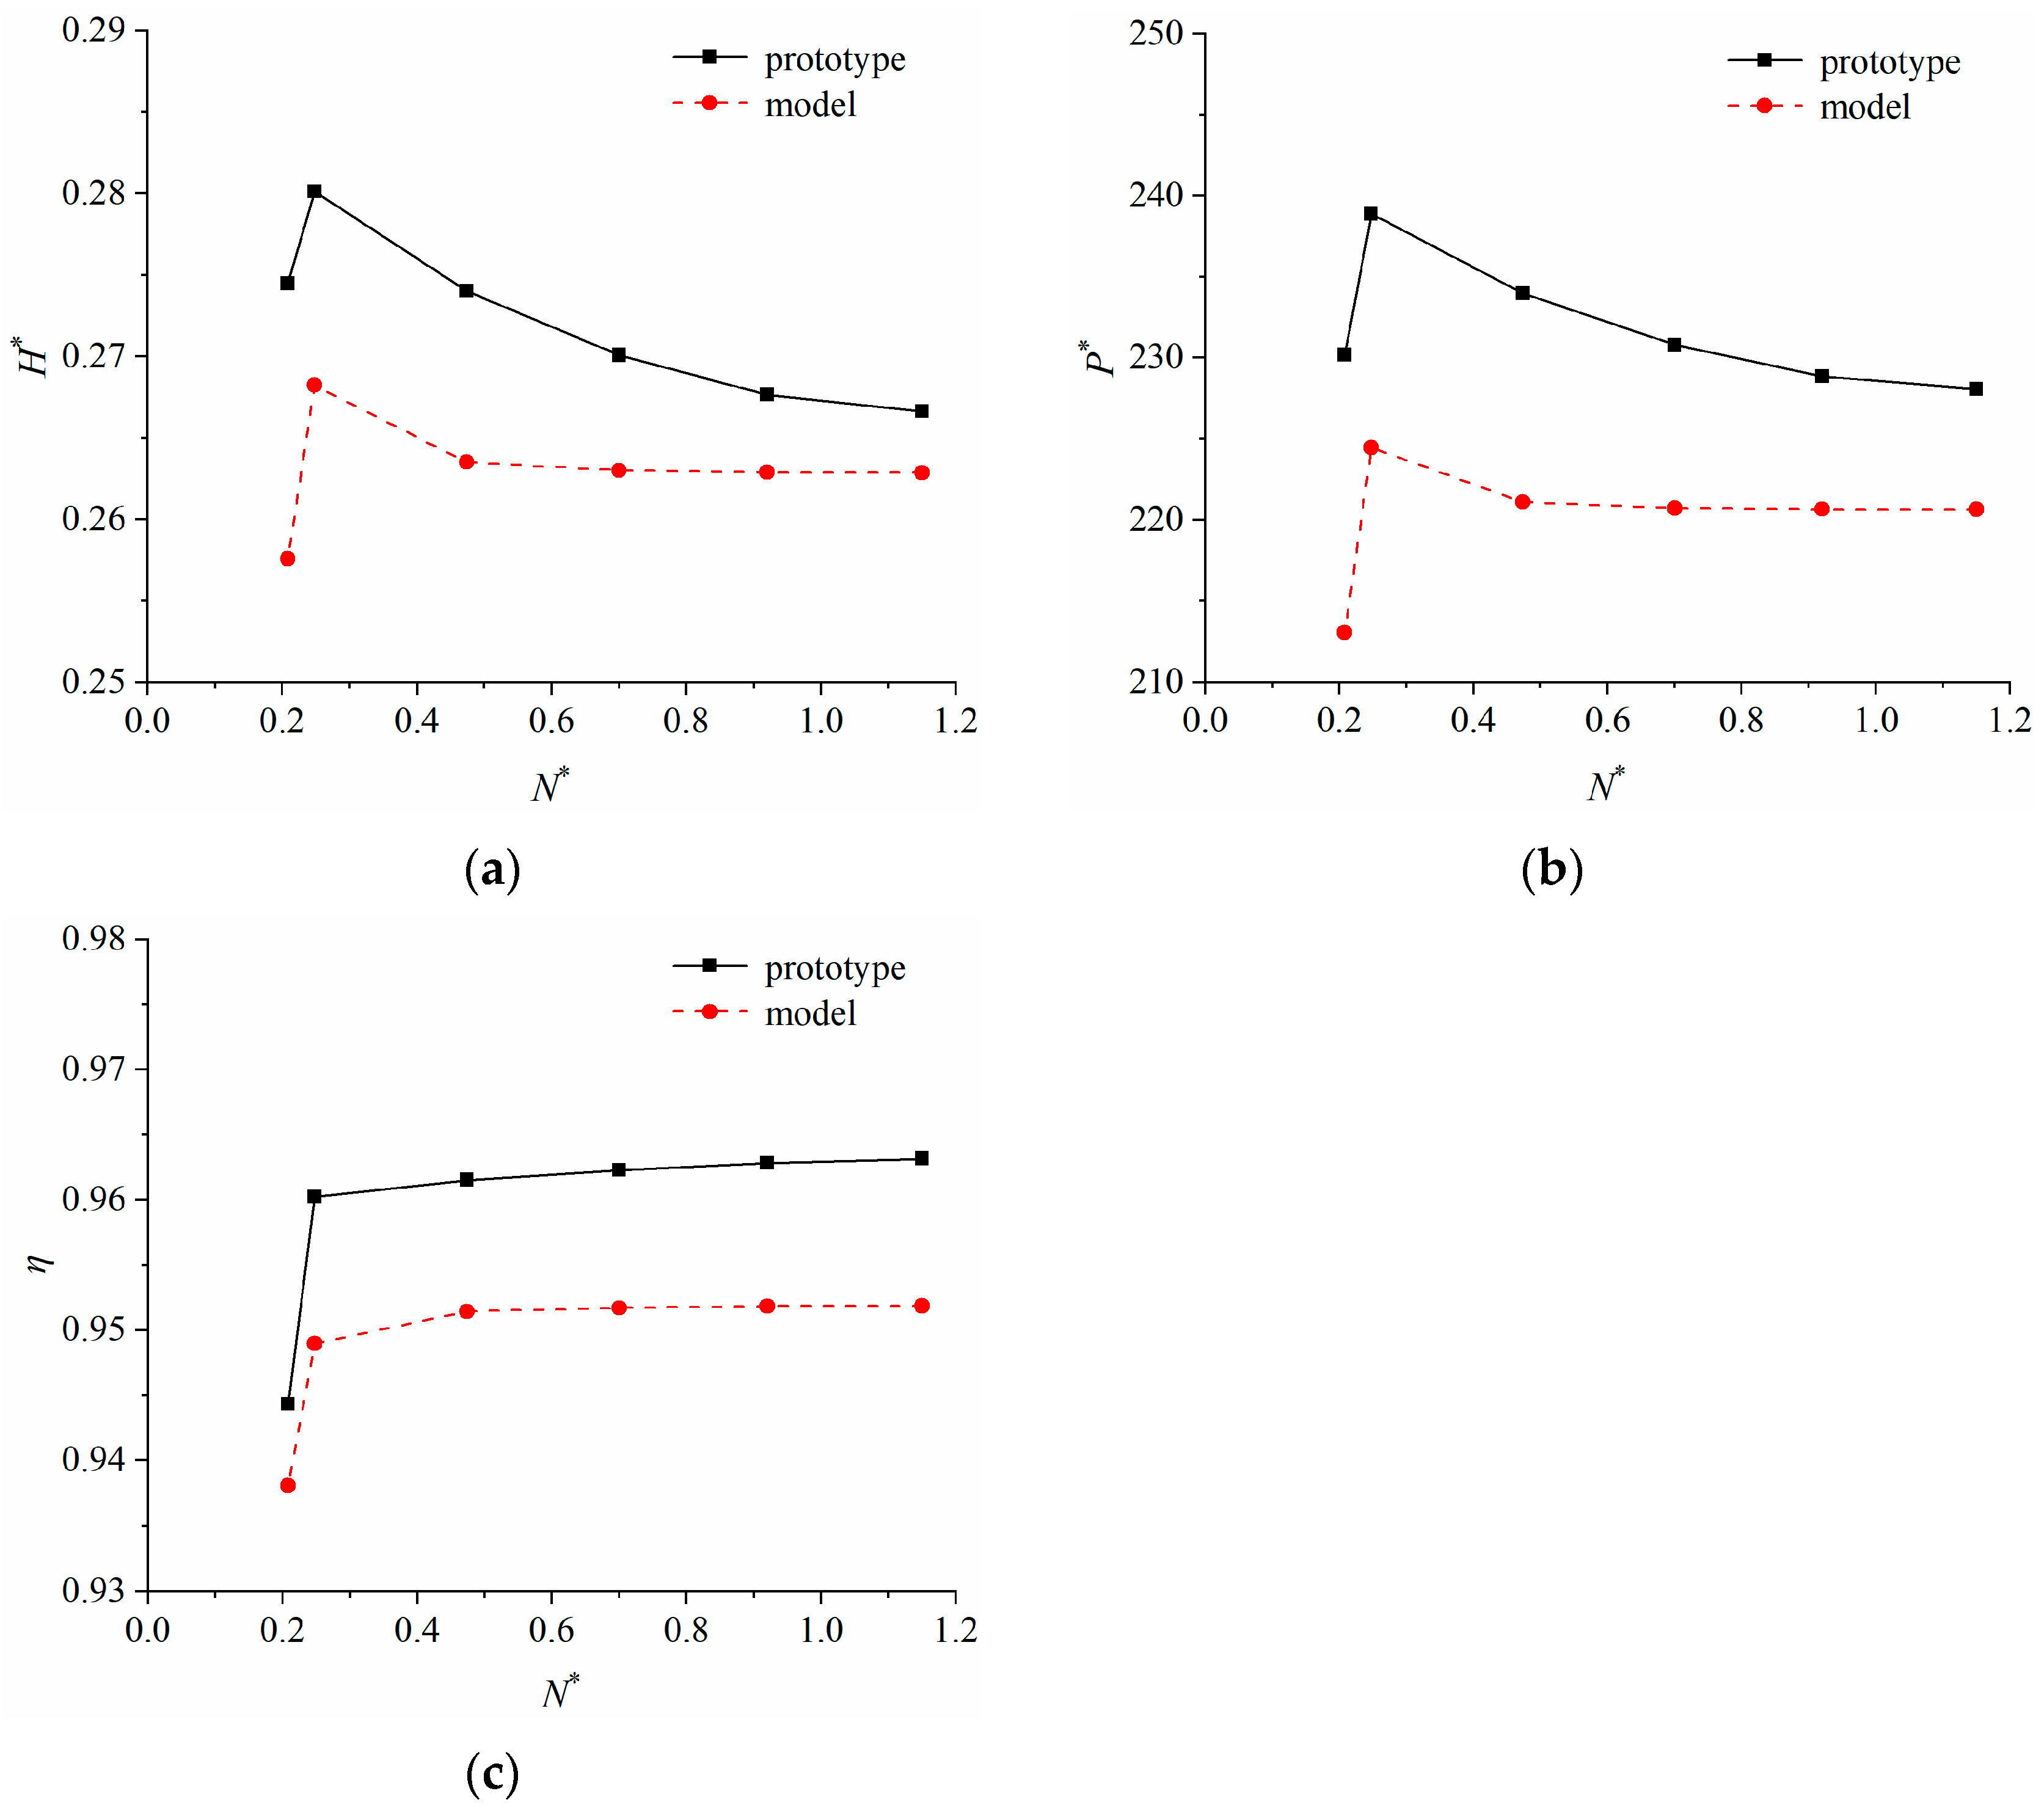
3.1.1. Energy Characteristics

As one of the main parameters of turbine performance, the cavitation coefficient has a significant impact on both the cavitation characteristics and energy characteristics of the unit. Figure 5 shows the relationship curves between the energy characteristics and the cavitation coefficients (N*). The head coefficient (H*), power coefficient (P*), and efficiency (η) of the runner domain in the prototype and the model have a similar variation pattern when the cavitation coefficient decreases.
When the cavitation coefficient (N*) decreases from 1.15 to 0.248, the head coefficient (H*) of the prototype and the model increases by 5.07% and 2.04%, respectively, as illustrated in Figure 5a. This shows that the energy characteristics of the runner domain, especially the prototype runner domain, will be slightly improved with the reduction in the cavitation coefficient in this range. When the cavitation coefficient (N*) continued to decline to 0.208, the water head coefficient (H*) began to decline rapidly. Compared to the cavitation coefficient N* = 0.248, the head coefficient of the prototype and the model decreased by 2.02% and 3.97%, respectively. This indicates that when the cavitation coefficient (N*) is below 0.248, the cavitation phenomenon will be detrimental to the working ability of the runner, especially the model runner. The variant rule of power coefficient (P*) with cavitation coefficient (N*) is similar to that of the head coefficient (H*), as shown in Figure 5b. With the decrease in the cavitation coefficient, the power coefficients (P*) of the prototype and the model first increase by 4.75% and 1.73%, respectively, and then decrease by 3.65% and 5.03%, respectively, relative to their peak points. The relationship curves between the efficiency and the cavitation coefficients can be seen in Figure 5c. Different from the changes in the head coefficient (H*) and the power coefficient (P*), the efficiencies (η) of the prototype and the model remain constant when the cavitation coefficient (N*) is greater than 0.474, and then start to decline with the decrease in the cavitation coefficient (N*). The efficiency drops sharply when the cavitation coefficient (N*) is below 0.248. The cavitation coefficient when the efficiency of the runner domain decreases by 1% is defined as the critical cavitation coefficient. The critical cavitation coefficient of the prototype and the model was estimated by interpolation to be 0.230 and 0.222, respectively. Although the critical cavitation coefficient of the prototype is higher than that of the model, they are still comparable. The critical cavitation coefficient calculated by the model can be considered as a reference to the prototype.
Comparing the prototype and the model, the energy characteristics of the prototype are higher than those of the model at the same cavitation coefficient. As the cavitation coefficient increases, so does the difference. At the point where the energy characteristics drop, the energy characteristics of the prototype are about 4.43%, 6.42%, and 1.19% higher than those of the model, respectively.

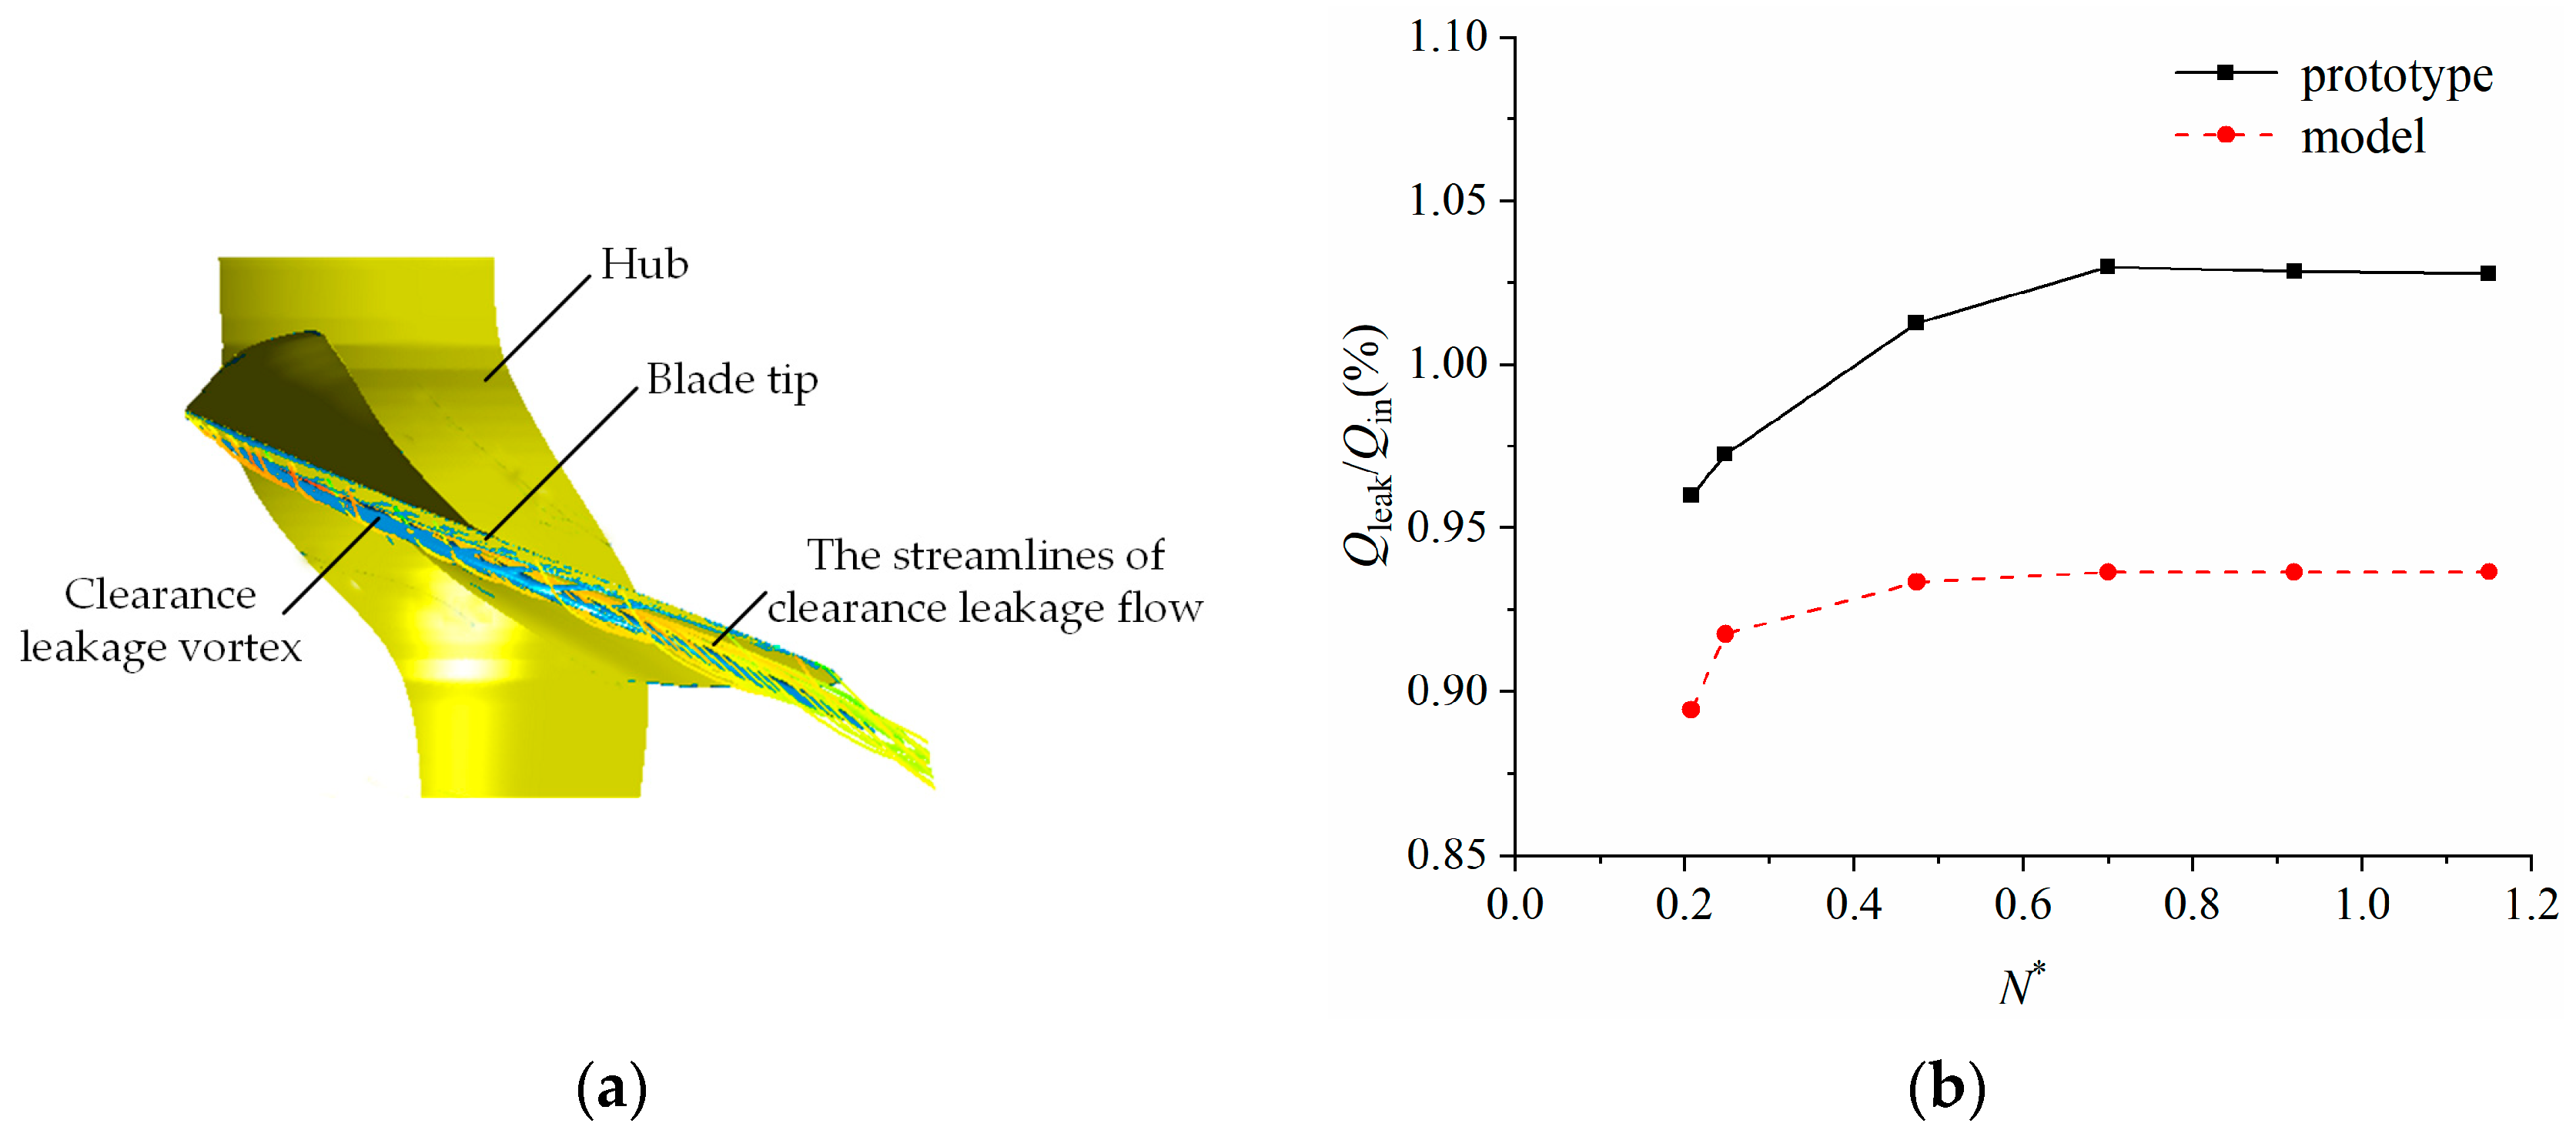
3.1.2. Clearance Leakage Characteristics

Figure 6 shows the leakage flow and the leakage vortex in the region of the shroud clearance, as well as the relationship curves between the clearance leakage flow rate and cavitation coefficients (N*). The value of the clearance leakage flow rate (Qleak) is normalized by the flow rate of the inlet (Qin). Both the prototype and the model exhibit a gradual decrease in clearance leakage flow rate as the cavitation coefficient (N*) decreases. The clearance leakage flow rate changes are small in both the prototype and the model when the cavitation coefficient (N*) is in the range of 1.15 to 0.7. When the cavitation coefficient (N*) decreases to 0.474, the clearance leakage flow rate of the prototype decreases by 1.66% relative to when the cavitation coefficient (N*) is 0.7, while that of the model decreases by 0.33%. The decrease rate of the clearance leakage flow rate of the prototype is obviously higher than that of the model, which is related to the cavitation state of the clearance region. When the flow channel near the clearance is blocked by the clearance cavitation, the clearance leakage flow rate will be reduced. The clearance leakage flow rate decreases as the flow path becomes more blocked. When the cavitation coefficient (N*) decreases further, the degree of cavitation near the clearance region becomes more severe, and the clearance leakage flow rate also continues to decrease. The clearance leakage flow rates of the prototype and model decrease quickly, with the cavitation coefficient (N*) decreasing from 0.248 to 0.208, resulting in a decrease of 1.29% and 2.53%, respectively. During this process, the energy characteristics of the prototype and the model also decrease rapidly.

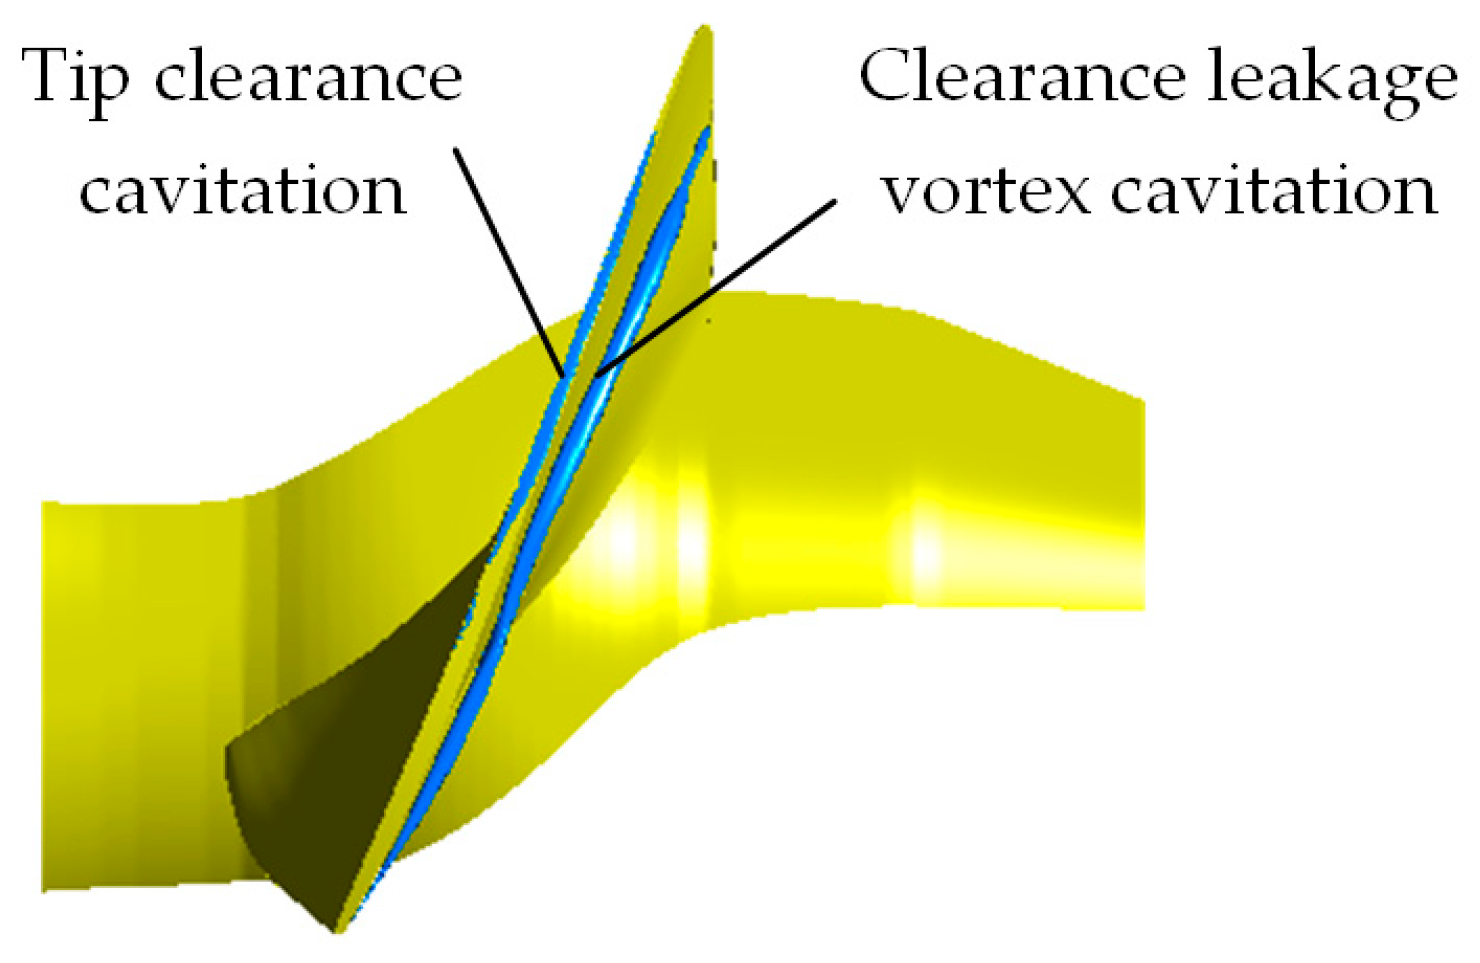
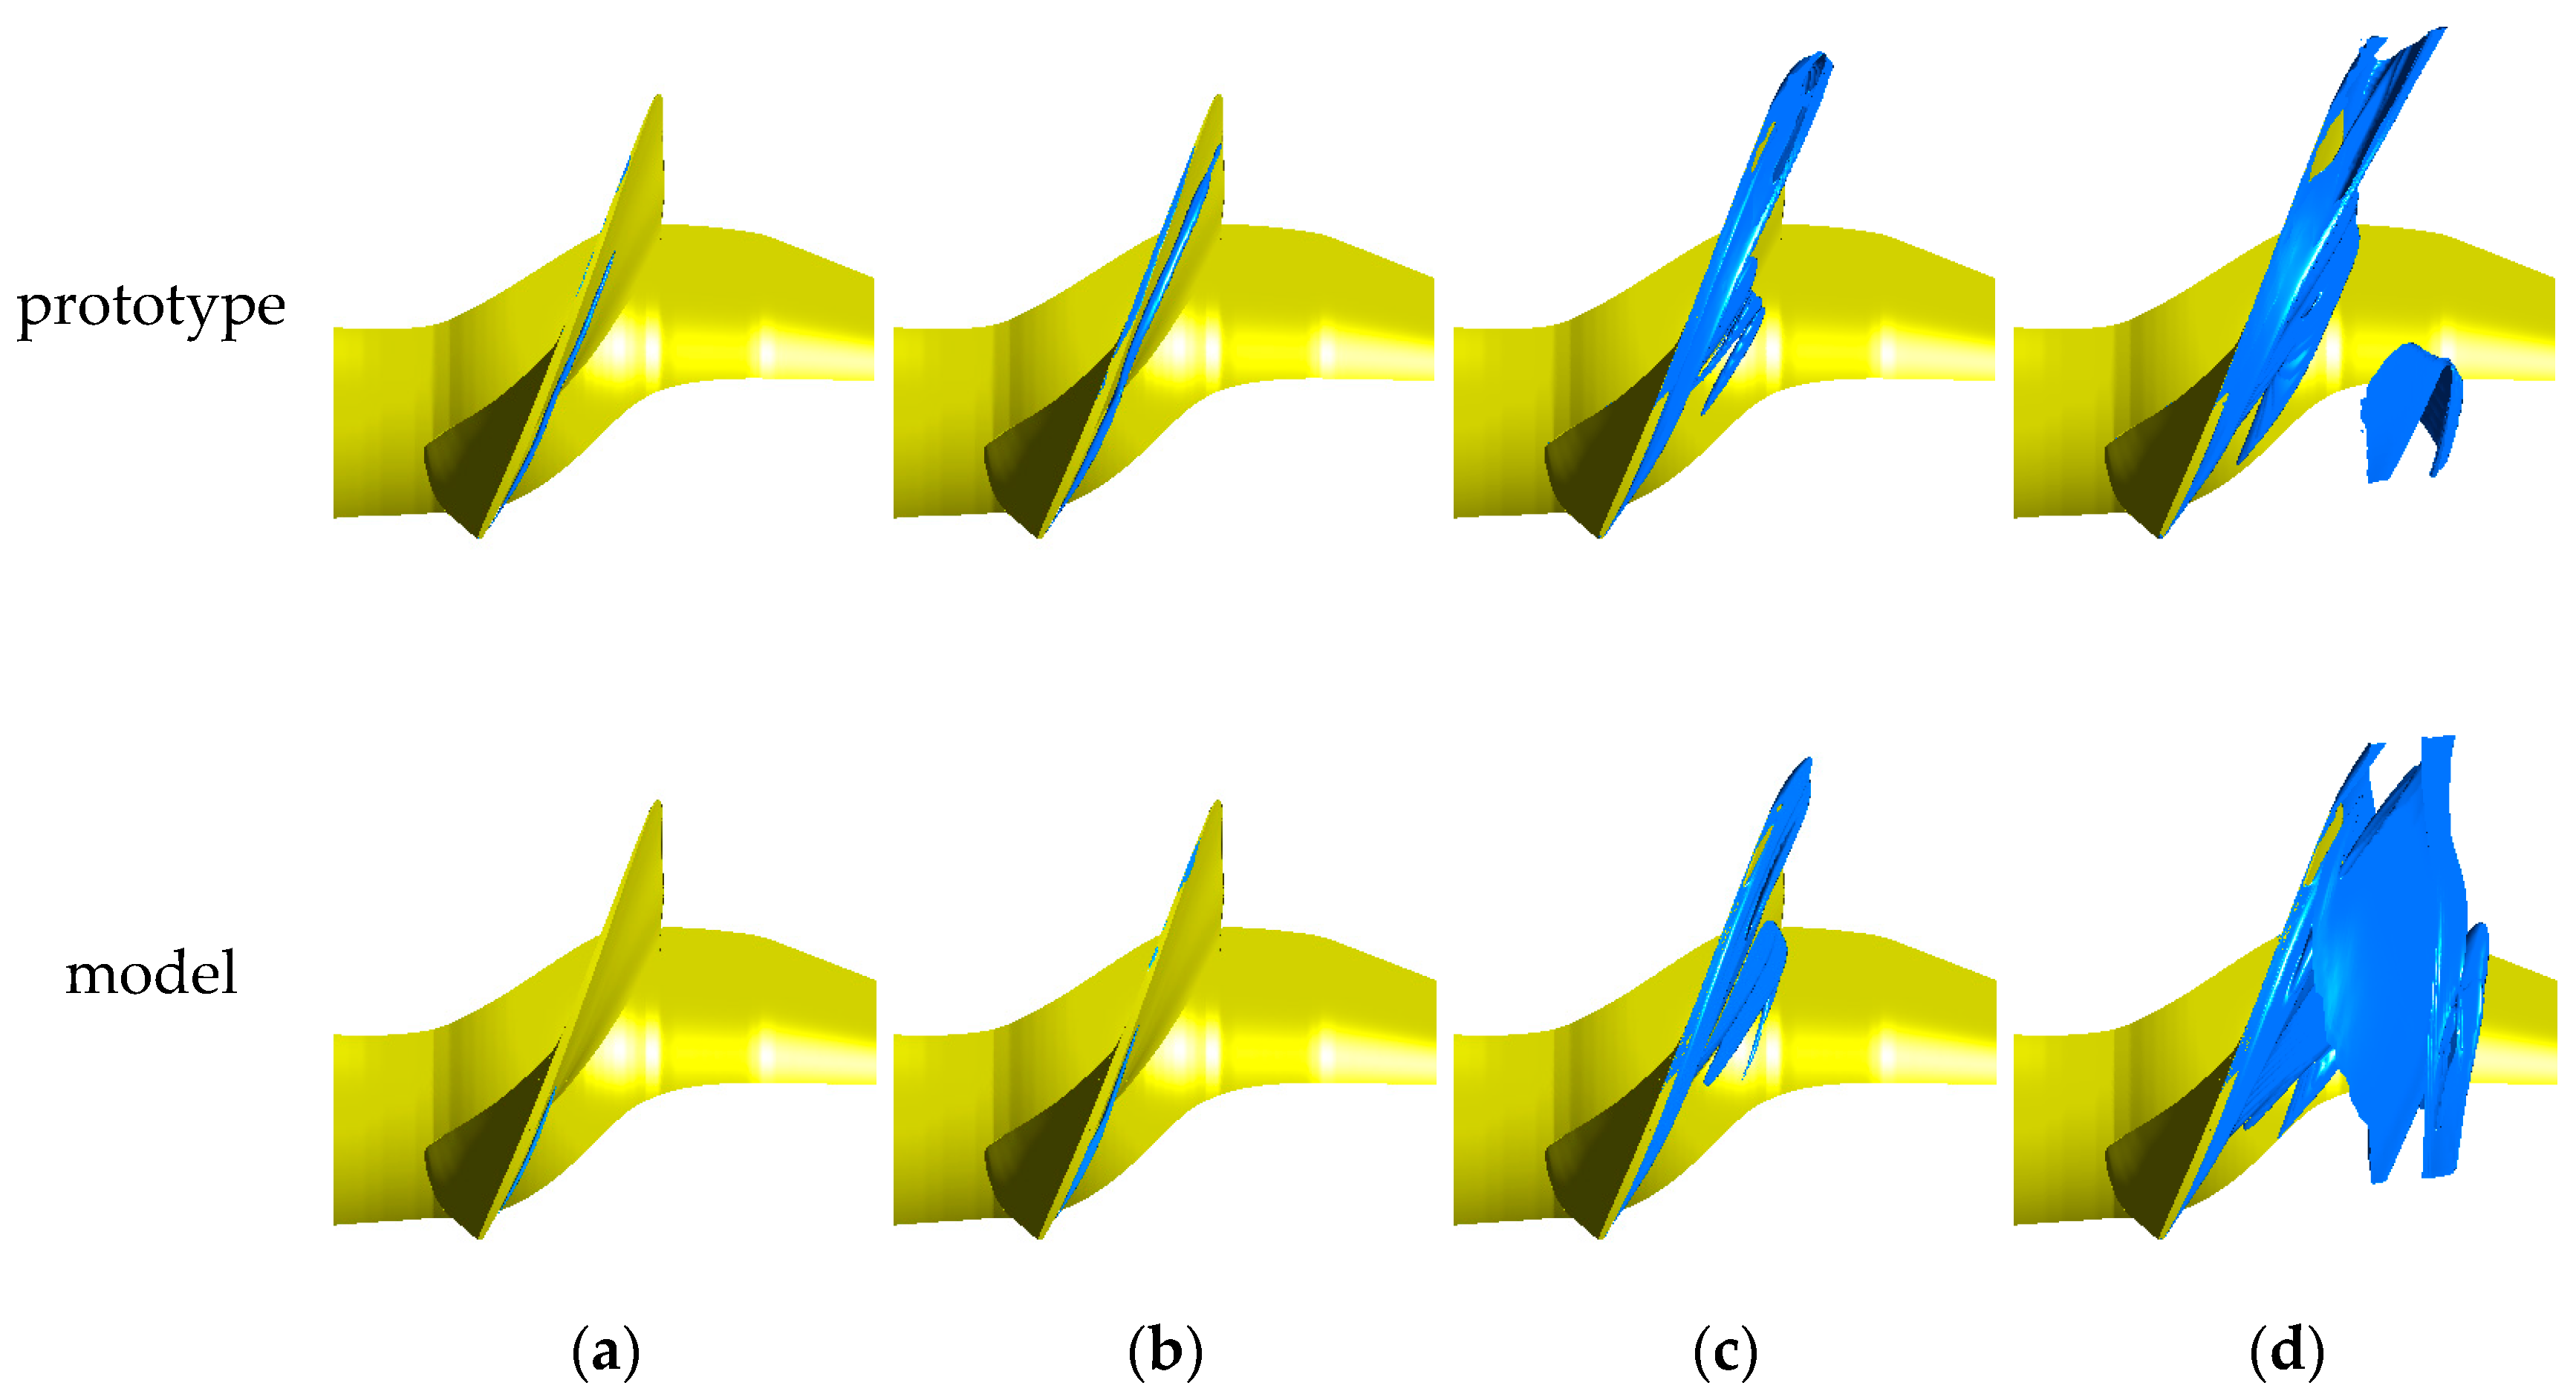
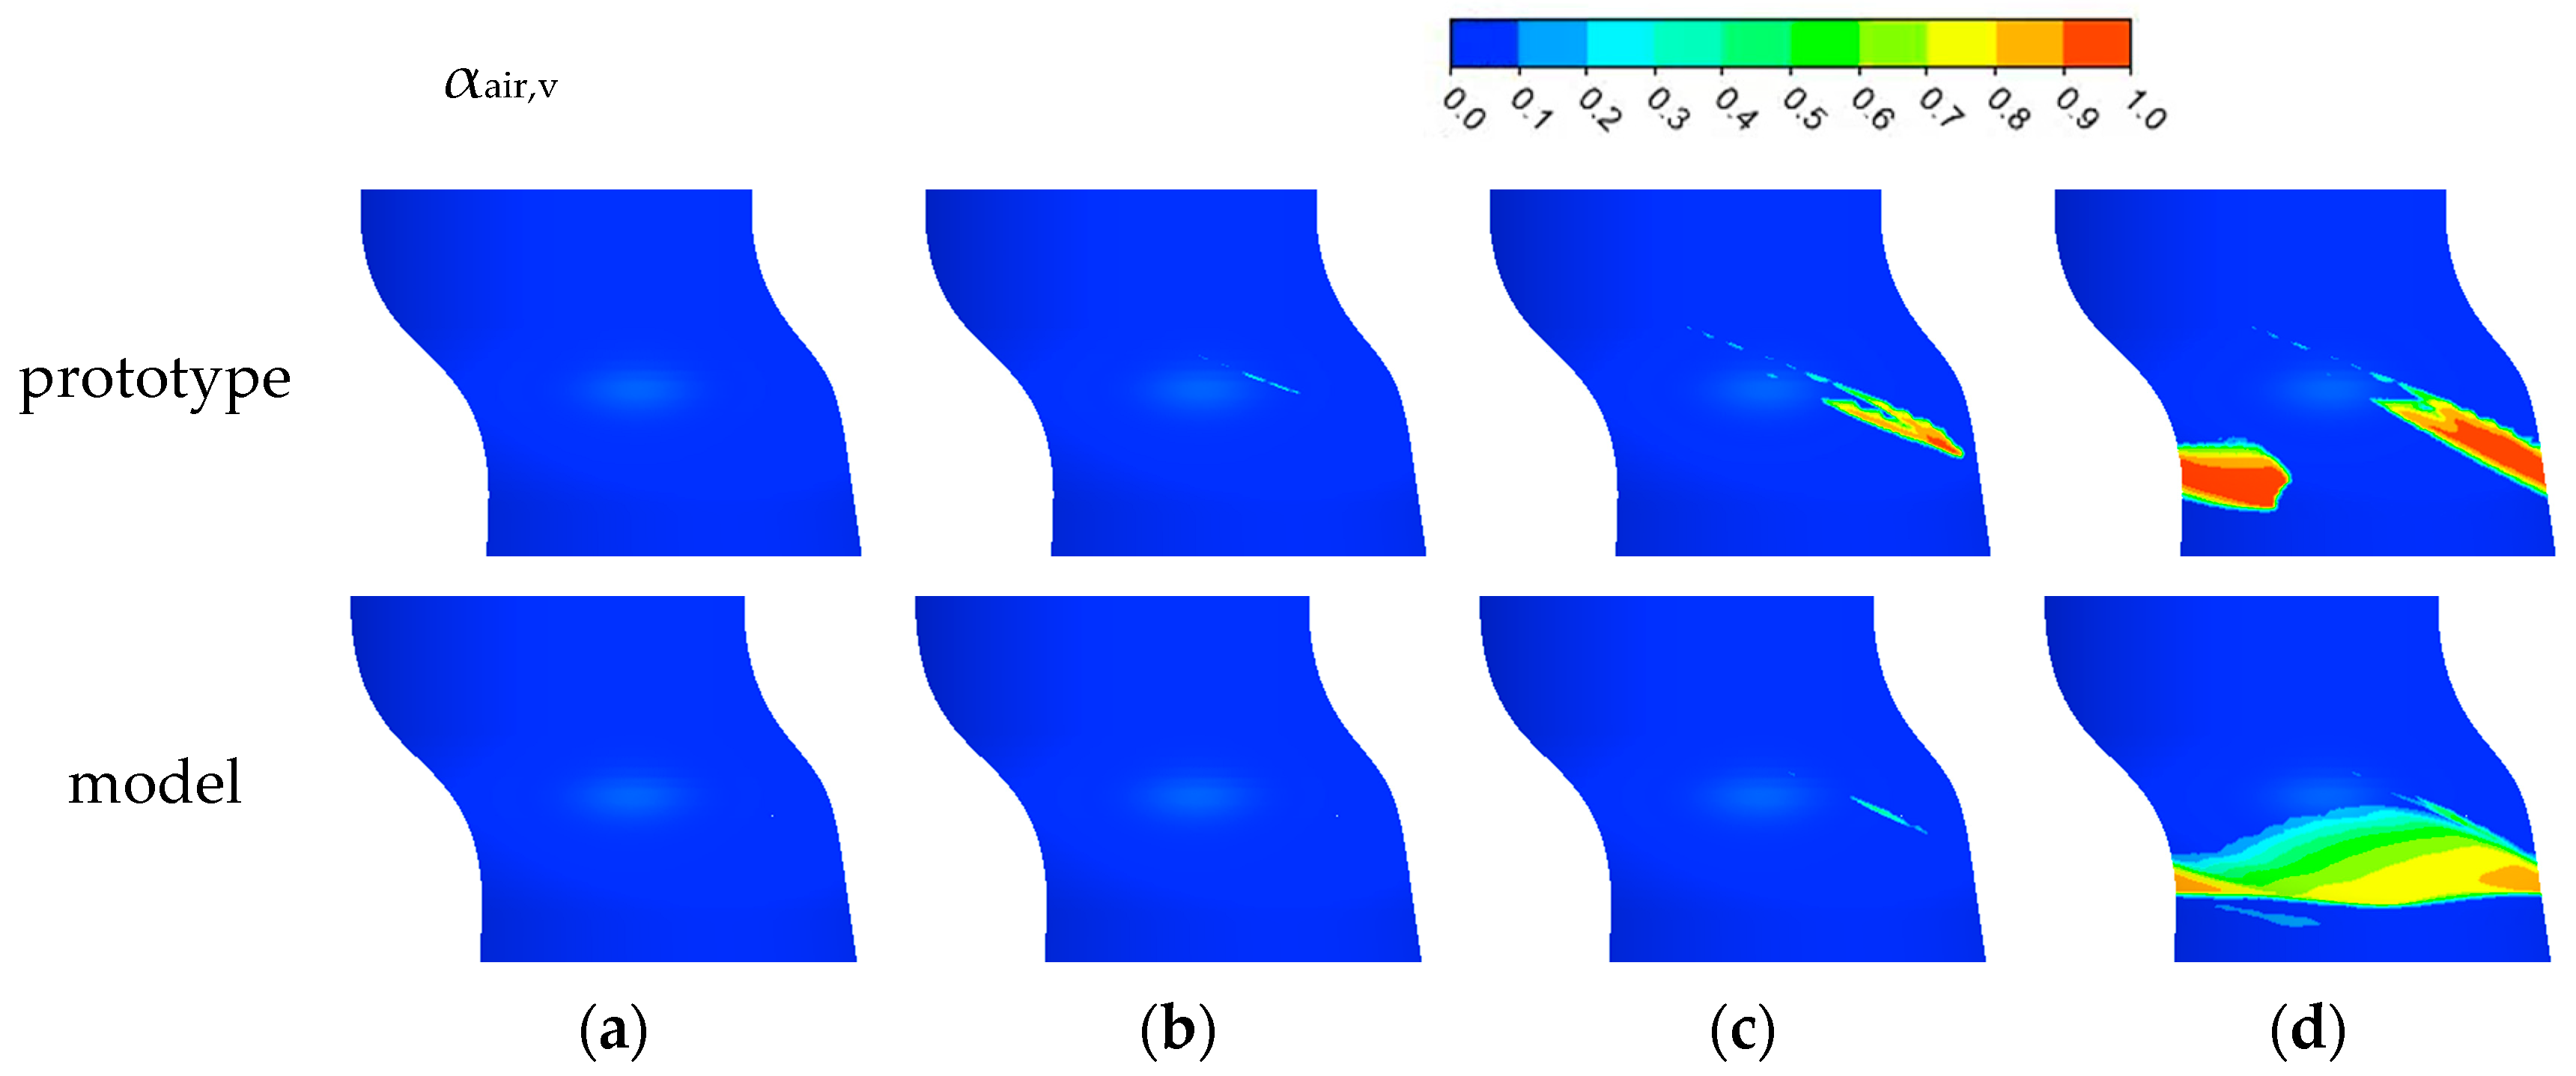
3.1.3. Cavitation Distribution near the Blade Tip

The tip clearance cavitation and clearance leakage vortex cavitation in the shroud clearance region are shown in Figure 7. Reference [30] describes the formation reasons for them.
The cavitation distribution near the blade tip can be seen in Figure 8 by utilizing the isosurface of vapor volume fraction (αv = 0.1). The degree of cavitations in the blade tip region of both the prototype and the model becomes more intense with the decrease in the cavitation coefficient (N*). Specifically, when cavitation occurs, the clearance leakage vortex cavitation starting from the head of the blade occurs earlier than the tip clearance cavitation, which is in the middle and the tail of the blade. With a decreased cavitation coefficient (N*), the clearance leakage vortex cavitation diameter thickens and continues to extend to the outlet side of the blade, while the tip clearance cavitation develops bidirectionally towards the head and the tail of the blade. The interaction between tip clearance cavitation and clearance leakage vortex cavitation occurs when the cavitation coefficient (N*) is 0.248. The tail of the blade was completely covered by the cavitation region. As the cavitation coefficient (N*) continues to decrease, the cavitation degree near the tip intensifies further, resulting in a stronger blocking effect on the flow passage.
Comparing the cavitation region near the blade tip of the prototype and the model, it can be seen that when the cavitation coefficient (N*) is bigger than 0.248, the degree of tip clearance cavitation and clearance leakage vortex cavitation of the prototype is more serious than that of the model under the same cavitation coefficient. The clearance leakage vortex cavitation of the prototype is further away from the suction surface of the blade. When the cavitation coefficient (N*) is below 0.248, the degree of cavitation near the blade tip of the model is more obvious and more serious than that of the prototype.

3.1.4. Volume Change of the Runner Cavitation

As can be seen from Figure 8, the tip clearance cavitation and the clearance leakage vortex cavitation can be seen more clearly than other cavitations in Figure 8a,b. As the cavitation coefficient decreases, all the cavitations increase in intensity. Other cavitations can also be seen in Figure 8c,d. In Figure 8d, it should be noted that other cavitations have been more serious than tip clearance cavitation and clearance leakage vortex cavitation. To quantitatively analyze the variation in clearance cavitation near the blade tip with the cavitation coefficient, the flow field was divided into the flow field near the blade tip and the other flow fields. According to the cavitation morphology near the blade tip when the cavitation coefficient (N*) is 0.208, the position of the blade-spreading length with the shroud facing inwards by 20% is divided into the flow field near the blade tip. The position remains constant under different cavitation coefficients. The cavitation in the flow field near the blade tip is called tip cavitation, and the cavitation in other flow fields is called other cavitation. For ease of differentiation, the volume of the entire flow passage was denoted as VRV, the total cavitation volume in the flow passage was denoted as Vcav-total, the tip cavitation volume was denoted as Vcav-tip, and the other cavitation volumes were denoted as Vcav-other.
Figure 9a,b show the variations of the ratios of the tip cavitation volume and other cavitation volumes to the total cavitation volume in the runner domain under the different cavitation coefficients, respectively. Figure 9c,d are the variations of the ratios of the tip cavitation volume and other cavitation volumes to the total volume of the flow field under the different cavitation coefficients, respectively. Combined with Figure 9a,b, it can be seen that when the cavitation coefficient (N*) is bigger than 0.248, the maximum value of the ratio of the tip cavitation volume to the total cavitation volume in the computational domain is about 99% in the prototype, while it is about 98% in the model. With the decrease in the cavitation coefficient (N*), the ratio of the tip cavitation volume to the total cavitation volume is continuously decreasing, and the ratio of the other cavitation volumes to the total cavitation volume is continuously increasing. When the cavitation coefficient (N*) is 0.208, the ratio of the tip cavitation volume to the total cavitation volume in the computational domain is about 49% in the prototype, while it is about 37% in the model. The indication is that other cavitation in the runner domain is more serious than tip clearance cavitation at the moment. Combining Figure 9c,d, it can be seen that the tip cavitation volume and other cavitation volumes of the prototype and the model increase exponentially in the flow passage with the decrease in the cavitation coefficient (N*). The ratio of the tip cavitation volume to the flow field volume of the prototype is higher than that of the model when the cavitation coefficient (N*) is greater than 0.248. The ratio of the tip cavitation volume to the flow field volume in the prototype is lower than that in the model when the cavitation factor (N*) is 0.208. The conclusions of cavitation morphology in the runner domain are in agreement with this. In addition, it can be seen that when the cavitation coefficient (N*) is below 0.248, the volumes of tip cavitation and other cavitation in the flow passage increase sharply. The energy characteristics of the runner domain show a rapid decline trend at this time, indicating that the change in cavitation volume has a great influence on the energy characteristics of the runner domain.

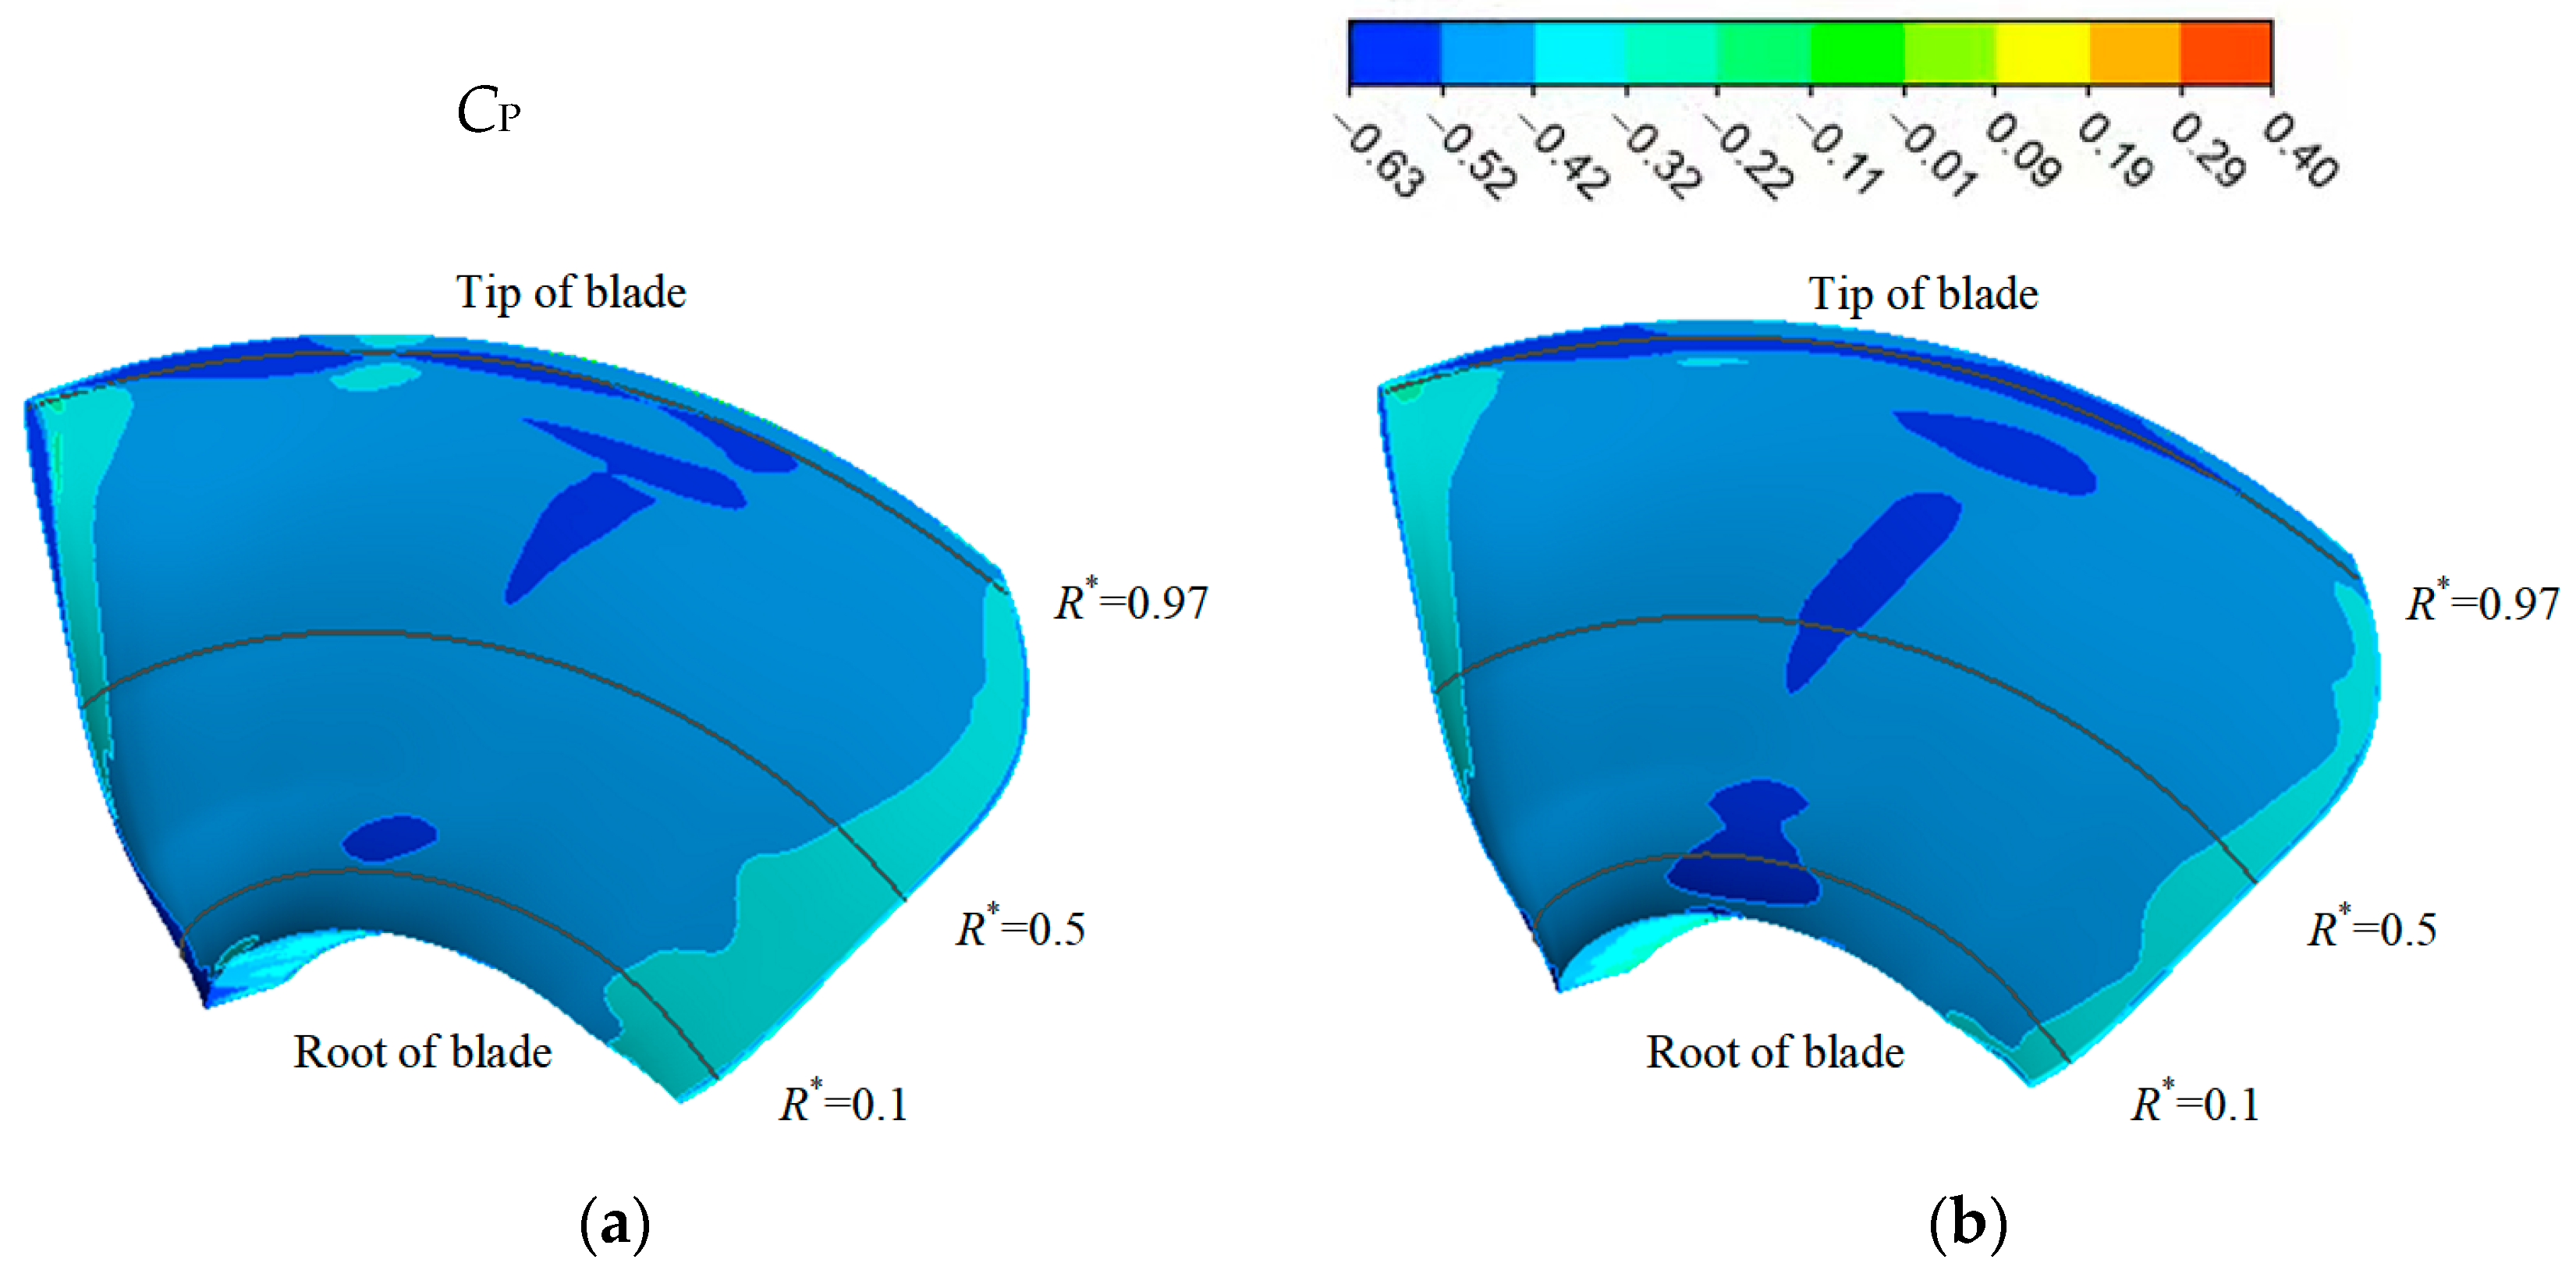
3.1.5. Distribution of Pressure Coefficients on the Blade Surfaces

When the cavitation coefficient (N*) is 0.474, the cloud plots of the distribution of the pressure coefficients (CP) on the suction surfaces of the prototype and model are shown in Figure 10. The pressure coefficient is determined by using Formula (10), with the p here representing the static pressure on the surface of the blade. It can be seen that the distribution of pressure coefficients on the suction surface of the blade in the prototype and model is similar. Due to the influence of the clearance leakage vortex, a strip of low-pressure region similar to the trajectory of the clearance leakage vortex appears at the tip of the blade.
The positions R* = 0.97, R* = 0.5, and R* = 0.1 of the blade span were selected to explore the distribution of pressure coefficients on the blade surfaces under different cavitation coefficients, as shown in Figure 11. Taking the device cavitation coefficient as an example, it can be seen that the prototype and model have similar changes in pressure coefficient on their blade surfaces under the same cavitation coefficient. The fluctuations in the pressure coefficients at the positions R* = 0.97 and R* = 0.1 are stronger than those at the position R* = 0.5 along the flow direction, which is mainly influenced by the shroud clearance flow and hub clearance flow. At the position R* = 0.97, it can be seen that the pressure drop occurs at the same chord length position for the prototype and the model. This indicates that the initial point of the clearance leakage vortex cavitation along the chord length is close to each other. However, the extent of the low-pressure region of the prototype is longer than that of the model along the chord length, which means that the clearance leakage vortex of the prototype has a greater influence on the suction surface of the blade. The distribution of pressure coefficients on the pressure surface remains constant regardless of the cavitation coefficient. The suction surface of the blade has a greater variation in pressure coefficients, particularly at the tip and root positions. This is because the clearance flows of the shroud and hub are greatly affected by the cavitation coefficient. At position R* = 0.97, the local pressure on the suction surface of the blade increases as the cavitation coefficient decreases. The local pressure increases will reduce the pressure difference between the pressure surface and suction surface of the blade to a certain extent and thus reduce the pressure load of the blade. Although the position of the pressure drop point on the blade surface does not change much with the decrease in the cavitation coefficient, the range of low-pressure regions across the chord length expands.

3.1.6. Cavitation Characteristics of the Runner Chamber

The distribution cloud map of the vapor volume fraction of the shroud surface can be seen in Figure 12. The cavitation characteristics of the runner chamber can be analyzed using these cloud maps. The cavitation of the runner chamber in the prototype and the model mainly occurs in the region from the middle of the blade to the exit edge of the blade. With the decrease in the cavitation coefficient, the cavitation of the runner chamber in the prototype occurs earlier than that in the model. When the cavitation coefficient is bigger than the device cavitation coefficient, the maximum vapor volume fraction on the shroud surface of the prototype and model is approximately 0. When the cavitation coefficient is 0.474, the maximum air volume fraction of the shroud surface of the prototype is about 0.32, while that of the model is about 0. It can be thought that the cavitation may occur in the runner chamber of the prototype under the device cavitation coefficient, but not in the runner chamber of the model. When the cavitation coefficient continued to decrease to close to the critical cavitation coefficient, the runner chamber of the model began to cavitate. when the cavitation coefficient is 0.208, the cavitation region on the runner chamber of the model is larger than that of the prototype, which is caused by the more serious cavitation degree at the tip of the model.

4. Conclusions

As the change in cavitation coefficients, the rules of the clearance cavitation flow between the prototype and the model are similar, but there are large differences in the energy characteristics and cavitation characteristics between the two. The specific characteristics are as follows.
  • Under the cavitation conditions, the energy characteristics (head coefficient, power coefficient, and efficiency) of the prototype are higher than those of the model. The operating conditions where the energy characteristics drop rapidly are the same. In addition, the critical cavitation coefficient of the prototype is close to that of the model. To some extent, the critical cavitation coefficient calculated by the model has reference significance for the prototype.
  • When the cavitation coefficient is larger than the critical cavitation coefficient, the cavitation characteristics of the blade and the runner chamber in the prototype are more serious than those in the model. When the cavitation coefficient is less than the critical cavitation coefficient, the degree of cavitation in the runner domain of the model is intensified. The cavitation characteristic of the runner chamber of the model is more serious than that of the prototype.
  • With the decrease in the cavitation coefficient, the cavitation of the runner chamber in the prototype occurs earlier than that in the model. The runner chamber in the prototype experiences cavitation at the device cavitation coefficient, while the runner chamber in the model does not. When the cavitation coefficient is reduced to close to the critical cavitation coefficient, the energy characteristics of the runner do not change much, but the cavitation significantly intensifies in the prototype and model.

Author Contributions

Conceptualization, Y.Z.; methodology, W.L. and L.Z.; software, Y.Z.; validation, T.C.; investigation, Y.Z. and W.L.; writing—original draft preparation, Y.Z.; writing—review and editing, Z.W. and W.L; visualization, Y.Z. and T.C.; supervision, L.Z. and W.L.; project administration, Z.W. and T.C. All authors have read and agreed to the published version of the manuscript.

Funding

This research was funded by the National Natural Science Foundation of China (No. 52079141).

Institutional Review Board Statement

Not applicable.

Informed Consent Statement

Not applicable.

Data Availability Statement

All data generated or analyzed during this study are included in this article.

Conflicts of Interest

Authors Wendong Luo and Tao Chen were employed by the company Guangxi Datengxia Gorge Water Conservancy Development Co. Ltd. The remaining authors declare that the research was conducted in the absence of any commercial or financial relationships that could be construed as a potential conflict of interest.

References

  1. Zhang, A.M.; Huang, W.C.; Li, D.F. Problems in the operation of Kaplan turbine. China Urban Econ. 2011, 30, 260. [Google Scholar]
  2. Liao, W.L.; Liu, S.Z.; Zhang, L.F. Experimental investigation of the tip clearance cavitations on blades flange of Kaplan turbine. J. Hydroelectr. Eng. 2005, 4, 67–72. [Google Scholar]
  3. Chen, Q.F.; Luo, Y.Y.; Li, X.G.; Ahn, S.H.; Zhang, J.; Wang, Z.W.; Xiao, Y.X. Influence of runner clearance on efficiency and cavitation in Kaplan turbine. IOP Conf. Ser. Earth Environ. Sci. 2018, 163, 012068. [Google Scholar] [CrossRef]
  4. You, D.; Wang, M.; Moin, P.; Mittal, R. Vortex dynamics and low-pressure fluctuations in the vortex dynamics and tip-clearance flow. J. Fluids Eng. 2007, 129, 1002–1014. [Google Scholar] [CrossRef]
  5. Tan, D.Q.; Han, X.L.; Liu, B.; Liu, W.J.; Wei, X.Z. Research on differences between clearance cavitation and airfoil cavitation in axial flow turbine. Large Electr. Mach. Hydraul. Turbine 2012, 2, 34–37. [Google Scholar]
  6. Xiao, X.W.; McCarter, A.A.; Lakshminarayana, B. Tip clearance effects in a turbine rotor: Part I—Pressure field and loss. J. Turbomach. 2001, 123, 296–304. [Google Scholar] [CrossRef]
  7. Amiri, K.; Mulu, B.; Cervantes, M.J. Experimental investigation of the interblade flow in a Kaplan runner at several operating points using Laser Doppler Anemometry. J. Fluids Eng. 2016, 138, 021106. [Google Scholar] [CrossRef]
  8. Ma, Y.; Qian, B.; Feng, Z.G.; Wang, X.; Shi, G.T.; Liu, Z.K.; Liu, X.B. Flow behaviors in a Kaplan turbine runner with different tip clearances. Adv. Mech. Eng. 2021, 13, 1069494471. [Google Scholar] [CrossRef]
  9. Wu, Y.Z.; Wang, X.H.; Yang, X.L.; Ding, J.F.; Zhu, D.; Tao, R.; Wang, H.M.; Xiao, R.F. Prediction of the influence of runner tip clearance on the performance of tubular turbine. J. Mar. Sci. Eng. 2022, 10, 136. [Google Scholar] [CrossRef]
  10. Liu, J.-S.; Bozzola, R. Three-dimensional Navier-Stokes analysis of tip clearance flow in linear turbine cascades. AIAA J. 1993, 31, 2068–2074. [Google Scholar] [CrossRef]
  11. Nikiforova, K.; Semenov, G.; Kuznetsov, I.; Spiridonov, E. Numerical investigation of tip clearance cavitation in Kaplan runners. IOP Conf. Ser. Earth Environ. Sci. 2016, 49, 092008. [Google Scholar] [CrossRef]
  12. Kim, H.-H.; Rakibuzzaman, M.; Kim, K.; Suh, S.-H. Flow and fast fourier transform analyses for tip clearance effect in an operating Kaplan turbine. Energies 2019, 12, 264. [Google Scholar] [CrossRef]
  13. Wang, L.K.; Lu, J.L.; Liao, W.L.; Zhao, Y.P.; Wang, W. Numerical simulation of the tip leakage vortex characteristics in a semi-open centrifugal pump. Appl. Sci. 2019, 9, 5244. [Google Scholar] [CrossRef]
  14. Zhou, J.L. Selection problems for pump station equipment. Drain. Irrig. Mach. 2001, 19, 3–12. [Google Scholar]
  15. Osterwalder, J. Efficiency scale-up for hydraulic turbo-machines with due consideration of surface roughness. J. Hydraul. Res. 2010, 16, 55–76. [Google Scholar] [CrossRef]
  16. Zheng, Y.C.; He, Z.R.; Chen, J.; Liu, D.X. Discussion on conversion method of performance parameters of the large pump unit. J. Hydraul. Eng. 1995, 10, 47–52. [Google Scholar]
  17. Hutton, S.P. Component losses in Kaplan turbines and the prediction of efficiency from model tests. Proc. Inst. Mech. Eng. 1954, 168, 743–762. [Google Scholar] [CrossRef]
  18. Ida, T. Analysis of scale effects on performance characteristics of hydraulic turbines—Part I. J. Hydraul. Res. 1989, 27, 809–831. [Google Scholar] [CrossRef]
  19. Ida, T. Analysis of scale effects on performance characteristics of hydraulic turbines—Part II. J. Hydraul. Res. 1990, 28, 93–104. [Google Scholar] [CrossRef]
  20. Ida, T. New formulae for scaling-up hydraulic efficiency of hydraulic turbines. J. Hydraul. Res. 1995, 33, 147–162. [Google Scholar] [CrossRef]
  21. Chen, S.S.; Ma, X.Z.; Chen, J.Q.; Zhou, Z.F.; He, Z.N. The conversion method of characteristic parameters of pump and pump set between prototype and model. J. Yangzhou Univ. (Nat. Sci. Ed.) 2015, 18, 45–48. [Google Scholar]
  22. McCormick, B.W. On cavitation produced by a vortex trailing from a lifting surface. J. Basic Eng. 1962, 84, 369–378. [Google Scholar] [CrossRef]
  23. Ren, J.; Chang, J.S. The scale effect of cavitation in the large hydraulic unit. Water Resour. Hydropower Eng. 1998, 29, 22–25. [Google Scholar]
  24. Ni, H.G. Correction of incipient cavitation coefficient for scale effect. J. Hydraul. Eng. 1999, 30, 28–32. [Google Scholar]
  25. Angulo, M.; Luciano, C.; Botero, F.; Rivetti, A.; Liscia, S. Dynamic measurements on a Kaplan turbine: Model—Prototype comparison. IOP Conf. Ser. Earth Environ. Sci. 2019, 240, 022006. [Google Scholar] [CrossRef]
  26. Angulo, M.; Rivetti, A.; Díaz, L.; Liscia, S. Air injection test on a Kaplan turbine: Prototype—Model comparison. IOP Conf. Ser. Earth Environ. Sci. 2016, 49, 022006. [Google Scholar] [CrossRef]
  27. Zeng, C.J.; Xiao, Y.X.; Zhang, J.; Gui, Z.H.; Wang, S.H.; Luo, Y.Y.; Fan, H.G.; Wang, Z.W. Numerical prediction of hydraulic performance in model and homologous prototype Pelton turbine. IOP Conf. Ser. Earth Environ. Sci. 2018, 163, 012016. [Google Scholar] [CrossRef]
  28. Li, Z.J.; Wang, Z.W.; Bi, H.L. Numerical study of similarity in prototype and model pumped turbines. IOP Conf. Ser. Earth Environ. Sci. 2014, 22, 032049. [Google Scholar] [CrossRef]
  29. Guo, Q. Study on the Characteristics of the Blade Tip Leakage Vortex Flow and the Cavitating Flow Field. Ph.D. Thesis, Agricultural University, Beijing, China, 2017. [Google Scholar]
  30. Zhang, Y.L.; Wu, Y.B.; Wei, J.W.; Wang, Z.W.; Zhou, L.J. Clearance flow field characteristics of Kaplan turbine under different flange clearance. IOP Conf. Ser. Earth Environ. Sci. 2022, 1037, 012023. [Google Scholar] [CrossRef]
Figure 1. The whole passage of the Kaplan turbine.
Water 15 03960 g001
Figure 2. The single-blade computation domain and boundary conditions.
Water 15 03960 g002
Figure 3. The relation curves between the validation indexes and the mesh number. (a) Efficiency; (b) the minimum pressure coefficient of the clearance leakage vortex cores.
Water 15 03960 g003
Figure 4. Meshes of the calculation domain. (a) Mesh in the single-blade calculation domain; (b) mesh on the blade surface; (c) mesh on the shroud surface.
Water 15 03960 g004
Figure 5. The relationship curves between the energy characteristics and the cavitation coefficients. (a) Head coefficient; (b) power coefficient; (c) efficiency.
Water 15 03960 g005
Figure 6. Clearance leakage characteristics. (a) The streamlines of clearance leakage flow and the clearance leakage vortex. (b) The relationship curves between the clearance leakage flow rate and cavitation coefficients.
Water 15 03960 g006
Figure 7. The tip clearance cavitation and clearance leakage vortex cavitation in the shroud clearance region.
Water 15 03960 g007
Figure 8. The isosurfaces of the vapor volume fraction αv = 0.1 under different cavitation coefficients. (a) N* = 0.7; (b) N* = 0.474; (c) N* = 0.248; (d) N* = 0.208.
Water 15 03960 g008
Figure 9. The relationship curves between the ratios of different cavitation volumes and cavitation coefficients. (a) Vcav-tip/Vcav-total; (b) Vcav-other/Vcav-total; (c) Vcav-tip/VRV; (d) Vcav-other/VRV.
Water 15 03960 g009
Figure 10. Distribution of pressure coefficients on the blade surfaces at N* = 0.474. (a) Prototype; (b) model.
Water 15 03960 g010
Figure 11. Distribution of pressure coefficients on the blade surfaces under different cavitation coefficients. (a) R* = 0.97; (b) R* = 0.5; (c) R* = 0.1.
Water 15 03960 g011
Figure 12. The vapor volume fraction on the shroud surface under different cavitation coefficients. (a) N* = 0.7; (b) N* = 0.474; (c) N* = 0.248; (d) N* = 0.208.
Water 15 03960 g012
Table 1. Basic parameters of Kaplan turbine.
GeometryPrototypeModel
Runner diameter D129.71 DmDm
Stay vanes Zs2525
Guide vanes Zg2828
Runner blades Z66
shroud clearance width ω4% Dm~4.57% Dm1.34‰ Dm~1.54‰ Dm
Table 2. The calculation results of the whole passage and the single-blade computing domain.
Computational DomainQ*H* P* ηCP
Whole passage0.5450.266134995.13%−0.929
Single-blade0.5410.263132495.19%−1.074
Disclaimer/Publisher’s Note: The statements, opinions and data contained in all publications are solely those of the individual author(s) and contributor(s) and not of MDPI and/or the editor(s). MDPI and/or the editor(s) disclaim responsibility for any injury to people or property resulting from any ideas, methods, instructions or products referred to in the content.

