1. Introduction
Most countries face an important problem of water pollution, which seriously threatens the biodiversity of aquatic organisms, disrupts the stability of ecosystems and ultimately harms public health [
1,
2]. Some authors note that anthropogenic pollution with low toxicity not causing the death of aquatic organisms may lead to the rapid adaptation of hydrobionts, which keeps certain species alive in polluted areas [
3,
4,
5]. However, such rapid adaptation is often accompanied by environmental compromises, such as reduced reproduction, smaller body size and increased susceptibility to other stressors [
6,
7,
8,
9], which may seriously affect individuals, populations and entire ecological communities. Variations in the physicochemical parameters of substances contaminating aquatic ecosystems may result from human activities related to the transportation, fishing and disposal of aquaculture domestic- and wastewater without proper treatment [
2,
10,
11,
12].
The increased biological impact of water-borne pollutants encouraged the scientific community to develop biomarkers using biological models [
13,
14]. The methods of biological monitoring provide information on the potential impact of water-borne pollutants on environmental risk assessment [
15]. However, traditional biological methods have some limitations: toxicity tests are valid at high concentrations of pollutants; biomarkers for early warning (small concentrations) are not considered [
16,
17].
Since the primary response of organisms detecting changes in physiological and environmental processes is behavioral activity, it can be recognized as an effective biomarker that can be used to assess the water quality and toxicity of water-borne pollutants [
18]. Additionally, behavioral biomarkers do not require animal killing even with long-term toxicity monitoring. Other important behavioral actions depend on behavioral activity, such as the search for food, protection against predators, reproduction, etc. Zooplankton swimming behavior may change under stress. It is therefore crucial to assess the potential impact of pollutants on organisms in order to ensure their safety and resistance [
19,
20].
Among the various modes of water pollution, emergency pollution attracts great public attention because it can pose a serious threat due to the sudden occurrence, rapid spread and unclear nature of pollutants [
21]. The existing traditional water quality assessment methods mainly measure the physical and chemical parameters of reservoirs [
22,
23]. Continuous pollution of water systems led to the development of reliable real-time monitoring approaches. In recent years, researchers have developed various types of computer sensors and online monitoring systems. But the appearance of foreign substances in the water is not always associated with the disturbance of ecological health. Therefore, in recent years, real-time monitoring technologies based on the behavioral responses of aquatic organisms have been significantly improved, which emphasizes the importance of behavioral toxicology [
24]. The generated behavior data can be analyzed using software, thus making the online behavior assessment a more controllable and efficient monitoring system [
18].
It is known that zooplankton are one of the most sensitive organisms in freshwater communities and that the number of many groups decreases under increased salinity [
8,
25,
26,
27]. Since zooplankton are the main intermediate link between primary producers and fish, their study is critical not only from a scientific, but also from a practical perspective.
The key zooplankton species in the Barents Sea pelagic ecosystem include large herbivorous copepods
Calanus finmarchicus,
Calanus glacialis Jaschnov,
Calanus hyperboreus Krøyer and
Metridia longa Lubbock. In the spring–summer period, these species account for up to 90% of the total biomass of mesozooplankton [
28]. Among small copepods (body size ≤ 1 mm),
Oithona similis Claus,
Pseudocalanus Boeck and
Microcalanus Sars G.O. are the most numerous [
28,
29,
30]. The dynamics of species composition were noted. Such copepods as
Oithona similis,
Calanus finmarchicus and
Pseudocalanus sp. were the most numerous (43.4, 23.2 and 15.9% of the total copepod count, respectively), and
Metridia longa accounted for 3.5%. However, according to biomass,
C. finmarchicus (63.7%),
Pseudocalanus sp. (14.4%) and
M. longa (9.4%) were the most important species, while O. similis amounted to only 3.0% [
31].
Among the biomonitoring and bioassessment technologies of the complex toxic impact of chemical pollutants on various levels of biological indicator systems [
32,
33], online biomonitoring is one of the most promising tools to obtain more effective and virtual biotoxicity data for subsequent risk assessment [
33].
According to Zhao [
34], online biomonitoring technologies are mainly divided into three categories according to differences in biophysiological and environmental indicators [
23]: (1) behavioral changes, including speed and position when swimming [
18,
35]; (2) biological metabolic changes [
36,
37,
38]; and (3) physiological changes accompanied by changes in electrical activity: changes in electrocardiogram (ECG) [
39,
40] and changes in electroencephalogram (EEG) [
41]. Note that the second and third categories can only be implemented in laboratory conditions. It is difficult to implement the first category in natural conditions since it is quite difficult to separate passive changes in the position of plankters due to the flow or change in the density of water from the active mobility characterizing their functional state.
The works by Dyomin et al. [
42,
43] showed that the indicator of habitat pollution may be a change in the phototropic response of zooplankton. The response of zooplankton to photostimulation changes against the background of the changed physiological state of hydrobionts when pollutants act [
42,
43]. Although, to date, the mechanism of this impact on zooplankton remains poorly understood, laboratory and field studies showed that photostimulation provides early detection of pollutants in the water medium according to behavioral responses [
44].
Ren et al. [
35] note that the most basic requirements for the monitoring system include its technical stability, which is being improved with the development of biological and electronic science and technology, and the repeatability of results due to the internal physical and environmental state of organisms [
2,
24,
34], which is affected not only by most pollutants, but also by circadian rhythms [
45].
The laboratory studies by Morgalev et al. [
44] revealed that the responses of
Daphnia magna Straus and
Daphnia pulex to photostimulation depend on the intensity of the attracting light. This makes it difficult to indicate the appearance or change in the concentration of a pollutant. The variability in the behavioral response is associated with the nonlinear response of plankton ensembles to photostimulus intensity. As the intensity of the illumination increased, the variability in the phototropic response underwent the phases of increase, decrease and relative stabilization. The authors proposed the use of paired photostimulation that includes two successive impacts of increasing intensity. The first stimulus stabilizes the behavioral response, and the increase in response to the second stimulus makes it possible to more accurately assess the response of the plankton ensemble. The study shows the high reliability and increased sensitivity of this method of detecting contamination in the aquatic medium compared with single photostimulation or traditional biotesting methods.
Thus, there is currently no common approach to the selection of an indicator of the physiological state of the plankton community in natural conditions, which is resistant to natural changes in the environment on the one hand and sensitive to low concentrations of pollutants on the other. The testing of the paired phototropic response as such an indicator performed in a freshwater reservoir [
46] made it possible to determine the purpose of this work—to identify the possibility, features and conditions for using paired photostimulation for the early detection of contamination of salt and marine waters.
We previously proposed and tested the phototropic response of plankton communities to paired photostimulation in the conditions of a freshwater reservoir as an indicator of the quality of the aquatic environment, which showed the potential for its use to generate an alarm signal in case of an unfavorable ecological situation in the water body [
47].
The purpose of this work is to confirm the advantages of this indicator in comparison with the indicators of the size diversity and taxonomic belonging of plankters, the spectral characteristics of the variation in their concentration, and their response in salt-water bodies.
2. Materials and Methods
2.1. Study Area
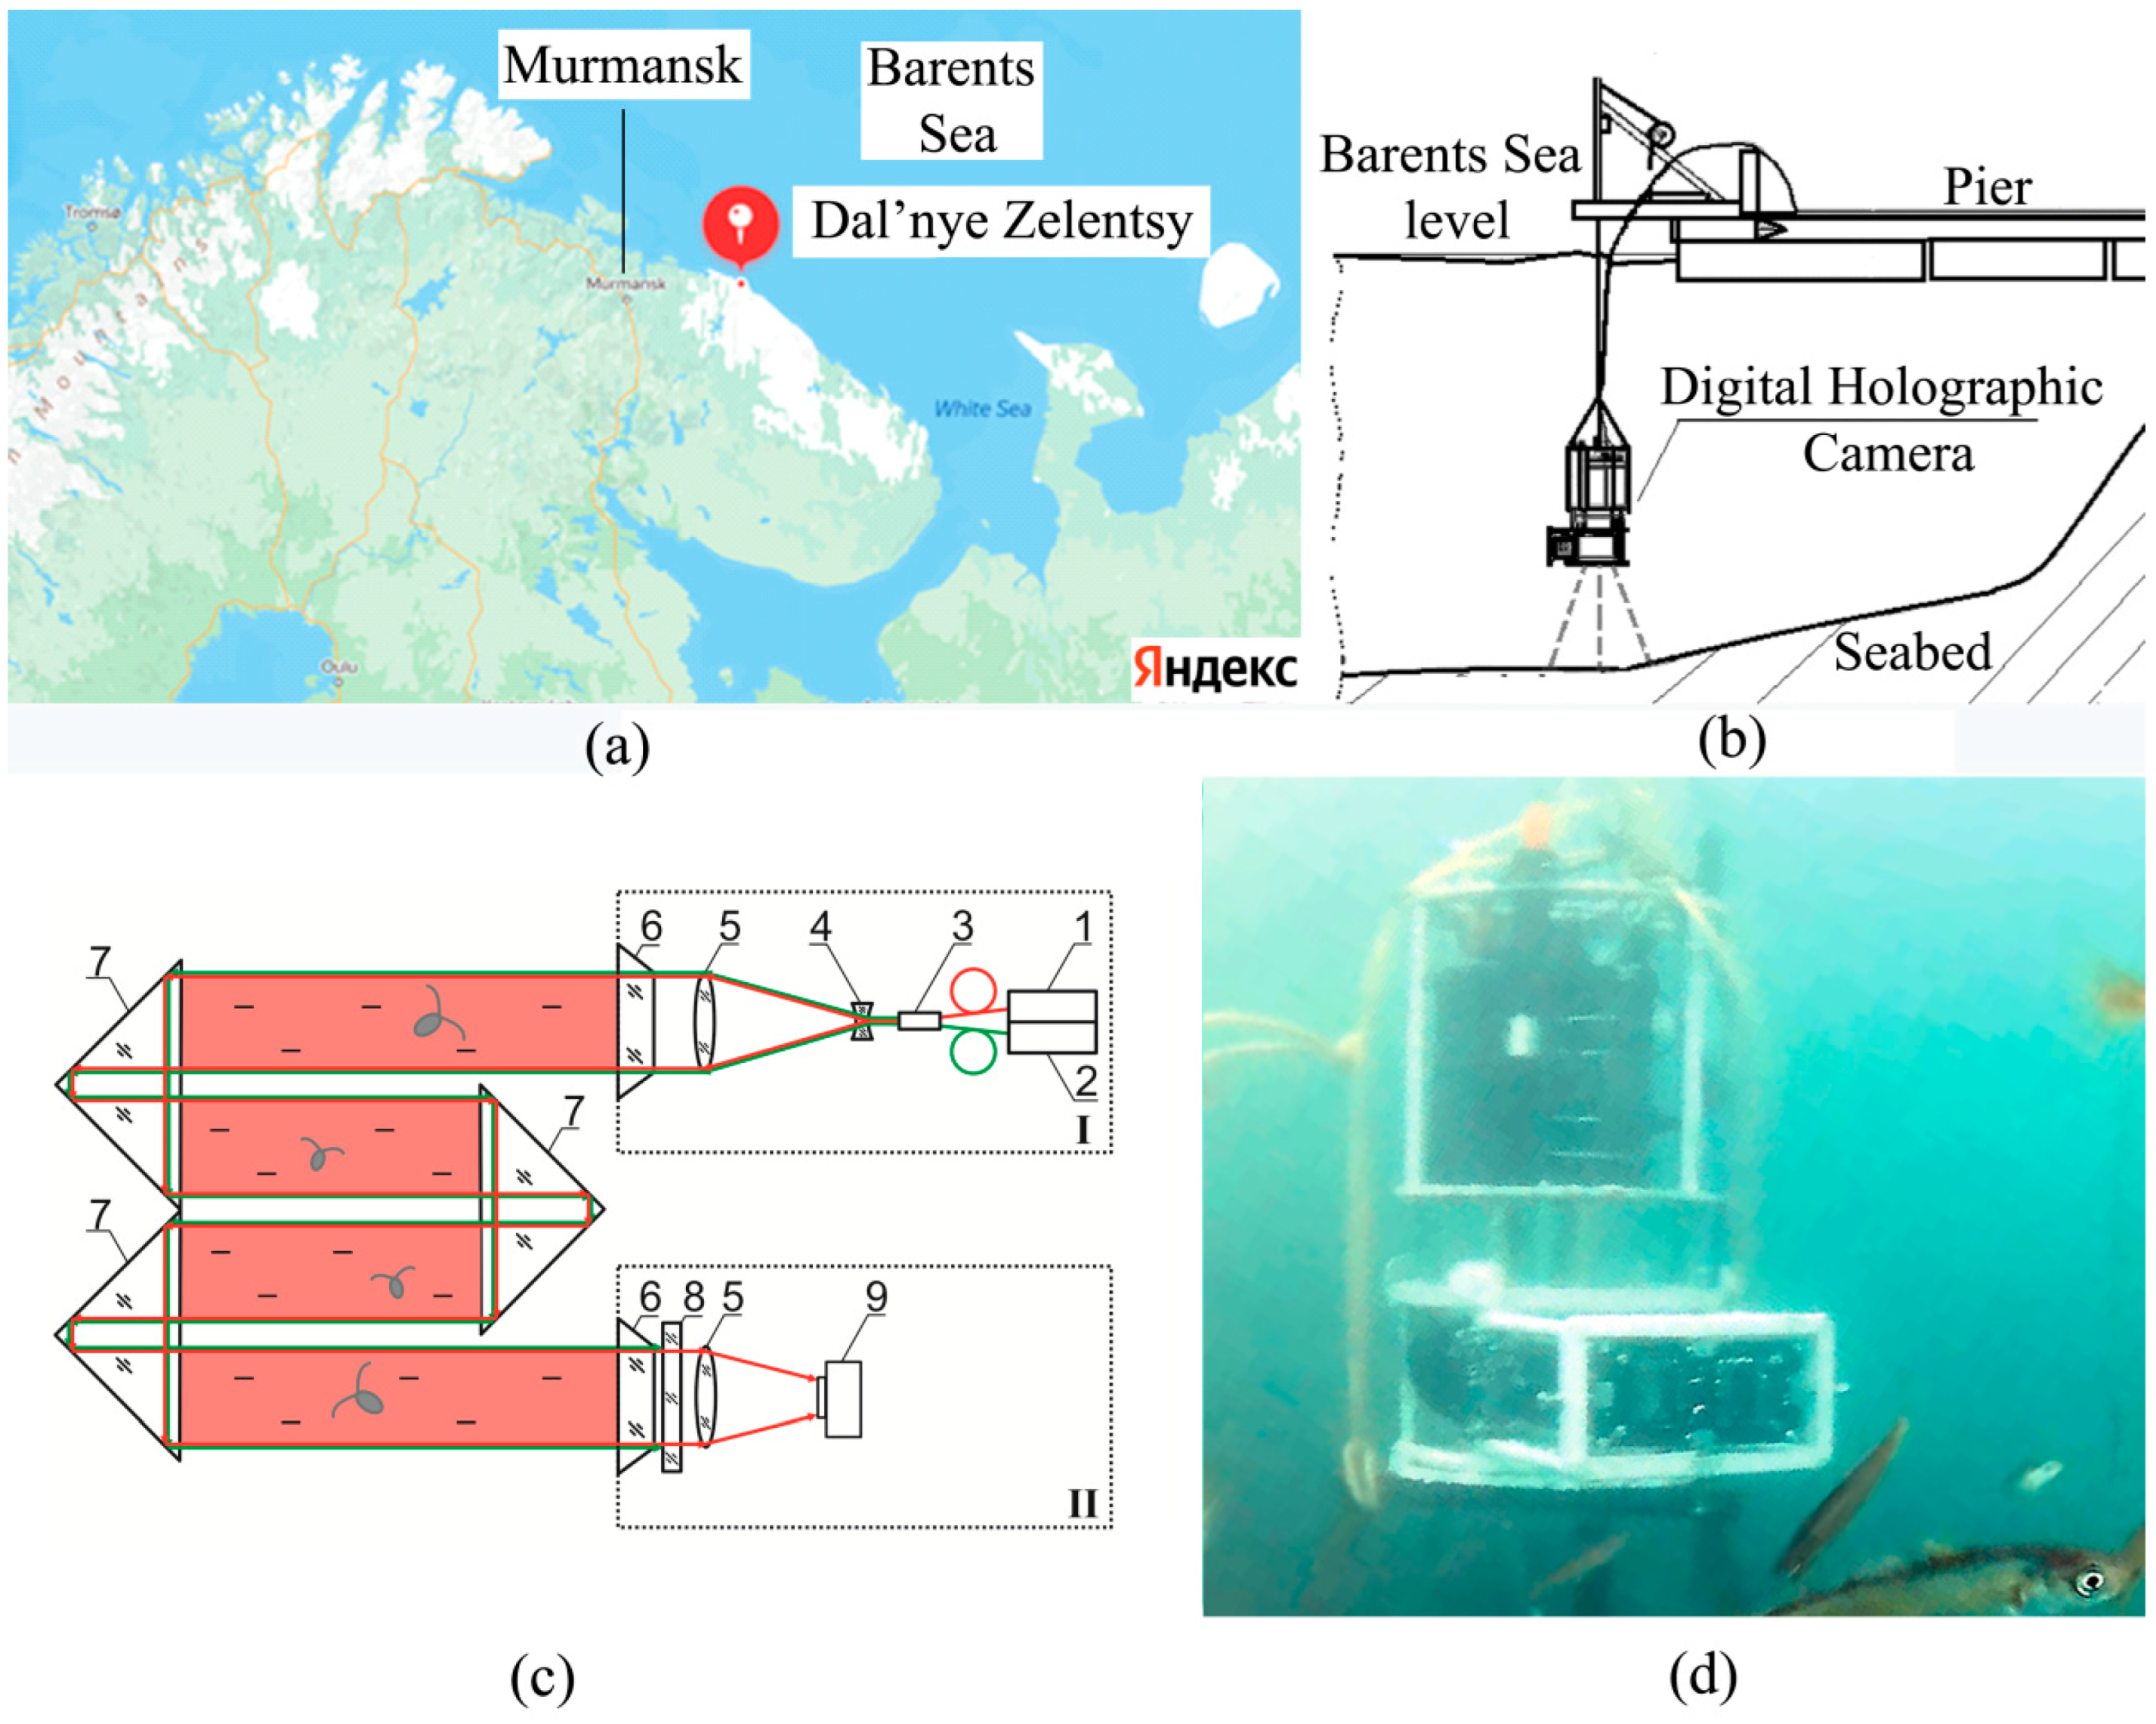
The studies were performed in the water area of the Zelenetskaya Bay of the Barents Sea in Dalnye Zelentsy village (
Figure 1a) from 27 July 2022 to 24 September 2022.
The Zelenetskaya Bay (a shallow bay in the eastern part of the Murmansk coast) forms an inlet between Cape Dernisty (69°08′ N, 36°05′ E) and Cape Zelenetsky [
48]. The bay mouth is oriented to the north–northeast. There are 5 islands in the estuary part protecting the bay from the sea wave. During the neap tides, some islands are connected by drying isthmi. The water area of the bay (excluding islands) is 2.23 km
2. The Dalnye Zelentsy village is located on the shore in the southwestern part of the bay. Most of the bay has a depth of less than 7 m; in the deepest part—western part—it does not exceed 11 m at low tide. There are small depressions with depths of up to 15–18 m in the western and eastern parts of the bay. In the open sea there is a bypass with a depth of more than 200 m from the west of the Zelenetskaya Bay. A branch of the warm Murmansk coastal current, which affects the hydrology of the bay, approaches the coast along this bypass. There is a free water exchange with the sea through the western and eastern straits between the bedrock coast and the islands.
Two streams flow into the bay at the west bank, in the Oscar Bay, and at the east bank, in the area of the littoral shelf, which serve the discharge for the freshwater runoff of the drainage area. The tidal currents in the bay are weak. The maximum speed of tidal currents is noted in the western strait. They reach about 1 km/h. The tidal regime is semidiurnal. The difference in the heights of high and low water in syzygy reaches 4–4.2 m, and 2 m in quadrature.
Currents in the bay do not have a clear continuous pattern and are folded under the influence of tidal variations in level, shoreline and bottom configurations. All currents are unstable with fluctuations in the 80–150° sector. The daily speed variability is within the range of 4.5–17 cm/s. The daily average speed varies from 8.3 to 10.7 cm/s. The decrease in speed in the lower horizons compared with the overlying ones is insignificant. The rhythm of diurnal variability depends to a greater extent on the wind and disturbance in the open part of the sea. The variability in the daily average speed has a pronounced seasonal rhythm. The minimum speed on all horizons is observed in February–March and the maximum in October–November, which is determined by seasonal fluctuations in the intensity of the Murmansk coastal current.
Waves with a height of 0.3–0.5 m prevail in the average annual wave climate. Waves of the maximum height are observed in winter with the maximum south-west winds. Their height reaches 0.8 m. As a rule, such waves are observed in December–February. Due to the fact that the bay is closed from strong winds and wind-generated sea and swell waves (inertial waves), the repeatability of calm sea in the average annual mode can be estimated as high—18–35%. The calmest period is spring–summer (32–35% of calm sea), and the most turbulent period is autumn—September–November, when the repeatability of calm sea is only 18%. Periodically, swell waves are generated in the bay due to long wave disturbances of the open sea surface.
Atmospheric factors, temperature and salinity of the waters in the Zelenetskaya Bay are determined by the characteristics of the waters of the Murmansk coastal current entering the bay.
The hydrobiological probe, which included the DHC and sensors of upper illumination, oxygenation, conductivity, temperature and pressure, was lowered to the bottom at the stage of plankton depth profile measurement using a winch, and during long-term monitoring it was fixed at an altitude of 4 m above the bottom (
Figure 1b).
2.2. Digital Holographic Camera
The design of a submersible digital holographic camera (DHC) was earlier described in detail by us [
42,
49]. The DHC allows one to record a hologram of the entire working volume of the medium (volume illuminated by a laser beam,
Figure 1c) followed by numerical reconstruction of holographic images of the medium cross-section layers at a predetermined pitch with further study of particles contained in the layers. In this case, the images of particles reconstructed from a hologram reliably determine the size, shape, coordinates of individuals, the nature of their movement, as well as their recognition and classification by taxa. This makes it possible to study the size distribution and behavioral responses of both the entire plankton community and individuals of different taxa separately. The design of the DHC-probe makes it possible to change the distance from the illuminating to the recording module in accordance with the turbidity of the medium. Under the conditions of this expedition, the optimal distance was 494 mm (with a maximum possible value of 694 mm), which formed a working volume of 0.112 dm
3.
Two semiconductor laser diodes were used in the DHC-probe: with a wavelength of 532 nm for the photostimulation of plankton and with a wavelength of 650 nm for hologram recording. The maximum illumination level near the illuminating block was 3400 lx (100%).
2.3. Paired Photostimulation
Two factors influence the accuracy and reproducibility of plankton behavioral responses: inter-individual variability in the background and different biological significances of different light intensities. We developed the method of paired photostimulation to reduce these influences, which was described in detail in Morgalev et al. [
44] and Dyomin et al. [
46].
The first, smaller impact stabilizes the functional state of the plankton community. The second, more intense, impact causes the crustaceans to move at a rate corresponding to their physiological state.
2.4. Hologram Registration Cycle for Determining the Paired Phototropic Response Index (pPhR Index)
The average number of crustaceans was determined from a set of 20 holograms of the DHC working volume recorded over 5 min. The number of crustaceans for each hologram was identified, and then the average concentration of 20 counts was calculated.
The DHC software allows for automatic recognition and classification of particle images reconstructed from registered digital holograms. To assign a particle to a particular taxon, not only the length of the particle is taken into account, but also the morphological parameter, which is the width–length ratio of the particle. The presence of particle outgrowths is critically important to assign it to zooplankton. The algorithm of automatic classification is described in detail in several of our articles [
42]. In short, it can be said that zooplankton include particles with a size of more than 80 µm with the presence of outgrowths, which are divided by size and morphological parameter into Cladocera, Copepoda nauplii, Copepoda adult, Chaetognatha, Appendicularia and Other. The values of the corresponding taxonomy criteria for certain particles are taken on the basis of an experiment, which is one of the tasks of expedition measurements [
47].
Three 5 min hologram sets were recorded to calculate the pPhR: (1) without photostimulation (I0); (2) at photostimulation with intensity I1 (illuminance 850 lx); and (3) at the second stage of photostimulation with intensity I2 (illuminance 2550 lx).
The duration and intensity of photostimulation when determining the pPhR index during monitoring were different: 10 min during the photostimulation with intensity I1 (illuminance 850 lx) and 10 min during photostimulation with intensity I2 (illuminance 3400 lx). Moreover, each of the 20 consecutive holograms was recorded once every 30 s.
Once the concentration during the first (C
1) and second (C
2) photostimulation was defined, we determined the pPhR according to the following formula:
2.5. Measurement of Plankton Profiles by Depth
To register the concentration profile and phototropic response profile of plankton, the DHC-probe was lowered from the surface to the bottom with stops every meter, during which the phototropic response index was determined. Depending on the tidal water level, the depth of the profile ranged from 7 to 12 m with the corresponding number of recorded cycles. The profile was further registered at 14:00, 20:00, 02:00, 8:00, 11:00, 17:00, 23:00 and 05:00 local time of adjacent days.
In parallel, we performed the vertical catching with a small Juday net with a mesh diameter of 168 μm.
The samples were collected in a layer from the bottom to the surface at the moorage zone near the point of DHC-probe immersion at the same time intervals.
The plankton sample was poured from the plankton insert into a 1 L plastic tank and fixed with a 40% solution of formalin neutralized with sodium tetraborate. The final concentration in the sample was 4%. The samples were processed under laboratory conditions. The office processing of the samples was carried out according to standard methods [
50]: 3 sub-samples with a volume of 2–3 mL were taken from each sample (the volume of the sub-sample was dependent on the number of organisms), which were analyzed in a Bogorov chamber or Petri dish (depending on the size of the zooplankters) using an MBS-10 stereoscopic microscope (with magnifications of ×16, ×32 or ×56).
The rest of the sample was fully analyzed to account for and measure the rare species. The species and age composition of zooplankton dominants was established with the use of determinants [
50,
51].
The biomass of certain species and taxonomic groups was calculated using nomograms, as well as the tables of weights of marine hydrobionts and dimensional-weight dependencies [
52,
53,
54,
55,
56,
57,
58]. The organisms were identified by class, genus, and, if possible, species. The results of the quantitative analysis of the three sub-samples were averaged and recalculated in ssp/m
3 taking into account the volume of filtered water, assuming 100% net filtration efficiency. The body length for dominants was measured in 100–150 species in each sample. The body length was measured for appendicularians regardless of their tail length. The mean values were presented with the standard error of mean.
2.6. Modeling of Anthropogenic Impact
A saturated NaCl salt solution (medium-ground salt (grinding 2) (manufactured by BSK-sol Belgorod, Russia)) was used as an impact temporarily disrupting the functional state of plankton. Preliminary laboratory studies showed that the phototropic response of salt-water crustaceans decreased when a saturated NaCl solution was drop-by-drop introduced into the seawater zone surrounding the working volume.
The table salt solution at a concentration of 300 g/dm3 was introduced in drops through a perforated tube ring surrounding the probe. The solution was introduced at a rate of 20 dm3 per day.
The design of the dropper ensured the fulfillment of the following principles:
- -
locality of pollutant introduction not affecting the extensive biocenosis;
- -
minimum disturbance of the working volume by optical inhomogeneities;
- -
possibility of recording changes in the medium parameters during pollutant introduction (using a conductivity sensor).
2.7. Study Design
After determining the depth of the layer with the maximum intensity of phototaxis, the camera was placed in this layer for long-term monitoring. To select the modes for subsequent photostimulation, the phototaxis was recorded for different illumination intensities: 25, 50, 75 and 100% of the maximum illumination for a light source of 3400 lx. The duration of stimulation amounting to 5 and 10 min was studied at each stage.
The next stage of the study included the long-term monitoring of crustacean concentration and the definition of the pPhR index (06.08–15.09.22) at a fixed position of the DHC at an altitude of 4 m from the bottom. The cycles (
Section 2.4) were registered once per hour.
At the next stage, the anthropogenic impact was modeled by adding a solution of table salt.
2.8. Statistical Data Analysis
Statistical processing was performed using Statistica 10 (StatSoft, Inc., Tulsa, OK, USA). The Mann–Whitney U-Test was used instead of the Student’s
t-test in case of deviation from the normal distribution. The Shannon Diversity Index was calculated similarly based on the histograms of crustacean sizes and species composition [
46].
The spectral analysis of long-term monitoring series and multiple regression analysis were performed using Statistica 10.
The results are presented as Mean ± Standard error of mean.
3. Results
3.1. Plankton Profiles by Depth
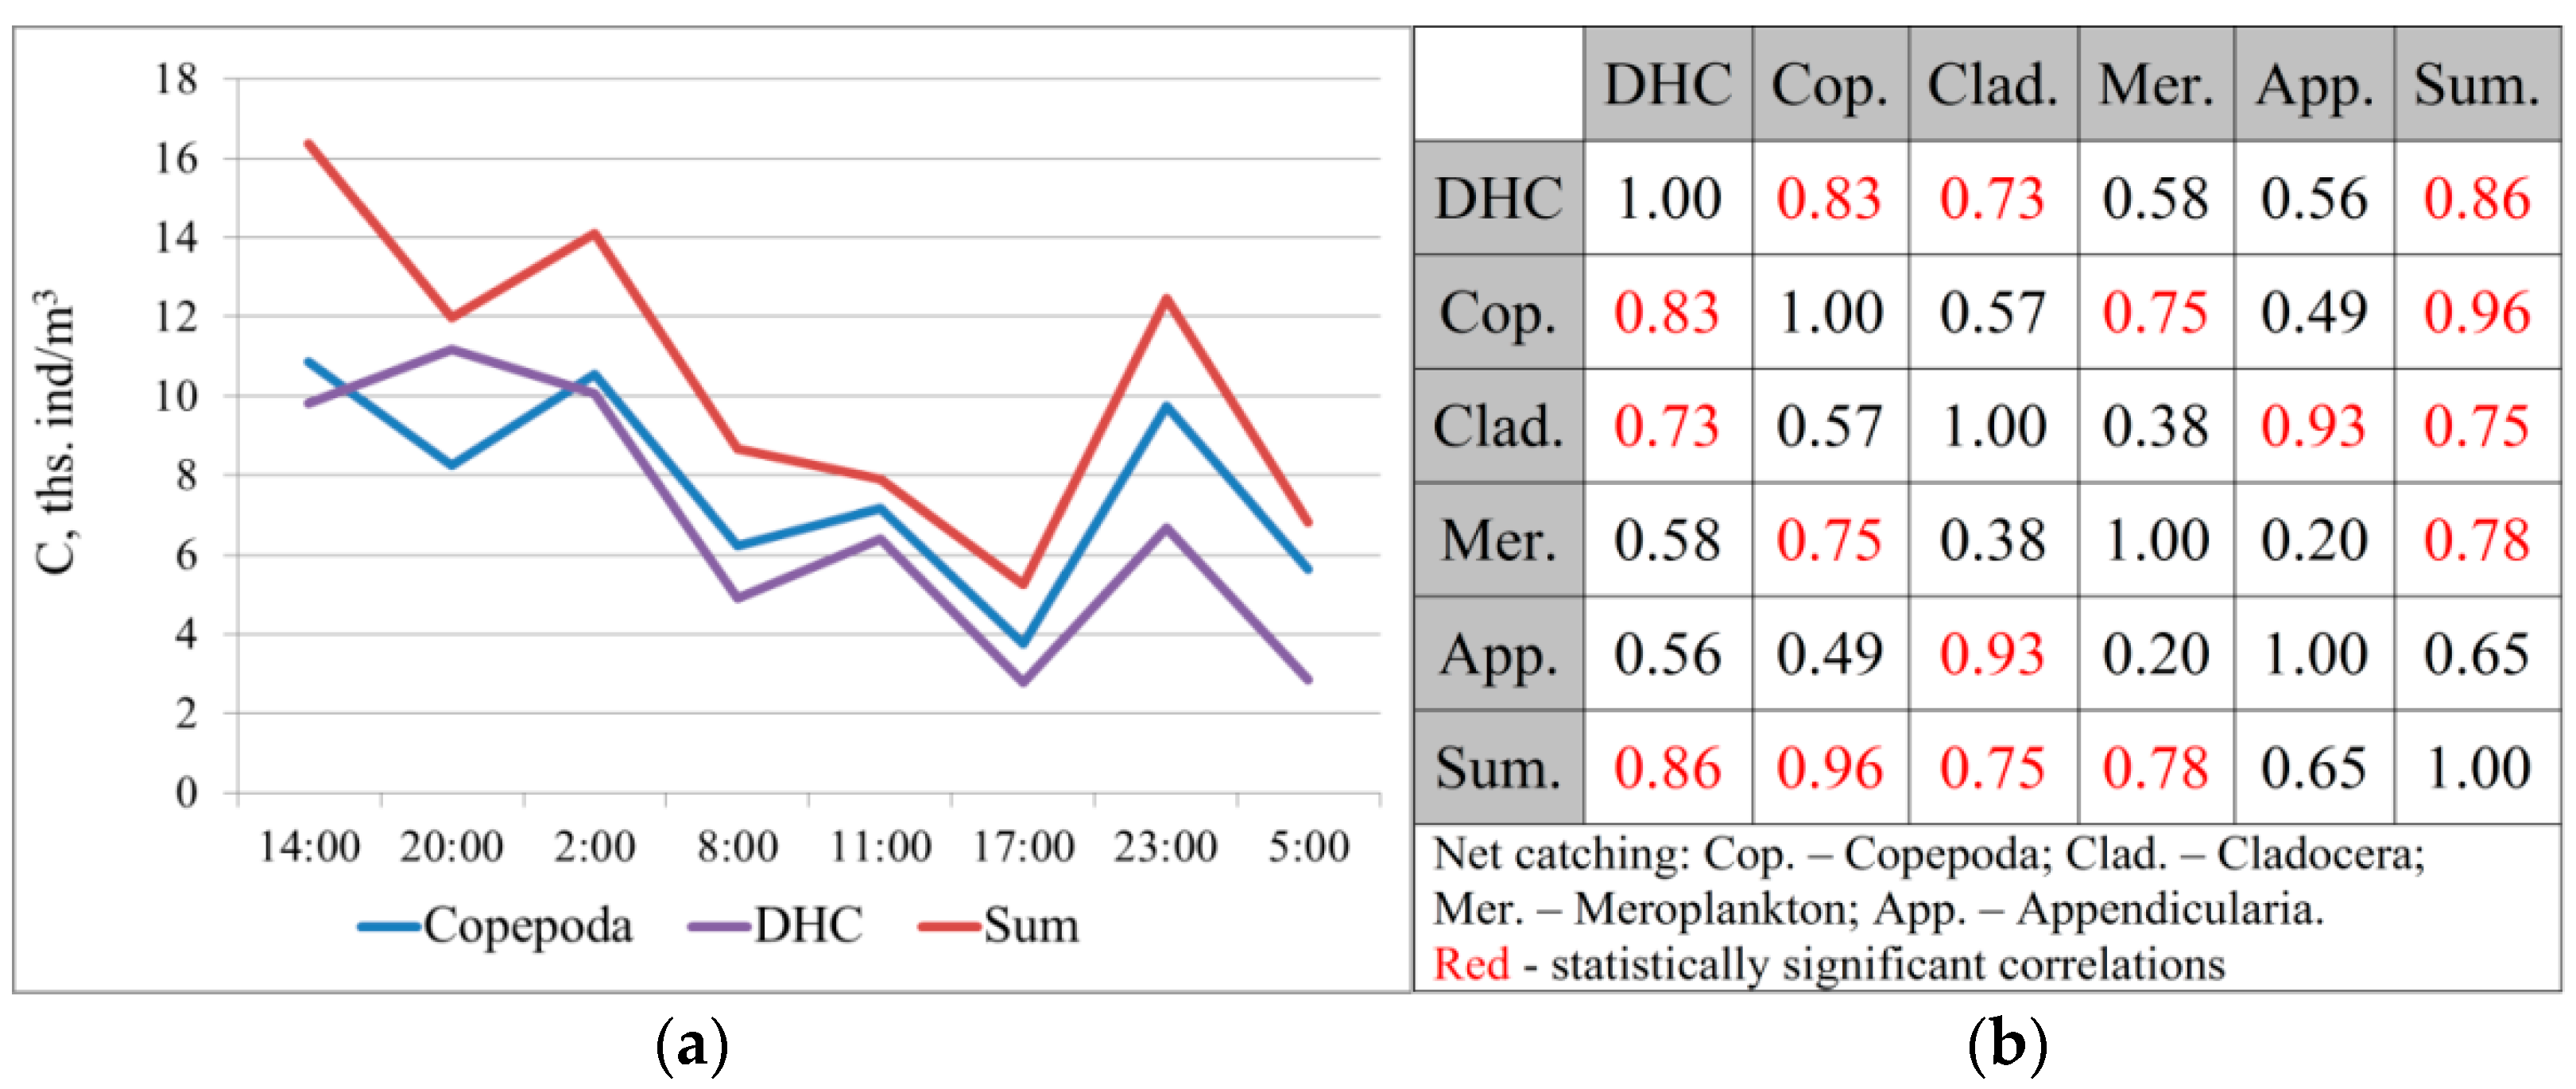
It is quite difficult to compare the obtained data due to the different spatial resolutions of the concentration measuring methods using the Juday net (in this study—a column from the bottom to the surface) and using the DHC (every meter). The studied profiles showed the largest representation of Copepoda crustaceans: on average, 75.6 ± 2.8% of the total number according to catching data and 86.0 ± 1.1% according to the DHC data. Cladocera crustaceans account for 8.6 ± 1.5% of the catching data and 8.8 ± 1.4% according to the DHC data.
The similarity of the results obtained using these methods is evident by comparing the average concentration values in successively studied profiles (
Figure 2).
A high degree of correlation was found between the DHC data and the total concentration of crustaceans according to the net catching data: r = 0.86 ± 0.21, p = 0.006. There is also a high correlation with the concentration of Copepoda, which make up the majority of plankters (r = 0.83 ± 0.23, p = 0.01).
According to the Chaddock scale [
59], this bond strength was “high”, and was reliably different from zero. The consistency of the data obtained with these methods made it possible to further use a method for registering the concentration of crustaceans with high time and spatial resolution using the DHC-probe.
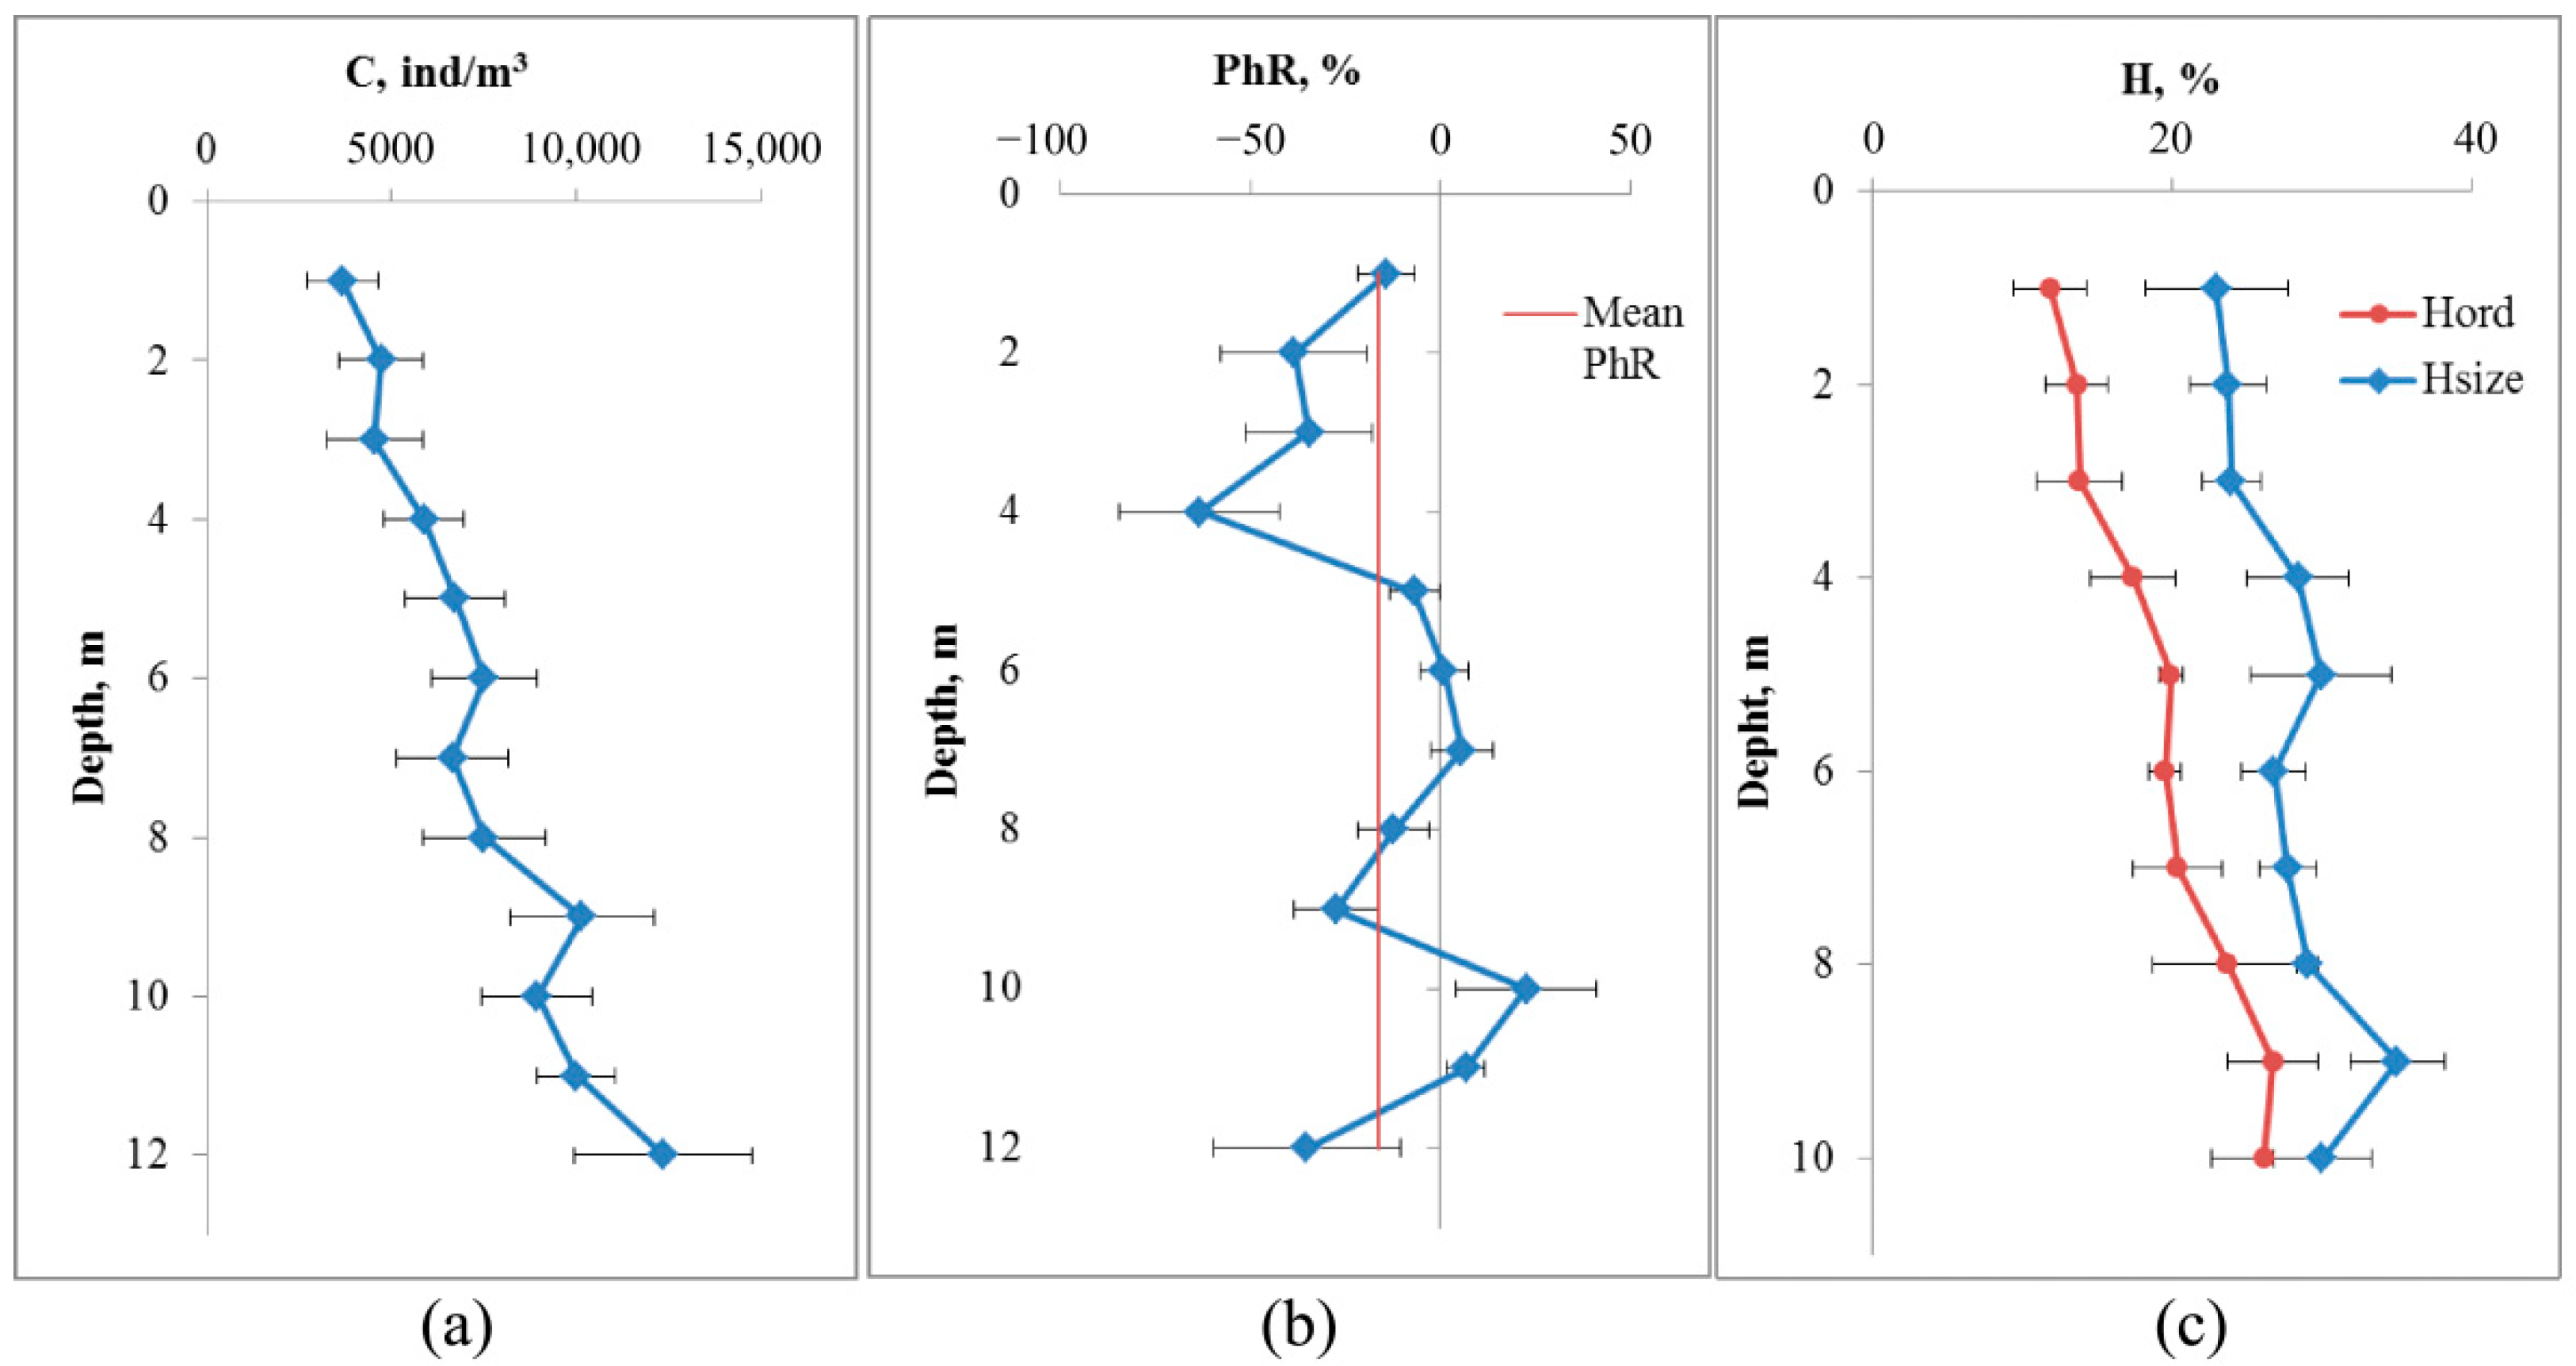
The depth profile of crustaceans averaged over eight measurements by the DHC-probe in accordance with
Section 2.5 is shown in
Figure 3.
The concentration of crustaceans increases as the depth increases from 3660 ± 970 ind/m3 at a depth of 1 m to 12,380 ± 2420 ind/m3 at a depth of 12 m (p = 0.004). At a depth of 9 m (which corresponds to a distance from the bottom of 4 m), a local maximum concentration of 10,140 ± 1960 ind/m3 was registered, which is significantly different from the values at the surface (p = 0.01).
The change in the phototropic response had two local minima significantly different from zero: at a depth of 4 m (−63 ± 21%, p = 0.01) and 9 m (−27 ± 11%, p = 0.027). The average phototropic response was −16.4 ± 6.9%, thus reliably different from zero (p = 0.026), which corresponds to a negative phototropic response to illumination.
Based on the combination of profile analyses, the depth of the DHC-probe for subsequent studies was 4 m from the bottom.
Another indicator of the state of the mesozooplankton community may be the entropy of individuals by size or systematic affiliation (
Figure 3c).
The change in the entropy of zooplankter dimensions by depth is not large and does not differ significantly from the values at the surface (22.9 ± 4.7% at a depth of 1 m and 35.0 ± 3.1% at a depth of 9 m, p = 0.052). At the same time, the entropy of species composition varies from 11.9 ± 2.4% at a depth of 1 m to 26.7 ± 3.0% at a depth of 10 m (p = 0.005, df = 14).
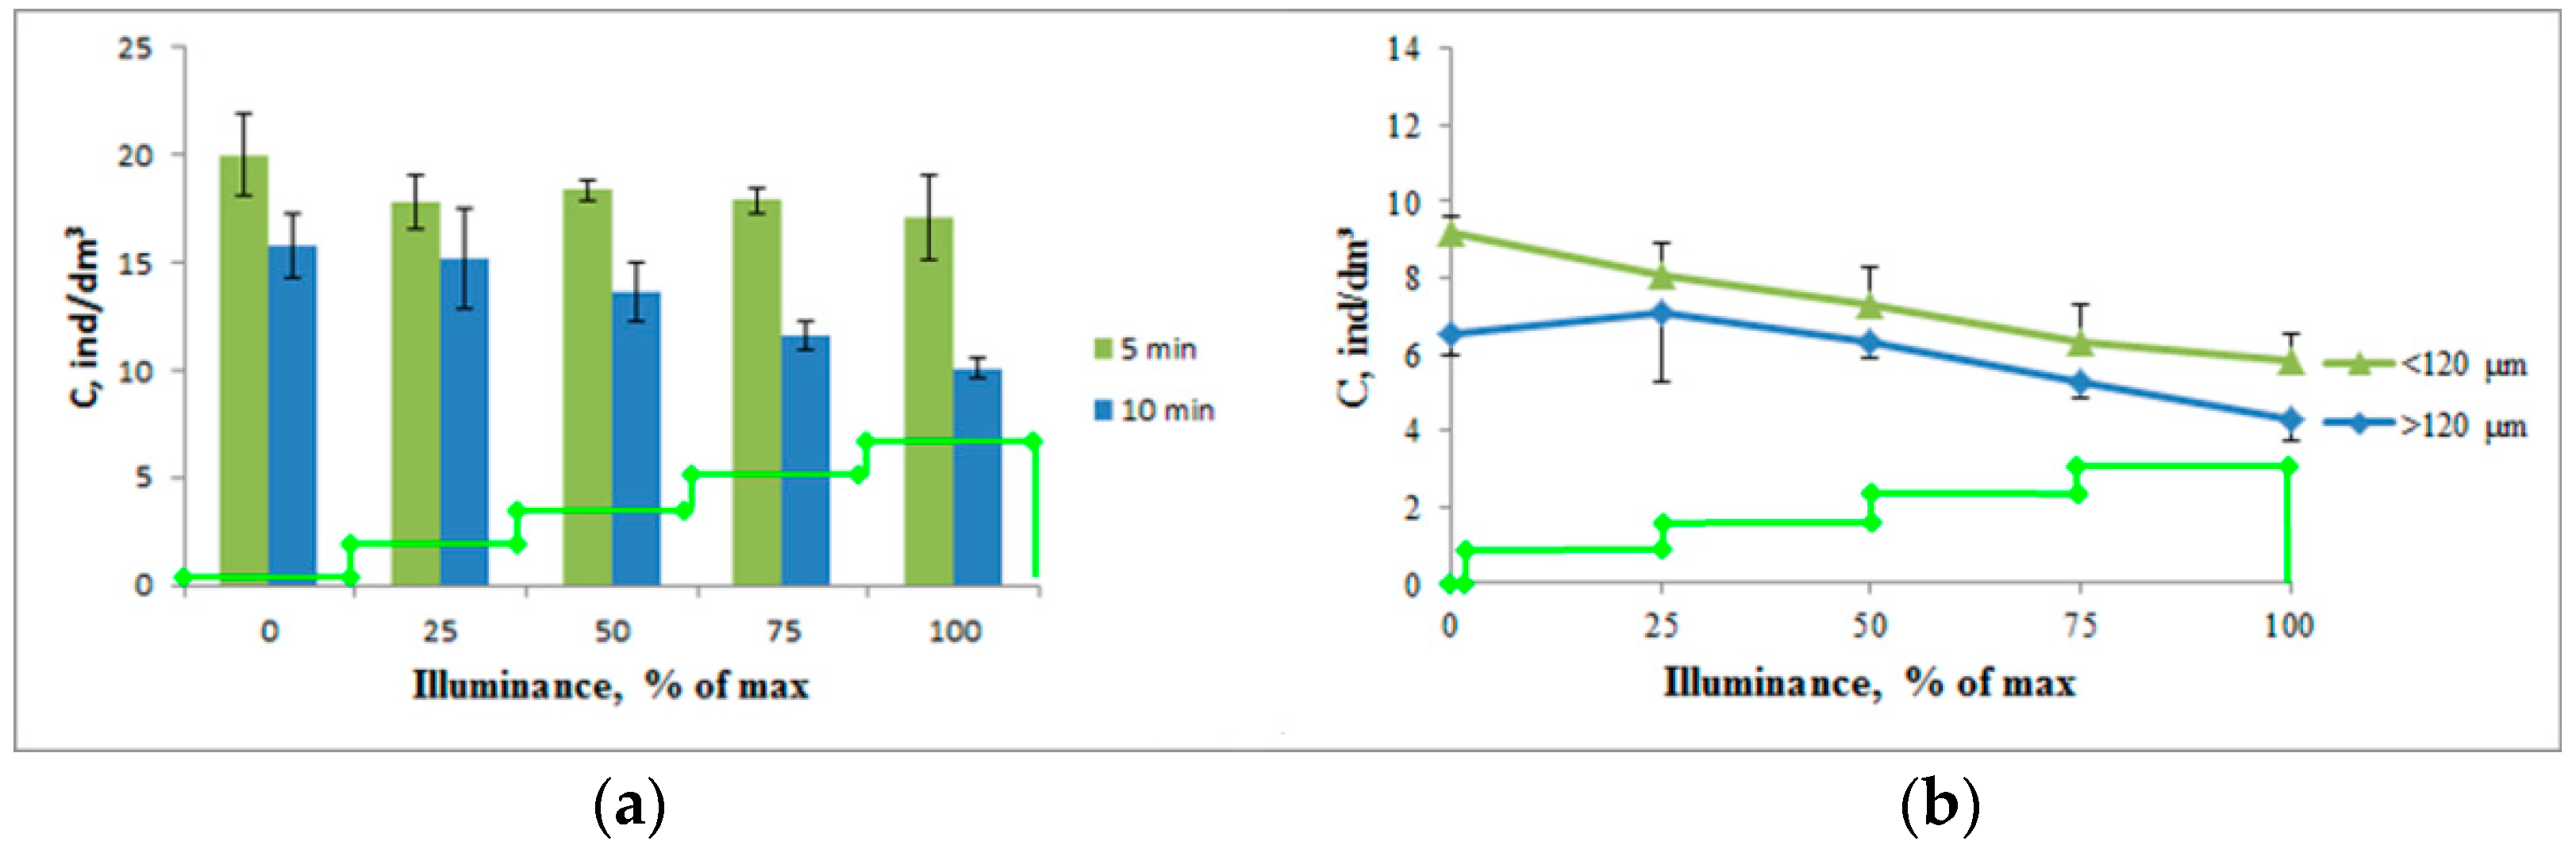
3.2. Choice of the Optimal Ratio of Photostimulation Intensities
Under laboratory conditions, we established [
41] that the greatest response was observed with the use of paired photostimulation according to the scheme: “first stage of photostimulation—5 min, 25% of maximum illuminance + second stage—5 min, 75% of maximum illuminance” (0 lx, 1150 lx and 3450 lx).
When adjusting for the conditions of the moorage place, taking into account the turbidity of the water and the negative phototropic response, the studies were performed with an increased duration of photostimulation at each stage (
Figure 4).
An increase in the intensity of photostimulation led to a decrease in the concentration of crustaceans in the working volume, both at 5 min and 10 min stimulation. Moreover, with 5 min stimulation, this process was expressed as a tendency (a decrease in the concentration from 20.0 ± 1.9 ind/dm3 to 17.1 ± 2.0 ind/dm3, p = 0.36). With 10 min stimulation, this process was reliable—the decrease in the concentration of crustaceans ranged from 15.8 ± 1.5 ind/dm3 to 10.1 ± 0.5 ind/dm3, p = 0.02. This process was observed both for plankters with a size of less than 120 μm (a decrease in concentration from 9.2 ± 0.4 ind/dm3 to 5.8 ± 0.7 ind/dm3, p = 0.015) and for larger individuals (a decrease in concentration from 6.5 ± 0.5 ind/dm3 to 4.3 ± 0.6 ind/dm3, p = 0.047).
At the same time, the crustaceans larger than 120 μm showed a tendency for a positive phototropic response with minimal photostimulation intensity (p > 0.05) leading to a subsequent steeper decrease in the concentration. The rate of concentration decrease was 0.94 ind/dm3 per one stage of photostimulation, which exceeds that of smaller crustaceans—0.86 ind/dm3. At the same time, almost 100% of the change in the concentration was associated with a change in light intensity (R2 = 0.987 for crustaceans with sizes less than 120 μm and R2 = 0.997 for larger crustaceans).
Based on the results of this series of experiments, a paired photostimulation mode of 10 min 850 lx + 10 min 3400 lx (25% and 100% of the maximum illuminance for this light source) was chosen for further studies.
3.3. Pollution Monitoring and Modeling
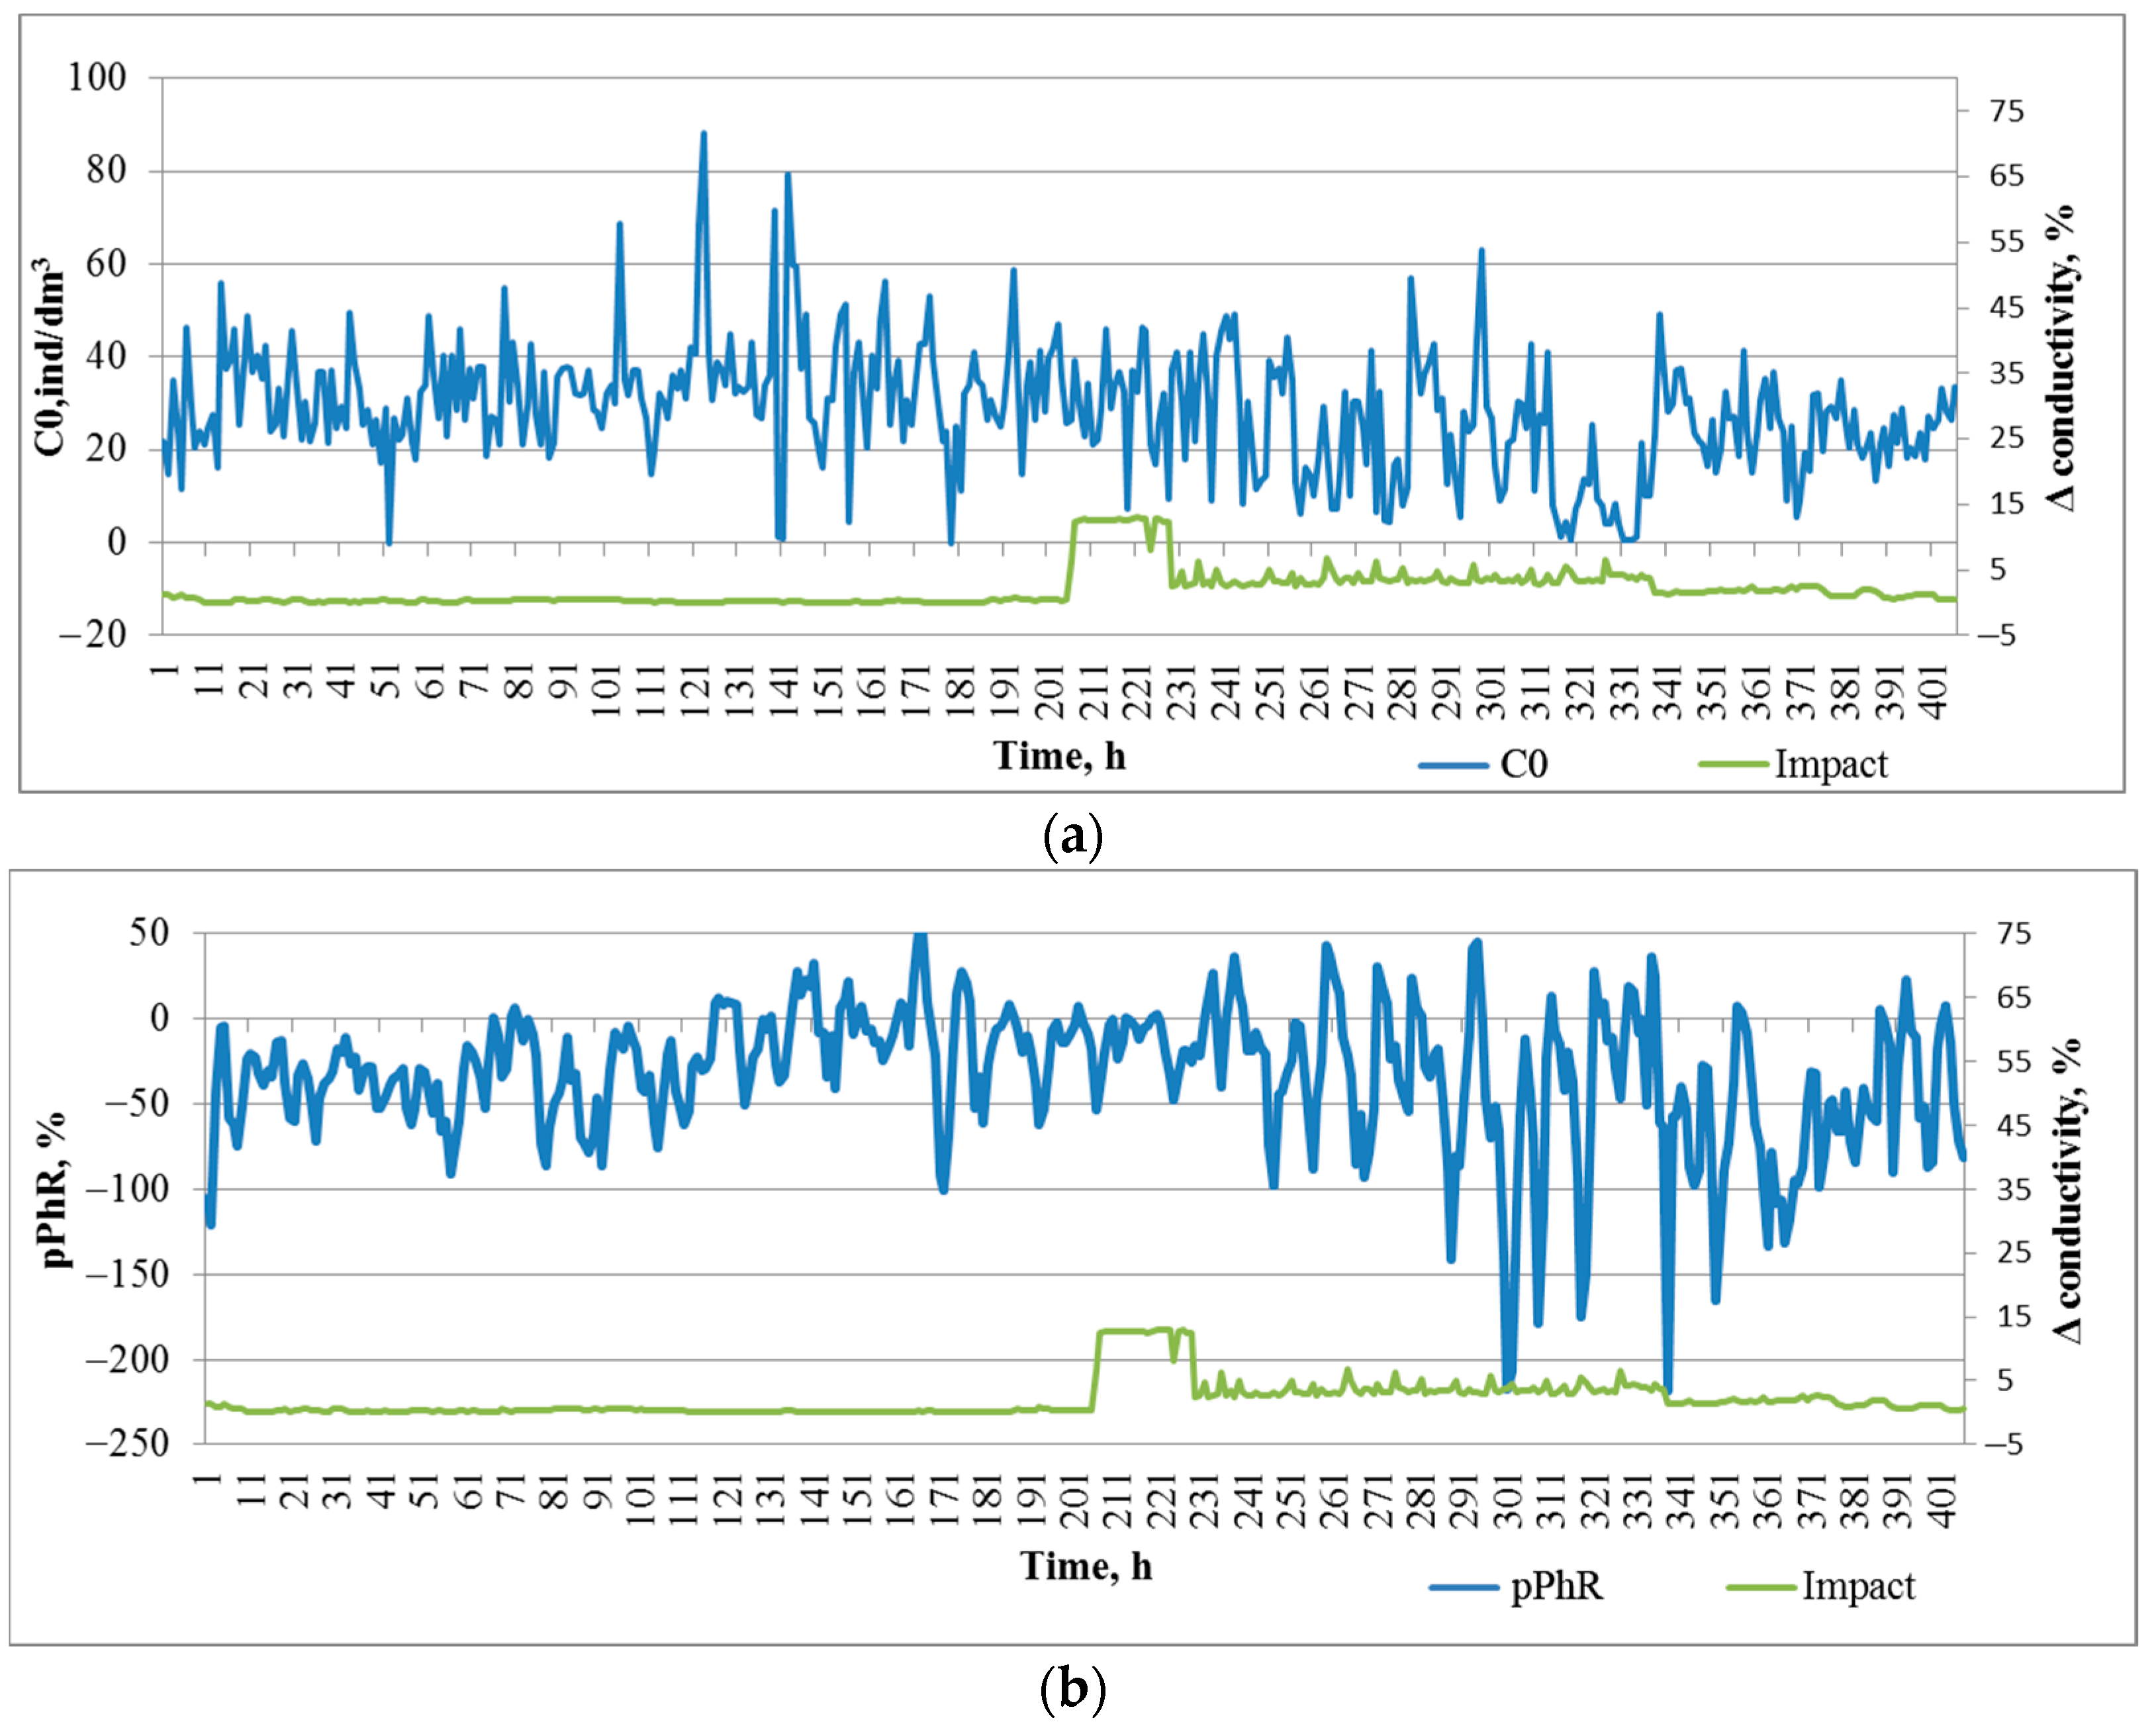
According to the conductivity sensor, the conductivity of water in the impact zone before salt introduction (203 h of registration) was in the range of ±0.3%. During the impact in the first phase (14 h), the conductivity changed by 11.6 ± 0.8% (p < 0.001), in the second phase (112 h) it changed by 4.1 ± 0.2% (p < 0.001), and after the impact was stopped it gradually recovered to the initial value.
During the entire registration period (850 h) before salt contamination, there was a gradual increase in zooplankton concentration in the DHC working volume from 18.9 ± 1.5 ind/dm3 on the first day of observation to 33.9 ± 2.0 ind/dm3 (p < 0.001) on the last day before the introduction of the salt solution. This could be caused by a seasonal change in plankton concentration.
During the period taken as the background level (200 h before the introduction of salt solution), the plankton concentration was 33.0 ± 0.8 ind/dm
3. The introduction of salt solution led to a significant decrease in plankton concentration only in the second phase of impact, i.e., 14 h after the solution was introduced (
Figure 5a,
Table 1—Impact 1, Impact 2). Once the impact was stopped, the plankton concentration was recovered.
A predominantly negative phototropic response of zooplankton to the paired photostimulation was registered throughout the observation period, thus indicating a response to avoid additional illumination. In the background period, a pPhR = −26.0 ± 2.0 p.p. fluctuation was also observed, which did not achieve significant differences between the values at the beginning and at the end of this period (
Figure 5b). Significant changes in the pPhR index occurred already in the first phase with the introduction of salt solution (Impact 1,
Table 1). Moreover, we observed an inhibition of this response and a decrease in its amplitude. In the second phase (Impact 2,
Table 1), the amplitude of the response to photostimulation increased, and light avoidance was more intense with a lower intensity of salt solution impact. After the impact was stopped, the intensity of the avoidance response decreased wavily, nevertheless exceeding the background level.
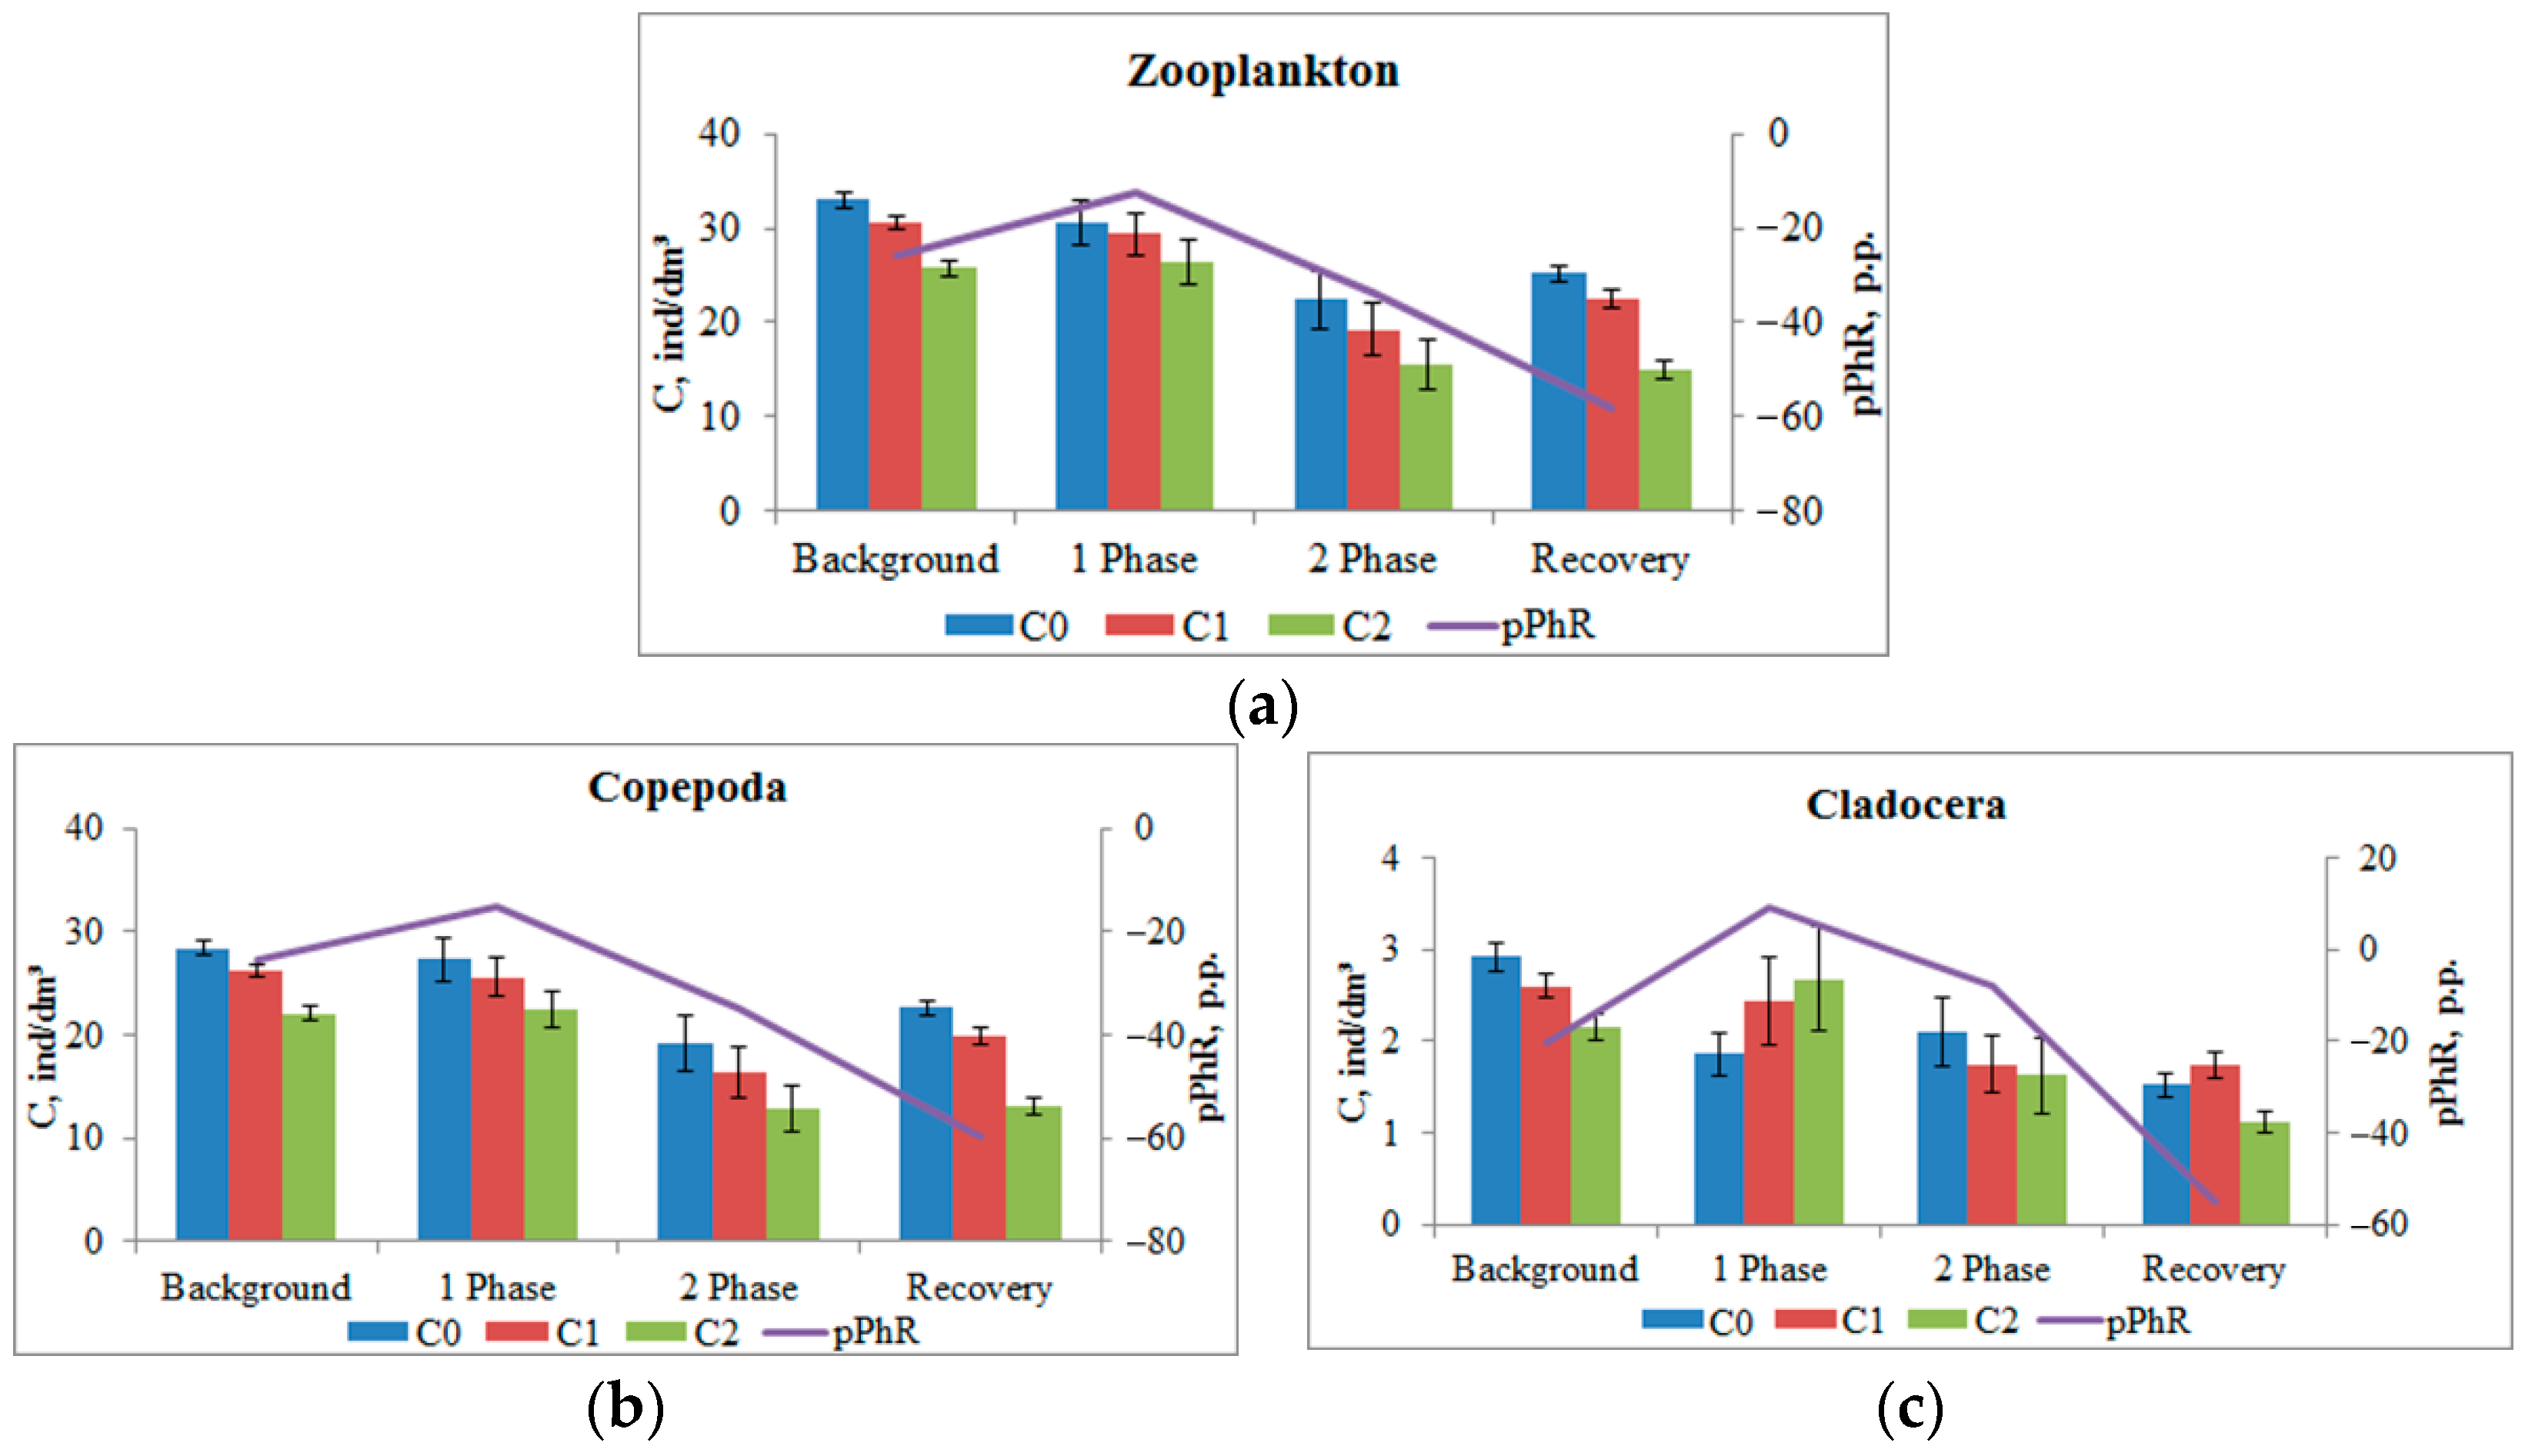
This pattern is characteristic of the phototropic response of the entire mesozooplankton community (
Figure 6a). A more detailed analysis highlighting the responses of the main taxonomic groups of plankton present in the working volume (which is ensured by the use of the DHC) showed a difference in response. Copepoda crustaceans (adult and nauplii stages), which accounted for more than 80% of the number of registered crustaceans, showed a negative phototropic response (
Figure 6b) at all phases of the experiment: pPhR changed from −25.3 ± 1.9 p.p. in the background up to −15.0 ± 4.7 p.p. (
p = 0.021) in the first phase of impact, up to −34.7 ± 10.3 p.p. (
p > 0.05) in the second phase and up to −59.6 ± 4.7 p.p. (
p < 0.001) after salt introduction ended.
At the same time, at the maximum impact (Impact 1) the Cladocera crustaceans showed a positive phototropic response: pPhR changed the sign from −20.5 ± 2.6 p.p. in the background to +9.3 ± 3.7 p.p. (p < 0.001).
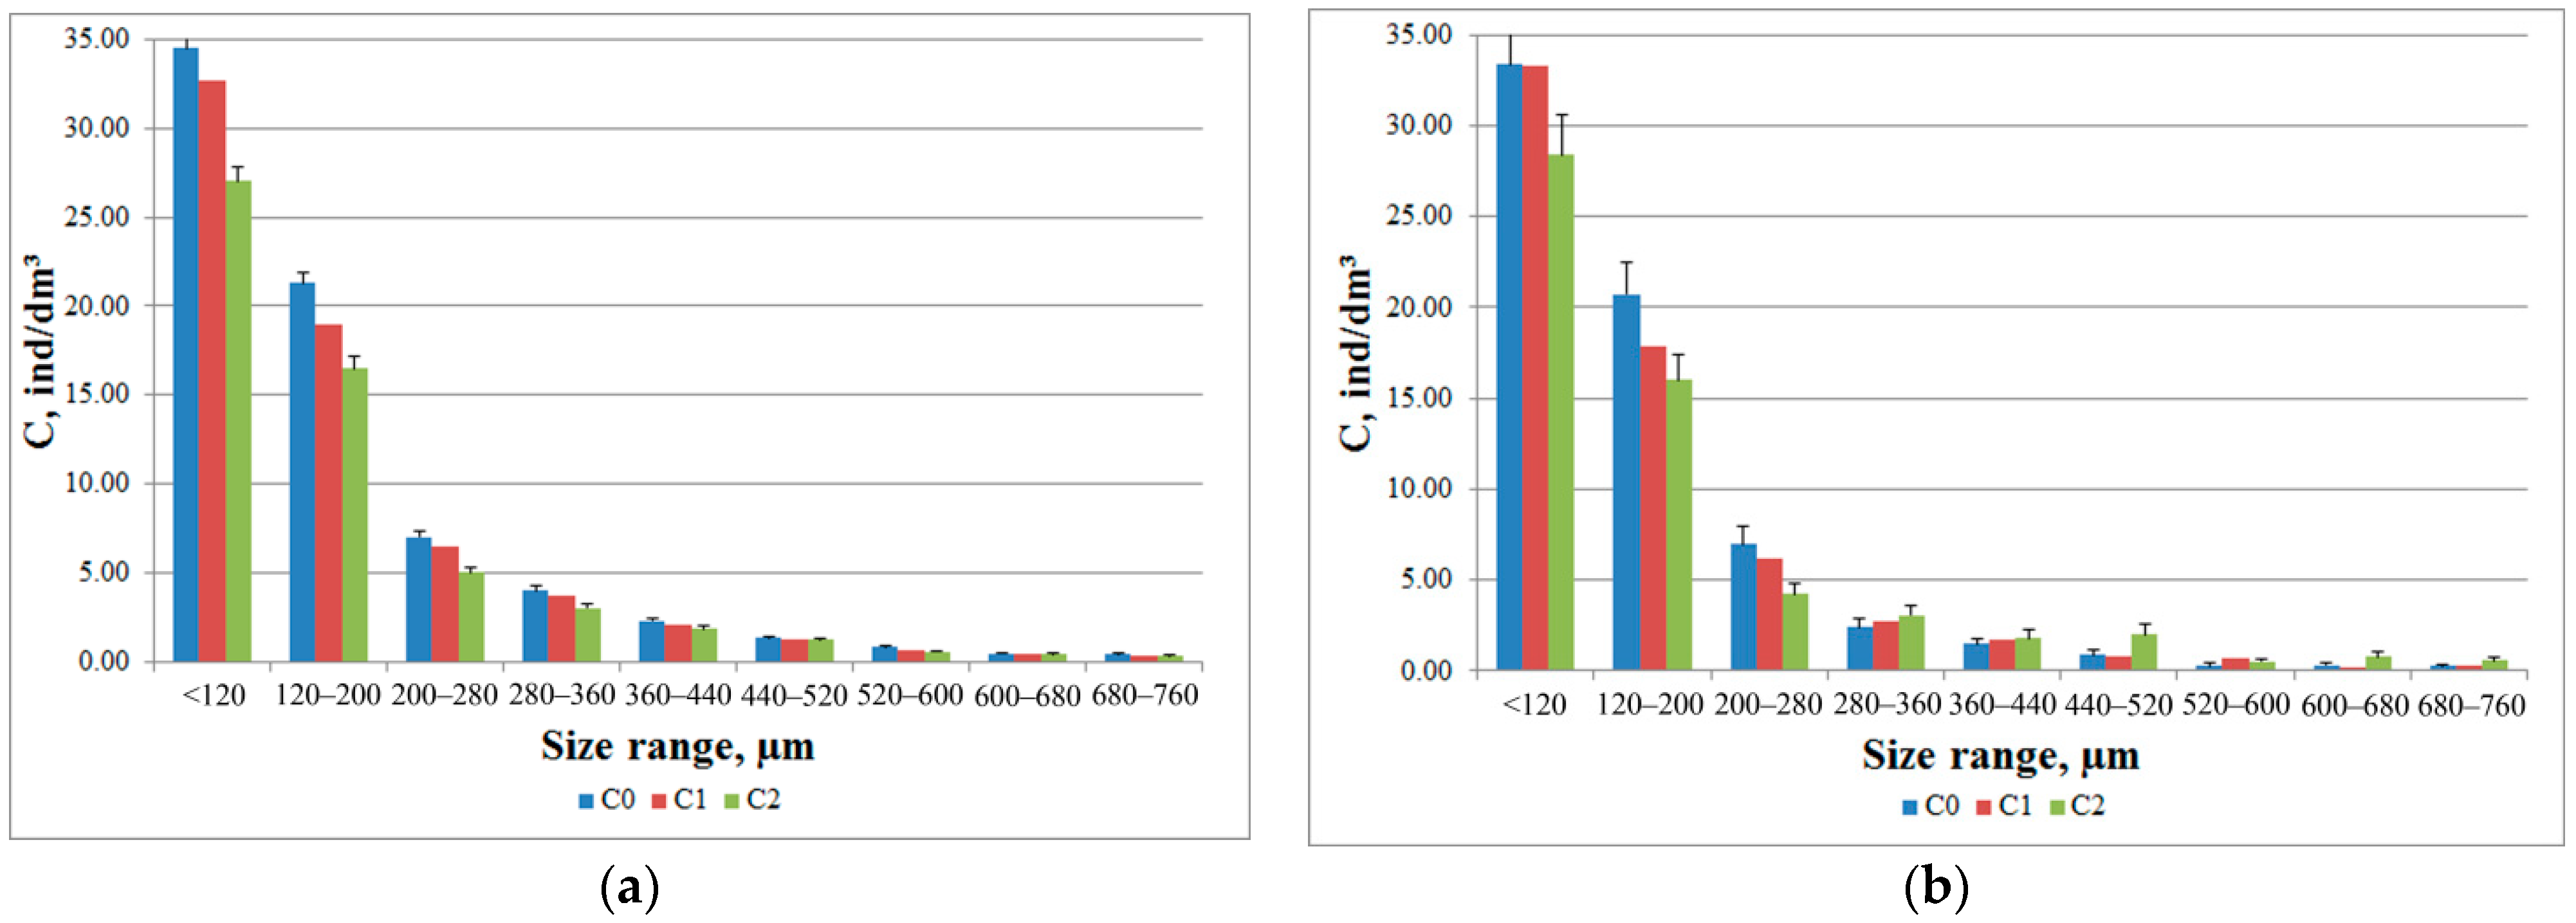
Different participation of individuals of different taxonomic groups in the formation of the total response of the zooplankton community was also observed in the analysis of histograms of the size composition of plankters in the DHC working volume (
Figure 7). During the introduction of salt solution, the crustaceans with a size of 280 μm to 760 μm showed a positive phototropic response (
Figure 7b), which corresponded to the size of Cladocera crustaceans.
However, such rearrangement of the dimensional structure was not reflected monotonously in the ordering criteria of the community—entropy. In the background, the normalized entropy was 44.0 ± 0.6 p.p. of the maximum possible and decreased to 41.7 ± 1.1 p.p. (p = 0.039) during the first phase of impact. In the second phase, there was a decrease to 40.8 ± 1.1 p.p. (p = 0.007); however, no recovery was registered in the post-impact period (39.3 ± 0.8 p.p., p < 0.001).
The dynamics of the community ordering by species diversity was somewhat different. The relative entropy of species composition in the background (in the absence of contamination) was 30.1 ± 0.6 p.p. of the maximum possible level. A significant reduction to 26.9 ± 1.0 p.p. (p = 0.002) was registered only in the second phase of impact. There was a slight recovery to 28.9 ± 0.6 p.p. in the post-impact period (p = 0.04) compared with the second phase.
As noted above, in a natural monitoring experiment, long time series of measurements of plankton concentration in the DHC working volume were obtained in the absence of photostimulation, during the first and the second photostimulation.
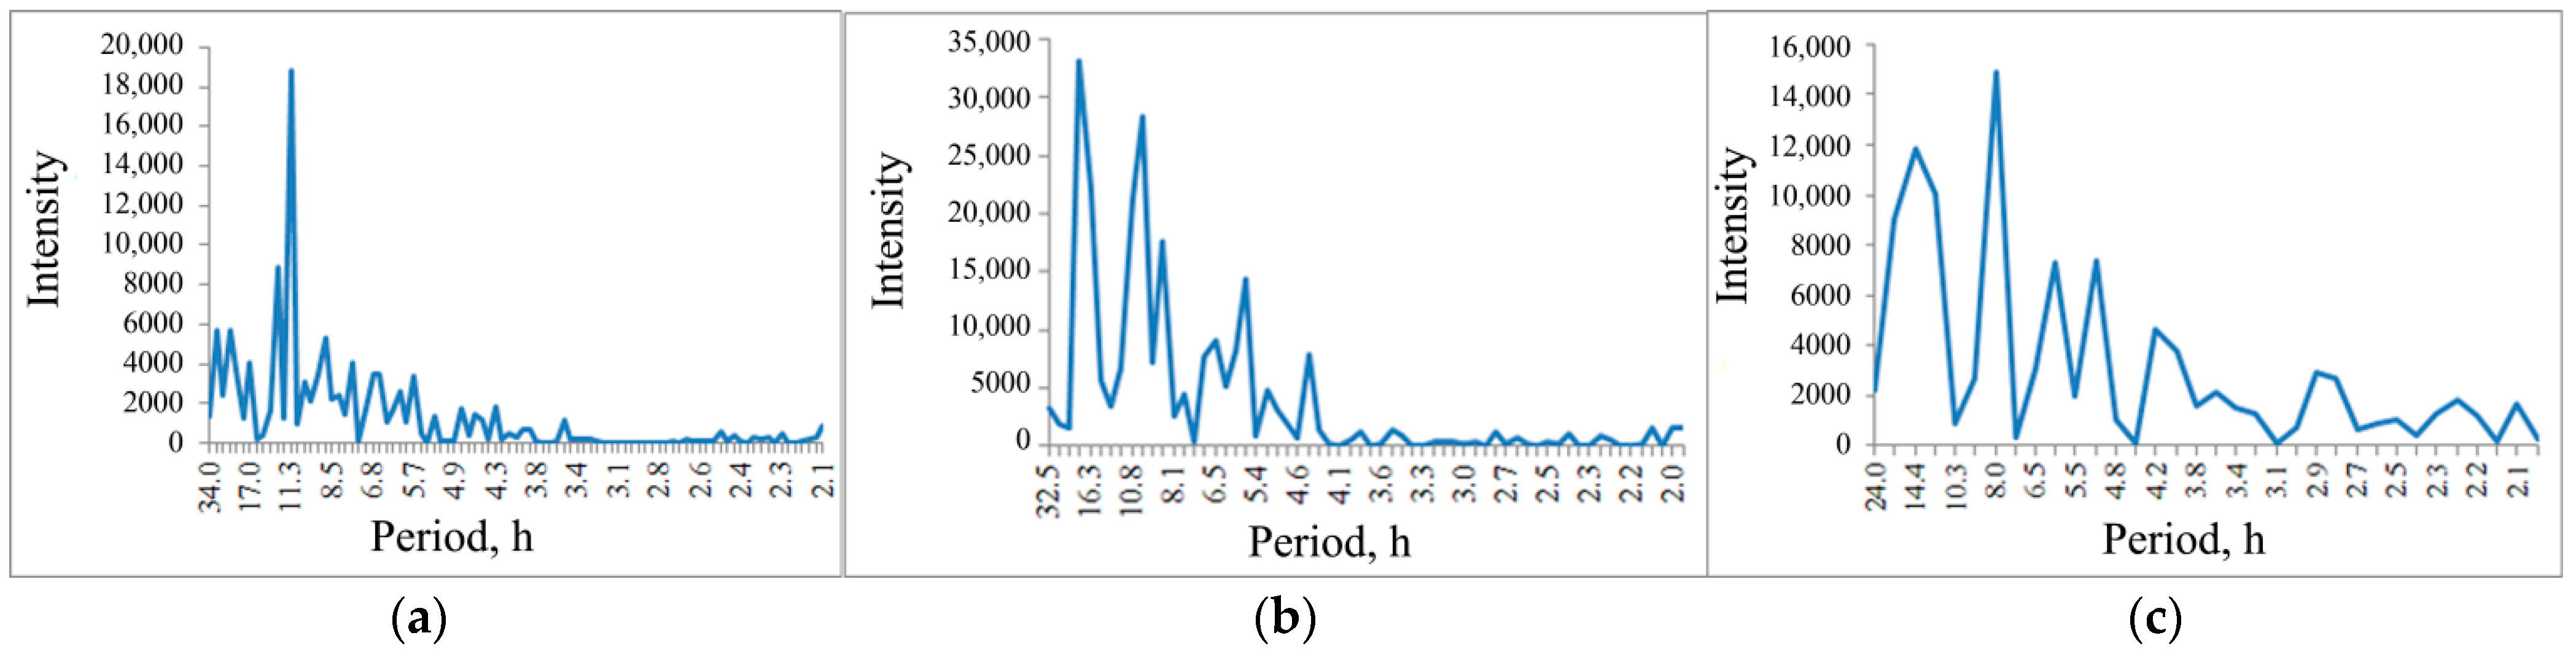
The spectral analysis of these series allows one to analyze the presence of characteristic frequencies (or time periods) corresponding to the rhythmic processes of plankton.
The spectrogram of the pPhR oscillations, of which a diagram is shown in
Figure 5b, does not contain a pronounced circadian rhythm peak (close to 24 h), but contains pronounced peaks close to the tidal period of 12.8 h and 11.3 h (
Figure 8a).
When the salt solution is introduced, this ordering is broken; oscillations with a longer period of 18.6 h and faster oscillations with a period of 10.0 h are intensified (
Figure 8b).
During the recovery period, long-period oscillations show a tendency to return to background values (14.4 h), which is not observed in shortwave oscillations shifting to 8.0 h (
Figure 8c).
4. Discussion
Currently, there are two main methodological approaches: analytical—determination of the concentration of the main pollutants (in the laboratory or directly in the water body) and biological—determination of the quality of water samples using test organisms, which are used to control the ecological health of water bodies that are understood as the conditions for normal reproduction of the main components of the ecological system of the water body: pelagic and benthic crustaceans and fish [
60]. The difficulties of the first approach are driven by the lack of data on the maximum allowable concentration (MAC) of thousands of types of new chemical compounds annually synthesized by industries. The difficulties of the second approach are associated with the need for sampling and long-term tests involving laboratory test organisms that do not always meet the natural conditions of a given region. As a result, a false-positive response to factors familiar to autochthonous species is possible.
An alternative and more dynamic approach presented in our series of works [
44,
46] is based on the in situ registration of behavioral responses of autochthonous mesozooplankton communities. Unlike mortality and immobilization tests, the change in behavioral responses may occur at concentrations of pollutants not exceeding the MAC or NOEM. At the same time, the biological significance of such changes is quite high, since plankters form the basis of food chains and even weak changes in the severity of their phototropic responses may lead to higher death rates due to the risk-avoidance response of predatory fish attacks [
61].
Even integral behavioral responses such as vertical plankton migration [
62] require a high spatial resolution to determine the concentration of zooplankton, which is difficult to achieve using Juday net catching but which can be ensured by the DHC. The comparison of the total concentration of zooplankters obtained during net catching from the entire water column from the bottom to the surface with the total concentration of zooplankters recorded by the DHC during movement from the bottom to the surface within a 1 m pitch showed the precision of the measurements, especially expressed in parallel measurements at the same time at adjacent points (
Figure 2). The similarity of the daily dynamics with a correlation coefficient of 0.86 also indicates the validity of the use of data obtained by the DHC.
The use of DHC technology based on submersible digital holography of plankton allows one to not only specify the distribution of the number of plankters by depth, but also the implementation of such types of analysis as the phototropic response and entropy of the plankton community by size and species composition.
Due to the detailed pattern of the vertical profile, it is possible to determine the optimal depth of the DHC-probe installation for long-term monitoring of the mesozooplankton state. In particular, this study revealed the local maximum of zooplankton concentration and negative phototropic response at a depth of 4 m from the bottom.
The size diversity can also characterize the state of the mesozooplankton community. Zooplankton are a major consumer and predator in most aquatic ecosystems. They demonstrate a huge variety of features, environmental strategies and, as a result, affect other trophic levels and the cycle of materials and energy. Adequate representation of this diversity in community and ecosystem models remains a challenging task. But some features, such as body size and mobility, go beyond several functions and serve as major factors determining the ecological strategies of zooplankton [
63]. The vertical entropy profile in terms of dimensional characteristics indicates the relative consistence of the community (
Figure 3c), but the difference in dimensions affects the phototropic response (
Figure 4 and
Figure 7).
The entropy of the species composition reliably increases by depth, which reflects the transition from an almost single-species composition to a richer composition of the zooplankton community. This fact, registered by us during the expedition to Lake Baikal [
46], may indicate a decrease in exogenous pressing as it moves away from the surface. Light pollution [
64,
65], especially in shallow areas, may also be the source of such pressing.
Earlier, we showed that the phototropic response to paired photostimulation depends on the ratio of light intensity at different stages of photostimulation [
46]. But unlike the plankton of the freshwater Lake Baikal, which is mainly presented by
Epischura baikalensis showing a positive response to paired photostimulation, the plankton community at the site of our study showed a negative phototaxis (
Figure 4), i.e., it was more consistent with the most widespread view on the polarity of phototropism of salt-water plankton [
64]. This was especially typical for crustaceans whose size was less than 120 µm. The results of such studies make it possible to optimize the parameters of paired photostimulation for further monitoring.
Continuous monitoring (200 h of background) revealed no significant changes in the concentration of mesozooplankton, their phototaxis and diversity, which reflected the absence of extreme changes in plankton habitat.
But a pronounced change in the state of the plankton community was observed when the alternating factor was introduced—a local change in salinity by introducing a salt solution. Zooplankton concentration and pPhR amplitude decreased, and a change in the pPhR was observed already in the first phase of impact, earlier than the change in the concentration (
Table 1).
It should be noted that the inhibition of phototaxis in a more intensive impact phase 1 can be the superposition of the multidirectional responses of plankters of different taxonomic groups that make up this community. The analysis showed that the crustaceans identified by the DHC algorithm as belonging to Cladocera during this period showed a positive phototropic response (
Figure 6c). A similar interpretation can be proposed for the appearance of a positive phototropic response in crustaceans with a size range from 280 μm to 760 μm (
Figure 7b), which corresponds to the size of Cladocera crustaceans. The question of how much the total response to stress is a superposition of responses, or whether Copepoda crustaceans are critical here, requires further study.
The rearrangement of the dimensional structure (decrease in H
rel) was observed in the first phase of salt solution impact, while the entropy of species composition was observed only in the second phase, similar to the dynamics of crustacean concentration. However, these changes indicate an increase in pressing on the system [
66].
Rhythmic processes are particularly interesting as informative indicators of the state of the planktonic community. The congenital circadian (daily, diurnal) rhythms are endogenous but synchronize with external factors and may be destroyed when the habitat parameters change. Contamination may be considered as one such parameter that may lead to the desynchronization of rhythmic processes [
10], which can be used for diagnostic purposes.
However, unlike the water bodies of the middle latitude territories, these studies demonstrate a weak peak in the circadian rhythm (24 h) in the spectrogram of the pPhR oscillations, which may be associated with the features of insolation beyond the Arctic Circle. Rhythms with a frequency close to tidal processes are more typical. But, similar to the water bodies of the middle latitudinal territories, such a rhythm (
Figure 8) is disturbed with exogenous impact, and there is no recovery to the background pattern for 60 h after the impact is stopped.
Earlier, we showed that that the most optimal indicator of the state of the plankton community in freshwater is the dynamics of the paired phototropic response [
46]. In this work, we tested the validity of this idea for salt-water plankton.
Despite the practical absence of correlations between the level of deviations in water conductivity (intensity of impact) and individual indicators of plankton community responses (maximum value of the correlation coefficient r = 0.16), the multiple regression method made it possible to build a response model and identify the most significant predictors. The following indicators were introduced in the model:
Δcond—deviation in conductivity from the background level due to the introduction of salt solution into the DHC working area, percentage point (p.p.). It is a measure of the impact on the habitat of the plankton community;
C0—concentration of crustaceans in the DHC working zone without photostimulation, ind/dm3;
C1—concentration of crustaceans in the DHC working zone at the first stage of photostimulation, ind/dm3;
C2—concentration of crustaceans in the DHC working zone at the second stage of photostimulation, ind/dm3;
pPhR—index of the paired phototropic response, percentage point (p.p.);
Hrel—normalized entropy of plankter size without photostimulation, p.p.;
Hrel1, Hrel2—normalized entropy of plankter size during the first and second stages of photostimulation, p.p.;
Hord—relative entropy of species composition in the background, p.p.;
Hord1, Hord2—relative entropy of species composition during the first and second stages of photostimulation, p.p.;
Pdom—dominant spectrogram period, h.
The stepwise inclusion method established that statistically significant predictors of the model are C2 (
p < 0.022), pPhR (
p = 0.006) and Hrel2 (
p = 0.019), i.e., predictors associated with the response to the paired photostimulation. The model has the following form:
In this case, the multiple regression coefficient equals 0.48, and the model explains 20% of the dispersion (adjusted R2 = 0.199) with an accuracy of 3.0 p.p.
The significance of photostimulation indicators can be explained by the fact that the oscillations in the zooplankton concentration without photostimulation are determined by many factors: the difference in the amplitude of migrations among different species; different behavior of the same species in different water bodies; and changes in the nature of migrations due to age (stage), gender and season; and changes in the time different species move towards the surface and down to the bottom [
67]. Therefore, many authors [
67,
68] consider migration movements a passive process caused by a change in the transfer rate of organisms by vertical water currents, especially internal waves, having a 12 and 24 h periodicity for some components, or a change in the immersion rate of organisms during the cyclic shift of day and night temperatures, accompanied by a corresponding modulation of buoyancy conditions (change in density and “viscosity” of water).
At the same time, the studies of zooplankton concentration changes during photostimulation show their relation to the change in locomotor activity, behavioral responses regulated by the nervous system [
69,
70], and, most subtly, reflecting the change in the state of both individuals and the community.


 ,
, 
