
Satellite-Based Monitoring of Growing Agricultural Water Consumption in Hyper-Arid Regions

 ,
,  and
and 
Abstract
:1. Introduction
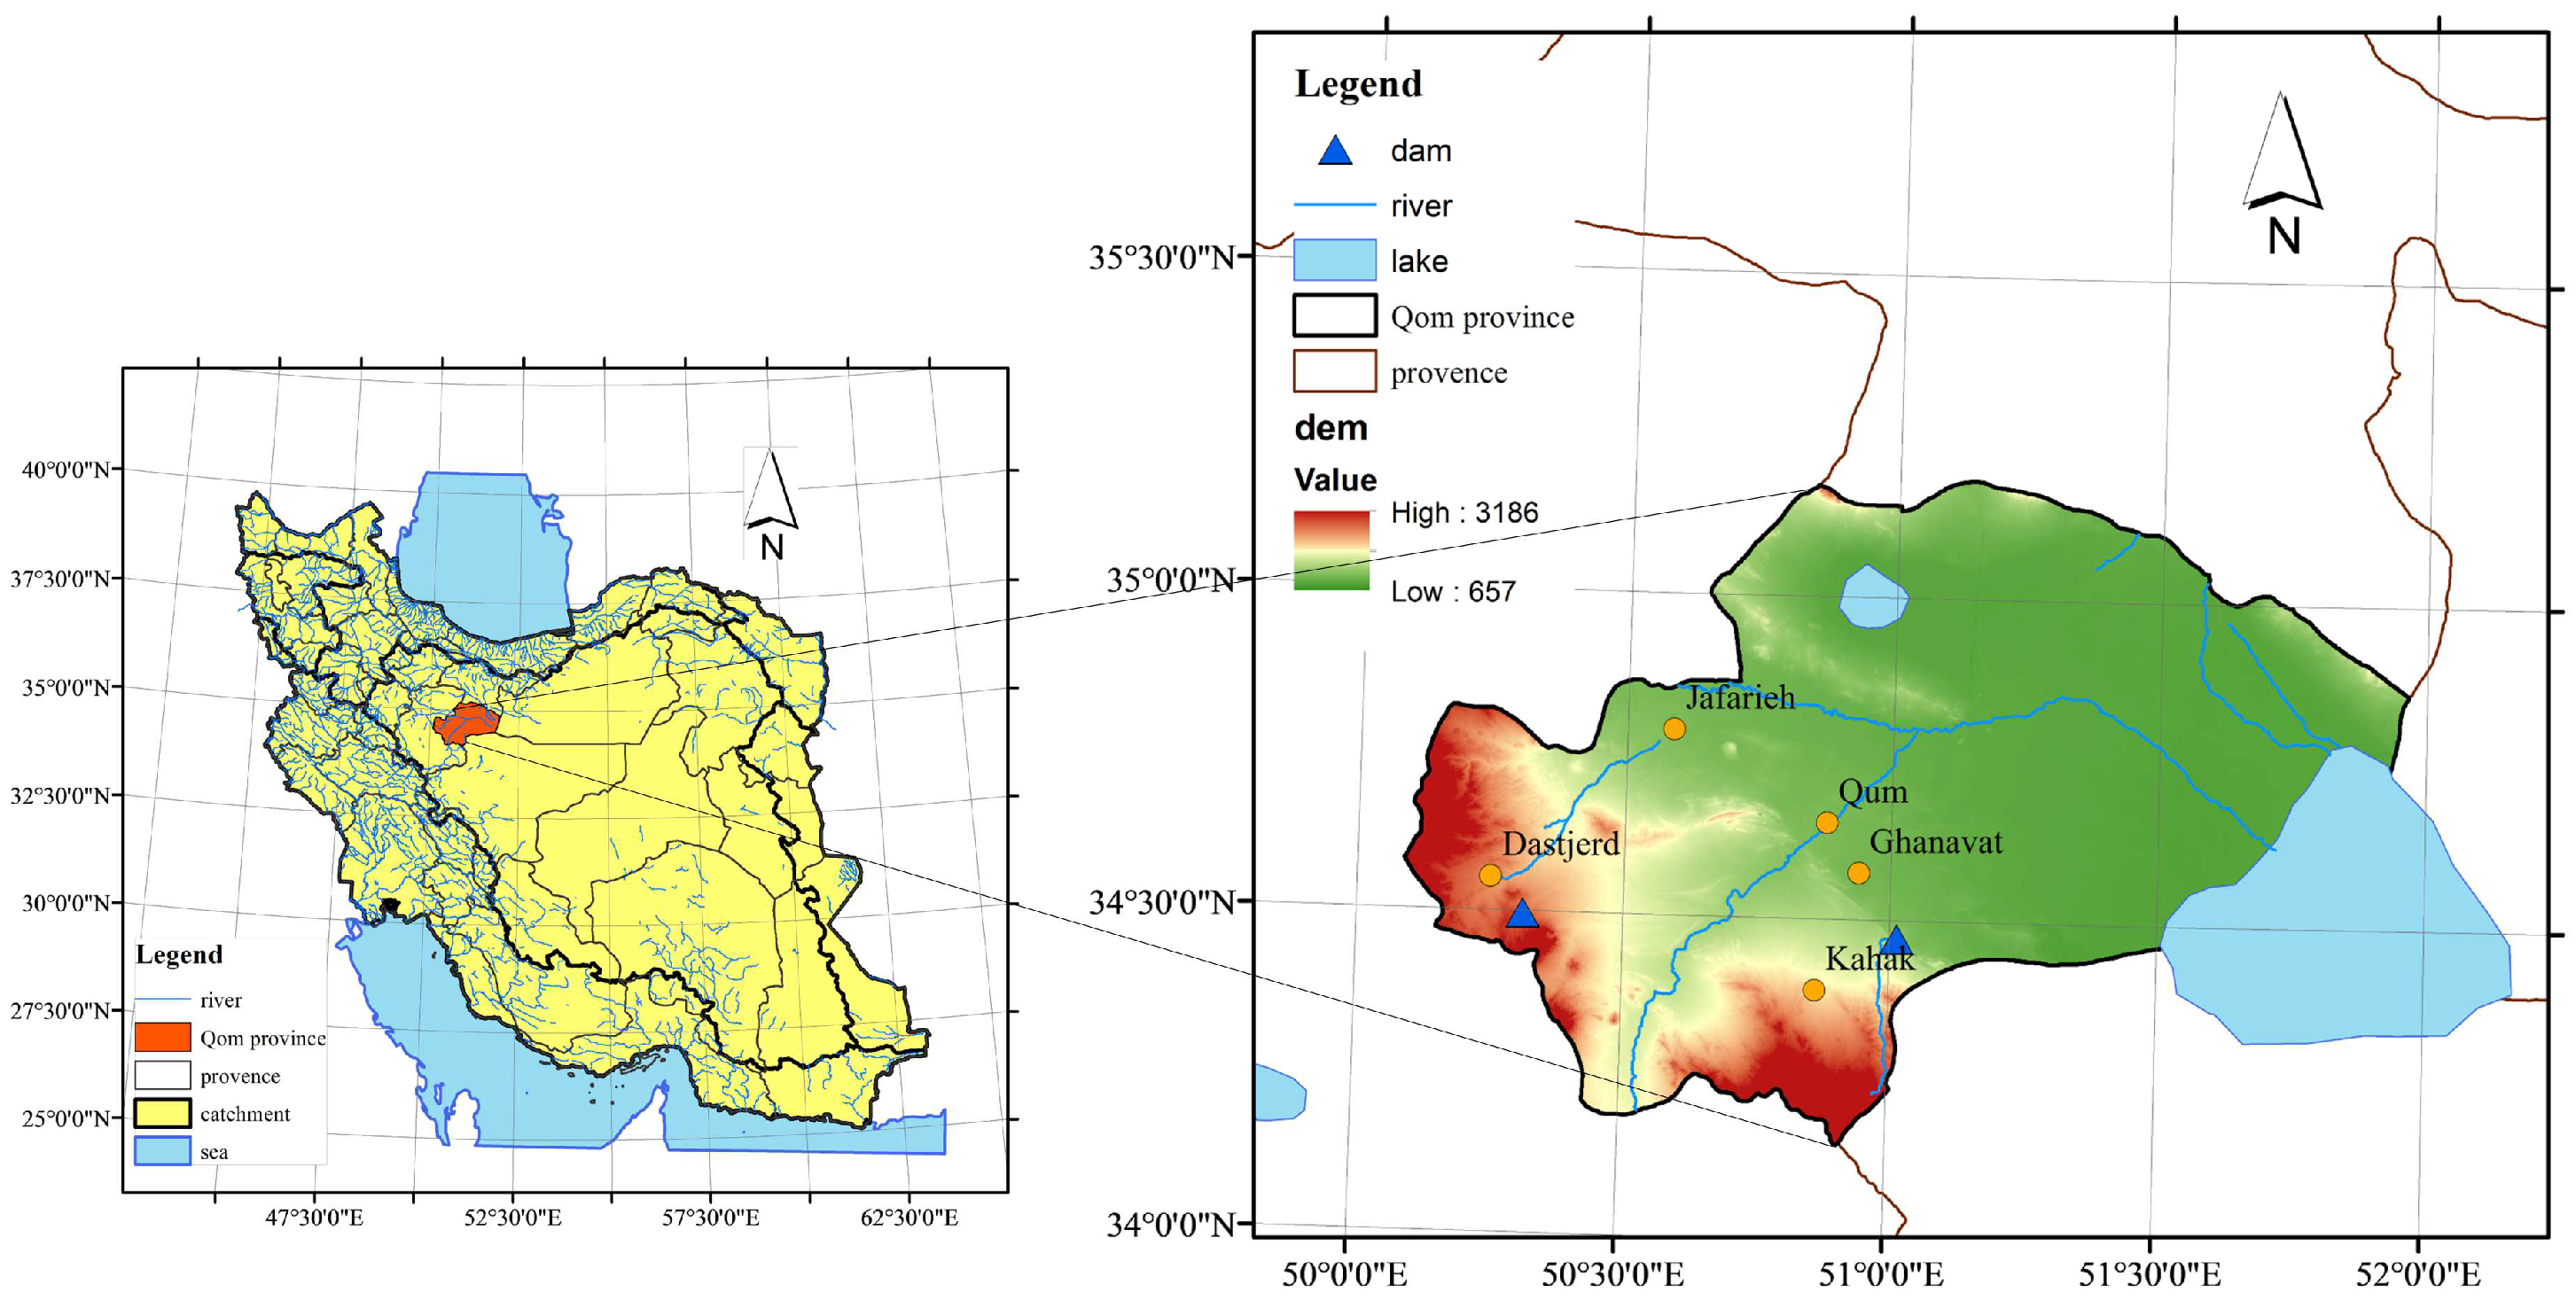
2. Study Area
3. Materials and Methods
3.1. Image Pre-Processing
3.2. Image Processing
3.2.1. Maximum Likelihood Classification
3.2.2. Decision Tree Classification
3.3. Image Post-Processing
3.4. Estimation of Net Water Consumption
4. Results and Discussion
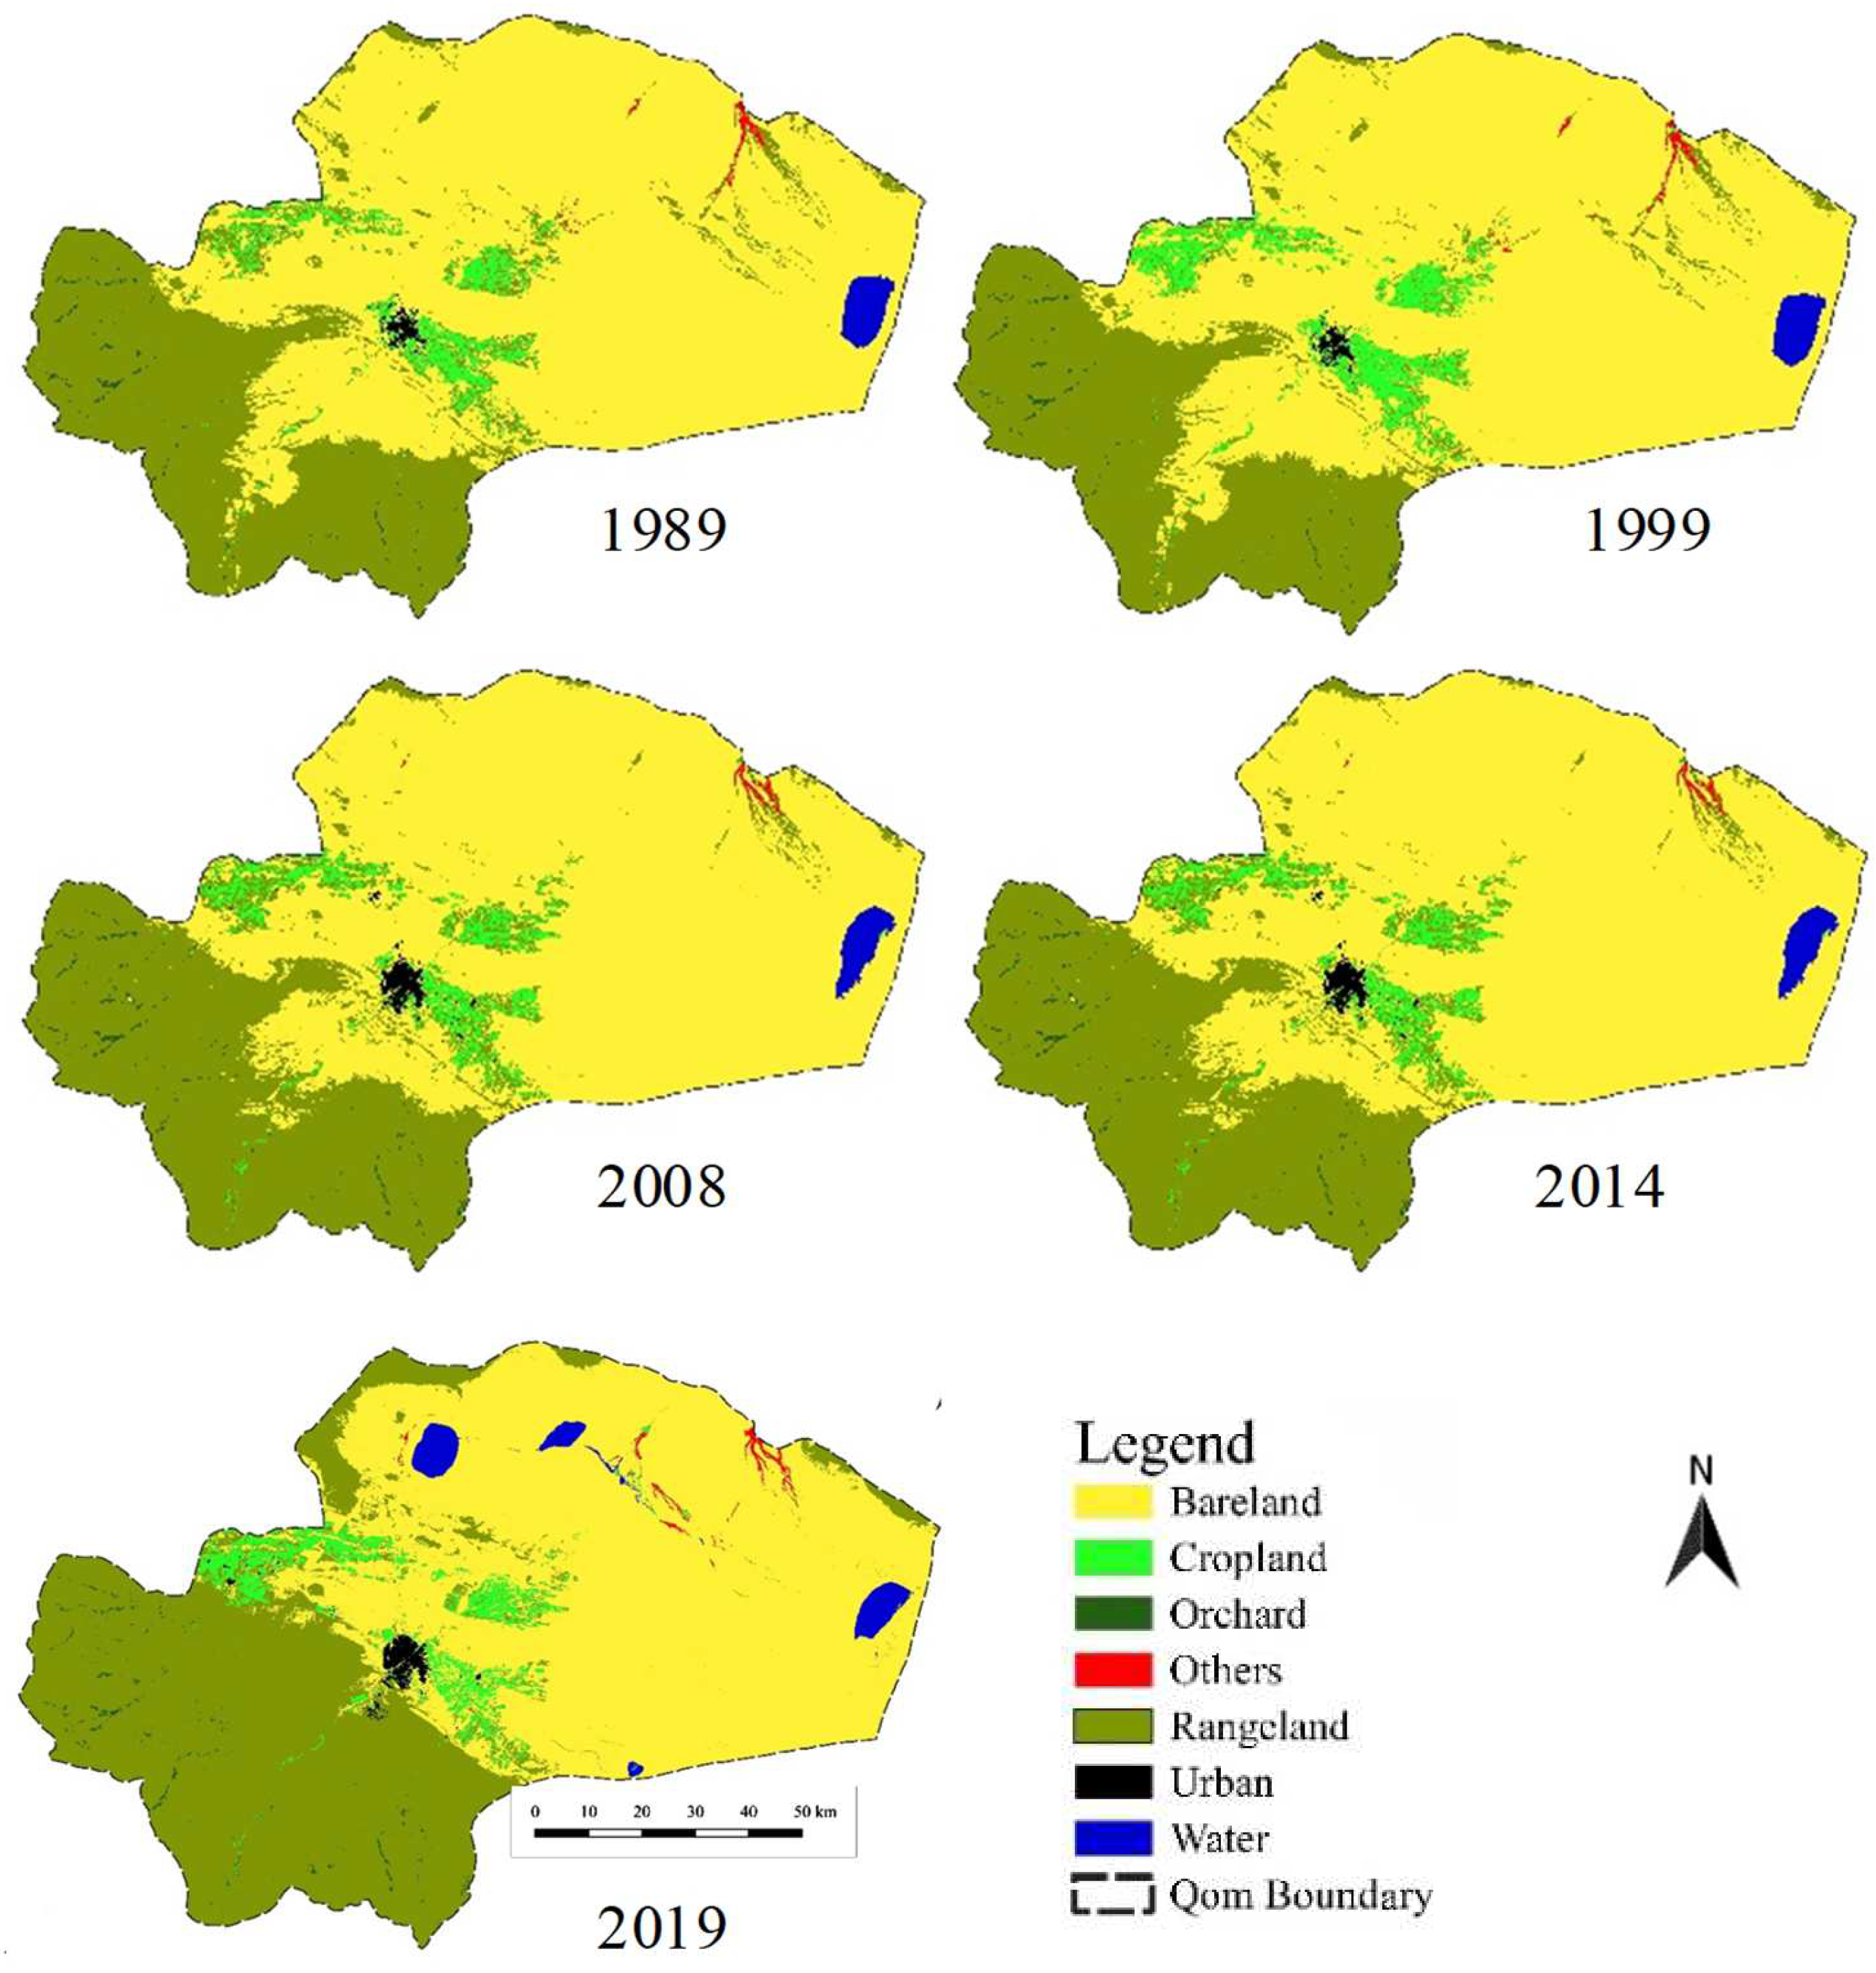
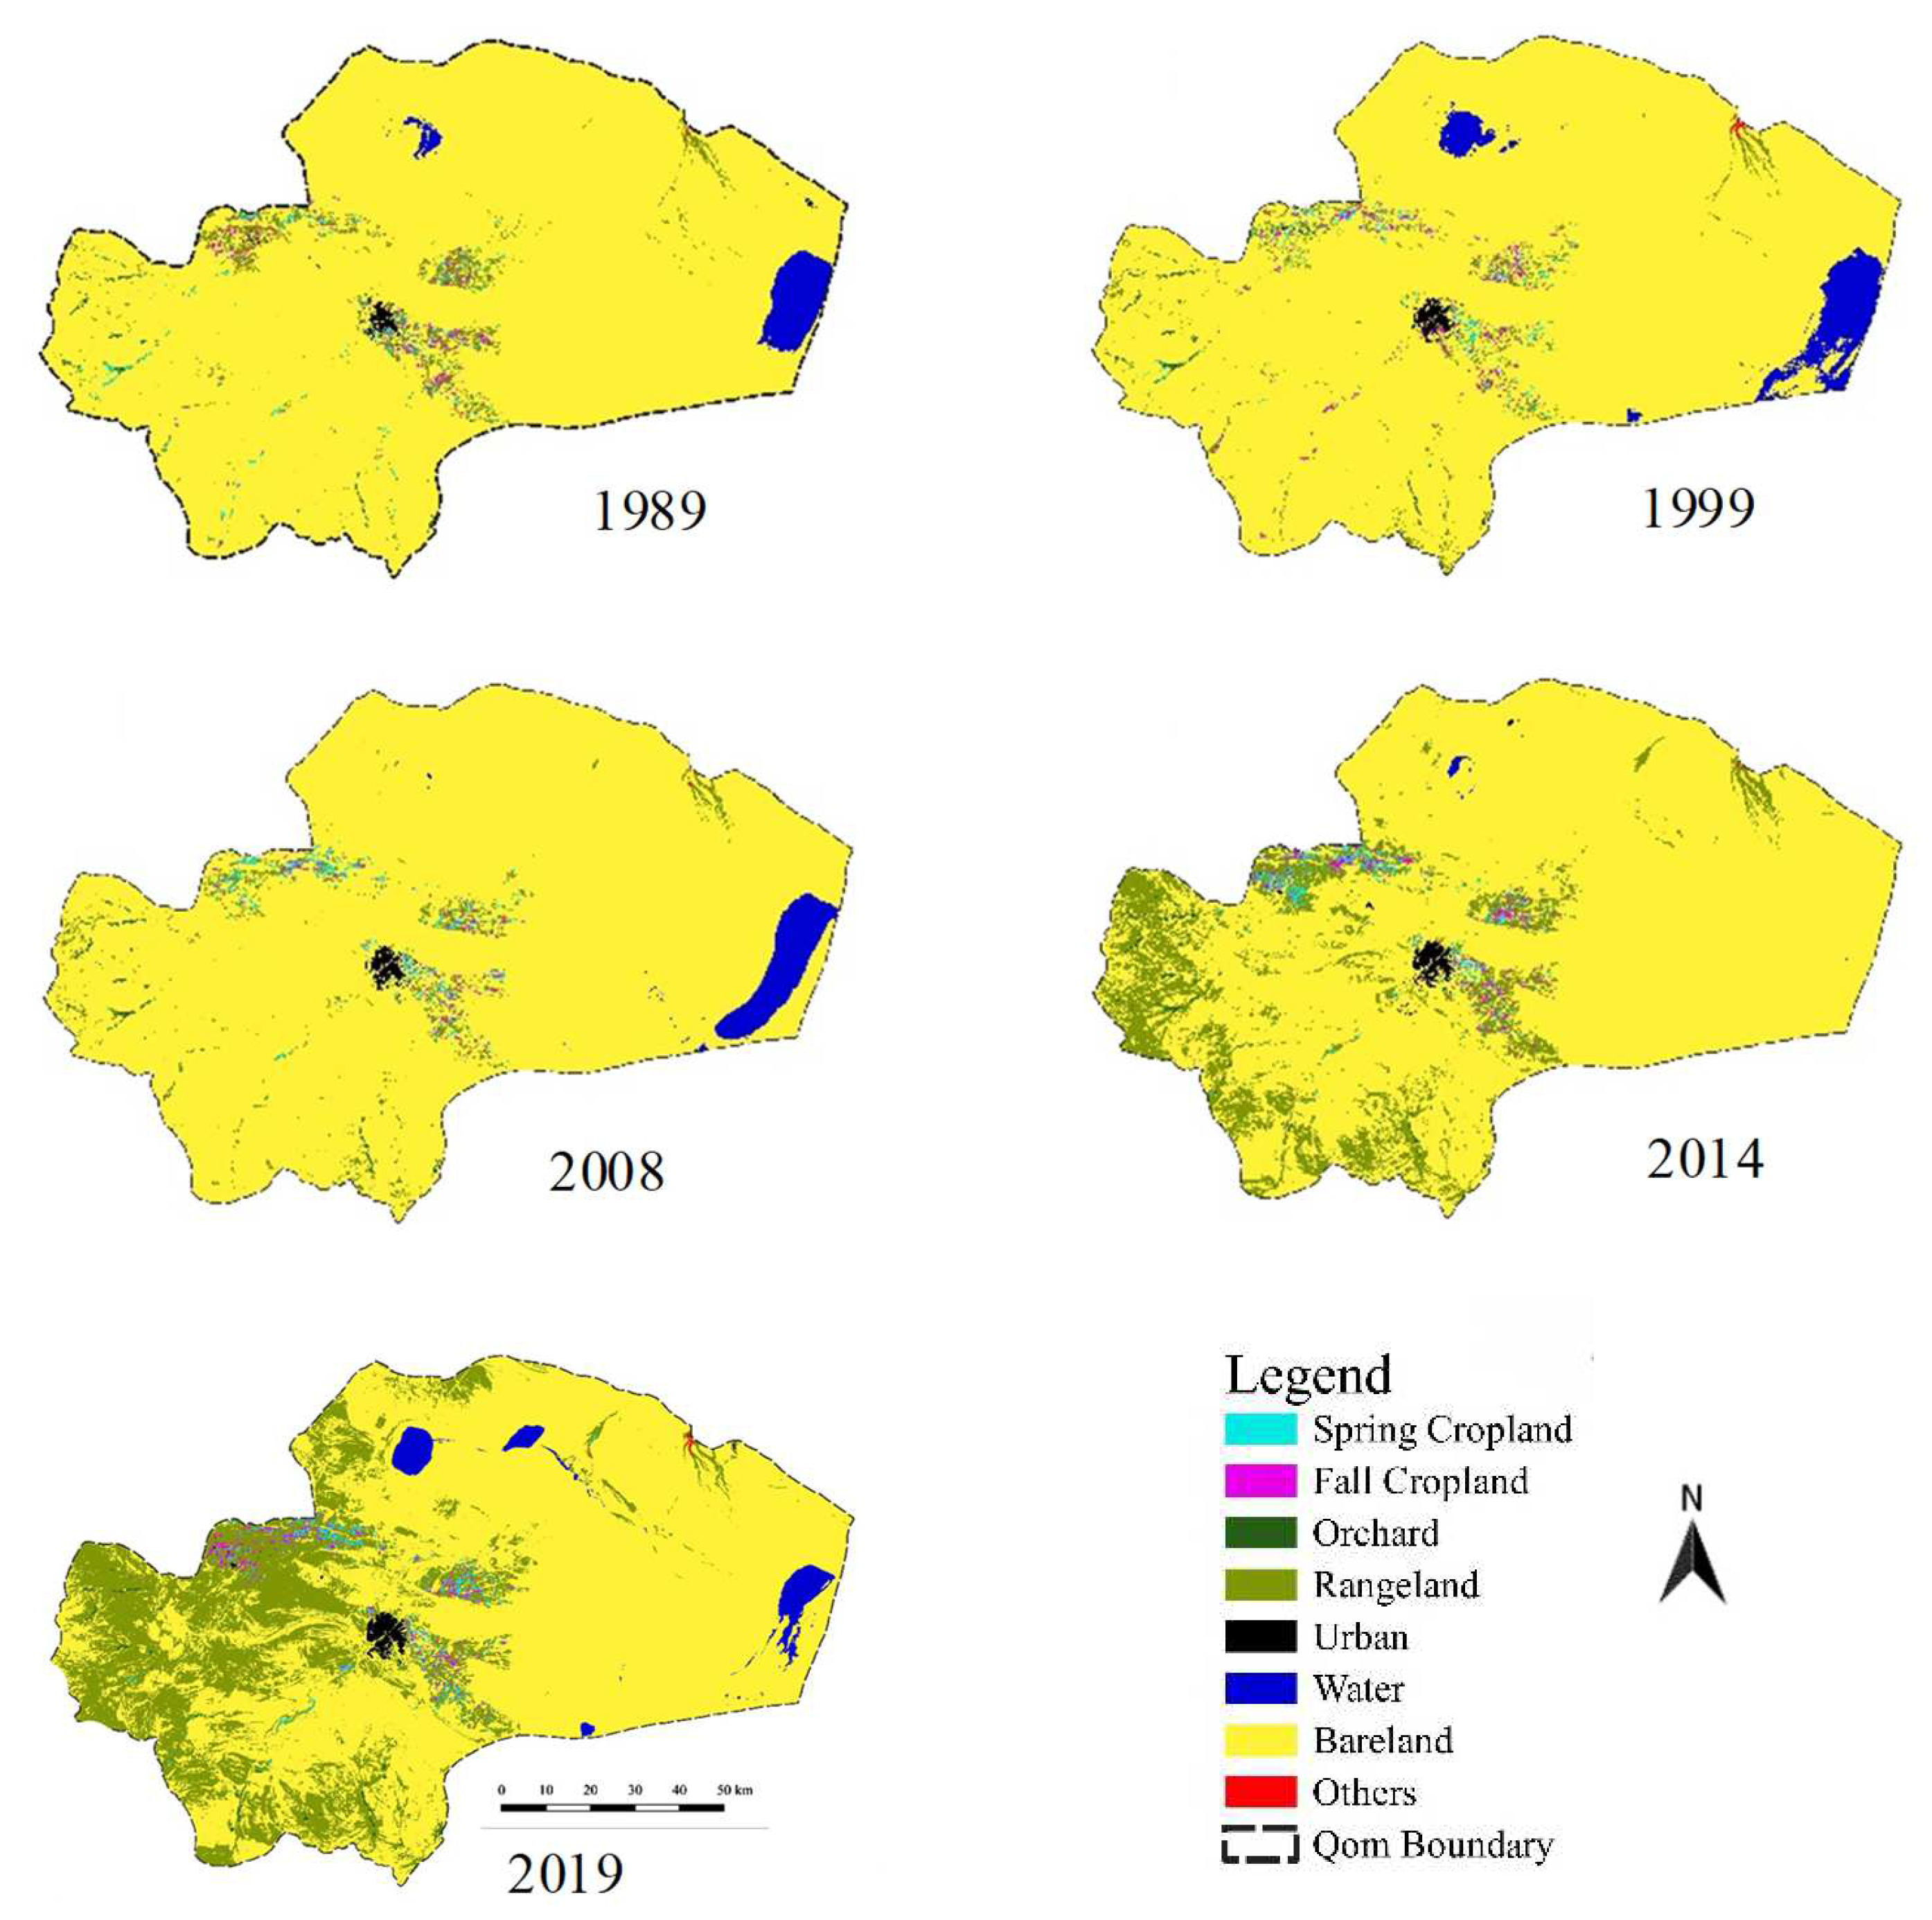
4.1. Land Use over 30 Years
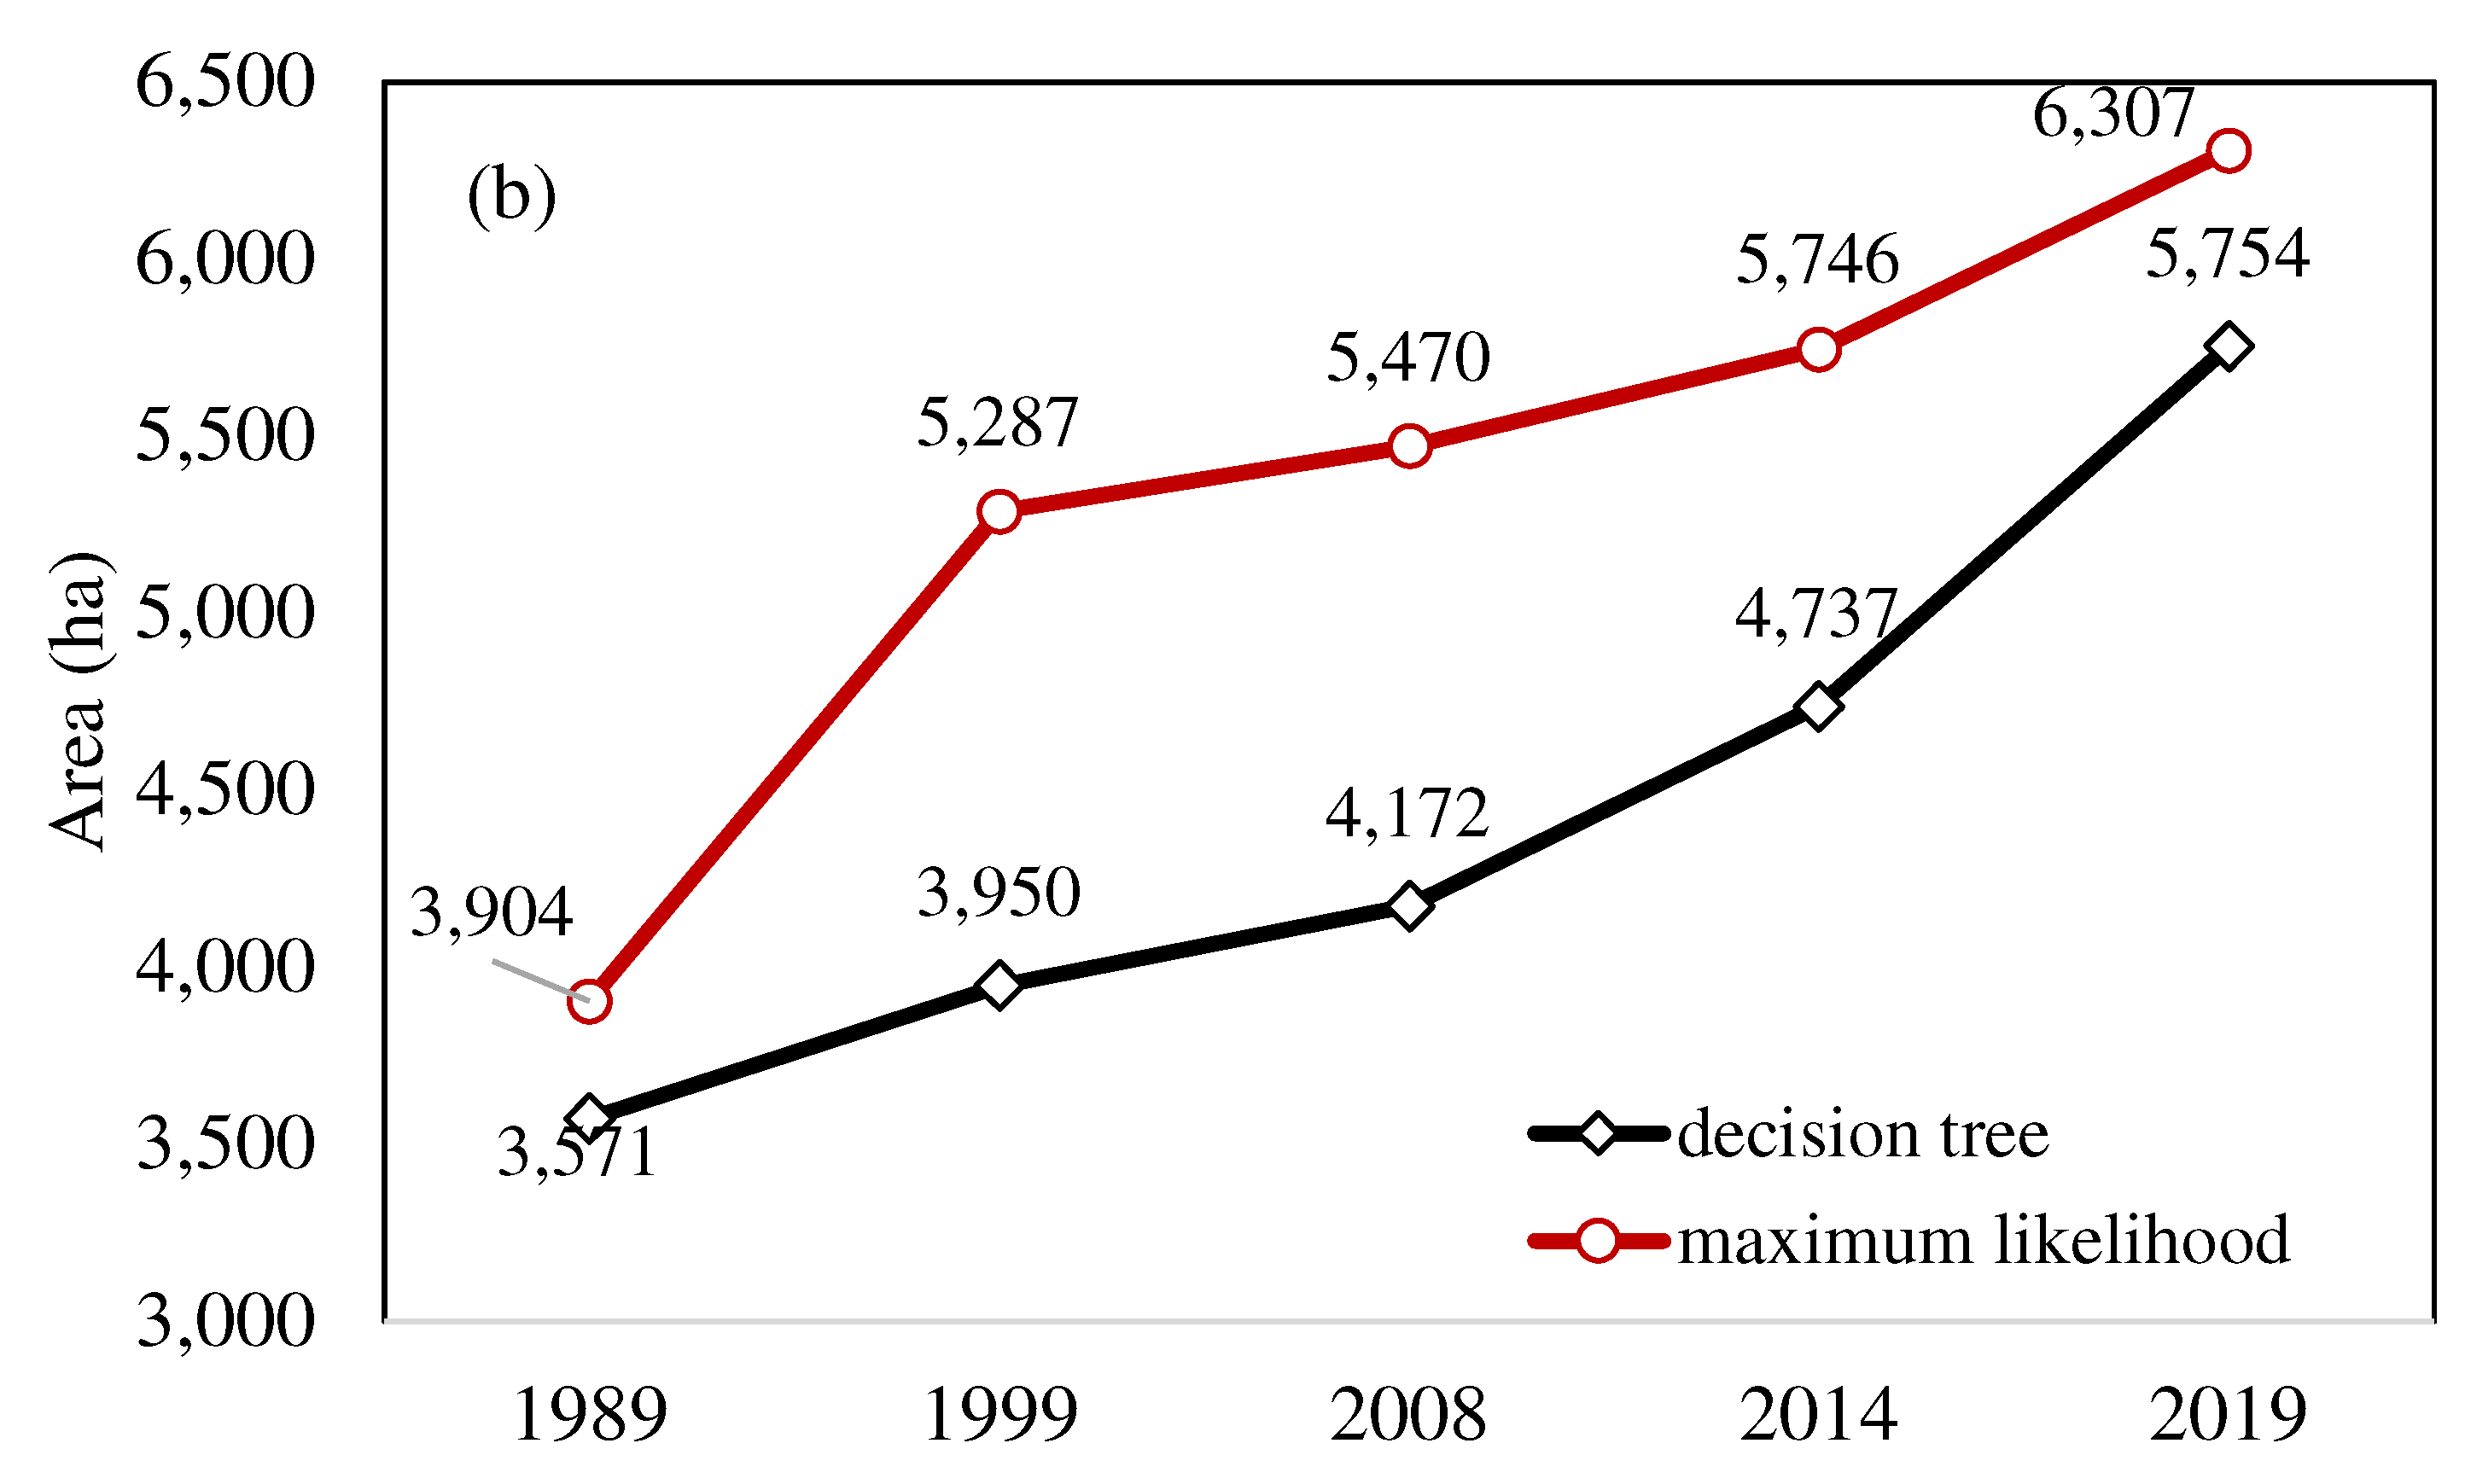
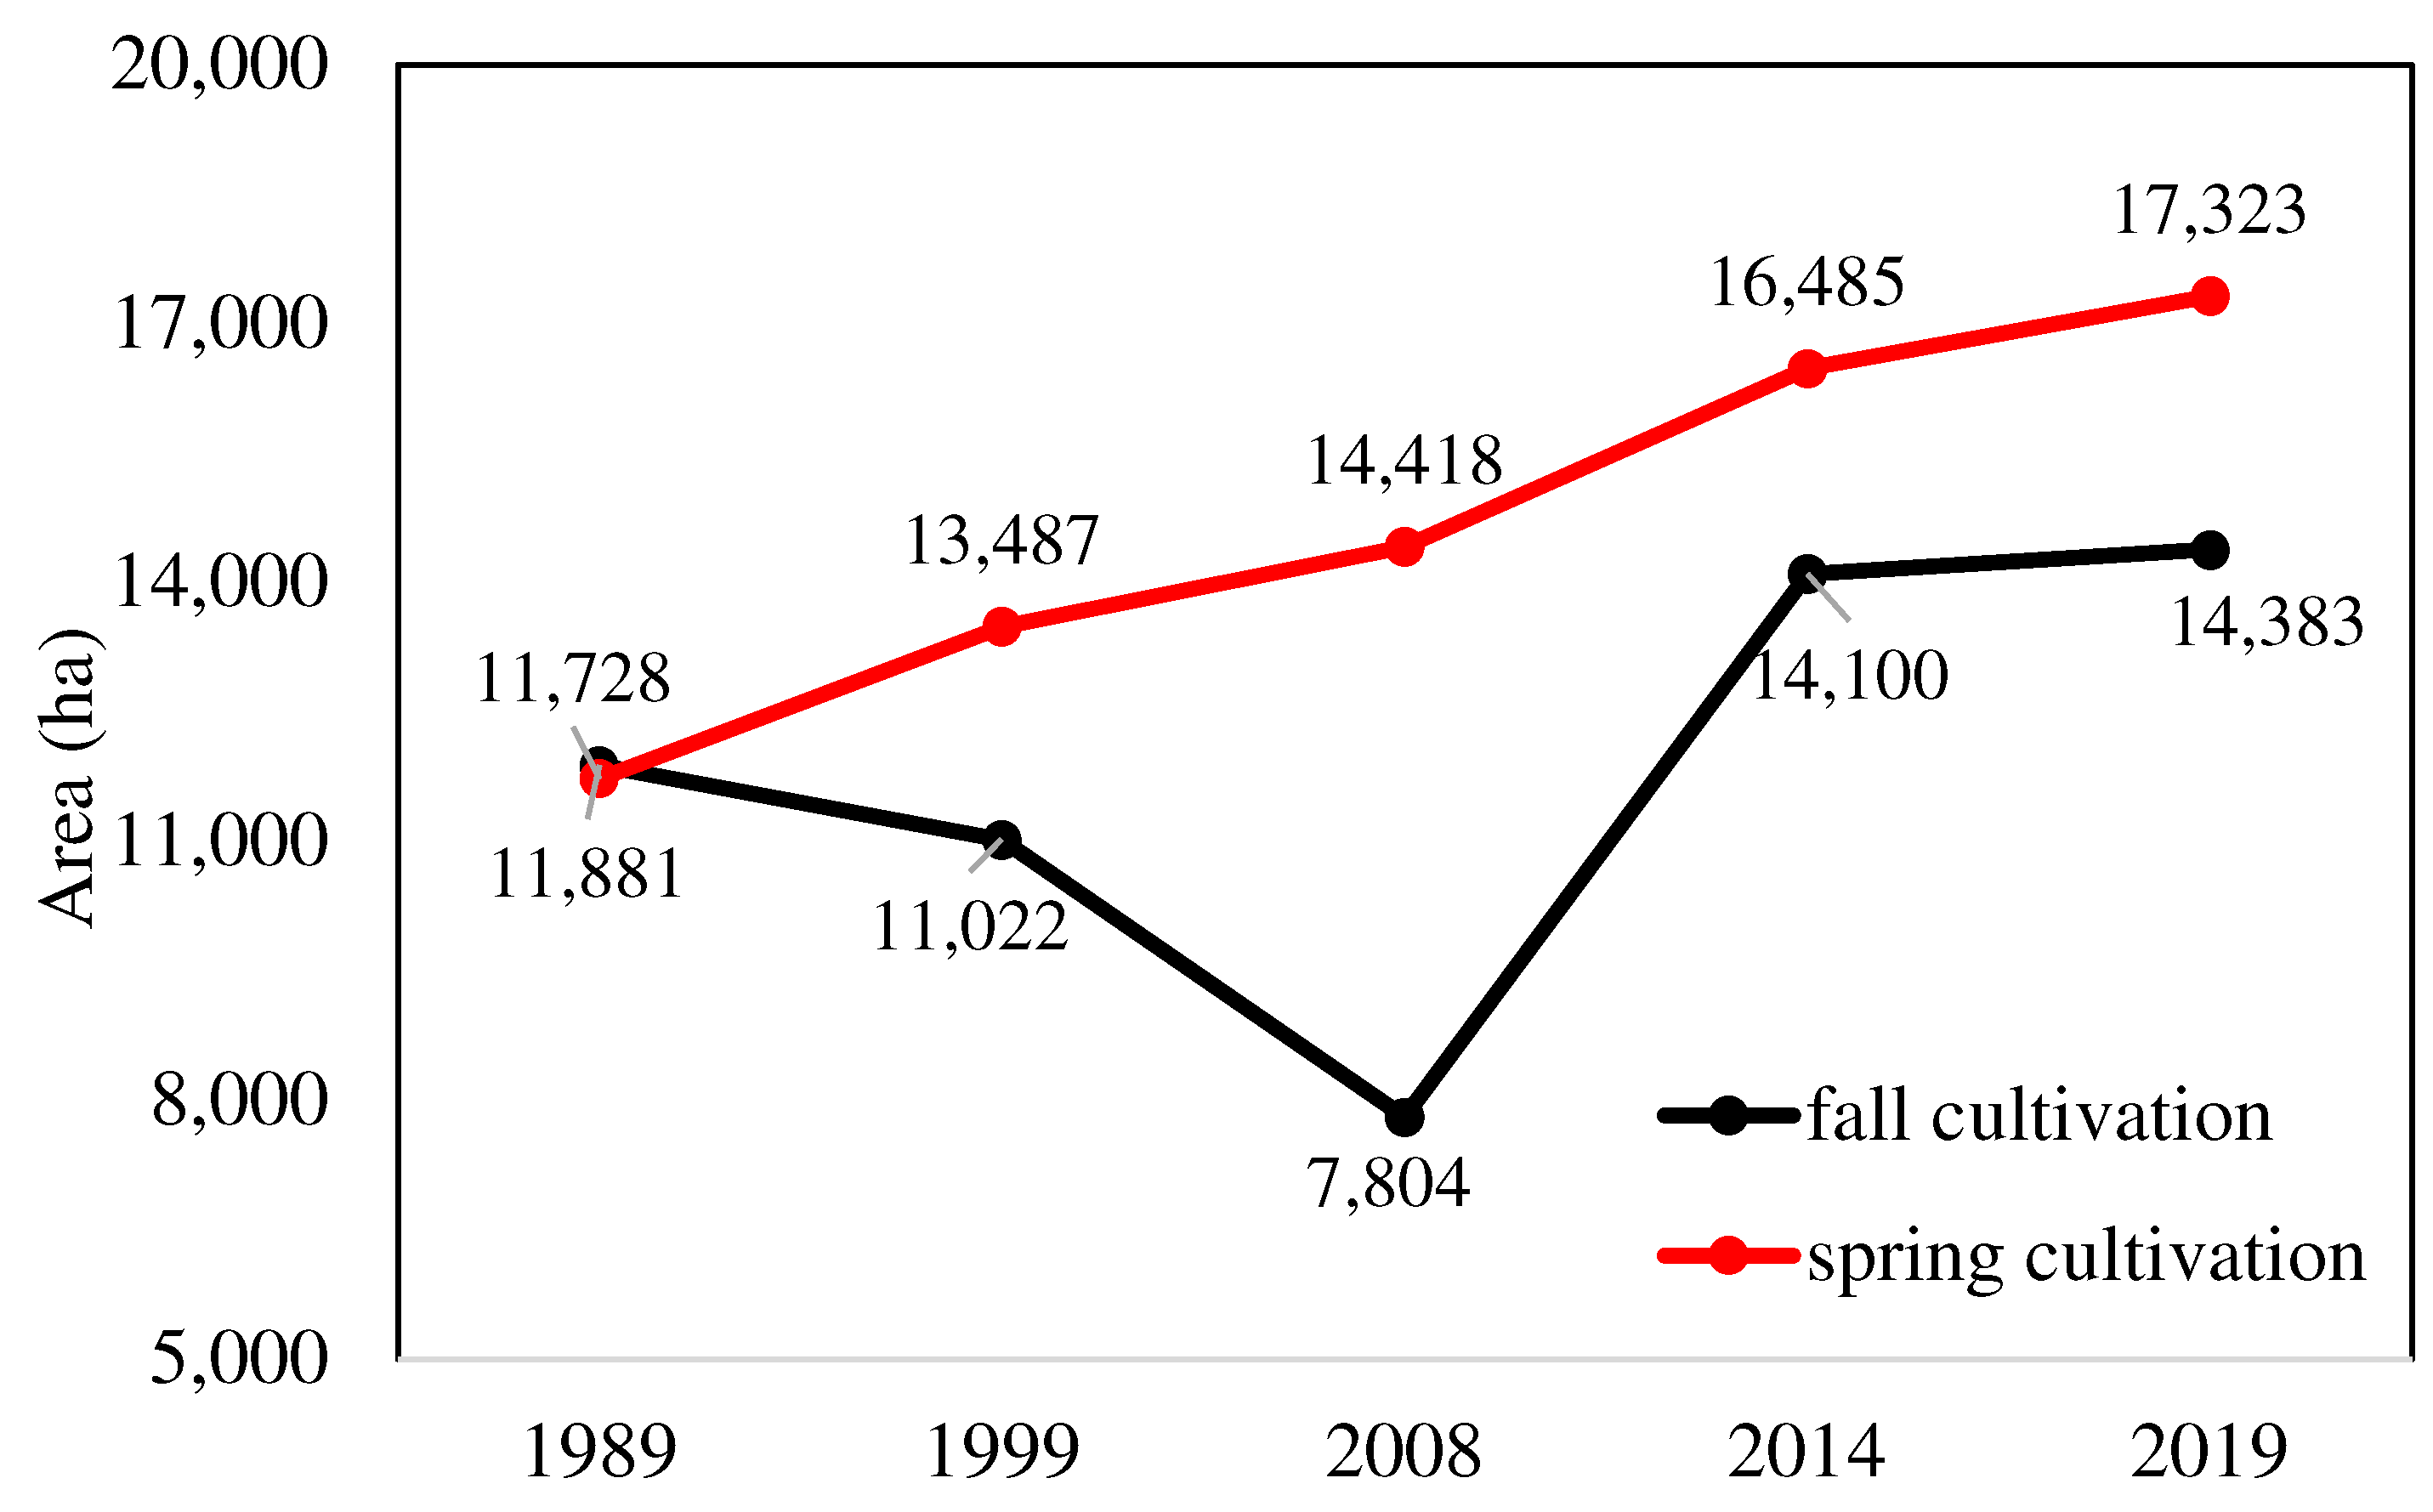
4.2. Trend of Land-Use Change
4.3. Trend of Net Water Consumption
5. Conclusions
Author Contributions
Funding
Data Availability Statement
Conflicts of Interest
References
- Teka, H.; Madakadze, C.I.; Botai, J.O.; Hassen, A.; Angassa, A.; Mesfin, Y. Evaluation of Land Use Land Cover Changes Using Remote Sensing Landsat Images and Pastoralists Perceptions on Range Cover Changes in Borana Rangelands, Southern Ethiopia. Int. J. Biodivers. Conserv. 2018, 10, 1–11. [Google Scholar] [CrossRef]
- Hua, A.K. Land Use Land Cover Changes in Detection of Water Quality: A Study Based on Remote Sensing and Multivariate Statistics. J. Environ. Public Health 2017, 2017, 7515130. [Google Scholar] [CrossRef] [PubMed]
- Mahdian, M.; Hosseinzadeh, M.; Siadatmousavi, S.M.; Chalipa, Z.; Delavar, M.; Guo, M.; Abolfathi, S.; Noori, R. Modelling Impacts of Climate Change and Anthropogenic Activities on Inflows and Sediment Loads of Wetlands: Case Study of the Anzali Wetland. Sci. Rep. 2023, 13, 5399. [Google Scholar] [CrossRef]
- Zhou, Q.; Li, B.; Sun, B. Modelling Spatio-Temporal Pattern of Landuse Change Using Multi-Temporal Remotely Sensed Imagery. Int. Arch. Photogramm. Remote Sens. Spat. Inf. Sci. 2008, 37, 729–734. [Google Scholar]
- Singh, R.L.; Singh, P.K. Global environmental problems. In Principles and Applications of Environmental Biotechnology for a Sustainable Future; Springer: Singapore, 2017; pp. 13–41. [Google Scholar]
- Modabberi, A.; Noori, R.; Madani, K.; Ehsani, A.H.; Mehr, A.D.; Hooshyaripor, F.; Kløve, B. Caspian Sea Is Eutrophying: The Alarming Message of Satellite Data. Environ. Res. Lett. 2020, 15, 124047. [Google Scholar] [CrossRef]
- Mozafari, Z.; Noori, R.; Siadatmousavi, S.M.; Afzalimehr, H.; Azizpour, J. Satellite-Based Monitoring of Eutrophication in the Earth’s Largest Transboundary Lake. GeoHealth 2023, 7, e2022GH000770. [Google Scholar] [CrossRef]
- Hussain, S.; Mubeen, M.; Karuppannan, S. Land Use and Land Cover (LULC) Change Analysis Using TM, ETM+ and OLI Landsat Images in District of Okara, Punjab, Pakistan. Phys. Chem. Earth Parts a/b/c 2022, 126, 103117. [Google Scholar] [CrossRef]
- Lagrosa, J.J., IV; Zipperer, W.C.; Andreu, M.G. An Ecosystem Services-Centric Land Use and Land Cover Classification for a Subbasin of the Tampa Bay Watershed. Forests 2022, 13, 745. [Google Scholar] [CrossRef]
- Zarandian, A.; Ramezani Mehrian, M.; Mohammadyari, F. Impact Assessment of Vegetation Loss on the Ecosystem Functions in a Semiarid Watershed in Iran. Acta Geophys. 2022, 70, 677–696. [Google Scholar] [CrossRef]
- Liang, F.; Zhang, X.; Li, H.; Yu, H.; Lin, Q.; Jiang, M.; Zhang, J. Land Use Classification Based on Maximum Likelihood Method. In Advances in Intelligent Data Analysis and Applications, Proceedings of the Sixth Euro-China Conference on Intelligent Data Analysis and Applications, Arad, Romania, 15–18 October 2019; Springer: Singapore, 2022; pp. 133–139. [Google Scholar]
- Saraf, S.; Vejahat, J. Assessment of quantitative and qualitative characteristics of rivers in the catchment area of the Salt Lake in Alborz Province of Iran. Cent. Asian J. Environ. Sci. Technol. Innov. 2022, 3, 128–142. [Google Scholar]
- Chughtai, A.H.; Abbasi, H.; Karas, I.R. A Review on Change Detection Method and Accuracy Assessment for Land Use Land Cover. Remote Sens. Appl. Soc. Environ. 2021, 22, 100482. [Google Scholar] [CrossRef]
- Rohani, N.; Rajaee, T.; Mojaradi, B.; Jabbari, E.; Shafiei Darabi, S.A.; Heidari Bani, M. Climate Study of Changes of Major Water Resources in Qom Province Using Satellite Data and Remote Sensing Technologies. Environ. Sci. 2021, 19, 239–258. [Google Scholar]
- Verma, P.; Singh, P.; Srivastava, S.K. Impact of Land Use Change Dynamics on Sustainability of Groundwater Resources Using Earth Observation Data. Environ. Dev. Sustain. 2020, 22, 5185–5198. [Google Scholar] [CrossRef]
- Hu, Y.; Batunacun; Zhen, L.; Zhuang, D. Assessment of Land-Use and Land-Cover Change in Guangxi, China. Sci. Rep. 2019, 9, 2189. [Google Scholar] [CrossRef] [PubMed]
- Nodefarahani, M.; Aradpour, S.; Noori, R.; Tang, Q.; Partani, S.; Klöve, B. Metal Pollution Assessment in Surface Sediments of Namak Lake, Iran. Environ. Sci. Pollut. Res. 2020, 27, 45639–45649. [Google Scholar] [CrossRef]
- Mosammam, H.M.; Nia, J.T.; Khani, H.; Teymouri, A.; Kazemi, M. Monitoring Land Use Change and Measuring Urban Sprawl Based on Its Spatial Forms: The Case of Qom City. Egypt. J. Remote Sens. Space Sci. 2017, 20, 103–116. [Google Scholar]
- Nemati, A.; Ghoreishi Najafabadi, S.H.; Joodaki, G.; Mousavi Nadoushni, S.S. Evaluation of Agricultural Drought Characteristics in Iran’s Central Plateau Catchment Using GRACE Satellite. Iran. J. Soil Water Res. 2019, 50, 313–327. [Google Scholar]
- Noori, R.; Maghrebi, M.; Jessen, S.; Bateni, S.M.; Heggy, E.; Javadi, S.; Nouri, M.; Pistre, S.; Abolfathi, S.; AghaKouchak, A. Decline in Iran’s Groundwater Recharge. Nat. Commun. 2023, 14, 6674. [Google Scholar] [CrossRef]
- Pakseresht, S. Strategic Problemology of Development in Qom Province; Center for Presidential Strategic Studies: Tehran, Iran, 2016. [Google Scholar]
- Karimi, N.; Bagheri, M.H.; Hooshyaripor, F.; Farokhnia, A.; Sheshangosht, S. Deriving and evaluating bathymetry maps and stage curves for shallow lakes using remote sensing data. Water Resour. Manag. 2016, 30, 5003–5020. [Google Scholar] [CrossRef]
- Zha, Y.; Gao, J.; Ni, S. Use of normalized difference built-up index in automatically mapping urban areas from TM imagery. Int. J. Remote Sens. 2003, 24, 583–594. [Google Scholar] [CrossRef]
- Ahmad, A.; Quegan, S. Analysis of maximum likelihood classification on multispectral data. Appl. Math. Sci. 2012, 6, 6425–6436. [Google Scholar]
- Friedl, M.A.; Brodley, C.E. Decision tree classification of land cover from remotely sensed data. Remote Sens. Environ. 1997, 61, 399–409. [Google Scholar] [CrossRef]
- Dittrich, A.; Buerkert, A.; Brinkmann, K. Assessment of Land Use and Land Cover Changes during the Last 50 Years in Oases and Surrounding Rangelands of Xinjiang, NW China. J. Agric. Rural Dev. Trop. Subtrop. 2010, 111, 129–142. [Google Scholar]
- Ebadzadeh, H.; Ahmadi, K.; Mohammadnia-Afrozi, S.; Abbastaghani, R.; Moradi-Islami, A.; Abbasi, M.; Yari, S. Agricultural Statistics; Agricultural-Jihad Organization of Qom Province: Qom, Iran, 2014. [Google Scholar]
- Banko, G. A Review of Assessing the Accuracy of Classifications of Remotely Sensed Data and of Methods Including Remote Sensing Data in Forest Inventory; International Institute for Applied Systems Analysis: Luxemburg, 1998. [Google Scholar]
- Sharma, S.; Pradhan, R. Classification Methods for Land Use and Land Cover Pattern Analysis. Int. J. Innov. Technol. Explor. Eng. 2014, 4, 36–38. [Google Scholar]
- Alizadeh, A.; Kamali, G. Crops Water Requirement in Iran; Imam Reza University: Mashhad, Iran, 2008. [Google Scholar]
- Preite, L.; Solari, F.; Vignali, G. Technologies to Optimize the Water Consumption in Agriculture: A Systematic Review. Sustainability 2023, 15, 5975. [Google Scholar] [CrossRef]
- Rosenfield, G.H.; Fitzpatrick-Lins, K. A Coefficient of Agreement as a Measure of Thematic Classification Accuracy. Photogramm. Eng. Remote Sens. 1986, 52, 223–227. [Google Scholar]
- Cohen, J. A Coefficient of Agreement for Nominal Scales. Educ. Psychol. Meas. 1960, 20, 37–46. [Google Scholar] [CrossRef]
- Noori, R.; Hooshyaripor, F.; Javadi, S.; Dodangeh, M.; Tian, F.; Adamowski, J.F.; Berndtsson, R.; Baghvand, A.; Klöve, B. PODMT3DMS-Tool: Proper orthogonal decomposition linked to the MT3DMS model for nitrate simulation in aquifers. Hydrogeol. J. 2020, 28, 1125–1142. [Google Scholar] [CrossRef]
- Maghrebi, M.; Noori, R.; Partani, S.; Araghi, A.; Barati, R.; Farnoush, H.; Torabi Haghighi, A. Iran’s Groundwater Hydrochemistry. Earth Space Sci. 2021, 8, e2021EA001793. [Google Scholar] [CrossRef]
- Yaghmaei, H.; Sadeghi, S.H.; Moradi, H.; Gholamalifard, M. Effect of Dam Operation on Monthly and Annual Trends of Flow Discharge in the Qom Rood Watershed, Iran. J. Hydrol. 2018, 557, 254–264. [Google Scholar] [CrossRef]
- Rajabi, A.M. A Numerical Study on Land Subsidence Due to Extensive Overexploitation of Groundwater in Aliabad Plain, Qom-Iran. Nat. Hazards 2018, 93, 1085–1103. [Google Scholar] [CrossRef]
- Noori, R.; Maghrebi, M.; Mirchi, A.; Tang, Q.; Bhattarai, R.; Sadegh, M.; Noury, M.; Torabi Haghighi, A.; Kløve, B.; Madani, K. Anthropogenic Depletion of Iran’s Aquifers. Proc. Natl. Acad. Sci. USA 2021, 118, e2024221118. [Google Scholar] [CrossRef] [PubMed]
- Foldvary, L.; Abdelmohsen, K.; Ambrus, B. Water Density Variations of the Aral Sea from GRACE and GRACE-FO Monthly Solutions. Water 2023, 15, 1725. [Google Scholar] [CrossRef]
- Xu, L.; Chen, N.C.; Zhang, X. Global drought trends under 1.5 and 2 °C warming. Int. J. Climatol. 2019, 39, 2375–2385. [Google Scholar] [CrossRef]


| Index Classification Method | Cropland | Orchard | Rangeland | Urban | Water | Bare Land | |
|---|---|---|---|---|---|---|---|
| PA | DTC | 83.33 | 86.84 | 83.33 | 71.88 | 89.47 | 96.15 |
| MLC | 75 | 80.49 | 82.76 | 81.25 | 78.95 | 73.08 | |
| UA | DTC | 89.74 | 100 | 75.76 | 100 | 100 | 52.52 |
| MLC | 91.67 | 91.67 | 51.06 | 100 | 100 | 63.33 | |
| Oe | DTC | 16.67 | 13.16 | 16.67 | 28.13 | 10.53 | 3.85 |
| MLC | 25 | 19.51 | 17.24 | 18.75 | 21.05 | 26.92 | |
| Ce | DTC | 10.26 | 0 | 24.24 | 0 | 0 | 40.87 |
| MLC | 8.33 | 8.33 | 48.94 | 0 | 0 | 36.67 | |
| Year | 1989 | 1999 | 2008 | 2014 | 2019 | |
|---|---|---|---|---|---|---|
| Land-Use | ||||||
| cropland | 30,546.81 | 34,340.85 | 34,039.8 | 39,108.33 | 39,255.03 | |
| orchard | 3903.57 | 5286.69 | 5470.47 | 5745.6 | 6306.84 | |
| rangeland | 335,022.7 | 306,292.1 | 356,932.5 | 319,030.5 | 446,187.5 | |
| urban | 4309.74 | 4745.88 | 6030.36 | 6137.73 | 6547.86 | |
| water | 9843.84 | 29,911.23 | 935.91 | 5709.33 | 17,401.77 | |
| bare land | 765,847.08 | 770,640.2 | 738,251.9 | 775,568.8 | 632,671.8 | |
| others | 2543.04 | 799.83 | 1931.67 | 716.31 | 4202.82 | |
| Year | 1989 | 1999 | 2008 | 2014 | 2019 | |
|---|---|---|---|---|---|---|
| Land-Use | ||||||
| spring cultivation | 11,728.17 | 13,487.4 | 14,418.36 | 16,485.48 | 17,323 | |
| fall cultivation | 11,880.81 | 11,022.03 | 7804.44 | 14,100.48 | 14,383.26 | |
| orchard | 3571.47 | 3949.56 | 4172.22 | 4737.24 | 5754.24 | |
| rangeland | 33,865.92 | 30,117.87 | 32,275.71 | 140,075.8 | 262,979.9 | |
| urban | 4016.16 | 4167.63 | 4448.7 | 5127.39 | 5786.88 | |
| water | 24,480.99 | 40,031.37 | 29,954.25 | 1209.69 | 22,538.52 | |
| bare land | 1,062,503 | 1,048,405 | 1,058,963 | 970,571.5 | 823,176.9 | |
| others | 523.8 | 1345.77 | 382.68 | 245.88 | 1227.15 | |
Disclaimer/Publisher’s Note: The statements, opinions and data contained in all publications are solely those of the individual author(s) and contributor(s) and not of MDPI and/or the editor(s). MDPI and/or the editor(s) disclaim responsibility for any injury to people or property resulting from any ideas, methods, instructions or products referred to in the content. |
© 2023 by the authors. Licensee MDPI, Basel, Switzerland. This article is an open access article distributed under the terms and conditions of the Creative Commons Attribution (CC BY) license (https://creativecommons.org/licenses/by/4.0/).
Share and Cite
Ebrahimivand, A.; Hooshyaripor, F.; Rezaei-Gharehaghaj, S.; Razi, S.; Salamttalab, M.M.; Kolahi, M.; Noori, R. Satellite-Based Monitoring of Growing Agricultural Water Consumption in Hyper-Arid Regions. Water 2023, 15, 3880. https://doi.org/10.3390/w15223880
Ebrahimivand A, Hooshyaripor F, Rezaei-Gharehaghaj S, Razi S, Salamttalab MM, Kolahi M, Noori R. Satellite-Based Monitoring of Growing Agricultural Water Consumption in Hyper-Arid Regions. Water. 2023; 15(22):3880. https://doi.org/10.3390/w15223880
Chicago/Turabian StyleEbrahimivand, Ashkan, Farhad Hooshyaripor, Salar Rezaei-Gharehaghaj, Sahand Razi, Mohammad Milad Salamttalab, Mahdi Kolahi, and Roohollah Noori. 2023. "Satellite-Based Monitoring of Growing Agricultural Water Consumption in Hyper-Arid Regions" Water 15, no. 22: 3880. https://doi.org/10.3390/w15223880
APA StyleEbrahimivand, A., Hooshyaripor, F., Rezaei-Gharehaghaj, S., Razi, S., Salamttalab, M. M., Kolahi, M., & Noori, R. (2023). Satellite-Based Monitoring of Growing Agricultural Water Consumption in Hyper-Arid Regions. Water, 15(22), 3880. https://doi.org/10.3390/w15223880