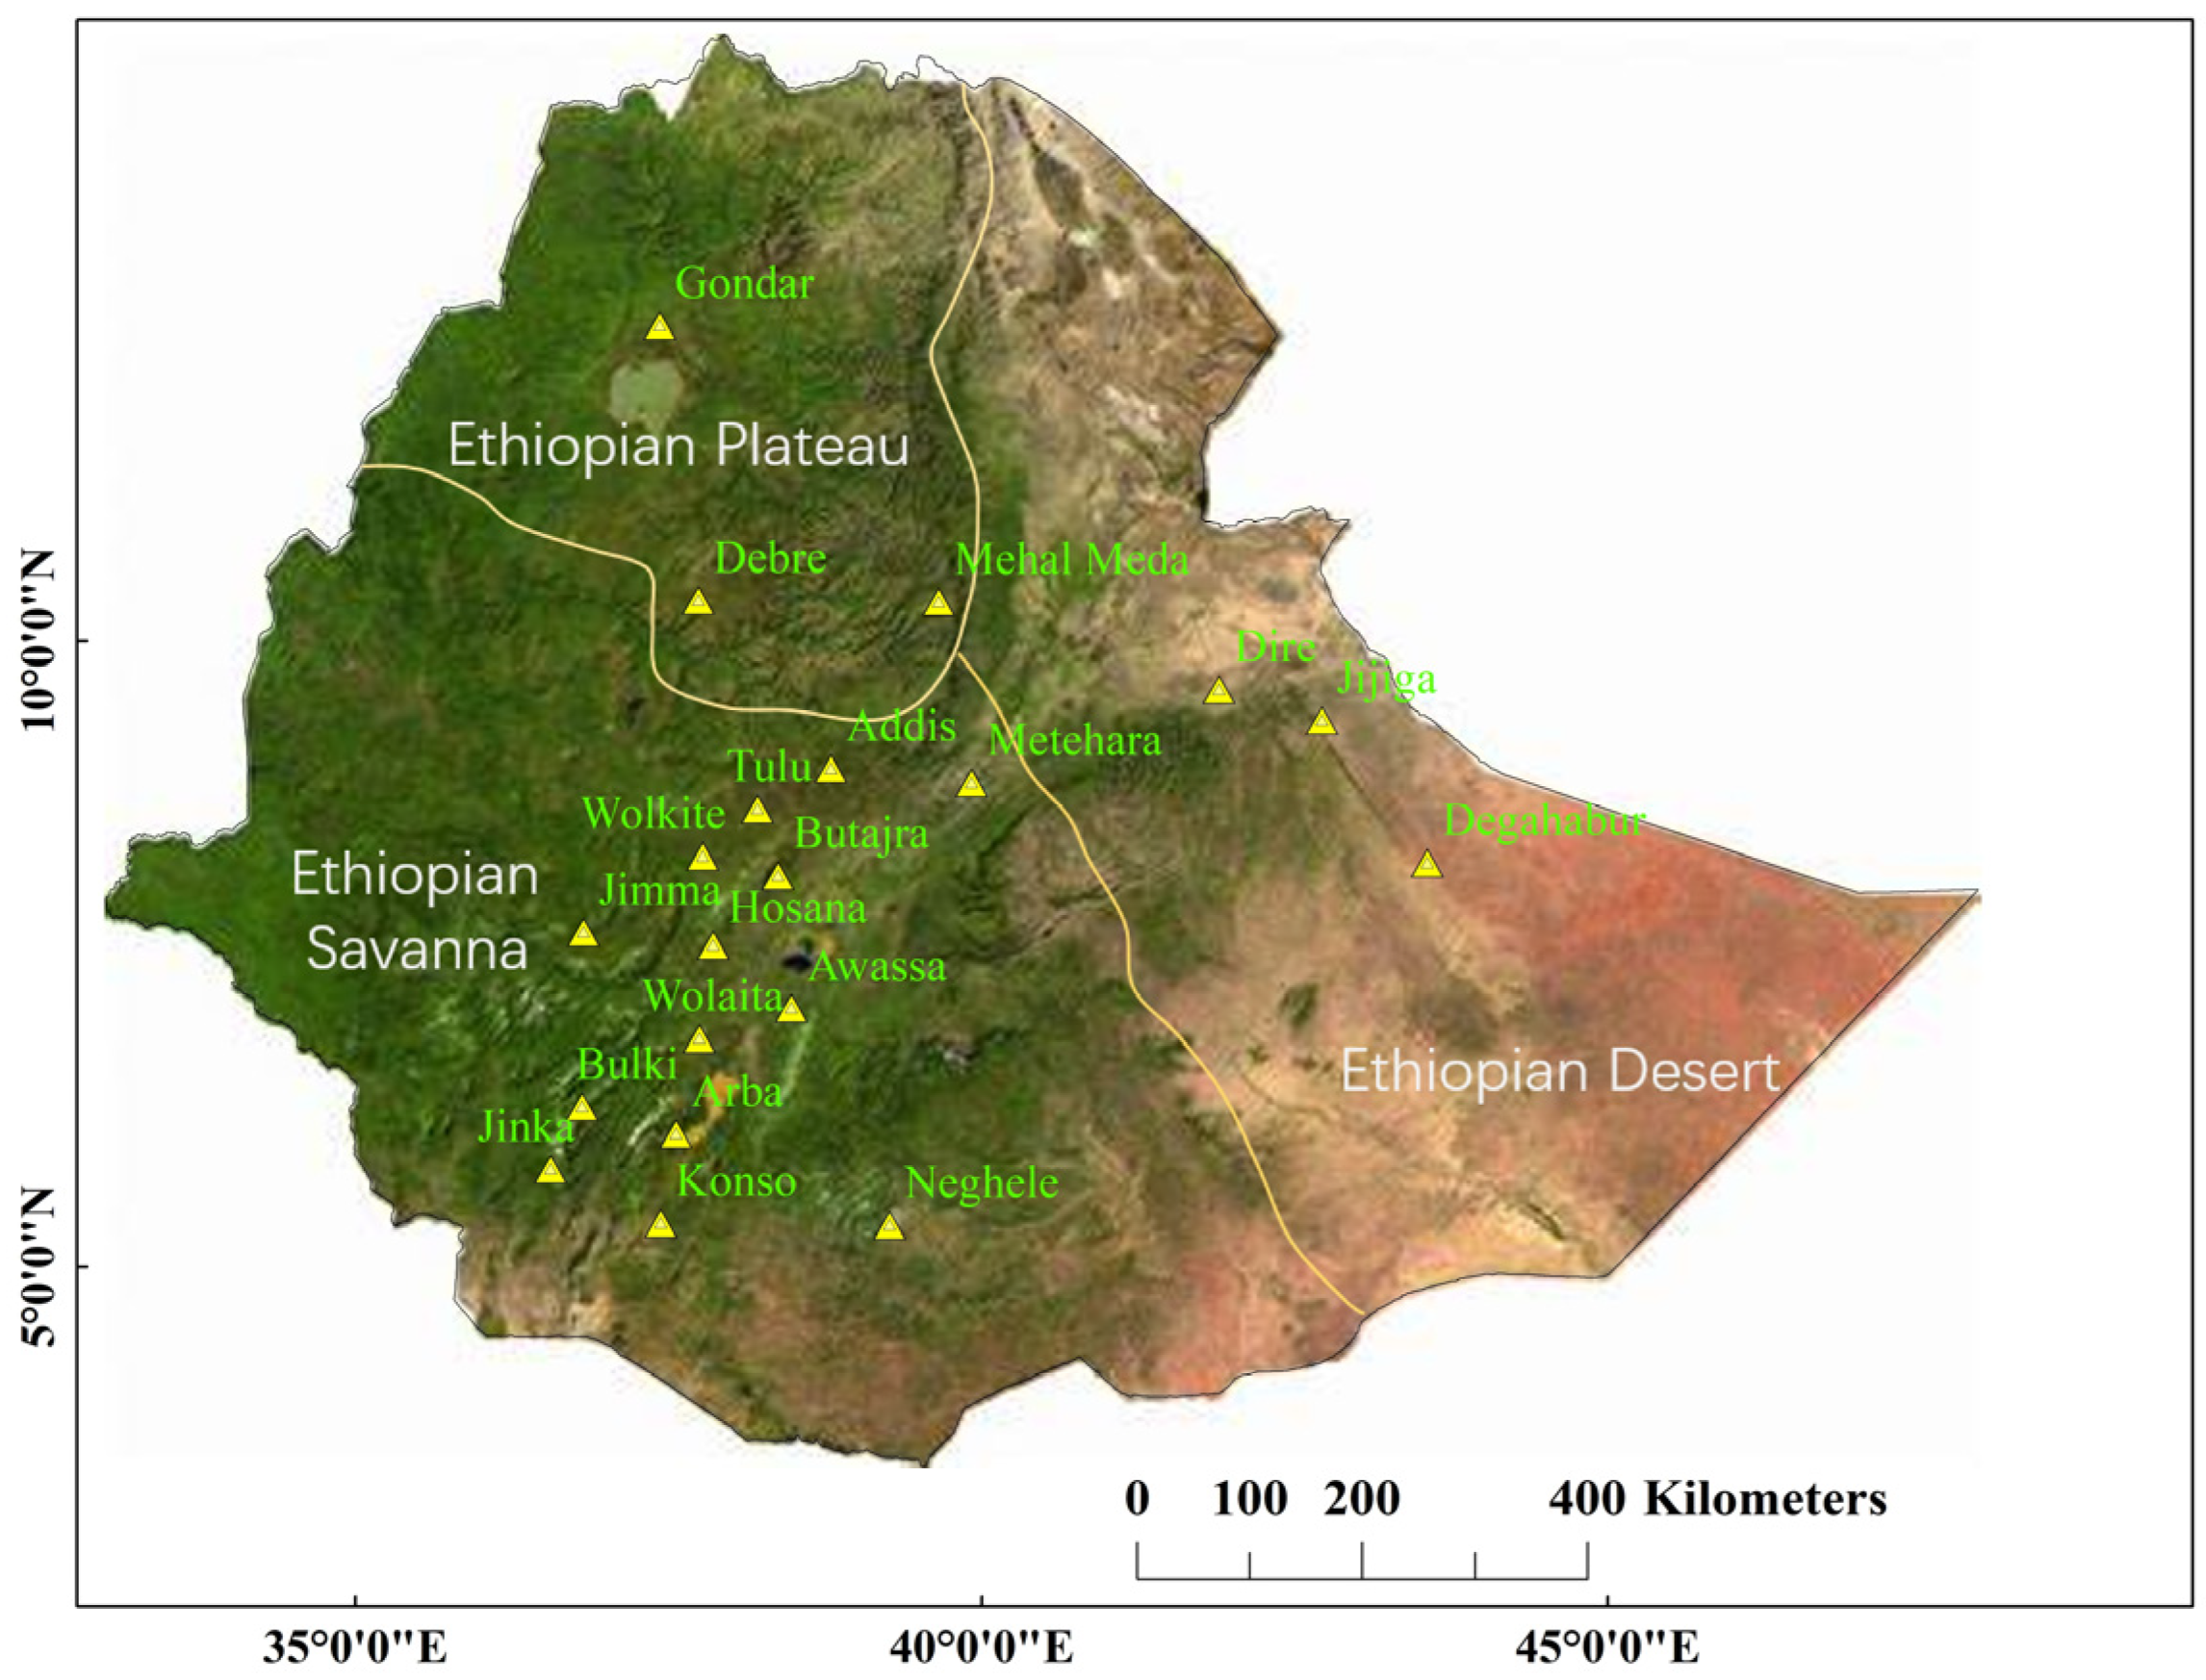
Figure 1.
Distribution of 20 meteorological stations in Ethiopia.
Figure 1.
Distribution of 20 meteorological stations in Ethiopia.
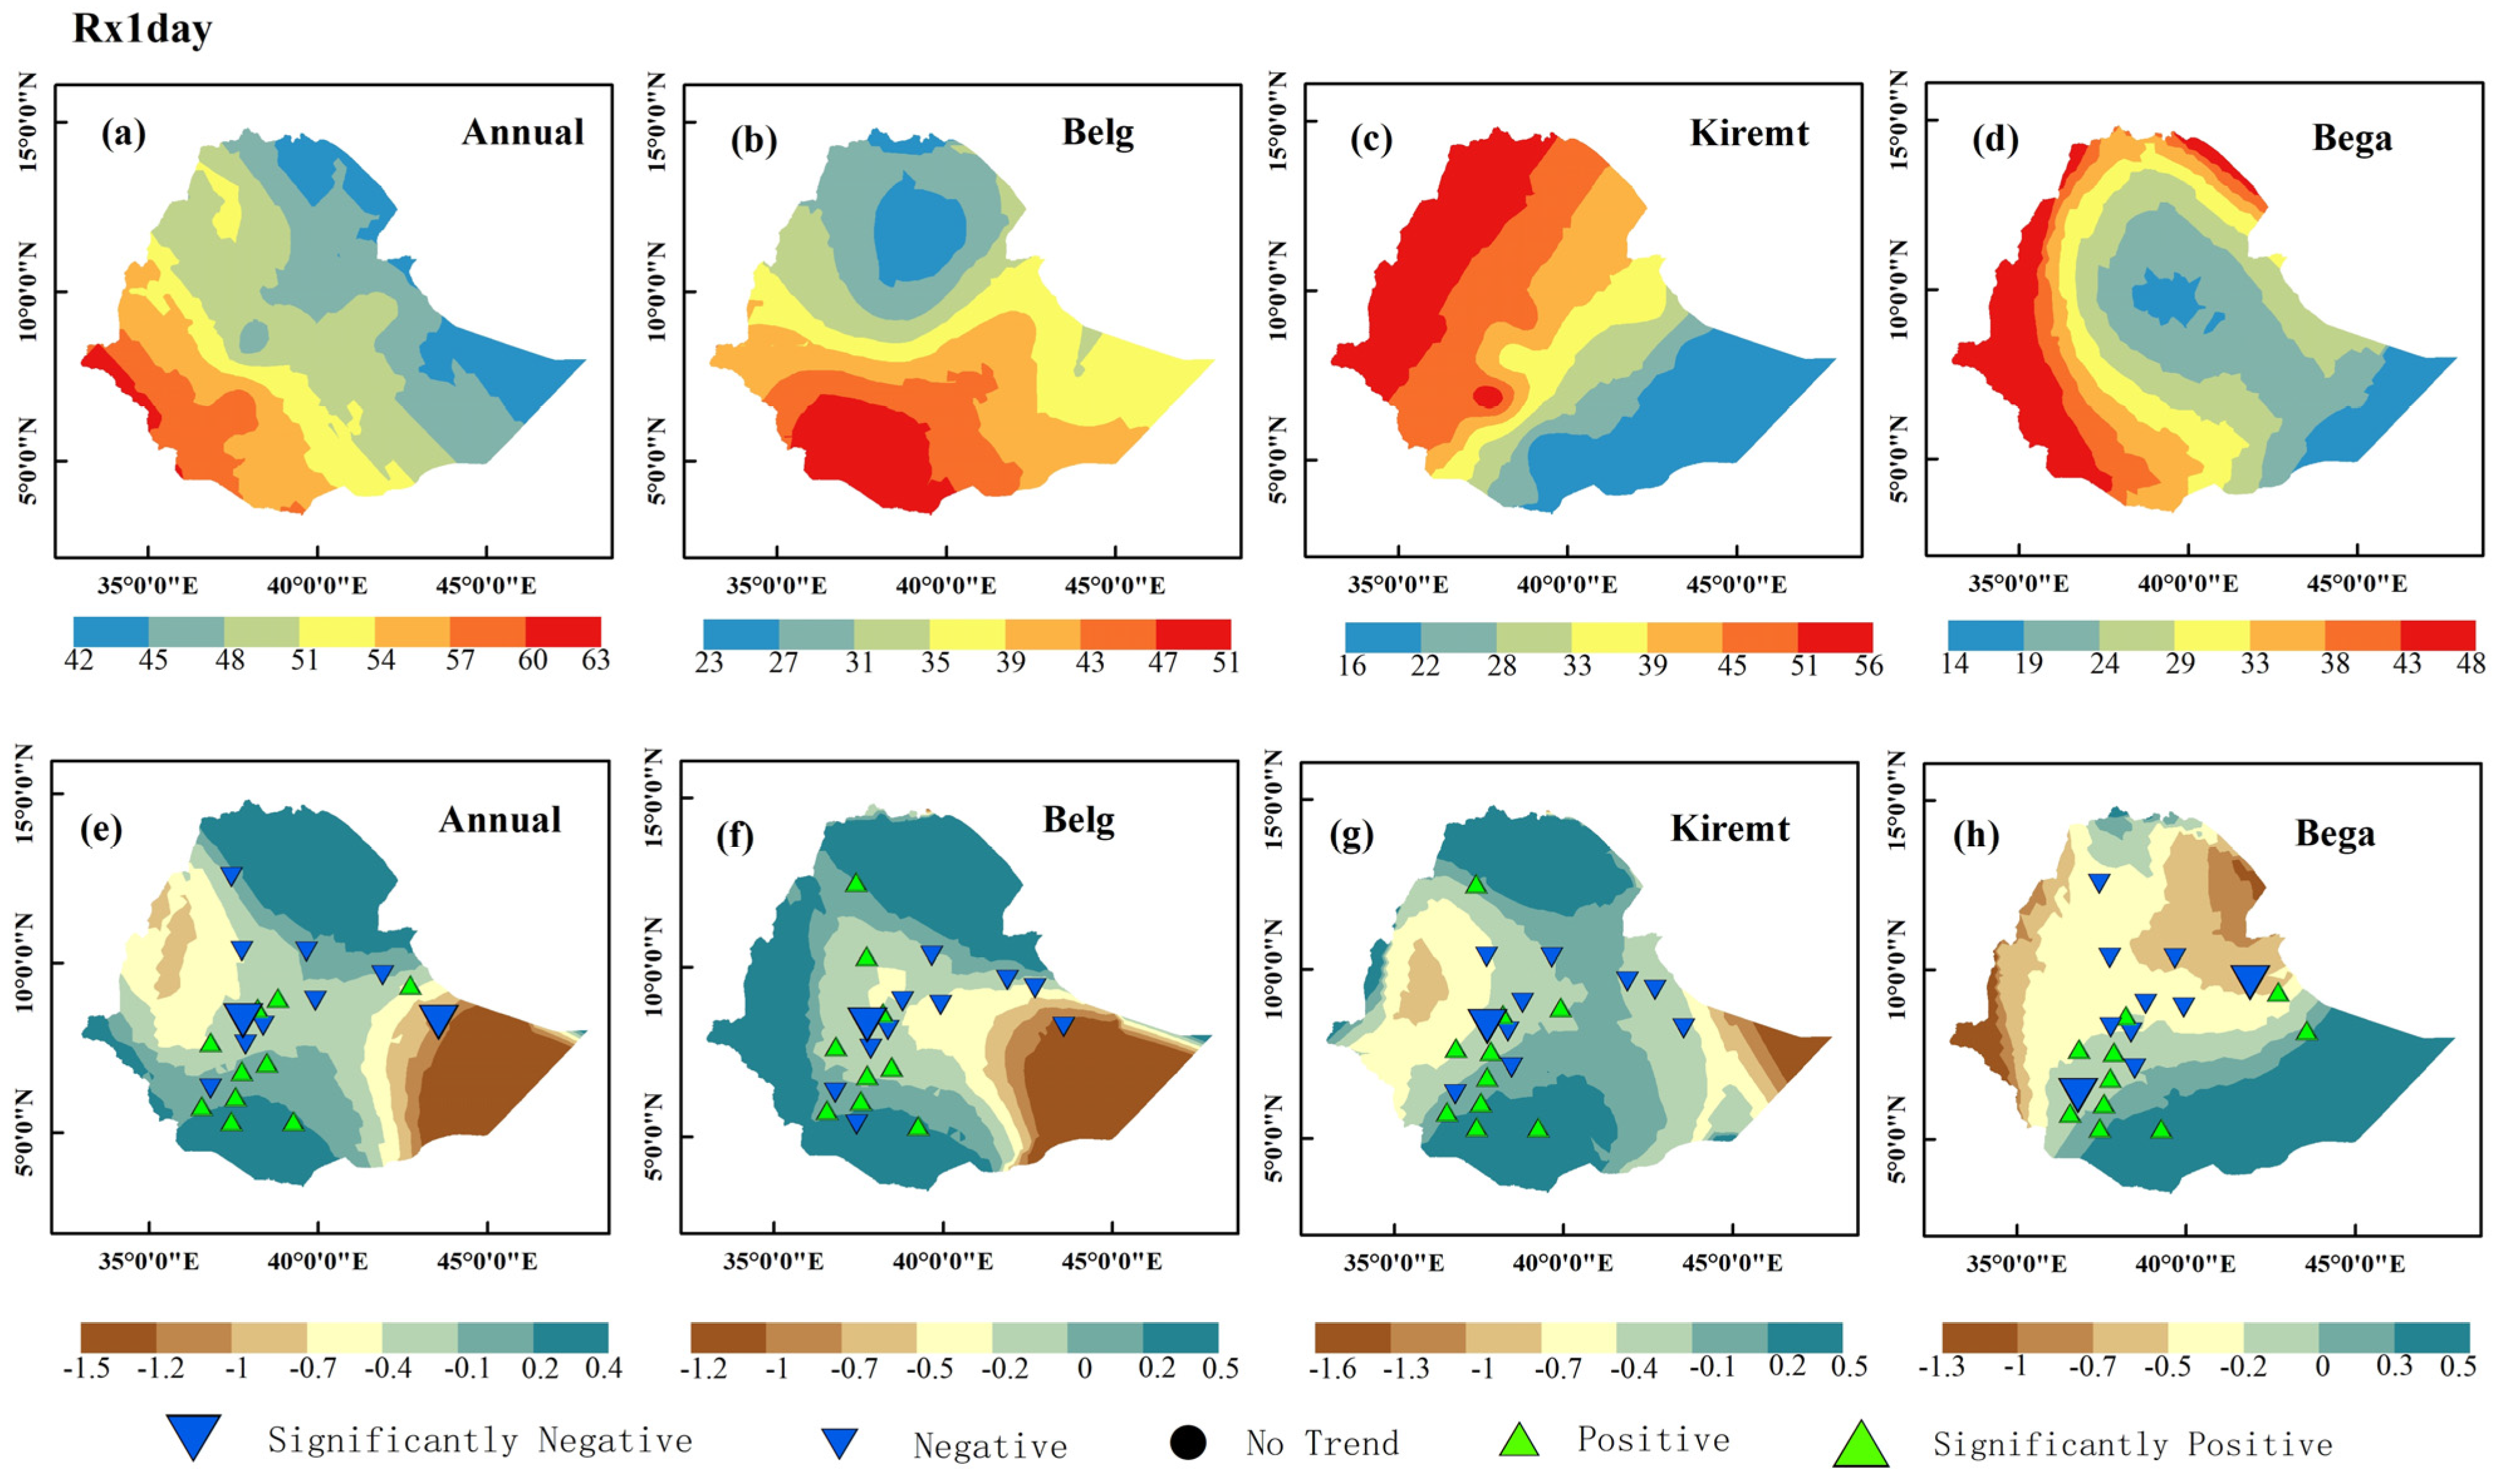
Figure 2.
Spatial distribution of mean and trend of Rx1day index under different temporal scales: (a,e) annual, (b,f) Belg season, (c,g) Kiremt season, (d,h) Bega season.
Figure 2.
Spatial distribution of mean and trend of Rx1day index under different temporal scales: (a,e) annual, (b,f) Belg season, (c,g) Kiremt season, (d,h) Bega season.
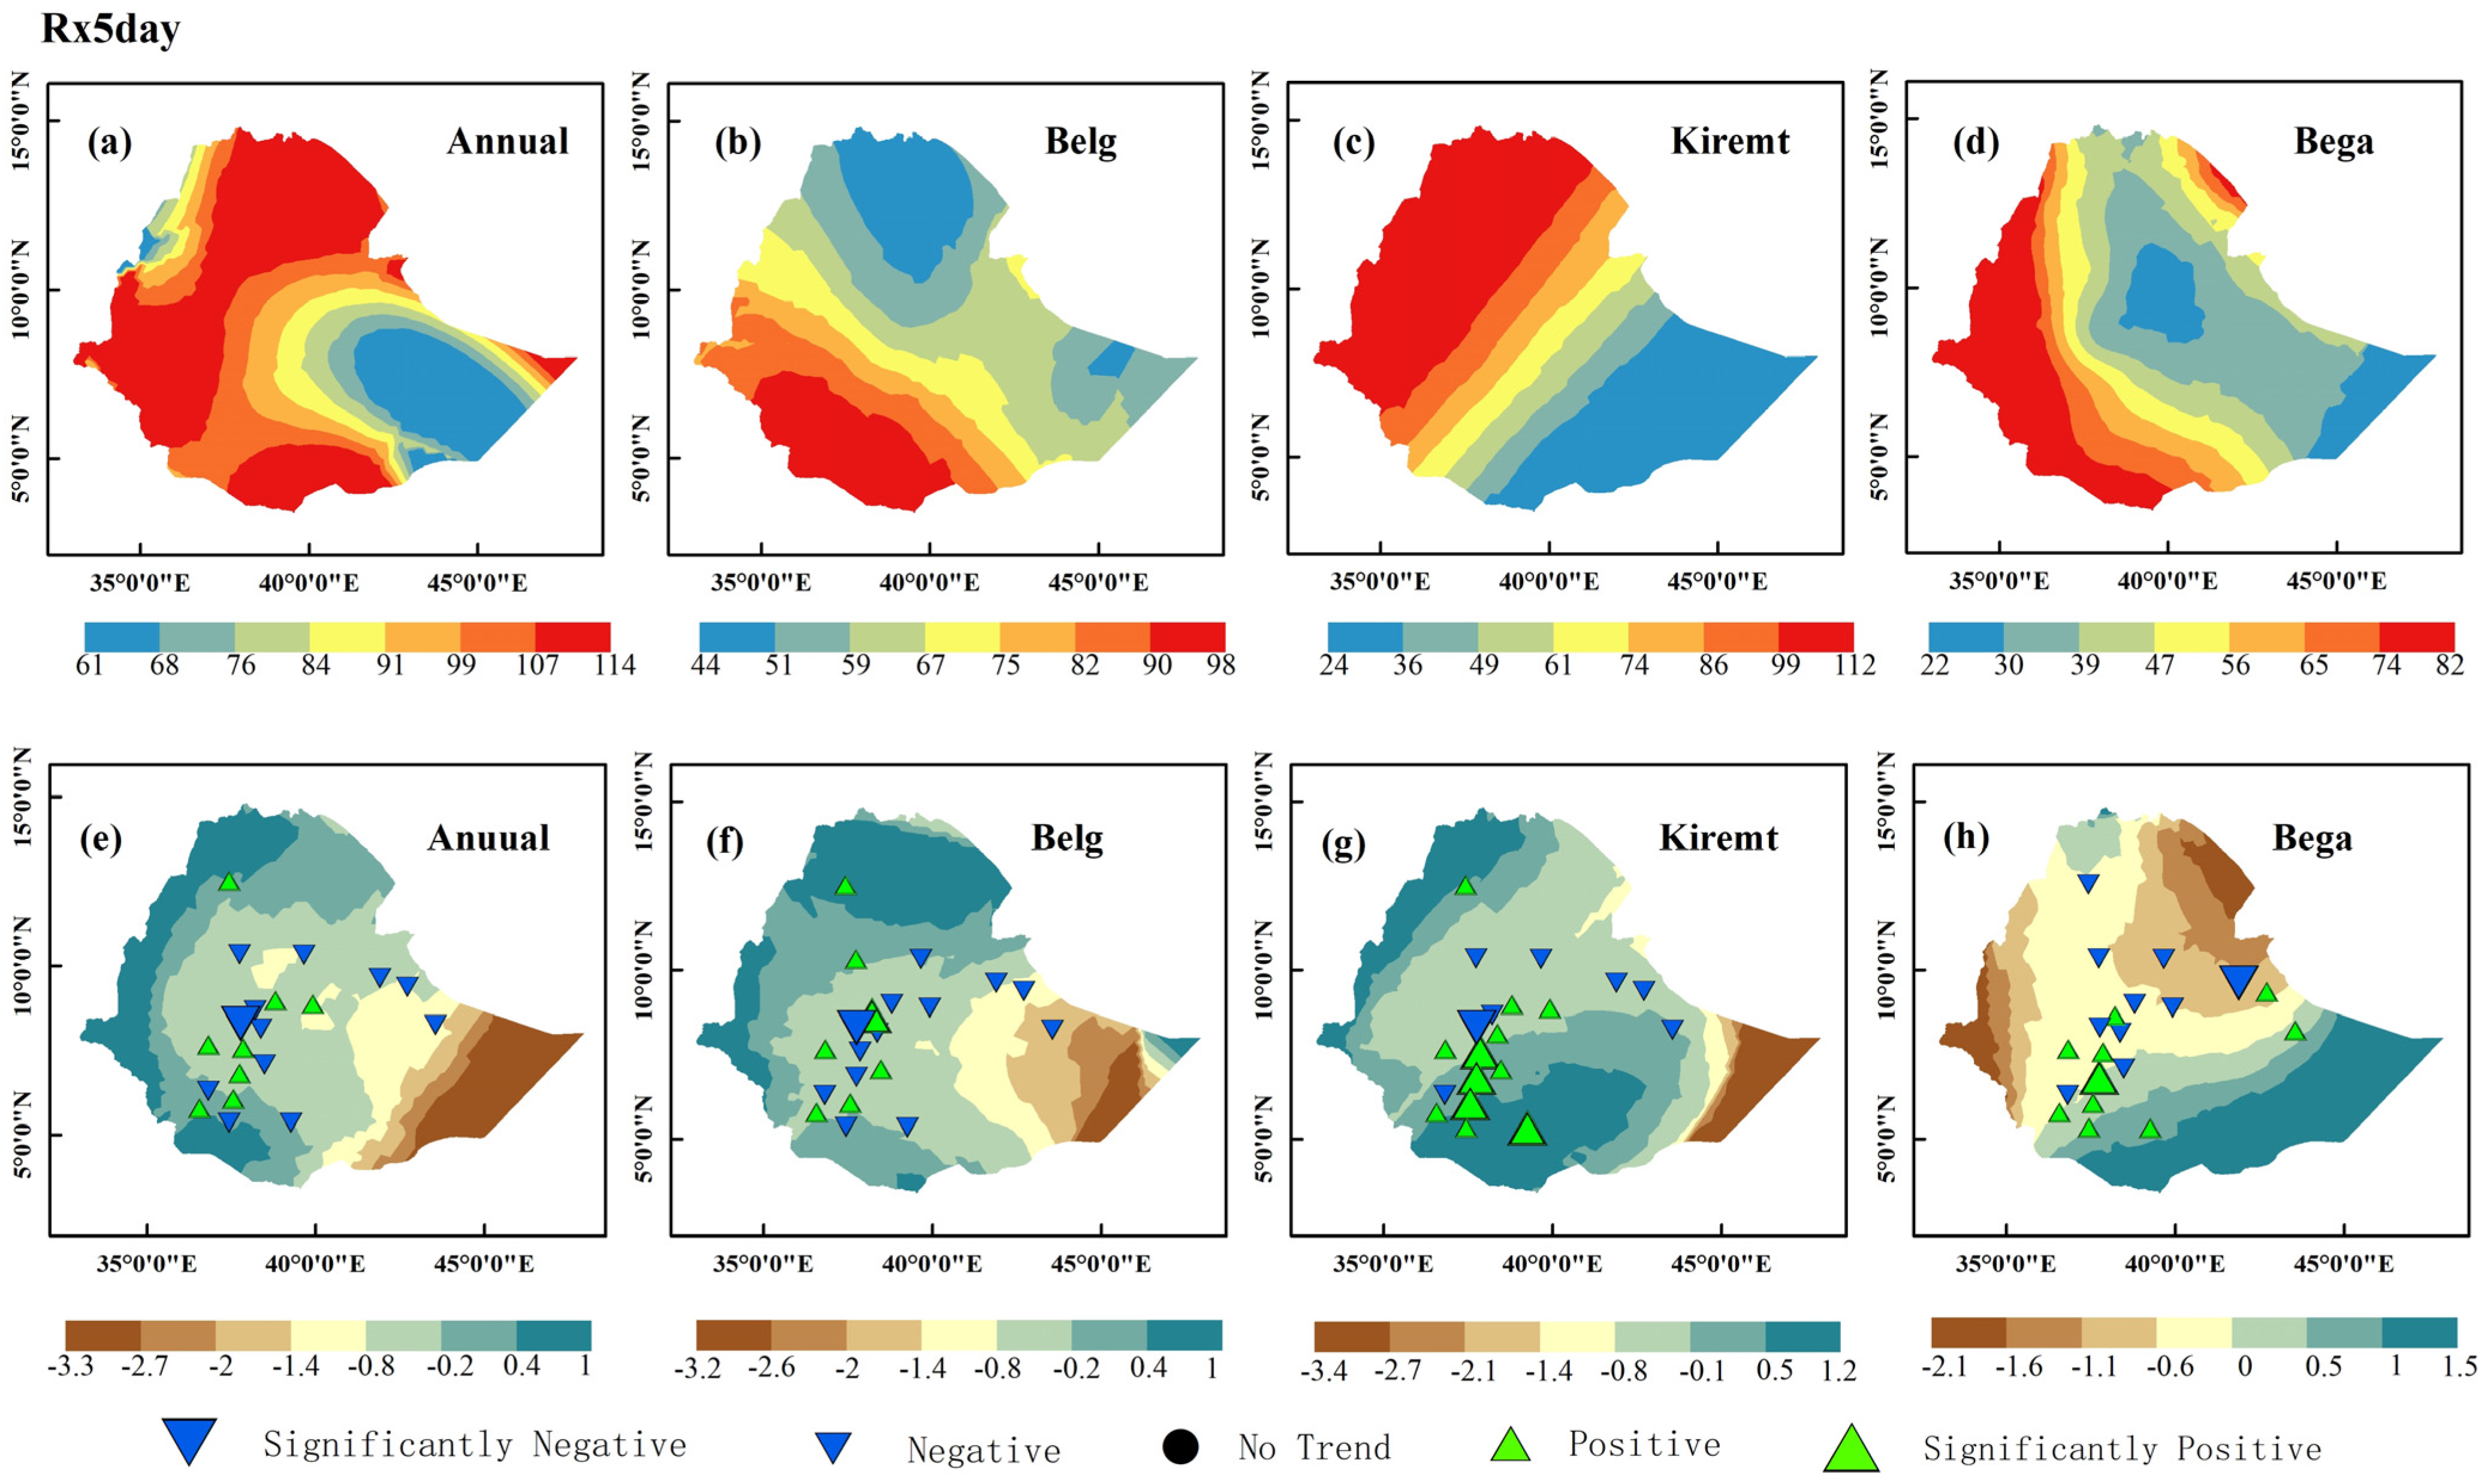
Figure 3.
Spatial distribution of mean and trend of Rx5day index under different temporal scales: (a,e) annual, (b,f) Belg season, (c,g) Kiremt season, (d,h) Bega season.
Figure 3.
Spatial distribution of mean and trend of Rx5day index under different temporal scales: (a,e) annual, (b,f) Belg season, (c,g) Kiremt season, (d,h) Bega season.
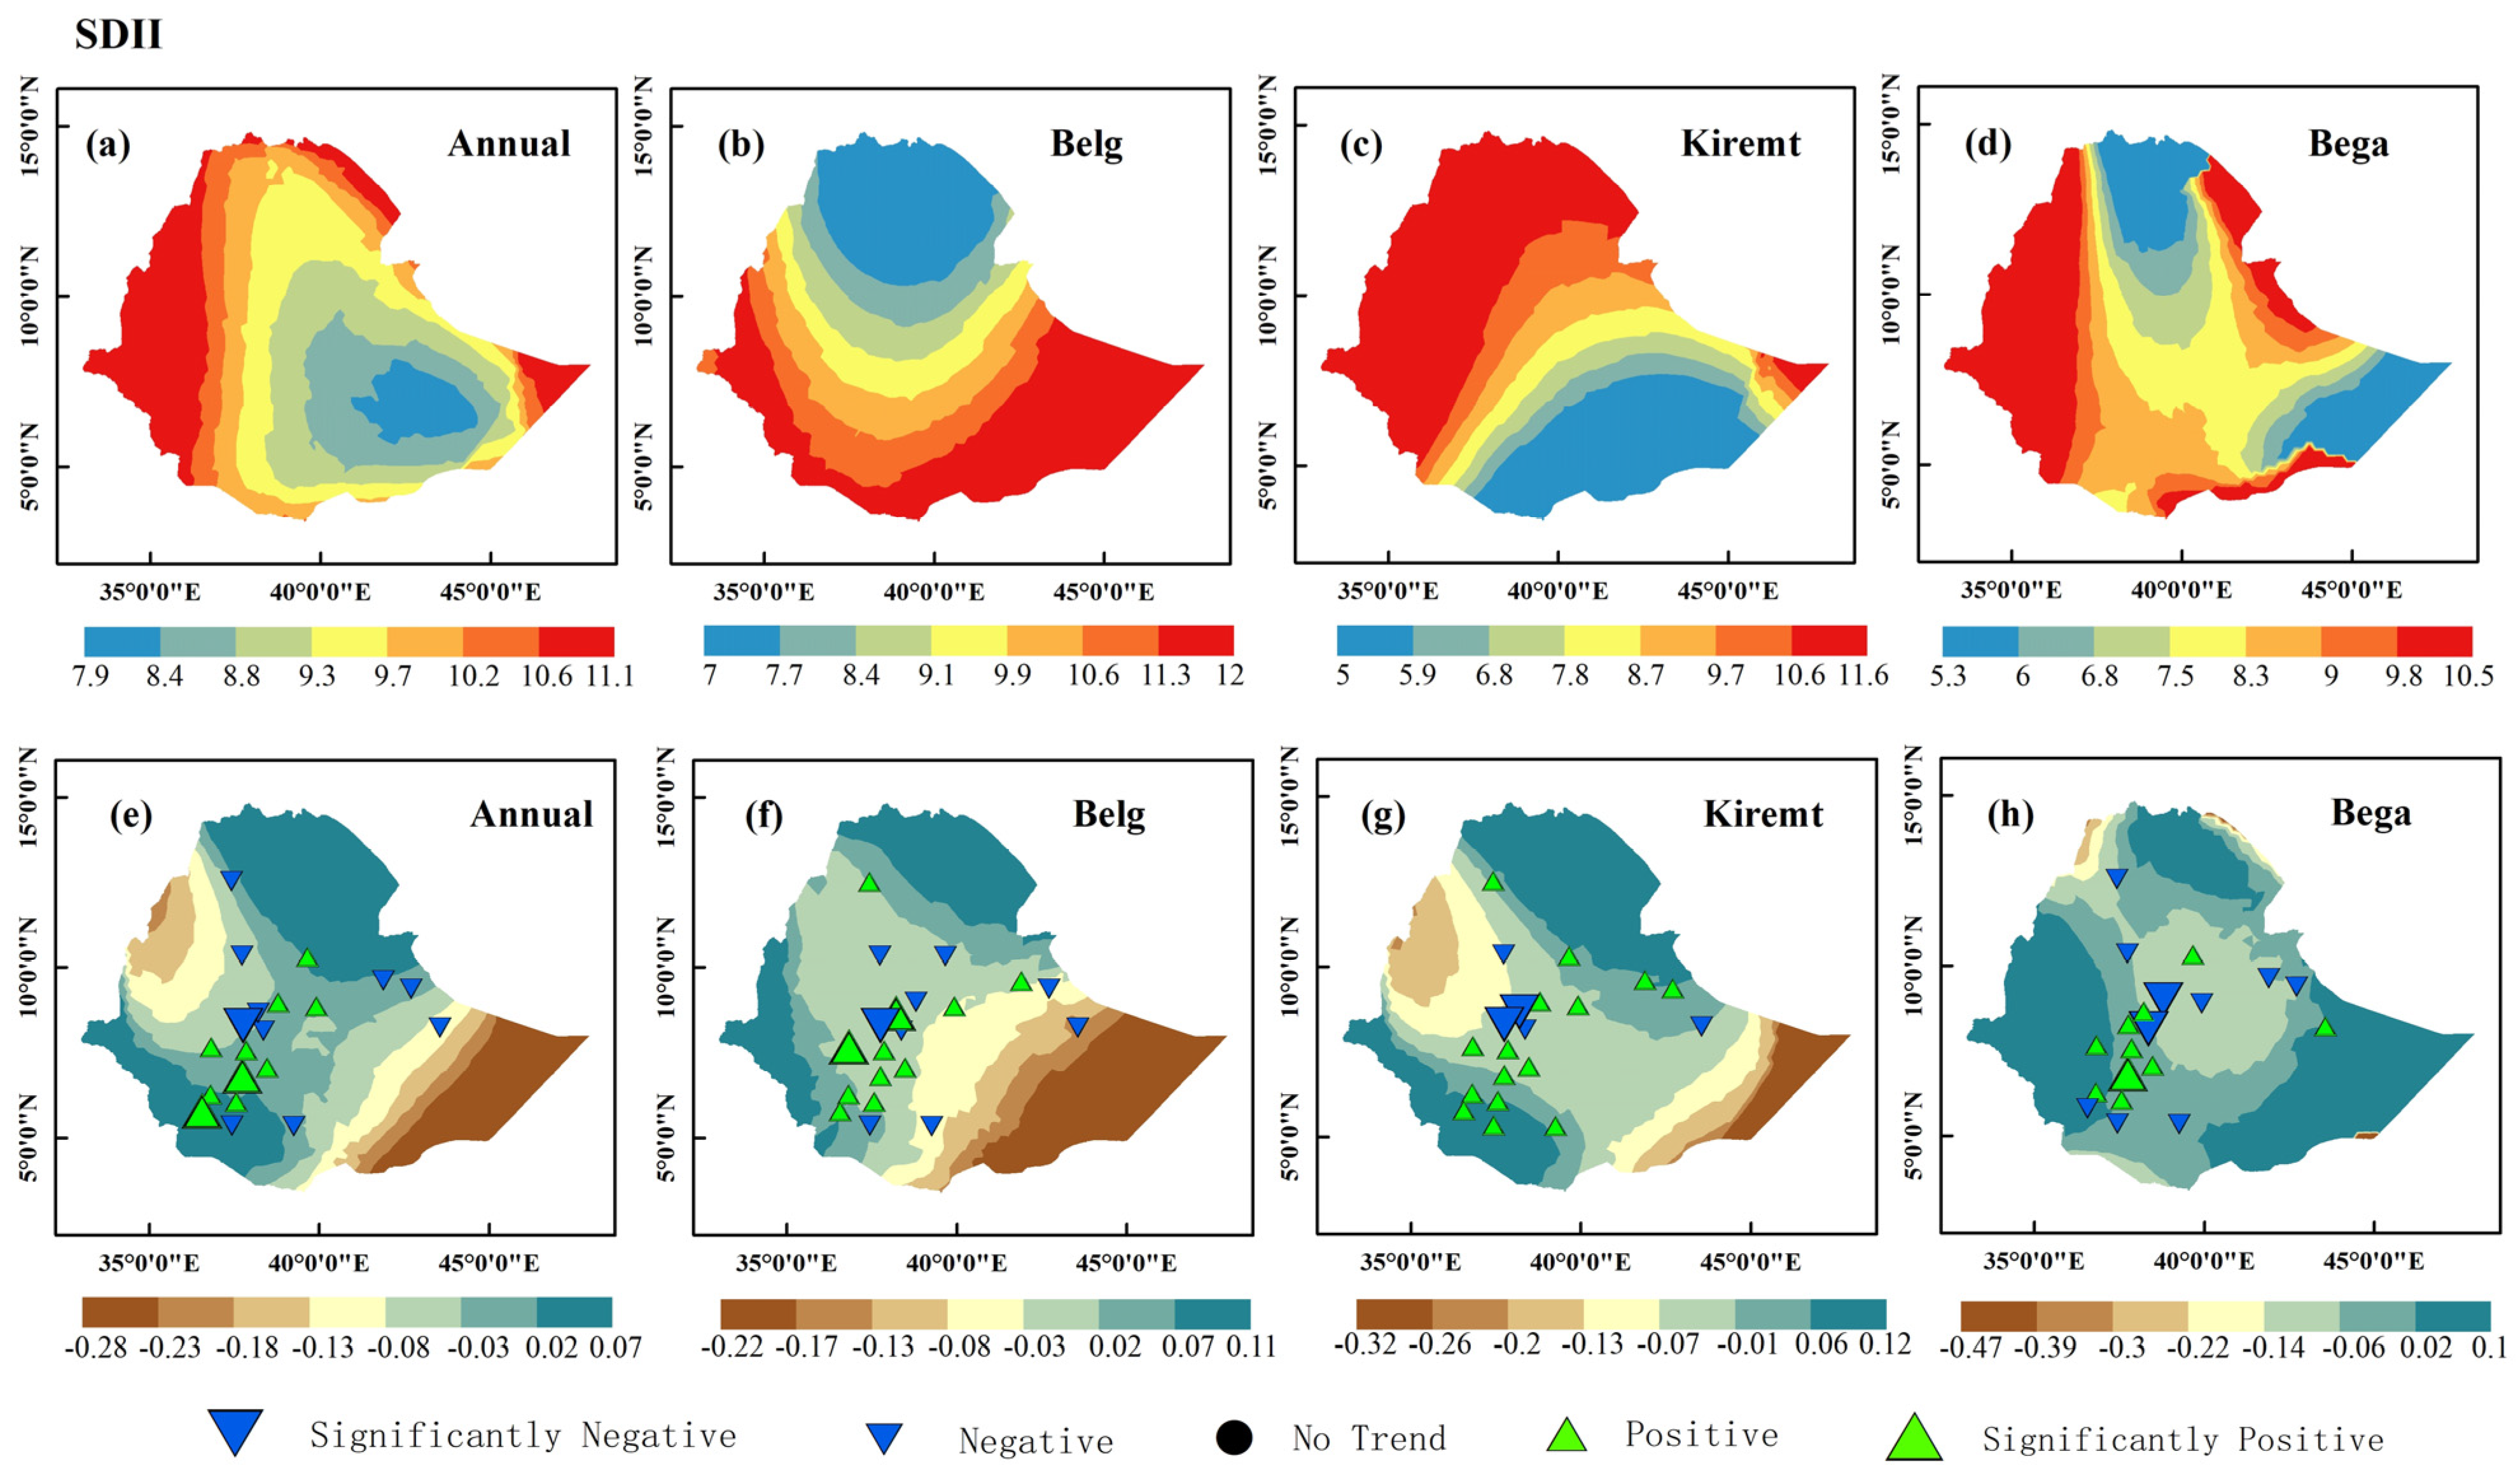
Figure 4.
Spatial distribution of mean and trend of SDII index under different temporal scales: (a,e) annual, (b,f) Belg season, (c,g) Kiremt season, (d,h) Bega season.
Figure 4.
Spatial distribution of mean and trend of SDII index under different temporal scales: (a,e) annual, (b,f) Belg season, (c,g) Kiremt season, (d,h) Bega season.
Figure 5.
Spatial distribution of mean and trend of R95pTOT index under different temporal scales: (a,e) annual, (b,f) Belg season, (c,g) Kiremt season, (d,h) Bega season.
Figure 5.
Spatial distribution of mean and trend of R95pTOT index under different temporal scales: (a,e) annual, (b,f) Belg season, (c,g) Kiremt season, (d,h) Bega season.
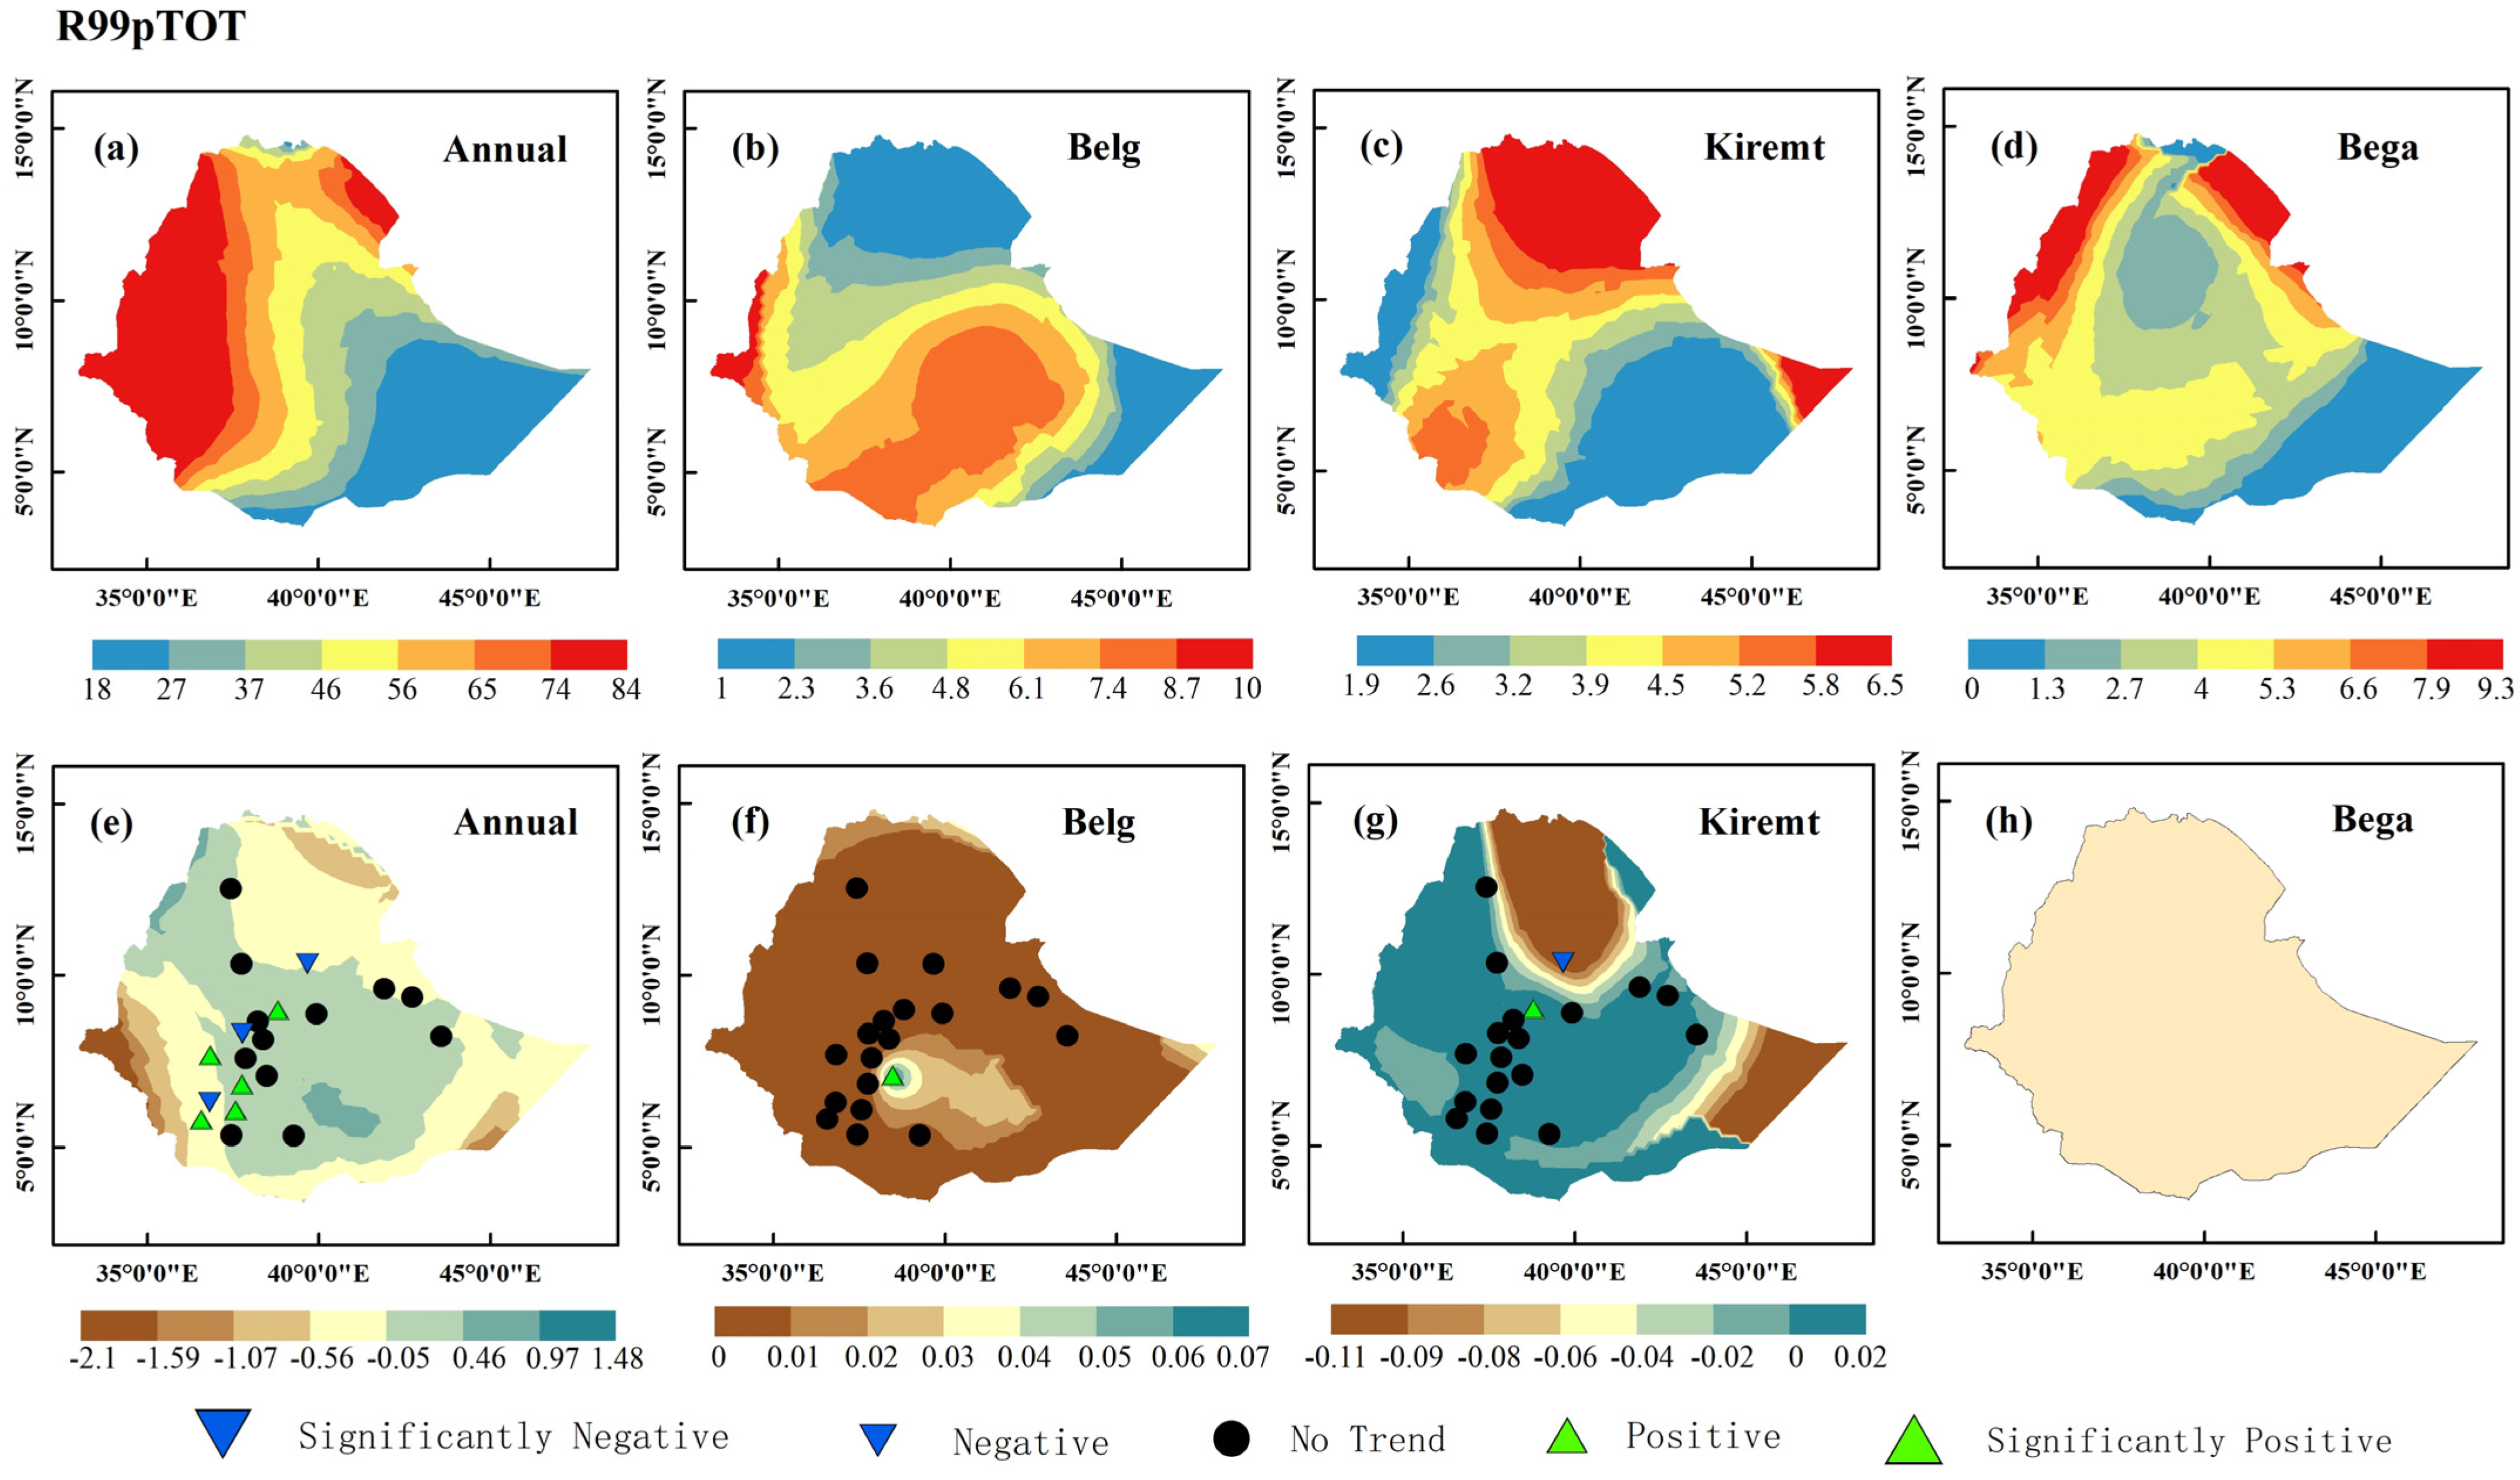
Figure 6.
Spatial distribution of mean and trend of R99pTOT index under different temporal scales: (a,e) annual, (b,f) Belg season, (c,g) Kiremt season, (d,h) Bega season.
Figure 6.
Spatial distribution of mean and trend of R99pTOT index under different temporal scales: (a,e) annual, (b,f) Belg season, (c,g) Kiremt season, (d,h) Bega season.
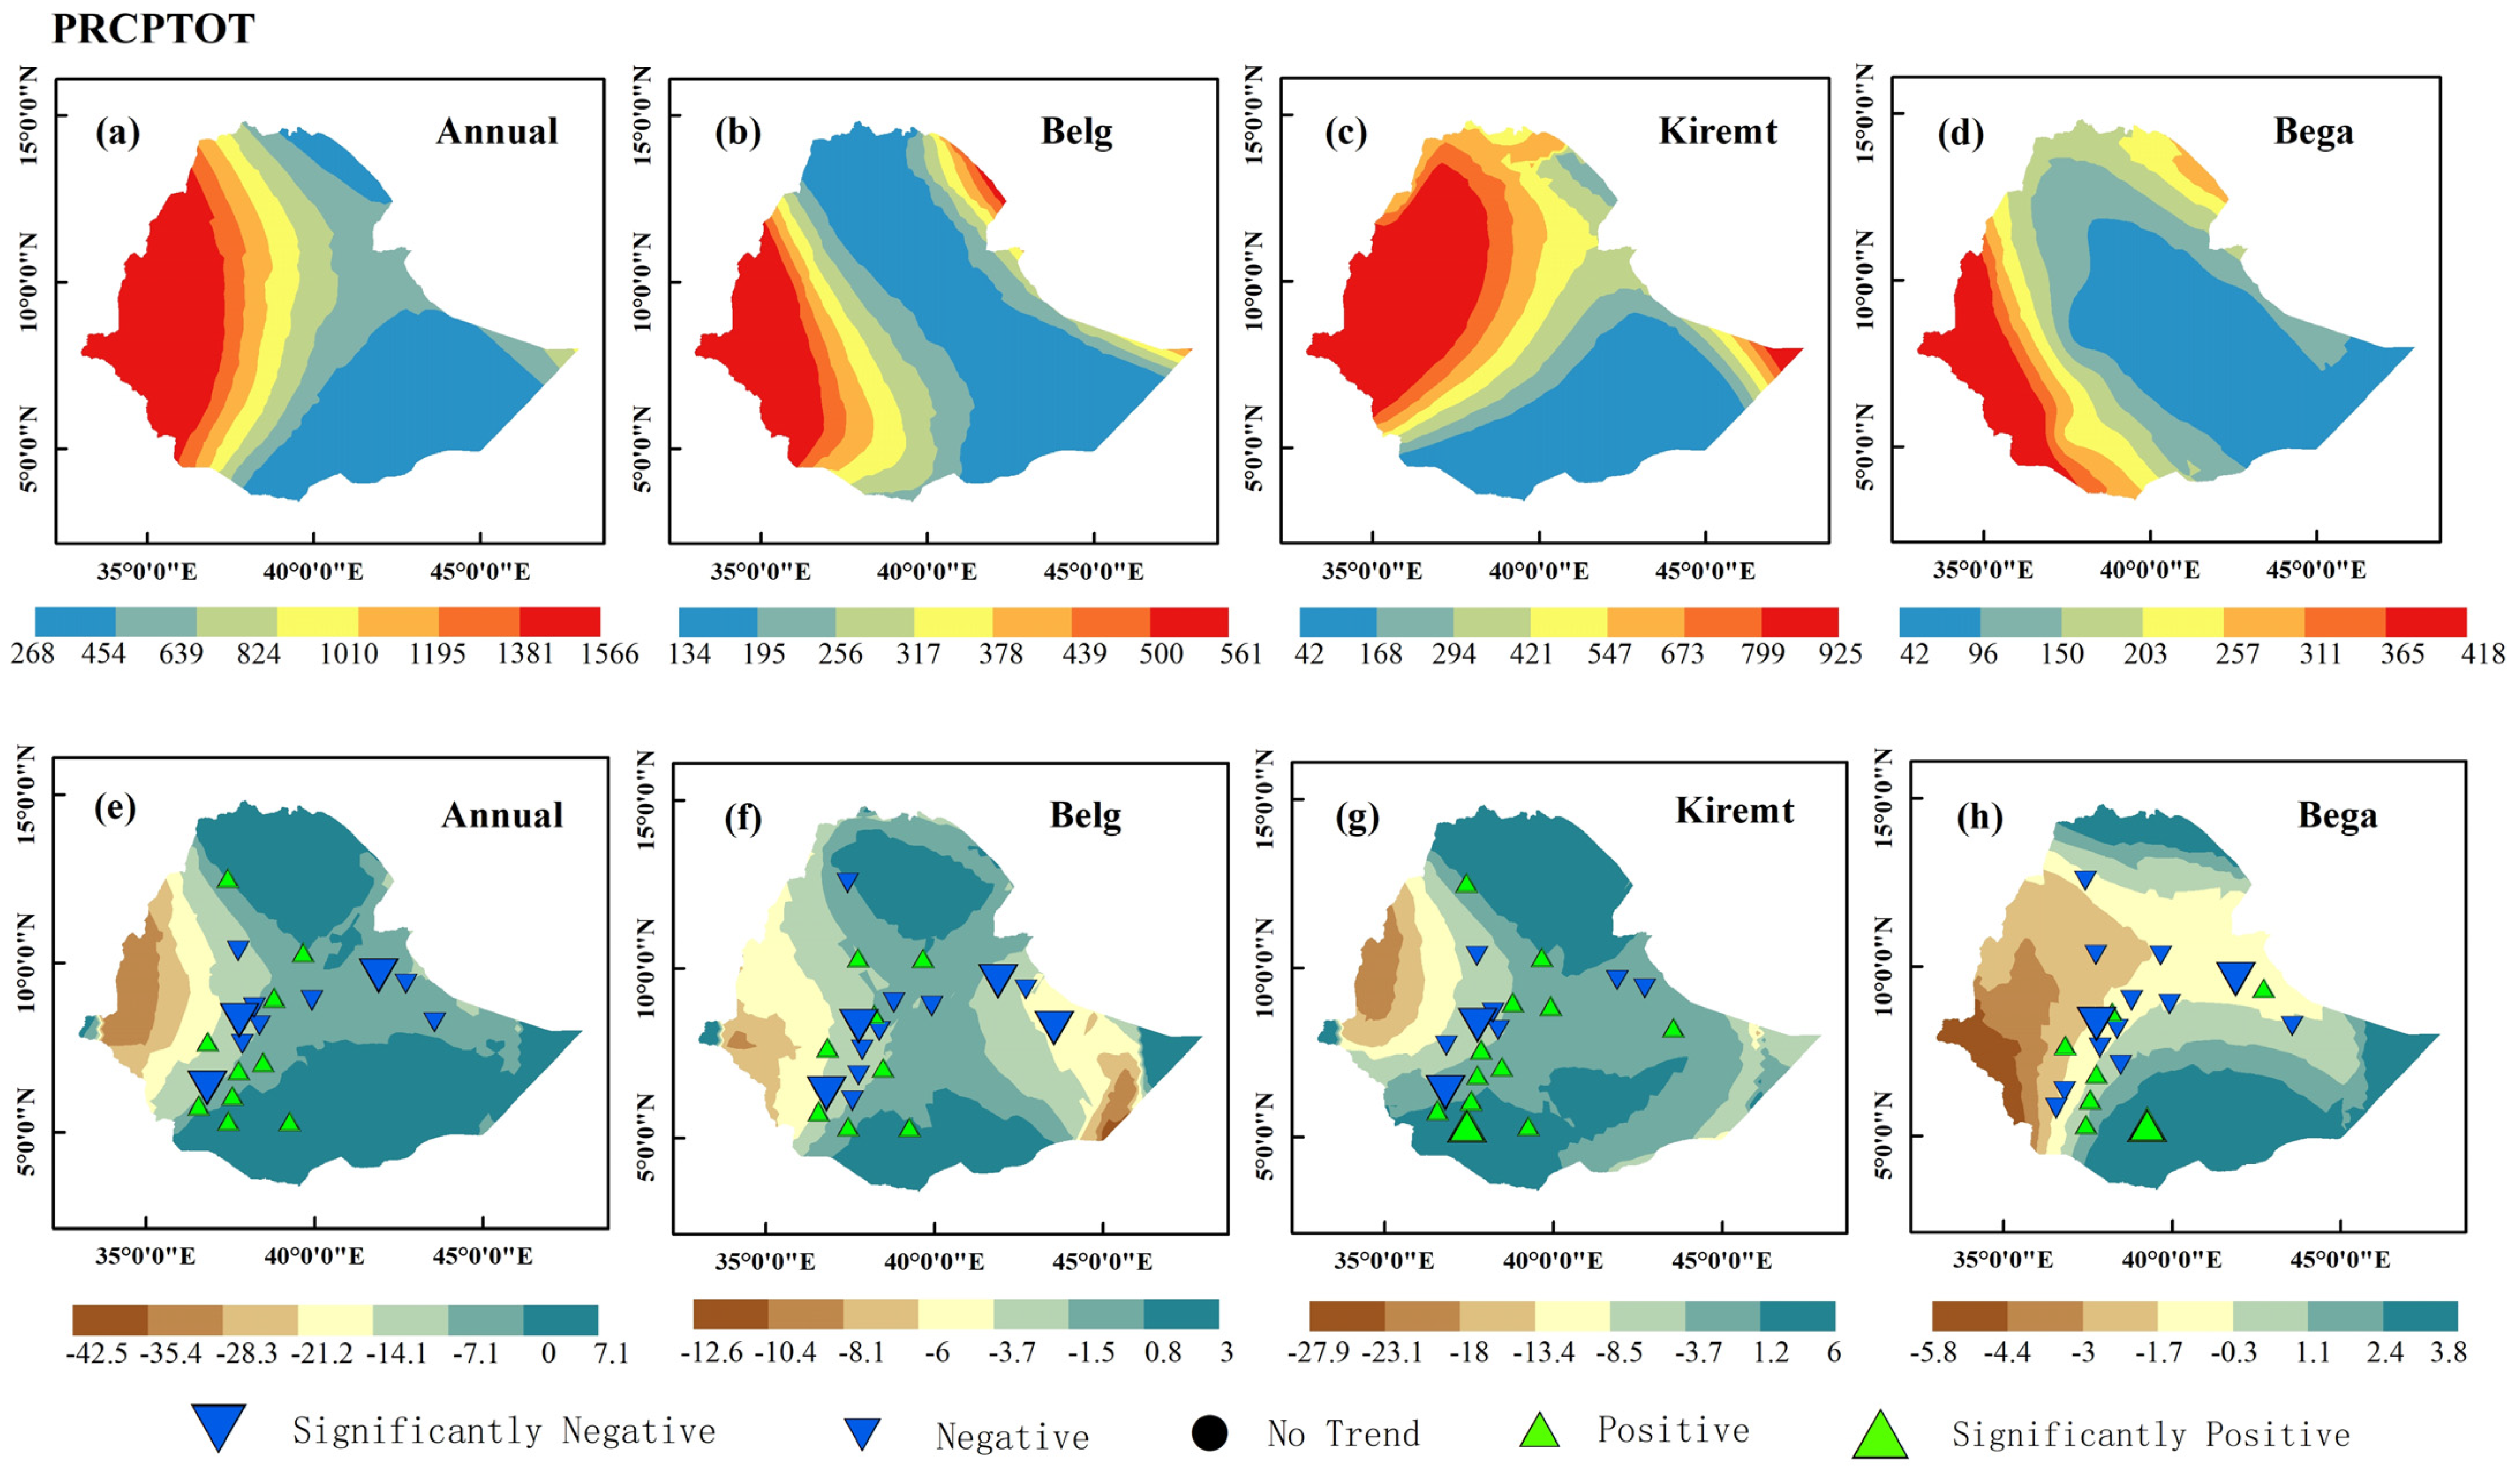
Figure 7.
Spatial distribution of mean and trend of PRCPTOT index under different temporal scales: (a,e) annual, (b,f) Belg season, (c,g) Kiremt season, (d,h) Bega season.
Figure 7.
Spatial distribution of mean and trend of PRCPTOT index under different temporal scales: (a,e) annual, (b,f) Belg season, (c,g) Kiremt season, (d,h) Bega season.
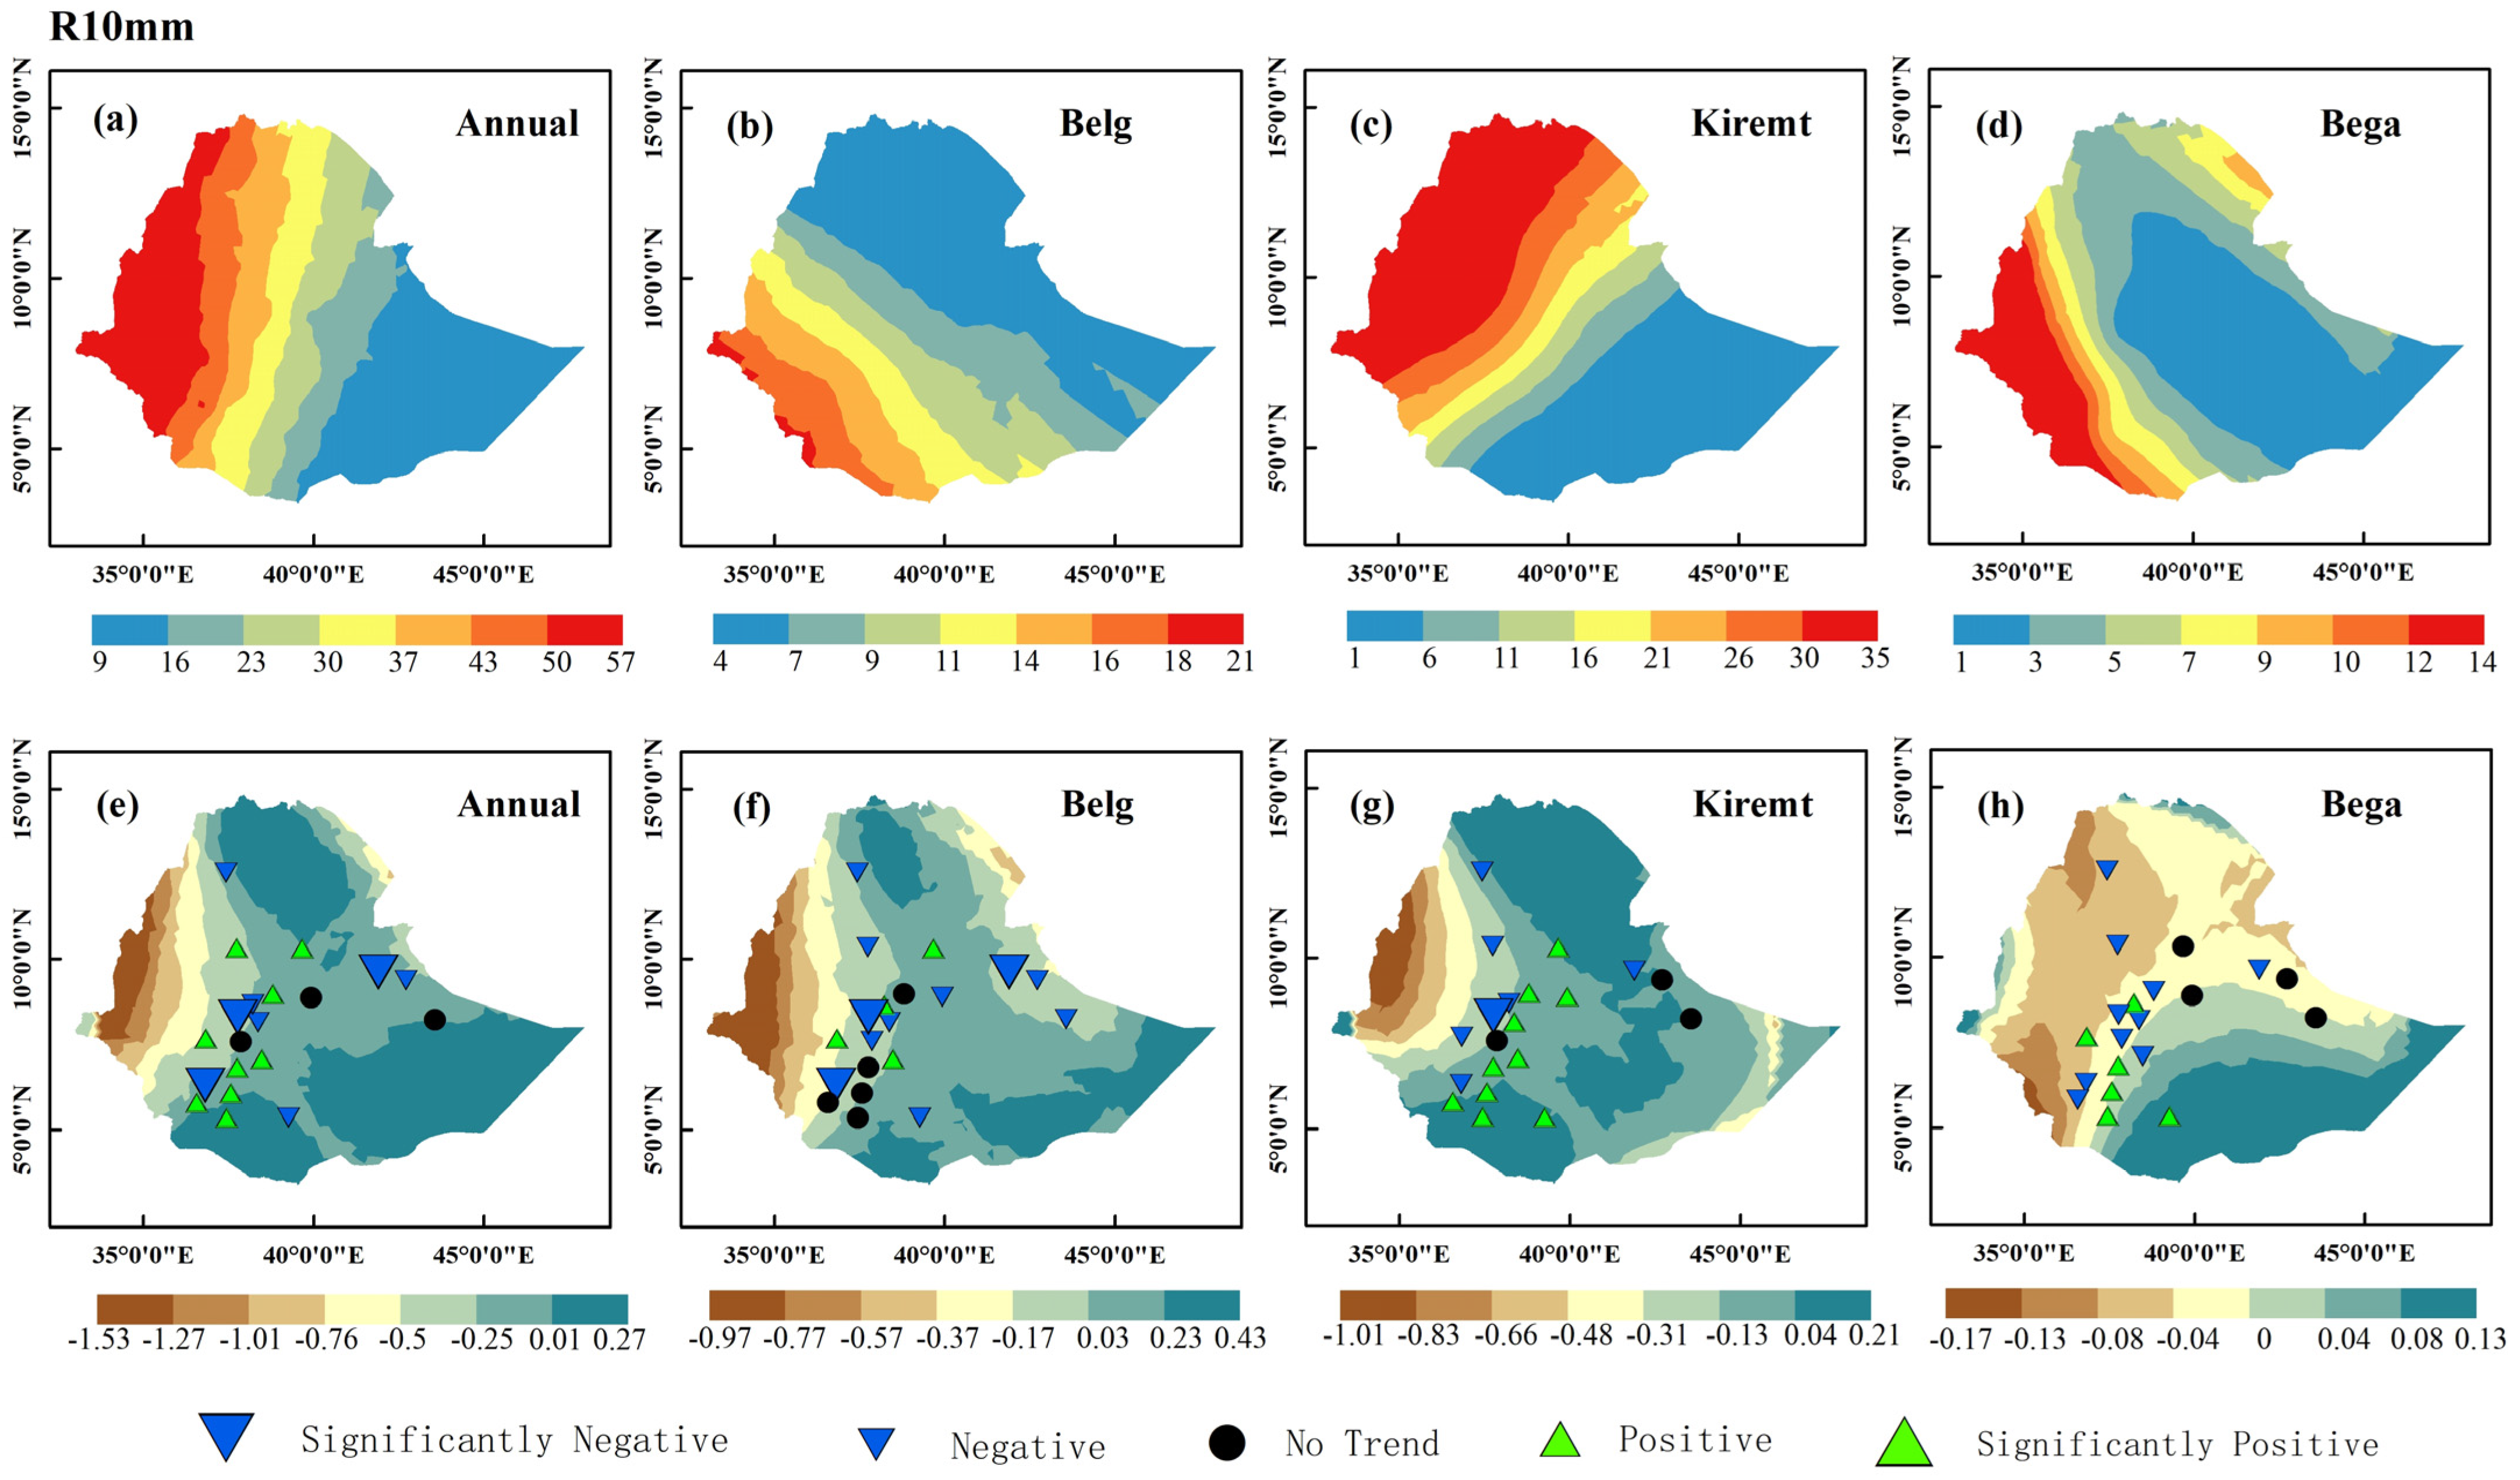
Figure 8.
Spatial distribution of mean and trend of R10mm index under different temporal scales: (a,e) annual, (b,f) Belg season, (c,g) Kiremt season, (d,h) Bega season.
Figure 8.
Spatial distribution of mean and trend of R10mm index under different temporal scales: (a,e) annual, (b,f) Belg season, (c,g) Kiremt season, (d,h) Bega season.
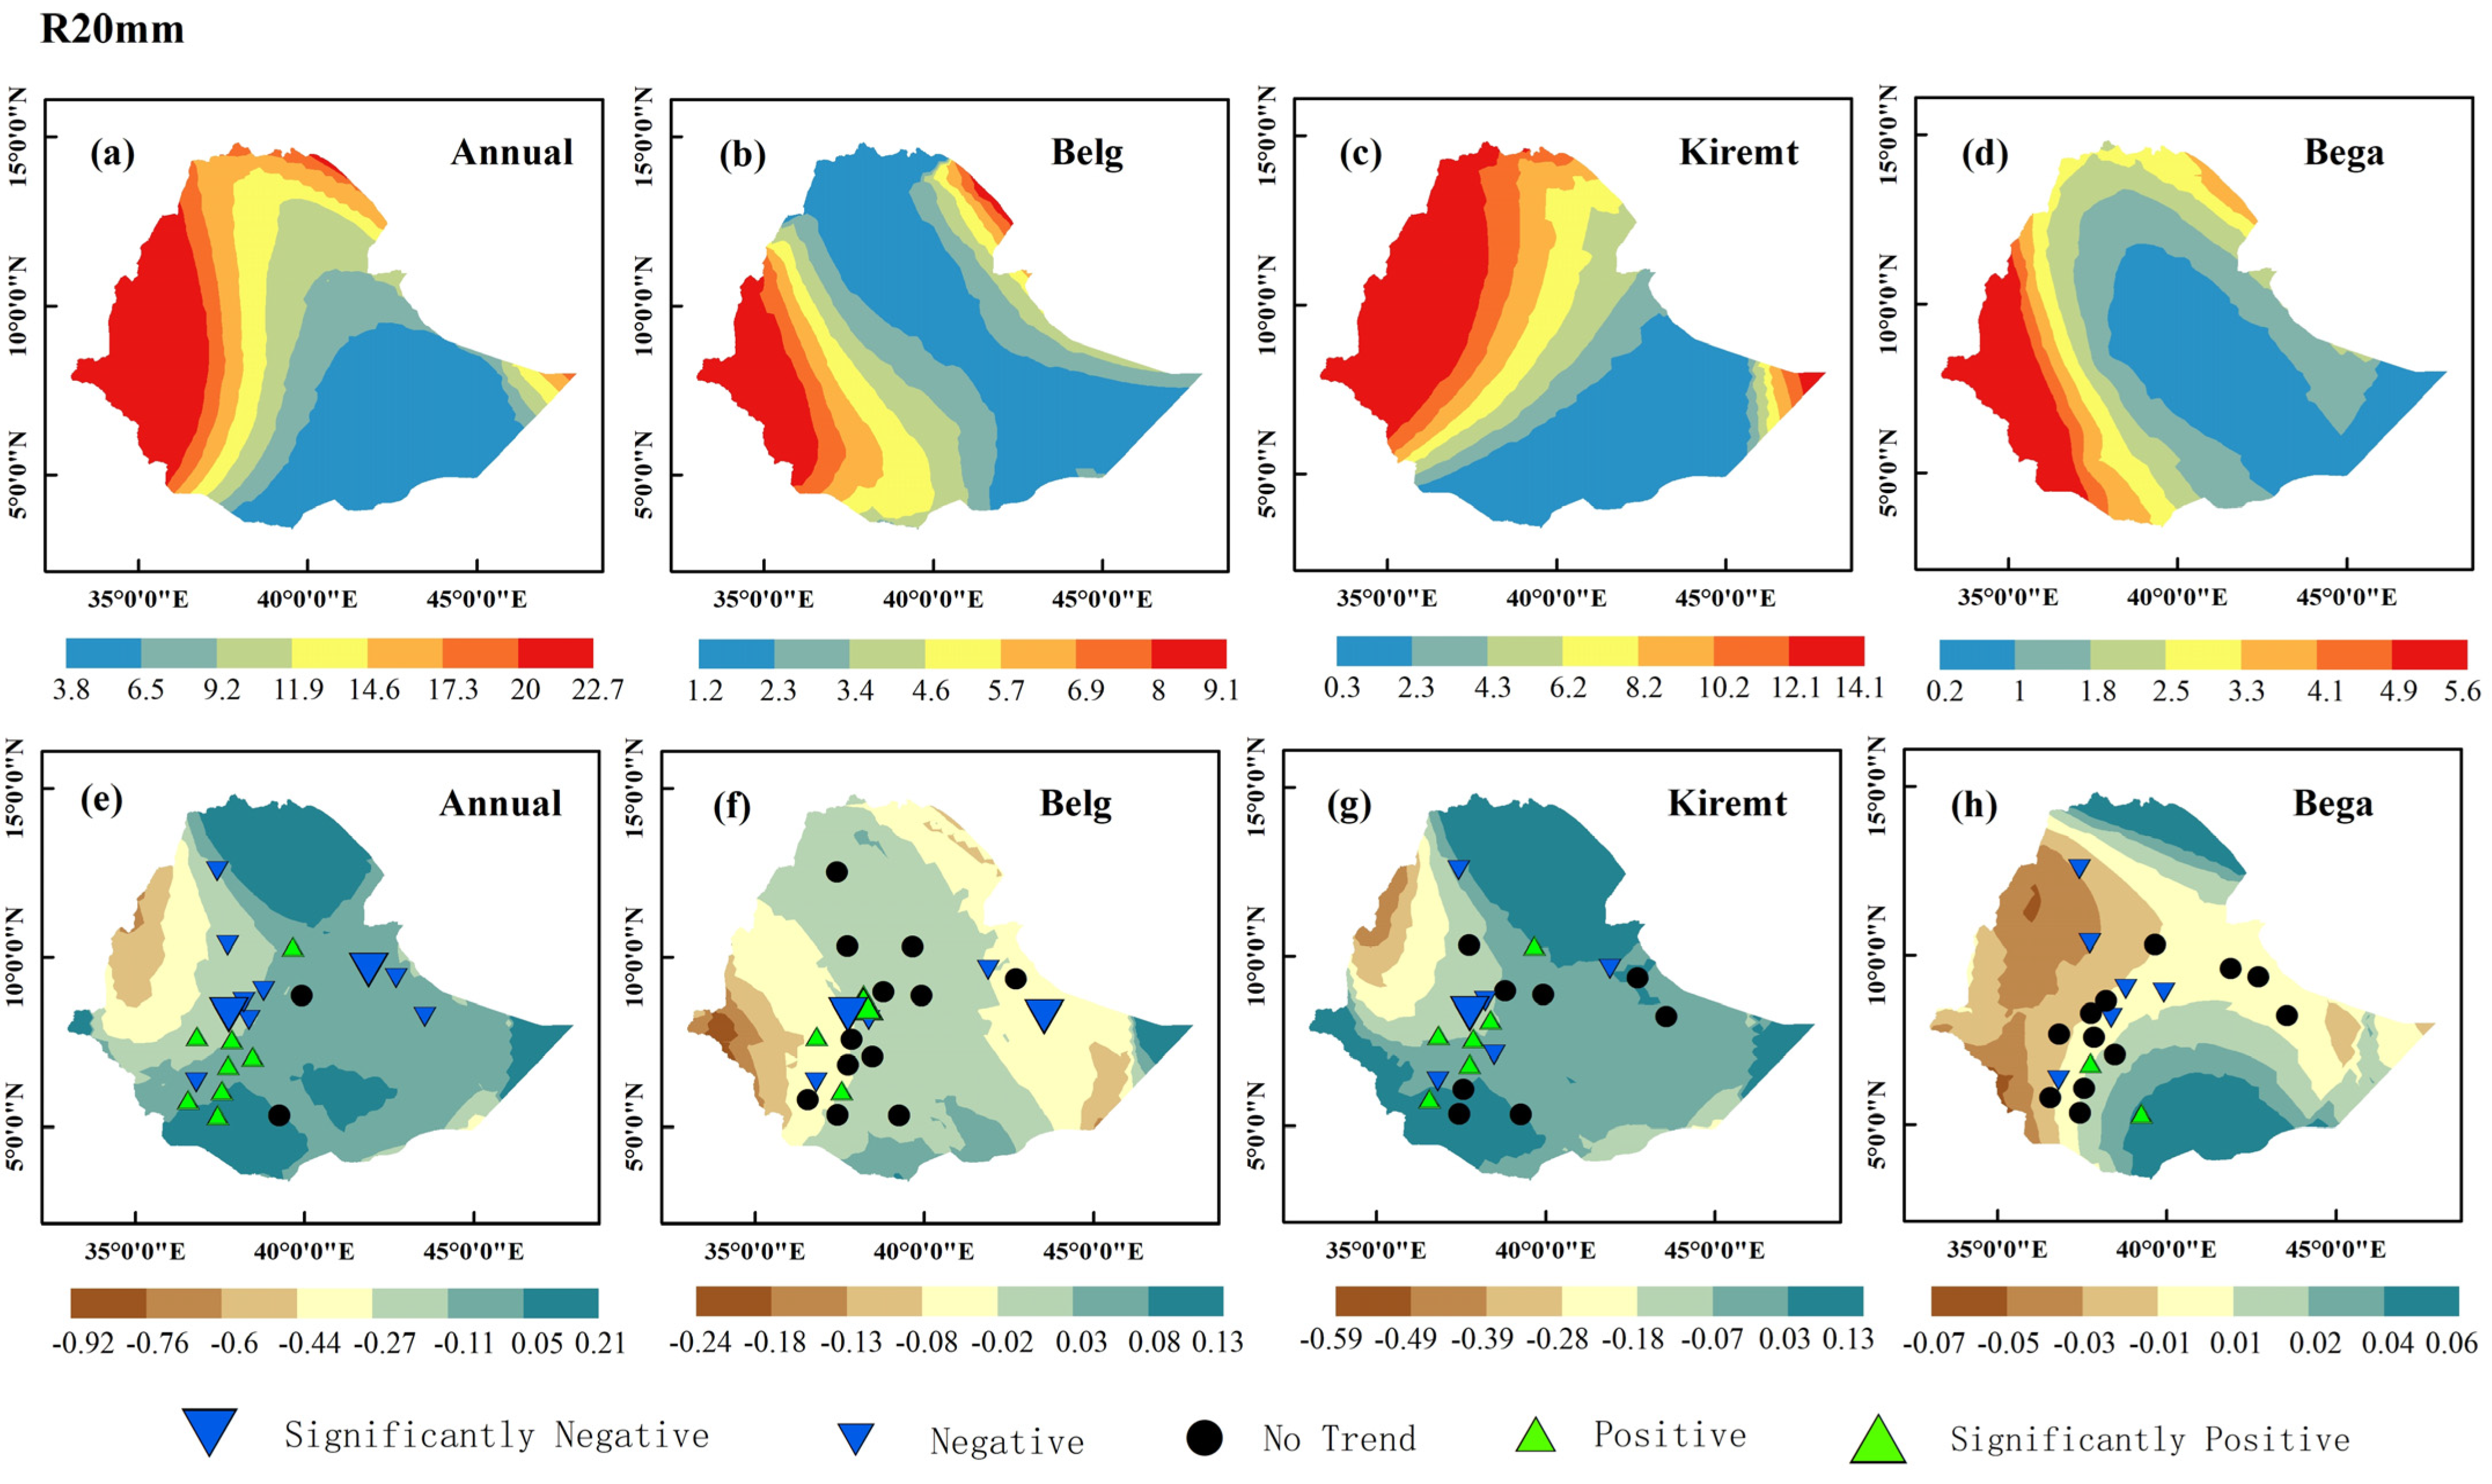
Figure 9.
Spatial distribution of mean and trend of R20mm index under different temporal scales: (a,e) annual, (b,f) Belg season, (c,g) Kiremt season, (d,h) Bega season.
Figure 9.
Spatial distribution of mean and trend of R20mm index under different temporal scales: (a,e) annual, (b,f) Belg season, (c,g) Kiremt season, (d,h) Bega season.
Figure 10.
Spatial distribution of mean and trend of CDD index under different temporal scales: (a,e) annual, (b,f) Belg season, (c,g) Kiremt season, (d,h) Bega season.
Figure 10.
Spatial distribution of mean and trend of CDD index under different temporal scales: (a,e) annual, (b,f) Belg season, (c,g) Kiremt season, (d,h) Bega season.
Figure 11.
Spatial distribution of mean and trend of CWD index under different temporal scales: (a,e) annual, (b,f) Belg season, (c,g) Kiremt season, (d,h) Bega season.
Figure 11.
Spatial distribution of mean and trend of CWD index under different temporal scales: (a,e) annual, (b,f) Belg season, (c,g) Kiremt season, (d,h) Bega season.
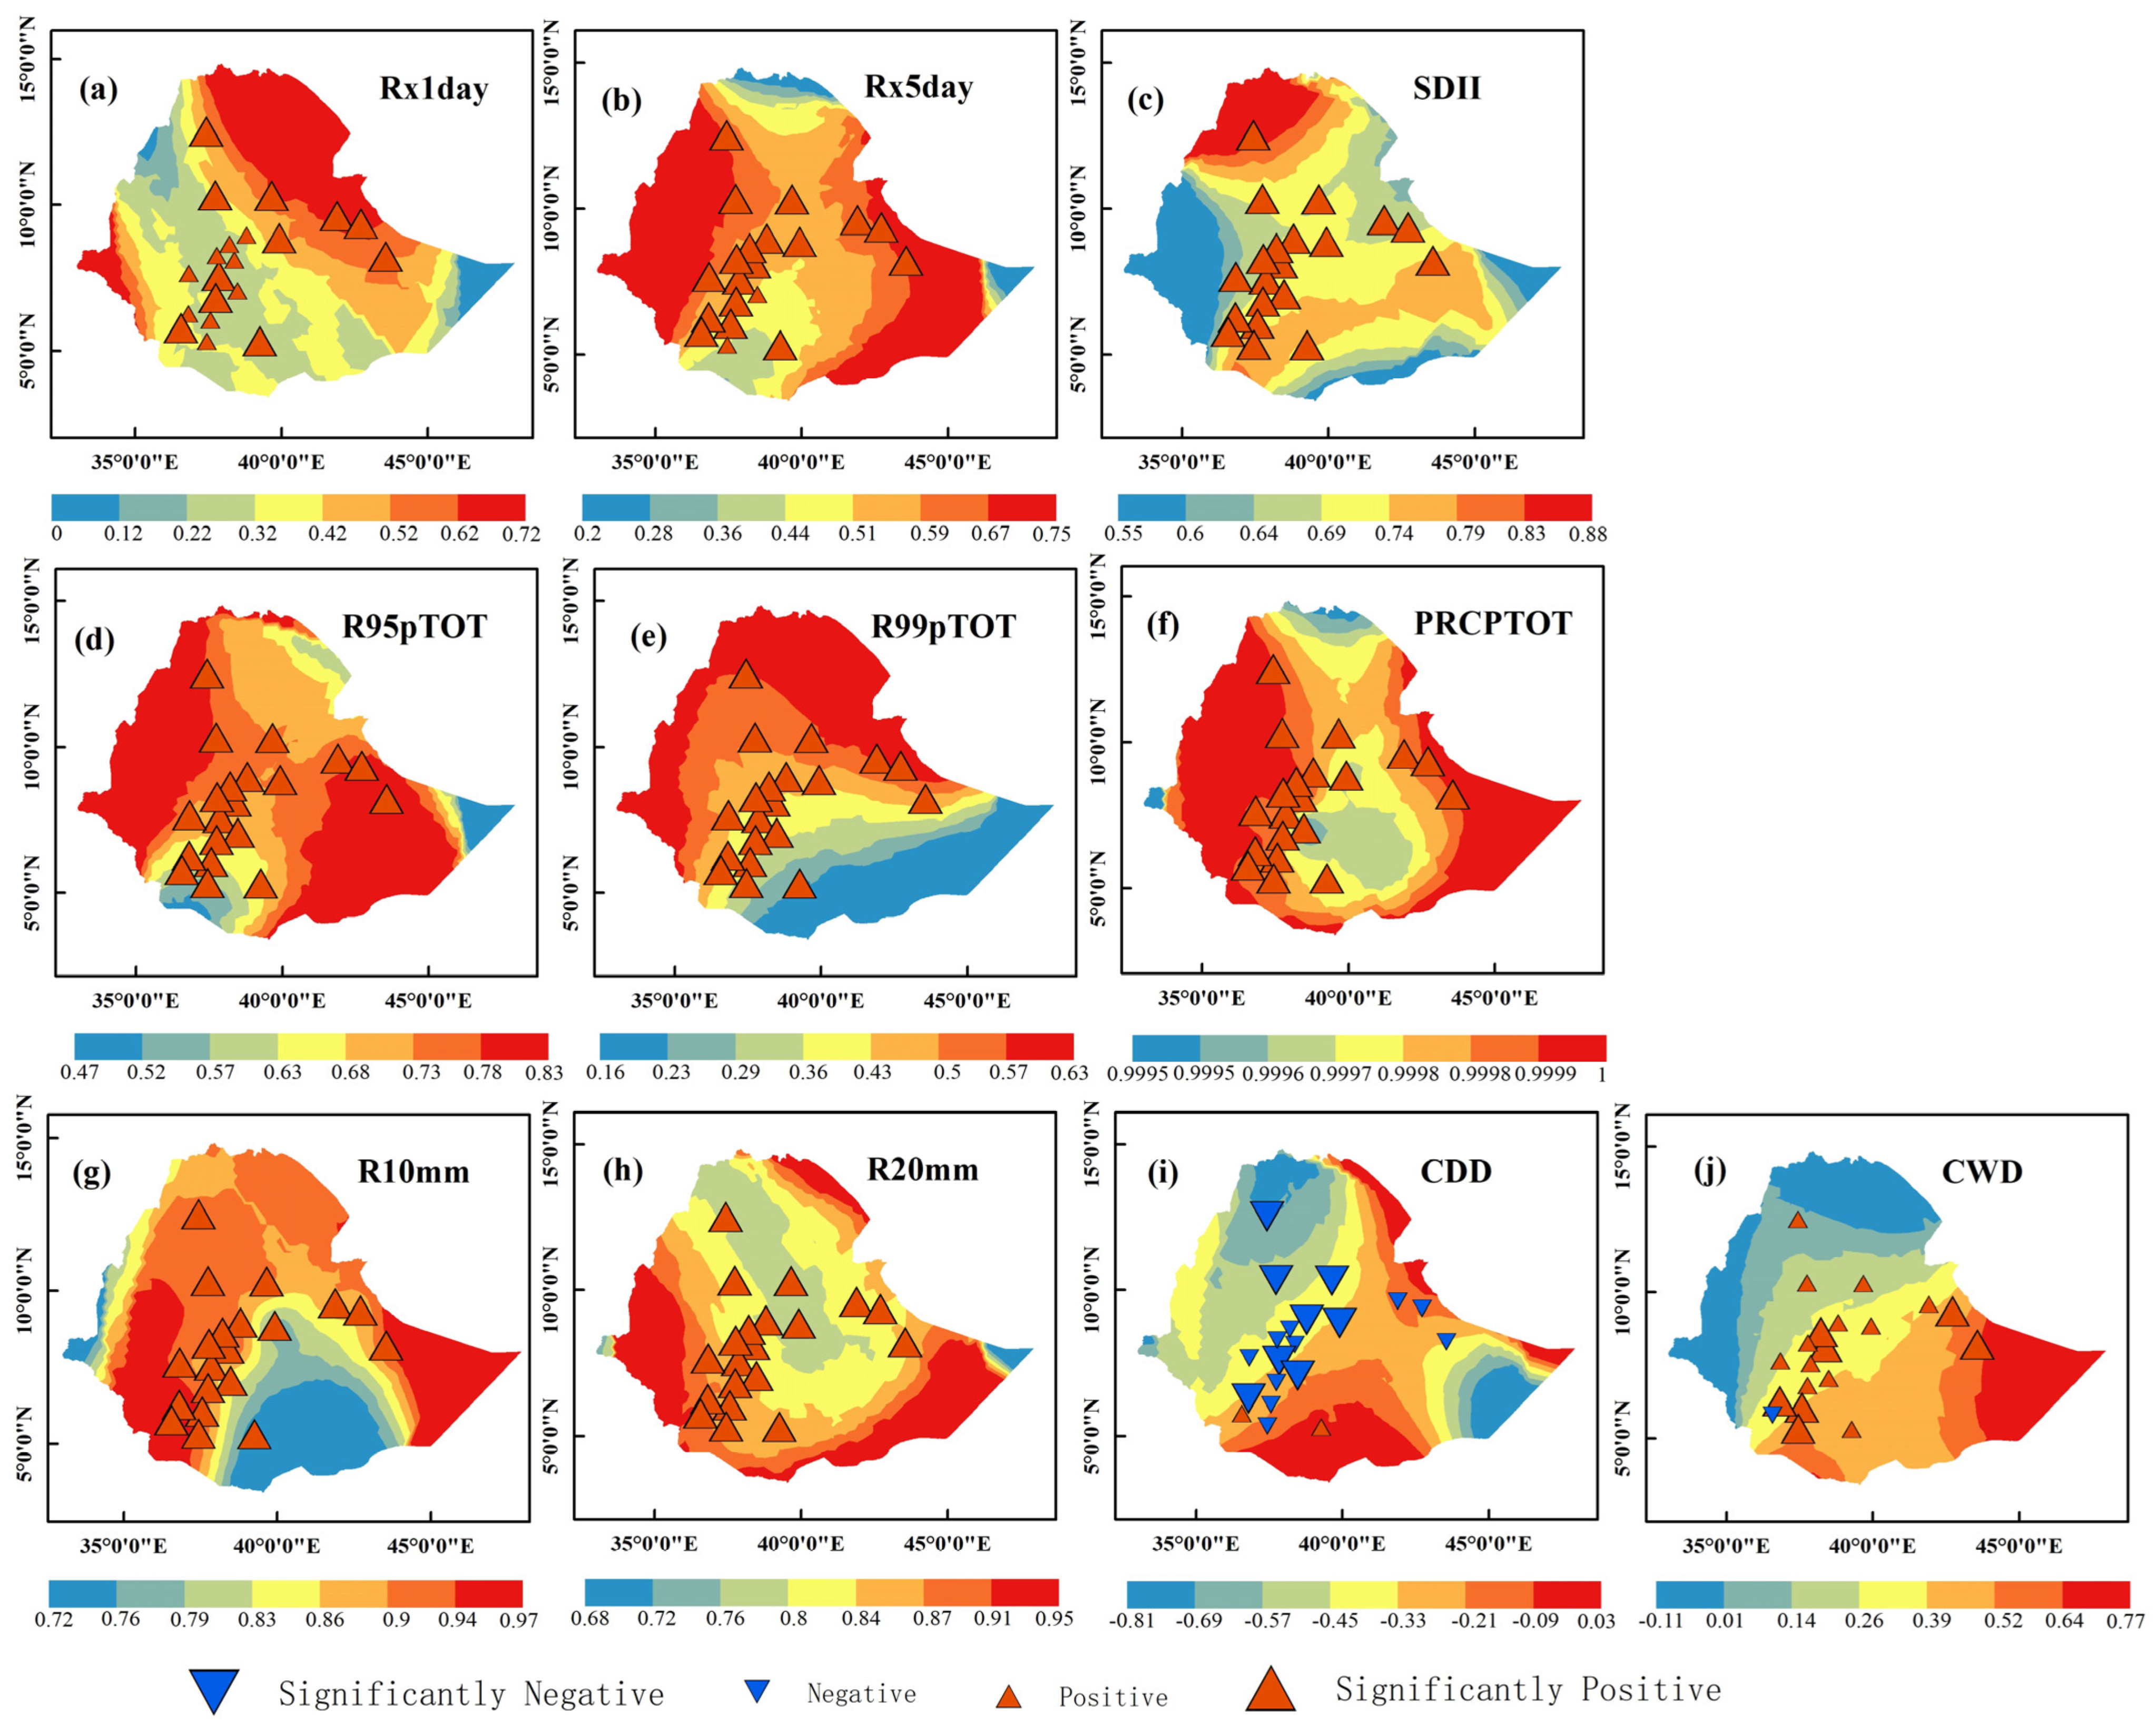
Figure 12.
Correlation between mean annual temperature and ten extreme precipitation indices: (a) Rx1day, (b) Rx5day, (c) SDII, (d) R95pTOT, (e) R99pTOT, (f) PRCPTOT, (g) R10mm, (h) R20mm, (i) CDD, (j) CWD.
Figure 12.
Correlation between mean annual temperature and ten extreme precipitation indices: (a) Rx1day, (b) Rx5day, (c) SDII, (d) R95pTOT, (e) R99pTOT, (f) PRCPTOT, (g) R10mm, (h) R20mm, (i) CDD, (j) CWD.
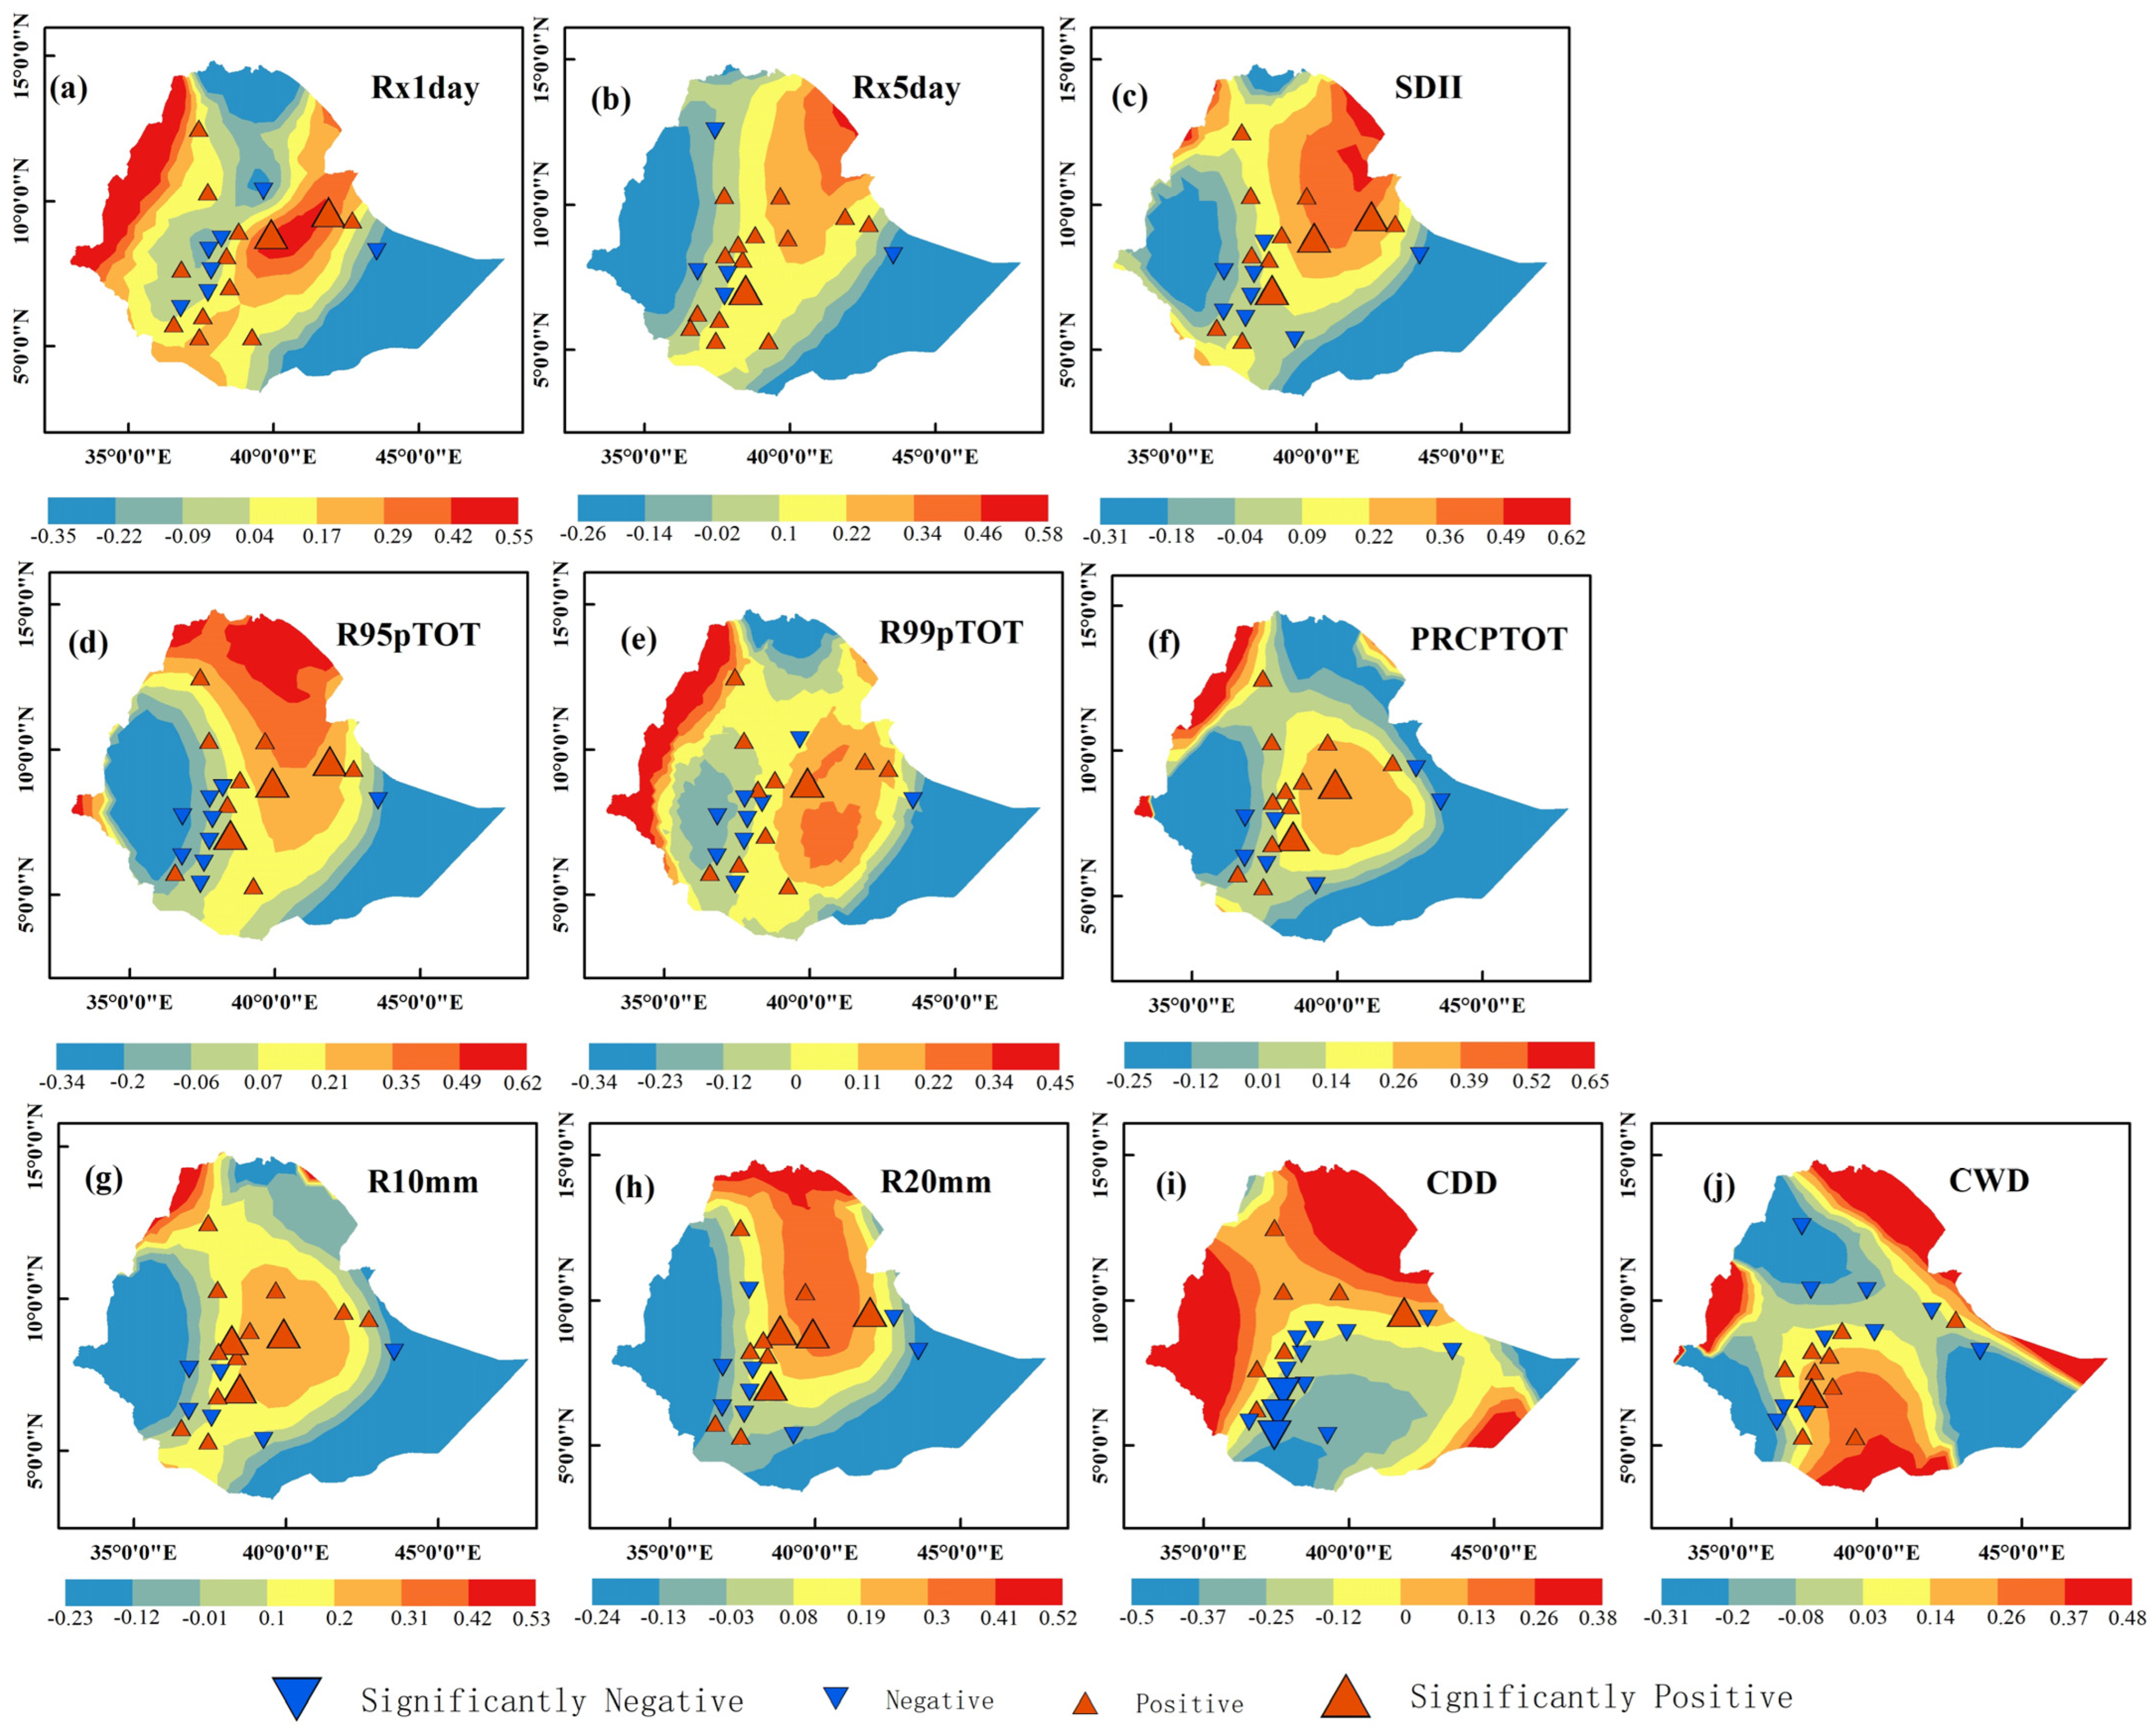
Figure 13.
Correlation between mean annual precipitation and annual extreme precipitation indices: (a) Rx1day, (b) Rx5day, (c) SDII, (d) R95pTOT, (e) R99pTOT, (f) PRCPTOT, (g) R10mm, (h) R20mm, (i) CDD, (j) CWD.
Figure 13.
Correlation between mean annual precipitation and annual extreme precipitation indices: (a) Rx1day, (b) Rx5day, (c) SDII, (d) R95pTOT, (e) R99pTOT, (f) PRCPTOT, (g) R10mm, (h) R20mm, (i) CDD, (j) CWD.
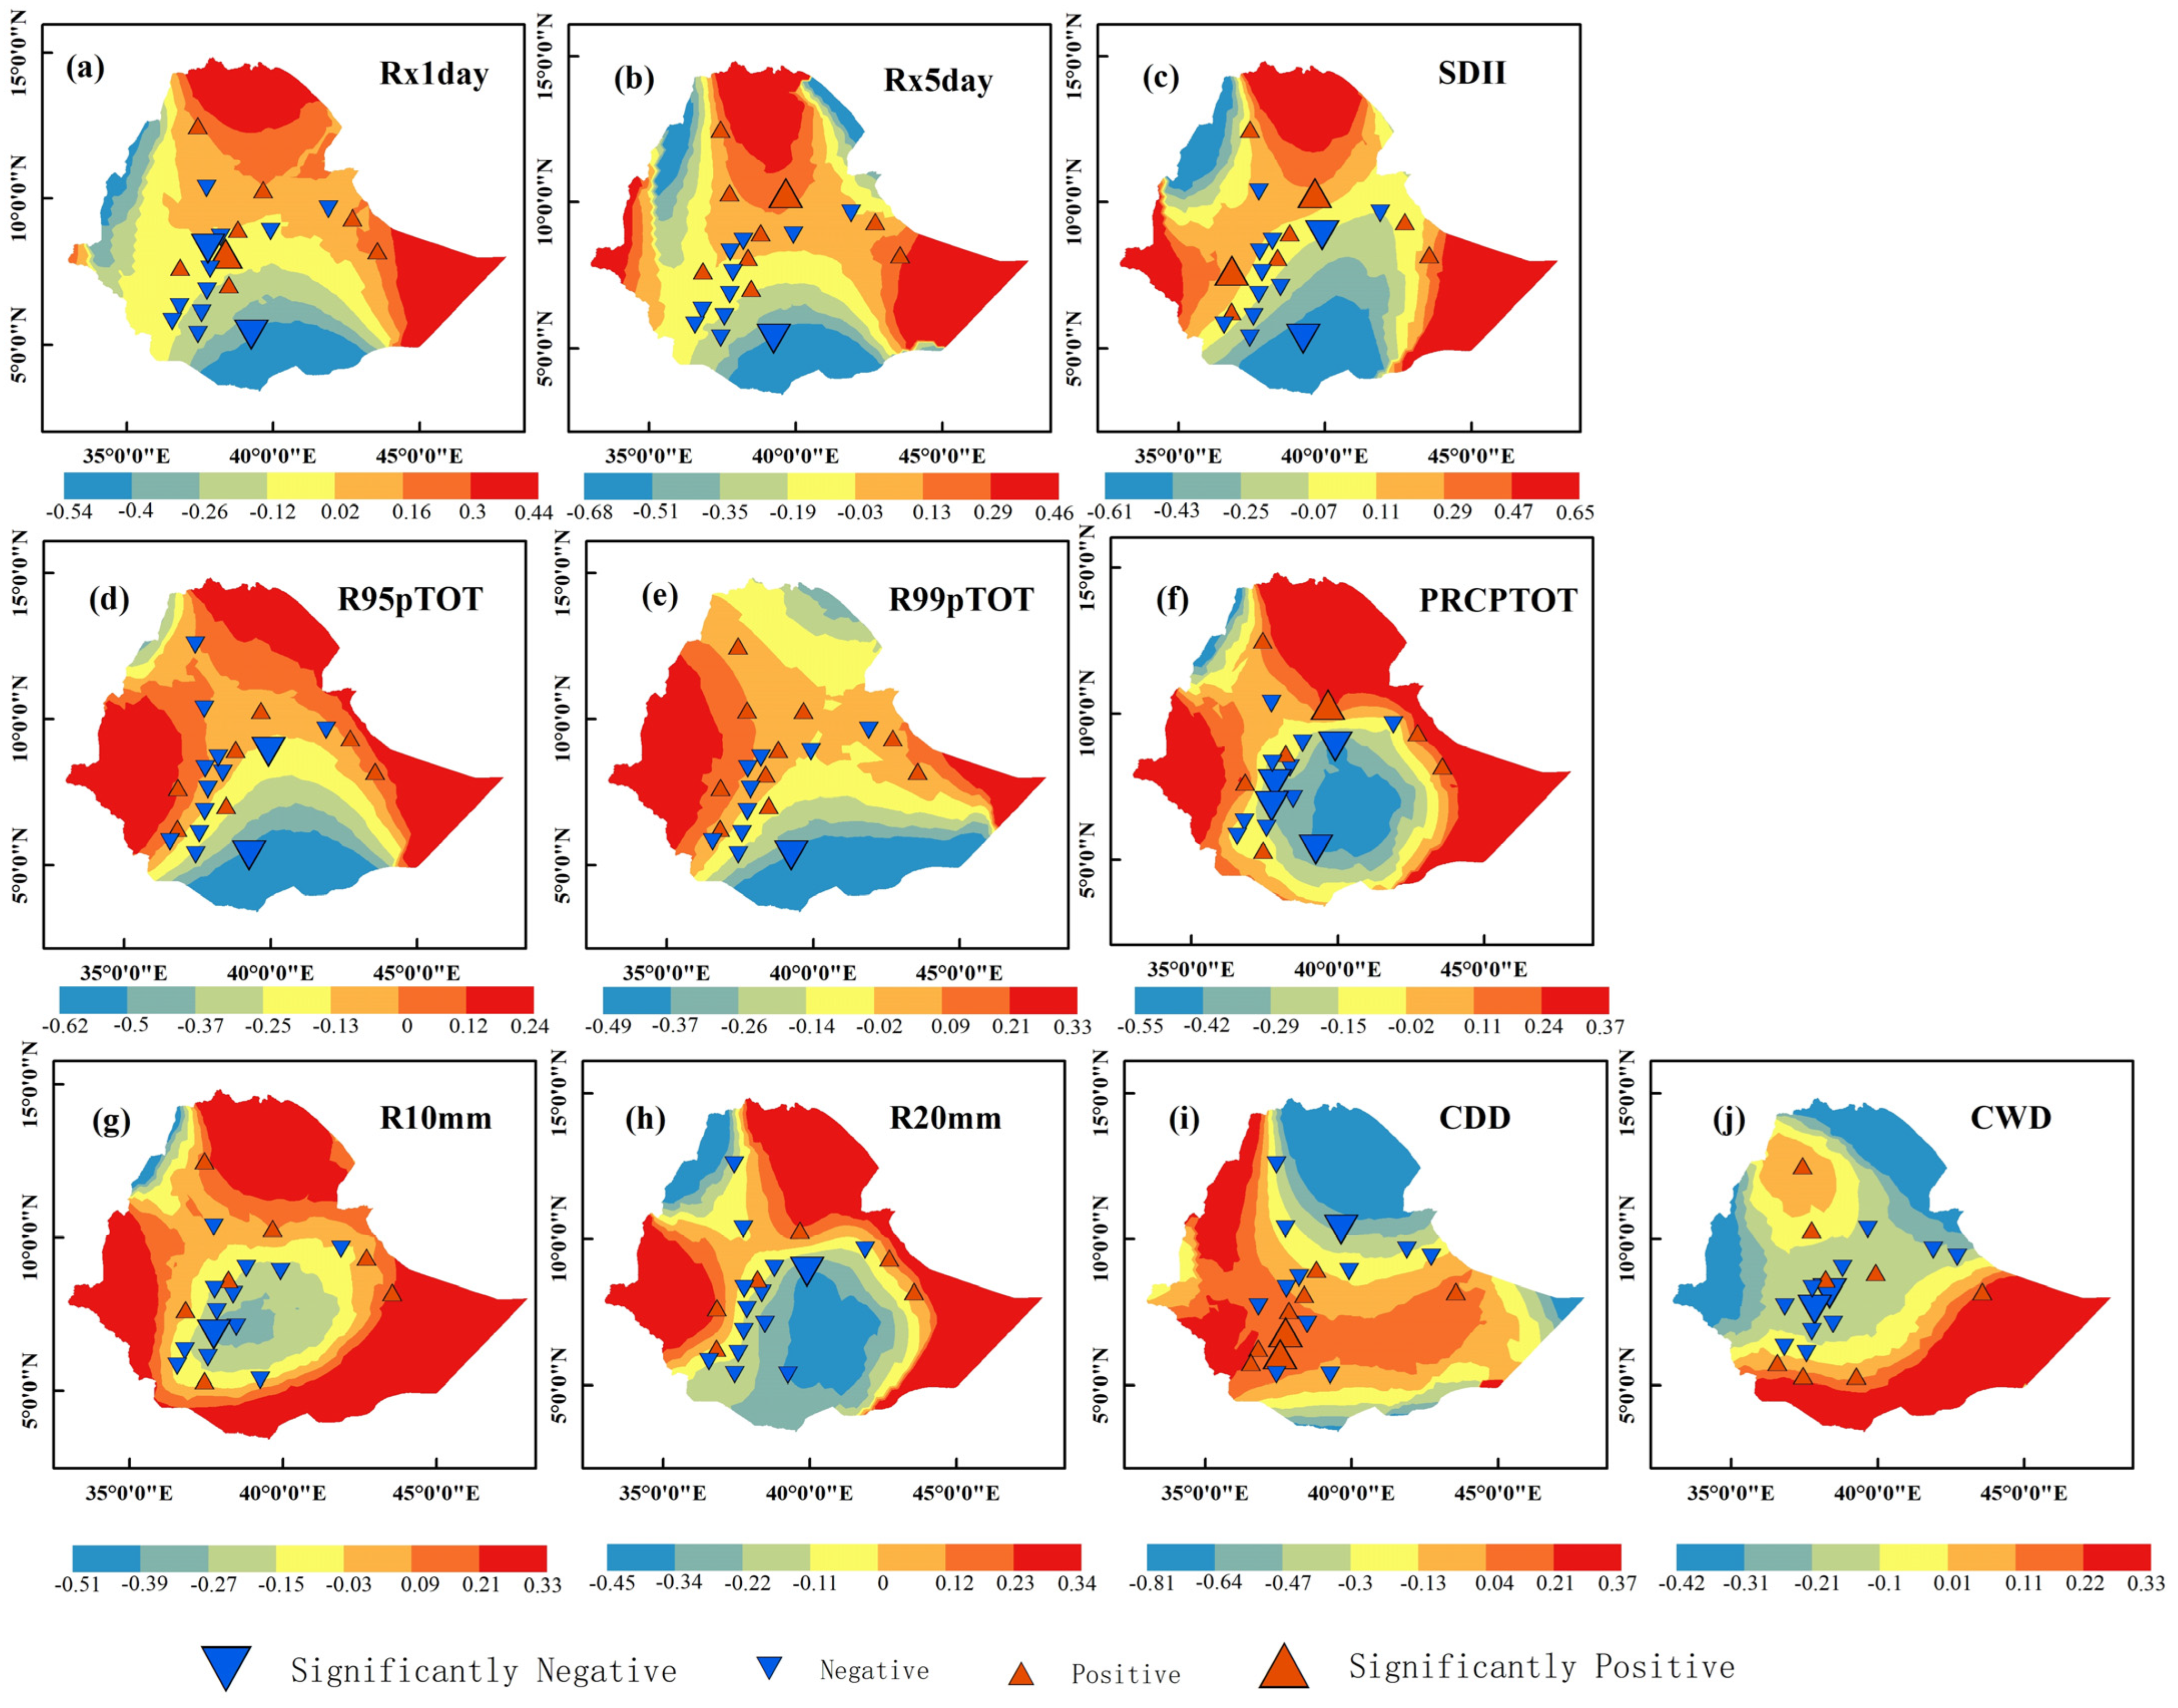
Figure 14.
Correlation between SWASMI and annual extreme precipitation indices: (a) Rx1day, (b) Rx5day, (c) SDII, (d) R95pTOT, (e) R99pTOT, (f) PRCPTOT, (g) R10mm, (h) R20mm, (i) CDD, (j) CWD.
Figure 14.
Correlation between SWASMI and annual extreme precipitation indices: (a) Rx1day, (b) Rx5day, (c) SDII, (d) R95pTOT, (e) R99pTOT, (f) PRCPTOT, (g) R10mm, (h) R20mm, (i) CDD, (j) CWD.
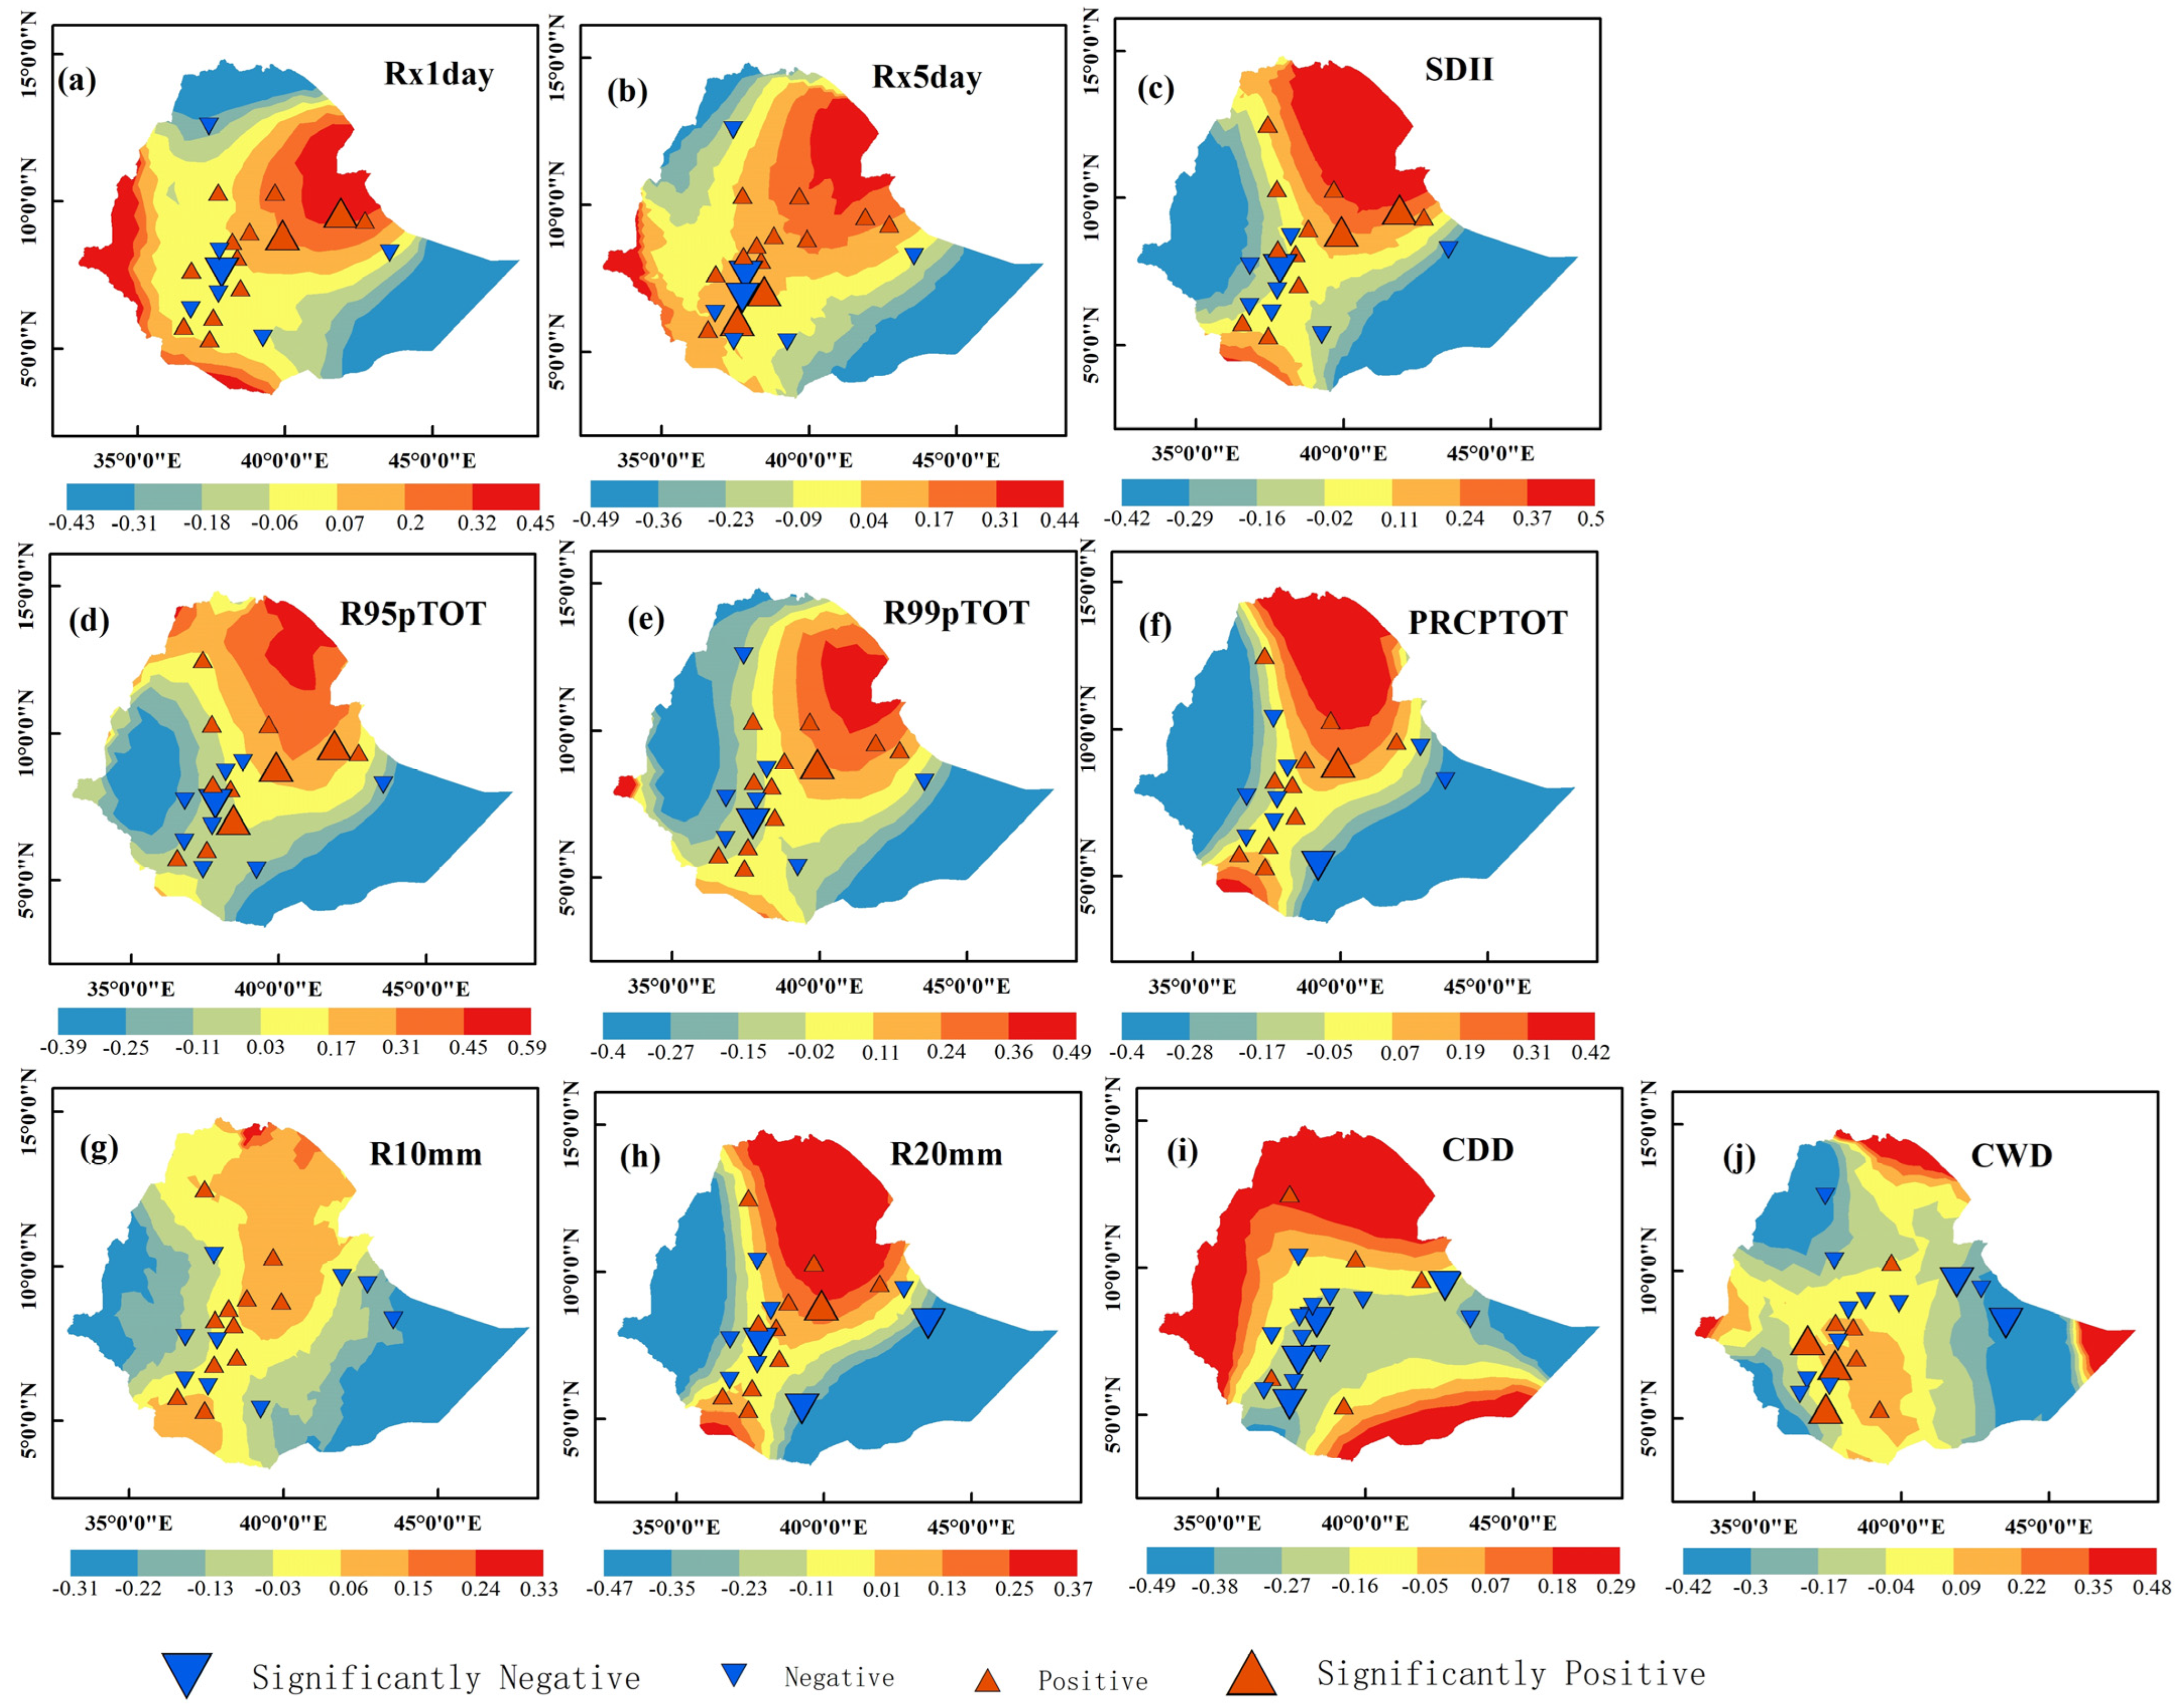
Figure 15.
Correlation between WASMI and annual extreme precipitation indices: (a) Rx1day, (b) Rx5day, (c) SDII, (d) R95pTOT, (e) R99pTOT, (f) PRCPTOT, (g) R10mm, (h) R20mm, (i) CDD, (j) CWD.
Figure 15.
Correlation between WASMI and annual extreme precipitation indices: (a) Rx1day, (b) Rx5day, (c) SDII, (d) R95pTOT, (e) R99pTOT, (f) PRCPTOT, (g) R10mm, (h) R20mm, (i) CDD, (j) CWD.
Table 1.
Geographical location of 20 meteorological stations in Ethiopia.
Table 1.
Geographical location of 20 meteorological stations in Ethiopia.
| Station | Latitude | Longitude | Elevation | Station | Latitude | Longitude | Elevation |
|---|
| Addis | 38.80 | 8.98 | 2354 | Jijiga | 42.72 | 9.37 | 1557 |
| Arba | 37.56 | 6.06 | 1220 | Jimma | 36.82 | 7.67 | 1710 |
| Awassa | 38.48 | 7.07 | 1694 | Jinka | 36.56 | 5.78 | 1373 |
| Bulki | 36.81 | 6.28 | 2430 | Konso | 37.44 | 5.34 | 1431 |
| Butajra | 38.38 | 8.12 | 2074 | Mehal Meda | 39.66 | 10.31 | 3084 |
| Debre | 37.74 | 10.33 | 2446 | Metehara | 39.92 | 8.87 | 952 |
| Degahabur | 43.56 | 8.23 | 1070 | Neghele | 39.27 | 5.33 | 1439 |
| Dire | 41.90 | 9.61 | 1045 | Tulu | 38.21 | 8.66 | 2190 |
| Gondar | 37.43 | 12.52 | 1973 | Wolaita | 37.75 | 6.82 | 1854 |
| Hosana | 37.86 | 7.57 | 2306 | Wolkite | 37.77 | 8.28 | 1884 |
Table 2.
Ten extreme precipitation indices.
Table 2.
Ten extreme precipitation indices.
| Classes | Indices | Full Names | Definitions | Units |
|---|
Intensity
Indices | Rx1day | Max 1-day precipitation amount | Maximum 1-day precipitation amount | mm |
| Rx5day | Max 5-day precipitation amount | Maximum 5-day precipitation amount | mm |
| SDII | Simple daily intensity index | The ratio of annual total wetday (days with precipitation over 1 mm) precipitation to the number of wet days | mm/day |
Amount
Indices | R95pTOT | Very wet days | Total annual precipitation from days with daily precipitation >95th Percentile | mm |
| R99pTOT | Extreme wet days | Total annual precipitation from days with daily precipitation >99th Percentile | mm |
| PRCPTOT | Annual total wet-day precipitation | Total annual precipitation from days with daily precipitation ≥1 mm Percentile | mm |
Duration
Indices | R10mm | Number of heavy precipitation days | Annual data count when daily precipitation ≥ 10 mm | days |
| R20mm | Number of very heavy precipitation days | Annual data count when daily precipitation ≥ 20 mm | days |
| CDD | Consecutive dry days | Maximum number of consecutive days with daily precipitation <1 mm | days |
| CWD | Consecutive wet days | Maximum number of consecutive days when precipitation ≥1 mm | days |
Table 3.
Trend range of Rx1day index in three regions of Ethiopia.
Table 3.
Trend range of Rx1day index in three regions of Ethiopia.
| Regions | Ethiopian Plateau | Ethiopian Desert | Ethiopian Savanna |
|---|
| Annual | −1 to 0.4 | −1.5 to 0.4 | −1 to 0.4 |
| Belg | 0 to 0.5 | −1.2 to 0.5 | 0 to 0.5 |
| Kiremt | 0.2 to 0.5 | −1.6 to 0.5 | −1 to 0 |
| Bega | −0.7 to 0.5 | −1.3 to 0.5 | −1.3 to 0.5 |
Table 4.
Trend range of Rx5day in three regions of Ethiopia.
Table 4.
Trend range of Rx5day in three regions of Ethiopia.
| Regions | Ethiopian Plateau | Ethiopian Desert | Ethiopian Savanna |
|---|
| Annual | −1.4 to 1 | −3.3 to 0.4 | −1.4 to 1 |
| Belg | −0.2 to 1 | −3.1 to 1 | −0.8 to −0.2 |
| Kiremt | −0.8 to 1.2 | −3.4 to 1.2 | 0.5 to 1.2 |
| Bega | −1.1 to 1 | −2.1 to 1.5 | −2.1 to 1.5 |
Table 5.
Trend range of SDII index in three regions of Ethiopia.
Table 5.
Trend range of SDII index in three regions of Ethiopia.
| Regions | Ethiopian Plateau | Ethiopian Desert | Ethiopian Savanna |
|---|
| Annual | −0.13 to 0.07 | −0.28 to 0.07 | −0.08 to 0.07 |
| Belg | −0.03 to 0.11 | −0.22 to 0.11 | −0.13 to 0.11 |
| Kiremt | −0.2 to 0.12 | −0.32 to 0.12 | −0.13 to 0.12 |
| Bega | −0.22 to 0.1 | −0.14 to 0.1 | −0.06 to 0.1 |
Table 6.
Trend range of R95pTOT index in three regions of Ethiopia.
Table 6.
Trend range of R95pTOT index in three regions of Ethiopia.
| Regions | Ethiopian Plateau | Ethiopian Desert | Ethiopian Savanna |
|---|
| Annual | −8.1 to 4.7 | −5.5 to 4.7 | −13.2 to 4.7 |
| Belg | −0.4 to 0.4 | −1 to 0.4 | −0.4 to 0.4 |
| Kiremt | −0.2 to 0.4 | −1 to 0.4 | −0.6 to 0.4 |
| Bega | −2.3 to 0.5 | −2.3 to 0.5 | −0.7 to 0.5 |
Table 7.
Trend range of R99pTOT index in three regions of Ethiopia.
Table 7.
Trend range of R99pTOT index in three regions of Ethiopia.
| Regions | Ethiopian Plateau | Ethiopian Desert | Ethiopian Savanna |
|---|
| Annual | −0.56 to 1.48 | −1.59 to 0.05 | −2.1 to 0.46 |
| Belg | 0–0.02 | 0–0.02 | 0–0.07 |
| Kiremt | −0.11 to 0.02 | −0.11 to 0.02 | −0.04 to 0.02 |
| Bega | 0 | 0 | 0 |
Table 8.
Trend range of PRCPTOT index in three regions of Ethiopia.
Table 8.
Trend range of PRCPTOT index in three regions of Ethiopia.
| Regions | Ethiopian Plateau | Ethiopian Desert | Ethiopian Savanna |
|---|
| Annual | −21.2 to 7.1 | −7.1 to 7.1 | −42.5 to 7.1 |
| Belg | −3.7 to 3 | −12.6 to 3 | −10.4 to 3 |
| Kiremt | −13.4 to 6 | −8.5 to 6 | −27.9 to 6 |
| Bega | −4.4 to 3.8 | −1.7 to 3.8 | −5.8 to 3.8 |
Table 9.
Trend range of R10mm index in three regions of Ethiopia.
Table 9.
Trend range of R10mm index in three regions of Ethiopia.
| Regions | Ethiopian Plateau | Ethiopian Desert | Ethiopian Savanna |
|---|
| Annual | −0.76 to 0.27 | −0.76 to 0.27 | −1.53 to 0.27 |
| Belg | −0.57 to 0.43 | −0.57 to 0.43 | −0.97 to 0.43 |
| Kiremt | −1.01 to 0.21 | −0.48 to 0.21 | −1.01 to 0.21 |
| Bega | −0.13 to 0.08 | −0.08 to 0.13 | −0.17 to 0.13 |
Table 10.
Trend range of R20mm index in three regions of Ethiopia.
Table 10.
Trend range of R20mm index in three regions of Ethiopia.
| Regions | Ethiopian Plateau | Ethiopian Desert | Ethiopian Savanna |
|---|
| Annual | −0.92 to 0.21 | −0.27 to 0.21 | −0.6 to 0.21 |
| Belg | −0.13 to 0.02 | −0.13 to 0.13 | −0.24 to 0.08 |
| Kiremt | −0.59 to 0.13 | −0.18 to 0.13 | −0.28 to 0.13 |
| Bega | −0.07 to 0.06 | −0.03 to 0.06 | −0.07 to 0.06 |
Table 11.
Trend range of CDD index in three regions of Ethiopia.
Table 11.
Trend range of CDD index in three regions of Ethiopia.
| Regions | Ethiopian Plateau | Ethiopian Desert | Ethiopian Savanna |
|---|
| Annual | 0.27 to 1.95 | 0.27 to 2.62 | 0.27 to 2.62 |
| Belg | −0.5 to 1.2 | −0.5 to 1.2 | −0.5 to 1.2 |
| Kiremt | −0.94 to 0.18 | −0.94 to 0.18 | −0.94 to 0.18 |
| Bega | −0.37 to 1.08 | −0.37 to 3 | −0.11 to 3 |
Table 12.
Trend range of CWD index in three regions of Ethiopia.
Table 12.
Trend range of CWD index in three regions of Ethiopia.
| Regions | Ethiopian Plateau | Ethiopian Desert | Ethiopian Savanna |
|---|
| Annual | −0.25 to 0.03 | −0.11 to 0.1 | −0.18 to 0.03 |
| Belg | 0.01 to 0.07 | −0.14 to 0.04 | −0.11 to 0.04 |
| Kiremt | −0.24 to 0.17 | −0.11 to 0.23 | −0.24 to 0.17 |
| Bega | −0.05 to 0.08 | −0.07 to 0.08 | −0.07 to 0.08 |


