Article

Evolution Characteristics and Driving Factors of Cyanobacterial Blooms in Hulun Lake from 2018 to 2022

1
Water Conservancy and Civil Engineering College, Inner Mongolia Agricultural University, Hohhot 010018, China
2
Hulunbuir Academy of Inland Lakes in Northern Cold and Arid Areas, Hulunbuir 021008, China
*
Authors to whom correspondence should be addressed.
Water 2023, 15(21), 3765; https://doi.org/10.3390/w15213765
Submission received: 12 September 2023 / Revised: 9 October 2023 / Accepted: 20 October 2023 / Published: 27 October 2023

Abstract

:
Algal blooms pose serious threats to water environments and the balance of aquatic ecosystems. Moreover, environmental factors may be the primary driver of bloom outbreaks. Studying the characteristics and driving factors of the evolution of cyanobacterial blooms can provide a scientific basis for the restoration of lake water environments and aquatic ecosystems. Based on the Landsat extended time series and practical ecological investigation, this study determined the bloom area and dominant species of cyanobacterial blooms in Hulun Lake, and analyzed their evolution characteristics and primary influencing factors. The results show that the area of bloom outbreak tended to decrease from 2018 to 2020, with the peak area remaining below 150 km2; in contrast, the bloom area showed an increasing trend in 2021–2022, with a maximum of 1970.55 km2 in June 2022. Pearson correlation analysis of bloom area and driving factors showed that the wind speed was the main influencing factor of bloom outbreaks. In 2022, there were five dominant species of cyanobacteria in summer and three in autumn. Redundancy analysis of the dominant species of cyanobacteria and water quality indicators showed that COD, DO, TP, WT, pH, and TN were the main influencing factors of the dominant species of cyanobacteria in summer, and COD, DO, TP, and WT were the main influencing factors in autumn. In general, cyanobacteria in Hulun Lake are sensitive to changes in wind speed and nutrient concentration. An important approach towards effectively reducing the intensity of cyanobacterial blooms in Hulun Lake and coping with the ecological risks associated with the changing environment would be to reduce external loads and regulate the ecosystem structure of the lake. In the future, while studying the law of cyanobacterial bloom outbreaks, attention should be paid to the impact of the cyanobacterial physiological status on bloom outbreaks.

1. Introduction

Lakes are vital water resources on the surface, providing water for industrial and agricultural development and supporting human life in basins [1]. However, climate change and other factors have accelerated the eutrophication of lakes and intensified the outbreak of algal blooms [2,3]. At present, cyanobacterial blooms are one of the most crucial global environmental problems [4,5]. A cyanobacterial bloom is a phenomenon in which cyanobacteria multiply rapidly and accumulate on the surface of water under certain nutritional, hydrological, and climatic conditions, resulting in a blue–green color of water accompanied by a foul odor [6,7,8]. Since the 1980s, 68% of the world’s lakes have experienced massive blooms [9], such as Erie Lake in the United States, Winnipeg Lake in Canada, and Taihu Lake, Chaohu Lake, Erhai Lake and Dianchi Lake in China [10,11]. During events of cyanobacterial bloom outbreaks, rapidly multiplying cyanobacteria reduce the dissolved oxygen content of the water body, reduce the transparency of the water body, and block the respiratory and filter-feeding organs of small aquatic animals, resulting in their deaths; furthermore, cyanobacterial blooms can seriously affect water quality, endanger the health of humans and other organisms, and destroy the ecological landscape of water [12,13,14,15,16]. Therefore, it is of great significance to comprehensively and accurately grasp the evolution mechanism of lake cyanobacterial blooms in a timely manner and explore the main driving factors of their occurrence for the management and monitoring of lake cyanobacterial blooms.
Hulun Lake, also known as Dalai Lake, is the fifth largest lake in China, and the largest lake in Inner Mongolia [17]. In recent years, under the influence of human activities and climate change, the ecological environment of the Hulun Lake basin has been deteriorating continuously [18], the eutrophication of the lake has been intensifying, and large-scale cyanobacterial blooms have been breaking out, with the outbreak area increasing every year [19]. Bloom outbreaks in Hulun Lake have had a serious impact on social and economic development, especially on fisheries. In general, previous studies analyzed the drivers of lake phytoplankton or the spatial variation characteristics of blooms on the basis of either ecological survey methods or satellite remote sensing images. For example, Cao et al. [19] and Liu et al. [20] used optical remote sensing images to explore the outbreak area of blooms in Hulun Lake. Wang et al. [21], Li et al. [22], and Qian et al. [23] used lake ecological survey methods to explore the main influencing factors of phytoplankton in Hulun Lake. However, a single-method approach is not sufficient to comprehensively monitor the outbreak area and dominant species of lake blooms, and research on cyanobacterial blooms in Hulun Lake and their influencing factors is lacking.
In this study, remote sensing images (Landsat-8 OLI images) and an ecological survey method were combined to investigate the distribution and driving factors of cyanobacterial bloom outbreaks in Hulun Lake in 5 recent years (2018–2022). In particular, the floating algae index (FAI) was used to identify blooms and ecological investigation methods were applied to identify the dominant species of cyanobacterial blooms and determine the outbreak area of blooms and their driving factors. The specific objectives were as follows: (1) determine the outbreak area of blooms in Hulun Lake during 2018–2022 and analyze their evolution characteristics; (2) based on environmental factors, such as air temperature, precipitation, wind speed, wind direction, total nitrogen, total phosphorus, water temperature, dissolved oxygen, and ammonia nitrogen, analyze the driving factors of bloom outbreaks in Hulun Lake; (3) based on the ecological investigation method, identify the dominant species of cyanobacterial blooms in Hulun Lake in 2022 and analyze the main influencing factors. This study not only realizes large-scale monitoring, but also accurately identifies the dominant species of cyanobacterial blooms.

2. Materials and Methods
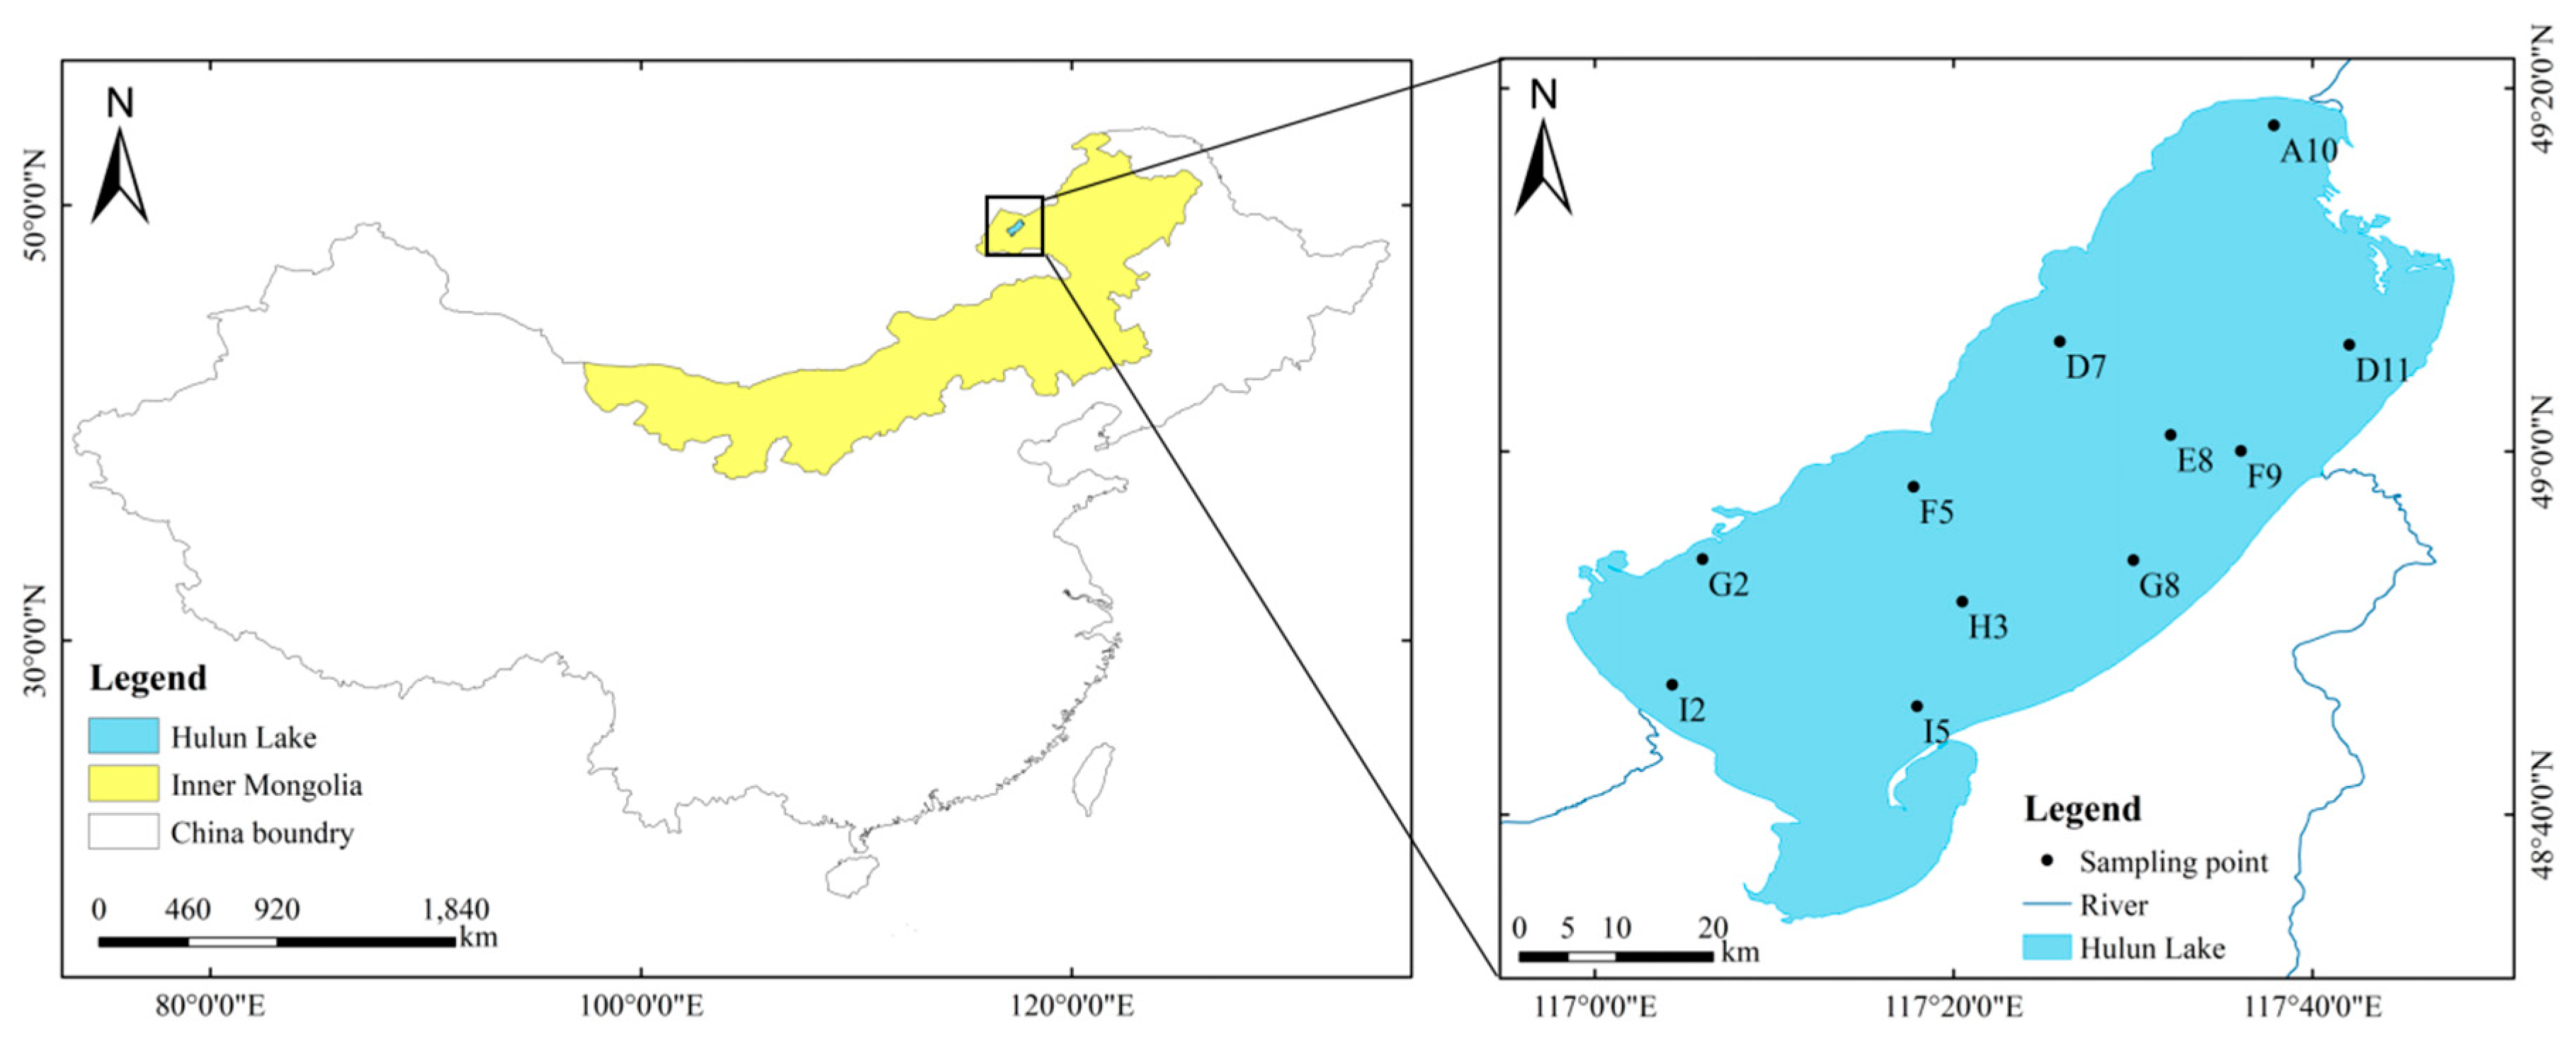
2.1. Study Area

Hulun Lake (48°30’–49°20’ N, 116°58’–117°48’ E) is located in northeastern China, near the borders of China, Mongolia, and Russia; specifically, it is located in the west of Hulunbuir Grassland in Hulunbuir City, Inner Mongolia (Figure 1). It is the fourth largest freshwater lake in China and the largest lake in Inner Mongolia. The lake has a length of 93 km, a maximum width of 41 km, and a circumference of 447 km [22]. The average water depth is 5.33 m, the maximum water depth is about 8 m, the lake area is 2237.5 km2, and the water volume is 13.49 × 10⁹ m3. The lake is mainly recharged by precipitation, groundwater, the Krulun River, and the Ulson River. Hulun Lake belongs to a semi-arid grassland climate in the middle temperate zone, with dry and windy springs, cool and short summers, rapidly cooling autumns with frost, and cold and long winters [23]. The freezing period of the lake is 170–180 days, and the thickness of the ice surface can reach 1.3 m [17].

2.2. Sample Collection and Data Source

2.2.1. Satellite Data

A total of 25 cloud-free or low-cloud (<5%) Landsat-8 OLI images of Hulun Lake from 2018 to 2022 were obtained from the United States Geological Survey website (http://glovis.usgs.gov/) accessed on 1 March 2023. According to the frost conditions of the lake, the period from June to October each year was selected, and one scene was considered for every month, amounting to five scenes per year. ENVI 5.6 software was used to preprocess the remote sensing images, including band fusion, geometric correction, radiometric calibration, and atmospheric correction. The water boundary was extracted using the normalized difference water index (NDWI). Through Landsat 8 reflectance data, the areas of the cyanobacterial blooms were retrieved from the satellite images to realize continuous observation of the cyanobacterial blooms in Hulun Lake.

2.2.2. Ecological Investigation

According to the temperature and optimal living conditions of cyanobacteria in the study area, combined with the shape of the lake basin and the source of recharge water, 11 monitoring sites (Figure 1) were set up in Hulun Lake in summer (August) and autumn (November) in 2022, and phytoplankton and water quality samples were collected from the surface of the lake (0.5 m below the lake surface) for quantitative and qualitative analyses.
(1) Details of the collection method for quantitative and qualitative phytoplankton samples are available in the literature “Phytoplankton Diversity of a Natural Karst Lake Combining Morphological and Molecular Approaches” [24].
(2) Water quality sample collection: water quality samples were collected simultaneously with the phytoplankton quantitative samples. In order to reduce experimental errors, the water quality samples were collected in parallel control groups. Water samples were collected using a plexiglass water intake device and in three 1 L polyethylene bottles. One bottle was used for the quantitative identification of phytoplankton, and two bottles were used for the water quality determination. After the water samples were transported to the laboratory, 300 mL water samples were filtered through a 0.45-µm filter membrane, and two bottles of water samples (filtered and original water samples) were stored at 4 °C.

2.2.3. Environmental Parameters

Data on the environmental parameters of Hulun Lake in all years from 2018 to 2022 (June to October) were collected. At all monitoring sites, the pH, dissolved oxygen (DO), and water temperature (WT) were measured using the 6600V2 multi-parameter water quality instrument (YSI) on site. Total nitrogen (TN), total phosphorus (TP), ammonia nitrogen (NH3-N), and other water quality indicators were determined in the laboratory. The concentration of TN was determined using alkaline potassium persulfate oxidation-ultraviolet spectrophotometry, the concentration of TP was determined using the molybdenum antimony anti-spectrophotometric method, and the concentration of NH3-N was determined using potassium persulfate oxidation spectrophotometry [25]. Since 2010, the team for water environment protection and restoration technology for rivers, lakes and wetlands of Inner Mongolia Agricultural University has continuously been observing the water environment factors of Hulun Lake every quarter. In addition, bloom outbreaks are also affected by meteorological factors, namely wind speed (WS), wind direction (WD), temperature (AT), and precipitation (PP). Therefore, meteorological data were obtained from the National Meteorological Data Service Center website (http://data.cma.cn/en) accessed on 1 March 2023. The data cover the sites of Manzhouli station (49.58 N, 117.32 E), Xinbahu Left Banner station (48.22 N, 118.27 E), and Xinbahu Right Banner station (48.68 N, 116.81 E), and the statistics of meteorological data refer to the daily average of the three stations.

2.3. Data Processing

2.3.1. Bloom Extraction Algorithm

In order to avoid misidentification of cyanobacterial blooms due to different threshold settings, environmental conditions (aerosol type and thickness, solar/observational geometry, and sunlight), observation conditions, and cloud cover, the floating algae index (FAI) was selected to extract the bloom area. FAI reflects the spectral variation characteristics of phytoplankton aggregation on the surface of water by constructing baselines of red, near-infrared, and short-wave infrared. FAI is expressed as follows:
FAI = ρ NIR ρ NIR
ρ NIR = ρ NIR   +   ( ρ SWIR   ρ RED )   ×   ( λ NIR   λ RED ) / ( λ SWZR   +   λ RED )
where ρ RED , ρ NIR ,   and   ρ SWIR represent the reflectance of red, near-red, and short-wave infrared bands, respectively; λ RED , λ NIR , and λ SWIR represent the center wavelength of the corresponding band of the Landsat-8 OLI sensor.

2.3.2. Dominant Species of Cyanobacteria

Regarding the dominance of cyanobacteria (y), y > 0.02 represents the dominant species [23]. Its calculation formula is as follows:
y = f i   ×   I
where y is the dominance of cyanobacteria, f i is the occurrence frequency of the i species of cyanobacteria, and I is the proportion of the number of the i species of cyanobacteria in the total number of cyanobacteria.

2.4. Statistical Analysis

The maximum inter-class variance threshold segmentation algorithm (OTSU) was used to determine the bloom threshold of each image. The bloom threshold is −0.009 for 2018–2021 and −0.020 for 2022. According to the Landsat-8 remote sensing image retrieval of the bloom area for each month, Pearson correlation analysis was conducted to explore the relationship between the bloom area and driving factors, and the main driving factors of the cyanobacterial bloom were determined. In order to further determine the main environmental factors affecting cyanobacterial blooms, redundancy analysis (RDA) was conducted to determine the relationship between the dominant species of cyanobacteria and water quality indicators. When the RDA data was processed, lg (x + 1) conversion was performed on the dominant species and water quality indicator data, except for pH (pH is already a log conversion of the concentration of H+ or OH). SPSS Statistics 26 and Canoco 5 were used for the above analysis, and ArcMap 10.8 and Origin 2019b were used for plotting.

3. Results

3.1. Change Trend of Blooms

The Landsat monitoring results from 2018–2022 (June–October each year) are shown in Figure 2. From 2018 to 2020, the overall outbreak scale of the cyanobacterial blooms in Hulun Lake remained small and tended to decline, with average annual areas of 29.66 km2, 27.20 km2, and 23.81 km2, respectively. In July 2018, the area of bloom reached a peak of 105.86 km2, and the peak area of each year appeared in July and August. The blooms mainly occurred in the northern, southern, and eastern coastal areas of the lake area (Figure 3), rarely occurring in the center. During 2021–2022, the average annual area of bloom outbreaks showed an upward trend, increasing from 80.87 km2 to 1453.48 km2. In June 2022, an unprecedented bloom event occurred, with a large outbreak area of 1970.55 km2, covering 88.07% of the lake surface.

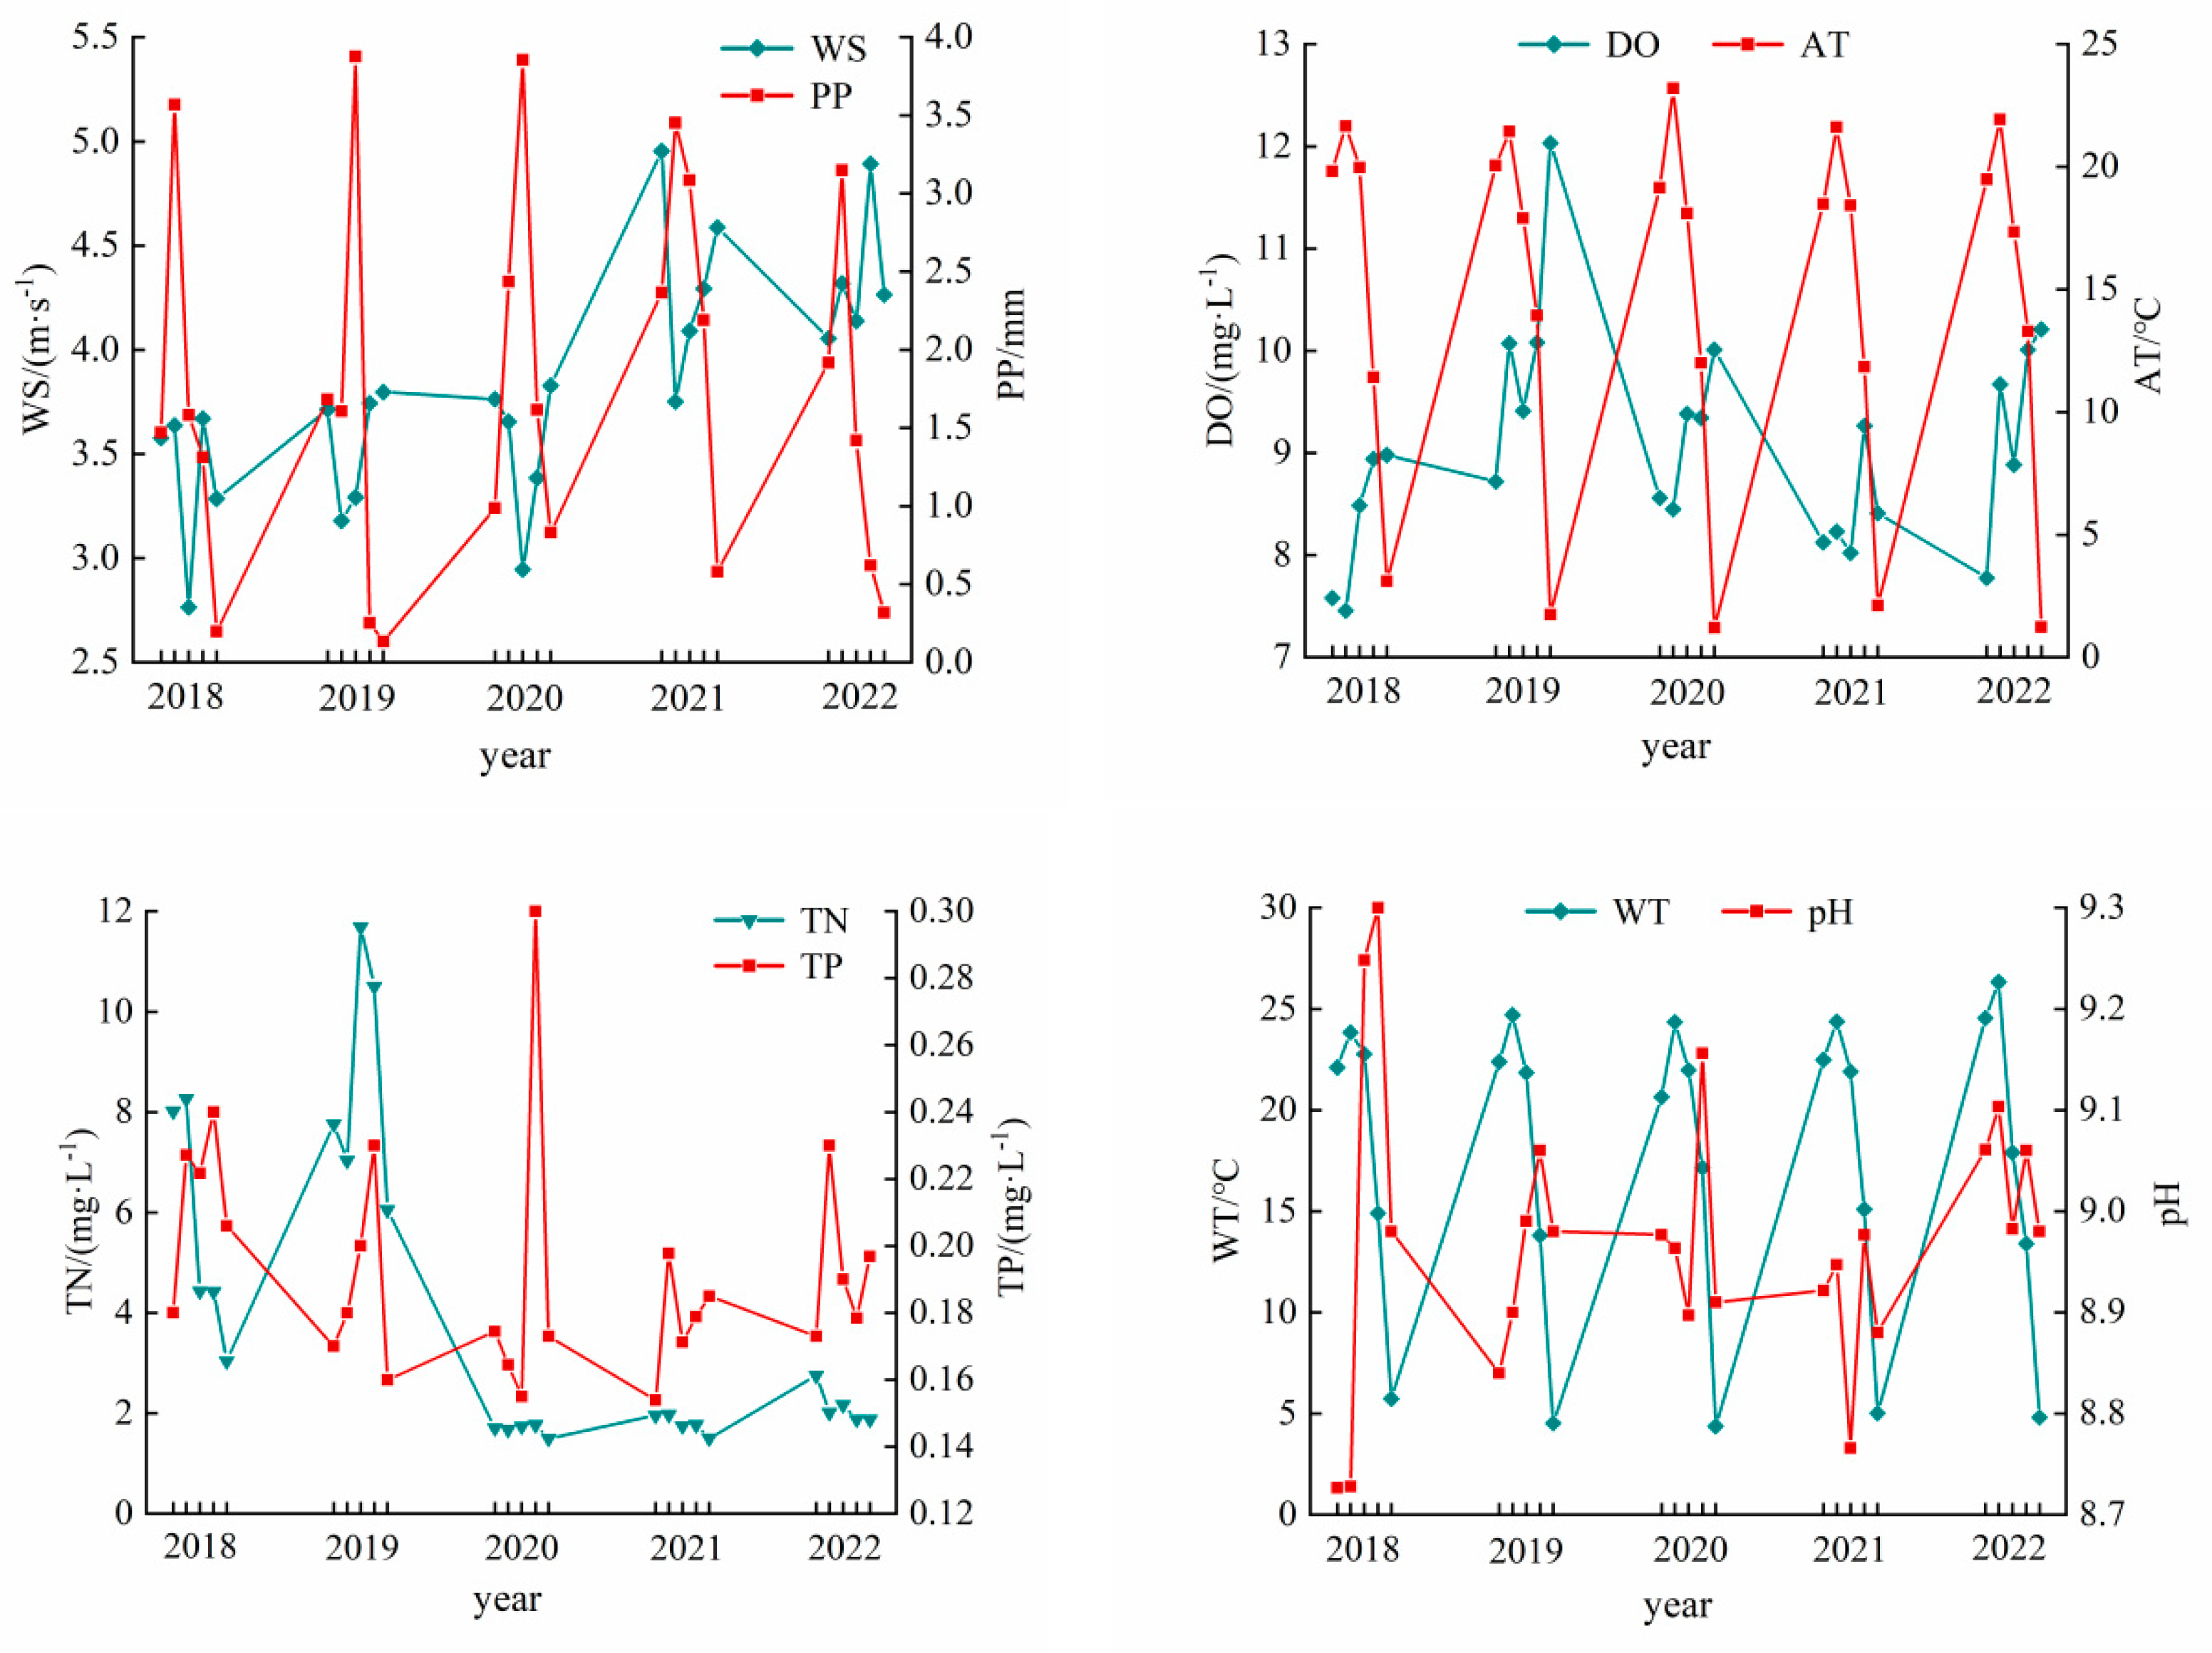
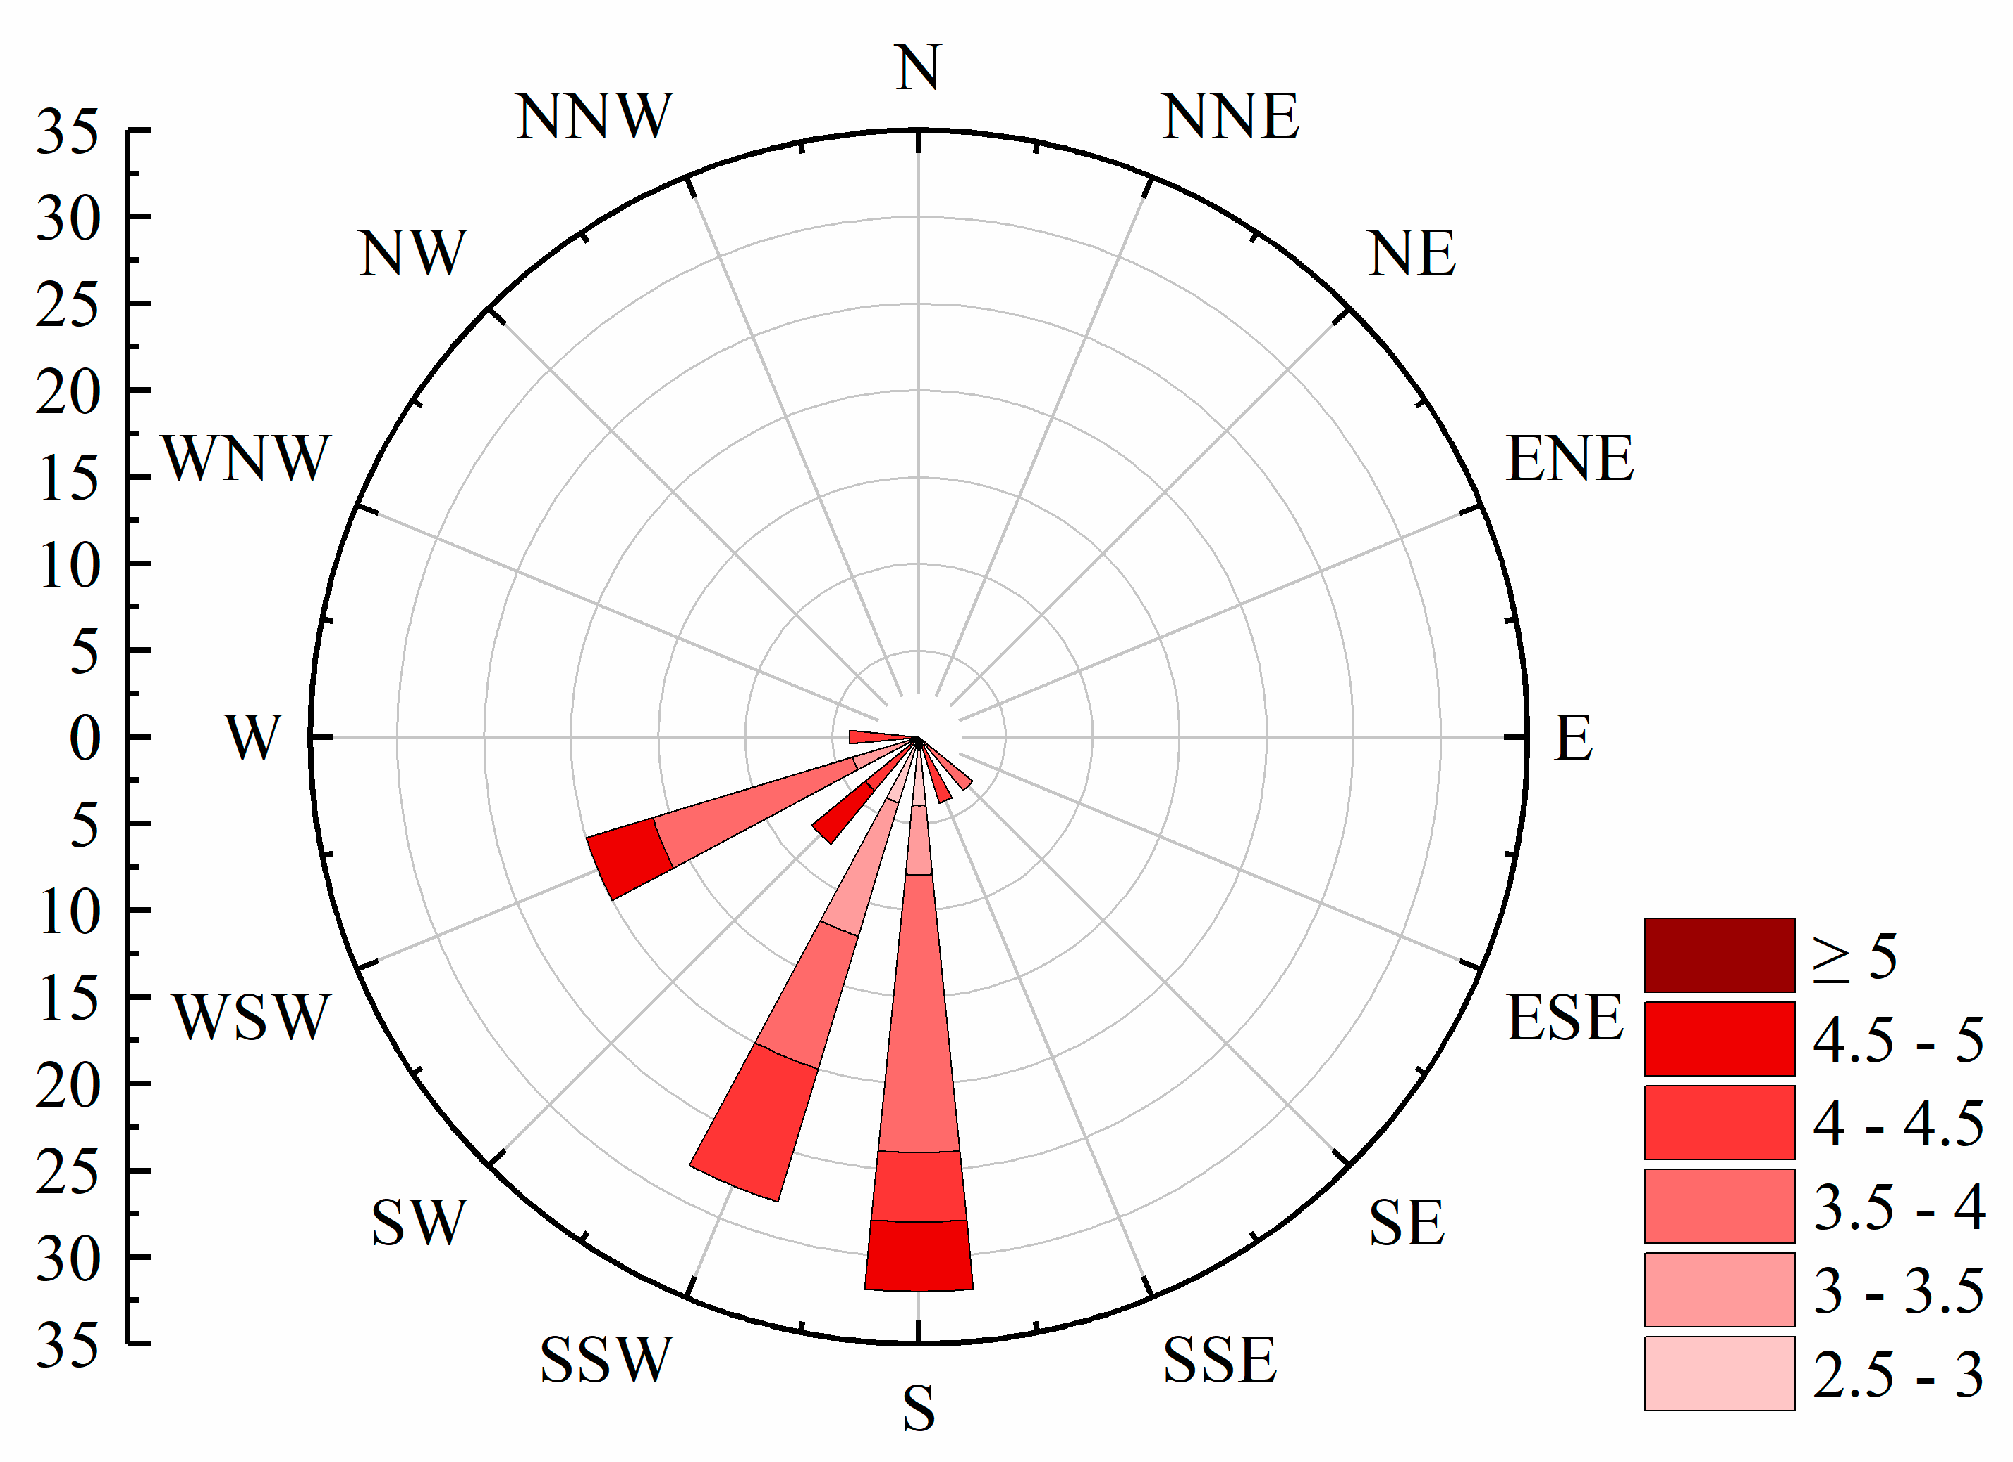
3.2. Interannual Variation of Meteorological and Environmental Factors

The changes in meteorological factors and water quality indicators over time during 2018–2022 are shown in Figure 4. AT, PP, WD, and WS all presented varying degrees of change between years. The interannual variation of AT was large, ranging between 14.49 °C and 15.19 °C, with an average annual temperature of 14.82 °C. The interannual variation of PP was also large, ranging from 1.48 to 2.33 mm, with an average annual variation of 1.78 mm. The interannual variation of WD was small, ranging between 198.42° and 219.30°, with an average annual change of 206.11°. The interannual variation of WS was large, ranging from 3.39 to 4.34 m·s−1, with an average annual variation of 3.82 m·s−1.
The concentrations of TN, TP, WT, pH, and DO showed a slight upward trend in 2022. The interannual variation of TN concentration was large, ranging between 1.72 and 9.24 mg·L−1, with an average annual concentration of 4.26 mg·L−1. The interannual variation of TP concentration was small, ranging between 0.17 and 0.22 mg·L−1, with an average annual concentration of 0.19 mg·L−1. The interannual variation of WT was small, ranging between 20.54 °C and 21.03 °C, with an average annual temperature of 20.82 °C. The interannual variation of pH was small, ranging between 9.00 and 9.28, with its peak in 2019. The interannual variation of DO concentration was large, ranging between 6.13 mg·L−1 and 9.09 mg·L−1, with an average annual concentration of 8.13 mg·L−1.

3.3. Driving Factors of Bloom
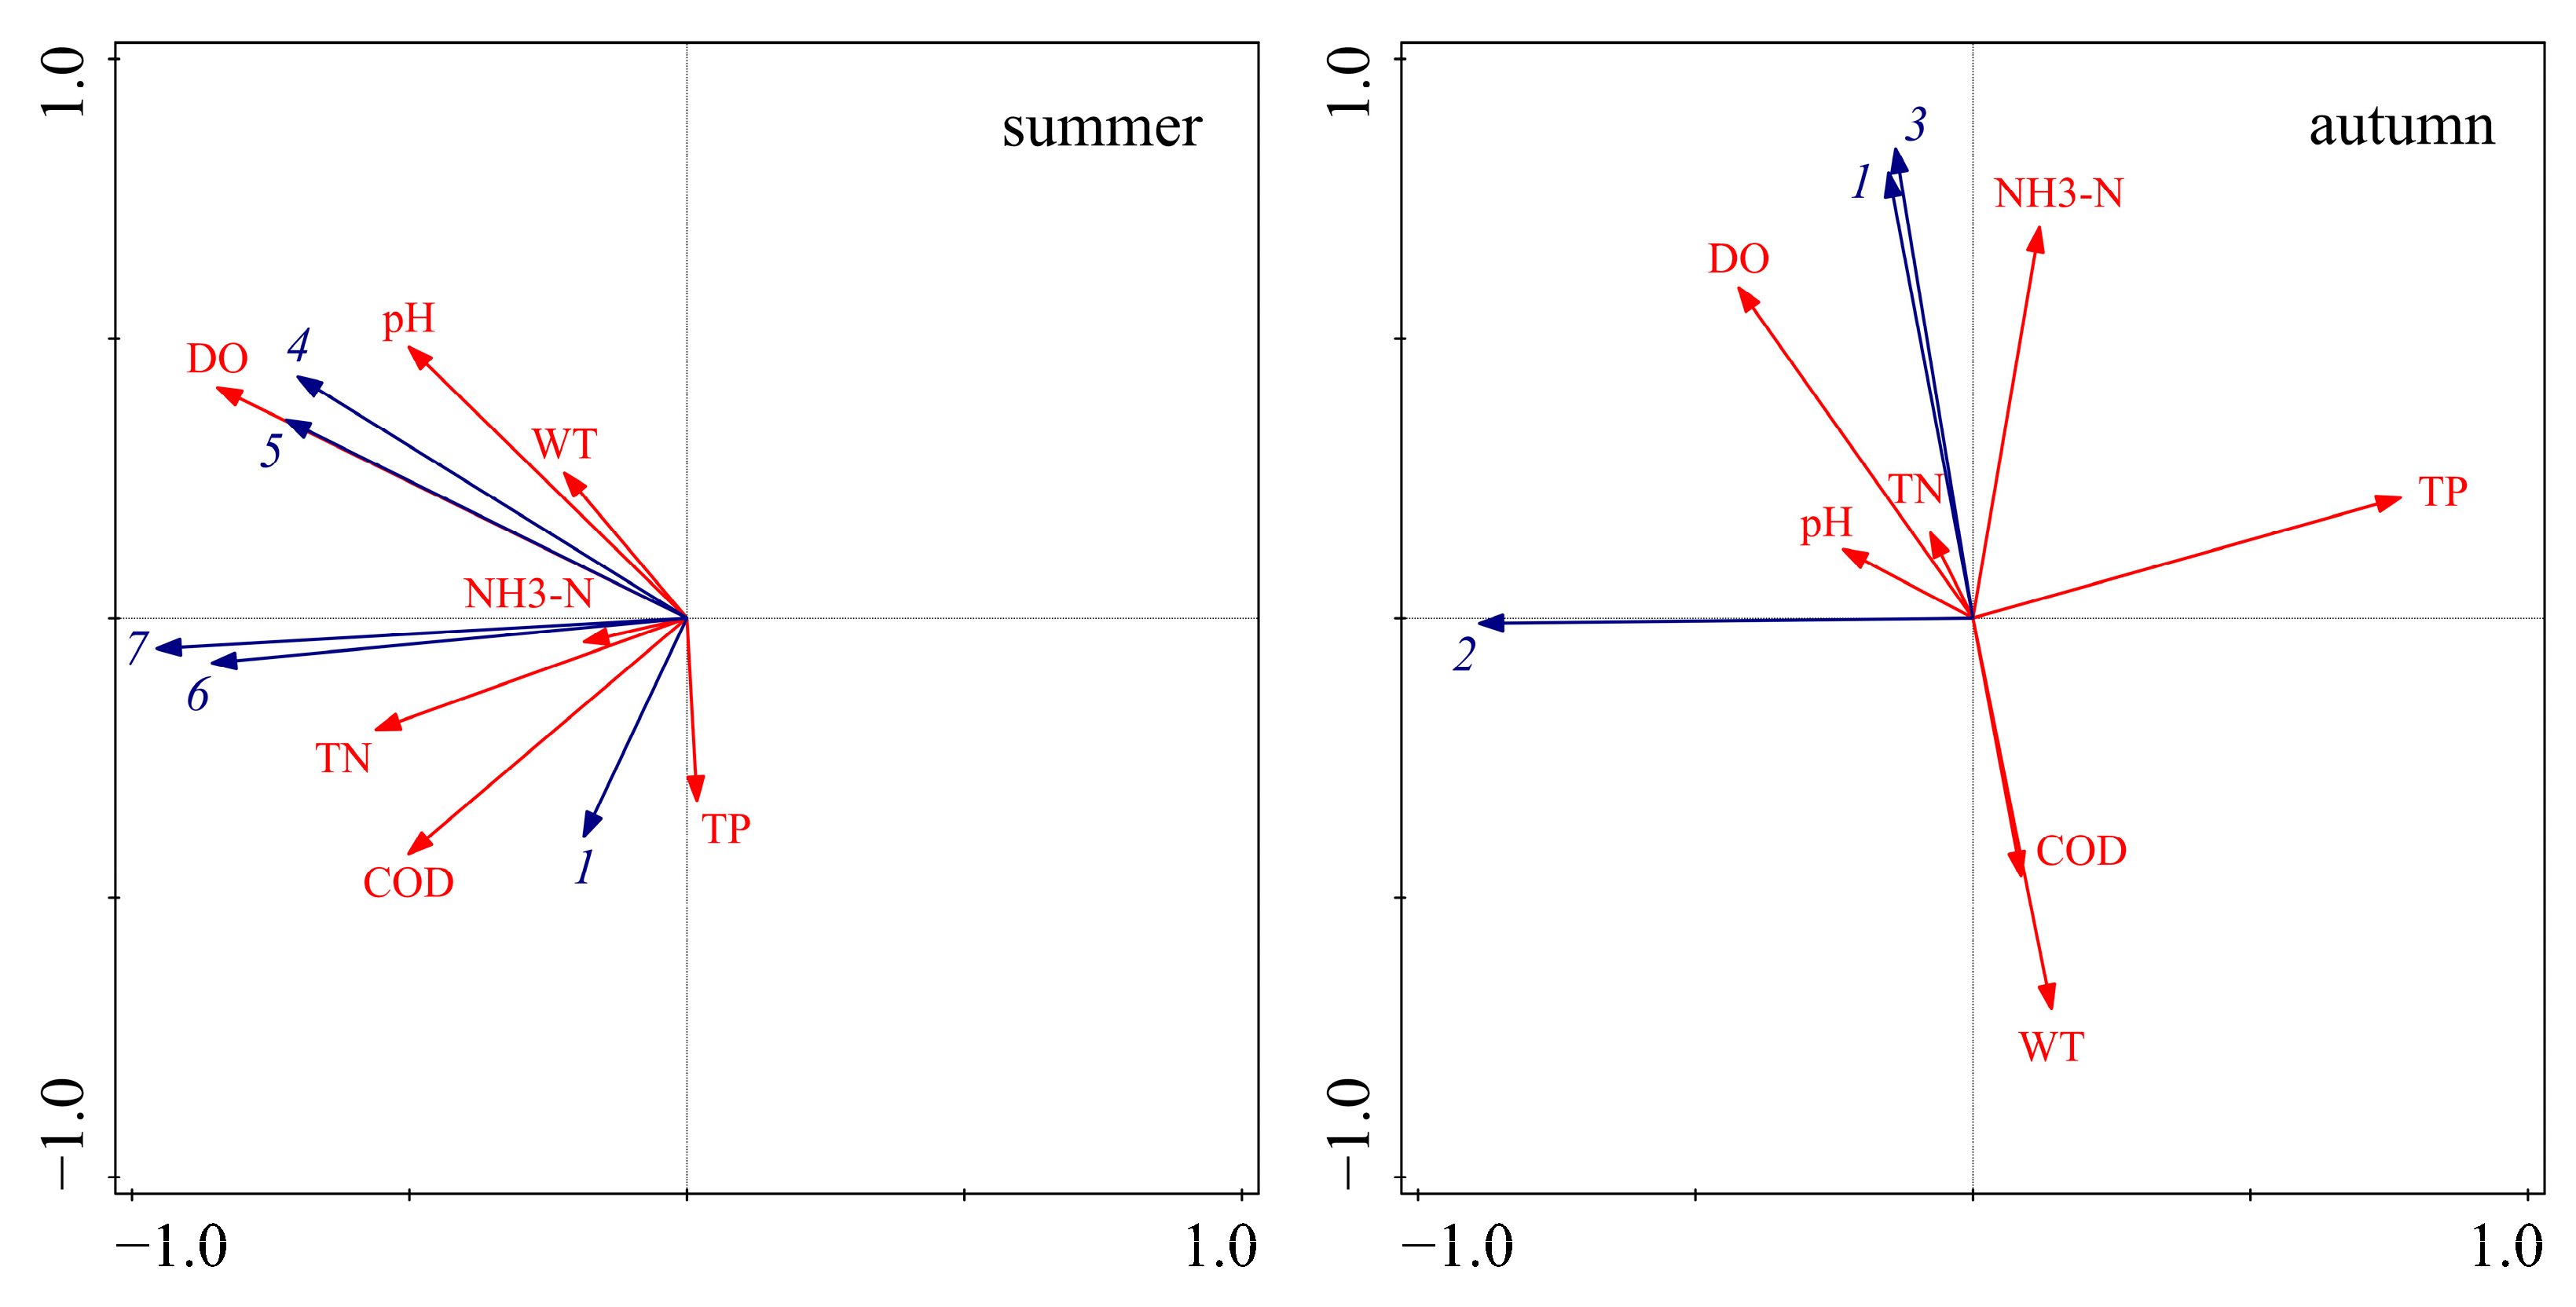
The Pearson correlation analysis was performed on the bloom area and driving factors from 2018 to 2022. The results showed (Table 1) a significant positive correlation between bloom area and WS (p < 0.05) during all study periods; bloom area was positively correlated with TP, WT, pH, DO, and AT, and negatively correlated with TN, PP, and WD, but the correlation was not significant.

3.4. RDA Analysis

In order to further identify the main driving factors for the large-scale outbreak of cyanobacteria in 2022, redundancy analysis (RDA) was conducted to analyze the relationship between the dominant species of cyanobacteria (Table 2) and water quality indicators (Figure 5). In summer, the dominant species were concentrated in the second and third quadrants. The eigenvalues of axis 1 and axis 2 were 0.93 and 0.05, respectively, and the interpretation of axis 1 and axis 2 was 97.86%, indicating a significant correlation between the dominant species of cyanobacteria and water quality indicators. The dominant species of cyanobacteria were positively correlated with COD, NH3-N, TP, TN, DO, pH, and WT. In autumn, the dominant species of cyanobacteria were well differentiated in the second and third quadrants. The eigenvalues of axis 1 and axis 2 were 0.74 and 0.04, respectively, and the interpretation of axis 1 and axis 2 was 78.43%. Planktolyngbya circumcreta was positively correlated with pH, DO, and TN, and negatively correlated with NH3-N, TP, COD, and WT; Microcystis sp. and Planktothrix agardhii were positively correlated with NH3-N, TP, TN, pH, and DO, and negatively correlated with COD and WT.

4. Discussion

4.1. Driving Factors of Blooms in Hulun Lake

In general, the rapid multiplication of cyanobacteria and formation of organic aggregates, which ultimately lead to blooms on the surface of the water, are driven by the combined influence of water conditions and meteorological factors [1]. In this study, Pearson correlation analysis was performed between water quality indicators and meteorological factors and the area of algal blooms in the same period from 2018 to 2022. The results showed that the concentrations of TP, DO, and TN and pH had little effect on the change trend in the bloom area. This may be because the concentrations of TP, DO, and TN and pH in Hulun Lake itself have been at high levels, providing sufficient nutrients for the growth of most cyanobacteria. Therefore, meteorological factors have become the main driving factors for the outbreak of water blooms.
Meteorological factors play an important role in the degree of bloom outbreak [26]. Changes in meteorological factors directly change the transport, transformation, and recharge mode of cyanobacteria [27]. Precipitation was negatively correlated with bloom area. Precipitation carries nutrients and suspended particulate matter into the lake through the scouring effect, which increases the nutrient load of the water body and also increases the turbidity of the water body, resulting in lake light attenuation, inhibiting the photosynthesis of cyanobacteria, increasing the doping effect of the water body, and diluting the cell density of cyanobacteria [27,28]. Temperature was positively correlated with the area of bloom. The increase in temperature can improve the utilization efficiency of nutrients by affecting the water temperature, thermal stratification, vertical mixing and biological community structure of the lake, accelerate the growth and reproduction of cyanobacteria, and reduce the probability of predation, resulting in an increase in the scale of blooms [28]. This is consistent with the analysis results of meteorological conditions during the bloom period in Chaohu Lake by Qi et al. [11]. Wind speed was positively correlated with bloom area. The average annual wind speed of Hulun Lake is 3.82 m·s−1, which is low and generates small waves, thus leading to only small disturbances. The relatively stable water environment is conducive to the floating and gathering of cyanobacteria on the water surface [29,30], thus promoting the formation of a large area of bloom. This is consistent with the research results of Shi et al. [31] on the relationship between bloom outbreaks and wind speed in Taihu Lake.
In order to further clarify the main influencing factors of the dominant species of cyanobacterial bloom outbreaks, RDA of the dominant species of cyanobacteria and the water quality indicators in the summer (August) and autumn (November) of 2022 was carried out. The results showed that COD, DO, TP, and WT were the main influencing factors of the dominant species of cyanobacteria in summer and autumn, additionally including pH and TN in summer.
WT is one of the decisive factors of algal growth and reproduction [32]. The DNA of cyanobacteria and the thermal stability of the photosynthetic system and other physiological functions lead to a high-temperature adaptation mechanism. Compared with other algae, cyanobacteria have stronger high-temperature resistance. Studies have shown that a WT > 15 °C promotes the growth of cyanobacteria [33]. The higher water temperature is conducive to the dominance of the cyanobacteria population and the outbreak of blooms. During the study period from 2018 to 2022, the water temperature of Hulun Lake was 20.54–21.03 °C, which was conducive to the increase in cyanobacteria biomass.
Nutrients in water are often regarded as key factors affecting the growth and community composition of cyanobacteria. The contents of N and P in water directly affect the distribution, growth, and reproduction of cyanobacteria. TP is an important limiting nutrient for the production of cyanobacteria and the flow of energy in the food chain, while TN is an essential nutrient for the reproduction and metabolism of cyanobacteria [34]. The average annual concentrations of TN and TP in Hulun Lake in 2022 were 2.02 mg·L−1 and 0.19 mg·L−1, respectively. The concentrations of TN (0.2 mg·L−1) and TP (0.02 mg·L−1) in the water body exceeded the critical concentration for eutrophication. When the concentrations of nitrogen and phosphorus in water are high, Microcystis sp., which is resistant to high phosphorus and nitrogen, can become the dominant species [35]. Therefore, the concentrations of nitrogen and phosphorus are important factors affecting the bloom process of cyanobacteria.
DO is one of the important conditions for photosynthesis in cyanobacteria, which affects their growth and metabolism. In the absence of light, cyanobacteria require DO in water for their growth and reproduction, reducing the DO content in water, and competition among cyanobacteria leads to DO becoming the key influencing factor [36]. In water bodies with a high density of cyanobacteria, photosynthesis consumes a large amount of CO2 in the water, and the occurrence of cyanobacterial blooms is accompanied by a decrease in CO2 concentration and an increase in pH. Studies have shown that water environments with a pH > 8.5 is suitable for the growth of cyanobacteria [37]. When the pH > 9, Microcystis blooms occur on the surface of water by means of a suspension mechanism, which is conducive to the absorption of CO2 at the “air-water” interface. In contrast, other algae without the suspension mechanism are at a competitive disadvantage due to the lack of CO2 needed to maintain a higher photosynthetic rate. During the sampling period, the pH of Hulun Lake was in the range of 9.00–9.28, which is conducive to the growth of cyanobacteria.

4.2. Change Trend of Blooms in Hulun Lake

Previous studies have shown that global bloom events and their impacts have increased [38]. In this study, the coverage area of cyanobacterial bloom outbreaks in Hulun Lake in 2022 was found to be the largest in the past five years, which agrees with the findings of Liu et al. [20] on the area of cyanobacterial bloom outbreaks in Hulun Lake. The reason may be that in 2022, climatic conditions accelerated the outbreak of cyanobacteria blooms, namely the high temperature, low rainfall, low water level, and low wind speed, resulting in significant differences in the interannual variation of cyanobacterial bloom areas in Hulun Lake. An increase in temperature reduces the thickness of the mixed layer and increases the number of algae cells per unit volume. This promotes the gathering of cyanobacteria with lower density in the surface layer by buoyancy, which expands the coverage area of blooms [39]. A decrease in precipitation and lowering of the water level increase the concentration of pollutants and nutrients in the lake, increase the degree of eutrophication, and induce the occurrence of cyanobacterial blooms [40]. A decrease in wind speed leads to the increase in anaerobic frequency at the bottom of the lake, which promotes the release of nutrients from sediments and the proliferation of cyanobacteria. A reduction in disturbance to the water body is conducive to the floating and accumulation of cyanobacteria particles, which provides a competitive advantage for bloom outbreaks [41].
During 2018–2020, the bloom outbreaks in Hulun Lake were mainly distributed in the northern, southern, and eastern coastal areas. The distribution of chlorophyll a content in Hulun Lake was consistent with that obtained by Guo et al. [42]. The nutrients required for the growth of cyanobacteria were likely derived from various sources such as the Jalainur Mining area fishing ground in the northern end, the Dalai Lake fishing ground at the estuary of the Xinkai River, the Donghekou fishing ground near the Ulson River, and the No. 5 fishing ground, Dashaquan fishing ground, and Xihekou fishing ground in the west, cultured bait, animal excrement, and carcasses. The Hulun Lake tourist attraction in the north, the Golden Coast tourist attraction in the southwest, and the Chinggis Khan hitching post tourist area attract a large number of tourists, and frequent human activities also promote the growth of cyanobacteria. Previous studies have shown that the dominant wind direction [43] and wind speed in lake basins drive the spatial distribution of cyanobacteria blooms. A southwest wind prevails in Hulun Lake (Figure 6), which gathers cyanobacteria in the northeast. In addition to promoting the accumulation of cyanobacteria blooms, wind speed can also affect chemical and biological processes in lakes by changing the vertical disturbance and material flux within lakes [44]. The average annual wind speed of Hulun Lake is less than 4 m·s−1, which promotes the floating and gathering of cyanobacteria on the surface, resulting in more cyanobacteria in the east and north of the lake, leading to the occurrence of blooms.
In order to solve the problem of large-scale outbreaks of cyanobacterial blooms, it is necessary to simultaneously disperse aquaculture and livestock pollution, reduce industrial and domestic sewage (not into sewage plants), remove silt and biological residues, and repair coastal wetlands. At the same time, constructing a scientific prediction system of cyanobacterial blooms can help in minimizing the impact of cyanobacterial blooms on residents’ lives and watershed environments. In the future, in addition to studying the evolution mechanism of cyanobacterial bloom outbreaks under various changing environmental conditions, attention should also be paid to the influence of dominant cyanobacteria species and their physiological states during bloom events [1].

5. Conclusions

(1) Regarding the variation characteristics of the cyanobacterial bloom areas in Hulun Lake from 2018 to 2022, the annual average area of blooms tended to be stable before 2021, mainly distributed in the coastal areas of the north, south, and east. After 2021, it showed a significant increasing trend. In June 2022, the area of blooms reached the largest in the past five years, covering 88.07% of the lake surface.
(2) Through Pearson correlation analysis of the bloom area and driving factors, wind speed was found to be the main driving factor of the large-scale outbreak of blooms.
(3) In 2022, there were five dominant species of cyanobacteria in summer and three in autumn, among which Microcystis sp. was the main dominant species in both seasons.
(4) Through RDA of the dominant species of cyanobacteria and water quality indicators in 2022, COD, DO, TP, WT, pH, and TN were found to be the main influencing factors of the dominant species in summer, and COD, DO, TP, and WT were found to be the main influencing factors in autumn.

Author Contributions

X.L.: Writing—original draft, Software, Visualization, Investigation; Y.L.: Conceptualization, Funding acquisition; S.Z. (Sheng Zhang): Resources, Conceptualization; G.L.: Conceptualization; Y.T.: Investigation, Data curation; S.W.: Investigation; H.Y.: Investigation, Data curation; X.S.: Conceptualization; S.Z. (Shengnan Zhao): Formal analysis. All authors have read and agreed to the published version of the manuscript.

Funding

This research received no external funding.

Data Availability Statement

The data in this article cannot be published for privacy reasons.

Acknowledgments

This work was supported by the Outstanding Youth Project of Inner Mongolia Agricultural University (BR230402); Inner Mongolia Science and Technology Project (grant number 2023YFHH0060); and National Natural Science Foundation of China (grant number 51909123). The authors would like to thank all the reviewers who participated in the review.

Conflicts of Interest

The authors declare that they have no known competing financial interests or personal relationships that could have appeared to influence the work reported in this paper.

References

  1. Yuan, J.; Cao, Z.G.; Ma, J.G.; Shen, M.; Qi, T.C. Remote sensed analysis of spatial and temporal variation in phenology of algal blooms in Lake Chaohu since 1980s. J. Lake Sci. 2023, 35, 57–72. (In Chinese) [Google Scholar]
  2. Yan, X.C.; Xu, X.G.; Wang, M.Y.; Wang, G.X.; Wu, S.J.; Li, Z.C.; Sun, H.; Shi, A.; Yang, Y.H. Climate warming and cyanobacteria blooms: Looks at their relationships from a new perspective. Water Res. 2017, 125, 449–457. [Google Scholar] [CrossRef] [PubMed]
  3. Wu, R.; Liu, Y.; Zhang, S.; Shi, X.H.; Zhao, S.N.; Lu, J.P.; Kang, X.E.; Wang, S.H.; Wu, Y.; Arvola, L. Characterization of nitrogen and phosphorus at the ice-water-sediment interface and the effect of their migration on overlying water quality in Daihai Lake (China) during the freezing period. Sci. Total Environ. 2023, 164863. [Google Scholar] [CrossRef] [PubMed]
  4. Qin, B.Q.; Deng, J.M.; Shi, K.; Wang, J.; Brookes, J.; Zhou, J.; Zhang, Y.L.; Zhu, J.W.; Paerl, H.W.; Wu, L. Extreme Climate Anomalies Enhancing Cyanobacterial Blooms in Eutrophic Lake Taihu, China. Water Resour. Res. 2021, 57, e2020WR029371. [Google Scholar] [CrossRef]
  5. Wei, J.L.; Cui, Y.J.; Li, Y.Z.; Zhang, S.S.; Xu, H.Z.; Pang, Y.M.; Pei, H.Y. Distribution characteristics and environmental driving factors of cyanobacteria community in impounded Lakes and reservoirs in Shandong on the East Route of South-to-North Water diversion project. Environ. Sci. 2023, 1–15. (In Chinese) [Google Scholar] [CrossRef]
  6. Chen, T.; Du, X.; Chen, Y.Y.; Guo, X.Y.; Xiong, W. Metabarcoding profiling of phytoplankton communities associated to Algal blooms and determining related drivers in Baiyangdian Lake. Environ. Sci. 2023, 1–12. (In Chinese) [Google Scholar]
  7. Peng, M.Y.; Li, C.M.; Xia, J.; Song, Z.G.; Wen, B. The dominant algal species and the controlling factors triggered 2021—2022 Huguangyan Maar Lake algal bloom event. Environ. Chem. 2023, 42, 1642–1650. (In Chinese) [Google Scholar]
  8. Wang, S.Q.; Zhang, X.; Wang, C.; Chen, N.C. Multivariable integrated risk assessment for cyanobacterial blooms in eutrophic lakes and its spatiotemporal characteristics. Water Res. 2023, 228, 119367. [Google Scholar] [CrossRef]
  9. Ho, J.C.; Michalak, A.M.; Pahlevan, N. Widespread global increase in intense lake phytoplankton blooms since the 1980s. Nature 2019, 574, 667–670. [Google Scholar] [CrossRef]
  10. Huang, J.C.; Zhang, Y.J.; Arhonditsis, G.B.; Cao, J.F.; Chen, Q.W.; Peng, J. The magnitude and drivers of harmful algal blooms in China’s lakes and reservoirs: A national-scale characterization. Water Res. 2020, 181, 115902. [Google Scholar] [CrossRef]
  11. Qi, G.H.; Ma, X.S.; He, S.Y.; Wu, P.H. Long-term spatiotemporal variation analysis and probability prediction of algal blooms in Lake Chaohu (2009–2018) based on multi-source remote sensing data. J. Lake Sci. 2021, 33, 414–427. (In Chinese) [Google Scholar]
  12. Dai, Y.H.; Yang, S.B.; Zhao, D.; Hu, C.M.; Xu, W.; Anderson, D.M.; Li, Y.; Song, X.P.; Boyce, D.G.; Gibson, L.; et al. Coastal phytoplankton blooms expand and intensify in the 21st century. Nature 2023, 615, 280–284. [Google Scholar] [CrossRef] [PubMed]
  13. Wang, K.; Razzano, M.; Mou, X. Cyanobacterial blooms alter the relative importance of neutral and selective processes in assembling freshwater bacterioplankton community. Sci. Total Environ. 2020, 706, 135724. [Google Scholar] [CrossRef] [PubMed]
  14. Wang, K.; Mou, X.Z.; Cao, H.S.; Struewing, T.; Allen, J.; Lu, J.R. Co-occurring microorganisms regulate the succession of cyanobacterial harmful algal blooms. Environ. Pollut. 2021, 288, 117682. [Google Scholar] [CrossRef] [PubMed]
  15. Zhou, T.; Li, Y.; Jiang, B.; Alatalo, J.M.; Li, C.; Ni, C. Tracking spatio-temporal dynamics of harmful algal blooms using long-term MODIS observations of Chaohu Lake in China from 2000 to 2021. Ecol. Indic. 2023, 146, 109842. [Google Scholar] [CrossRef]
  16. Guo, X.; Zhu, A.; Chen, R. China’s algal bloom suffocates marine life. Science 2021, 373, 751. [Google Scholar] [CrossRef]
  17. Wu, R.; Zhang, S.; Liu, Y.; Shi, X.H.; Zhao, S.N.; Kang, X.E.; Sun, B.; Arvola, L.; Li, G.H. Spatiotemporal variation in water quality and identification and quantification of areas sensitive to water quality in Hulun lake, China. Ecol. Indic. 2023, 149, 110176. [Google Scholar] [CrossRef]
  18. Jiang, Z.F.; Li, C.Y.; Zhang, S. Zooplankton in Hulun Lake and the eutrophication evaluation. J. Arid. Land Resour. Environ. 2014, 28, 158–162. (In Chinese) [Google Scholar] [CrossRef]
  19. Cao, M.M.; Qing, S.; Du, Y.C.Z.; Yuan, R.Q.; Shun, B.R. Remote sensing monitoring of algal blooms in Hulun Lake based on SMDPSO algorithm. J. Water Resour. Water Eng. 2021, 32, 66–72+80. (In Chinese) [Google Scholar]
  20. Liu, J.Q.; Shi, Q.; Song, Y.; Zou, Y.R.; Liang, C. Remote sensing monitoring and comparison of cyanobacteria in Hulun Lake based on HY-1C satellite data. Geomat. World 2022, 29, 35–38+48. (In Chinese) [Google Scholar]
  21. Wang, D.B.; Jun, S.; Chen, L.; Zhou, J.H.; Bai, X.Y.; Chao, L.M. Community structures of phytoplankton in the Hulun Lake during lcebound season and its relation with environmental factors. Environ. Monit. China 2019, 35, 59–66. (In Chinese) [Google Scholar] [CrossRef]
  22. Li, X.C.; Yu, H.X.; Dou, H.S.; Pan, H.F.; Ma, C.X. Phytoplankton functional groups and related influencing factors in Hulun Lake and adjacent waters in spring. Chin. J. Fish. 2020, 33, 31–41. (In Chinese) [Google Scholar]
  23. Qian, X.Y.; Li, J.B.; Ao, W.; Pang, B.; Bao, S.R.; Wang, Q.; Liu, B.; Wang, Z.L. Seasonal dynamics of phytoplankton and its relationship with environmental factors in Lake Hulun. J. Lake Sci. 2022, 34, 1814–1827. (In Chinese) [Google Scholar]
  24. Šimunović, M.; Kulaš, A.; Žutinić, P.; Udovič, M.G. Phytoplankton Diversity of a Natural Karst Lake Combining Morphological and Molecular Approaches. Water 2023, 15, 1379. [Google Scholar] [CrossRef]
  25. State Environmental Protection Administration. Methods Formonitoring and Analysis of Water and Wastewater, 4th ed.; China Environmental Science Press: Beijing, China, 2002. (In Chinese) [Google Scholar]
  26. Zhang, M.; Duan, H.T.; Shi, X.L.; Yu, Y.; Kong, F.X. Contributions of meteorology to the phenology of cyanobacterial blooms: Implications for future climate change. Water Res. 2012, 46, 442–452. [Google Scholar] [CrossRef]
  27. Liu, X.M.; Zhang, G.X. A review of studies on the impact of climate change on cyanobacteria blooms in lakes. Adv. Water Sci. 2022, 33, 316–326. (In Chinese) [Google Scholar] [CrossRef]
  28. Zhang, P.; Guo, C.X.; Yu, J.; Quan, Q.M.; Yao, J.L.; Wang, J.Y.; Ye, X.R.; Zhu, M.Y.; Sun, Q.L.; Zhu, G.W. Characteristics of phytoplankton community structure and its response to hydro-meteorology in summer of Qiantang River. J. Lake Sci. 2022, 34, 418–432. (In Chinese) [Google Scholar]
  29. Jiang, D.L. Research on temporal and spatial variation of algae blooms and its driving factors in Lake Dianchi based on GIS/RS. Master’s Thesis, Southwest University, Chongqing, China, 2015. (In Chinese). [Google Scholar]
  30. Sun, X.J.; Qin, B.Q.; Zhu, G.W.; Zhang, Z.P. Effect of wind-induced wave on concentration of colloidal nutrient and phytoplankton in Lake Taihu. Environ. Sci. 2007, 28, 506–511. (In Chinese) [Google Scholar] [CrossRef]
  31. Shi, K.; Zhang, Y.; Zhang, Y.; Li, N.; Qin, B.; Zhu, G.; Zhou, Y. Phenology of Phytoplankton Blooms in a Trophic Lake Observed from Long-Term MODIS Data. Environ. Sci. Technol. 2019, 53, 2324–2331. [Google Scholar] [CrossRef]
  32. Jiang, Y.J.; He, W.; Liu, W.X.; Qin, N.; Ouyang, H.L.; Wang, Q.M.; Kong, X.Z.; He, Q.S.; Yang, C.; Yang, B.; et al. The seasonal and spatial variations of phytoplankton community and their correlation with environmental factors in a large eutrophic Chinese lake (Lake Chaohu). Ecol. Indic. 2014, 40, 58–67. [Google Scholar] [CrossRef]
  33. Robarts, R.D.; Zohary, T. Temperature effects on photosynthetic capacity, respiration, and growth rates of bloom-forming cyanobacteria. N. Z. J. Mar. Freshw. Res. 1987, 21, 391–399. [Google Scholar] [CrossRef]
  34. Morey, J.S.; Monroe, E.A.; Kinney, A.L.; Beal, M.; Johnson, J.G.; Hitchcock, G.L.; Dolah, F.M.V. Transcriptomic response of the red tide dinoflagellate, Karenia brevis, to nitrogen and phosphorus depletion and addition. BMC Genom. 2011, 12, 346. [Google Scholar] [CrossRef]
  35. Tan, X.; Shen, H.; Song, L.R. Comparative studies on physiological responses at phosphorus stress of three waterbloom-forming cyanobacteria. Acta Hydrobiol. Sin. (In Chinese). 2007, 5, 693–699. [Google Scholar]
  36. Zhang, Q.; Chen, Y.C.; Lin, Y.Q.; Ma, H.H.; Ding, Y.; Sun, H.; Chen, Q.W. Spatial distribution patterns of phytoplankton community during different water periods along cascade reservoirs in yhe Lancang River. Acta Sci. Circumstantiae 2022, 42, 392–401. (In Chinese) [Google Scholar] [CrossRef]
  37. Zhao, M.X.; Han, B.P. Analysis of factors affecting cyanobacteria bloom in a tropical reservoir (Tangxi Reservoi, China). Acta Ecol. Sin. (In Chinese). 2005, 7, 1554–1561. [Google Scholar]
  38. Van Dolah, F.M. Marine algal toxins: Origins, health effects, and their increased occurrence. Environ. Health Perspect. 2000, 108 (Suppl. S1), 133–141. [Google Scholar] [CrossRef]
  39. Tong, Y.D.; Xu, X.W.; Qi, M.; Sun, J.J.; Zhang, Y.Y.; Zhang, W.; Wang, M.Z.; Wang, X.J.; Zhang, Y. Lake warming intensifies the seasonal pattern of internal nutrient cycling in the eutrophic lake and potential impacts on algal blooms. Water Res. 2021, 188, 116570. [Google Scholar]
  40. Walter, J.M.; Lopes, F.A.C.; Lopes-Ferreira, M.; Vidal, L.M.; Leomil, L.; Melo, F.; Azevedo, G.S.; Oliveira, R.M.S.; Medeiros, A.J.; Melo, A.S.O.; et al. Occurrence of harmful cyanobacteria in drinking water from a severely drought-impacted semi-arid region. Front. Microbiol. 2018, 176. [Google Scholar] [CrossRef]
  41. Wang, C.L.; Pan, W.Y.; Han, Y.Q.; Qian, X. Effect of global climate change on cyanobacteria bloom in Taihu Lake China. Environ. Sci. 2010, 30, 822–828. (In Chinese) [Google Scholar]
  42. Guo, Z.Y.; Li, C.Y.; Shi, X.H.; Sun, B.; Zhao, S.N.; Quan, D.; Hou, B. Spatial and temporal distribution characteristics of chlorophyll a content and its influencing factor analysis in Hulun Lake of Cold and Dry Areas. Ecol. Environ. Sci. 2019, 28, 1434–1442. (In Chinese) [Google Scholar]
  43. Li, J.L.; Luo, C.L.; Lv, H.; Xu, J.F.; Luo, L.C.; Pan, M.; He, F.; Man, X.M.; Zhang, R.F.; Gong, F.L.; et al. Spatio-temporal variation and driving factors of algal bloom at Lake Dianchi during 2002–2018. Acta Ecol. Sin. 2023, 43, 878–891. (In Chinese) [Google Scholar]
  44. Zhang, C.; Lai, S.Y.; Gao, X.P.; Liu, H.A. A review of the potential impacts of climate change on water environment in lakes and reservoirs. J. Lake Sci. 2016, 28, 691–700. (In Chinese) [Google Scholar]
Figure 1. Location of research area and sampling points.
Water 15 03765 g001
Figure 2. Variation trend of bloom areas in Hulun Lake during 2018–2022.
Water 15 03765 g002
Figure 3. Spatial distribution of blooms in Hulun Lake during 2018–2022.
Water 15 03765 g003
Figure 4. Interannual changes of driving factors in Hulun Lake during 2018–2022.
Water 15 03765 g004
Figure 5. Redundancy analysis of dominant species of cyanobacteria and water quality indicators in 2022 (1 represents Microcystis sp., 2 represents Planktolyngbya circumcreta, 3 represents Planktothrix agardhii, 4 represents Planktothrix spiroides, 5 represents Pseudanabaena sp., 6 represents Dolichospermum flos-aquae, 7 represents Aphanizomenon sp.).
Water 15 03765 g005
Figure 6. Wind direction rose chart from 2018 to 2022.
Water 15 03765 g006
Table 1. Correlation between bloom area and meteorological factors.
TNTPWTpHDOATPPWDWS
Area−0.2770.0050.1020.2540.0680.085−0.008−0.0040.455 *
Note: * the correlation is significant at 0.05 level (two-tailed).
Table 2. Dominant species of cyanobacteria in the summer and autumn of 2022.
NumberDominant SpeciesDominance (y)
AugustNovember
(Summer)(Autumn)
1Microcystis sp.0.4910.208
2Planktolyngbya circumcreta 0.126
3Planktothrix agardhii 0.024
4Planktothrix spiroides0.03
5Pseudanabaena sp.0.058
6Dolichospermum flos-aquae0.25
7Aphanizomenon sp.0.022
Disclaimer/Publisher’s Note: The statements, opinions and data contained in all publications are solely those of the individual author(s) and contributor(s) and not of MDPI and/or the editor(s). MDPI and/or the editor(s) disclaim responsibility for any injury to people or property resulting from any ideas, methods, instructions or products referred to in the content.

