Article

Stable Isotopes and Water Level Monitoring Integrated to Characterize Groundwater Recharge in the Pra Basin, Ghana

1
GFZ German Research Centre for Geosciences, Fluid Systems Modelling, Telegrafenberg, 14473 Potsdam, Germany
2
Institute of Geosciences, University of Potsdam, Karl-Liebknecht-Str. 24-25, 14476 Potsdam, Germany
3
Department of Nuclear Science and Applications, Graduate School of Nuclear and Allied Sciences, University of Ghana Legon, Accra P.O. Box AE 1, Ghana
*
Author to whom correspondence should be addressed.
Water 2023, 15(21), 3760; https://doi.org/10.3390/w15213760
Submission received: 9 August 2023 / Revised: 17 October 2023 / Accepted: 19 October 2023 / Published: 27 October 2023
(This article belongs to the Special Issue The Use of Environmental Isotopes in Hydrogeology)

Abstract

:
In the Pra Basin of Ghana, groundwater is increasingly becoming the alternative water supply due to the continual pollution of surface water resources through illegal mining and indiscriminate waste discharges into rivers. However, our understanding of hydrogeology and the dynamics of groundwater quality remains inadequate, posing challenges for sustainable water resource management. This study aims to characterize groundwater recharge by determining its origin and mechanism of recharge prior to entering the saturated zone and to provide spatial estimates of groundwater recharge using stable isotopes and water level measurements relevant to groundwater management in the basin. Ninety (90) water samples (surface water and groundwater) were collected to determine stable isotope ratios of oxygen ( δ 18 O ) and hydrogen ( δ 2 H ) and chloride concentration. In addition, ten boreholes were installed with automatic divers to collect time series data on groundwater levels for the 2022 water year. The Chloride Mass Balance (CMB) and the Water Table Fluctuation (WTF) methods were employed to estimate the total amount and spatial distribution of groundwater recharge for the basin. Analysis of the stable isotope data shows that the surface water samples in the Pra Basin have oxygen ( δ 18 O ) and hydrogen ( δ 2 H ) isotope ratios ranging from −2.8 to 2.2‰ vrs V-SMOW for δ 18 O and from −9.4 to 12.8‰ vrs V-SMOW for δ 2 H , with a mean of −0.9‰ vrs V-SMOW and 0.5‰ vrs V-SMOW, respectively. Measures in groundwater ranges from −3.0 to −1.5‰ vrs V-SMOW for δ 18 O and from −10.4 to −2.4‰ vrs V-SMOW for δ 2 H , with a mean of −2.3 and −7.0‰ vrs V-SMOW, respectively. The water in the Pra Basin originates from meteoric source. Groundwater has a relatively depleted isotopic signature compared to surface water due to the short residence time of infiltration within the extinction depth of evaporation in the vadose zone. Estimated evaporative losses in the catchment range from 51 to 77%, with a mean of 62% for surface water and from 55 to 61% with a mean of 57% for groundwater, respectively. Analysis of the stable isotope data and water level measurements suggests a potential hydraulic connection between surface water and groundwater. This hypothesis is supported by the fact that the isotopes of groundwater have comparatively lower values than surface water. Furthermore, the observation that the groundwater level remains constant in months with lower rainfall further supports this conclusion. The estimated annual groundwater recharge in the catchment ranges from 9 to 667 mm (average 165 mm) and accounts for 0.6% to 33.5% (average 10.7%) of mean annual precipitation. The total estimated mean recharge for the study catchment is 228 M m 3 , higher than the estimated total surface water use for the entire Pra Basin of 144 M m 3 for 2010, indicating vast groundwater potential. Overall, our study provides a novel insight into the recharge mechanism and spatial quantification of groundwater recharge, which can be used to constrain groundwater flow and hydrogeochemical evolution models, which are crucial for effective groundwater management within the framework of the Pra Basin’s Integrated Water Resources Management Plan.

1. Introduction

Estimating groundwater recharge and identifying its origin and recharge processes are required in managing groundwater systems. The Pra Basin hosts most of the valuable mineral deposits that partly drive Ghana’s economy. Recently, the basin has faced many water management challenges resulting from the excessive land degradation from illegal mining activities [1]. Most of the surface water the indigenous people once used for their water supply is polluted and no longer potable [1]. This situation has placed heightened pressure on the utilization of groundwater as an alternative water supply across the basin. Quantifying groundwater recharge and identifying its origin and recharge processes is supposed to provide a sustainable use of the resource [2].
Determining the sustainable yield of aquifers requires accurate information on groundwater recharge at both spatial and temporal scales in response to changing climatic conditions [2]. To properly characterize aquifer systems, several techniques for quantifying groundwater recharge as well as studying recharge processes, have been proposed. Most of these methods involve numerical simulations [3,4,5,6] and the application of natural tracers [2,7,8,9,10]. Afrifa et al. [2] emphasized that the most accurate groundwater recharge estimates can be obtained through a calibrated numerical groundwater flow model. However, these estimates are limited by the governing hypotheses and conditions, as well as the availability of adequate hydrogeological data [2]. A combined interpretation of stable isotope data and the groundwater recharge estimation using the classical Chloride Mass Balance (CMB) and Water Table Fluctuation (WTF) methods have been used here to develop a conceptual model for the groundwater system.
Stable isotopes of oxygen and hydrogen are key water constituents that can be used to determine groundwater origin [2,10], recharge processes [7,11], identify potential end-member mixing between aquifers and surface water bodies [11,12] and provide valuable information about hydrological systems at the local or regional scale [11]. However, isotopic data might not offer straightforward source interpretation due to the complexity of most hydrogeological systems. This is because there can be multiple end-member solutions, each with different isotopic enrichment, contributing to groundwater recharge along the flow path. The existence of these different sources further complicates the interpretation of the groundwater sources, which is based solely on isotope data [13]. Against this background, the interpretation of regional surface water and groundwater isotope data must take into account the prevailing climatic conditions as well as the surface and sub-surface processes.
In various geological terrains around the world, the CMB method has been employed to evaluate groundwater recharge [8,14,15,16,17]. The CMB method was postulated by Eriksson and Khunakasem [15], who used it to estimate groundwater recharge in the saturated zone of a coastal plain in Israel. Since then, several researchers in sub-Saharan Africa have adopted this technique to estimate groundwater recharge [8,18,19]. The approach runs on the hypothesis that the groundwater chloride concentration is mainly derived from atmospheric deposition and is conservative [20,21]. The method estimates groundwater recharge over a large temporal and spatial range, from one year to thousands of years and from a few metres to several kilometres [8].
The WTF method is used to quantify groundwater recharge by analyzing the rise in the water level [22]. This technique assumes that the groundwater level rise is exclusively a result of precipitation infiltrating the aquifer while disregarding other factors of the groundwater budget, such as lateral flows during recharge [23,24,25]. The method is most effective when applied to unconfined aquifers that exhibit rapid fluctuations in water levels over a relatively short period [24,25]. One key limitation of the WTF is the need for an accurate estimate of the specific yield of the geologic material in order to compute the recharge [23,26]. Several researchers have utilized the WTF technique to quantify groundwater recharge in various climatic and geological terrains across the world [2,23,24,25,26]. The widespread use of the WTF method stems from the fact that groundwater level data is easy to collect and recharge rates can be easily estimated based on temporal or spatial variations in water levels [25]. It has been proposed that the WTF’s recharge estimate is more accurate than estimates derived from other alternative methods [23].
In this paper, we used the stable isotopes as a proxy to assess groundwater origin and potential recharge processes, including quantifying the evaporative losses of surface water and groundwater prior to recharge. In addition, the CMB and WTF methods are used to provide estimates of groundwater recharge in the basin. A Fifty-year precipitation and temperature record is also examined to learn about changes in climatology and variability of the climate and its impacts on the water resources. The results obtained from this study will be crucial in conceptualizing the basin’s hydrogeological and hydrochemical framework, which are currently not well-studied.

2. Materials and Methods

2.1. Study Area

Our investigation focuses on the Birim and the main Pra sub-catchments, which lie between 5° N and 6°44 18.30 N, and 0°20 7.8 W, and 1°52 26.50 W in the Pra Basin of Ghana (Figure 1). The total land area is about 10,703 km 2 . Both rivers originate in the highlands of Ghana’s Kwahu Mountain Range in the Eastern Region and flow approximately 240 km south into the ocean [27]. Further information on the physical setting can be found in Manu et al. [28].
The northern zone of the area is characterized by relatively high elevations, reaching 800 m above mean sea level, while the southern areas are relatively flat, with elevations down to 0 m (Figure 2). The vegetation is a moist deciduous forest type with isolated reserves. Three air masses, including monsoon, equatorial and northeast trade winds, drive the region’s climate [29]. According to Kankam-Yeboah et al. [29], the region can be classified as a humid semi-equatorial climate with bimodal rainfall peaking in May/June and September/October. The average yearly rainfall is 1500 mm and ranges from 1300 to 1900 mm [27,30]. In most months, potential evapotranspiration (PET) surpasses precipitation, averaging 1650 mm [29]. The basin is generally warm and moist, with an annual relative humidity between 70% and 80% [27]. The mean temperature is 28 °C with minimum and maximum values of 26 °C and 32 °C [30].
The geology consists primarily of Birimian meta-sediments and the Cape Coast granitoid (Figure 1). These rocks are crystalline and typically lack primary porosity [31]. However, secondary porosities have developed due to compressional and tensional activities during regional tectonic processes. Given this, groundwater in the area is governed by secondary structures in the form of fractures, shears and faults. Notably, the Birimian meta-sediments exhibit a substantial weathered zone between these two rock formations, ranging from 90 to 120 m [32]. This weathered zone is characterized by significantly higher permeability than the massive granitoids. Investigations have shown that the most productive groundwater zones in the Birimian are the layer between the lower part of the saprolite and the upper part of the saprock [32]. This aquifer zone complements the fracture zone aquifer within the bedrock and is an important water source for domestic and agricultural uses. For the granitoids, the weathered zone has a thickness ranging from 20 to 80 m [33]. It is worth mentioning that most of the groundwater wells were drilled for domestic purposes and that the total depths of the wells are determined when sufficient water is obtained. Given this, the reported borehole depths may not have penetrated the entire aquifer in the terrain. Nonetheless, studies by Banoeng-Yakubo et al. [31] revealed that the depths of boreholes in the Birimian formation generally range from 35 to 62 m with an average of 42 m. In contrast, boreholes in the granitoid formation typically range from 35 to 55 m in depth, with an average of 50 m [34]. According to Banoeng-Yakubo et al. [31], the rocks’ water-yielding capacity depends on the secondary permeabilities. In the terrain, Borehole yield is variable, ranging from 8 to 360 lpm in the Birimian formation and from 12 to 150 lpm in the granitoids [35,36]. Between the two rock types, the Birimian has a higher groundwater-yielding potential than the granitoid due to differences in secondary permeabilities.

2.2. Data Collection and Analysis

In this study, a total of 90 water samples were collected from boreholes and rivers (Figure 2). The sampling campaign was conducted in March 2020 and marked the beginning of the first wet season in the study region. The water samples were analyzed for their δ 18 O and δ 2 H isotope ratios using the Picarro L-2140i Ringdown Spectrometer. All the measurements are presented in permille (‰) relative to the Vienna Standard Mean Ocean Water 2 Standard (V-SMOW2). The analytical accuracy of the instrument is ±0.19‰ for δ 18 O , and ±0.49‰ for δ 2 H , respectively. The measurement uncertainty was assessed by conducting ten repeated analyzes with international reference materials SLAP2 and V-SMOW2. In addition, the instrument’s performance was verified against an international laboratory standard. The stable isotope ratios’ concentrations were then calculated using Equation (1):
δ = R sample R std R std · 1000
where Rsample and Rstd are the stable isotopic ratios of oxygen and deuterium of the water samples and the standard concentration, respectively. The chloride concentrations in groundwater and precipitation were taken from Manu et al. [1] and Duah et al. [14], respectively. Bivariate plots were used to construct surface water and groundwater regression lines using the δ 18 O vs. δ 2 H plot. The water samples’ isotopic composition was interpreted considering the local and the global meteoric water lines established by Akiti [37] and Craig [38], respectively.
Total precipitation amounts and minimum and maximum temperature data from 1964 to 2013 were acquired from Princeton University’s land surface modelling group. The data have been bias-corrected and down-scaled according to the observation-based global forcing dataset of Sheffield et al. [39]. A total of 14 observation stations distributed evenly across the basin were used for the analysis. Ten rain gauges were installed at or near the locations of the wells being monitored to measure daily precipitation and temperature (minimum and maximum).

2.3. Quantification of Evaporation Losses of Sampled Water

This study used the isotopic signature of the precipitation that recharged the sampled surface and groundwater and the annual average humidity and temperature of the prevailing climatic conditions to estimate the evaporation rate of these two water sources. The procedure used in the calculation is akin to the model proposed by Craig and Gordon [40]. For a detailed step-wise approach, refer to Fellman et al. [41]. The fraction of water loss through evaporation can be quantified using the equation reformulated by Gibson and Reid [42] for a non-steady-state condition and adopted by several authors [11,43,44], as shown in Equation (2):
f = 1 δ L δ * δ P δ * 1 m
where δ L and δ P indicate the initial signatures of δ 18 O and δ 2 H ratios of the sampled surface water and groundwater, respectively. The indices m and δ * are estimated from Equations (3) and (4) respectively [11,42,44,45,46]:
m = ( h ϵ 1000 ) ( 1 h + ϵ k 1000 )
δ * = ( h δ A + ϵ ) ( h ϵ 1000 )
where h represents the basin’s mean relative humidity, δ A represents the stable δ 18 O and δ 2 H ratios for the ambient air/vapor, ϵ k is the kinetic isotopic fractionation factor, which is linked to the relative humidity between water (w) and vapor (v) for 18 O and 2 H , estimated using Equations (5) and (6), respectively:
ϵ k 18 O w v = 14.2 ( 1 h )
ϵ k 2 H w v = 12.5 ( 1 h )
ϵ k 18 O w v and ϵ k 2 H w v were estimated at 4.3 and 3.8, respectively, by adopting a local humidity of 70% [47]. The total isotopic enrichment factor, ϵ [48] is calculated using Equation (7):
ϵ = ϵ eq + ϵ k
where ϵ eq is expressed as ϵ eq = 1000 ( 1 α 1 w v ), which is a function of temperature (in Kelvin) expressed for δ 18 O by Equation (8) [11,43]:
10 10 l n α 18 O w v = 1.534 × 10 6 T 2 3.206 × 10 3 T + 2.644
Using a mean yearly temperature of 298.15 K, the kinetic fractionation factor ( ϵ k ) was calculated to be 9.11‰ vrs V-SMOW, resulting in a fractionation enrichment factor (f) of −13.37‰ vrs V-SMOW [43].
Determining the isotopic signature of ambient air moisture ( δ A ) can be a daunting task since it is seldom directly measured in field settings. Typically, it is estimated based on the initial isotopic composition of recent rainfall. It’s crucial to emphasize that the isotopic composition of ambient air can undergo notable variations at various heights above a surface water body [49]. According to the proposal by Peng et al. [50], an isotopic equilibrium exists between the isotopic signature of the initial precipitation δ A and the ambient air vapor δ IP which is expressed by Equation (9):
δ A δ IP 10 3 ( α w v 1 )
where α w v is the fractionation factor. For the estimation, we adopted the initial isotopic signature of rainwater, which was sampled in April 2012 around the Lake Bosumtwi area from Loh et al. [43] and returned a value of −12.40‰vrs V-SMOW for δ 18 O .

2.4. Groundwater Recharge Estimation Using CMB Method

The CMB method relies on the mass balance principle to estimate groundwater recharge using precipitation and groundwater chloride data [8]. The basic assumptions guiding the application of the CMB method are as follows: (1) the unsaturated zone has no Cl in storage; (2) in groundwater it is derived primarily from precipitation and dry atmospheric deposition; (3) its concentration in surface water is the same as in the precipitation and (4) the depth of groundwater is large enough that seasonal variation is regarded as small [8,21].
Considering steady-state equilibrium conditions with advection as the dominant Cl transport in the system and disregarding other sources such as dry atmospheric deposition and human activities like irrigation and animal watering [8], the recharge to groundwater is thus calculated using Equation (10):
R = P · Cl p Cl gw
where R denotes the total estimated recharge (mm), P is the long-term average precipitation (mm), Cl p and Cl gw are the precipitation and groundwater chloride concentration measured in mg/L, respectively [8]. In the calculation, we utilized the average annual precipitation of 1500 mm as reported by Dickson et al. [51]. In addition, the average chloride concentration in precipitation (1.13 mg/L) was taken from Duah et al. [14], which was estimated using records from meteorological stations in the adjacent Densu Basin. The chloride concentration in groundwater was obtained from 56 samples collected by ourselves [28].
The calculated recharge values were further interpolated using the inverse distance weighting (IDW) method to determine the spatial distribution of groundwater recharge. Mainly because of data paucity, a simple interpolation scheme, IDW was chosen instead of interpolation schemes that assume a statistical correlation between the data points

2.5. Groundwater Recharge Estimation Using Water Table Fluctuation Method

The WTF method entails tracking and measuring changes in groundwater levels over time, often months to a year. In this investigation, data logger were installed in ten boreholes in August 2020 to record and store data on water level fluctuations every four hours. In addition, four wells had barometer data recorders installed to track air pressure, and this information was used for correction. The information about the location and geological formation for the monitored wells are shown in Table 1.
The WTF approach assumes that the rise in the groundwater table over a period of time is driven solely by groundwater recharge and that it is directly related to the aquifer’s specific yield [22]. Groundwater recharge can thus be estimated using Equation (11):
R = S y · Δ h Δ t
where R designate the recharge amount from precipitation, S y represents the specific yield, (Δh) is the head difference throughout the recharge period and (Δt) is the time duration of the recharge. For each monitoring well, the graphical extrapolation approach was used to approximate the increase in water level (Δh). We examined the water level data visually and manually stretched the recession curve. The rise in the water level during the recharge phase is determined by the difference between the lowest point on the extrapolated antecedent recession curve and the peak of the water rise [23]. More information regarding the use of the WTF method is well explained in Delin et al. [22].
As there are currently no records of specific yield for the aquifer materials in the basin, it was adopted from the literature (Table 2) [52]. The values were adopted using the geologic material of the area’s aquifers, which was primarily granite and meta-sediments (Table 2) [52]. With this in mind, we used specific yield (Sy) values of 0.02 in the range of 0.01 to 0.03 for weathered phyllite, schist and associated rocks, 0.02 in the range of 0.02–0.04 for granite and 0.05 in the range of 0.01–0.08 for sandstone [52], respectively.

3. Results

3.1. Climatology of Precipitation and Temperature in the Pra Basin

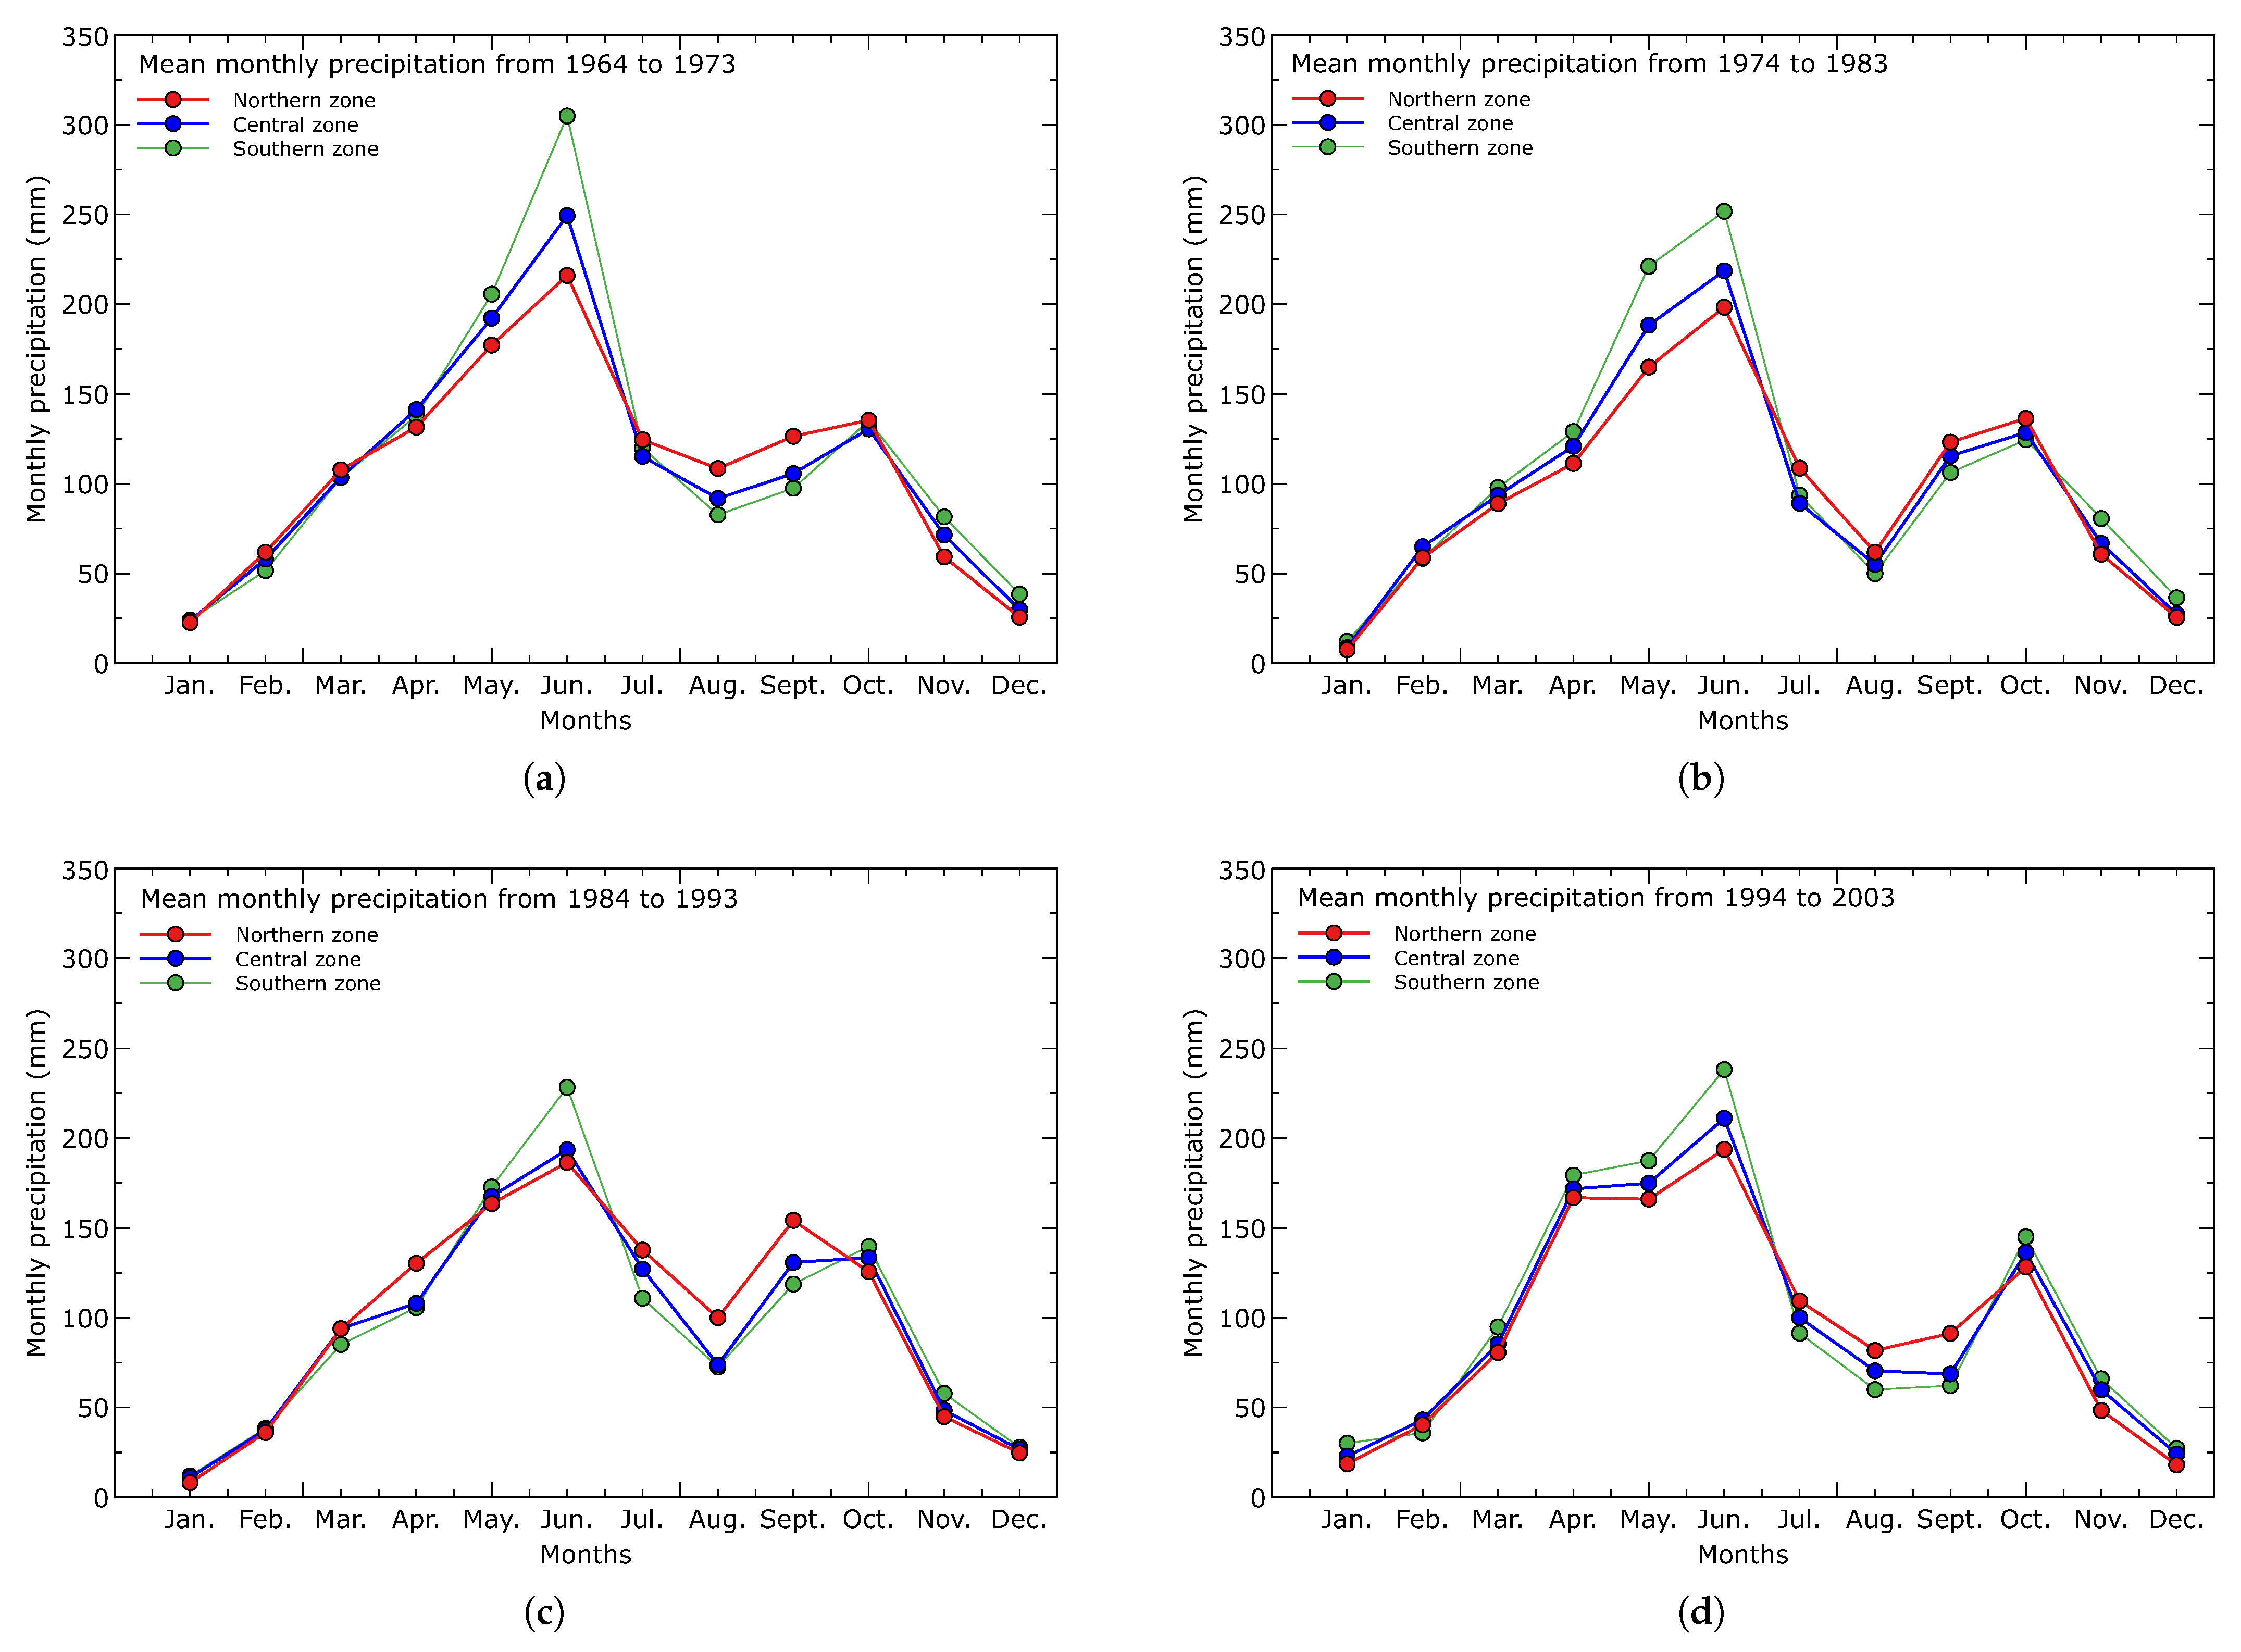
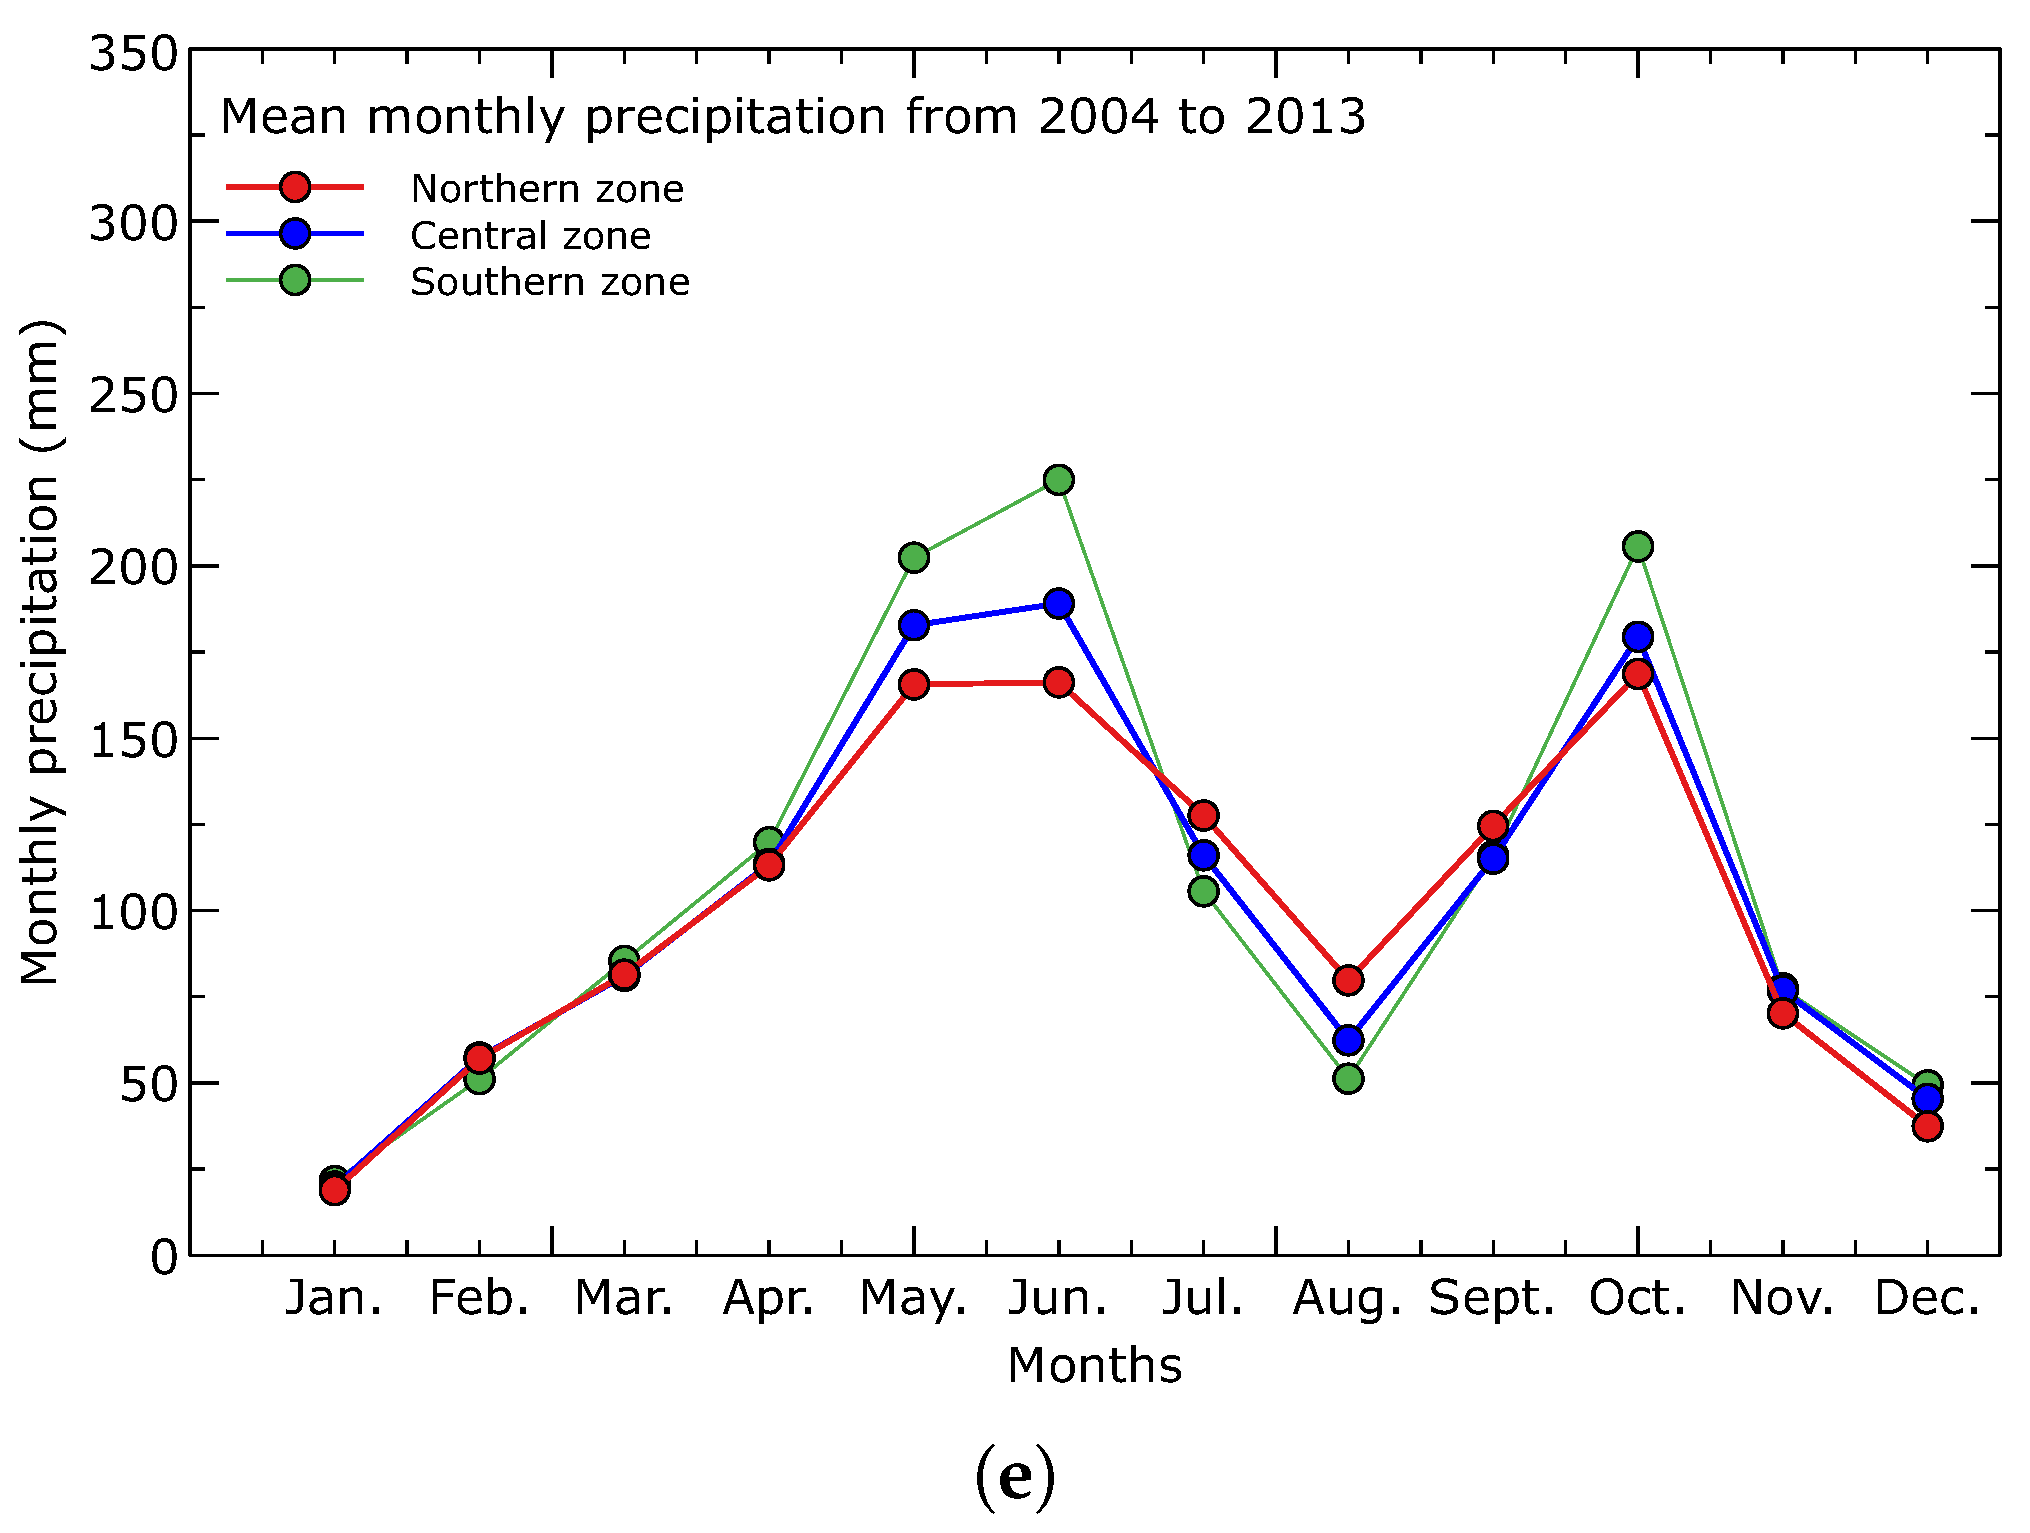
Figure 3a,b displays decadal mean monthly precipitation and temperature for the past 50 years. The bimodal precipitation pattern remains visible in the precipitation climatology (Figure 3a). The wet season has two halves, the first of which starts in March and peaks in June, and the second in September and peaks in October. However, analysis of the decadal variability in precipitation patterns reveals a decrease in the precipitation amount at the peak of the first wet season and an increase during the second wet period.
According to our observations, the second half of the wet season has gotten noticeably wetter in the past decade compared to the previous four decades. The first decade, between 1964 and 1973, recorded the highest peak of the first wet season, with a mean precipitation of 257 mm, while the last decade, between 2004 and 2013, recorded the lowest peak, with a mean of 193 mm. The second wet season’s highest peak, with an average rainfall of 184 mm, occurred between 2004 and 2013. The mean monthly precipitation for the past decades for the three zones (northern, central and southern) are shown in Figure A1 (Appendix A). Analysis of extreme precipitation events reveals that the southern zone, located closer to the sea, experiences higher precipitation amounts, particularly in June, which gradually decreases towards the northern part of the basin. Conversely, during the first dry period from July to September, the northern zone exhibits relatively higher precipitation than the central and southern parts.
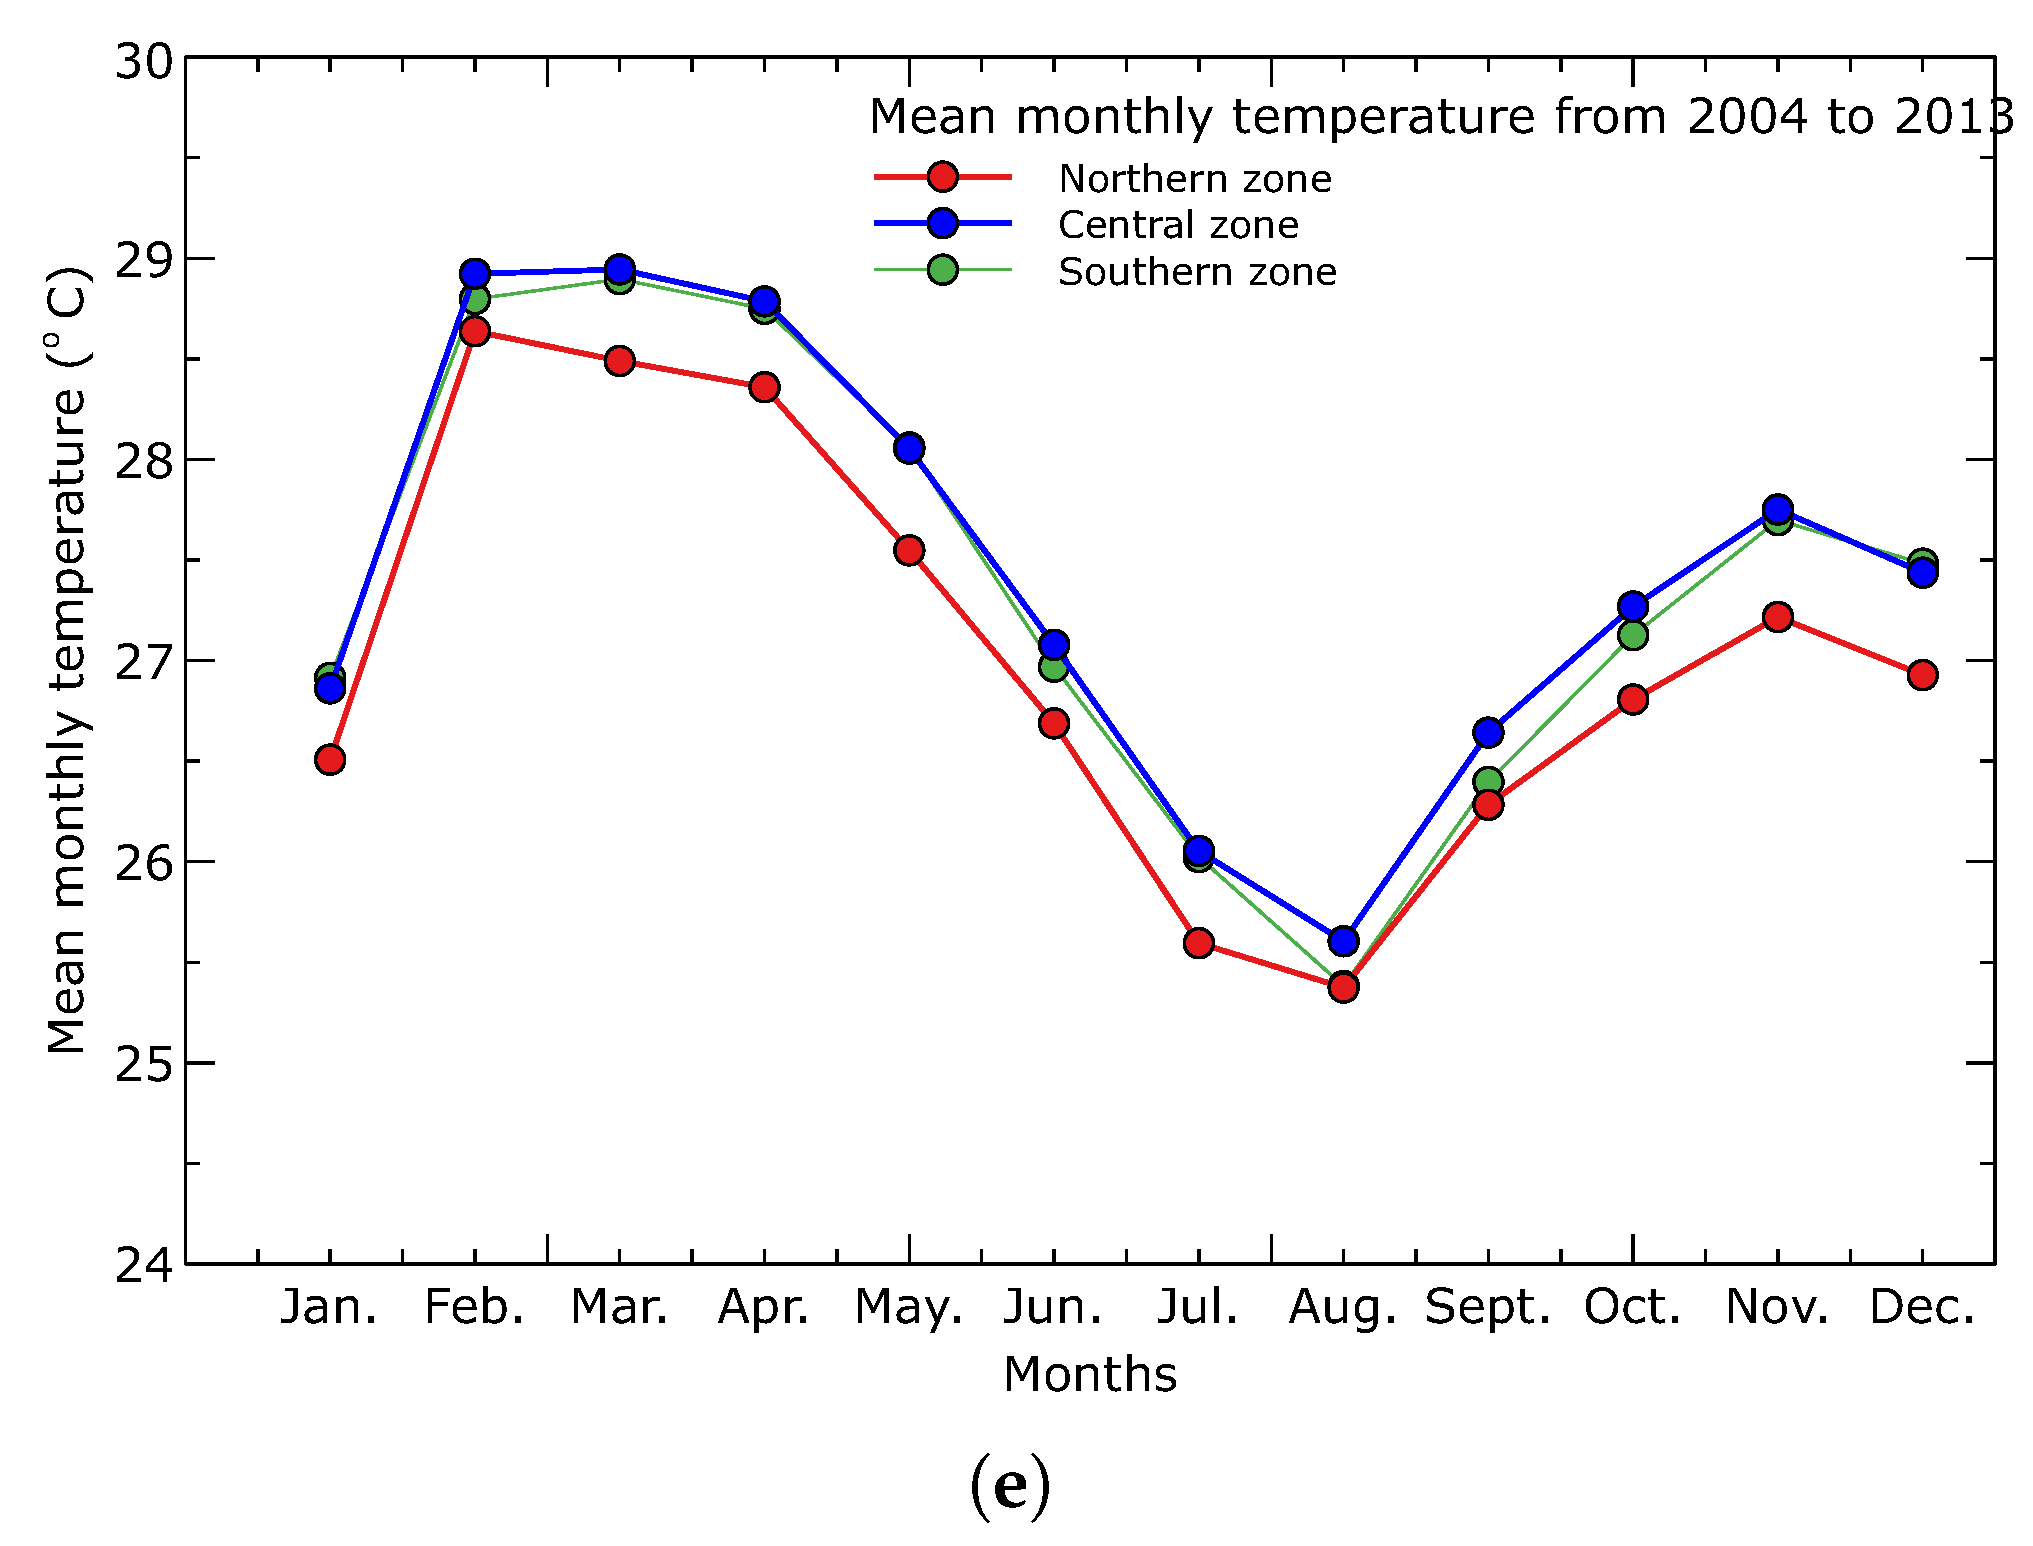
We discovered that the mean monthly temperatures in the basin have been rising over the past 50 years (Figure 3b). The bimodal pattern of the basin’s temperature climatology has not changed. In the months of February and November, two peaks are visible. In the most recent ten years, between 2004 and 2013, February had the highest temperatures, with an average monthly value for the season of 28.8 °C, while the average monthly value for the second season was 27.54 °C. Generally, the wet season records the lowest temperatures, while the dry season records the highest. The temperature variations in the three zones are shown in Figure A2 (Appendix A) and show the trend from the northern topographically high to the southern topographically low of the region. Across all five decades, temperatures are highest in the lowlands and lowest in the highlands.

3.2. Variability in Surface Water and Groundwater δ 18 O and δ 2 H Values

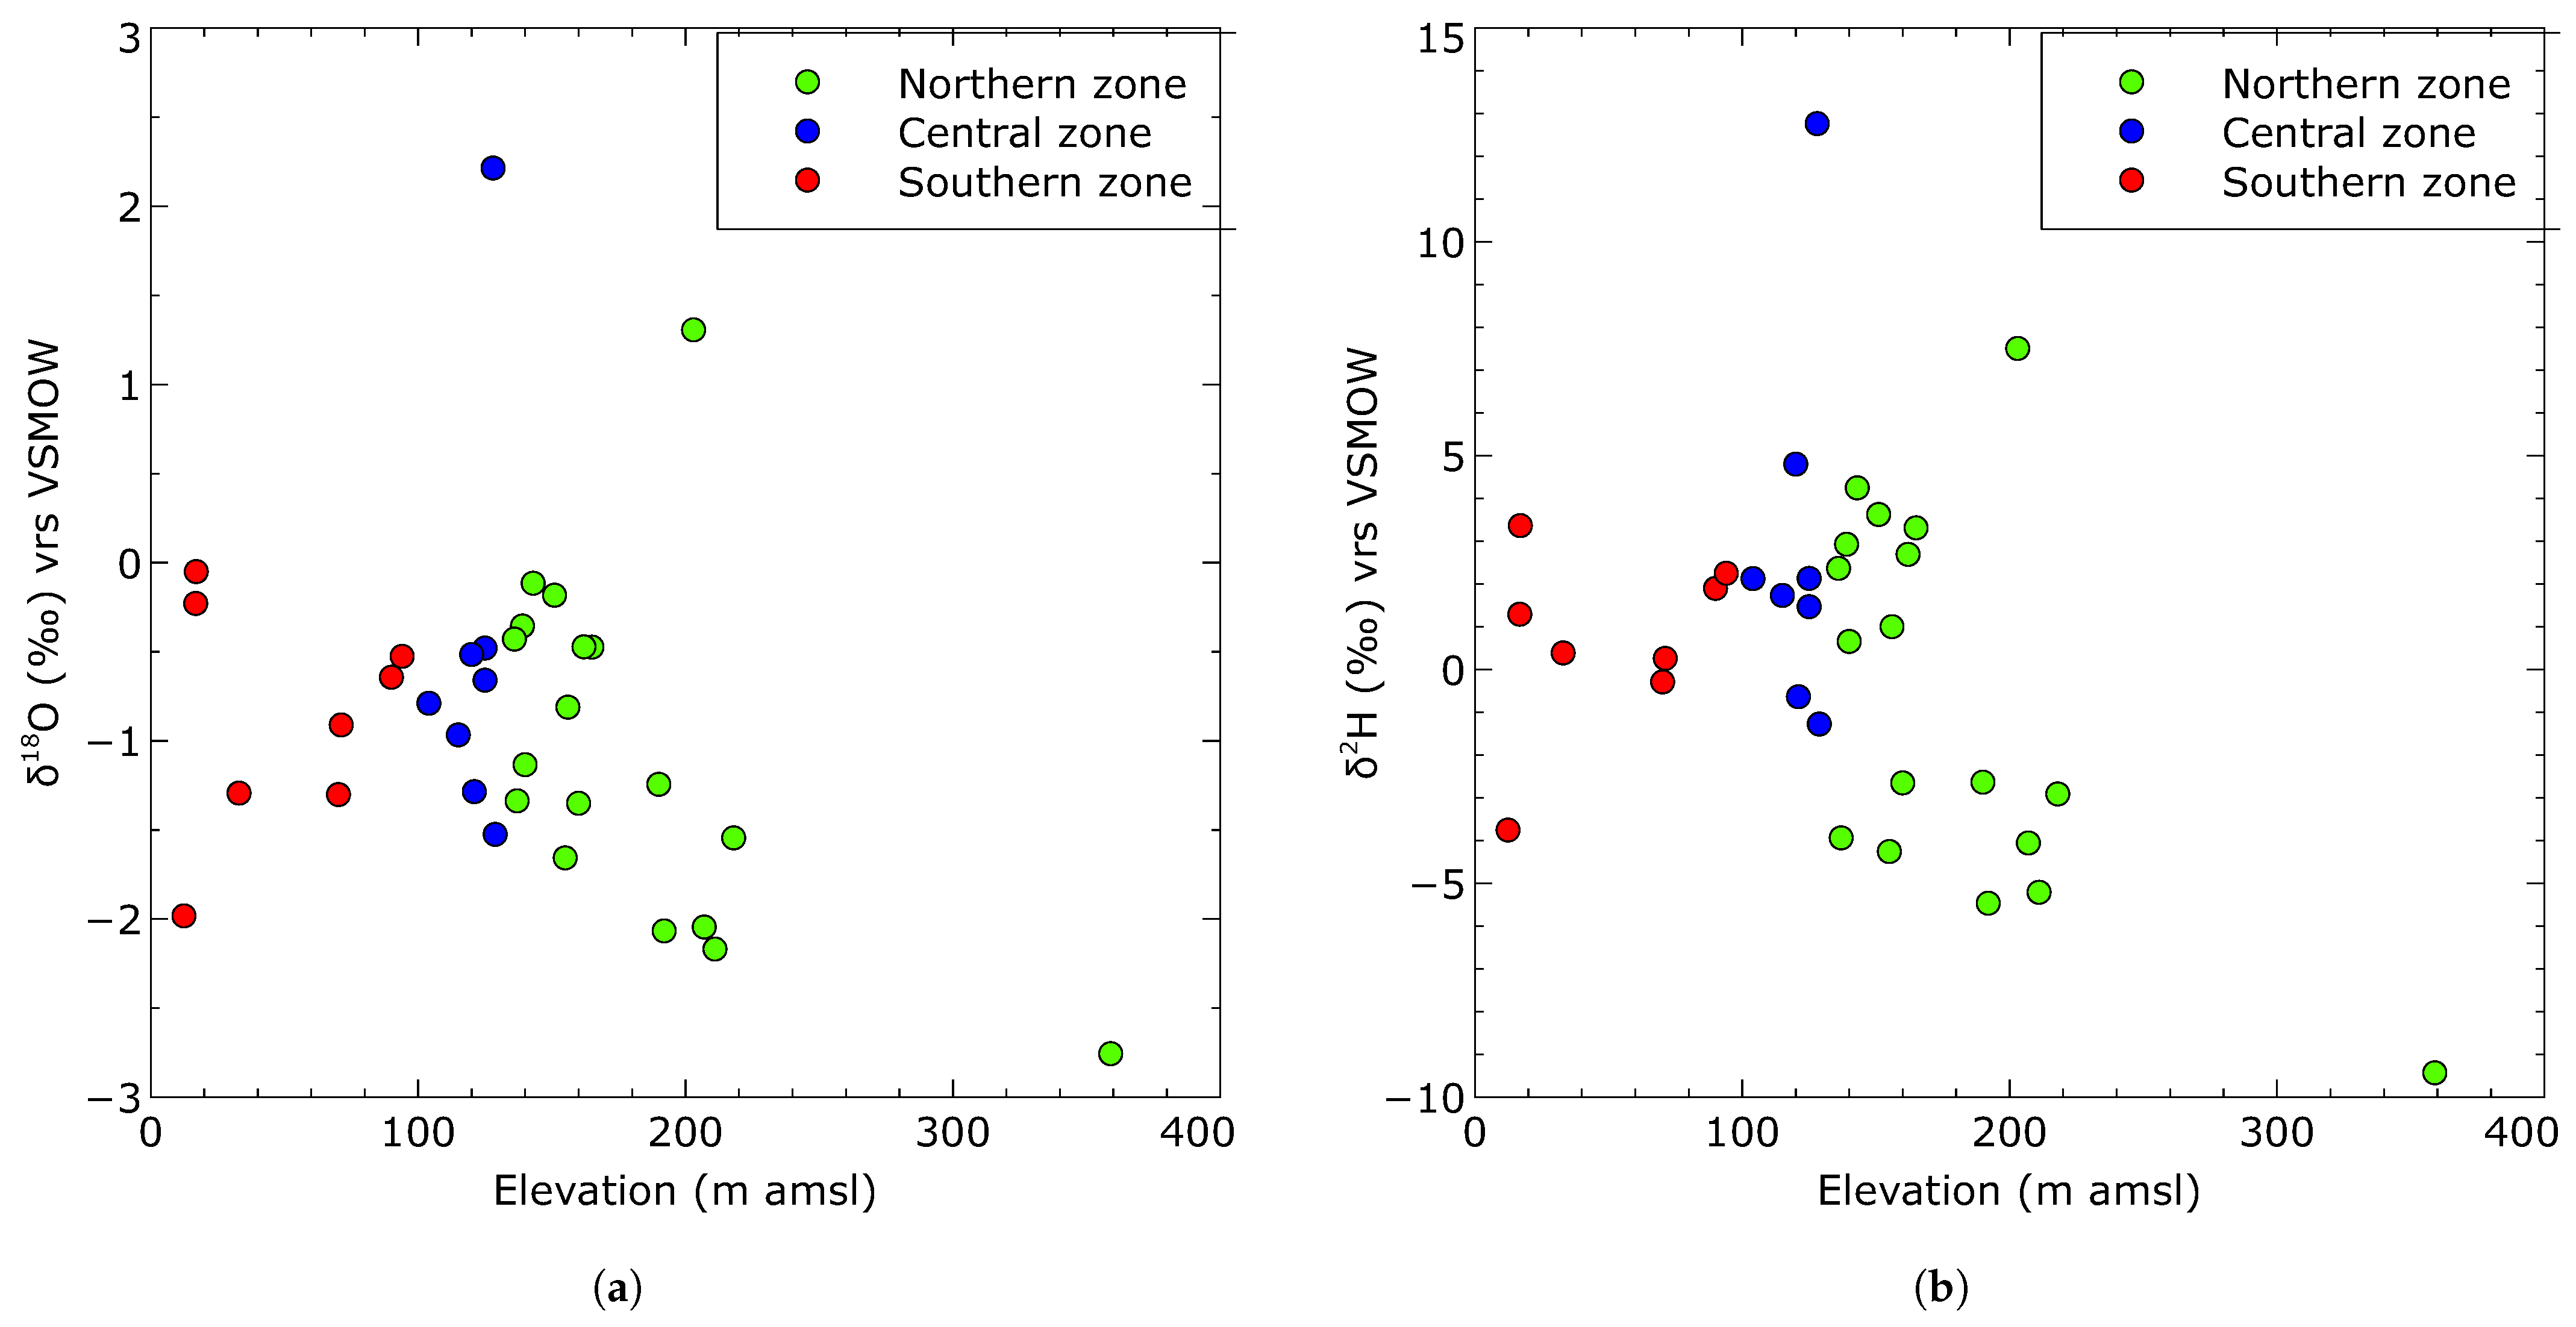
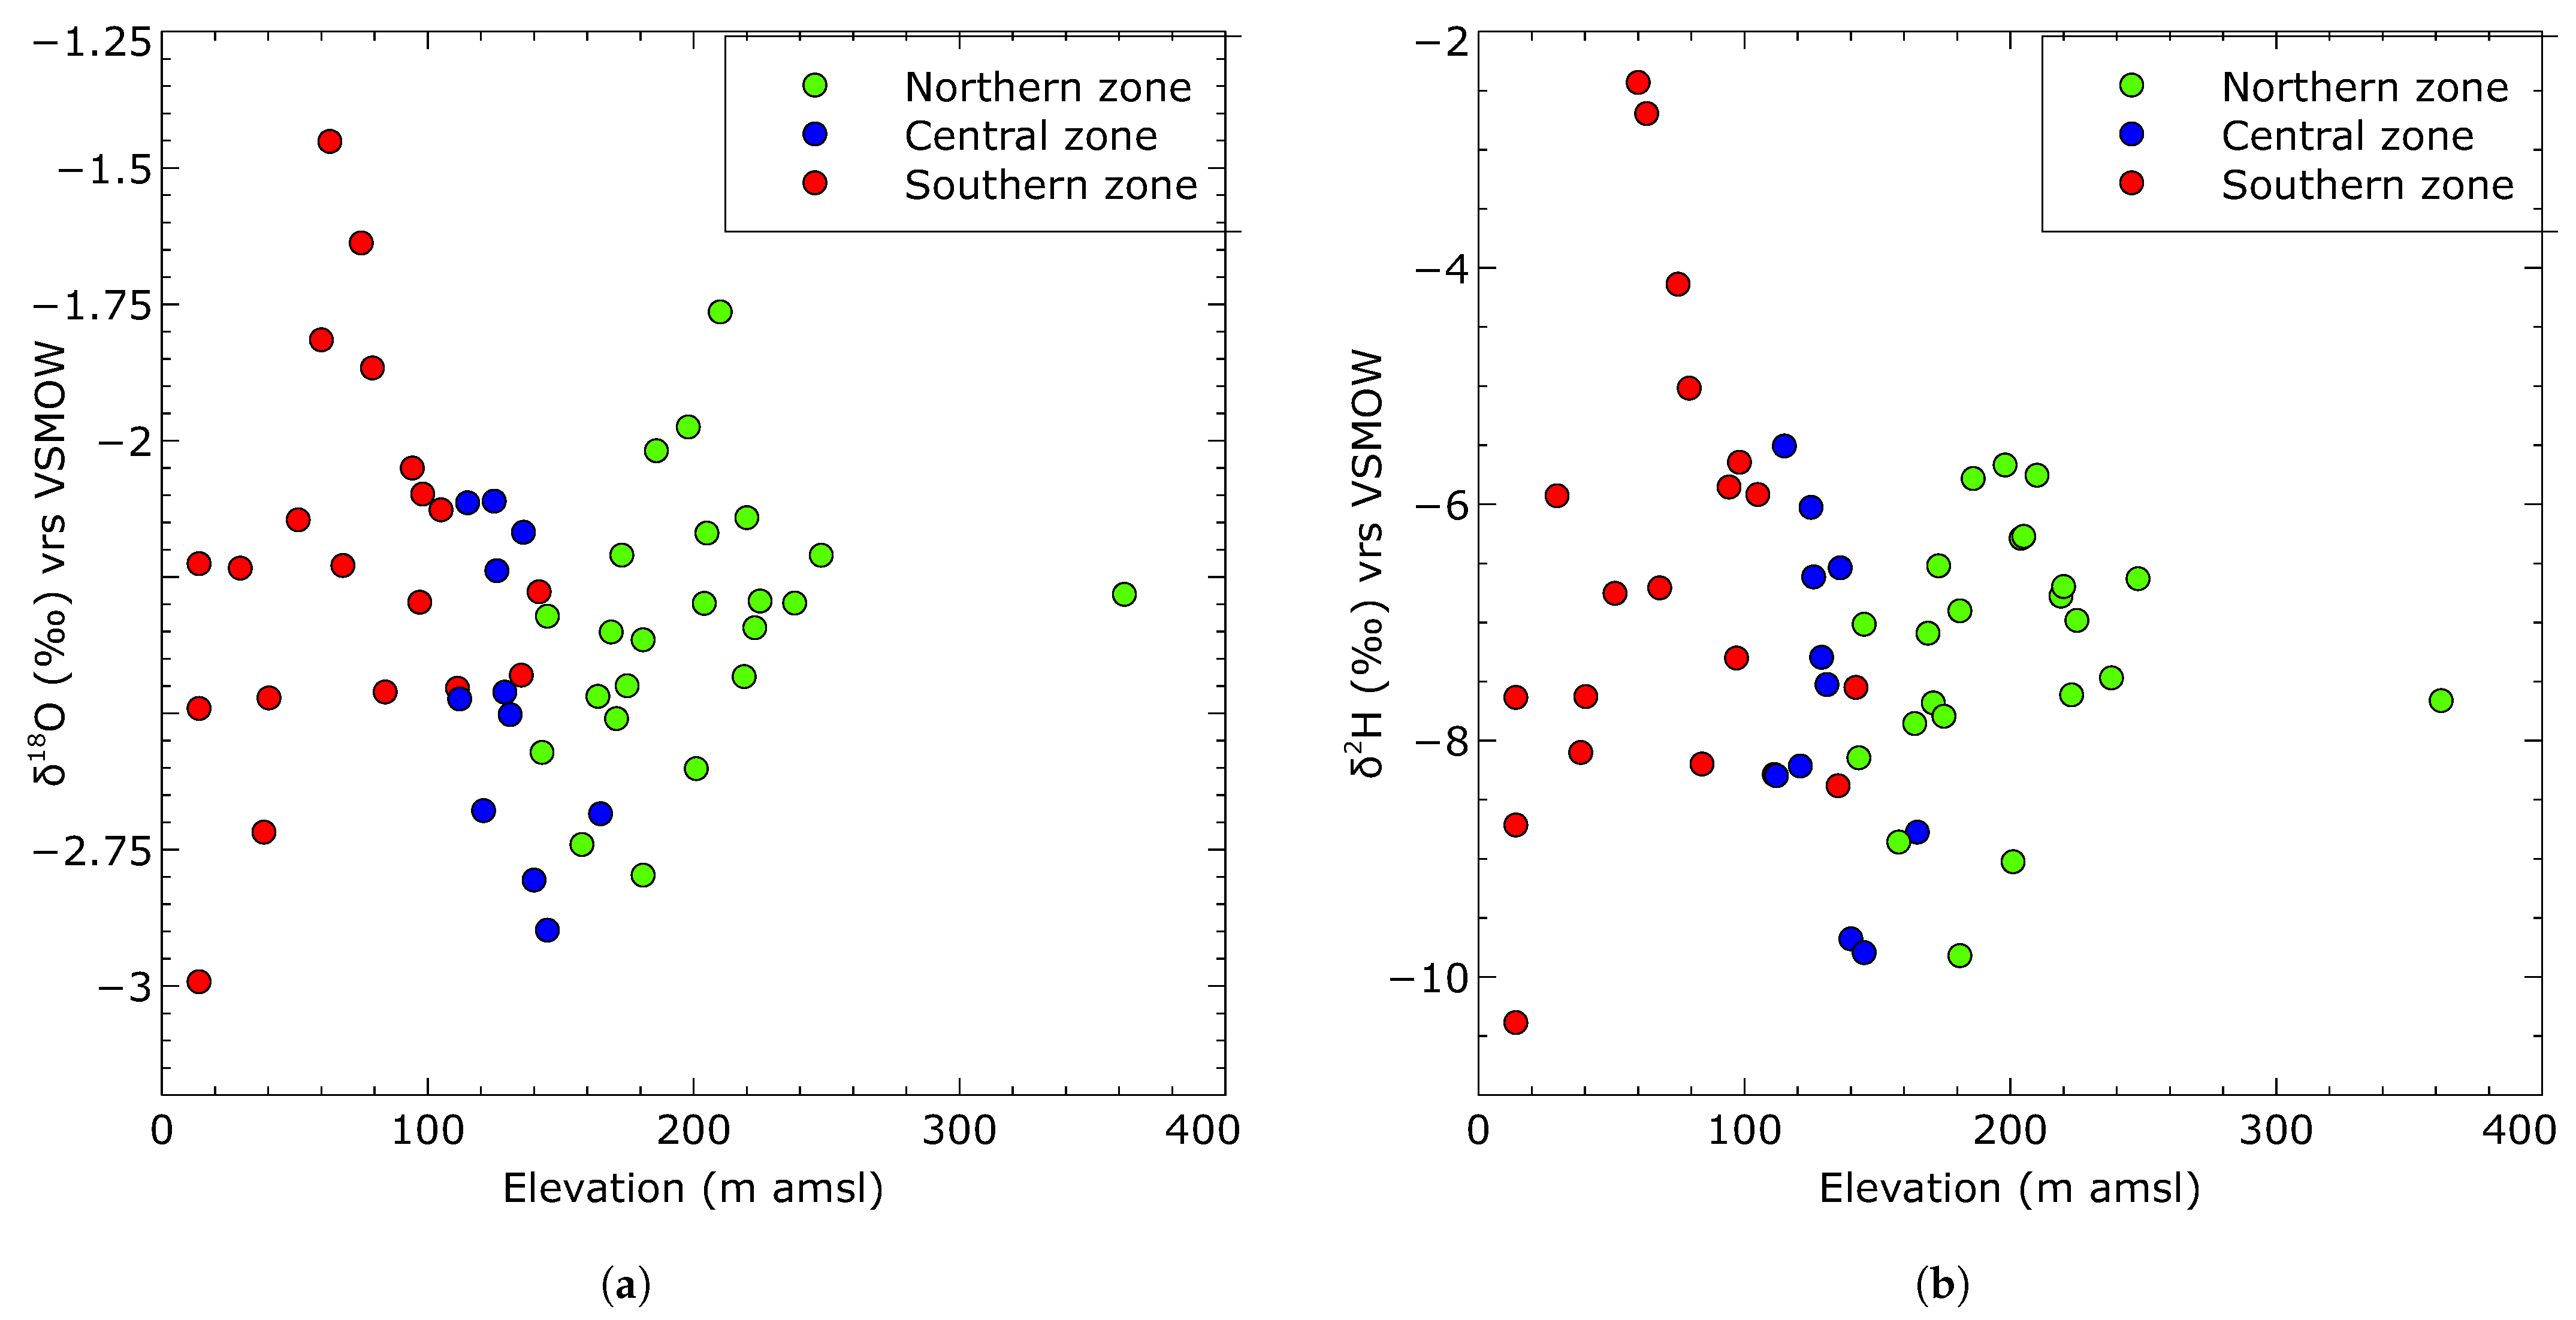
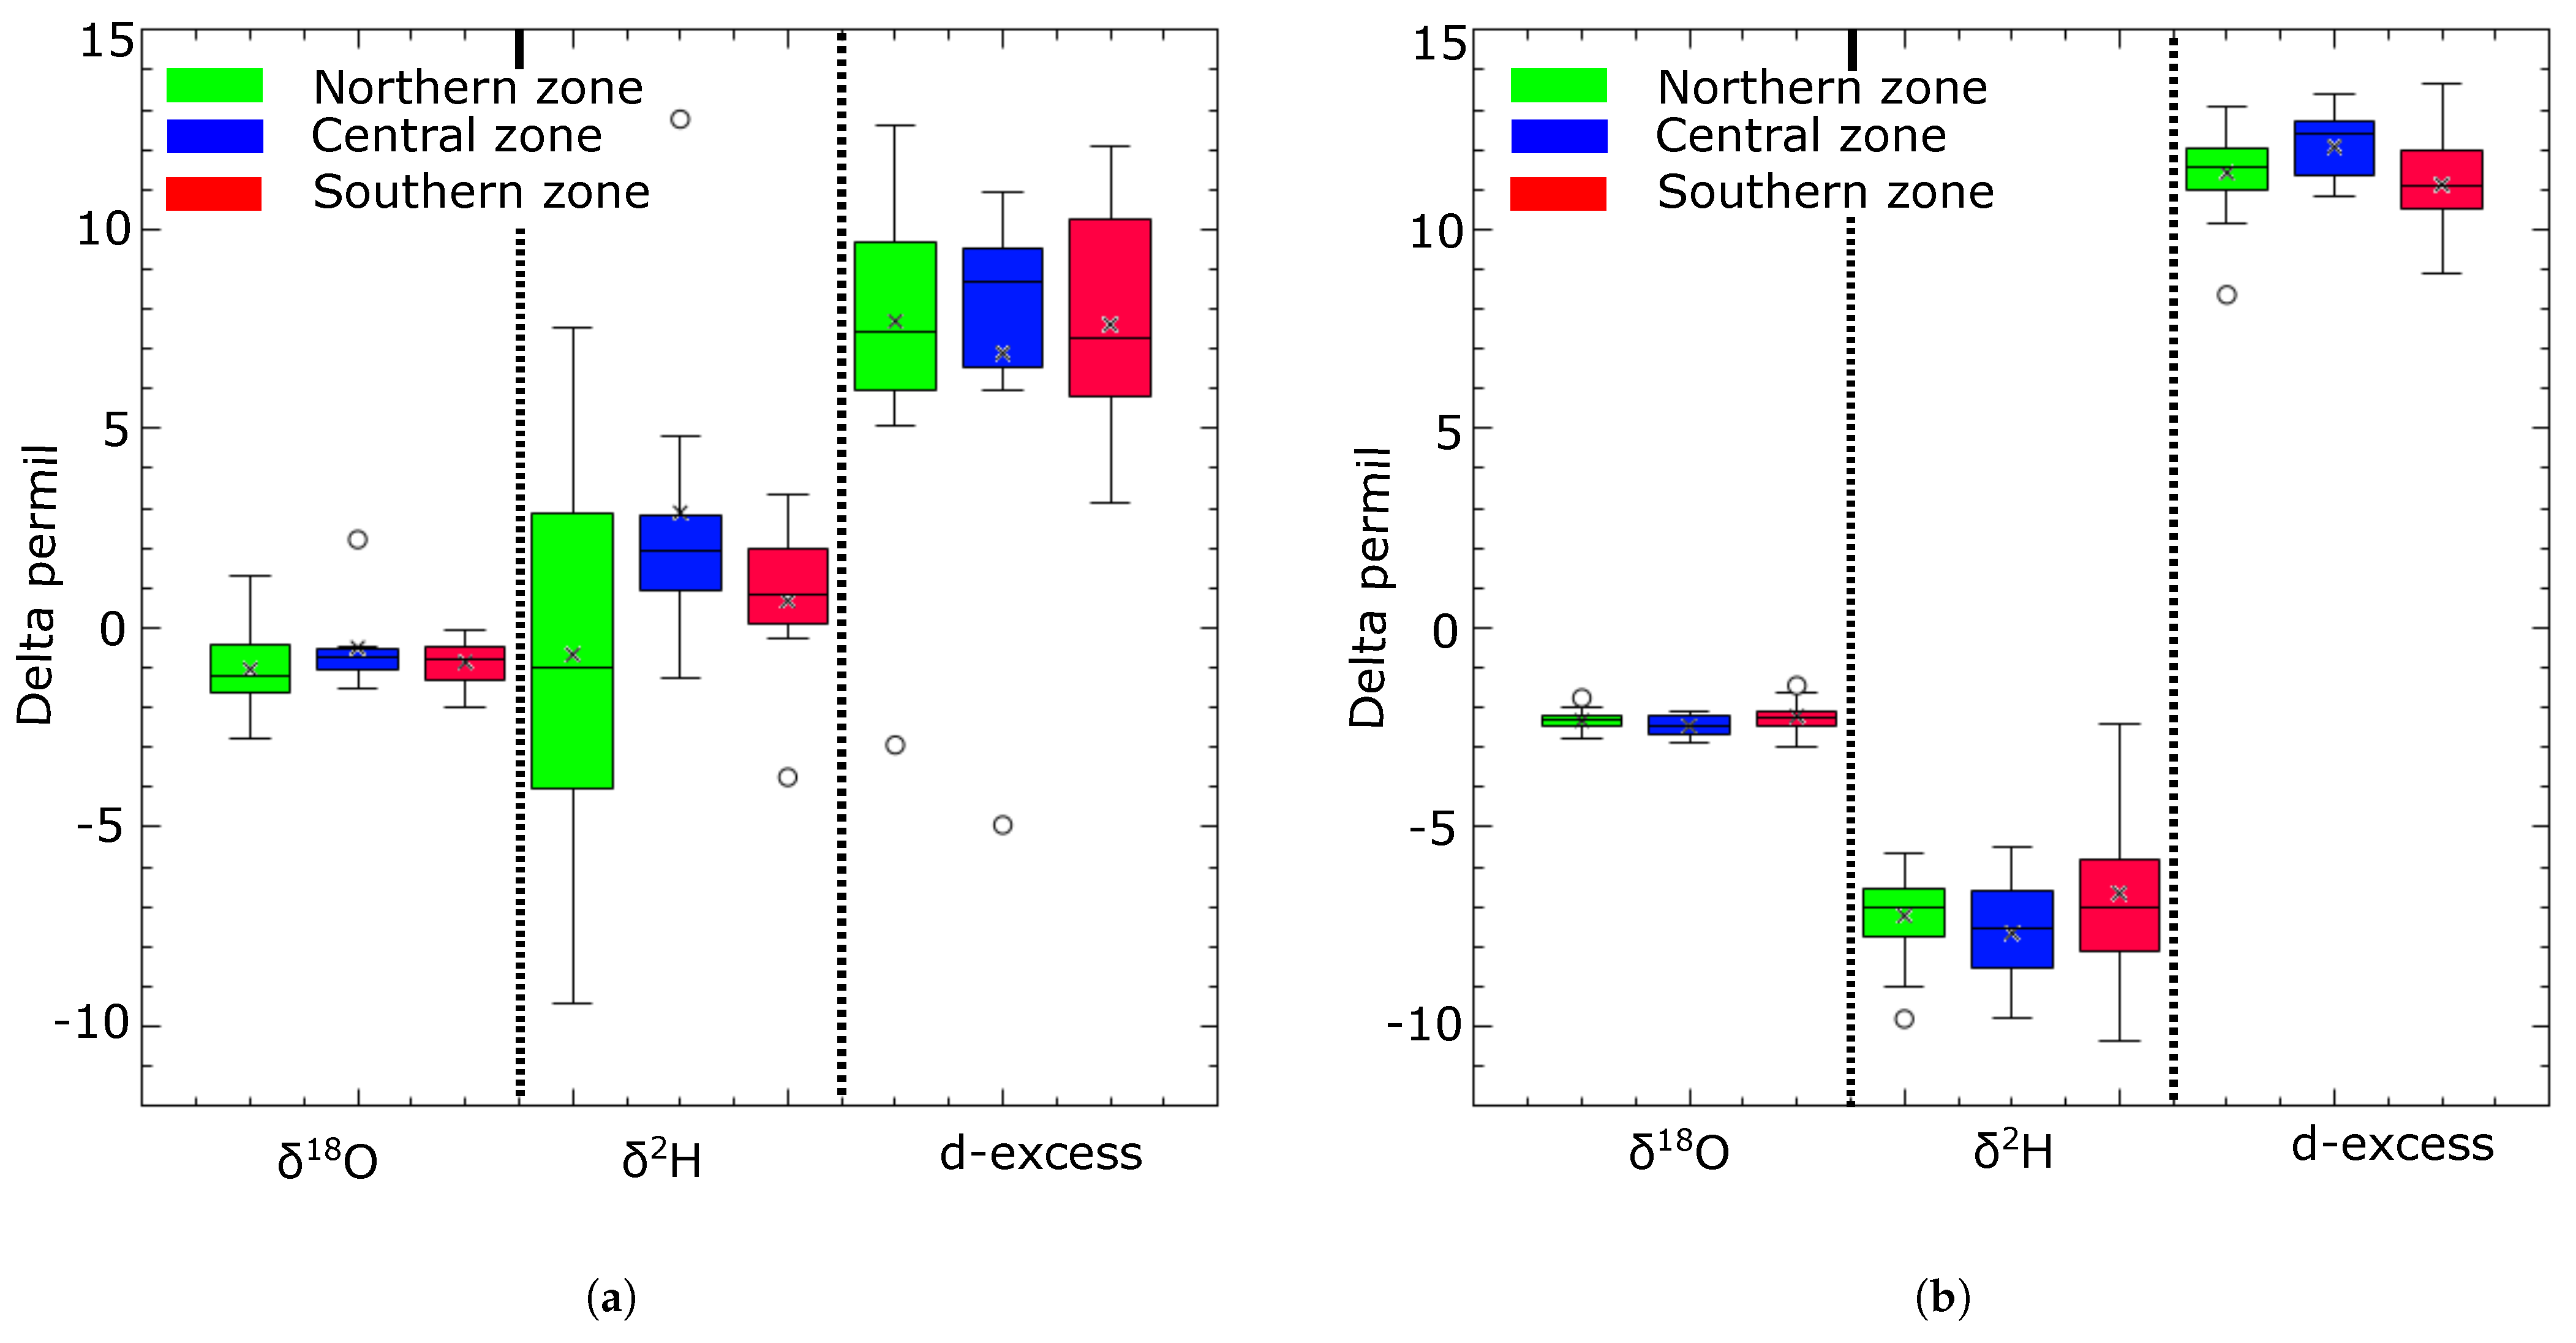
Surface water (Figure 4a) shows large variability in stable isotopic composition. The δ 18 O and δ 2 H ratios in surface water samples range from −2.8 to 2.2‰ vrs V-SMOW for δ 18 O and from −9.4 to 12.8‰ vrs V-SMOW for δ 2 H , with a mean of −0.9‰ vrs V-SMOW and 0.5‰ vrs V-SMOW, respectively. The deuterium excess (d-excess) is between −5.0‰ vrs V-SMOW and 12.6‰ vrs V-SMOW, with a mean of 7.5‰ vrs V-SMOW. The δ 2 H values show the largest variability in the dataset and this occurs in the northern zone. There are no significant variations in the mean isotopic composition of the stable O-18 isotope ratios in the northern zones. The computed d-excess values exhibit a relatively consistent level of variability across the three zones. When plotting stable isotopes against elevation (see Figure A3a in Appendix A), no distinct correlation is observed. Nonetheless, the sample taken from the Apapaw River, which serves as the source of the Birim River and is located at a higher elevation, displays a notably depleted isotopic composition.
Groundwater (Figure 4b) shows much less variability in the stable isotopes compared to the surface water. The δ 18 O and δ 2 H isotope ratios in groundwater range from −3.0 to −1.5‰ vrs V-SMOW and from −10.4 to −2.4‰ vrs V-SMOW with an estimated mean of −2.3‰ vrs V-SMOW and −7.0‰ vrs V-SMOW, respectively. The d-excess ranges from 8.3 to 13.6‰ vrs V-SMOW, with a mean of 11.4‰ vrs V-SMOW. The δ 18 O values are generally enriched relative to δ 2 H values in all the three zones. The groundwater exhibits a higher d-excess compared to the surface water. Figure 5 is a contour map displaying the distribution of δ 18 O and δ 2 H values in the Pra Basin groundwater. A plot of the stable isotopes against the elevation (see Figure A3b in Appendix A) show no positive correlation.

3.3. Correlation between δ 18 O and δ 2 H of Water

The initial isotopic compositions of the precipitation that recharged the surface water and groundwater are estimated to be −2.6‰ vrs V-SMOW ( δ 18 O ) and −6.4‰ vrs V-SMOW ( δ 2 H ) and −3.1‰ vrs V-SMOW ( δ 18 O ) and −10.8‰ vrs V-SMOW ( δ 2 H ), respectively. These values are determined by the intersection of the evaporation lines of surface water and groundwater on the local meteoric water line (LMWL). Notably, these values indicate significant depletion compared to the measured isotopic signatures of surface water and groundwater. Figure 6a shows the linear regression models for the relationships between δ 18 O and δ 2 H for the water samples. Notably, the positions of the water samples are to the right of the LMWL, with surface waters showing the largest deviation from the initial isotopic composition. The regression analysis of the two water sources shows lower slope and intercept values compared to the LMWL. The calculated d-excess of all the water samples is lower than that of the LMWL. The surface water samples show a lower d-excess compared to the groundwater. Figure 6b illustrates the relationship between d-excess and δ 18 O for surface water and groundwater. The Cl and δ 2 H relationship depicted in Figure 7 does not exhibit a distinct influence of isotopic processes like evaporation, mixing, or transpiration on the groundwater. In general, both surface water and groundwater stable isotopes have undergone substantial alterations, enriching the heavier isotopes in contrast to their initial isotopic composition.

3.4. Estimations of the Rate of Evaporation in Surface Water and Groundwater

Surface water experiences higher rates of evaporation compared to groundwater. The calculated regional evaporation rates for surface water vary between 51% and 77%, averaging 62%, while for groundwater, it range from 55% to 61%, with an average of 57%. No significant disparities in mean evaporation rates were observed among the northern, central, and southern zones for groundwater. However, for surface water, there are slight variations in mean evaporation rates across these zones, specifically recording values of 61%, 64%, and 62% for the northern, central, and southern zones, respectively. An analysis of evaporation rates in relation to elevation did not reveal any discernible increasing or decreasing patterns.

3.5. Groundwater Recharge Estimate Using Chloride Mass Balance Method

The chloride in the groundwater range from 3.2 mg/L to 196.7 mg/L, with a mean of 26.9 mg/L. The lowest chloride concentrations were predominantly measured in the northern parts of the area, which are characterized by highly fractured meta-sedimentary rocks and are farthest away from the coast. The highest chloride concentrations were measured in the southern areas of the basin, which are underlain by granitoid rocks and are situated near the coast.
Groundwater recharge was highest in the northern zone and decreased down gradient towards the south. The estimated amount of recharge in the Pra Basin ranges between 9 mm and 666 mm, representing 0.6% to 33.5% of the average yearly rainfall. In Appendix A, you can find Table A1, which provides the estimated recharge values for different borehole locations. The estimated average recharge for the entire study region is 165 mm, which is equivalent to 10.7% of the annual precipitation average of 1500 mm. Figure 8 shows the spatial groundwater recharge distribution based on the CMB calculations.

3.6. Groundwater Recharge Estimate from Water Table Fluctuation Method

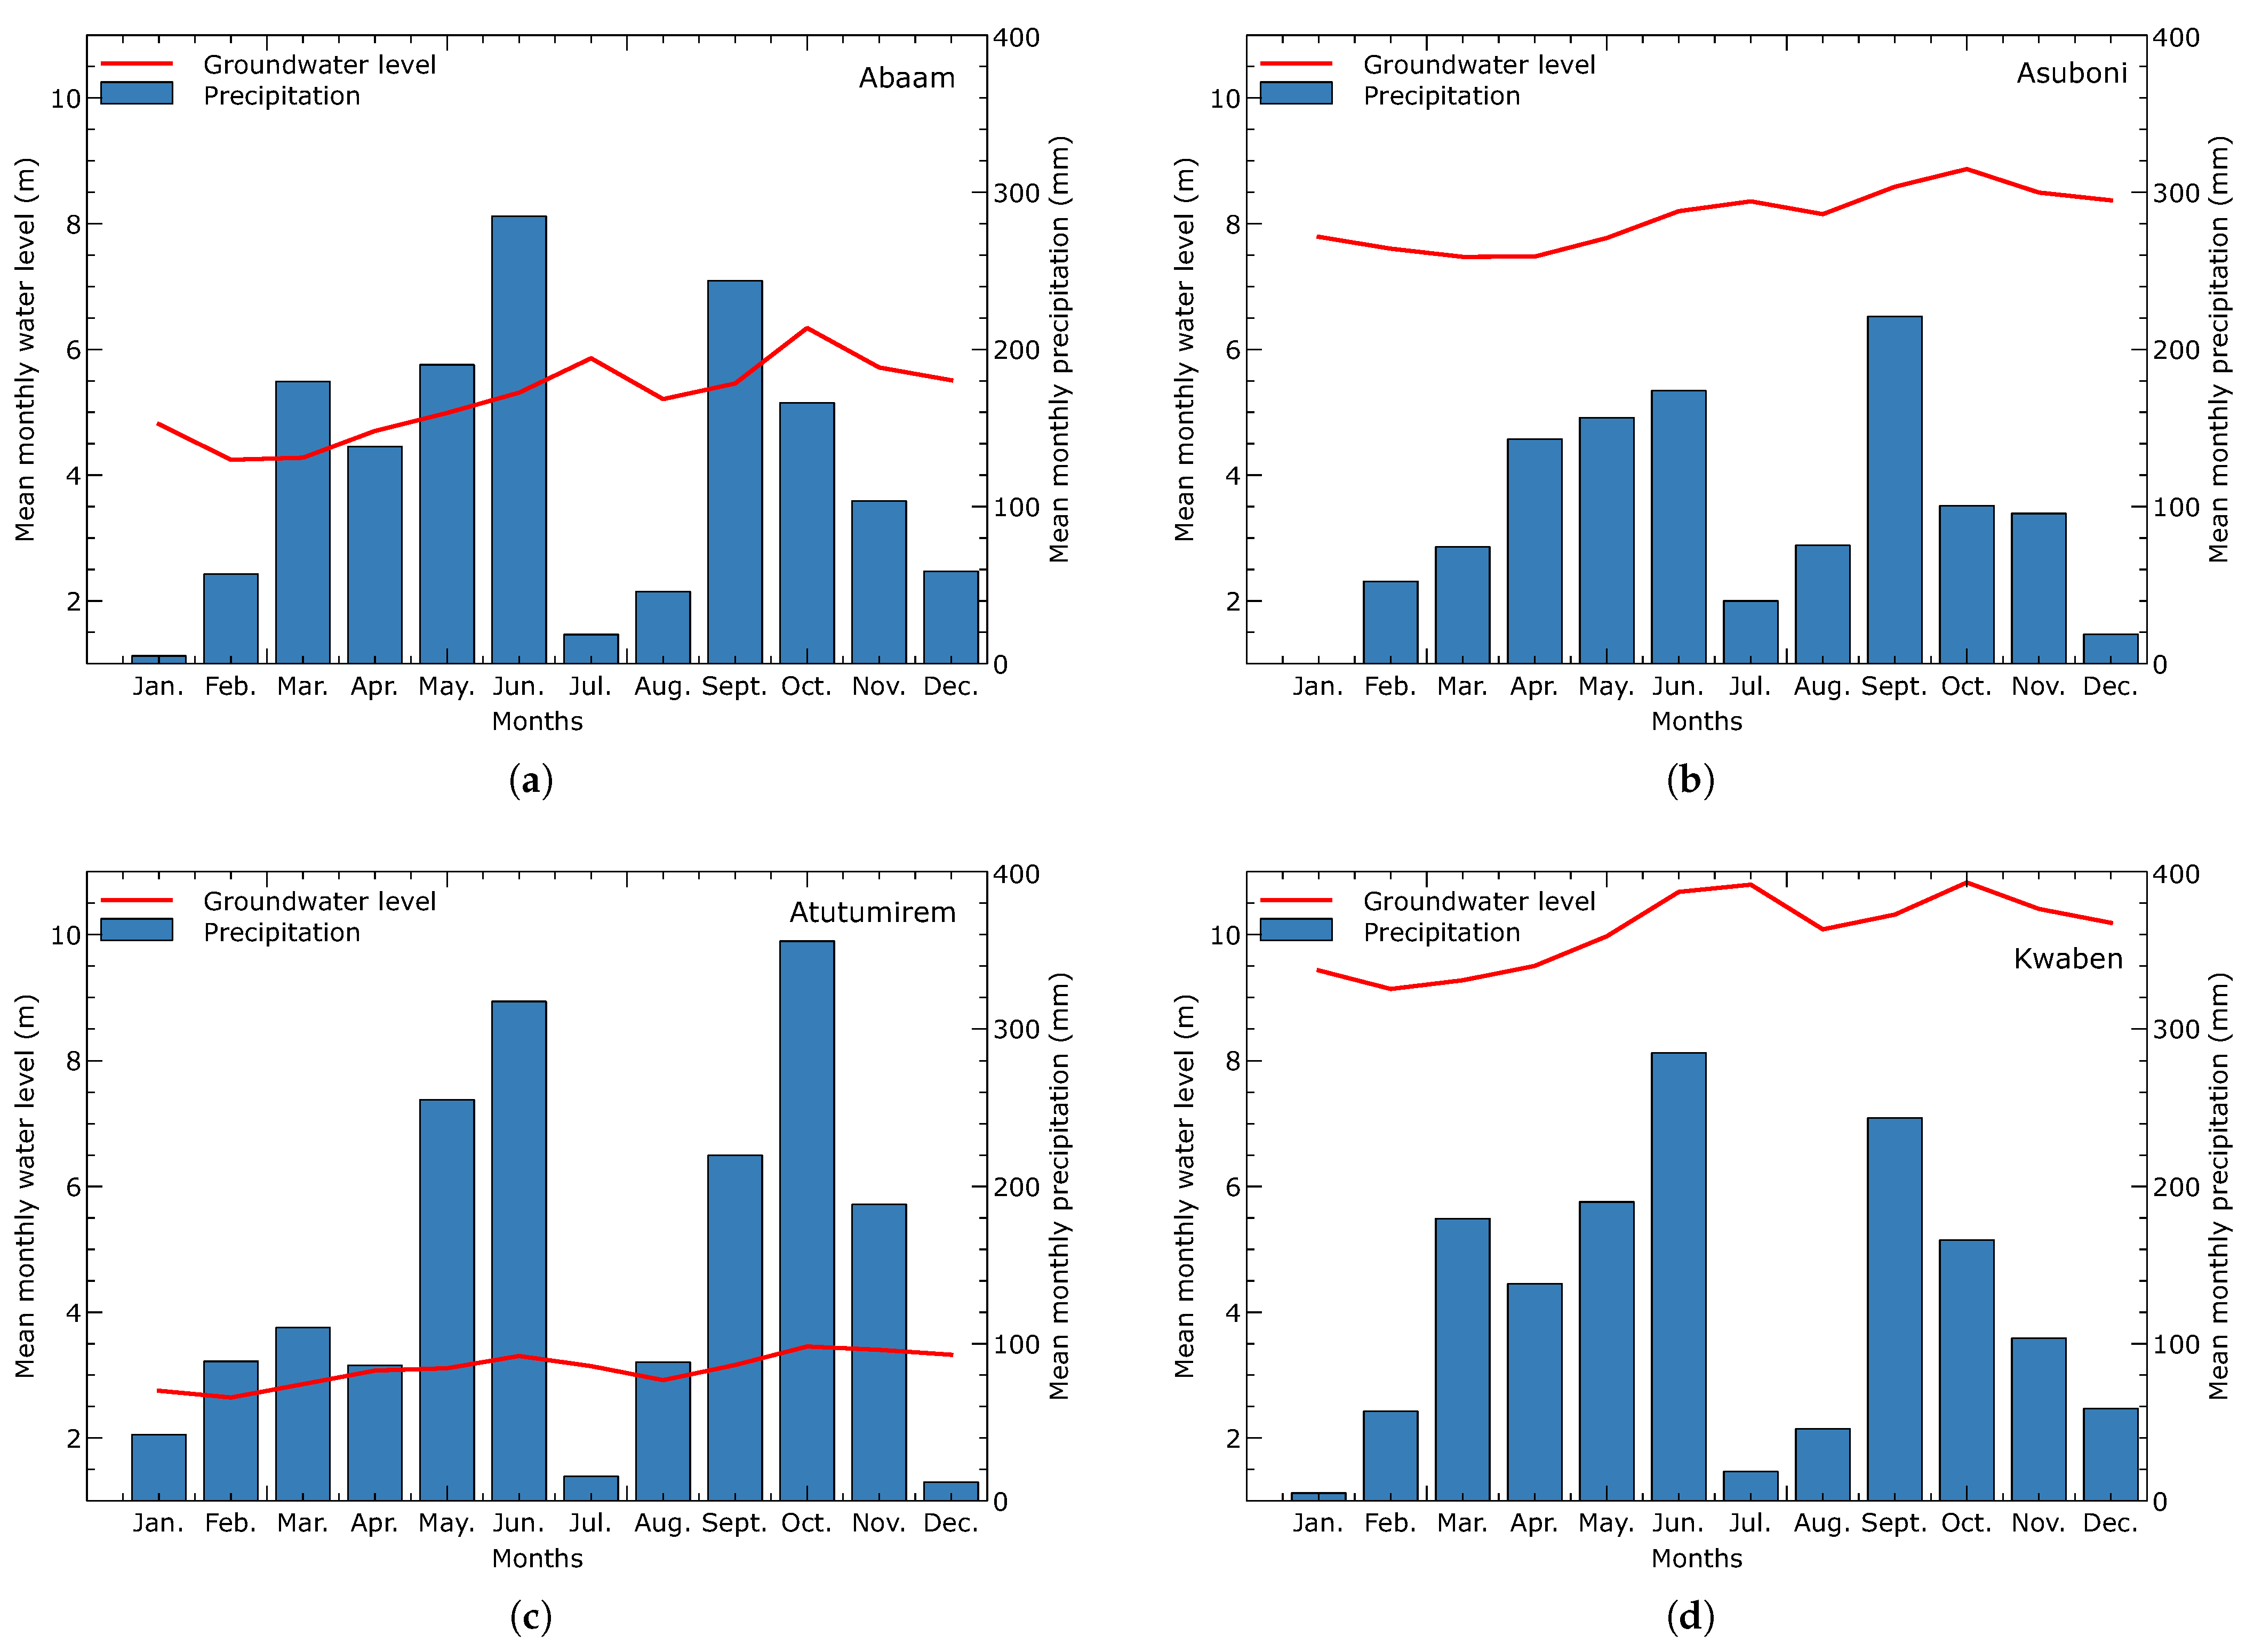
Generally, the groundwater level rise coincides with the wet periods, with peak values in June and September. Figure 9 shows the hydrographs of groundwater level fluctuations from selected monitoring wells overlaid with the mean monthly precipitation for the water year 2022. The highest and lowest water level rises occurred in the first wet season (usually March–June), with values of 3.28 m and 0.12 m, respectively. It is also evident that the rise in groundwater level associated with a precipitation event occurred with a delay of 1–2 months between January and February and from November to December.
Groundwater recharge rate is higher in the first half (March-June) of the wet season than in the second (September-November), reflecting the rise in water levels in both seasons. Table 3 presents the estimated groundwater recharge values using the WTF method. The mean recharge range from 0.23 to 3.60% of the mean annual precipitation. The highest estimated mean recharge for the two wet seasons occurred in Kwaben, with 54.1 mm, accounting for 3.6% of the annual rainfall in the basin. We observed that the highest value was associated with the well located in the Birimian meta-sediment, with a depth of 37 m. In contrast, the deepest well at 80 m depth located at Bronikrom had the lowest estimated mean recharge, also found in the Birimian meta-sediment. No significant correlation was obtained between the well depth and the recharge.

4. Discussion

4.1. Regional Climatic Conditions, Present and the Past

The climatology of temperature and precipitation of the study area has not changed over the past five decades. Ghana’s Fourth National Communication to the United Nations Framework Convention on Climate Change reports that temperatures increased by 1.0 °C between 1960 and 2003, with an average of 0.21 °C per decade [53]. The report also highlights that hot days have increased by 48 per year [53]. This change is largely consistent with the results presented in this study (Figure 3b). The temperature for the past five decades has been observed to follow an increasing trend with the current climate getting hotter. These are reflected in the peak months in February and November, with the highest recorded temperatures. Since isotope fractionation is temperature-dependent, the current climatic conditions are likely to favour the enrichment of the heavier isotopes compared to earlier decades when temperatures were relatively lower. In addition to the temperature increase, there is also a noticeable variation in the amount of rainfall, with the current years experiencing a decrease in the first peak during the first wet season and an increase in the second season. This trend is consistent with the assertion that precipitation over the past three decades varied greatly on the inter-annual and inter-decade timescales [53]. Here, we could argue that different seasons are likely to be associated with different concentrations of stable isotopes in precipitation due to the rising temperatures and the change in the precipitation, which has become erratic for the past five decades. The observed trends in the past extreme climate scenarios indicate that the study area has experienced higher temperatures and reduced rainfall, impacting both source vapor and precipitation. This will certainly enrich the isotopic composition of precipitation, which is the principal source of recharge of the Pra Basin’s surface water and groundwater systems.

4.2. Isotopic Characterization of the Surface Water and Groundwater

The considerable variation in δ 18 O and δ 2 H values observed in the surface water samples, as opposed to the groundwater samples, can be attributed to the significant evaporation occurring in the region due to the elevated temperatures. In this study, we adopted the local meteoric water line developed by Akiti [37] for southern Ghana as our reference for our interpretation. The slope and the intercept of δ 18 O and δ 2 H fitted for the surface water samples are less than the LMWL. This is primarily due to fractionation caused by evaporation, as supported by previous studies [40,44]. It has been established that the slope of surface water evaporation typically ranges from 4 to 6 [54], which is the case in this study. Since surface waters are open systems, the isotope fractionation upon evaporation is influenced by the prevailing atmospheric conditions. Studies have shown that lower slopes of surface water are associated with lower humidity [55]. In general, an increase in humidity will cause a proportional increase in the slope of the evaporation line and vice versa. In the study area, where the relative humidity is generally between 70% and 80% year-round, the δ 18 O and δ 2 H isotope ratios are expected to produce a regression line with a lower slope than the LMWL [11] due to the influence of fractionation attending the continuous evaporation of the open river systems in the basin. The deuterium excess (d-excess) calculated for the surface water samples is used together with δ 18 O to derive a relationship that can be used to understand the influence of evaporation on the water’s stable 18 O and 2 H isotope composition. In the case of this study, all surface water d-excess values are lower than the LMWL estimate of 13.61‰ vrs V-SMOW (Figure 6b), underlining an evaporation influence.
The estimated evaporation rate of the surface water reflects the influence of the prevailing high temperatures, resulting in a more enriched stable δ 18 O and δ 2 H ratios relative to the groundwater pointing to a likely discharge from groundwater into the surface water. The intercept of the surface water line with the LMWL indicates the initial isotopic signature of the precipitation that recharged the rivers before undergoing evaporation [11,44]. This is based on the assumption that the LMWL reflects the characteristics of recent rainfall. However, we acknowledge that there may be changes in the slope and intercept of the LMWL due to climate variability over the past five decades. Unfortunately, we could not conduct precipitation measurements over a longer period due to time constraints to allow a more representative characterization of the stable isotope composition of precipitation in the basin. Nevertheless, the intercept values of −3.1‰ vrs V-SMOW ( δ 18 O ) and −10.8‰ vrs V-SMOW ( δ 2 H ) obtained were within the range of δ 18 O and δ 2 H compositions in recent precipitation observed in the Densu Basin [9] which shares similar climatic conditions with our study area. The large deviation of the surface water samples from the initial isotopic signature of precipitation indicates that the surface water in the basin has experienced evaporative enrichment of the heavier isotopes. This enrichment is attributed to the fractionation process associated with evaporation. Furthermore, it is plausible that biological organisms influenced the isotopic composition of the surface water by concentrating lighter isotopes and potentially distorting the isotope ratio data, especially under changing climatic conditions such as those prevalent in the study area [56]. As a result, the combined effects could lead to stable isotope depletion in the surface waters, which is the subject of a separate study. From the estimated evaporation losses, it is clear that the influence of living organisms may be masked by the evaporative enrichment of the heavier isotopes due to the high temperatures in the region. It is important to acknowledge the presence of potential sources of error in these estimates. These sources may include uncertainties in climatic parameters such as relative humidity and the isotopic composition of ambient water vapor. Furthermore, the plausibility of sampling surface water, which consists of a mixture of water from different sources [11], can make the analysis even more complex and uncertain. As expected, the stable isotope ratios are more enriched in the surface water than in groundwater, suggesting that any interaction between surface water and groundwater would likely favor groundwater discharge into the rivers.
The regional groundwater δ 18 O and δ 2 H data plots near the LMWL exhibit a lower slope and intercept relative to the LMWL indicating that the source of groundwater recharge is mainly from precipitation that has undergone some degree of evaporation prior to recharge. This is consistent with the signature of groundwater isotopic composition in semiarid regions caused by high temperatures and low relative humidity [11,57]. Research has shown that evaporation of infiltrating water prior to recharge generally exhibits a systematic enrichment of stable isotopes, resulting in a change in the evaporation line relative to the LMWL with a slope of typically 2 to 5 [54]. In this study, the slope (4.7) of the groundwater evaporation line (Figure 6a) falls within this range and suggests that evaporation plays an important role in the groundwater recharge processes in the Pra Basin.
The significant departures of the slope and intercept relative to the LMWL are likely due to the effects of high evaporation rates attending high temperatures, low relative humidity and the slow infiltration rate through the vadose zone [2,11]. During the infiltration process, the infiltrating water can be affected by re-evaporation in the unsaturated zone due to the delayed transit time of the water. Yidana [11] emphasized that the nature and thickness of the overburden material and its clay content determine the percentage of precipitation that reaches the saturated zone. When the aquifer system is less permeable, the vertical hydraulic conductivity is reduced, and infiltration is slowed, so water in the vadose zone above the evaporation extinction depth re-evaporates [11]. In the event of significant evaporation, the water in the unsaturated zone becomes enriched with heavier isotopes, which are later transported into the aquifer by the infiltration of the late rains. In our study area, the northern and central zones are underlain primarily by meta-sedimentary rocks that are more permeable and porous to facilitate direct recharge from precipitation than the Cape Coast granitoids that underlie the southern parts of the basin. For this reason, the meta-sedimentary aquifers are expected to show more depleted isotopes than the granitoid. However, the isotopic composition of groundwater does not show significant variations in the terrain, suggesting that the factors leading to the isotopic fractionation of precipitation reaching the saturated zone are similar. However, the slight variability between the northern and southern zones can be explained by the differences in precipitation evolution processes from the vadose zone to the saturated zone [11]. The intersection of the groundwater evaporation line with the LMWL indicates the isotopic signature of the source precipitation [11,43] that recharges the aquifers in the area. As indicated in Figure 6a, δ 18 O and δ 2 H at the intersection are −3.1‰ vrs V-SMOW and −10.8‰ vrs V-SMOW, respectively. Estimates of the fraction of precipitation that evaporates before groundwater recharge range from 57 to 65%. Although the precipitation evaporation rate on its way to the saturated zone is lower than surface waters, it remains a notable factor. This observation supports the notion that infiltration of precipitation through the vadose zone is a slow process that results in significant re-evaporation of the water before or during its passage through the unsaturated zone.
Multiple processes, including evaporation, mixing and transpiration, may affect the infiltrating water on the land surface or during percolation through the unsaturated to the saturated zone. The bivariate plot of Cl vs. δ 2 H was used to elucidate further on the likely processes affecting the infiltrating water prior to groundwater recharge (Figure 7a). Here we see in Figure 7b that δ 2 H does not correlate with Cl concentration. If the infiltrating water is affected by evaporation, then we expect that an increase in Cl will correspond to the enrichment in 2 H along the evaporation line shown in Figure 7a [12]. If the infiltrating water is affected by transpiration prior to recharge, then the Cl concentration will increase without a corresponding change in the stable 2 H isotopic composition and the evaporation line will be horizontal [12]. If the mixing of two discrete end members is the sole dominant process, the strong positive correlation indicated by a straight line would be expected [12]. In the study area, the groundwater movement is structurally controlled so that the water samples probably consist of water from different aquifers. This will likely affect the mean isotopic composition of the final water. The transpiration process during recharge is reasonable as the dense vegetation cover in the study area likely facilitates the transpiration of infiltrated water in the root zone.

4.3. Groundwater Recharge Estimates

The estimated recharge values obtained from the CMB and WTF methods are largely consistent with values reported in other studies conducted in Ghana and semi-arid regions in Africa. The CMB recharge estimates show larger variability, ranging from 0.6% to 34%, while the WTF method ranges from 0.2% to 3.6% of the mean long-term annual precipitation. The estimate of 10.7% mean recharge of the annual precipitation from the CMB is generally consistent with the mean basin recharge of 16% reported by the Water Resources Commission of Ghana, and our results are consistent with other studies carried out in different parts of Ghana. For example, Yidana et al. [3] estimated an average recharge of 7.6% of annual precipitation using numerical groundwater flow models in south-east Ghana, while Afrifa et al. [2], Obuobie et al. [8], and Duah et al. [14] reported similar figures in northern and southern Ghana, respectively.
The groundwater recharge estimates obtained from the CMB are reasonable compared to other studies. However, some uncertainties are expected due to other potential sources of Cl in groundwater that are not considered in the calculation. The main assumption for using the CMB is that the source of Cl in groundwater is mainly from precipitation and that Cl behaves conservatively, not being leached or absorbed from aquiferous sediments and not being affected by chemical reactions [2,8,14]. Other sources of Cl , including deposition from marine aerosols and pollution from sewage, might contribute to the Cl loads as these wells are public wells exposed to unregulated disposal of solid and liquid waste on-site. While the weathering of chloride-containing minerals (e.g., halite) can impact chloride in groundwater, its effects have been neglected because no petrographic evidence of their occurrence is known in the terrain [58]. If Cl in groundwater increases, the estimated recharge, which is inversely proportional to the Cl concentration in groundwater, is expected to be low, leading to an overestimation of recharge and vice versa.
The basin-wide distribution of groundwater recharge shows high values in the northern parts, which are underlain by the Birimian meta-sedimentary rocks, while the lower recharge areas correspond to the granitoid. In a previous study [1], the northern parts of the study area were proposed as a recharge zone likely to receive direct recharge from precipitation. With direct recharge, lower Cl values are expected than in waters with a high evaporation rate before reaching the aquifer. Among these two lithologies, the Birimian meta-sediments composed of phyllite have higher aquifer permeability than the granitoid [3,59]. Because secondary porosity governs the occurrence of groundwater in the terrain [59], it is likely that more vertical recharge is expected in the phyllite aquifers to the north than to the south, which is granitoid and less permeable compared to the Birimian rocks. The accuracy of the CMB estimates could be improved by using long-term data on chloride ( Cl ) instead of the one-time measurements used in this study. Unfortunately, long-term monitoring data on Cl in the Pra Basin was not available during this research.
The groundwater hydrographs show that the main driver of groundwater recharge is seasonal precipitation, although the contribution of river runoff is also a plausible factor. A close inspection of the hydrographs and rainfall patterns reveals that the peak of groundwater level rise occurs most during the two wet seasons, July and October. The current rainfall peak in the second part of the season is projected to occur in October; however, it happened in September. This trend suggests that the 2022 water year does not follow the mean climatology of the rainfall in the second season, which is supposed to peak in October. A similar characteristic was observed in the last three decades (Figure 3) when the peak in rainfall in the second period was slightly higher in September than expected in October. The continuous water level rise observed during the break of the wet seasons can be described as a delayed vertical recharge from the preceding precipitation or horizontal component of the groundwater water recharge [2,60]. A similar trend has been observed by Afrifa et al. [2] in the Oti River Basin in Ghana. This observation is influenced by the thickness of the overburden and the nature of the material it is composed of Lee et al. [60] emphasized that the thickness of the unsaturated zone partly controls the peak of the water level fluctuation during groundwater level monitoring. A thicker unsaturated zone is more likely to display a gradual peaking of the amplitude of the water level rise over monitoring periods than a shallow unsaturated zone, which would show a rapid peak in the amplitude [2,60]. This assertion is largely consistent with the nature of the hydrographs (Figure 9) presented for the ten groundwater wells in this study. It is a well-known fact that every visible river basin on the earth’s surface is accompanied by an underground basin, often as large or larger than its surface counterpart. At the same time, groundwater is one of the main components of the water balance in a river system, which is why some rivers also exist in the dry season. In the study area, the major rivers are the Birim River and Main Pra River, which could contribute some water to the aquifers. While isotope data predominantly suggest groundwater discharging into rivers, the results from the groundwater hydrographs suggest that the reverse is also plausible. This is supported by Figure 9, which shows that the groundwater level remains relatively stable even in months with low rainfall.
The groundwater recharge using the WTF method shows relatively little variability and agrees with the range of values estimated using the CMB method. This is reasonable and consistent with those obtained with WTF and other methods in many semi-arid regions [2,8,14]. Using the average recharge estimate of 1.64% and the minimum annual precipitation of 1300 mm, the estimated mean annual recharge for the entire study catchment for the 2022 water year is 228 M m 3 , which is higher than the estimated total surface water use for the entire Pra Basin of approximately 144 M m 3 for the year 2010 [27]. It is worth noting that the land size of the current study catchment (10,703 km 2 ) is less than half the size of the entire Pra Basin (23,000 km 2 ) and therefore indicates a great potential for developing groundwater for domestic and industrial purposes. The comparatively lower recharge amounts calculated by the WTF compared to the CMB can be partly attributed to the limited number of monitoring wells used in this current study. Here, conclusions on the spatial variability of groundwater recharge using the WTF can be improved by considering more data from evenly distributed monitoring wells across the basin. Furthermore, we would like to point out that the specific yield (Sy) used in the calculation was taken from the literature and not from measurements of the respective aquifer materials in the region. For this reason, some margin of error is predicted for the estimated groundwater recharge reported in this study. If the specific yield of the aquifer materials in the basin is measured, the accuracy of the WTF recharge calculations can be improved.

5. Conclusions

The use of stable isotope tracers oxygen ( δ 18 O ) and hydrogen ( δ 2 H ) and water level measurements have been applied in this study to ascertain the source, recharge mechanisms, and spatial estimates of groundwater recharge within the Pra Basin of Ghana. This study has presented regional stable isotope data of surface and groundwater for the first time, providing essential boundary conditions to conceptualize hydrogeochemical processes that drive groundwater evolution. Using chloride mass balance (CMB) and water table fluctuation (WTF) methods has enabled the quantification of groundwater recharge in the Pra Basin. Data from past climate records were fully integrated into the study to evaluate the potential climatic variability over the past 50 years. Current data from 10 groundwater monitoring wells were provided for the recharge estimates and for understanding the source of the aquifer recharge. Our results allow the following conclusions:
  • The past fifty years show a temperature increase of about 1 degree Celsius. The climatology of precipitation and temperature remain unchanged; however, a gradual decrease in precipitation can be observed for the first peak of the rainy season in June.
  • Surface waters have experienced relatively high levels of evaporation due to the direct effects of prevailing climatic conditions. The relatively lower evaporation rate of groundwater is attributed to the short residence time of the infiltrating water within the evaporation extinguishing depth in the vadose zone.
  • Groundwater recharge from meteoric water tends to have higher concentrations of heavier isotopes relative to the LMWL. This enrichment occurs due to significant evaporation either at the land surface or during seepage through the vadose zone. The rate of evaporation of infiltrating water is likely influenced by factors such as the thickness and composition of the material between the surface and the saturated zone, as well as the high temperatures and low relative humidity prevailing in the region.
  • An integrated analysis of stable isotope data and water level measurements suggests a potential hydraulic connection between surface water and groundwater. This hypothesis is supported by the fact that the isotopes of groundwater have comparatively lower values than surface water. Furthermore, the observation that the groundwater level remains constant in months with lower rainfall further supports this conclusion.
  • The primary groundwater recharge area is in the northern zone, where the highest recharge occurs. The calculated recharge values show a gradual decline from the northern regions towards the southern areas of the basin.
  • Groundwater recharge for the study catchment, considering the average estimate of 1.64% (WTF) and minimum annual precipitation of 1300 mm, is 228 M m 3 , which is higher than the estimated water use for the entire Pra Basin, underscoring a high potential for water supply.
The results presented in this study can be used to advance water management in the Pra Basin as they provide quantitative recharge estimates, which are prerequisites for planning and sustainable development of groundwater resources. For further studies, developing a numerical groundwater flow model is essential to gain a more comprehensive understanding of the water budget in the catchment. Such a model would enable accurate groundwater recharge estimates by integrating various water balance components, such as precipitation, river contributions, evapotranspiration, etc. Furthermore, this modelling approach would enable reliable delineation of groundwater flow patterns and the assessment of the hydrochemical evolution of groundwater in the Pra Basin.

Author Contributions

Conceptualization, E.M. and M.K.; methodology, E.M., M.K. and M.D.L.; software, E.M. and M.D.L.; validation, E.M. and M.D.L.; formal analysis, E.M.; investigation, E.M.; writing—original draft preparation, E.M.; writing—review and editing, E.M., M.D.L., T.T.A. and M.K; visualization, E.M.; supervision, M.K. All authors have read and agreed to the published version of the manuscript.

Funding

This publication has been supported by the funding programme “Open Access Publikationskosten” Deutsche Forschungsgemeinschaft (DFG, German Research Foundation)—Project Number 491075472. The German Academic Exchange Service (DAAD) funded the first author with the program funding number 57460308.

Data Availability Statement

Datasets related to this article can be found at https://doi.org/10.5880/GFZ.3.4.2023.002 (accessed on 16 February 2023).

Acknowledgments

This study is part of the first author’s doctoral thesis. He would like to express his greatest appreciation to the German Academic Exchange Service (DAAD) for funding his stay in Germany. We also thank Ghana’s Water Research Institute (WRI) for their assistance during the field campaigns. Our special thanks go to Thomas Kempka of GFZ German Research Centre for Geosciences for his comments and assistance throughout the research process. We also acknowledge the support from Emmanuel Obuobie (WRI) and Bismark Akurugu (WRI) for their assistance during the field campaigns. The four anonymous reviewers are also thanked for their constructive comments.

Conflicts of Interest

The authors declare no conflict of interest.

Appendix A

Table A1. Groundwater recharge values estimated for the Pra Basin using the CMB method. We utilized an average long-term precipitation of 1500 mm [30] and a chloride concentration in rainwater of 1.13 mg/L [14] for the recharge estimates. Cl GW is the chloride in groundwater.
CommunityNorthings (m)Eastings (m)Elevation (m) Cl GW (mg/L)Recharge (mm)As % of Annual Rainfall
Apapaw765,897.0680,069.0362.034.948.63.2
Asiakwa SOS776,819.0693,156.0238.03.5486.632.4
Jejeti759,161.8716,496.3204.09.0188.812.6
Asubone754,144.0724,194.0219.018.790.86.1
Kokrompe751,209.0715,992.0205.010.4163.410.9
Kofi dede735,301.0732,346.0225.09.2184.212.3
Kwahu Besease732,647.0730,776.0220.038.544.02.9
Kwahu Oda731,178.0728,046.0201.07.9214.014.3
Kwaben766,831.0700,042.0210.06.1279.718.6
Akrofofo763,058.0702,365.0181.03.5666.232.0
Asunafo753,556.0701,388.0171.03.4502.533.5
Bomaa766,573.0695,707.0248.010.9155.910.4
Pamang763,069.0686,882.0223.03.4501.533.4
Kwamang752,530.0686,709.0175.04.3393.326.2
Okyinso744,419.0687,559.0158.03.2522.332.0
Akyem Abodom741,242.0680,849.7143.018.989.96.0
Subi7395,30.0678,458.8164.06.7251.916.8
Abompe734,625.3685,930.3181.06.3267.817.9
Otumi731,175.3688,002.9186.034.649.03.3
Kade739,619.2673,085.2132.035.048.43.2
Akwatia742,140.6666,200.2169.014.2119.17.9
Kusi736,501.7668,688.9145.06.2273.318.2
Awaham753,138.8658,835.2198.049.234.42.3
Kakoasi742,452.0658,015.0125.023.273.04.9
Etwereso705,906.0664,604.8140.09.3181.912.1
Zevor704,904.4658,538.3112.016.8101.06.7
Lebikrom724,448.3664,516.9145.05.3320.121.3
Soabe730,327.1663,168.4136.015.9106.97.1
Oda721,159.6655,929.2121.098.017.31.2
Atutumirem723,063.7649,411.2115.049.634.12.3
Aprade710,391.5639,605.4165.06.0284.118.9
Kenie697,462.6641,406.8131.010.5162.110.8
Obobakrokrowa701,896.6645,044.1126.012.5135.89.1
Akotikrom704,676.7649,089.0129.021.578.75.2
Nyamebekyere683,039.0637,611.0135.212.9131.48.8
Ababuom687,388.0623,282.0111.27.6223.014.9
Bronokrom656,858.0561,969.014.055.030.82.1
Brunokrom656,856.0561,958.014.0196.78.60.6
Kotogyina644,148.0558,902.032.587.919.31.3
Abotere642,296.0564,153.029.558.129.11.9
Dompin647,796.3563,871.114.033.950.03.3
Ewiadaso646,686.0572,168.060.027.262.44.2
Nyekompoe652,970.0577,496.038.420.782.05.5
Essamang646,554.0591,595.051.312.4136.69.1
Mamponso651,448.0600,012.040.310.0169.611.3
Anyanasi654,795.0618,484.068.134.249.53.3
Dokoro646,702.0620,785.097.014.2119.58.0
Somnyamekor656,844.5625,862.584.012.0141.39.4
Breman654,738.0631,093.075.079.521.31.4
Imbrain636,514.0642,921.0141.917.596.96.5
Akonfudi686,960.0644,646.098.135.847.33.2
Kenkuase671,977.0618,658.094.219.686.65.8
Okyerekrom667,847.0626,235.079.25.1334.022.3
Twifo Mamp660,003.0610,858.063.2122.013.90.9
Wawase668,444.0599,214.0105.013.4126.58.4
Figure A1. Decadal mean monthly precipitation climatology from (a) 1964 to 1973, (b) 1974 to 1983, (c) 1984 to 1993, (d) 1994 to 2003 and (e) 2004 to 2013, respectively in the Pra Basin for the three defined zones (northern, central and southern) after Manu et al. [1]. The northern zones are at higher elevations while the southern zones are at lower elevations, respectively.
Water 15 03760 g0a1aWater 15 03760 g0a1b
Figure A2. Decadal mean monthly temperature climatology from (a) 1964 to 1973, (b) 1974 to 1983, (c) 1984 to 1993, (d) 1994 to 2003 and (e) 2004 to 2013, respectively in the Pra Basin for the three defined zones (northern, central and southern) after Manu et al. [1]. The northern zones are at higher elevations while the southern zones are at lower elevations, respectively.
Water 15 03760 g0a2aWater 15 03760 g0a2b
Figure A3. Surface water stable oxygen-18 (a) and deuterium (b) isotopes plot against elevation show no clear correlation between them. The sample located in the highest elevation measured the least stable isotope of oxygen and deuterium ratios.
Water 15 03760 g0a3
Figure A4. Groundwater stable oxygen-18 (a) and deuterium (b) isotopes plot against elevation show no significant correlation between them. Very few samples in the southern zone (low elevation) showed relative enrichment of the stable oxygen-18 and deuterium isotope ratios.
Water 15 03760 g0a4

References

  1. Manu, E.; De Lucia, M.; Kühn, M. Hydrochemical characterization of groundwater in the crystalline basement aquifer system in the Pra Basin (Ghana). Water 2023, 15, 1325. [Google Scholar] [CrossRef]
  2. Afrifa, G.Y.; Sakyi, P.A.; Chegbeleh, L.P. Estimation of groundwater recharge in sedimentary rock aquifer systems in the Oti basin of Gushiegu District, Northern Ghana. J. Afr. Earth Sci. 2017, 131, 272–283. [Google Scholar] [CrossRef]
  3. Yidana, S.M.; Ganyaglo, S.; Banoeng-Yakubo, B.; Akabzaa, T. A conceptual framework of groundwater flow in some crystalline aquifers in Southeastern Ghana. J. Afr. Earth Sci. 2011, 59, 185–194. [Google Scholar] [CrossRef]
  4. Okofo, L.B.; Martienssen, M. A three-dimensional numerical groundwater flow model to assess the feasibility of managed aquifer recharge in the Tamne River basin of Ghana. Hydrogeol. J. 2022, 30, 1071–1090. [Google Scholar] [CrossRef]
  5. Yidana, S.M.; Alfa, B.; Banoeng-Yakubo, B.; Obeng Addai, M. Simulation of groundwater flow in a crystalline rock aquifer system in Southern Ghana—An evaluation of the effects of increased groundwater abstraction on the aquifers using a transient groundwater flow model. Hydrol. Process. 2014, 28, 1084–1094. [Google Scholar] [CrossRef]
  6. Mace, R.E.; Chowdhury, A.H.; Anaya, R.; Way, S.C.T. A Numerical Groundwater Flow Model of the Upper and Middle Trinity Aquifer, Hill Country Area; Texas Water Development Board Open File Report 00-02; Texas Water Development Board: Austin, TX, USA, 2000.
  7. Addai, M.O.; Yidana, S.M.; Chegbeleh, L.P.; Adomako, D.; Banoeng-Yakubo, B. Groundwater recharge processes in the Nasia sub-catchment of the White Volta Basin: Analysis of porewater characteristics in the unsaturated zone. J. Afr. Earth Sci. 2016, 122, 4–14. [Google Scholar] [CrossRef]
  8. Obuobie, E.; Diekkrueger, B.; Reichert, B. Use of chloride mass balance method for estimating the groundwater recharge in northeastern Ghana. Int. J. River Basin Manag. 2010, 8, 245–253. [Google Scholar] [CrossRef]
  9. Adomako, D.; Maloszewski, P.; Stumpp, C.; Osae, S.; Akiti, T. Estimating groundwater recharge from water isotope (δ2H, δ18O) depth profiles in the Densu River basin, Ghana. Hydrol. Sci. J. 2010, 55, 1405–1416. [Google Scholar] [CrossRef]
  10. Gibrilla, A.; Fianko, J.R.; Ganyaglo, S.; Adomako, D.; Stigter, T.Y.; Salifu, M.; Anornu, G.; Zango, M.S.; Zakaria, N. Understanding recharge mechanisms and surface water contribution to groundwater in granitic aquifers, Ghana: Insights from stable isotopes of δ2H and δ18O. J. Afr. Earth Sci. 2022, 192, 104567. [Google Scholar] [CrossRef]
  11. Yidana, S. The stable isotope characteristics of groundwater in the Voltaian Basin—An evaluation of the role of meteoric recharge in the basin. J. Hydrogeol. Hydrol. Eng. 2013, 2, 2. [Google Scholar]
  12. Love, A.; Herczeg, A.; Armstrong, D.; Stadter, F.; Mazor, E. Groundwater flow regime within the Gambier Embayment of the Otway Basin, Australia: Evidence from hydraulics and hydrochemistry. J. Hydrol. 1993, 143, 297–338. [Google Scholar] [CrossRef]
  13. Davisson, M.; Smith, D.; Kenneally, J.; Rose, T. Isotope hydrology of southern Nevada groundwater: Stable isotopes and radiocarbon. Water Resour. Res. 1999, 35, 279–294. [Google Scholar] [CrossRef]
  14. Duah, A.A.; Akurugu, B.A.; Darko, P.K.; Manu, E.; Mainoo, P.A. Groundwater recharge and potential exploitation in the Densu basin, Southwestern Ghana. J. Afr. Earth Sci. 2021, 183, 104332. [Google Scholar] [CrossRef]
  15. Eriksson, E.; Khunakasem, V. Chloride concentration in groundwater, recharge rate and rate of deposition of chloride in the Israel Coastal Plain. J. Hydrol. 1969, 7, 178–197. [Google Scholar] [CrossRef]
  16. Marei, A.; Khayat, S.; Weise, S.; Ghannam, S.; Sbaih, M.; Geyer, S. Estimating groundwater recharge using the chloride mass-balance method in the West Bank, Palestine. Hydrol. Sci. J. 2010, 55, 780–791. [Google Scholar] [CrossRef]
  17. Dassi, L. Use of chloride mass balance and tritium data for estimation of groundwater recharge and renewal rate in an unconfined aquifer from North Africa: A case study from Tunisia. Environ. Earth Sci. 2010, 60, 861–871. [Google Scholar] [CrossRef]
  18. Gebru, T.A.; Tesfahunegn, G.B. Chloride mass balance for estimation of groundwater recharge in a semi-arid catchment of northern Ethiopia. Hydrogeol. J. 2019, 27, 363–378. [Google Scholar] [CrossRef]
  19. Uugulu, S.; Wanke, H. Estimation of groundwater recharge in savannah aquifers along a precipitation gradient using chloride mass balance method and environmental isotopes, Namibia. Phys. Chem. Earth Parts a/b/c 2020, 116, 102844. [Google Scholar] [CrossRef]
  20. Zhu, C.; Winterle, J.R.; Love, E.I. Late Pleistocene and Holocene groundwater recharge from the chloride mass balance method and chlorine-36 data. Water Resour. Res. 2003, 39, 7. [Google Scholar] [CrossRef]
  21. McNamara, J.P. An Assessment of the Potential for Using Water and Chloride Budgets to Estimate Groundwater Recharge in Granitic, Mountain Environments. Final Report. 2005. Available online: https://www2.deq.idaho.gov/admin/LEIA/api/document/download/4654 (accessed on 30 April 2023).
  22. Delin, G.N.; Healy, R.W.; Lorenz, D.L.; Nimmo, J.R. Comparison of local-to regional-scale estimates of ground-water recharge in Minnesota, USA. J. Hydrol. 2007, 334, 231–249. [Google Scholar] [CrossRef]
  23. Obuobie, E.; Diekkrueger, B.; Agyekum, W.; Agodzo, S. Groundwater level monitoring and recharge estimation in the White Volta River basin of Ghana. J. Afr. Earth Sci. 2012, 71, 80–86. [Google Scholar] [CrossRef]
  24. Scanlon, B.R.; Healy, R.W.; Cook, P.G. Choosing appropriate techniques for quantifying groundwater recharge. Hydrogeol. J. 2002, 10, 18–39. [Google Scholar] [CrossRef]
  25. Healy, R.W.; Cook, P.G. Using groundwater levels to estimate recharge. Hydrogeol. J. 2002, 10, 91–109. [Google Scholar] [CrossRef]
  26. Risser, D.W.; Gburek, W.J.; Folmar, G.J. Comparison of Methods for Estimating Ground-Water Recharge and Base Flow at a Small Watershed Underlain by Fractured Bedrock in the Eastern United States; US Geological Survey; US Department of the Interior: Washington, DC, USA, 2005; Volume 5038.
  27. Water Resources Commission, W.R.C. Pra River Basin—Integrated Water Resources Management Plan. Available online: https://www.wrc-gh.org/documents/reports/ (accessed on 23 March 2023).
  28. Manu, E.; Vieth-Hillebrand, A.; Rach, O.; Schleicher, A.M.; Trumbull, R.; Stammeier, J.A.; Gottsche, A.; Kühn, M. Hydrochemistry and stable oxygen (δ18O) and hydrogen (δ2H) isotopic composition of surface water and groundwater and mineralogy, in the Pra Basin (Ghana) West Africa. GFZ Data Serv. 2023. [Google Scholar] [CrossRef]
  29. Kankam-Yeboah, K.; Obuobie, E.; Amisigo, B.; Opoku-Ankomah, Y. Impact of climate change on streamflow in selected river basins in Ghana. Hydrol. Sci. J. 2013, 58, 773–788. [Google Scholar] [CrossRef]
  30. Benneh, G.; Dickson, K. A New Geography of Ghana, Revised ed.; Longman: London, UK, 1995. [Google Scholar]
  31. Banoeng-Yakubo, B.; Yidana, S.; Ajayi, J.; Loh, Y.; Asiedu, D. Hydrogeology and groundwater resources of Ghana: A review of the hydrogeological zonation in Ghana. In Potable Water and Sanitation; Nova Science Publishers, Inc.: Hauppauge, NY, USA, 2010. [Google Scholar]
  32. Banoeng-Yakubo, B.; Yidana, S.M.; Nti, E. An evaluation of the genesis and suitability of groundwater for irrigation in the Volta Region, Ghana. Environ. Geol. 2009, 57, 1005–1010. [Google Scholar] [CrossRef]
  33. Kortatsi, B.K. Hydrochemical framework of groundwater in the Ankobra Basin, Ghana. Aquat. Geochem. 2007, 13, 41–74. [Google Scholar] [CrossRef]
  34. Carrier, M.A.; Lefebvre, R.; Racicot, J.; Asare, E.B. Northern Ghana hydrogeological assessment project. In Proceedings of the 33rd WEDC International Conference, Accra, Ghana, 7–11 April 2008. [Google Scholar]
  35. Ganyaglo, S.Y.; Banoeng-Yakubo, B.; Osae, S.; Dampare, S.B.; Fianko, J.R.; Bhuiyan, M.A. Hydrochemical and isotopic characterisation of groundwaters in the eastern region of Ghana. J. Water Resour. Prot. 2010, 2, 199. [Google Scholar] [CrossRef]
  36. Dapaah-Siakwan, S.; Gyau-Boakye, P. Hydrogeologic framework and borehole yields in Ghana. Hydrogeol. J. 2000, 8, 405–416. [Google Scholar] [CrossRef]
  37. Akiti, T. Environmental isotope study of ground water in crystalline rocks of the Accra plains (Ghana). In Proceedings of the 4th Working Meeting on Isotopes in Nature, Leipzig, Germany, 22–26 September 1986. [Google Scholar]
  38. Craig, H. Isotopic variations in meteoric waters. Science 1961, 133, 1702–1703. [Google Scholar] [CrossRef]
  39. Sheffield, J.; Goteti, G.; Wood, E.F. Development of a 50-year high-resolution global dataset of meteorological forcings for land surface modeling. J. Clim. 2006, 19, 3088–3111. [Google Scholar] [CrossRef]
  40. Craig, H.; Gordon, L.I. Deuterium and oxygen 18 variations in the ocean and the marine atmosphere. In Stable Isotopes in Oceanographic Studies and Paleotemperatures; Tongiorgi, E., Ed.; Consiglio Nazionale delle Richerche, Laboratorio de Geologia Nucleare: Pisa, Italy, 1965; pp. 9–130. [Google Scholar]
  41. Fellman, J.B.; Dogramaci, S.; Skrzypek, G.; Dodson, W.; Grierson, P.F. Hydrologic control of dissolved organic matter biogeochemistry in pools of a subtropical dryland river. Water Resour. Res. 2011, 47. [Google Scholar] [CrossRef]
  42. Gibson, J.; Reid, R. Stable isotope fingerprint of open-water evaporation losses and effective drainage area fluctuations in a subarctic shield watershed. J. Hydrol. 2010, 381, 142–150. [Google Scholar] [CrossRef]
  43. Loh, Y.S.A.; Fynn, O.F.; Manu, E.; Afrifa, G.Y.; Addai, M.O.; Akurugu, B.A.; Yidana, S.M. Groundwater-surface water interactions: Application of hydrochemical and stable isotope tracers to the lake bosumtwi area in Ghana. Environ. Earth Sci. 2022, 81, 1–15. [Google Scholar] [CrossRef]
  44. Dogramaci, S.; Skrzypek, G.; Dodson, W.; Grierson, P.F. Stable isotope and hydrochemical evolution of groundwater in the semi-arid Hamersley Basin of subtropical northwest Australia. J. Hydrol. 2012, 475, 281–293. [Google Scholar] [CrossRef]
  45. Welhan, J.; Fritz, P. Evaporation pan isotopic behavior as an index of isotopic evaporation conditions. Geochim. Cosmochim. Acta 1977, 41, 682–686. [Google Scholar] [CrossRef]
  46. Allison, G.; Leaney, F. Estimation of isotopic exchange parameters, using constant-feed pans. J. Hydrol. 1982, 55, 151–161. [Google Scholar] [CrossRef]
  47. Turner, B.F.; Gardner, L.; Sharp, W.E.; Blood, E. The geochemistry of Lake Bosumtwi, a hydrologically closed basin in the humid zone of tropical Ghana. Limnol. Oceanogr. 1996, 41, 1415–1424. [Google Scholar] [CrossRef]
  48. Gonfiantini, R. Environmental isotopes in lake studies. In Handbook of Environmental Isotopes Geochemistry; Fritz, P., Fontes, J.C., Eds.; Elsevier: New York, NY, USA, 1986; Volume II, pp. 113–168. [Google Scholar]
  49. Adsiz, C.; Skrzypek, G.; McCallum, J. The measurement of ambient air moisture stable isotope composition for the accurate estimation of evaporative losses. MethodsX 2023, 11, 102265. [Google Scholar] [CrossRef]
  50. Peng, T.R.; Huang, C.C.; Wang, C.H.; Liu, T.K.; Lu, W.C.; Chen, K.Y. Using oxygen, hydrogen, and tritium isotopes to assess pond water’s contribution to groundwater and local precipitation in the pediment tableland areas of northwestern Taiwan. J. Hydrol. 2012, 450, 105–116. [Google Scholar] [CrossRef]
  51. Dickson, K.B.; Benneh, G.; Essah, R. A New Geography of Ghana; Longman: London, UK, 1988; Volume 34. [Google Scholar]
  52. Sinha, B.; Sharma, S.K. Natural Ground Water Recharge Estimation Methodologies in India; Springer: Berlin/Heidelberg, Germany, 1988. [Google Scholar]
  53. Bergesen, H.O.; Parmann, G.; Thommessen, Ø.B. United Nations Framework Convention on Climate Change (UNFCCC). In Yearbook of International Cooperation on Environment and Development 1998–99; Routledge: Boca Raton, FL, USA, 2018; pp. 73–77. [Google Scholar]
  54. Barnes, C.; Allison, G. Tracing of water movement in the unsaturated zone using stable isotopes of hydrogen and oxygen. J. Hydrol. 1988, 100, 143–176. [Google Scholar] [CrossRef]
  55. Fan, Y.; Chen, Y.; Li, X.; Li, W.; Li, Q. Characteristics of water isotopes and ice-snowmelt quantification in the Tizinafu River, north Kunlun Mountains, Central Asia. Quat. Int. 2015, 380, 116–122. [Google Scholar] [CrossRef]
  56. Dawson, T.E.; Mambelli, S.; Plamboeck, A.H.; Templer, P.H.; Tu, K.P. Stable isotopes in plant ecology. Annu. Rev. Ecol. Syst. 2002, 33, 507–559. [Google Scholar] [CrossRef]
  57. Okofo, L.B.; Adonadaga, M.G.; Martienssen, M. Groundwater age dating using multi-environmental tracers (SF6, CFC-11, CFC-12, δ18O, and δD) to investigate groundwater residence times and recharge processes in Northeastern Ghana. J. Hydrol. 2022, 610, 127821. [Google Scholar] [CrossRef]
  58. Manu, E.; De Lucia, M.; Kühn, M. Water–Rock Interactions Driving Groundwater Composition in the Pra Basin (Ghana) Identified by Combinatorial Inverse Geochemical Modelling. Minerals 2023, 13, 899. [Google Scholar] [CrossRef]
  59. Banoeng-Yakubu, B.; Yidana, S.; Ajayi, J.; Loh, Y.; Aseidu, D. Hydrogeology and groundwater resources of Ghana: A review of the hydrogeology and hydrochemistry of Ghana. In Potable Water and Sanitation; Nova Science Publishers, Inc.: Hauppauge, NY, USA, 2011; p. 142. [Google Scholar]
  60. Lee, J.Y.; Yi, M.J.; Hwang, D. Dependency of hydrologic responses and recharge estimates on water-level monitoring locations within a small catchment. Geosci. J. 2005, 9, 277–286. [Google Scholar] [CrossRef]
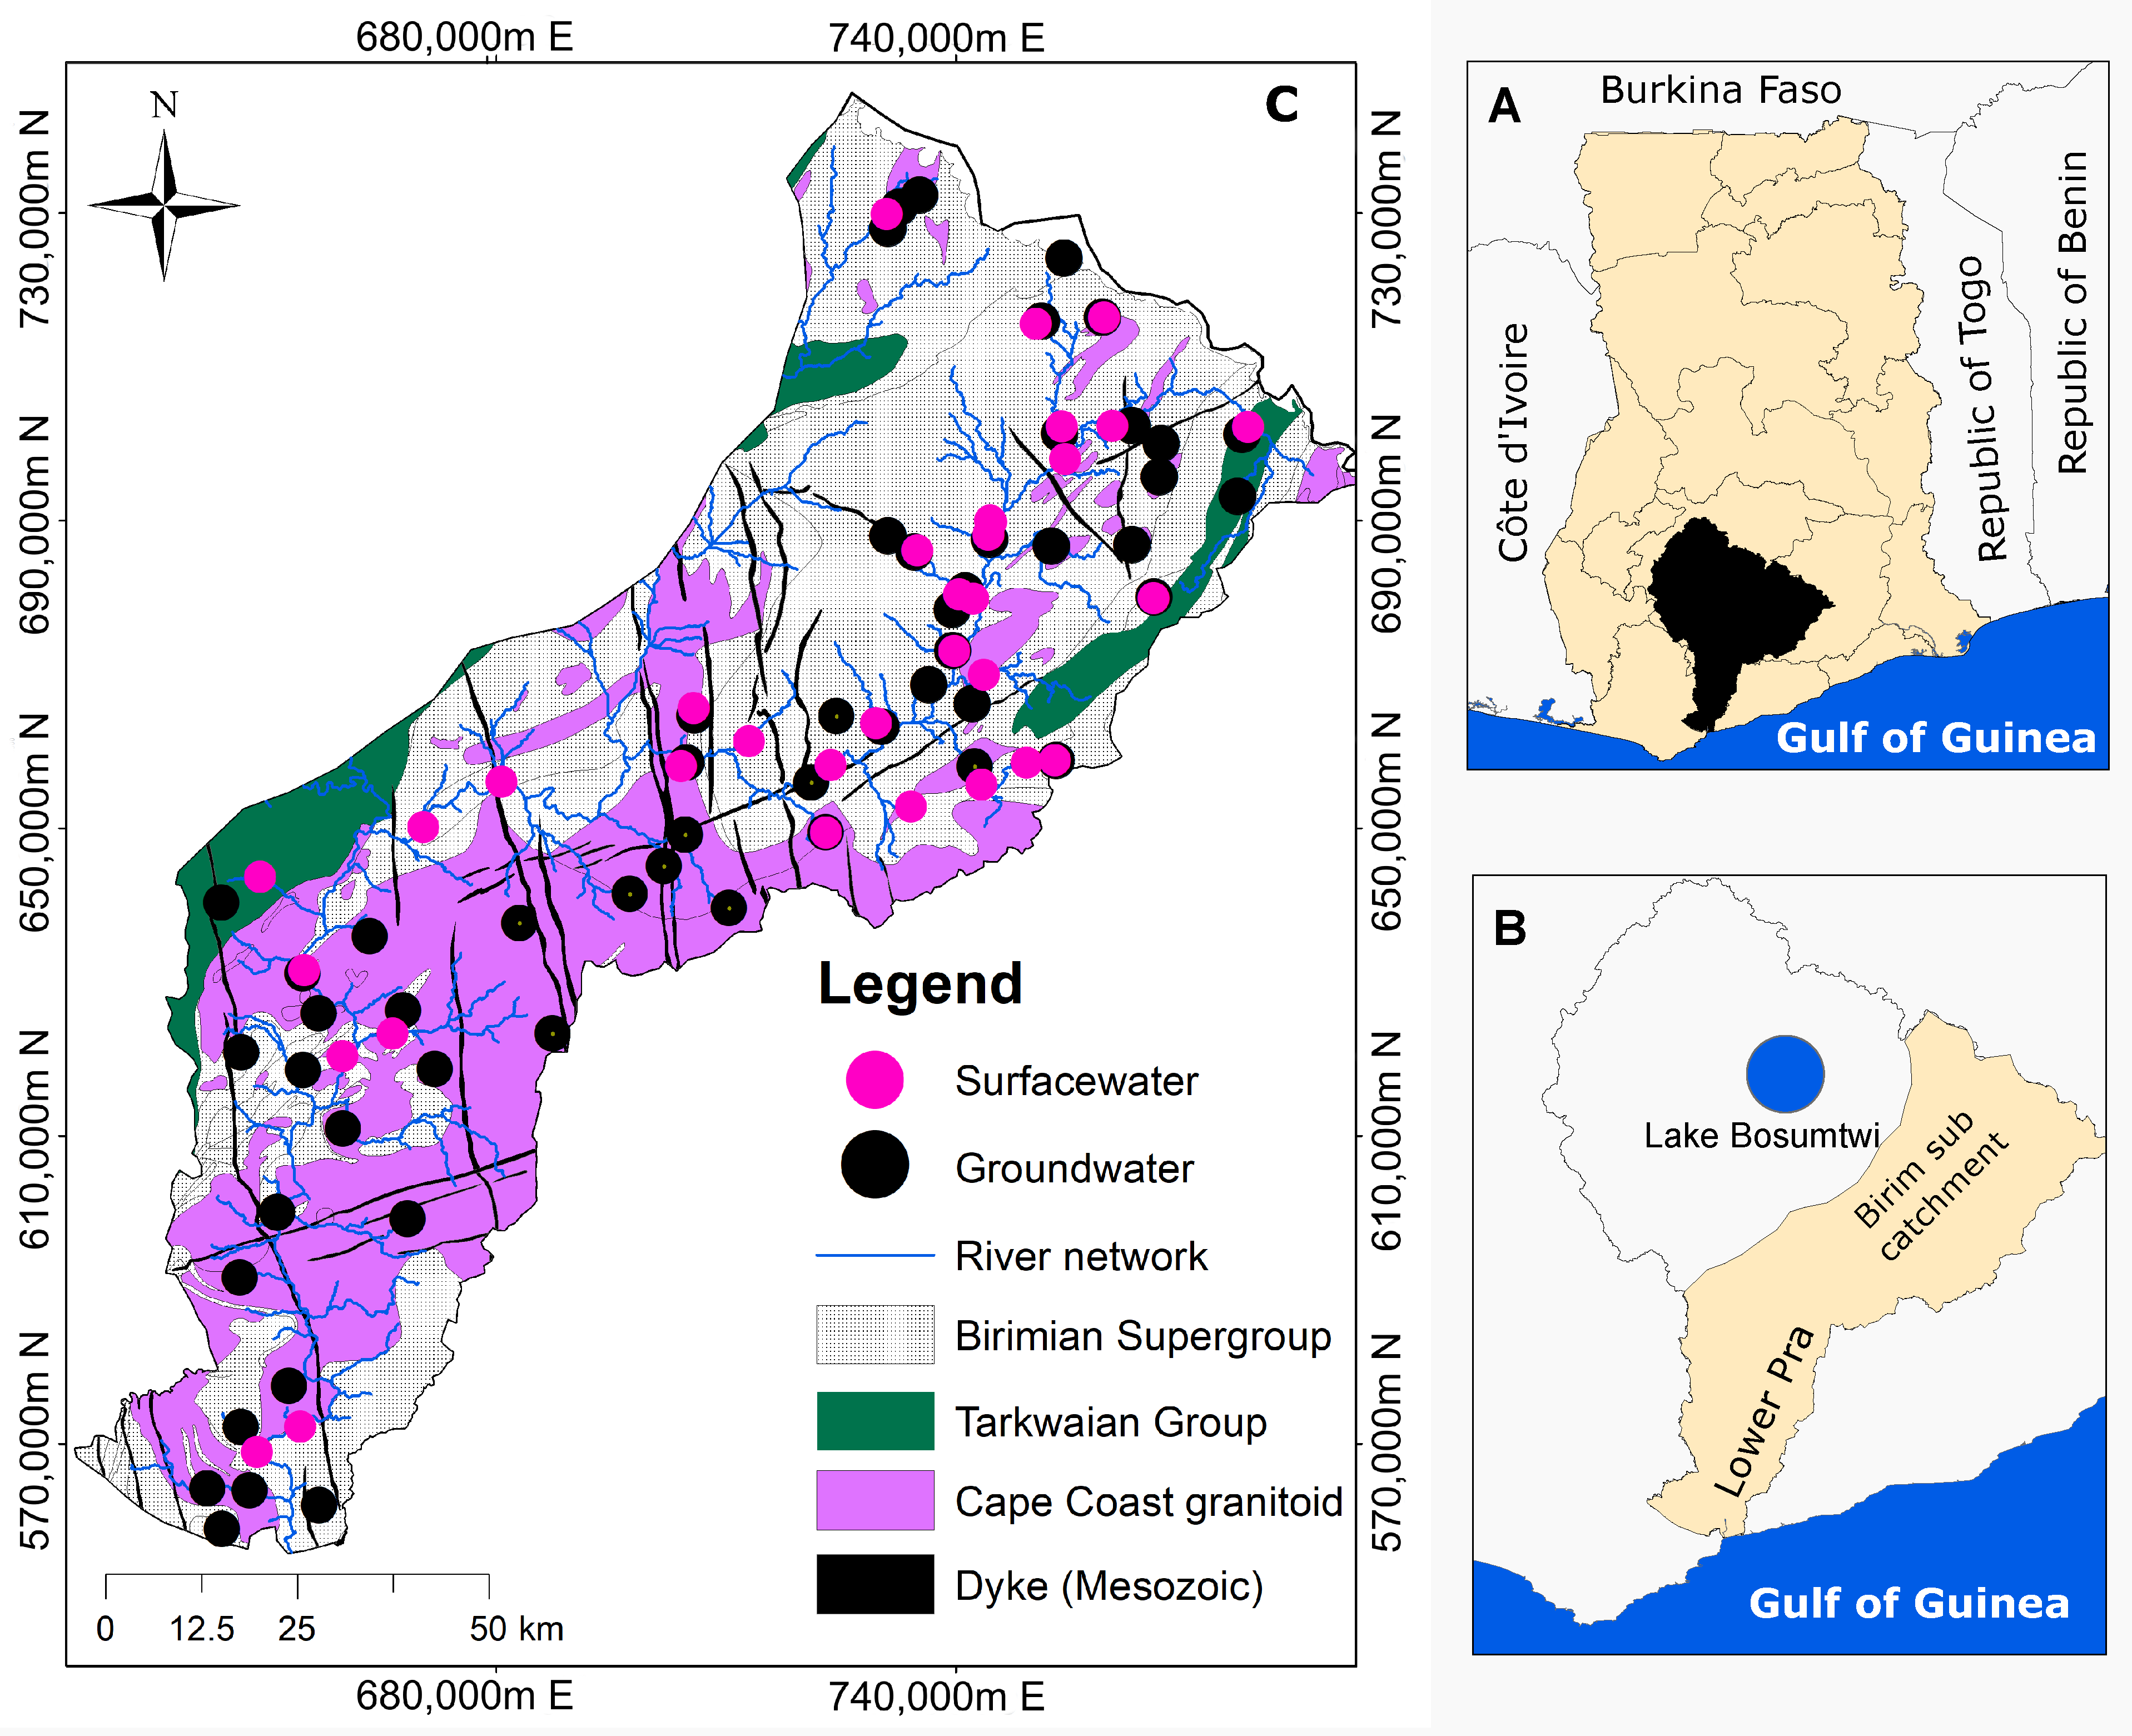
Figure 1. The location of the main Pra Basin in Ghana (A), the study area representing the Birim and the Lower Pra catchments of the Pra Basin (B), the geological map of the area showing the predominant rock types and the surface water and groundwater sampling locations (C). Modified after Manu et al. [1].
Water 15 03760 g001
Figure 2. A topographic map showing the distribution of the sampling points (modified after Manu et al. [28]). The northern boundary of the basin forms part of the Kwahu Mountain Range, with elevations reaching 850 m above sea level. Also visible is the river network with a major flow direction from the north to the south of the basin.
Water 15 03760 g002
Figure 3. Mean monthly precipitation (a) and temperature (b) climatology for the past fifty years (1964–2013) in the study area. Data source: Princeton University’s land surface modelling group, which has been biased corrected and down-scaled according to the observation-based global forcing dataset of Sheffield et al. [39].
Water 15 03760 g003
Figure 4. Box-and-whisker plots of the variation in the δ 18 O and δ 2 H ratios and the calculated d-excess for the surface water (a) and groundwater (b) samples for the three zones.
Water 15 03760 g004
Figure 5. Groundwater (a) ( δ 18 O ) and (b) ( δ 2 H ) values of the Pra Basin do not show significant correlation with elevation.
Water 15 03760 g005
Figure 6. (a) Surface water and groundwater δ 18 O and δ 2 H relationship plots used to infer the origin and evaporation influence. Also featured are the local [37] and the global [38] meteoric water lines. Both water sources defined an evaporation line with lower slopes, indicating the change in the δ 18 O and δ 2 H isotope ratios in the initial precipitation. (b) The d-excess vs. δ 18 O plot provide information about the influence of evaporation. Almost all samples plot below the d-excess of the LMWL, indicating that the precipitation that recharged the surface water and groundwater experienced evaporation. The intercept of the surface water and groundwater lines (A and B) indicates precipitation’s initial isotopic signature before recharge.
Water 15 03760 g006
Figure 7. (a) Conceptual diagram showing the potential recharge pathway affecting changes in groundwater isotopic composition and Cl concentration (modified after Love et al. [12]). (b) Deuterium vs. Cl shows no clear dominant process influencing groundwater recharge.
Water 15 03760 g007
Figure 8. Spatial interpolation of groundwater recharge based on the CMB approach as a percentage of the long-term mean precipitation (1500 mm) using the inverse distance weighting (IDW) method.
Water 15 03760 g008
Figure 9. Groundwater hydrographs and observed averaged monthly precipitation at some selected locations (a) Abaam, (b) Asuboni, (c) Atutumirem and (d) Kwaben in the Pra Basin for the water year 2022.
Water 15 03760 g009
Table 1. Monitored well characteristics in Ghana’s Pra Basin. The meta-sediment comprises weathered phyllite, shale, schist, while the granite comprises granitic to quartz dioritic gneiss.
CommunityWell IDLongitudeLatitudeElevation (m)Well Depth (m)Geology
AbaamPTB 20−0.824036.2218314670.8Meta-sediment
Asubone RailPTB 30−0.732446.4714419127.0Meta-sediment
KroboPTB 21−1.603355.061441356.0Meta-sediment
KwabengPTB 31−0.588646.3233720737.0Meta-sediment
WawasePTB 25−1.481855.146815920.0Meta-sediment
BronikromPTB 28−1.365286.0780414080.0Meta-sediment
AfosuPTB 29−1.000226.3705218748.0Meta-sediment
Dunkwa-KPTB 26−1.678175.9200710536.7Sandstone
Twifo-MampPTB 17−1.626845.669458828.6Granite
AtuntumiremPTB 19−0.985225.8716113340.5Granite
Table 2. List of specific yield values used in groundwater recharge estimate in India (modified after Sinha and Sharma [52].
MaterialRange of Specific Yield
Sandy alluvium0.12–0.18
Valley fills0.10–0.14
Silt/clay rich alluvium0.05–0.12
Sandstone0.01–0.08
Limestone0.03
Highly karstified limestone0.07
Granite0.02–0.04
Basalt0.01–0.03
Laterite0.02–0.04
Weathered phyllite, shale, schist, and associated rocks0.01–0.03
Table 3. Groundwater recharge values estimated for the Pra Basin for the water year 2022.
Well LocationAquifer MaterialSpecific Yield ( S y )Δh (m) 1st Wet SeasonΔh (m) 2nd Wet SeasonRecharge (mm) 1st Wet SeasonRecharge (mm) 2nd Wet SeasonMean Recharge (mm)As % of Annual Rainfall
AbaamMeta-sediments0.021.601.1332.022.627.31.82
AsuboniMeta-sediments0.020.871.0717.421.419.41.29
KroboMeta-sediments0.021.850.1537.03.020.01.33
KwabenMeta-sediments0.023.292.1265.842.454.13.60
WawaaseMeta-sediments0.021.240.9224.818.421.61.44
BronikromMeta-sediments0.020.120.232.44.63.50.23
AfosuMeta-sediments0.020.850.7417.014.815.91.06
Dunkwa-KSandstone0.050.730.4936.524.530.52.00
Twifo MampGranite0.031.470.7744.123.133.62.20
AtutumiremGranite0.031.050.9821.019.920.51.40
Note(s): Meta-sediments are composed of weathered phyllite, shale, schist and associated rocks. Δh designates the water level rise.
Disclaimer/Publisher’s Note: The statements, opinions and data contained in all publications are solely those of the individual author(s) and contributor(s) and not of MDPI and/or the editor(s). MDPI and/or the editor(s) disclaim responsibility for any injury to people or property resulting from any ideas, methods, instructions or products referred to in the content.