Abstract
The interpretation of the results of hydrogeological field observations and the modeling of fractured porous subsurface media is often conducted using dual-porosity and/or dual-permeability concepts. These concepts, however, do not consider the effects of spatial and temporal variations and uncertainties, or fuzziness, in the evaluation of the subsurface flow characteristics of fractured porous media. The goal of the paper is to introduce a concept of fuzzy dual permeability of fractured porous media based on the fuzzy system analysis of the results of ponded infiltration tests in fractured basalt. The author revisited the results of the tests conducted in areas close to the Idaho National Laboratory (INL), Idaho, USA: small-scale (approximately 0.5 m2) ponded tests at the Hell’s Half Acre site, mesoscale (56 m2) ponded tests at the Box Canyon site, and a large-scale infiltration test (31,416 m2) at the Radioactive Waste Management Complex at INL. Methods of fuzzy clustering and fuzzy regression were applied to describe the time-depth waterfront penetration and to characterize the phenomena of rapid flow through a predominantly fractured component and slow flow through a predominantly porous matrix component. The concept of fuzzy dual permeability is presented using a series of fuzzy membership functions of the waterfront propagation with depth and time. To describe the time variation of the flux, a fuzzy Horton’s model is presented. The developed concept can be used for the uncertainty quantification in flow and transport in geologic media.
1. Introduction
Ponded infiltration tests are often conducted to investigate how land surface flooding events affect infiltration, groundwater recharge (e.g., [1,2]), and agricultural studies [3]. Multiple factors affect the infiltration into the subsurface, such as rough or rocky surface topography, subsurface media heterogeneity, soil swelling or shrinking, soil aggregation, and water and air redistribution within the porous space (e.g., [4,5]). Moreover, the flow processes take place at different temporal and spatial scales (e.g., [6,7]) through rock matrix pore structures as relatively “slow” flows and fracture networks as ”fast” flows along localized preferential pathways. Therefore, the flow and transport in fractured rocks usually occur in a nonvolume-averaged fashion.
The modeling of nonvolume-averaged flow and transport processes in saturated–unsaturated fractured porous media is often conducted using macroscale continuum concepts, which are based on the application of the effective continuum, double porosity, dual permeability, or multiple interacting continua models (e.g., [8,9,10,11]). Contrary to the dual-porosity model that assumes stagnant water in the matrix, a dual-permeability model is based on the water exchange between the matrix and the fractures. However, such models may be inadequate for resolving spatially localized and nonrepeatable time-varying flow phenomena [12,13]. For example, a series of infiltration tests in fractured basalt demonstrated that the temporal trends of the infiltration rate are unrepeatable [14,15]. One of the reasons for the unrepeatability of the infiltration trend is the system’s nonlinearity. Because of the system’s nonlinearity, small changes in the initial and boundary conditions cause the unrepeatability of flow dynamics in successive ponded infiltration events, as well as nonlinear and nonstationary processes and a combination of feedback and feedforward phenomena in heterogeneous subsurface media. In practice, even the application of modern hydrogeological, soil physics, geophysical, and geochemical techniques provides scarce and insufficient information to reasonably represent hydrologic model parameters. Significant uncertainties in the interpretation of field data limit the application of the classical infiltration theory (e.g., [16,17]) and numerical methods for predictions [13].
In recent years, the possibility theory and methods of fuzzy system analysis have been used to address experimental and modeling uncertainty in various fields of science, including physics, chemistry, and hydrology. For example, Bárdossy and Disse [18] were probably the first to apply fuzzy rule-based models for the assessment of infiltration. Bárdossy and Duckstein [19] presented a comprehensive analysis of the modeling of uncertainty, vagueness, and imprecision using a fuzzy logic approach in the field of hydrology, which can handle the modeling of large-scale nonlinear systems such as groundwater flow and pollution. Several other publications aimed at the use of fuzzy logic methods in the field of hydrology (e.g., [20,21,22,23]). A concept of fuzzy permeability and porosity to assess the seepage in reservoirs was applied in [24].
The goal of the paper is to introduce a concept of fuzzy dual permeability of fractured porous media based on the fuzzy systems analysis of the results of ponded infiltration tests in fractured basalt. To achieve this goal, the author revisited the data obtained from a series of ponded infiltration tests conducted in fractured basalt in areas close to the Idaho National Laboratory (INL), Idaho, USA, at different scales: small scale (approximately 0.5 m2) ponded tests at the Hell’s Half Acre site [15]; mesoscale ponded tests at the Box Canyon site [14]; and a large-scale test at the Radioactive Waste Management Complex at Idaho National Laboratory [7,25].
The structure of the paper is as follows. Section 2 presents the summaries of ponded infiltration tests, illustrating the temporal dynamics of the flow rate at the land surface and the time-depth of penetration of the waterfront. Section 3 presents a summary of the methods of fuzzy system analysis, namely, the fuzzy regression and clustering used for the interpretation of the results of experiments. Section 4 demonstrates the results of the fuzzy data analysis, and Section 5 includes conclusions.
2. Summary of Field Ponded Infiltration Tests
2.1. HHA Infiltration Tests
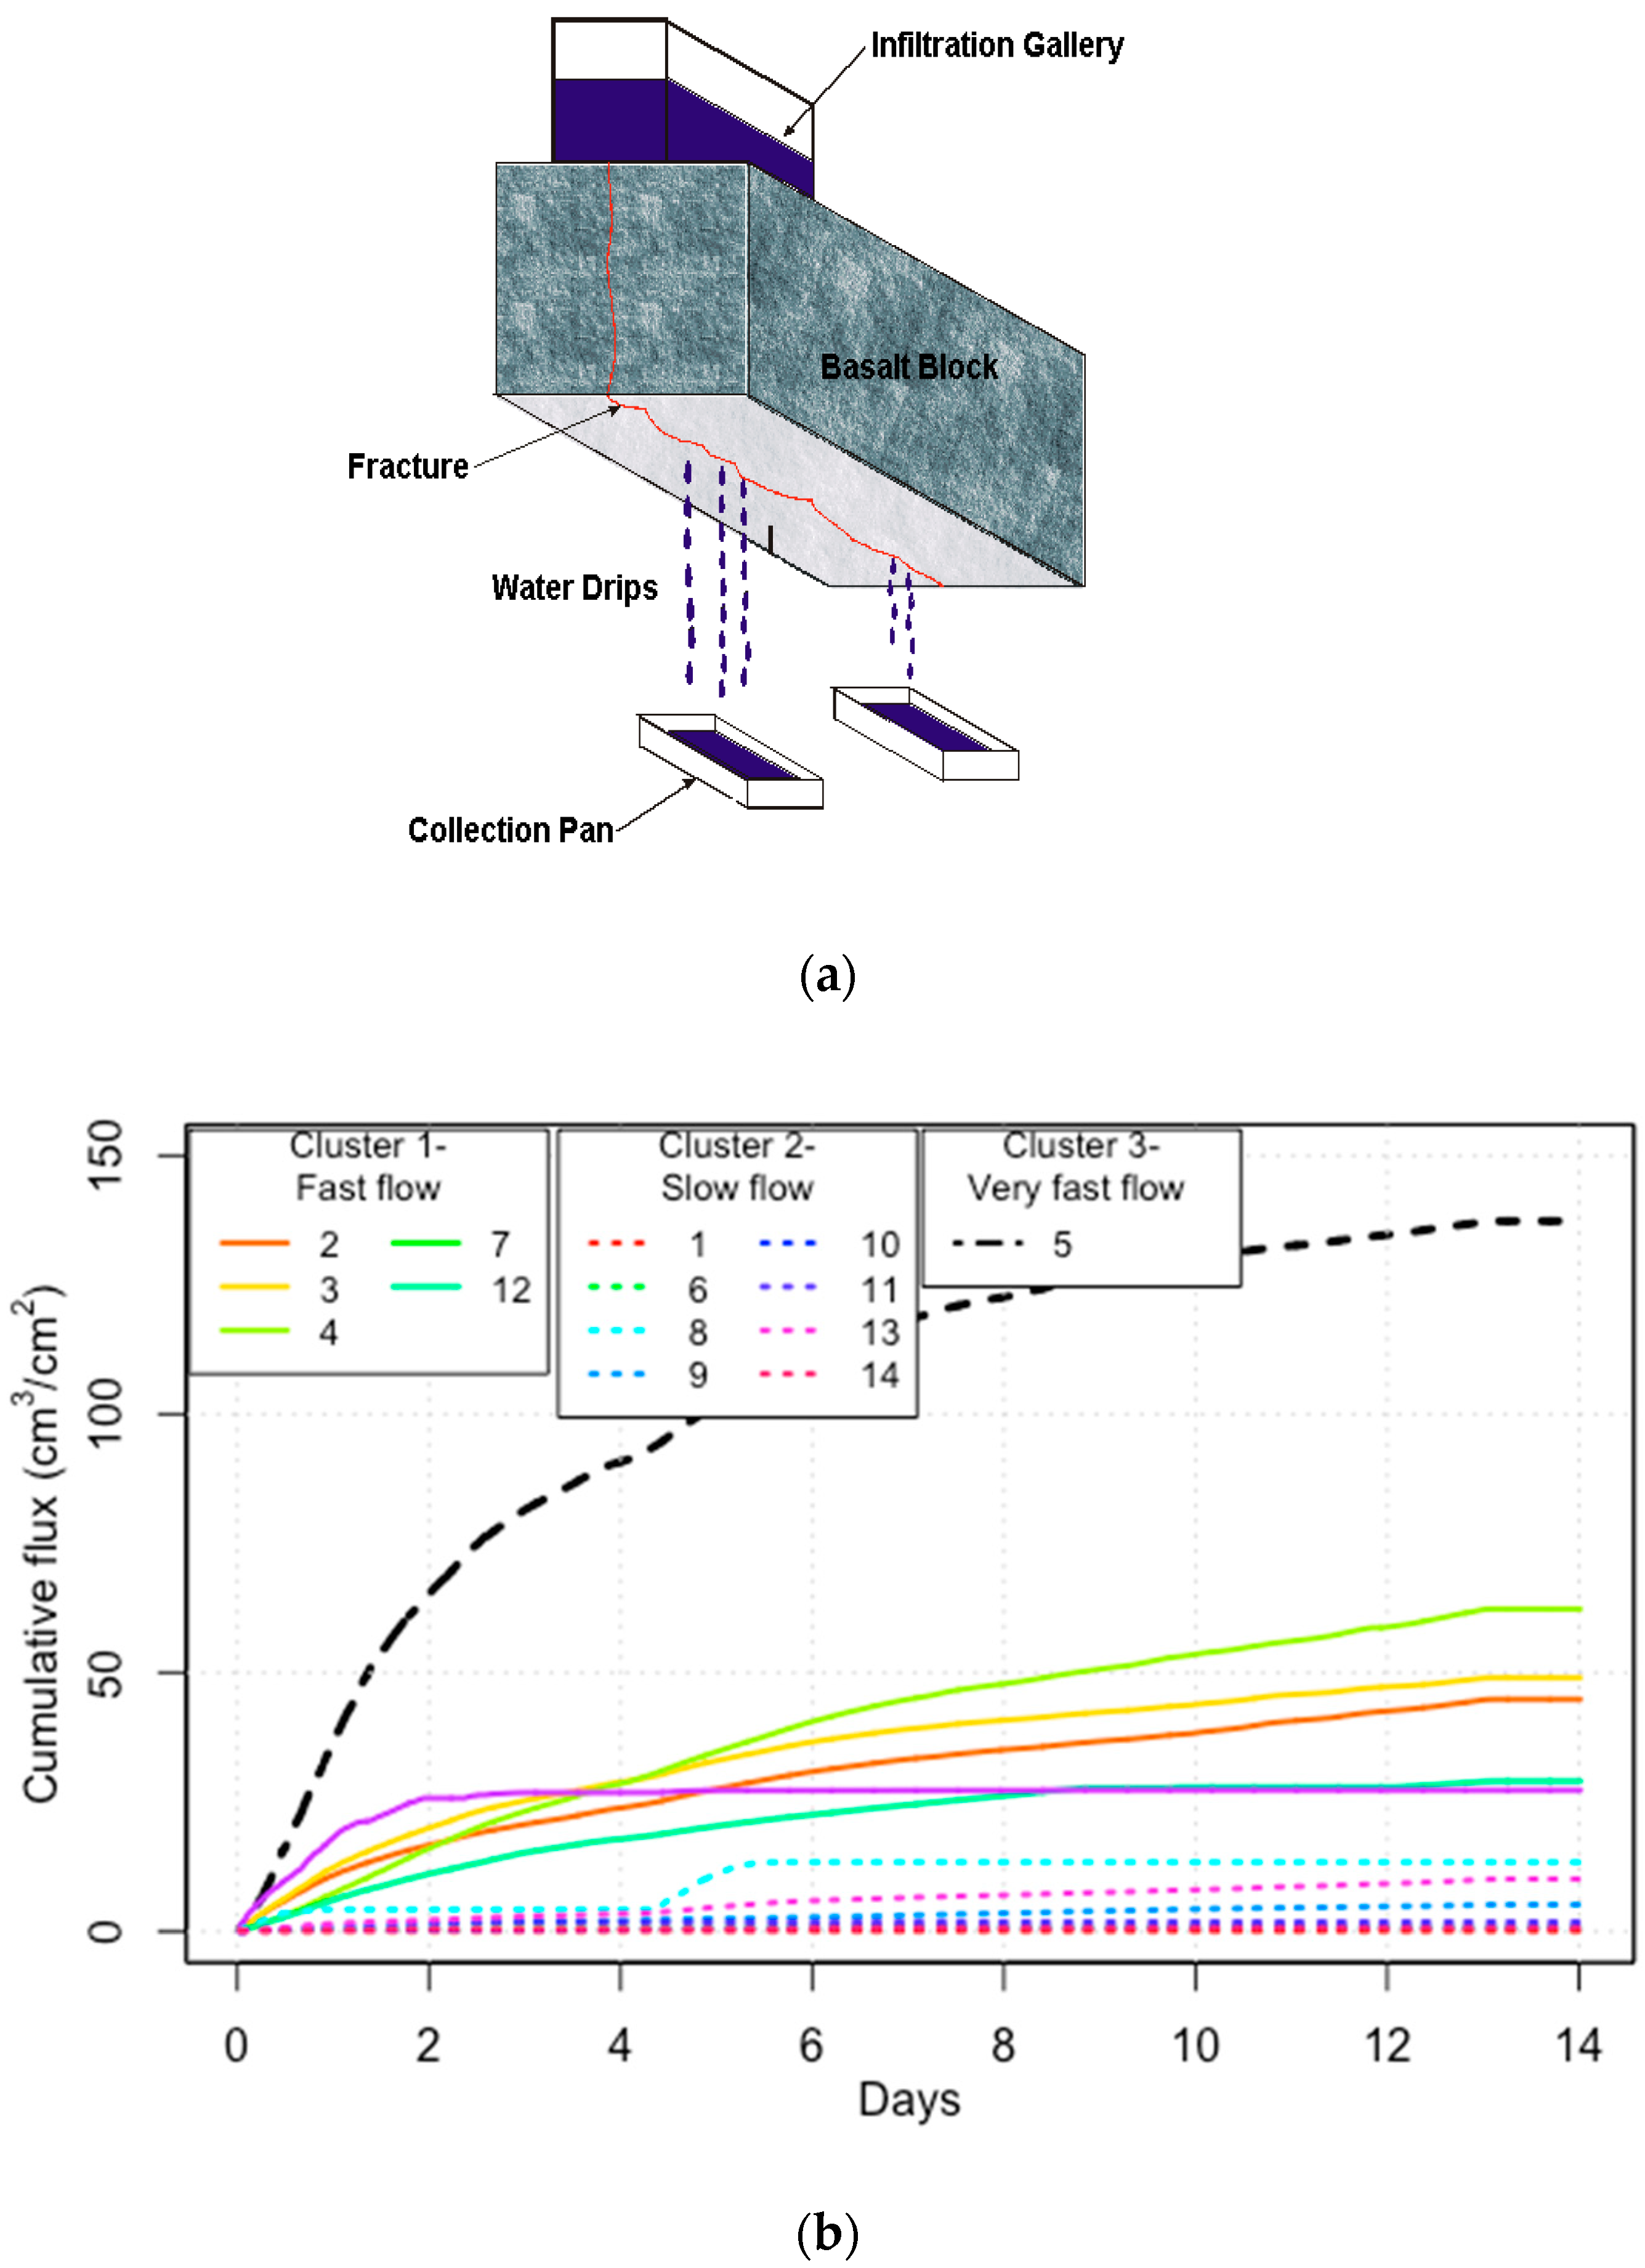
Water was supplied from an infiltration reservoir of 40 by 80 cm, and infiltrating water was collected in collection pans (each 20 by 30 cm) on the underside of the basalt column [15]. (Note that fractured basalt is one of the most permeable types of fractured rock [26].) The influx was measured as the water volume supplied to maintain a constant water level in the infiltration reservoir, and the outflux was measured in individual pans. Figure 1a shows a schematic of the test, and, as an example, Figure 1b shows graphs of a cumulative flux vs. time collected in the collection pans during one of the infiltration tests. The time of the water penetration was detected using the tensiometers installed at different depths within the basalt ledger.
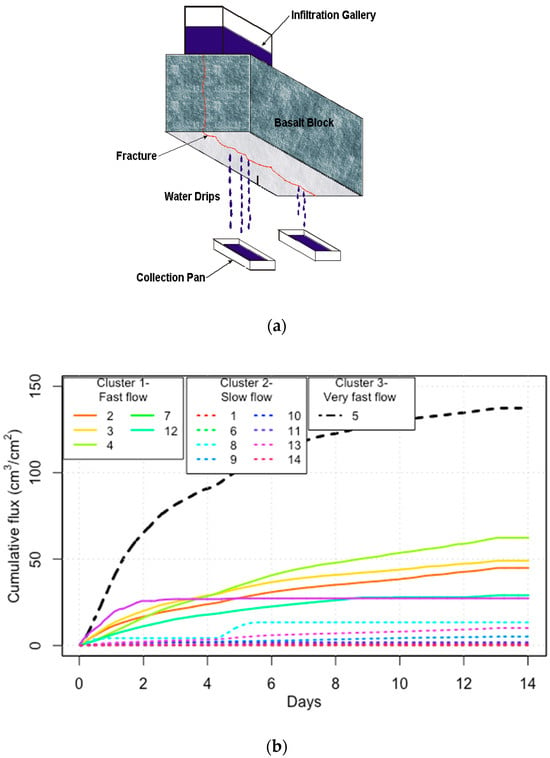
Figure 1.
(a) A schematic of the small-scale (0.5 m2) Hell’s Half Acre ponded infiltration test [15], and (b) graphs of the cumulative water flux plotted using data collected in individual pans during the ponded infiltration tests at the HHA site (solid and dashed lines correspond to three clusters of the individual pans; explanation will be given in Section 4.2).
In all tests at the HHA, an initial decrease in the infiltration rate was observed, which may have been caused by the air redistribution and entrapment [14,15,27], the development of the capillary pressure at the waterfront [28], microbiological clogging of fractures, and basalt in the near-surface zone. The analysis of the Horton model parameters of the cumulative flux is given in Section 4.2 below.
2.2. Box Canyon Infiltration Tests
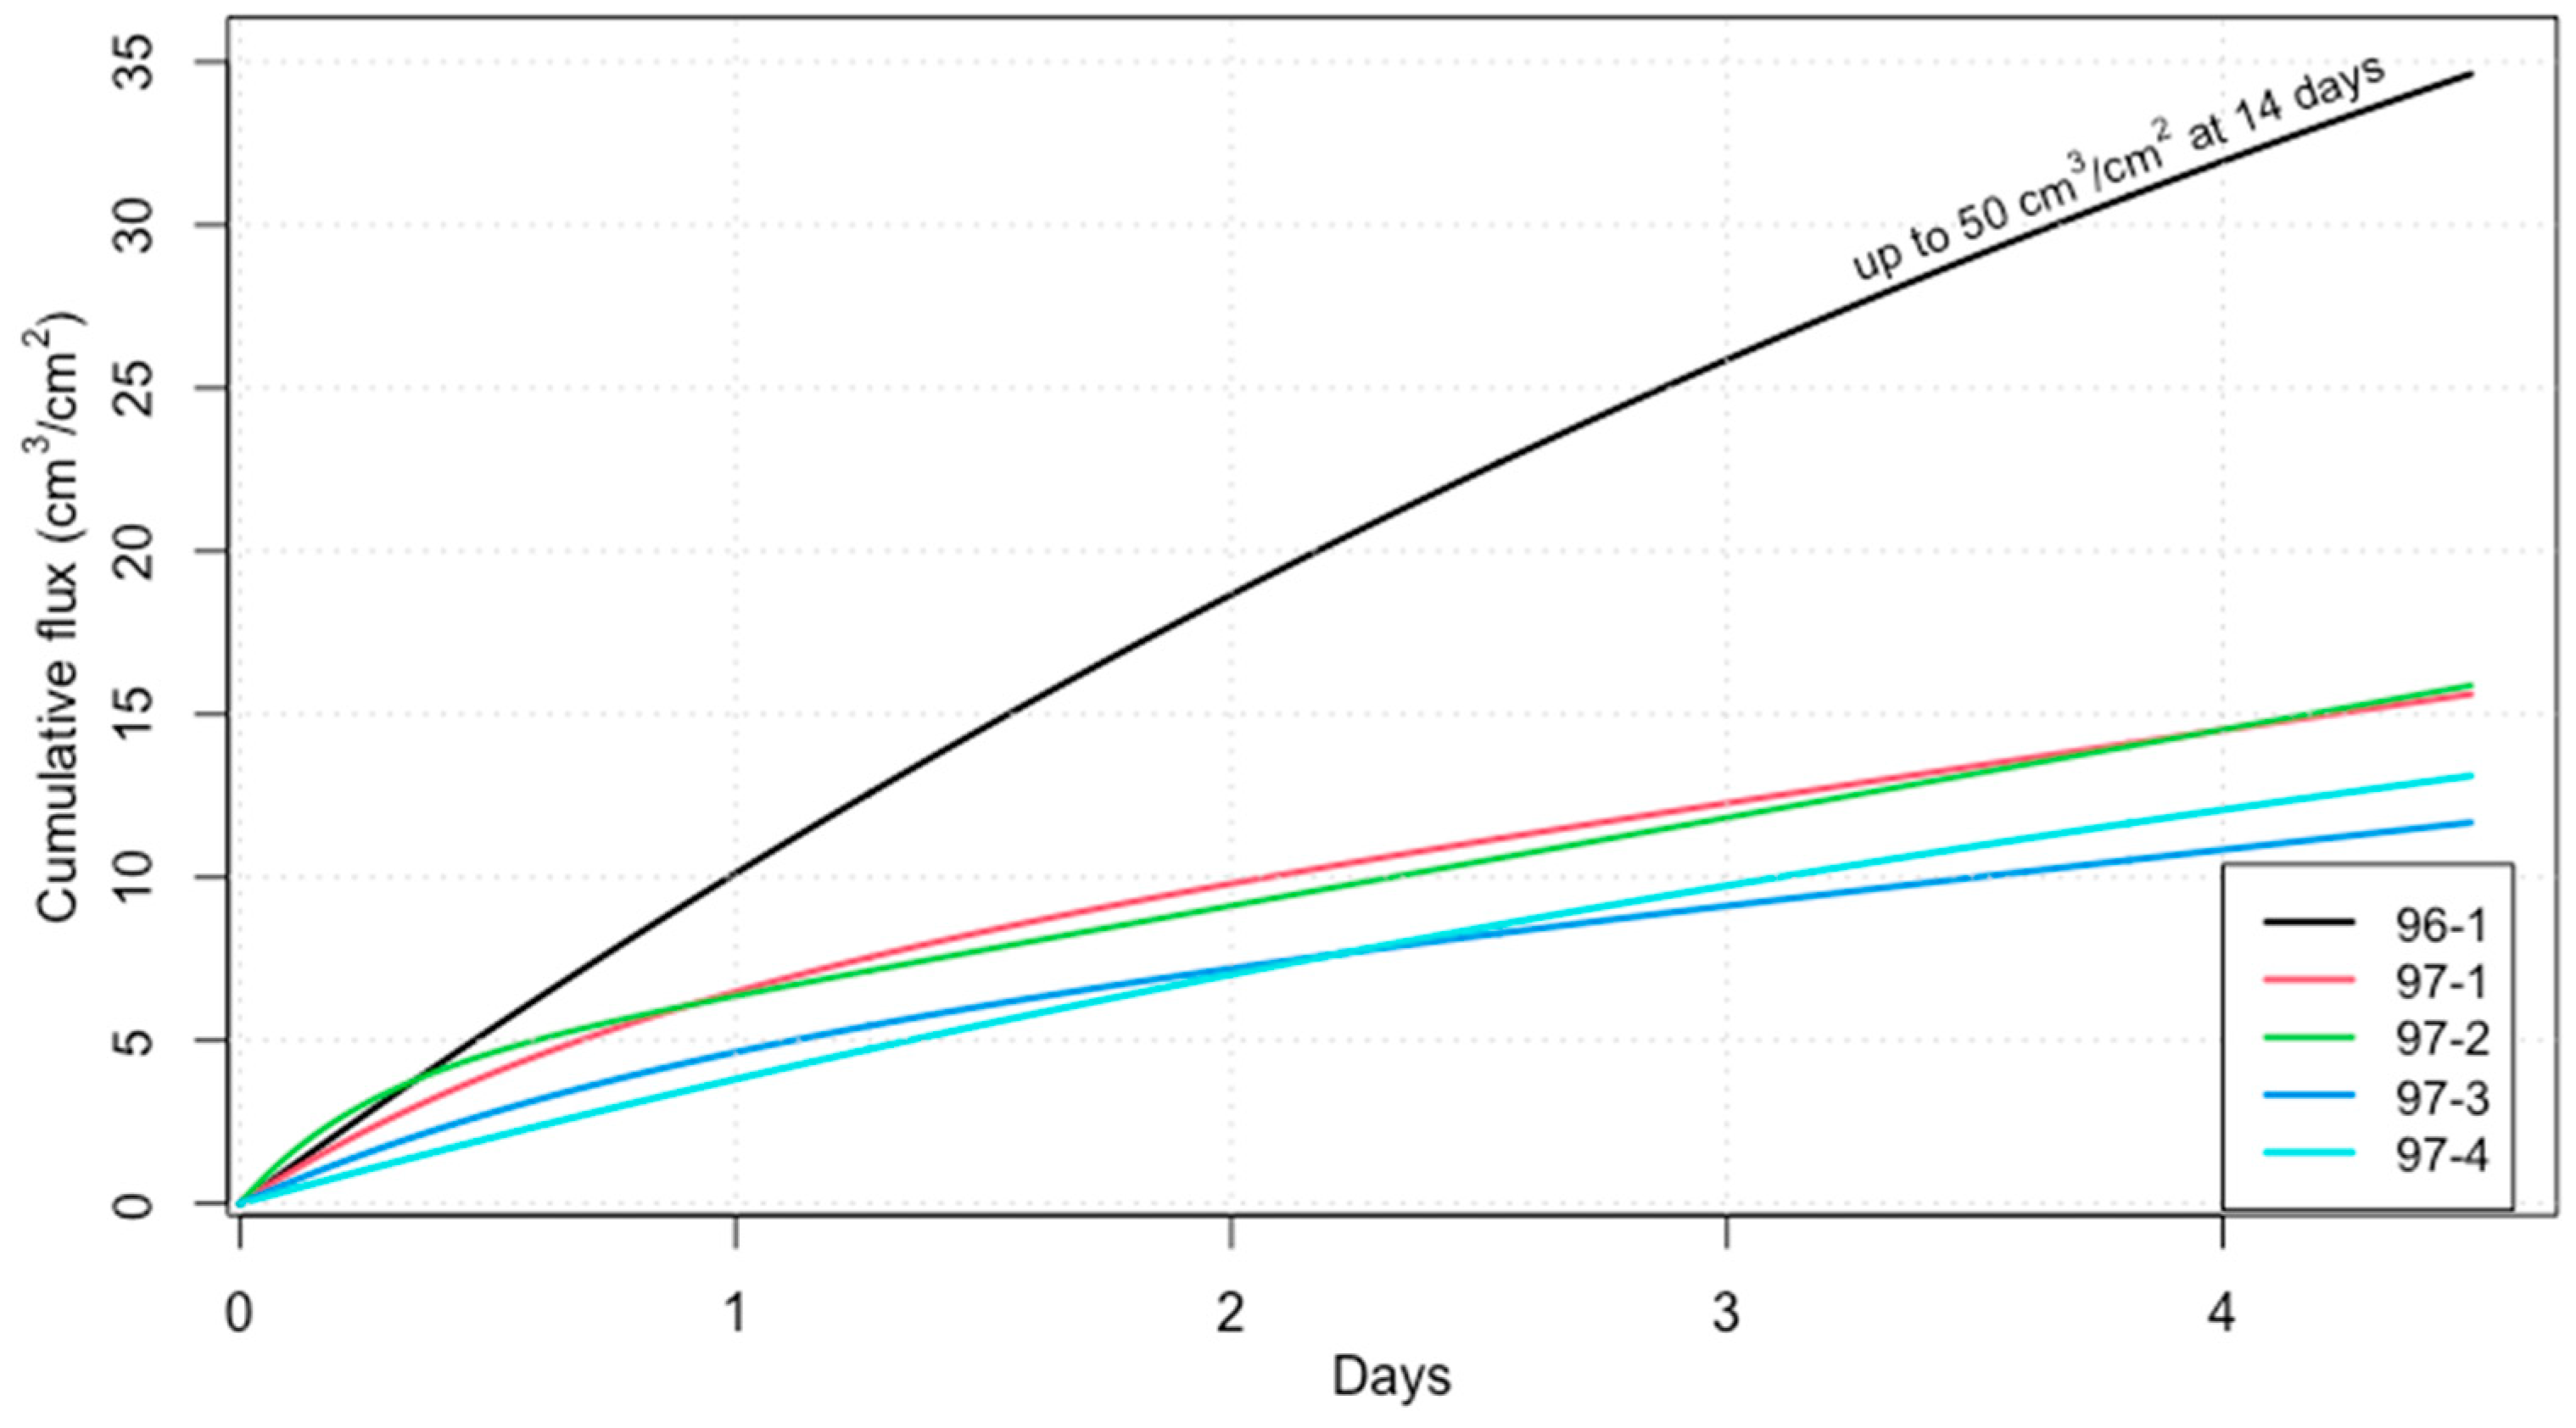
Eight mesoscale infiltration tests were conducted at the Box Canyon (BC) site using a surface pond of 7 m by 8 m = 56 m2. The infiltration tests included one 2-week test, three 2-day tests, and one 4-day test. Overall, all tests showed a decrease in the infiltration rate with time, presumably because of mechanical or microbiological clogging of fractures and the vesicular basalt in the near-surface zone, as well as the effect of entrapped air.
The subsurface moisture redistribution was monitored with tensiometers, neutron logging, time domain reflectometry (TDR), and ground-penetrating radar (GPR). A conservative tracer, potassium bromide, was added to the pond water to monitor water flow with electrical resistivity probes and water sampling. The analysis of the monitoring data shows evidence of preferential flow rather than the penetration of a uniform wetting front.
A comparison of the graphs of the temporal trends of the infiltration rate with time shows that these trends are not repeatable (Figure 2) and are affected by rapid preferential flow through the largest vertical fractures, followed by a gradual saturation of other fractures and the basalt matrix, as well as water redistribution within horizontal fractures and rubble zones, enabling the development of local perched water bodies [15]. Because of the complex three-dimensional preferential water flow, local water pressure measurements using tensiometers are of limited use for the evaluation of a hydraulic gradient and calculations of hydraulic conductivity [29]. The cumulative ponded water flux for each test, shown in Figure 2, was calculated using Horton’s perceptual model given by [30,31]
where q is the cumulative flux at time t, if is final (constant) flux, io is the initial flux, and β is the decay parameter called Horton’s coefficient. The model parameters used for calculations are given in Table 1. This model describes experimental data very well, as the correlation coefficients determined by fitting Horton’s cumulative flux to data collected in the field for all tests were 0.99 [14]. (The fuzzy analysis of the parameters of the Horton equation is presented in Section 4.2.)
q = if ∗ t + (1/β) (io − if) [1 − exp (−β ∗ t)]
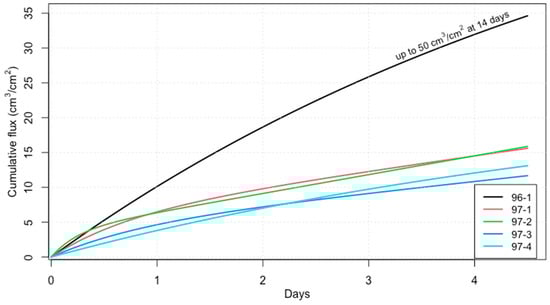
Figure 2.
Time variations of the cumulative total volume of water infiltrated during the Box Canyon tests, which were calculated from the Horton equation with the parameters given in Table 1.

Table 1.
Parameters of the Horton equation used to describe the cumulative water flux during the Box Canyon tests [14].
2.3. Large-Scale Infiltration Test at the Radioactive Waste Management Complex at INL
The large-scale infiltration test (LSIT) was conducted at the Radioactive Waste Management Complex of INL using a pond of 200 m in diameter (31,416 m2 in area) with the application of various tracers [7,25]. Figure 3 illustrates the breakthrough curves (BTCs) of selenium, which was used as a tracer, at the different monitoring wells. These BTCs demonstrate significant variations in the water travel time at different locations. Observations showed that the tracer travel time to the outer Ring C of monitoring wells, located more than 100 ft from the inner Ring B, is in the same range as that to inner Ring B. The tracer breakthrough curves were used for the evaluation of the water arrival times to different depths, and the data were analyzed in Section 4.1 below along with the data from the HHA and Box Canyon tests.
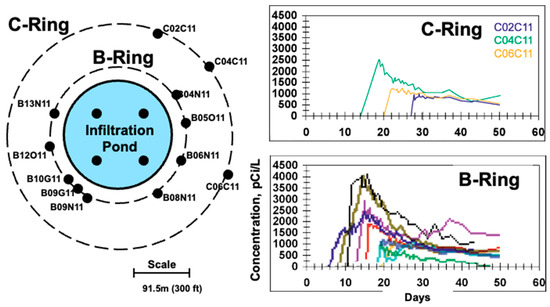
Figure 3.
(a) A schematic of the large-scale infiltration test at the RWMC, Idaho, and (b) Time series of Se-75 concentration at Rings B and C shown in (a), demonstrating evidence of spatial and temporal variabilities in waterfront arrival and breakthrough curves [7,25].
3. Methods of Fuzzy Data Analysis
3.1. General Idea of Fuzzy Data Analysis and a Fuzzy Membership Function
Fuzzy systems analysis is an effective method to describe the relationships between model parameters when the data are vague or uncertain, and when the sample size is low or insufficient to apply conventional statistical methods [32,33]. The key concept of fuzzy systems analysis is the application of membership values, which express the extent to which an object meets vague or imprecise systems properties. A fuzzy membership function is defined as A = {(x, µA(x))|x X}, where µA(x) is called the membership function for the fuzzy set A, and X is referred to as the universe of discourse. The membership function A is used to associate each element x X with a value within the interval [0, 1]. A fuzzy membership function expresses an imprecise, rather than exact, quantity, as is the case with “ordinary” (single-valued) numbers. In other words, an FMF is a function in a domain that is a specified set of real numbers. Each numerical value in the FMF domain is assigned a specific grade of membership within the range from 0, representing the smallest possible grade, to 1, representing the largest possible grade. A fuzzy membership function generally bounds a probability distribution function (PDF). In Figure 4, a fuzzy number shown in red is said to “enclose” a probability distribution shown in the blue color. A fuzzy number also expresses the idea that what is probable must preliminarily be possible.
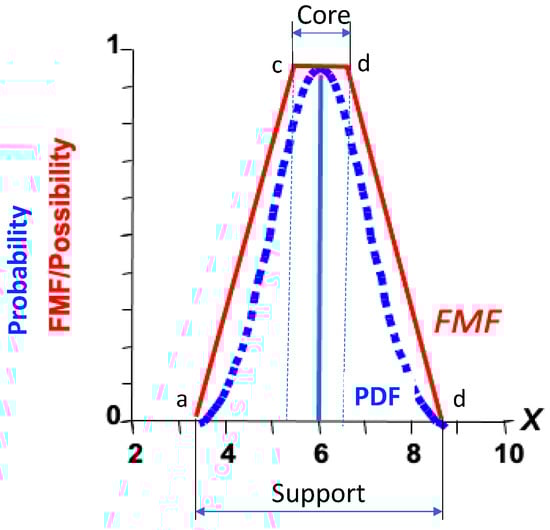
Figure 4.
Illustration of a concept of the fuzzy membership function (a possibility function, which is in red) that is defined using the four points (a, b, c, and d), in comparison with the probability distribution function (shown in blue).
There are different shapes of fuzzy numbers, for example, triangular, trapezoidal, Gaussian, and sigmoidal membership functions. As an example, Figure 4 shows a trapezoidal fuzzy membership function that is defined using the four parameters a, b, c, and d, and is given by
The span from a to d is called the support of the FMF, and the span from b to c represents the highest membership value that an element can take and is called the core. If x is (a, b) or (c, d), then it will have a membership value between 0 and 1.
The Gaussian fuzzy membership function depends on two parameters, the center and the width of a fuzzy set. Gaussian FMFs are popular for expressing symmetrical and smooth fuzzy sets. The Gaussian FMF can be obtained using the unity-based normalization, or the rescaling of the PDF to the range in [0, 1], which was used to obtain the Gaussian FMFs in Section 4.1 below.
In this paper, the probability density functions were estimated using a limited number of data points, which are generally ubiquitous and present a conceptual challenge in the statistical data analysis [32,33]. Our goal is to first estimate the density function from the limited observed data, based on the nonparametric approach to the evaluation of the PDF. To obtain the smooth PDF curves, which were then converted to the FMF curves, the density function of the R library stats with the application of the kernel biweight was used.
3.2. Fuzzy Clustering and Fuzzy Regression
Fuzzy clustering is a method of clustering that expresses the idea that a point may belong to one or more clusters [34,35]. Fuzzy clusters are identified in such a way that the data points in the same cluster are close to each other and are similar, but data points in other clusters are far apart. Fuzzy clustering is frequently used in pattern recognition and is applied in this study to identify the time-depth waterfront penetration. Specifically, a fuzzy k-means clustering algorithm FKM of the R package fclust was applied. Fuzzy k-means is the same algorithm as k-means, which is a popular simple clustering technique, but instead of assigning a point exclusively to only one cluster, it can have some sort of fuzziness or overlap between two or more clusters.
The fuzzy/possibilistic regression is applicable in cases when the data size or structure prevents an application of common statistical analysis. A fuzzy linear regression algorithm fuzzylm, using the least squares (PLRLS) method in the R package fuzzyreg, was applied to analyze the results of the fuzzy clustering of the time-depth waterfront penetration. Note that the fuzzy confidence intervals are different from a statistical linear regression model. The input data of the time-depth waterfront penetration represent crisp numbers, and the model predicts the response in the form of nonsymmetric triangular fuzzy numbers. (A list of R libraries used in this study is given in the References [36,37,38,39,40]).
4. Results of Fuzzy Data Analysis
4.1. Fuzzy Clustering and Fuzzy Regression of the Time-Depth Waterfront Penetration
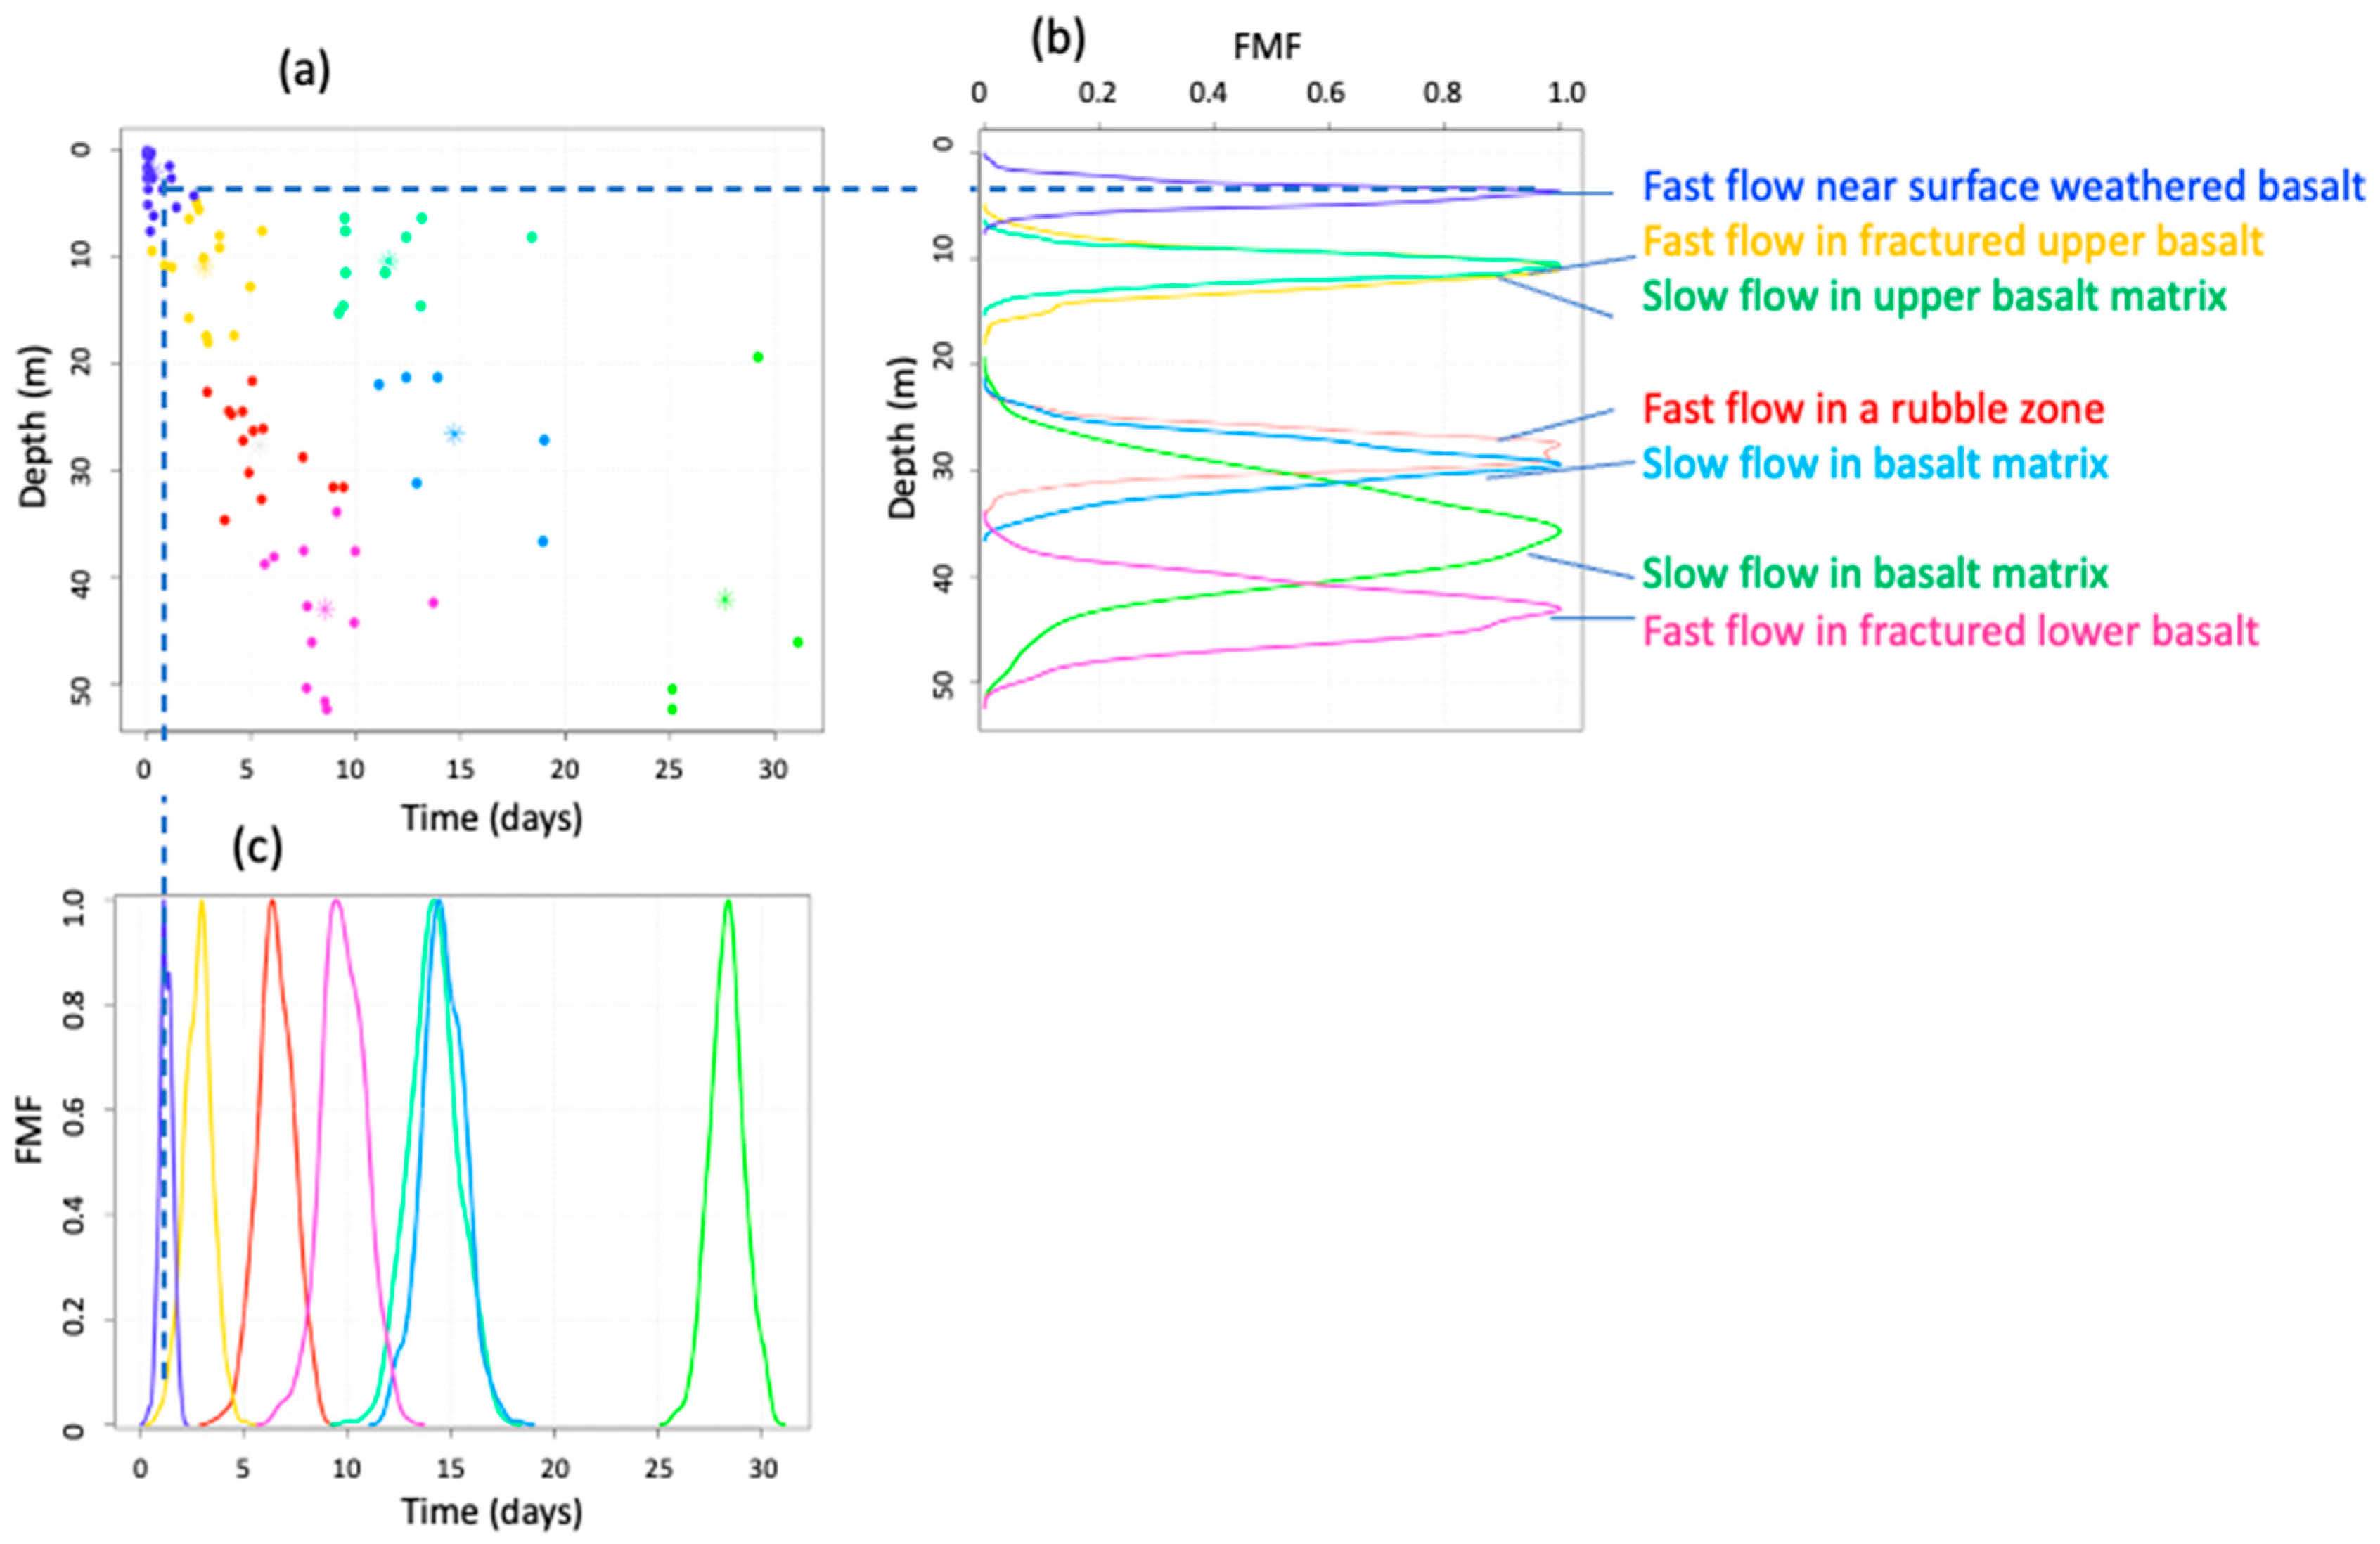
Fuzzy clustering: The scatter plot of the depth vs. time of the waterfront penetration (based on 92 data points) is shown in Figure 5a. The results of the clustering into the seven clusters are shown in color, and the cluster centers are shown using the asterisks. The fuzzy membership functions corresponding to the depths of each cluster are shown in Figure 5b, and the fuzzy membership functions corresponding to the time of each cluster are shown in Figure 5c. The examination of Figure 5a shows that there were two types of flow paths—fast flow paths and slow flow paths—and the correspondence of the fuzzy membership functions to different types of flow in different lithological features (near-surface weathered basalt, fractured upper basalt, matrix of upper basalt, a rubble zone between the upper and lower basalt flows, and fractured and matric lower basalt flow) are shown on the right-hand side of Figure 5b.
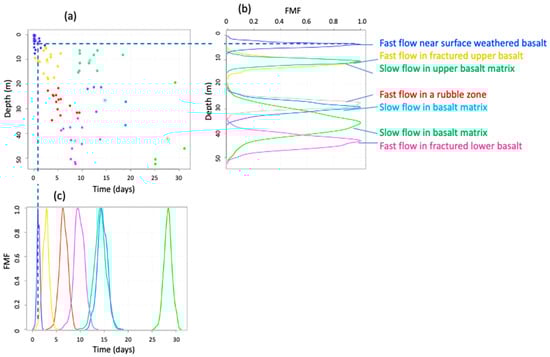
Figure 5.
Fuzzy clustering of water travel time vs. depth from three field ponded infiltration tests in fractured basalt: (a) the scatter plot of the depth vs. time of the waterfront penetration, based on the data from the three ponded infiltration tests, (b) fuzzy membership functions of the depths corresponding to the clusters shown in (a), and (c) fuzzy membership functions of the time corresponding to the clusters shown in (a,b). The colors of FMFs in (c) correspond to the clusters identified in (b). The vertical and horizontal dashed blue lines represent an example of mapping between the depth and time for the clusters “Near-surface weathered basalt”.
Fuzzy regressions: Figure 6 illustrates the results of the fuzzy linear regression of the waterfront penetration for the clusters corresponding to the fast flow paths (blue color) and slow flow paths. The blue and red solid lines represent the fuzzy functional relationship between the time and depth of the waterfront penetration in a fuzzy environment for the fast and slow flow paths, and the corresponding dashed lines represent the 95% confidence intervals (CIs). Figure 6a shows that the 95% CI areas representing the fast and slow paths (blue and red shaded areas) overlay each other. The equation of the relationship between the depth and time of the fast waterfront penetration is given by
and the equation for the slow waterfront penetration is given by
where Depth is in meters, and Time is in days.
Depth = 2.34 + 3.63 ∗ Time,
Depth = 1.09 + 1.11 ∗ Time,
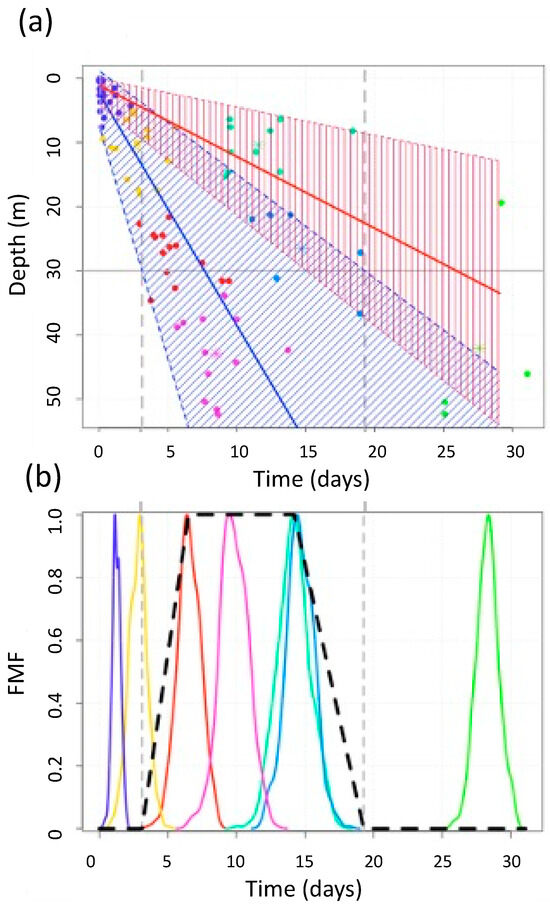
Figure 6.
(a) Results of the application of fuzzy regression of the waterfront penetration along the fast flow paths (blue color) and slow flow paths (red color). Solid blue and red lines are fuzzy regression lines and dashed blue and red lines are 95% CIs. (b) FMFs of time of the clusters, and a dashed black line is the trapezoidal FMF that corresponds to the water arrival at the depth of 30 m. The trapezoidal FMF with support = [3.098,19.2837] and core = [6.5,14.2]. The colors of FMFs in (b) are the same as in Figure 5.
The coefficients of 3.63 m/day and 1.11 m/day of these equations express the average velocities of the waterfront penetrations for the fast flow paths and the slow flow paths, respectively.
The spread of the 95% CIs can be used to assess the FMF of the water travel time. For example, Figure 6a shows a gray color horizontal solid line at a 30 m depth. The intersections of this line with the 95% CIs of the fast flow clusters are used to define the support (for the value of the FMF = 0) of the trapezoidal FMF to represent the FMF of the water arrival to the depth of 30 m. The peaks of the clusters within this interval are used to define the core of the FMF (for the value of the FMF = 1). The overlay of the 95% CIs indicates that the distinction between the fast and slow flow paths is generally uncertain based on the results of the fuzzy analysis of flow phenomena.
4.2. Fuzzy Analysis of the Infiltration Rate and Parameters of Horton’s Infiltration Model
The parameters of Horton’s model for individual infiltration tests were evaluated in publications [14,15]. In this paper, the minimum and maximum flow rates, and Horton’s β coefficient for the HHA and Box Canyon tests are given using the FMFs. The FMFs were determined based on the evaluation of the normalized PDFs of the if, io, and β parameters (as described in Section 3.1), and the results are shown in Figure 7. Figure 7a,b are plotted using the same scale of the x-axis to visually compare the ranges of the infiltration rate at the small-scale HHA site and the mesoscale Box Canyon site. These figures demonstrate the larger ranges of the area-averaged infiltration ranges of io and if at the HHA site, which can be explained by the fast infiltration through the near-surface weathered fractured basalt, and which corresponds to the fast waterfront penetration cluster shown in Figure 4.
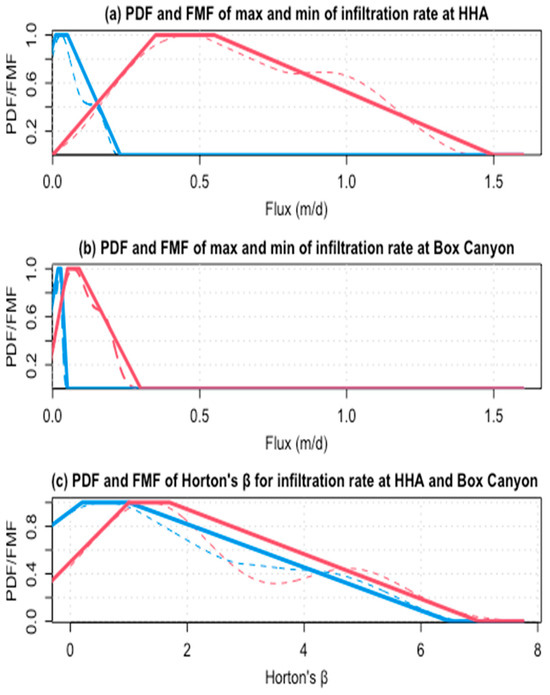
Figure 7.
Comparison of the fuzzy membership functions of the area-averaged Horton’s model parameters if and io for the HHA and Box Canyon infiltration tests. Dashed lines are calculated PDFs, and solid lines are fuzzy membership functions. In (a,b), the red color is the maximum infiltration rate, and the blue is the minimum infiltration rate. In (c) the red is Horton’s β for the HHA tests, and the blue is for the Box Canyon tests.
The fuzzy k-means clustering was applied to cluster the cumulative outflux data collected in individual pans during one of the infiltration tests at the HHA site. Figure 1b demonstrates that the outflux curves can be clustered into three clusters that correspond to the clusters of fast flow (Cluster 1), slow flow (Cluster 2), and very fast flow (Cluster 3).
5. Conclusions
Uncertainty is inherently involved in the characterization of hydrological processes in fractured porous media, even when using modern field characterization and monitoring techniques. Field observations are commonly characterized by imprecise, vague, and ambiguous information, which justifies the application of a fuzzy systems analysis. To introduce the concept of fuzzy dual permeability of fractured porous media, the data from the ponded infiltration tests conducted in fractured basalts near the INL, Idaho, were analyzed: small-scale infiltration tests at the HHA (0.5 m2 scale), mesoscale infiltration tests conducted at Box Canyon (56 m2), and the LSIT at the Radioactive Waste Management Complex (200 m radius). The application of the fuzzy systems analysis, specifically, the fuzzy clustering and regression, to the characterization of the time-depth waterfront penetration and the infiltration rate time series helped characterize the phenomena of fuzzy dual permeability, which are caused by rapid flows through predominantly fractured components and slow flows through predominantly matrix components. Incorporation of the fuzzy systems approach into hydrogeological analysis and modeling is expected to provide a significant payoff for solving problems that are characterized by imprecise, vague, and ambiguous information, and it can be used for the management of water resources, decision-making, and risk analysis to characterize the uncertainty phenomena of flow and transport in geological formations. Further investigations can be conducted to put the concept of fuzzy permeability in association with neural net models and evolutionary algorithms.
Funding
The development of the fuzzy systems data analysis approach was supported by the LBNL Deduce project and Science Focus Area’s Watershed project funded by the U.S. Department of Energy, Office of Science, and Office of Advanced Scientific Computing under contract DE-AC02-05CH11231.
Data Availability Statement
Data used for calculations will be available upon request.
Acknowledgments
The author is grateful to Robert Podgorny of the Idaho National Laboratory (INL) and Thomas Wood, formerly with the INL, with whom field infiltration tests at HHA and Box Canyon were conducted. The critical and constructive comments and suggestions of three anonymous reviewers are very much appreciated.
Conflicts of Interest
The author declares no conflict of interest.
References
- Ramirez, J.A.; Lichter, M.; Coulthard, T.J.; Skinner, C. Hyper-resolution mapping of regional storm surge and tide flooding: Comparison of static and dynamic models. Nat. Hazards 2016, 82, 571–590. [Google Scholar] [CrossRef]
- Ahmed, A.; Hewa, G.; Alrajhi, A. Flood susceptibility mapping using a geomorphometric approach in South Australian basins. Nat. Hazards 2021, 106, 629–653. [Google Scholar] [CrossRef]
- Argyrokastritis, I.; Psychogiou, M.; Londra, P.A. Infiltration under Ponded Conditions. Water 2021, 13, 3492. [Google Scholar] [CrossRef]
- Manna, F.; Cherry, J.A.; McWhorter, D.B.; Parker, B.L. Groundwater recharge assessment in an upland sandstone aquifer of southern California. J. Hydrol. 2016, 541, 787–799. [Google Scholar] [CrossRef]
- Medici, G.; Langman, J.B. Pathways and Estimate of Aquifer Recharge in a Flood Basalt Terrain; A Review from the South Fork Palouse River Basin (Columbia River Plateau, USA). Sustainability 2022, 14, 11349. [Google Scholar] [CrossRef]
- Pyrak-Nolte, L.J.; Nolte, D.D.; Cook, N.G.W. Hierarchical cascades and the single fracture: Percolation and seismic detection. In Fractals in Petroleum Geology and Earth Processes; Barton, C.C., La Pointe, P.R., Eds.; Plenum Press: New York, NY, USA, 1995; pp. 143–178. [Google Scholar]
- Newman, M.E.; Dunnivant, F.M. Results from the Large-Scale Aquifer Pumping and Infiltration Test: Transport of Tracers through Fractured Media; Rep. INEL-95/146 ER-WAG7-77; Idaho National Engineering and Environmental Laboratory: Idaho Falls, ID, USA, 1995. [Google Scholar]
- Barenblatt, G.I.; Zheltov, I.P.; Kochina, I.N. Basic concepts in the theory of seepage of homogeneous liquids in fissured rocks [strata]. J. Appl. Math. Mech. 1960, 24, 1286–1303. [Google Scholar] [CrossRef]
- Beven, K.; Germann, P. Macropores and water flow in soils revisited. Water Resour. Res. 2013, 49, 3071–3092. [Google Scholar] [CrossRef]
- Gerke, H.H.; Dusek, J.; Vogel, T.; Khne, J.M. Two-dimensional dual-permeability analyses of a bromide tracer experiment on a tile-drained field. Vadose Zone J. 2007, 6, 651–667. [Google Scholar] [CrossRef]
- Šimůnek, J.; Jarvis, N.J.; Van Genuchten, M.T.; Gärdenäs, A. Review and comparison of models for describing non-equilibrium and preferential flow and transport in the vadose zone. J. Hydrol. 2003, 272, 14–35. [Google Scholar] [CrossRef]
- Pruess, K.; Faybishenko, B.; Bodvarsson, G.S. Alternative concepts and approaches for modeling flow and transport in thick unsaturated zones of fractured rocks. J. Contam. Hydrol. Spec. Issue 1999, 38, 281–322. [Google Scholar] [CrossRef]
- Berkowitz, B. Characterizing flow and transport in fractured geological media: A review. Adv. Water Resour. 2002, 25, 861–884. [Google Scholar] [CrossRef]
- Faybishenko, B.; Doughty, C.; Steiger, M.; Long, J.; Wood, T.; Jacobsen, J.; Lore, J.; Zawislanski, P. Conceptual model of the geometry and physics of water flow in a fractured basalt vadose zone. Water Resour. Res. 2000, 37, 3499–3522. [Google Scholar] [CrossRef]
- Podgorney, R.; Wood, T.; Faybishenko, B.; Stoops, T. Spatial and Temporal Instabilities in Water Flow through Variably Saturated Fractured Basalt on a One-Meter Scale; Geophysical Monograph No. 122; “Dynamics of Fluids in Fractured Rock” American Geophysical Union: Washington, DC, USA, 2000; pp. 129–146. [Google Scholar]
- Gourley, J.J.; Vieux, B.E. A method for identifying sources of model uncertainty in rainfall-runoff simulations. J. Hydrol. 2006, 327, 68–80. [Google Scholar] [CrossRef]
- Dohnal, M.; Jelinkova, V.; Snehota, M.; Dusek, J.; Brezina, J. Tree-Dimensional Numerical Analysis of Water Flow Affected by Entrapped Air: Application on of Noninvasive Imaging Techniques. Vadose Zone J. 2013, 12, 1–12. [Google Scholar] [CrossRef]
- Bárdossy, A.; Disse, M. Fuzzy rule-based models for infiltration. Water Resour. Res. 1993, 29, 373–382. [Google Scholar] [CrossRef]
- Bárdossy, A.; Duckstein, L. Fuzzy Rule Based Modeling with Application to Geophysical, Biological and Engineering Systems; CRC Press: Boca Raton, FL, USA, 1995. [Google Scholar] [CrossRef]
- Shu, C.; Ouarda, T.B.M.J. Regional flood frequency analysis at ungauged sites using the adaptive neuro-fuzzy inference system. J. Hydrol. 2008, 349, 31–43. [Google Scholar] [CrossRef]
- Nayak, P.C. Explaining Internal Behavior in a Fuzzy If-Then Rule-Based Flood-Forecasting Model. J. Hydrol. Eng. 2010, 15, 20–28. [Google Scholar] [CrossRef]
- Londoño, O.M.Q.; Romanell, A.; Lima, M.L.; Massone, H.E.; Martínez, D.E. Fuzzy logic-based assessment for mapping potential infiltration areas in low-gradient watersheds. J. Environ. Manag. 2016, 176, 101–111. [Google Scholar] [CrossRef]
- Kambalimath, S.; Deka, P.C. A basic review of fuzzy logic applications in hydrology and water resources. Appl. Water Sci. 2020, 10, 8. [Google Scholar] [CrossRef]
- Zhang, D.; Shu, L.; Li, S. Fuzzy structural element method for solving fuzzy dual medium seepage model in reservoir. Soft Comput. 2020, 24, 16097–16110. [Google Scholar] [CrossRef]
- Wood, T.R.; Norrell, G.T. Integrated Large-Scale Aquifer Pumping and Infiltration Tests: Groundwater Pathways OU 7-06; Summary Report, Rep. INEL-96/0256; Idaho National Engineering and Environmental Laboratory: Idaho Falls, ID, USA, 1996. [Google Scholar]
- Freeze, R.A.; Cherry, J.A. Groundwater; Prentice-Hall: Hoboken, NJ, USA, 1979. [Google Scholar]
- Faybishenko, B. Hydraulic behavior of quasi-saturated soils in the presence of entrapped air: Laboratory experiments. Water Resour. Res. 1995, 31, 2421–2435. [Google Scholar] [CrossRef]
- Neuman, S.P. Wetting front pressure head in the infiltration model of Green and Ampt. Water Resour. Res. 1976, 12, 564–566. [Google Scholar] [CrossRef]
- Faybishenko, B.; Finsterle, S. On tensiometry in fractured rocks. In Theory, Modeling, and Field Investigation in Hydrogeology; A Special Volume in Honor of Shlomo P. Neuman’s 60th Birthday; Zhang, D., Winter, L., Eds.; Geological Society of America: Boulder, Colorado, USA, 2000. [Google Scholar]
- Horton, R.E. An approach towards physical interpretation of infiltration capacity. Proc. Soil Sci. Soc. Am. 1940, 5, 399–417. [Google Scholar] [CrossRef]
- Beven, K.; Robert, E. Horton’s perceptual model of infiltration processes. Hydrol. Process 2004, 18, 3447–3460. [Google Scholar]
- Silverman, B.W. Density Estimation for Statistics and Data Analysis, Monographs on Statistics and Applied Probability; Chapman and Hall: London, UK, 1986. [Google Scholar]
- Chen, W.-C.; Tareen, A.; Kinney, J.B. Density estimation on small datasets. Phys. Rev. Lett. 2018, 121, 160605. [Google Scholar] [CrossRef]
- Zadeh, L.A. Fuzzy sets. Inf. Control 1965, 8, 338–353. [Google Scholar] [CrossRef]
- Bezdek, J.C. Pattern Recognition with Fuzzy Objective Function Algorithms; Plenum Press: New York, NY, USA, 1981. [Google Scholar]
- R Core Team. R: A Language and Environment for Statistical Computing; R Foundation for Statistical Computing: Vienna, Austria, 2013; ISBN 3-900051-07-0. Available online: http://www.R-project.org/ (accessed on 1 October 2023).
- Gagolewski, M.; Caha, J. FuzzyNumbers Package: Tools to Deal with Fuzzy Numbers in R. 2021. Available online: https://github.com/gagolews/FuzzyNumbers/ (accessed on 1 October 2023).
- Ferraro, M.; Giordani, P.; Serafini, A. Fclust: An R Package for Fuzzy Clustering. R J. 2019, 11. Available online: https://journal.r-project.org/archive/2019/RJ-2019-017/RJ-2019-017.pdf (accessed on 1 October 2023). [CrossRef]
- Škrabánek, P.; Martínková, N. Algorithm 1017: Fuzzyreg: An R Package for Fuzzy Linear Regression Models. ACM Trans. Math. Softw. 2021, 47, 29. [Google Scholar] [CrossRef]
- Zeileis, A.; Grothendieck, G. zoo: S3 Infrastructure for Regular and Irregular Time Series. J. Stat. Softw. 2005, 14, 1–27. [Google Scholar] [CrossRef]


Disclaimer/Publisher’s Note: The statements, opinions and data contained in all publications are solely those of the individual author(s) and contributor(s) and not of MDPI and/or the editor(s). MDPI and/or the editor(s) disclaim responsibility for any injury to people or property resulting from any ideas, methods, instructions or products referred to in the content. |
© 2023 by the author. Licensee MDPI, Basel, Switzerland. This article is an open access article distributed under the terms and conditions of the Creative Commons Attribution (CC BY) license (https://creativecommons.org/licenses/by/4.0/).