Article

Hydro-Climatic and Vegetation Dynamics Spatial-Temporal Changes in the Great Lakes Depression Region of Mongolia

by
Batsuren Dorjsuren
1,2,*,
Valerii A. Zemtsov
2,*,
Nyamdavaa Batsaikhan
3,
Denghua Yan
4,
Hongfei Zhou
5 and
Sandelger Dorligjav
3
1
Department of Environment and Forest Engineering, National University of Mongolia, Ulaanbaatar 210646, Mongolia
2
Department of Hydrology, National Research Tomsk State University, Tomsk 634050, Russia
3
Department of Geography, School of Art & Sciences, National University of Mongolia, Ulaanbaatar 210646, Mongolia
4
State Key Laboratory of Simulation and Regulation of Water Cycle in River Basin, China Institute of Water Resources and Hydropower Research (IWHR), Beijing 100038, China
5
Xinjiang Institute of Ecology and Geography, CAS, Urumqi 830011, China
*
Authors to whom correspondence should be addressed.
Water 2023, 15(21), 3748; https://doi.org/10.3390/w15213748
Submission received: 27 September 2023 / Revised: 19 October 2023 / Accepted: 24 October 2023 / Published: 26 October 2023
(This article belongs to the Special Issue Advances in Ecohydrology in Arid Inland River Basins)

Abstract

:
The Great Lakes Depression region basin is among the most sensitive regions to vegetation change due to climate change. This study estimated spatial-temporal changes and relationships in hydro-climate and vegetation dynamics in the basin. Studying the spatial-temporal variation between vegetation dynamics and hydro-climate in this basin is essential for assessing climate change and sustainability. This research involved an examination of the mean yearly air temperature, overall annual rainfall, fluctuations in river discharge, vegetation cover, and alterations in vegetation types within the selected basin stations. This was accomplished through the utilization of hydro-meteorological analysis, satellite assessment, land cover determination, and statistical analysis. Over the course of the study, it was observed that the average annual air temperature increased at all stations (with a positive change of Z = +1.16). The amount of precipitation decreased (Z = −0.79), especially from 2000 to 2014, and its statistical significance decreased. During the study period, average river discharge significantly decreased (Z = −3.51). Due to these combined factors, the lake’s water level also decreased (Z = −2.03). Vegetation cover change varied in high mountains, near river and lake water surfaces, and in arid regions. Changes in air temperature and precipitation in the current year determine vegetation cover. Because of the large amount of precipitation in the summer months from 2000 to 2010 and 2020, the growth of vegetation cover during that period was relatively good. This study was conducted in arid and semi-arid regions of Central Asia and demonstrates the impact of climate change on changes in vegetation cover.

1. Introduction

Vegetation plays many vital roles in nature and society. It performs a crucial function in controlling the carbon cycle, influencing climate patterns, and facilitating the transfer of substances and energy among the atmosphere, land surface, hydrological processes, food chains, and soil-dwelling organisms [1]. In society, vegetation is the primary source of raw materials for food, medicine, medical equipment, beauty, industrial raw materials, and an important component of material wealth [2]. Therefore, it is very important to determine how vegetation cover is changing with climate change and the main factors influencing this change. Looking at the interrelationships of vegetation changes and climate change in areas with the most significant vegetation change, and also vulnerable and sensitive areas, can be useful for predicting the changes in other areas and vegetation communities [3]. A classic example of such a place is Central Asia’s arid and semi-arid regions [4,5,6]. Central Asia’s arid and semi-arid regions are among the most sensitive vegetative regions to climate change. It is vital to estimate the spatial and temporal variations in climate changes and the associated changes in water and vegetation in these sensitive areas, such as the Mongolian Plateau.
Changes in vegetation cover in the Mongolia Plateau region are closely related to water and climate variables [7]. The study of vulnerable ecosystems about hydro-climatic change has enormous implications for the ability of a region to maintain its unique characteristics [8]. This mid-latitude region in the northern part of the world has four seasons, where sensitive plants are dominant, seasonal and winter temperature differences are significant, and plant growth dynamics differ between seasons [6,9]. The region’s most favorable climate and weather period for vegetation growth is 5–8 months when the vegetation cover grows best during an active balance of air temperature and precipitation [10]. It is the region where the influence of hydro-climate on vegetation growth is most pronounced and a region where it is changing the most.
Another critical factor affecting vegetation cover is the human impact. In particular, the use of surface water significantly impacts changes in vegetation cover [11,12]. Human factors affecting vegetation cover include surface water use, which can influence agricultural practices, soil and plant cover use, and the grazing capacity of hydrological networks [13,14]. In particular, the impact of grazing on water points is one of the major causes of vegetation cover degradation and erosion. Therefore, studying the process of degradation of vegetation cover due to the effects of hydro-climate on the one hand and livestock grazing on the other hand may be very important to estimate the combined effects in the semi-arid and arid regions of the Mongolian Plateau.
In the study of water and climate change, it can be very important to compare the changes in the main climate parameters with the surface water changes and to calculate the direct and indirect correlations to detect the subsequent changes due to the main parameters [15,16]. It is important to estimate the impact of changes in air temperature in the basin on precipitation and then study the impact of precipitation on surface water [17]. It may be possible to calculate the interrelationship between these changes and the changes and effects of other factors affecting the vegetation cover.
The relationship between these changes may vary from place to place depending on the characteristics of the place. For example, in the arid and semi-arid highlands of Central Asia, surface water mostly flows from high mountain snow and glaciers and precipitation water has the greatest impact on lowland vegetation and surface water [18]. Therefore, it is important to calculate in detail how changes in hydro-climate, such as changes in air temperature, precipitation, and river discharge in high regions, will affect vegetation cover and the rate and extent of spatial and temporal changes.
The purpose of this study is to study the interrelationship between hydro-climatic change and vegetation cover in the Great Lakes Depression region in western Mongolia. In order to achieve the objectives of this study, the following objectives were set, including (i) determining the hydro-climatic changes; (ii) determining temporal and spatial changes in vegetation cover; and (iii) establishing the relationship between hydro-climate and vegetation cover.

2. Materials and Methods

2.1. Study Area

The Great Lakes Depression is in the western part of Mongolia, surrounded by the Mongolian Altai Mountains in the west, the Sayan mountain system in the north, the Khangai Mountains in the east, and the Mongolian Altai and Khangai Mountains in the south (45°51′26″–51°07′03″ N, 87°44′58″–99°03′56″ E), with a small part of the northern area crossing into the Russian Federation (Figure 1). The total land area is 268,309.52 km2, of which 9% is located in the territory of the Russian Federation, while 91% of the total area, or 244,182.13 km2, is located in the territory of Mongolia. The region has a fragile ecosystem with a variety of natural typologies, including the desert steppe, gobi, steppe, forest-steppe zones, and high mountain belts with an elevation of 744–4306 m above sea level. Due to the diversity of its nature, the area has its own unique flora. Desert is found in the central part of the Great Lakes basin (Nanophyton erinaceum, Anabasis brevifolia, Reaumurua soongorica) “A desert is a dry area with sparse or no vegetation.”. Gobi (Artemisia xerophytica, Stipa glareosa, Asterofhamus hereopappoides), “The gobi is a large desert and semi-desert with region sparse or little vegetation in Central Asia” and steppe (Allium eduardi, Festuca valesiaca, Caragana pygmaea) “A steppe is a natural grassy area with dense or large vegetation area.” vegetation communities are formed around large rivers and lakes in basins (Populus laurifolia, Cleistogenes squarrosa, Agropyron nevskii). A wide variety of plants [19] are present across the basin. Further, mountain and high-altitude plants (Adonis apennina L., Allium altaicum, Swertia banzragczii) grow in the Mongolian Altai, Khangai, and Kharhiraa Turgeni Mountains located at the outermost edge of this region [20].

2.2. Data Sources

To study the interrelationship between hydro-climatic change and vegetation cover, a number of different data sets were collected. Climate data, such as air temperature and precipitation, for the Great Lakes Depression region of Mongolia were obtained from National Centers for Environmental Information, i.e., NOAA’s National Centers for Environmental Information (NCEI) “(https://ngdc.noaa.gov/ accessed on 23 September 2022)” and Information and Research Institute of Meteorology, Hydrology, and Environment (IRIMHE) in Mongolia. River discharge and lake water level information were also obtained from the Hydrology and Measurement department of the IRIMHE “(http://irimhe.namem.gov.mn/ accessed on 20 November 2022)”. Global SRTM 90 m resolution Digital Elevation Model (DEM) data were obtained from the CGIAR-CSI GeoPortal “(https://cmr.earthdata.nasa.gov/ accessed on 7 August 2022)”. The normalized difference vegetation index (NDVI) and enhanced vegetation index (EVI) data were extracted from the MODIS NDVI product (MOD13Q1) obtained from the land processes distributed active archive center, NASA “(https://lpdaac.usgs.gov/ accessed on 10 January 2023)”. The land cover data of Landsat resolution of 30 m from 1990 to 2020 were used for land cover classification. The detailed global land cover classification system (containing 16 global and 14 regional land cover types) and 30 m spatial resolution images (GLC_FCS30-2015) were used [21]. The locations of the meteorological and water gauge stations used in the study are shown in Figure 1. The following factors were considered when selecting the climate and water gauge stations: (1) spatial distribution of stations, (2) the amount of data from the stations and the time of measurement, and (3) whether the stations are near water systems.

2.3. Methods

This study used the Mann–Kendall (MK) test method to detect hydro-climate time series data trends. Results were compared with the Innovative Trend Analysis Method (ITAM) and Sen’s Slope Estimator Test (SSET) to assess Mann–Kendall (MK) reliability and observe changes in trend. Trend analysis significance levels of 10%, 5%, and 1% were adopted to evaluate the hydro-climatic time series data. A digital elevation model (DEM) calculated the study area and baseline. The relationship between hydro-climatic data, NDVI, EVI, and land cover was calculated to estimate changes in plant cover according to the following general figure (Figure 2).

2.3.1. Hydro-Climatic Trend Analysis

The MK test method indicates statistically significant upward and downward trends [22,23]. Annual hydro-climatical data series were used in this study and analysis to detect changing trends. Annual precipitation, air temperature, river discharge, and lake water surface level trends were also analyzed separately. Individual hydro-meteorological time series data were compared with all-time series data for the same year.
The MK statistics are the cumulative results of all the data values. The MK test statistics “ S ” are then equated as
S = i = 1 n 1 j = i + 1 n s g n x j x i
The trend test is applied to x i data values i = 1 , 2 , n 1 and x j ( j = i + 1 , 2 , n ) . The data value of each x i is used as a reference point to compare with the data value of x j , which is given as
s g n x j x i = + 1 if   x j x i > 0   0 if   x j x i = 0 1 if   x j x i < 0
where s g n is the sign function, and x j and x i are the values in period j and i . When the number of data series is greater than or equal to ten n 10 , MK test is then characterized by a normal distribution with the mean E S = 0 , and variance V a r S is equated as
E S = 0
V a r S = n n 1 2 n + 5 k = 1 m t k ( t k 1 ) ( 2 t k + 5 ) 18
where m is the number of the tied groups in the time series, and t k is the number of ties in the k t h tied group.
The test statistics Z are as follows:
Z = s 1 δ if   S > 0   0 , if   S = 0   s + 1 δ if   S < 0
When Z is greater than zero, δ is the variance of S , indicating an increasing trend, and when Z is less than zero, it is a decreasing trend.
In time sequence, the statistics are defined independently:
U F k = d k E d k v a r d k ( k = 1 , 2 , , n )
Firstly, given the confidence level α , if the U F k   >   U F α / 2 , indicating that the sequence has a significant trend. Then, the time sequence of changes is represented in reverse order. The following equation is used to express the inverse relationship according to the calculation of the equation:
U B k = U F k
K = n + 1 k
where U F k and U B k are the statistical variables, two statistical order curves U B k and U F k are drawn as U B and U F curves, and two critical value lines are drawn on the graph to detect MK change points. U B and U F of these two crucial values indicate a significant upward or downward trend when it exceeds the line, and the range beyond the essential value line is defined as the time interval of the change. In this case, the intersection of the U B and U F curves indicates the start of the change, which is the point of difference [24].
ITAM has been used in several studies to detect changes in hydro-climate trends [23,25]. The ITAM divides a time series into two equal parts, and it sorts both sub-series in ascending order. Then after, the two halves are placed on a coordinate system ( x i : i = 1 , 2 , 3 , n / 2 ) on X-axis and ( x j : j = n / 2 + 1 , n / 2 + 2 , n ) on Y-axis. If the time series data on a scattered plot are collected on the 1:1 (45°) straight line, it indicates no trend. However, the trend increases when data points accumulate above the 1:1 straight line, and the trend decreases when data points accumulate below the 1:1 straight line.
The trend indicator is given as
φ = 1 n i = 1 n 10 ( x j x i ) μ
where φ = trend indicator, n = number of observations on the sub-series, x i = data series in the first half sub-series class, x j = data series in the second half sub-series part, and μ = mean of data series in the first half sub-series part.
A positive value of φ indicates an increasing trend. However, a negative value of φ indicates a decreasing trend. However, when the scatter points are closest around the 1:1 straight line, it implies the non-existence of a significant trend.
In SSET, the trend magnitude is calculated using [26] slope estimator methods. The slope Q i between two data points is given by the equation
Q i = x j x k j k , f o r   i = 1 , 2 , N
where x j and x k   are data points at time j and ( j > k ) , respectively. When there is only single datum in each time, then   N = n ( n 1 ) 2 ; n is number of time periods. However, if the amount of data in each year is high, then N < n ( n 1 ) 2 ; n is the total number of observations. The N values of slope estimator are arranged from smallest to biggest. Then, the median of slope ( β ) is computed as
β =   Q N + 1 / 2 w h e n   N   i s   o d d Q N / 2 + Q ( N + 2 ) / ( 2 ) / ( 2 ) w h e n   N   i s   e v e n
The sign of β shows whether the trend is increasing or decreasing.

2.3.2. Vegetation Analysis

NDVI is one of the most widely used vegetation indices of plant biomass and vegetation activity [27], which indicates the change in an area’s vegetative greenness [28].
N D V I = N I R R E D N I R + R E D
where NIR and RED are the near-infrared and red channels of the electromagnetic spectrum, respectively, corresponding to bands 2 and 1 of the MODIS (MOD13Q1) product. The second vegetation layer is the EVI, which has improved sensitivity for high biomass regions.
E V I = G P N I R P R e d ( P N I R + C 1 P R e d C 2 P B l u e + L )
where E V I is the enhanced vegetation index, G is the gain factor (=2.5), P N I R is the near-infrared reflectance, P R e d is the red reflectance, P B l u e is the blue reflectance, C 1 is the atmosphere resistance red correction coefficients (=6), C 2 is the atmosphere resistance blue correction coefficients (=7.5), and L is the canopy background brightness correction factor (=1) [25].

2.3.3. Land Cover Analysis

Analysis of vegetation cover changes in land cover categories allowed for greater control over temporal and spatial changes in vegetation. Therefore, spatial analysis was performed in duplicate to detect differences in land cover change over distinct periods and to establish transitions and correlations between land cover changes. By overlapping the land cover maps from 1990, 2000, 2010, and 2020, we derived a land cover transformation map, which was then employed for further analysis using a transformation matrix. The extent of changes in land cover was subsequently quantified as [25].
C A = T A t 2 T A t 1
C E = [ C A / T A ( t 1 ) ] 100
where T A , C A , and C E stand for the total area, changed the area, and the extent of change, respectively, t 1 and t 2 are the beginning and ending times. An external Kappa coefficient (KC) was calculated to confirm the transition of land cover change. KC is a measure of agreement between predefined producer ratings and user-assigned ratings. The calculation is based on the difference between how much agreement is present (“observed” agreement) and how much agreement would be expected to be present by chance alone (“expected” agreement) [29].
K = P A P E / 1 P ( E )
P ( A ) = A + D N
P E = A 1 N B 1 N + A 2 N B 2 N
where K is the Kappa coefficient, P ( A ) is the number of times the K rates agree, P ( E ) is the number of times the K rates are expected to agree only by chance, A and D are unchanged categories, A 1 and B 1 are subject’s categories, and N is the change in results.

2.3.4. Statistical Analysis

Correlation analysis was used to check whether there is a linear relationship between vegetation cover and water climate, and the strength of the relationship was expressed as a correlation coefficient [30,31]. The correlation coefficient is expressed by Equation (19).
r = ( x x _ ) ( y y _ ) ( x x _ ) 2 ( y y _ ) 2
Here, r: correlation coefficient, x—variable, x _ —standard deviation of x variable, y—variable, and y _ —standard deviation of y variable.

3. Results

3.1. Hydro-Climatic Analysis

When calculating the water–climate relationships, the parameters that most affect the hydrological process are selected. These parameters are average annual air temperature, total annual precipitation, river discharge, and lake water level. In the last 30 years, the air temperature in the basin has warmed by 1.09 °C, i.e., from −0.5 °C to + 0.5 °C (Figure 3).
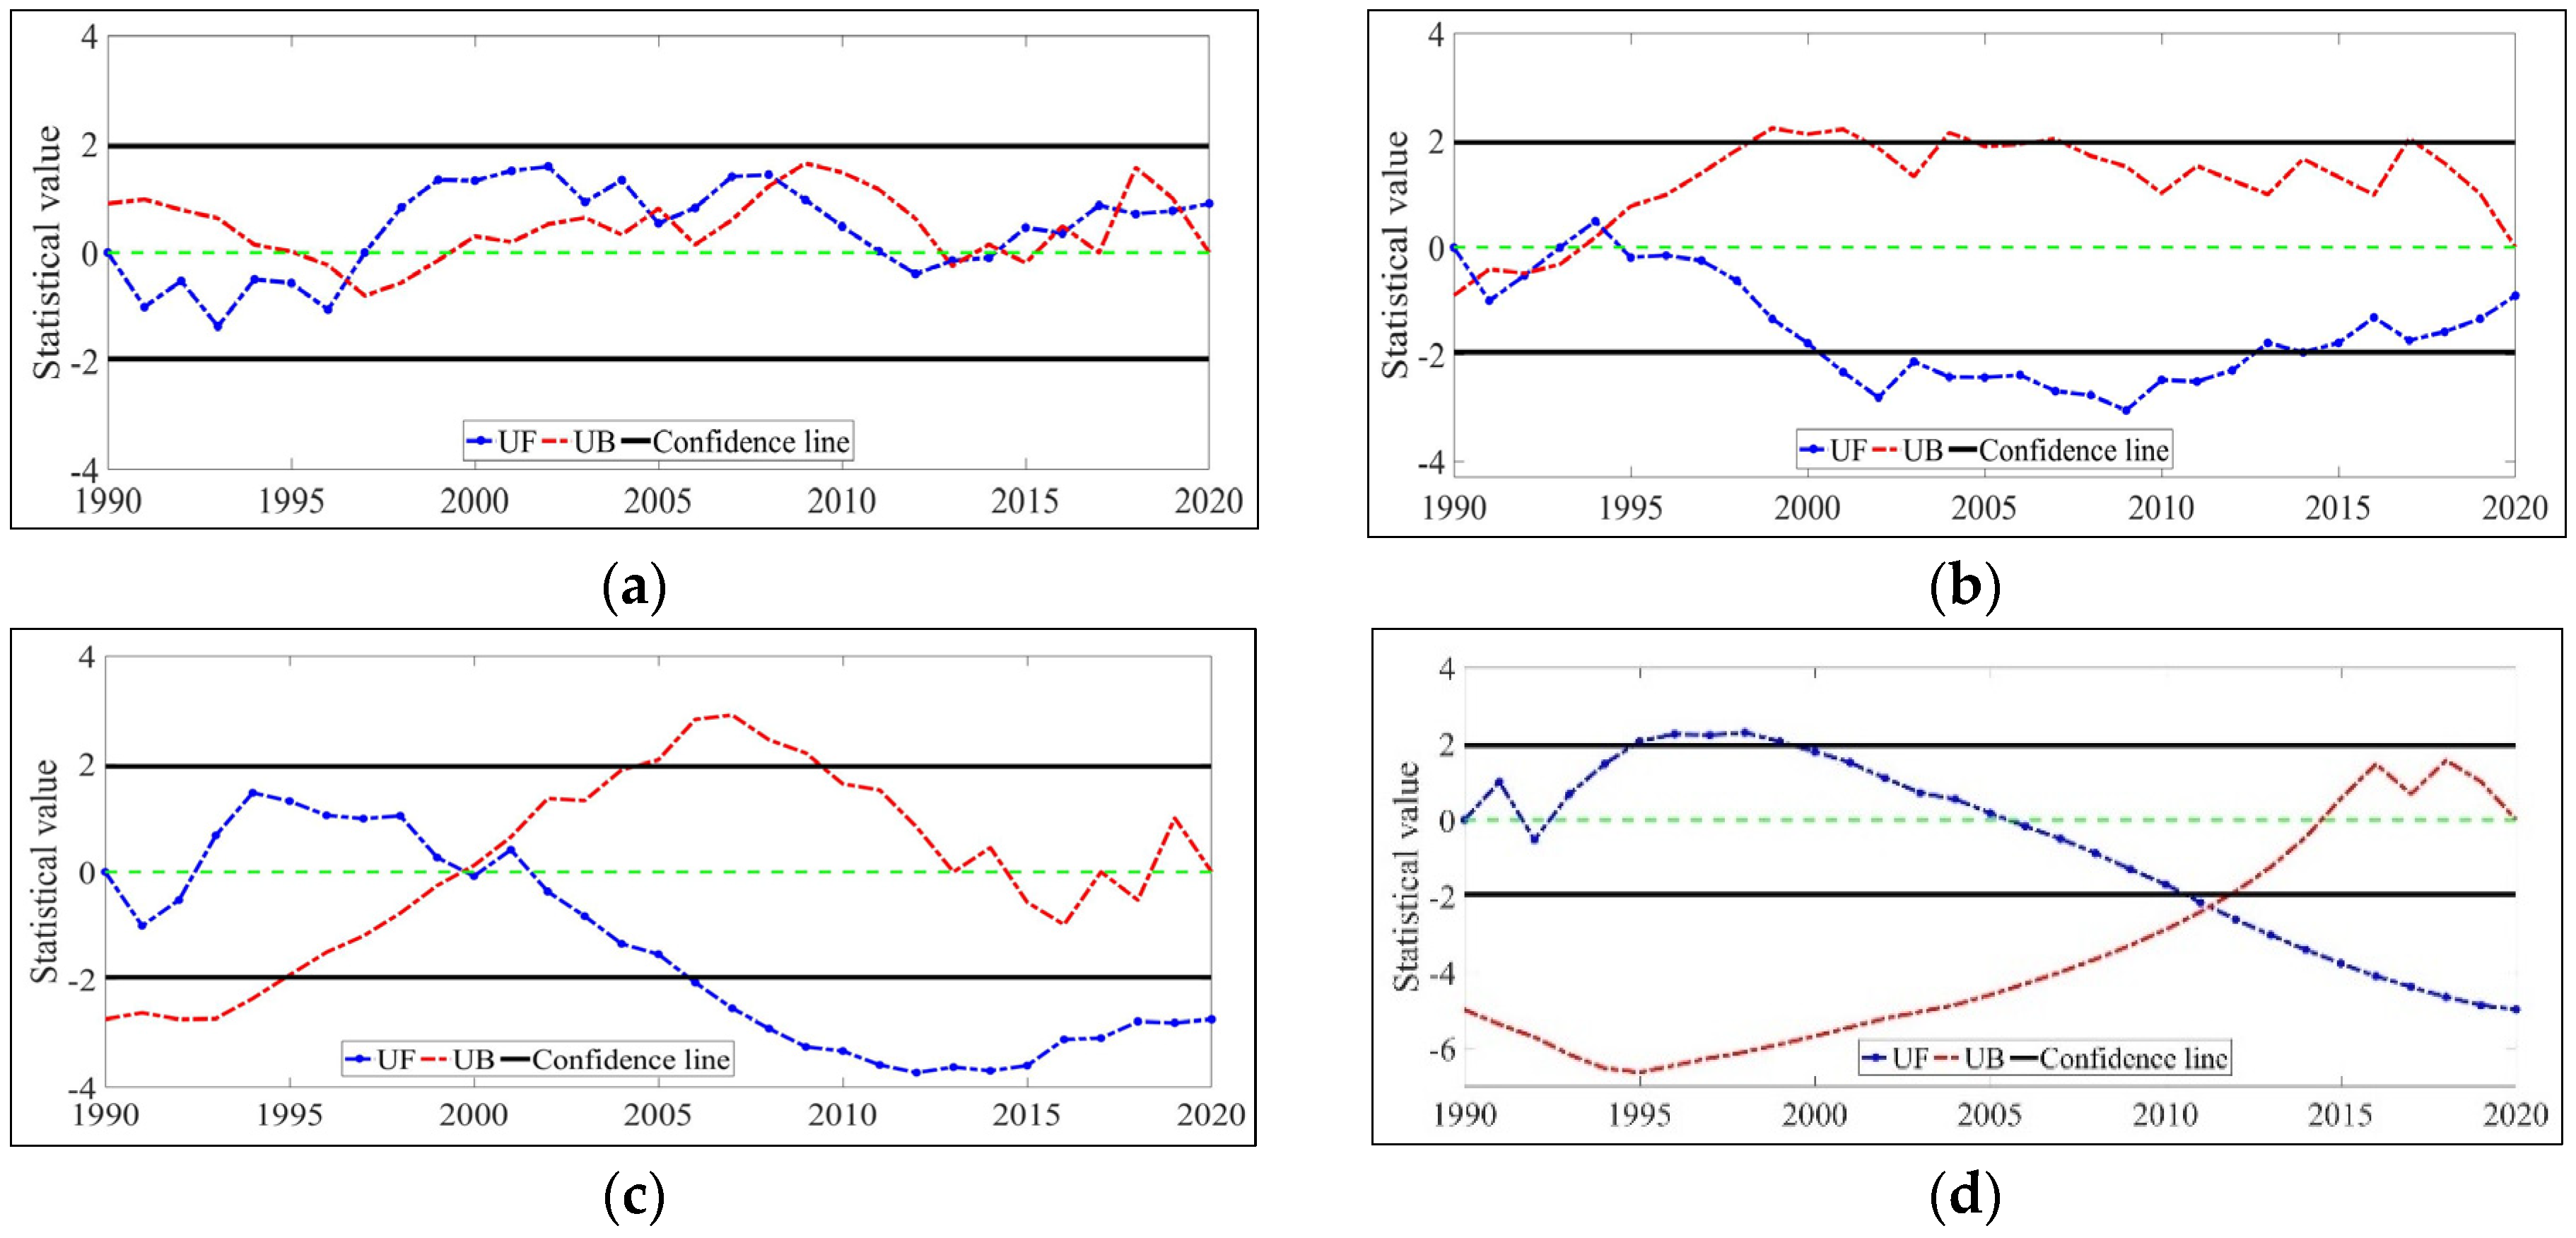
The amount of total annual precipitation decreased sharply from 1994 to 2010, and especially from 2000 to 2014, decreasing with statistical significance. Overall, this region receives little precipitation. Most of the precipitation falls during the summer months. In I confirm the winter months, the snow water remains stable for a long time. The average annual precipitation here is 134.6 mm. This is indicative of the semi-arid and arid regions of Central Asia.
In this region, Mongolia has the largest rivers in Central Asia, such as the Khovd River, the Zavkhan River, and the Tesin River, all flowing into terminal large lakes. Data from water monitors on these rivers were processed, and the average river discharge of these rivers decreased from 60 to 40 m3/s in the last 30 years. This decline continued from 1994 to 2012, with a slight upward trend since 2013. However, since 2005, it has continuously decreased with statistical significance.
The water level measurements of the two largest lakes in the study area, Uvs Lake and Khyargas Lake, show that the water level was high from 1995 to 1997, but the water level of the lake has continuously decreased since 1998. Especially since 2011, the decrease has been statistically significant (Figure 4).
Hydro-climatic parameters were calculated using MK, and a change analysis was performed using ITAM and SSET to confirm the calculation. The average air temperature increased (Z = 1.16), while precipitation slightly decreased (Z = −0.79). In arid and semi-arid regions, river discharge is directly related to changes in precipitation. However, despite the slight decrease in precipitation in this area, the river discharge (Z = −3.51) significantly decreased. The rate of decline in river discharge is twice as high as the rate of decline in precipitation, suggesting that there may be other factors influencing river discharge. In this region, the flow of river water, which is the main source of lake water, decreased due to this, and the lake’s water level (Z = −2.03) decreased significantly. This is directly related to the decrease in river discharge, the primary source (Table 1).

3.2. Vegetation Analysis

3.2.1. NDVI Analysis

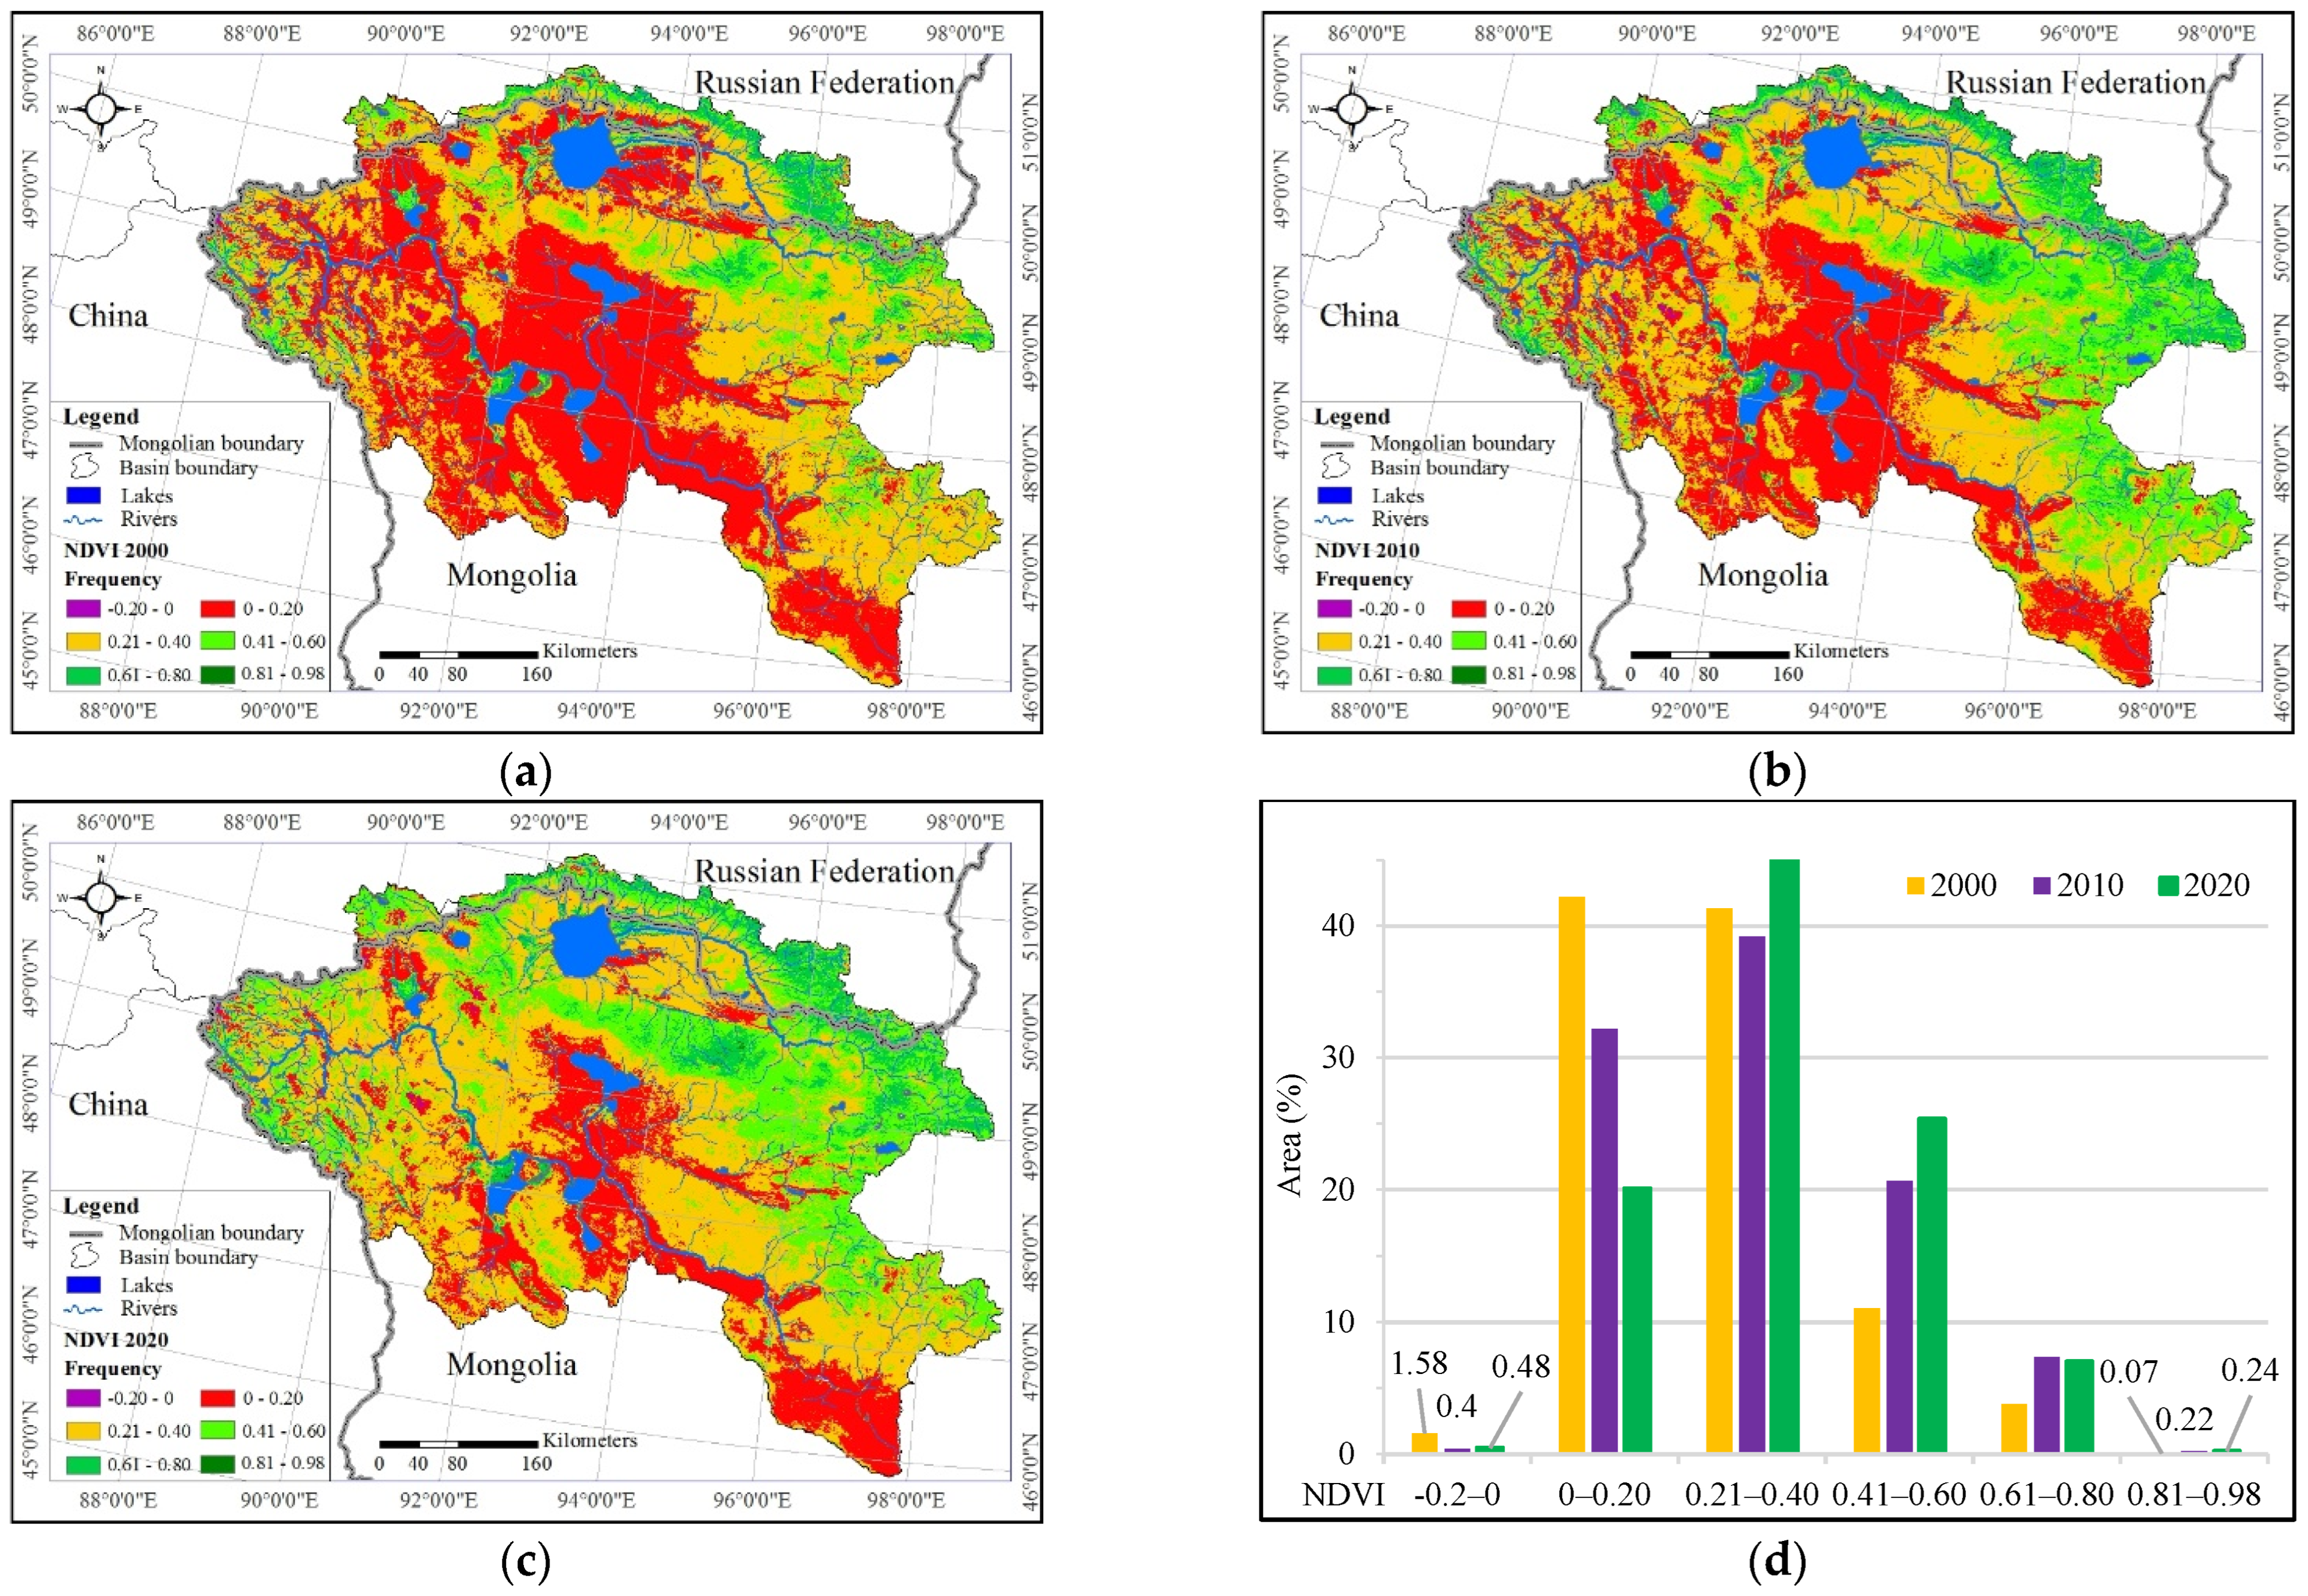
The Great Lakes basin region is located amid a diverse natural landscape with diverse vegetation associated with different ecosystems and climates. There are several large lakes in the central part of the basin, but there is an arid and semi-arid zone around the lake. Depending on the annual air temperature and precipitation, the most active vegetation period is between 5 and 9 months in this region. The MODIS NDVI product (MOD13Q1) was used to calculate the vegetation cover NDVI during the study period from August 12 to 27, 2000, 2010, and 2020. In arid and semi-arid regions of Mongolia, the most active summer vegetation period is from May 20 to August 10. But from September, plant growth stops and starts to wither due to the cold. Therefore, the period between August 12 and 27 was chosen when the vegetation in the region was most stable. NDVI had different values in high-altitude areas where surface water and vegetation cover, such as rivers and lakes, were greatest (Figure 5).
Considering the number of plants, in August 2000, 43.77% of the total area had a very poor yield or −0.20–0.20, while 41.34% of the total area had a poor yield. However, the rest of the land with relatively good yield accounted for 14.89% of the total area. As of 2010, 42.23% of the total area had a very poor yield of −0.20–0.20, while 39.18% of the total area had a poor yield. But the remaining 28.23% was relatively good yield land. As of 2020, 20.58% of the total area had very low vegetation cover or −0.20–0.20, while 46.77% of the total area had poor yields. But, the remaining 32.66% was relatively good yield land. In arid and semi-arid regions, vegetation cover growth is likely to be directly related to temperature and precipitation distribution. For example, from 2000 to 2009, there was an increase in air temperature and the amount of precipitation significantly decreased during this period. This overlaps with the period of low vegetation cover in the 2000 NDVI map. In addition, in 2020, when the increase in air temperature is relatively stable and the total annual precipitation increases, the NDVI of the basin will have a relatively high value. Therefore, it can be seen from the above comparison that air temperature and precipitation are directly related to NDVI growth.

3.2.2. EVI Analysis

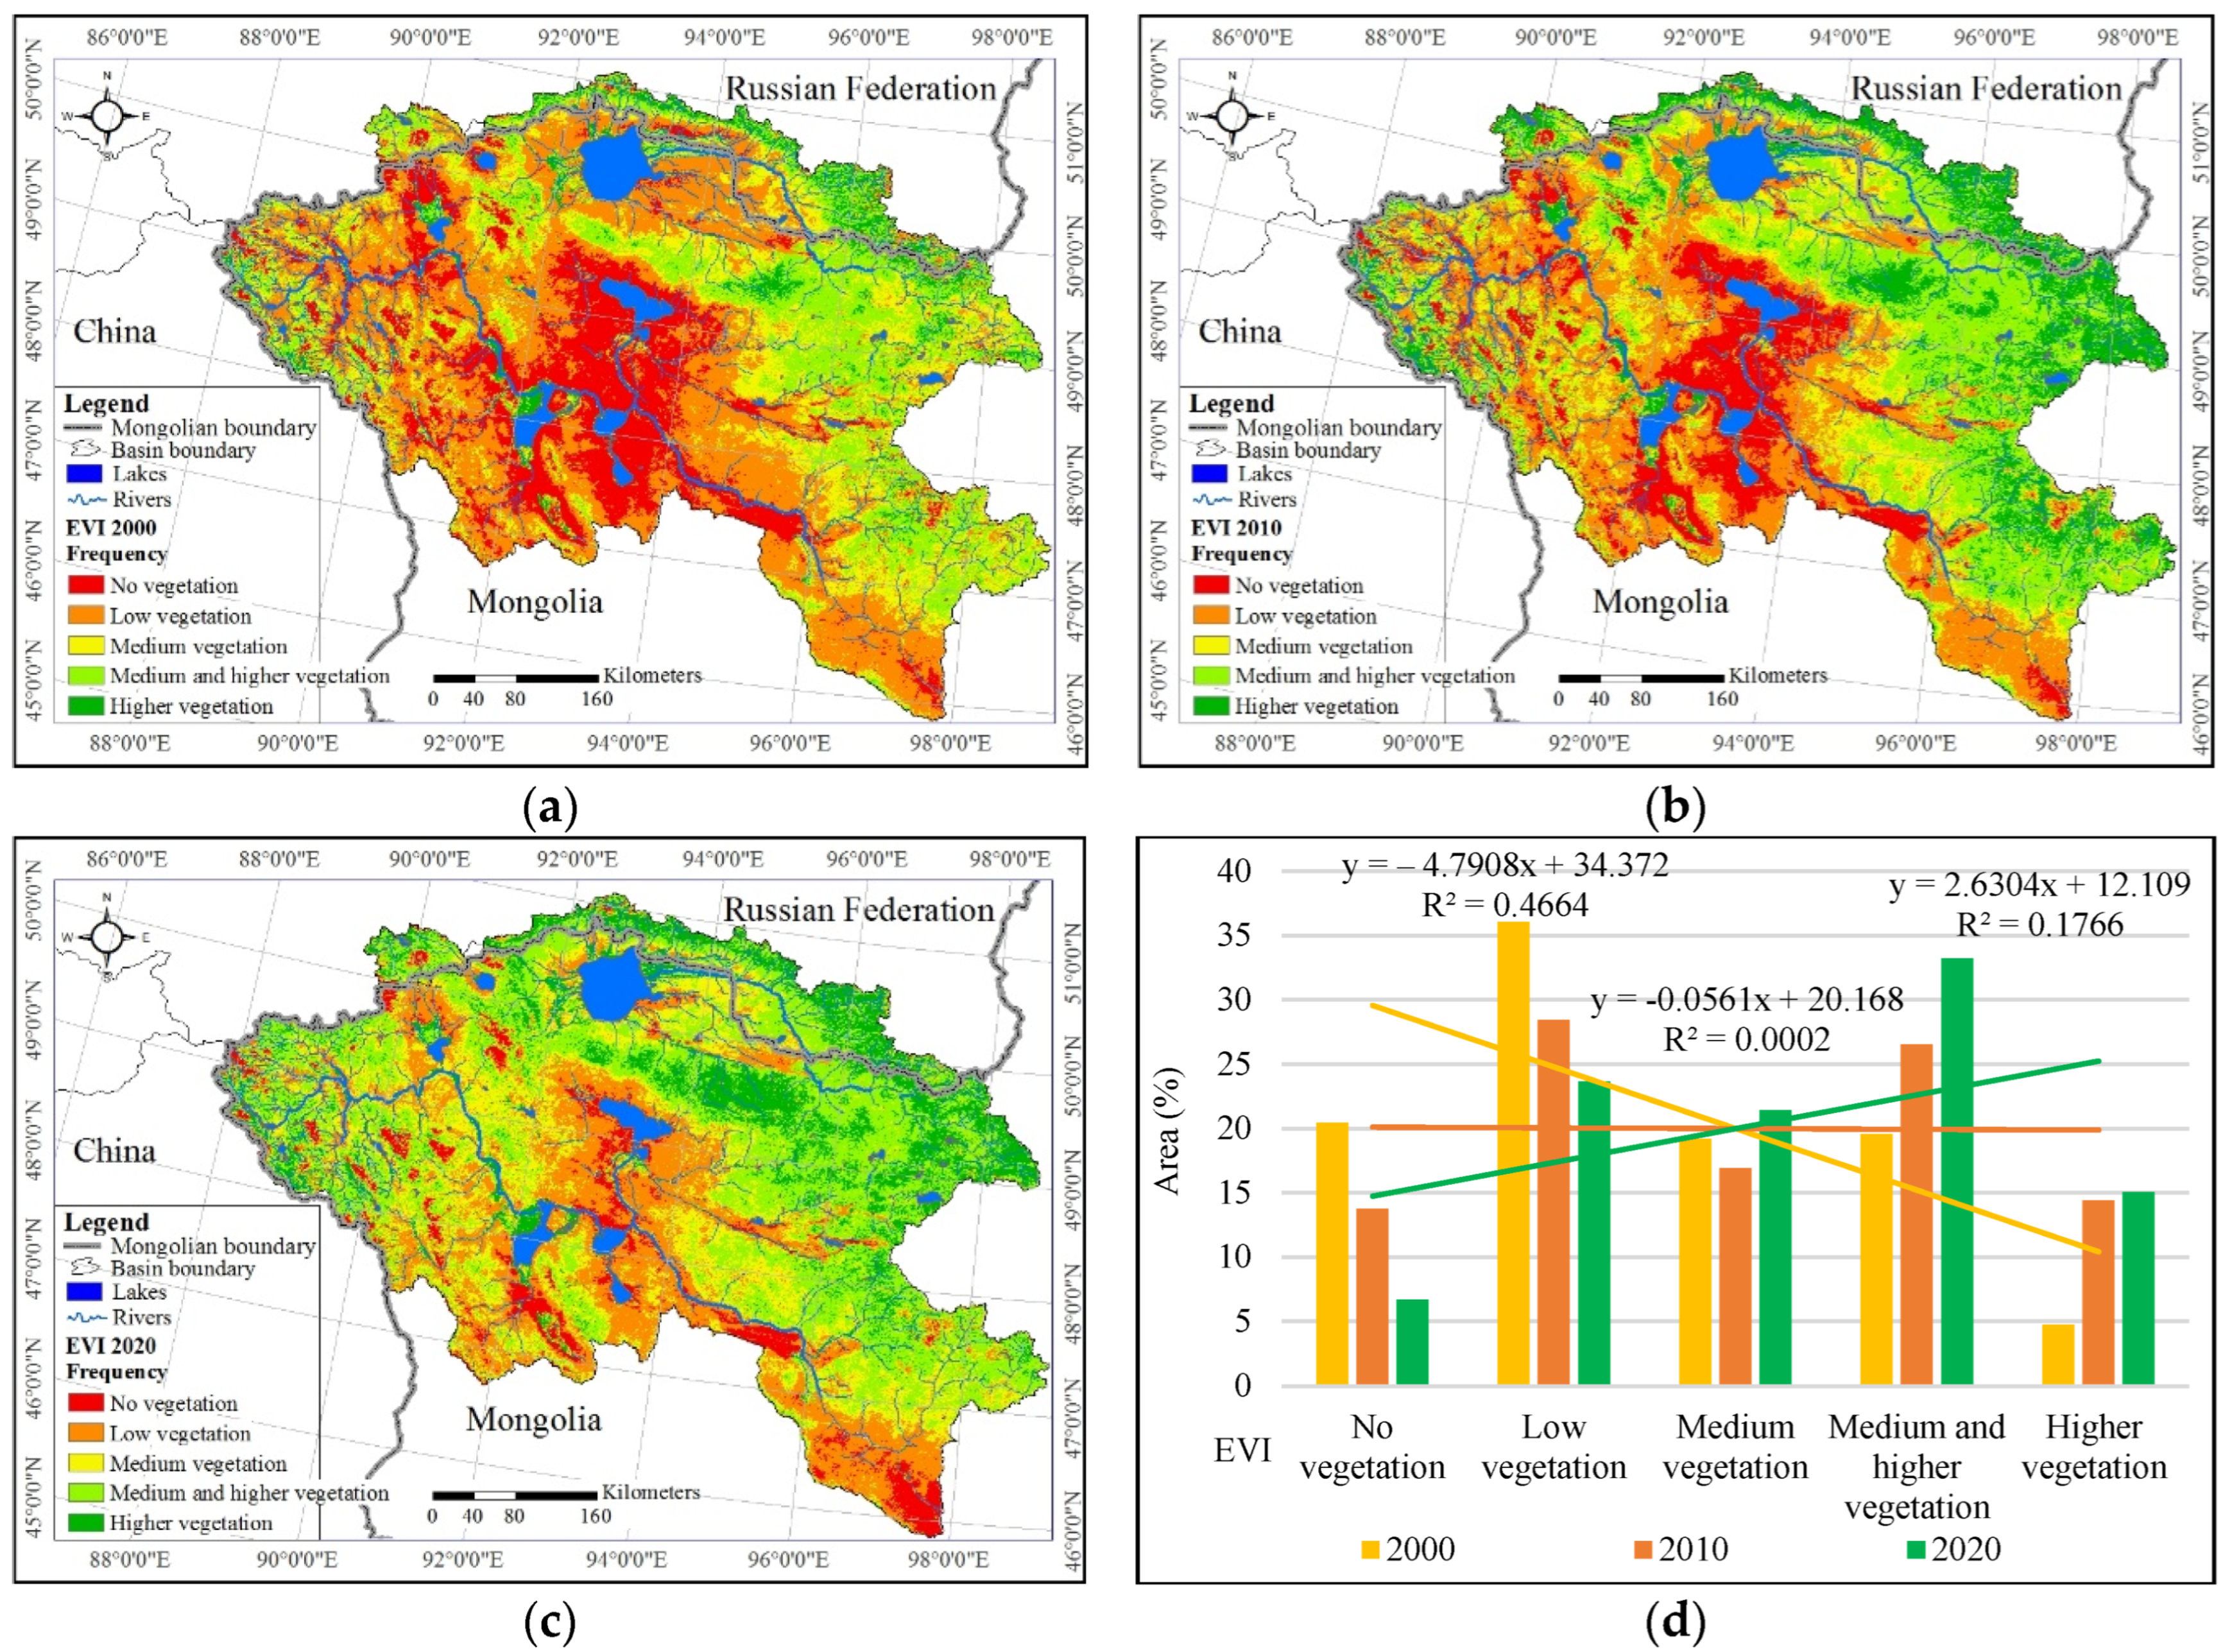
The EVI values of the study area were divided into five levels: no vegetation, low vegetation, medium vegetation, medium and higher vegetation, and higher vegetation. A significant feature of EVI was the degradation of vegetation cover in areas near large lakes and rivers. The amount of vegetation cover also showed similar trends, temporal and spatial variations, to NDVI (Figure 6).
As of 2000, 20.45% of non-vegetated land in the basin was the largest, with 36.07% of the land with low vegetation. On the other hand, 43.48% of areas had medium and large vegetation, respectively. Plant growth in 2010 was average compared to the 2000 and 2020 figures. As of 2020, the place without vegetation was 6.68%, while the area with low vegetation was 23.63%. The site with medium and large vegetation increased to 69.69%. The five categories of changes in the study area showed that the area with vegetation was less in 2000 (y = −4.7908x + 34.372, R2 = 0.4664), and the region with vegetation increased in 2020 (y = 2.6304x + 12.109, R2 = 0.1766). These changes were associated with changes in temperature and precipitation inputs, similar to changes in NDVI. In addition, vegetation cover degradation was significant in areas near surface water in the basin. This may be related to surface water use and possibly livestock grazing.

3.3. Land Cover Analysis

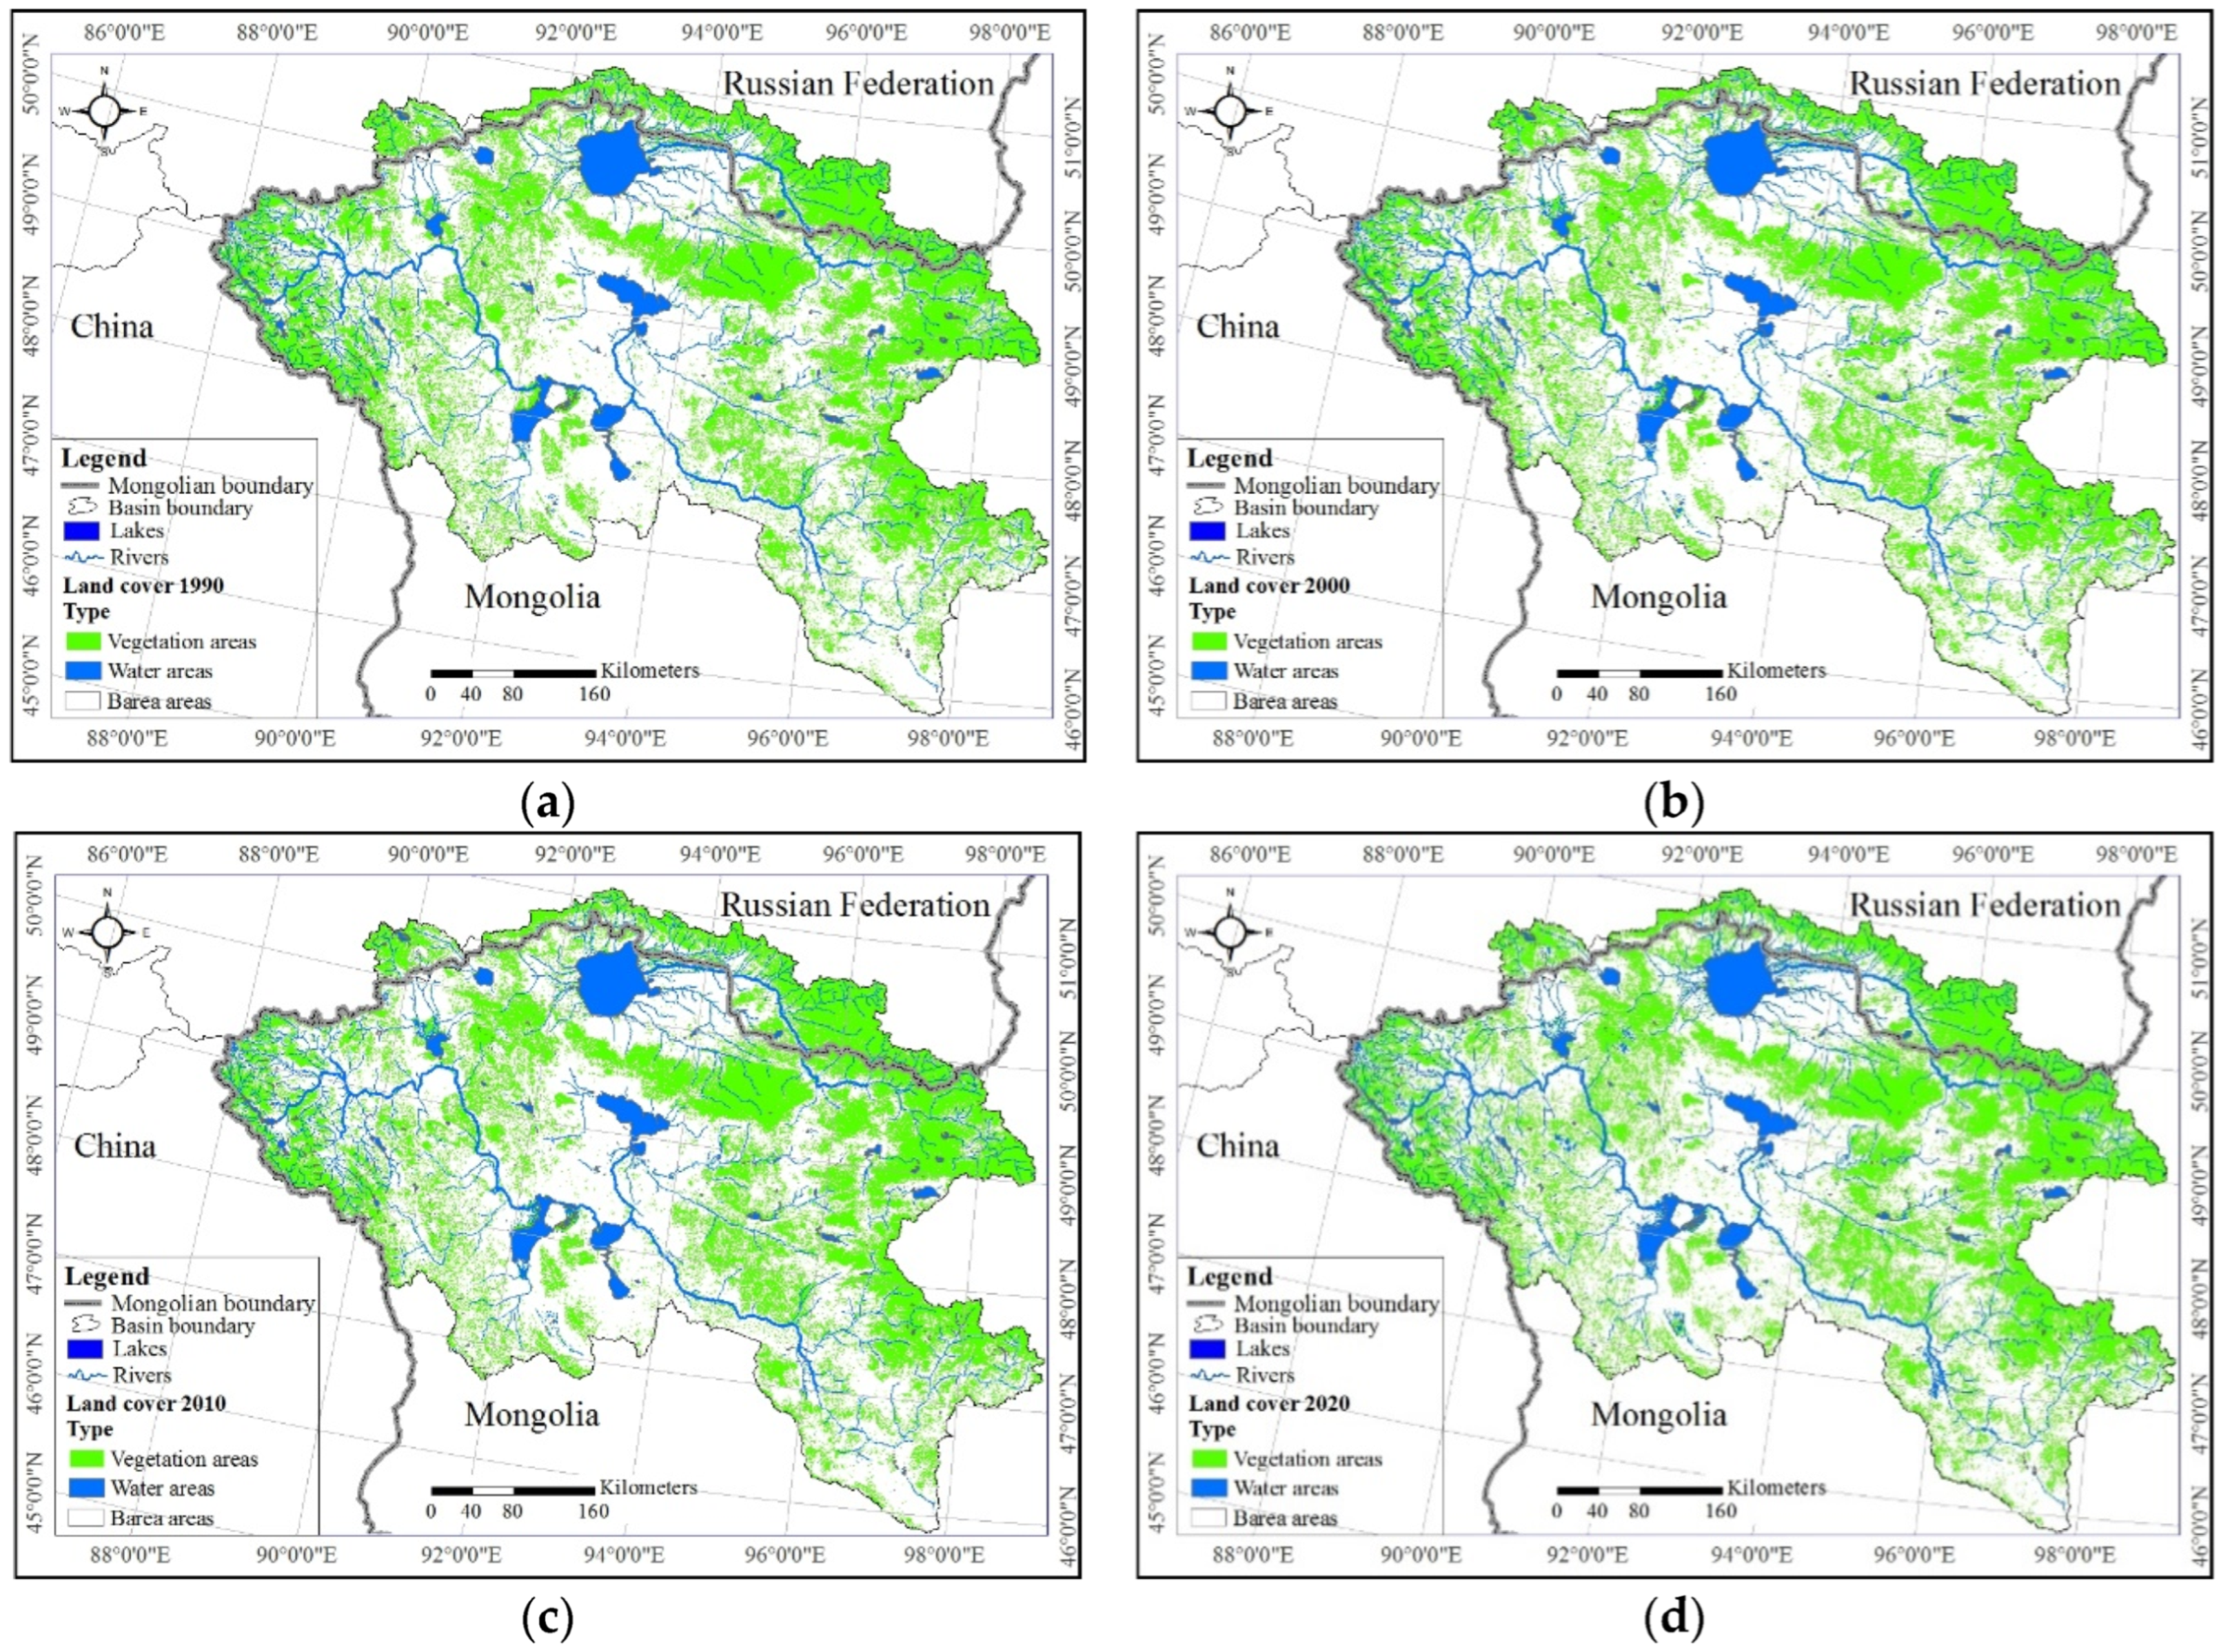
The land cover change was determined using satellite image data during August 1990, 2000, 2010, and 2020 when vegetation growth was stable. Not all land cover categories were separated and classified, but only three typologies were considered: vegetation, water, and empty land without vegetation. When calculating the change in vegetation cover, forest, cropland, shrubland, grassland, and spare vegetation types were included in the vegetated area. But, in the water section, water bodies, wetlands, permanent ice, and snow were included. In the bare areas section, impervious surfaces, bare areas, and consolidated bare area levels were calculated (Figure 7).
Vegetation change in land cover showed relatively little spatial variation. Vegetated surface area decreased in 2000 and increased by 2.4% between 2010 and 2020 due to changes in air temperature and precipitation, while water surface area decreased by 1.2% from 1990 to 2020. Bare area also decreased by 3.1% from 1990 to 2020. Vegetation and wetlands, as well as bare areas, changed slightly in relatively small areas between 1990 and 2020 (Table 2).
The land cover change increased from 65% to 66.9% from 1990 to 2020 by almost 2% in areas with vegetation area. The amount of water increased by 1.2%, from 3.7% to 4.9%. Bare area decreased by 3.1%, from 31.3% to 28.2%. This change was similar to the changes in NDVI and EVI.

3.4. Statistical Analysis

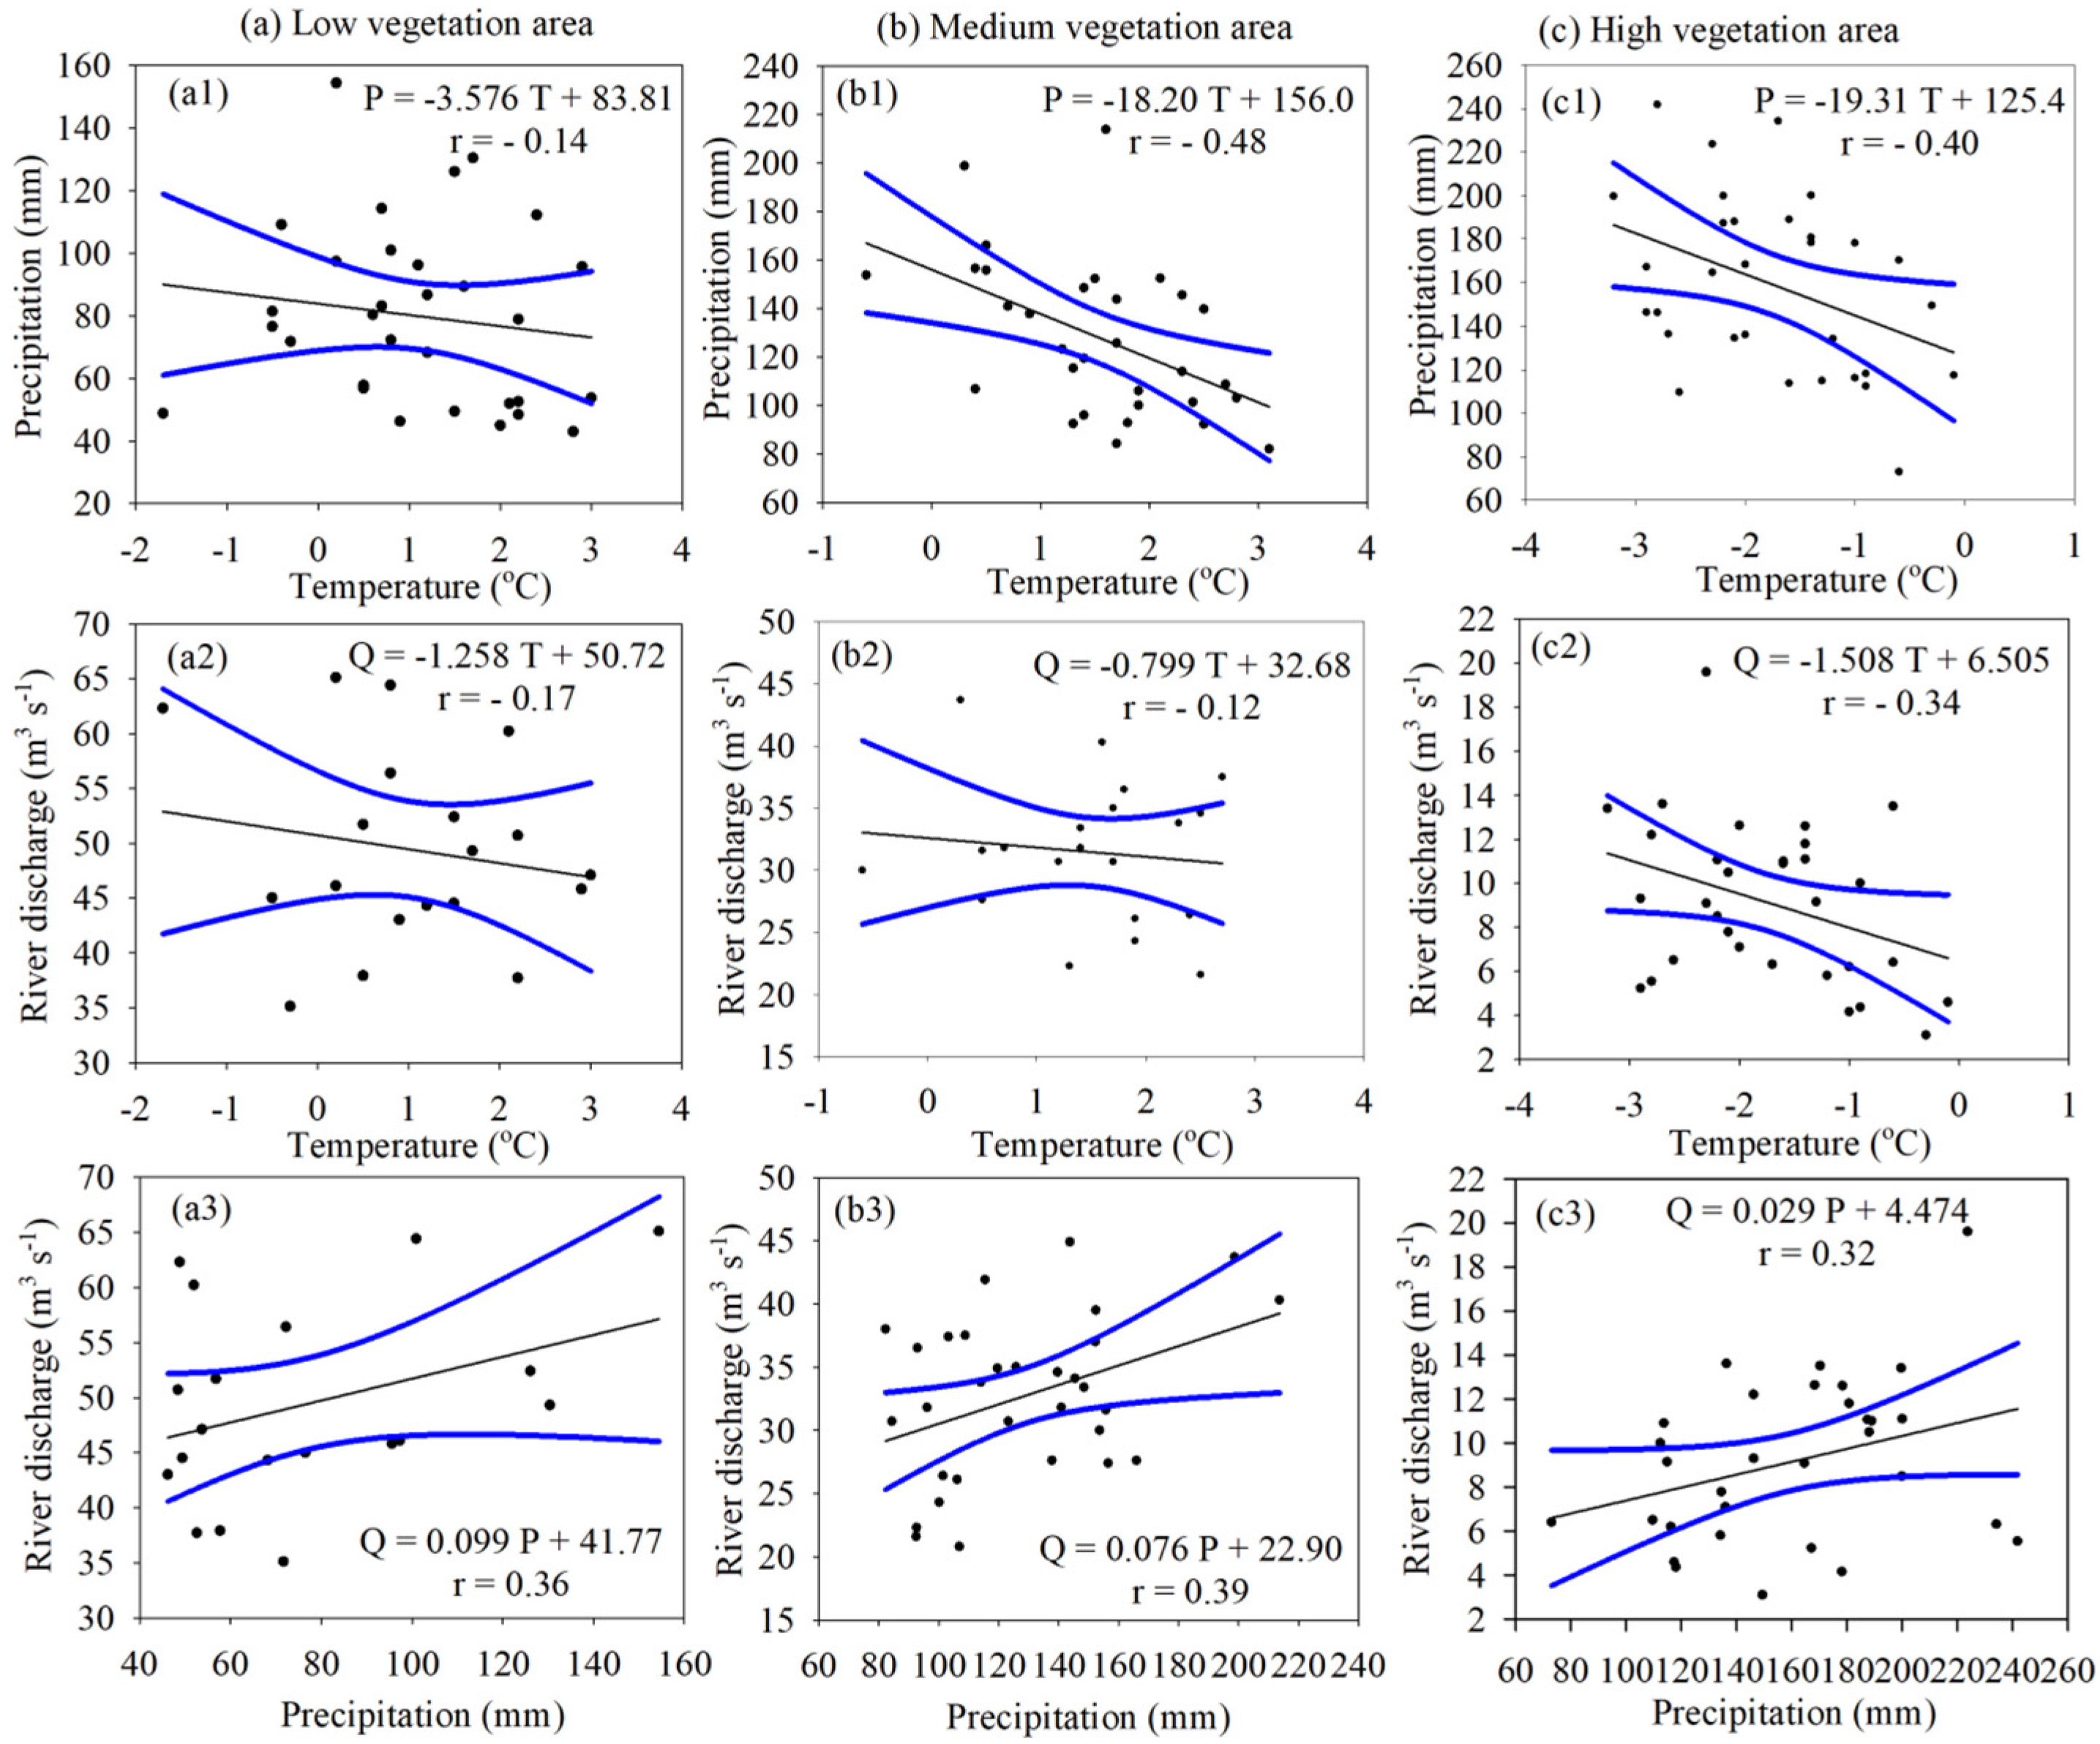
Considering the time and space relationship between vegetation dynamics and hydro-climatic, the relationship between the most sensitive parameters studied was confirmed using statistical analysis. For this purpose, the growth area of vegetation cover was divided into three main areas in the study area: low vegetation area, medium vegetation area, and high vegetation area, and the relationship between air temperature, precipitation, and river flow was calculated in each section (Figure 8).
When considering the relationship between air temperature and precipitation by dividing the study area into low vegetation area (a1–a3), medium vegetation area (b1–b3), and high vegetation area (c1–c3), when the air temperature increases, the pattern of gradual decrease in precipitation was observed at all points. Considering the relationship between precipitation and vegetation cover, vegetation cover increases as precipitation increases. For example, the correlation in (a1) became r = −0.14, while the correlation in (b1) increased to r = −0.48. Vegetation changes are most closely related to climate factors. Considering how the river flow depends on the difference in air temperature, a relatively weak relationship is revealed. The highest is r = −34 in areas with high vegetation area. This indicates that the air temperature in areas with high vegetation area may have an indirect effect on the flow of river water. Considering how the river discharge water depends on the increase in precipitation in the low vegetation area (a1–a3), medium vegetation area (b1–b3), and high vegetation area (c1–c3) in the research area, it is positively moderate at all points where related. The river discharge in the study area is affected by many factors, such as increasing air temperature, the melting of high mountain permafrost, and changing precipitation, and it can be seen that the influence of precipitation is significant. Therefore, in arid and semi-arid regions, the amount of precipitation positively and strongly influences the river discharge. The increase in air temperature will increase evaporation and change precipitation, and the sum of air temperature and precipitation will significantly impact water and vegetation growth that year.

4. Discussion

In the Great Lakes Depression region in western Mongolia, we can detect the changes in vegetation cover related to climate change. Studying these changes may provide opportunities for the development of appropriate land management techniques and predict how vegetation may change in a warmer future. Climate change and its associated hydrologic changes are taking place very strongly in the Great Lakes Depression region of Mongolia [32]. In this region, climate indicators such as temperature increase, precipitation decrease, water surface area decrease, and permafrost glacier area decrease have all been observed in recent years [33]. In particular, due to increased air temperature, snow and glaciers have steadily decreased in recent years [34], leading to less surface water.
During the last 30 years, the air temperature in the basin has warmed by 1 °C from −0.5 °C to +0.5 °C. From 1995 to 2005, the air temperature gradually increased, and after 2008, the warming intensity stabilized slightly. This increase in temperature increases the melting of high mountain permafrost and glaciers. The meltwater flows through surface water, like rivers, and accumulates in low-lying areas. The sudden increase in air temperature in the spring and summer seasons increases the melting of permafrost and glaciers on high mountain tops, causing a sharp rise in river water levels and the expansion of lake water areas in the early season. Conversely, considering the general trend of hydro-climate, the increase in air temperature in this region will decrease the amount of precipitation, and the decrease in precipitation impacts the flow of water in the river. Despite more water earlier in the season, average lake levels steadily declined over time. The change in the water consumption of the river likely also caused the water level of the lake to change. In our study, the decline in precipitation was most strongly linked to lower lake levels.
The expansion and reduction in vegetation cover are intimately connected to alterations in both precipitation and air temperature [35]. Changes in air temperature, the most prominent climate parameter, will indirectly have the most significant impact on vegetation growth. These changes are especially evident in sensitive areas of arid and semi-arid regions [36]. For example, in 2000, when the air temperature increased, the amount of precipitation decreased, and in the years 2010 and 2020, when the precipitation increased, the amount of vegetation cover increased in the basin, especially in the years when the NDVI and EVI values were high. An increase in the sensitivity of plants to water availability could lead to a decrease in tolerance to water changes and an increase in the conflict between plants and human societies related to water [37].
The processing of satellite images is useful in many ways when considering the factors influencing the detection of changes in vegetation cover [38,39]. Consideration of changes in land cover changes in vegetated surfaces, water surfaces, and bare land without vegetation is important for estimating the impact of vegetation cover changes [40]. The biggest change in the area of the basin was the bare area between 1990 and 2020, which was 8453.6 km2 or 3.1% of the total area of the basin. This area is quite extensive, especially for arid and semi-arid regions. While the area of wetlands in that area is increasing by a small percentage, the bare area, land without vegetation, is increasing, which may indicate a strong natural transition due to natural factors and other factors, especially climate.

5. Conclusions

In this study, hydro-climatic trend analysis, satellite image analysis, land cover determination, and statistical analysis methods were used to calculate the spatio-temporal relationship between vegetation dynamics and hydro-climate changes in the Great Lakes Depression region of Mongolia from 1990 to 2020.
The average annual air temperature increased by +1 °C from −0.5 °C to +0.5 °C during the research period. This increase substantially affected plant growth processes but differed depending on elevation and proximity to water. Mean annual air temperature tended to increase at all stations ( Z = +1.16). The mean yearly precipitation within the research amounted to 134.6 mm. The amount of precipitation rapidly decreased from 1994 to 2010, and from 2000 to 2014, it decreased with statistical significance. During the study period, the river discharge changed significantly due to the interrelationship between the increased air temperature and the decrease in precipitation. During the study period, average river discharge significantly decreased ( Z = −3.51). Also, the water level of the studied lake significantly decreased ( Z = −2.03).
Vegetation cover changes due to hydro-climatic changes were different in high mountains, near the water surface of rivers and lakes, and in arid and semi-arid regions. Vegetation yield is determined by changes in air temperature and precipitation of the same year, and the amount of precipitation in the summer months from 2000 to 2010 and 2020 was high, so the increase in the height of vegetation cover during that period was relatively good. That is why the amount of vegetation cover in NDVI, EVI, and land cover types tends to increase during this period. This change in vegetation cover is one of the paradoxes of climate change in the region that we must continue to study.
The growth of vegetation cover is highly dependent on hydro-climatic changes in the study area. In terms of distance, mainly water and vulnerable parts of vegetation cover in arid and semi-arid areas have changed. The most sensitive areas to climate change were those with moderate-to-high vegetation cover. This suggests that climate change significantly affects changes in vegetation cover in studies conducted in arid and semi-arid regions of Central Asia.
This research can serve as the primary data for researching the relationship between climate change, vegetation cover, land cover change, and ecosystem change in the Great Lakes Depression region of Mongolia, which is representative of the semi-arid region. In the future, studying human factors affecting vegetation cover is essential, as is studying human responses to vegetation change in the region.

Author Contributions

Conceptualization, B.D. and D.Y.; methodology, B.D.; software, N.B. and S.D.; formal analysis, B.D.; investigation, V.A.Z.; resources, S.D.; data curation, N.B.; writing—original draft preparation, B.D.; writing—review and editing, B.D.; visualization, H.Z.; supervision, V.A.Z.; project administration, B.D.; funding acquisition, D.Y. All authors have read and agreed to the published version of the manuscript.

Funding

This research was funded by the Mongolian Science and Technology Foundation (Grant: CHN-2022/274) and the Advanced Grant from the National University of Mongolia (Grant: P2022-4376). Also, it was funded by the National Key Research and Development Project of China (Grant: 2022YFE0119400). And this research was funded by the Chinese Academy of Sciences PIFI Fellowship for Visiting Scientists (Grant: 2024VCB0010).

Data Availability Statement

Data sharing not applicable.

Acknowledgments

Special thanks to reviewers and editors who reviewed and provided valuable feedback on the quality of the article’s final version.

Conflicts of Interest

The authors declare no conflict of interest.

Correction Statement

This article has been republished with a minor correction to the Funding statement. This change does not affect the scientific content of the article.

References

  1. Jiang, W.; Niu, Z.; Wang, L.; Yao, R.; Gui, X.; Xiang, F.; Ji, Y. Impacts of Drought and Climatic Factors on Vegetation Dynamics in the Yellow River Basin and Yangtze River Basin, China. Remote Sens. 2022, 14, 930. [Google Scholar] [CrossRef]
  2. Barhoum, A.; Jeevanandam, J.; Rastogi, A.; Samyn, P.; Boluk, Y.; Dufresne, A.; Danquah, M.K.; Bechelany, M. Plant celluloses, hemicelluloses, lignins, and volatile oils for the synthesis of nanoparticles and nanostructured materials. Nanoscale 2020, 12, 22845–22890. [Google Scholar] [CrossRef] [PubMed]
  3. Tramblay, Y.; Koutroulis, A.; Samaniego, L.; Vicente-Serrano, S.M.; Volaire, F.; Boone, A.; Le Page, M.; Llasat, M.C.; Albergel, C.; Burak, S.; et al. Challenges for drought assessment in the Mediterranean region under future climate scenarios. Earth Sci. Rev. 2020, 210, 103348. [Google Scholar] [CrossRef]
  4. Jiang, L.; Jiapaer, G.; Bao, A.; Kurban, A.; Guo, H.; Zheng, G.; De Maeyer, P. Monitoring the long-term desertification process and assessing the relative roles of its drivers in Central Asia. Ecol. Indic. 2019, 104, 195–208. [Google Scholar] [CrossRef]
  5. Kappas, M.; Degener, J.; Klinge, M.; Vitkovskaya, I.; Batyrbayeva, M. A Conceptual Framework for Ecosystem Stewardship Based on Landscape Dynamics: Case Studies from Kazakhstan and Mongolia. In Landscape Dynamics of Drylands across Greater Central Asia: People, Societies and Ecosystems; Gutman, G., Chen, J., Henebry, G.M., Kappas, M., Eds.; Springer International Publishing: Cham, Switzerland, 2020; pp. 143–189. [Google Scholar] [CrossRef]
  6. Ahlborn, J.; von Wehrden, H.; Lang, B.; Römermann, C.; Oyunbileg, M.; Oyuntsetseg, B.; Wesche, K. Climate—Grazing interactions in Mongolian rangelands: Effects of grazing change along a large-scale environmental gradient. J. Arid Environ. 2020, 173, 104043. [Google Scholar] [CrossRef]
  7. Hua, L.; Zhao, T.; Zhong, L. Future changes in drought over Central Asia under CMIP6 forcing scenarios. J. Hydrol. Regi. Stud. 2022, 43, 101191. [Google Scholar] [CrossRef]
  8. Foroumandi, E.; Nourani, V.; Dąbrowska, D.; Kantoush, S.A. Linking Spatial—Temporal Changes of Vegetation Cover with Hydroclimatological Variables in Terrestrial Environments with a Focus on the Lake Urmia Basin. Land 2022, 11, 115. [Google Scholar] [CrossRef]
  9. Yuchen, L.; Zongxing, L.; Xiaoping, Z.; Juan, G.; Jian, X. Vegetation variations and its driving factors in the transition zone between Tibetan Plateau and arid region. Ecol. Indic. 2022, 141, 109101. [Google Scholar] [CrossRef]
  10. Zhang, T.; Xu, X.; Jiang, H.; Qiao, S.; Guan, M.; Huang, Y.; Gong, R. Widespread decline in winds promoted the growth of vegetation. Sci. Total Environ. 2022, 825, 153682. [Google Scholar] [CrossRef]
  11. Noori, R.; Maghrebi, M.; Mirchi, A.; Tang, Q.; Bhattarai, R.; Sadegh, M.; Noury, M.; Torabi Haghighi, A.; Kløve, B.; Madani, K. Anthropogenic depletion of Iran’s aquifers. Proc. Natl. Acad. Sci. USA 2021, 118, e2024221118. [Google Scholar] [CrossRef]
  12. Maghrebi, M.; Noori, R.; Mehr, A.D.; Lak, R.; Darougheh, F.; Razmgir, R.; Farnoush, H.; Taherpour, H.; Moghaddam, S.M.R.A.; Araghi, A.; et al. Spatiotemporal changes in Iranian rivers’ discharge. Elem. Scie. Anthr. 2023, 11, 00002. [Google Scholar] [CrossRef]
  13. Lei, C.; Wagner, P.D.; Fohrer, N. Effects of land cover, topography, and soil on stream water quality at multiple spatial and seasonal scales in a German lowland catchment. Ecol. Indic. 2021, 120, 106940. [Google Scholar] [CrossRef]
  14. Tola, S.Y.; Shetty, A. Land cover change and its implication to hydrological regimes and soil erosion in Awash River basin, Ethiopia: A systematic review. Environ. Monit. Assess. 2021, 193, 836. [Google Scholar] [CrossRef] [PubMed]
  15. Chen, H.; Liu, H.; Chen, X.; Qiao, Y. Analysis on impacts of hydro-climatic changes and human activities on available water changes in Central Asia. Sci. Total Environ. 2020, 737, 139779. [Google Scholar] [CrossRef] [PubMed]
  16. Javadinejad, S.; Eslamian, S.; Ostad-Ali-Askari, K. The analysis of the most important climatic parameters affecting performance of crop variability in a changing climate. Int. J. Hydro. Scie. Techno. 2021, 11, 1–25. [Google Scholar] [CrossRef]
  17. Guevara-Ochoa, C.; Medina-Sierra, A.; Vives, L. Spatio-temporal effect of climate change on water balance and interactions between groundwater and surface water in plains. Sci. Total Environ. 2020, 722, 137886. [Google Scholar] [CrossRef] [PubMed]
  18. Zhao, Y.; Miao, Y.; Fang, Y.; Li, Y.; Lei, Y.; Chen, X.; Dong, W.; An, C. Investigation of factors affecting surface pollen assemblages in the Balikun Basin, central Asia: Implications for palaeoenvironmental reconstructions. Ecol. Indic. 2021, 123, 107332. [Google Scholar] [CrossRef]
  19. Baasanmunkh, S.; Oyuntsetseg, B.; Urgamal, M.; Norris, J.; Shiga, T.; Choi, H.J. Notes on the taxonomy of Nymphaeaceae and Menyanthaceae in Mongolia. J. Asia-Pac. Biodivers. 2022, 15, 129–137. [Google Scholar] [CrossRef]
  20. Baasanmunkh, S.; Batlai, O.; Tsegmed, Z.; Khurelpurev, O.; Magsar, U.; Batdelger, G.; Chuluunbat, J.; Nyamjantsan, N.; Petr, K.; Jae, C.H. Distribution of vascular plants in Mongolia—I Part. Mong. J. Biol. Sci. 2022, 20, 3–28. [Google Scholar] [CrossRef]
  21. Zhang, X.; Liu, L.; Chen, X.; Gao, Y.; Xie, S.; Mi, J. GLC_FCS30: Global land-cover product with fine classification system at 30&thinsp;m using time-series Landsat imagery. Earth Syst. Sci. Data 2021, 13, 2753–2776. [Google Scholar] [CrossRef]
  22. Dorjsuren, B.; Batsaikhan, N.; Yan, D.; Yadamjav, O.; Chonokhuu, S.; Enkhbold, A.; Qin, T.; Weng, B.; Bi, W.; Demberel, O.; et al. Study on Relationship of Land Cover Changes and Ecohydrological Processes of the Tuul River Basin. Sustainability 2021, 13, 1153. [Google Scholar] [CrossRef]
  23. Dorjsuren, B.; Yan, D.; Wang, H.; Chonokhuu, S.; Enkhbold, A.; Yiran, X.; Girma, A.; Gedefaw, M.; Abiyu, A. Observed Trends of Climate and River Discharge in Mongolia’s Selenga Sub-Basin of the Lake Baikal Basin. Water 2018, 10, 1436. [Google Scholar] [CrossRef]
  24. Li, X.; Fang, G.; Wen, X.; Xu, M.; Zhang, Y. Characteristics analysis of drought at multiple spatiotemporal scale and assessment of CMIP6 performance over the Huaihe River Basin. J. Hydrol. Reg. Stud. 2022, 41, 101103. [Google Scholar] [CrossRef]
  25. Dorjsuren, B.; Yan, D.; Wang, H.; Chonokhuu, S.; Enkhbold, A.; Davaasuren, D.; Girma, A.; Abiyu, A.; Jing, L.; Gedefaw, M. Observed trends of climate and land cover changes in Lake Baikal basin. Environ. Earth Sci. 2018, 77, 725. [Google Scholar] [CrossRef]
  26. Sen, P.K. Estimates of the Regression Coefficient Based on Kendall’s Tau. J. Am. Stat. Assoc. 1968, 63, 1379–1389. [Google Scholar] [CrossRef]
  27. Rouse, J.W.; Haas, R.H.; Schell, J.A.; Deering, D.W. Monitoring vegetation systems in the Great Plains with ERTS. NASA Spec. Publ. 1974, 351, 309–313. [Google Scholar]
  28. Barboza, T.O.C.; Ardigueri, M.; Souza, G.F.C.; Ferraz, M.A.J.; Gaudencio, J.R.F.; Santos, A.F.d. Performance of Vegetation Indices to Estimate Green Biomass Accumulation in Common Bean. Agric. Eng. 2023, 5, 840–854. [Google Scholar] [CrossRef]
  29. Ray, R.; Das, A.; Hasan, M.S.U.; Aldrees, A.; Islam, S.; Khan, M.A.; Lama, G.F.C. Quantitative Analysis of Land Use and Land Cover Dynamics using Geoinformatics Techniques: A Case Study on Kolkata Metropolitan Development Authority (KMDA) in West Bengal, India. Remote Sens. 2023, 15, 959. [Google Scholar] [CrossRef]
  30. Ren, Z.; Tian, Z.; Wei, H.; Liu, Y.; Yu, Y. Spatiotemporal evolution and driving mechanisms of vegetation in the Yellow River Basin, China during 2000–2020. Ecol. Indic. 2022, 138, 108832. [Google Scholar] [CrossRef]
  31. Xue, L.; Kappas, M.; Wyss, D.; Wang, C.; Putzenlechner, B.; Thi, N.P.; Chen, J. Assessment of Climate Change and Human Activities on Vegetation Development in Northeast China. Sensors 2022, 22, 2509. [Google Scholar] [CrossRef]
  32. Demberel, O.; Munkhbat, B.; Dorjsuren, B.; Callaghan, T.V.; Tsogoo, B.; Zemtsov, V.A.; Shaarav, O.; Gongor, E.; Jargalsaikhan, Z.; Ganhuyag, N.; et al. Relationship between Dynamics of Modern Glaciers of the Mt. Munkhkhairkhan (Mongolian Altai) and Climate. Water 2023, 15, 1921. [Google Scholar] [CrossRef]
  33. Klinge, M.; Schlütz, F.; Zander, A.; Hülle, D.; Batkhishig, O.; Lehmkuhl, F. Late Pleistocene lake level, glaciation and climate change in the Mongolian Altai deduced from sedimentological and palynological archives. Quat. Res. 2020, 99, 168–189. [Google Scholar] [CrossRef]
  34. Pan, C.G.; Kamp, U.; Munkhjargal, M.; Halvorson, S.J.; Dashtseren, A.; Walther, M. An Estimated Contribution of Glacier Runoff to Mongolia’s Upper Khovd River Basin in the Altai Mountains. Mt. Res. Dev. 2019, 39, R12–R20. [Google Scholar] [CrossRef]
  35. Qu, S.; Wang, L.; Lin, A.; Yu, D.; Yuan, M.; Li, C.a. Distinguishing the impacts of climate change and anthropogenic factors on vegetation dynamics in the Yangtze River Basin, China. Ecol. Indic. 2020, 108, 105724. [Google Scholar] [CrossRef]
  36. Li, G.; Yu, L.; Liu, T.; Jiao, Y.; Yu, J. Modeling Potential Impacts on Regional Climate Due to Land Surface Changes across Mongolia Plateau. Remote Sens. 2022, 14, 2947. [Google Scholar] [CrossRef]
  37. Jiang, T.; Wang, X.; Afzal, M.M.; Sun, L.; Luo, Y. Vegetation Productivity and Precipitation Use Efficiency across the Yellow River Basin: Spatial Patterns and Controls. Remote Sens. 2022, 14, 5074. [Google Scholar] [CrossRef]
  38. Talukdar, S.; Singha, P.; Mahato, S.; Shahfahad; Pal, S.; Liou, Y.-A.; Rahman, A. Land-Use Land-Cover Classification by Machine Learning Classifiers for Satellite Observations—A Review. Remote Sens. 2020, 12, 1135. [Google Scholar] [CrossRef]
  39. Alvarez-Vanhard, E.; Corpetti, T.; Houet, T. UAV & satellite synergies for optical remote sensing applications: A literature review. Sci. Remote Sens. 2021, 3, 100019. [Google Scholar]
  40. Xie, Z.; Phinn, S.R.; Game, E.T.; Pannell, D.J.; Hobbs, R.J.; Briggs, P.R.; McDonald-Madden, E. Using Landsat observations (1988–2017) and Google Earth Engine to detect vegetation cover changes in rangelands—A first step towards identifying degraded lands for conservation. Remote Sens. Environ. 2019, 232, 111317. [Google Scholar] [CrossRef]
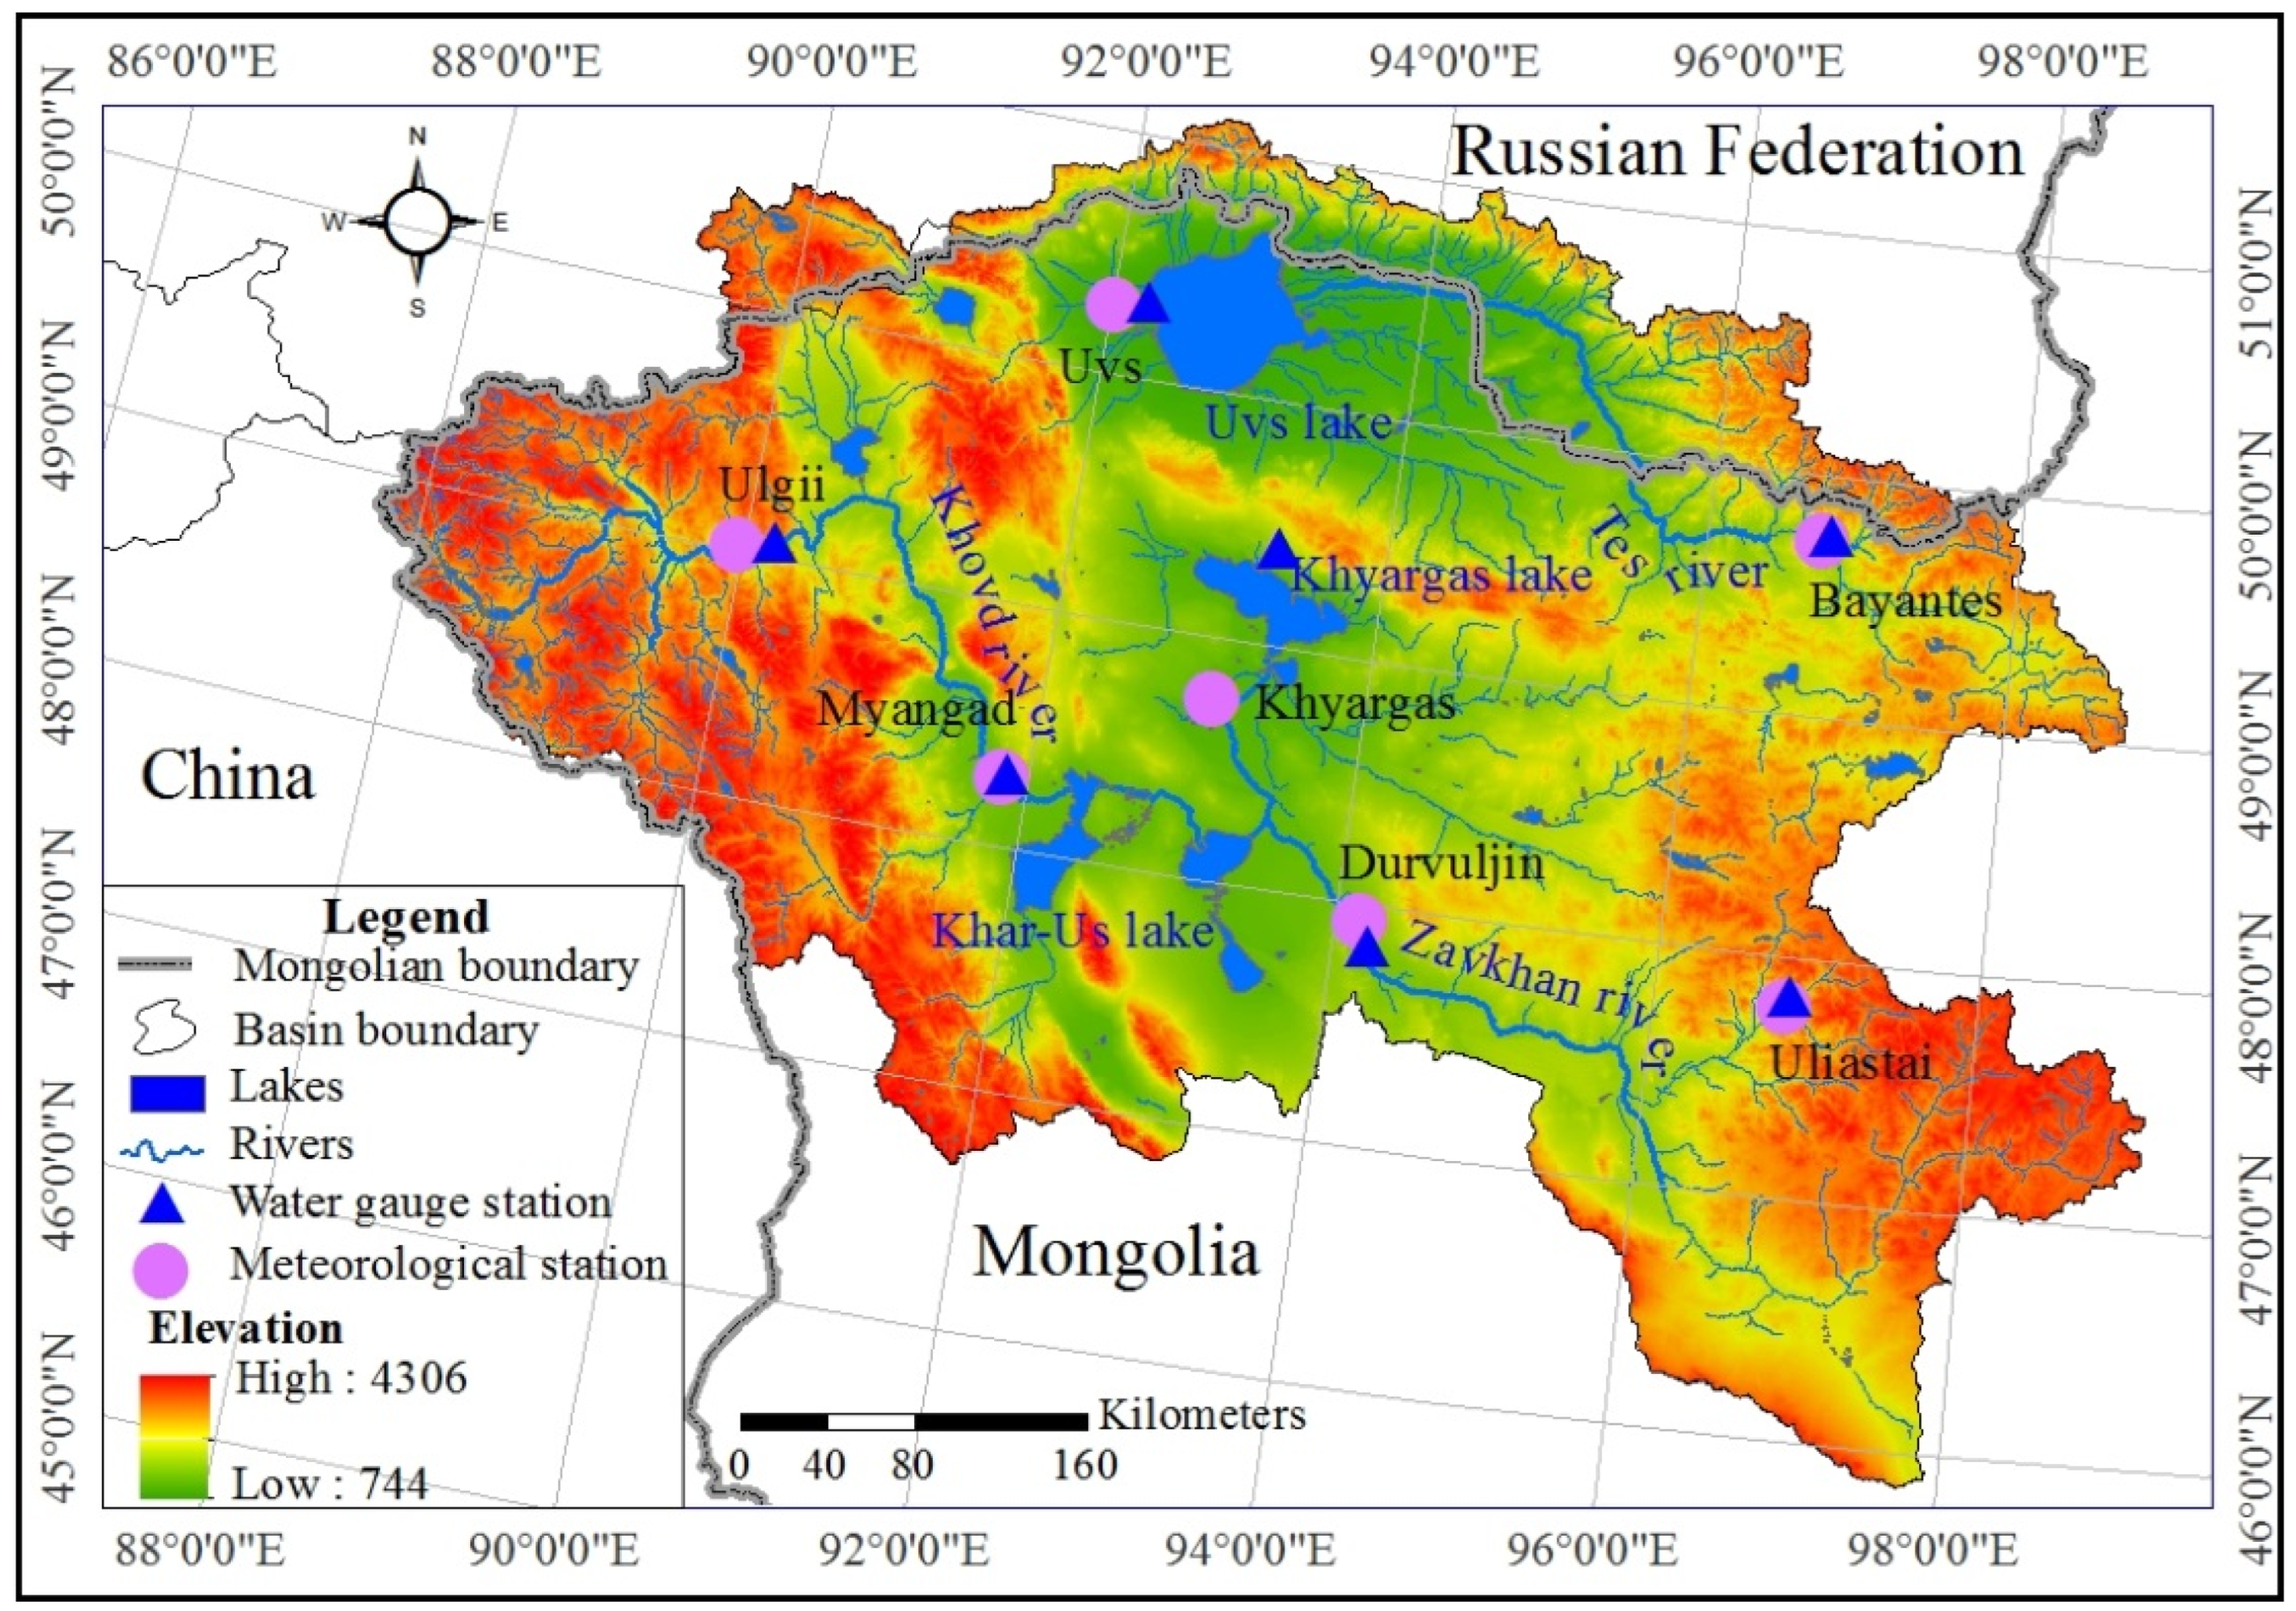
Figure 1. Location of the area and hydro-climate stations in the Great Lakes Depression region of Mongolia.
Water 15 03748 g001
Figure 2. Diagram on detecting spatio-temporal relationships between vegetation dynamics and hydro-climate.
Water 15 03748 g002
Figure 3. Hydro—climate change.
Water 15 03748 g003
Figure 4. Trends in water climate change in the Great Lakes Depression region: (a) annual mean air temperature trends; (b) trends in changes in total annual precipitation; (c) changes in the mean river discharge; and (d) changes in the water level of the Great Lakes.
Water 15 03748 g004
Figure 5. NDVI changes in Great Lakes Depression region of Mongolia. (a) NDVI in 2000; (b) NDVI in 2010; (c) NDVI in 2020; and (d) percentage of change in NDVI area.
Water 15 03748 g005
Figure 6. EVI changes in Great Lakes Depression region of Mongolia. (a) EVI in 2000; (b) EVI in 2010; (c) EVI in 2020; and (d) percentage of change in EVI area.
Water 15 03748 g006
Figure 7. Map of land cover changes in the Great Lakes Depression region: (a) 1990 land cover map; (b) 2000 land cover map; (c) 2010 land cover map; and (d) 2020 land cover map.
Water 15 03748 g007
Figure 8. Relationship between hydro-climatic (temperature, precipitation, and river discharge) factors in the Great Lakes Depression region: (a) low vegetation area; (b) medium vegetation area; and (c) high vegetation area.
Water 15 03748 g008
Table 1. Results for hydro-climate trends: MK ( Z ), ITAM ( φ ), and SSET ( β ).
Indicator Z φ β Rate of Change
1Air temperature1.16 *1.86 *0.010.10
2Precipitation−0.790.070.59−0.16
3River discharge−3.51 ***−2.66 **−1.36 *−0.61
4Lake water level−2.03 **−2.05 **−3.39 ***−5.9 ***
Notes: * Trends at 0.1 significance level; ** trends at 0.05 significance level; and *** trends at 0.01 significance level.
Table 2. Area and percentage of land cover change.
Land Cover Type1990200020102020
Area (km2)(%)Area (km2)(%)Area (km2)(%)Area (km2)(%)
Vegetation area174,452.765.0173,673.864.7175,344.865.4179,485.966.9
Water area9829.53.710,978.44.111,276.04.213,250.04.9
Bare area84,027.331.383,657.331.281,688.730.475,573.728.2
Total area268,309.5100268,309.5100268,309.5100268,309.6100
Disclaimer/Publisher’s Note: The statements, opinions and data contained in all publications are solely those of the individual author(s) and contributor(s) and not of MDPI and/or the editor(s). MDPI and/or the editor(s) disclaim responsibility for any injury to people or property resulting from any ideas, methods, instructions or products referred to in the content.