Abstract
This study aimed to improve the control system of the biological stage of wastewater treatment using the quality control information system to support the concept of environmental efficiency management. In this case, the object of the study was the treatment facilities of Sumy city (Ukraine). For automatic control of wastewater quality, pH, oxidation reduction potential (ORP), electrical conductivity, and temperature indicators were taken, as well as hydrobiological analysis of activated sludge and mathematical modelling. The pH of wastewater at the input system has systematically unacceptable values (above 8.5 were recorded). Unacceptable concentrations of sulphur-containing toxicants arrive at the entrance of treatment facilities (0.22–1.3 mg/L). The response of activated sludge biocenosis to increasing concentrations of hydrogen sulphide in wastewater was analysed. Furthermore, a mathematical model of monoculture population growth, with two factors that affect population growth (nutrient concentration and monoculture production concentration), was implemented for the initial assessment of possible negative effects on wastewater treatment. The differential equation of the population dynamics of the i-th species of microorganisms in activated sludge was described. The applied system of automated monitoring of wastewater parameters with expert assessment of activated sludge and a unified mathematical model of approaches allows for a complex system of decision-making support to be realised. However, this requires the construction of mathematical models that would take into account the cause–effect relations that operate under conditions of incomplete technological information and the potential presence of emergencies due to natural disasters and military activities.
1. Introduction
Sustainable and cyclical water management is a critical task for the water and wastewater sector, given its important role in determining the economic value of water. Therefore, there is an urgent need to further explore business opportunities in this sector to maximise the water potential. According to [1], the practices required for businesses and countries to move from a linear model to a circular economy model are divided into six action areas that form the Regenerate, Share, Optimise, Loop, Virtualise and Exchange (ReSOLVE) framework. In this case, an important development sector is the addition of digitisation operations in water treatment plants and wastewater treatment plants and the replacement of industrial devices with more energy-efficient options based on sustainable solutions.
One of the most important documents in the ISO 14000 series “Environmental Management Systems” is the ISO 14031 standard “Environmental Performance Assessment, General Requirements”. According to its postulates, it is defined as the measurable results of the environmental management system, related to the control of the level of impact on the environment. Thus, an increase in the level of ecological efficiency (EE) of the enterprise can be provided by the management of those elements of activity that make the most considerable impact on the environment. At the same time, EE assessment is an internal process and a management tool designed to provide management with information on how the environmental efficiency of the organisation corresponds to given criteria in the trend of minimising costs to achieve the goals of environmental safety. As pointed out in [2], hybrid modelling combines two modelling paradigms (mathematical and mechanistic) and aims to exploit the rapidly growing volumes of data being collected, as well as the ongoing pursuit of a deeper understanding of processes. Despite the potential of hybrid modelling in a sector that is undergoing significant digital and cultural transformation, the application of hybrid models remains uncertain.
According to the normative definition, a water supply and sanitation organisation is a legal entity that has the right to use water bodies and operate centralised water supply and (or) sanitation systems, including by means of its specialised structural subdivisions (sites, brigades). Accordingly, the key natural resource used, and for which EE is estimated in the water supply and sanitation sector (WSS), is “water”. First of all, the requirements of maximum permissible concentrations (MPC) or permissible concentrations (PC) of pollutants in the water resources diverted into geoecological systems are met. Monitoring urban water cycle infrastructures allows the generation of a large amount of data; this information, pre-processed, contributes to improving the efficiency of the processes carried out in these infrastructures, from catchment to treatment and subsequent discharge [3].
There are a number of well-known practices of environmental performance analysis: horizontal (comparing each item of a financial statement with the previous one); vertical (determining the structure of the total financial performance, the impact of each item on the result as a whole); trend (each item of a financial statement is traced over a period of time—a trend in this indicator is determined); relative indicators’ coefficients (calculation of the relationship of reporting data); comparative (prospective—comparison of indicators of environmental performance in the reporting period). As part of the bibliometric analysis, we used the Scopus database. However, each pollutant removed from the wastewater treatment plant (WWTP) has a different impact on the environment. During the past 20 years, topics related to the efficiency of WWTP management, in particular in the case of a biological treatment stage, have increased rapidly (Figure 1).
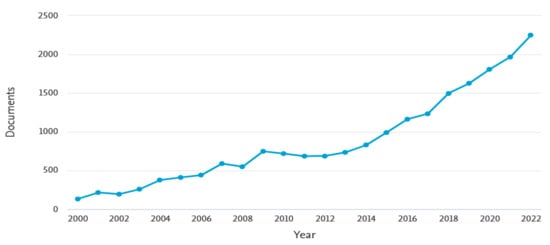
Figure 1.
Publication activities per year in the Scopus database (keywords: wastewater treatment, management, and pollutants).
In the case of wastewater treatment plants, the negative environmental impact of different pollutants, if they are not removed from the wastewater, is also different. Consequently, to include environmental impacts in the WWTP performance evaluation, it is necessary to “manually” assign weights to each result, rather than assigning them through optimisation. To overcome this limitation, study [4] evaluated the effectiveness of a sample of WWTPs using a weighted slack-based measurement model. This is a non-radial data envelopment analysis (DEA) model that allows weights to be assigned to inputs and outputs according to their importance. Thus, the assessment performed combines environmental issues with traditional “techno-economic” assessments of wastewater treatment plant efficiency. As indicated in [4], this can be done by calculating efficiency using a weighted reserve measurement model (WSBM). This is a non-radial DEA model, similar to the slacks-based model (SBM), but allowing the “manual” assignment of weights to a set of inputs and outputs [4].
DEA is a widely used method to evaluate the environmental performance of wastewater treatment plants; by combining several approaches into a single index, traditional DEA models do not account for the uncertainty of data. Furthermore, a study by [5] evaluated the environmental performance of a sample of Catalan wastewater treatment plants with respect to data uncertainty (DEA tolerance model), and for the first time, along with CO2, other greenhouse gases (GHG), such as CH4 and N2O, were considered as part of the process results. For each wastewater treatment plant, environmental efficiency was calculated in a point system, as in traditional DEA models, with an analysis of optimistic and pessimistic scenarios [5].
With the prevalence of digitalisation, intelligent operation has become a staple for future wastewater treatment plants, requiring significant data sets for model building. However, the data collected from the front-end sensor contained many missing dissolved oxygen (DO) values. The study by [6] used embedded long-term memory and guided recurrence units (GRUs), and selected some standard filling methods as benchmarks. The proposed model suffered from the problem of insufficient interpretability and long learning times. Thus, a practical method to solve the complex problem of no DO is increasingly relevant, laying the foundation for the intelligent operation of wastewater treatment plants [6].
The study by [7] focused on assessing the performance of sewage treatment plants (STPs) using a compliance index (CI). The methodology included three steps: (i) evaluating performance based on quality control, parameter checks, and compliance checks, (ii) testing the hypothesis of noncompliance, and (iii) testing the hypothesis using a nonparametric test. A new CI has been proposed to evaluate the performance of STPs against standards. Non-compliant STPs must be examined in every aspect to understand the underlying problem and to rehabilitate STPs in which the CI can be useful. The cause of non-compliance is the continuous impairment of the BOD for 41 days. Thus, it is important to study each aspect to conclude the suitability of the STP.
However, the task of ecological efficiency management is complicated by the fact that urban WWTPs are non-linear and non-stationary objects in terms of automatic control; there are also non-stationary and stochastic variations in the concentration of pollutants and water disposal volumes. Another factor that negatively affects the probability of emergencies in geo-ecosystems is that the entire wastewater infrastructure, including wastewater treatment plants, is a distributed information system with the need for parallel data processing. In this case, it is not possbile to monitor all the technologically important indicators of wastewater quality, not only in remote sites, but even at the operating system, because there are not enough measuring complexes capable of working in real time, or close to it.
The study by [8] focused on two main parts: the first was to evaluate the performance of two treatment plants using trickling filters (WWTP1) and activated sludge (WWTP2), and to ensure compliance with discharge standards and the ability to reuse treated wastewater in agriculture.
At the same time, it is necessary to take into account such an aspect of the functioning of sewage systems as additional pollution of wastewater during its transportation to the treatment facilities. That is, the usual superposition (summation) of pollutants from separate points of wastewater treatment plants does not work. Thus, in anaerobic conditions of the sewage network, the results of sulphur recovery can be extremely hazardous for activated sludge toxicants, which are not present in the wastewater of separate facilities. Therefore, when wastewater supplies with such significant excesses of pollutant concentrations are transported to a WWTP, it is impossible to reduce the final content of dissolved phosphate and nitrogen, as well as emerging contaminants that are not subject to biological degradation, using existing biological treatment technology.
The purpose of this study was to investigate the system of management of the biological stage of wastewater treatment using a quality control information system to support the concept of ecological efficiency management. To achieve the aim, the following tasks were carried out:
- −
- Studying the composition and properties of toxic substances in wastewater, as well as their impact on activated sludge microorganisms and the operation of biological treatment facilities;
- −
- Analysis of the results of using the information system to determine the quality of wastewater flowing into the biological treatment plant;
- −
- Conceptualisation of the management of biological wastewater treatment processes.
In this case, the object of the study was the treatment facilities of Sumy city (Ukraine). Sumy Municipal Hospital has local treatment facilities and only after preliminary treatment wastewater flows into the general sewerage system. It should be noted that sulphur compounds were associated with the disruption of municipal treatment facilities. Therefore, the presence of this toxicant was investigated. This study is relevant due to the lack of necessary measuring instruments capable of operating in aggressive environments and in real-time mode. That causes the lack of necessary data arrays and, accordingly, the incompleteness and blurriness of data, particularly in Ukraine. Interest is aroused by the use of mathematical and programmatic complexes and the formation of prospects for the introduction of artificial intelligence systems (neural networks).
2. Materials and Methods
2.1. Wastewater from an Urban Wastewater Treatment Plant
Sumy’s urban wastewater treatment plant is designed to treat municipal wastewater and has a design capacity of 135,000 m3·day−1, with an actual capacity of 65,000–70,000 m3·day−1. The city has a population of 256,474 people and occupies an area of 95.3 km2. The location map of the treatment facility is shown in Figure 2.

Figure 2.
Location of the urban wastewater treatment plant in Sumy, Ukraine (50°52′10.6″ N 34°47′57.3″ E).
The treatment of wastewater in municipal wastewater treatment plants consists of four stages: mechanical treatment, biological treatment, activated sludge removal, and activated water disinfection (Figure 3).
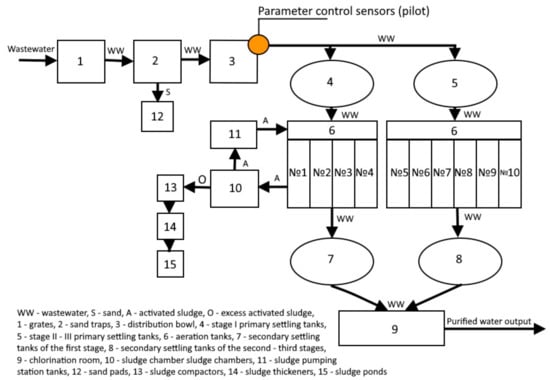
Figure 3.
Wastewater treatment scheme at the municipal wastewater treatment plant in Sumy.
Mechanical treatment includes screens and sand traps. It removes impurities from wastewater that are contained in it in an undissolved and partially colloidal state. After the mechanical impurities are removed from the screen, the wastewater enters the sand trap to remove heavy mineral impurities with a particle size of 0.09–0.5 mm. The sludge is removed from the hopper using a hydraulic lift, and the removal intervals are determined during operation. Sand from the hopper is transported by hydraulic lifts to the sand area for dewatering.
After mechanical treatment, wastewater is directed to the main distribution bowl and evenly distributed between the settling tanks in the working row.
Primary radial settlers are designed to retain organic particles suspended in wastewater. The sludge that has fallen to the bottom of the settling tank is raked to the centre using a double-sided scraper. Sludge removal is performed using plunger pumps that pump sludge to the sludge platform.
Light substances floating on the surface of the water in the settling tank are retained inside by semisubmersible plates installed in front of the overflow side of the collector.
Floating substances and grease from the water surface are also collected by semi-submersible plates, which gradually carry these substances to the periphery of the clarifier, from where they are discharged into the collector. After the primary clarifier, the clarified water enters the aeration tank, in which biological wastewater treatment is performed using oxygen and activated sludge supplied through an aerotube.
From the secondary settling tank, the regenerator and activated sludge enters the first channel. Through the regenerator, activated sludge is blown with air and its activity is restored. After biological treatment in the aeration tank, the wastewater flows through a pocket with a spillway at the end of the last corridor into the outfall channel and then into the secondary settling tank.
The mixture of treated wastewater and activated sludge is directed into the centrally located distribution bowl of the plant. The mixture is evenly distributed between the working settling tanks because of an unimmersed spillway with a wide threshold. From the bowl, the mixture is fed into the settling tank with a dosing unit located in the centre of the settling tank among the distribution units located under the bottom of the settling tank.
Secondary settling tanks are designed to separate activated sludge from treated water that passes through the aeration tank. They differ from the main ones in that they do not have any means of collecting and removing grease and other floating substances. Leaving the distribution device, the mixture enters the space bounded by the metal guide walls of the cylinder, which provide the necessary calm, radial distribution and deepening of the mixture flow in the sump, which in general, ensures a fairly complete utilisation of the sump’s working volume. Clarified water is discharged from the sump through an underground pipeline system.
The compacted excess activated sludge from the primary sludge thickener flows by gravity to the secondary sludge thickener and is then pumped into the sludge field. Sludge platforms and artificial foundation ponds are used to dewater and drain bottom sediments. The biologically treated wastewater is fed to the chlorination plant, where it is disinfected. Until 2020, disinfection was carried out with liquid chlorine. The company has now started to use sodium hypochlorite for wastewater disinfection. Its use not only protects the health of employees, but also allowed Miskvodokanal treatment facilities to be removed from the list of potentially hazardous facilities in the Sumy region.
The treated wastewater is discharged into the Psel River. The accepted method of wastewater treatment is biological, artificial treatment. Liquid chlorine disinfection is used as a pretreatment method.
The existing two-corridor displacer aeration tanks operate in the technological mode of prolonged aeration on “complete oxidation” with a load of 70–100 mg per gramme of dry matter BOD per day, with nitrification and simultaneous denitrification. In this mode, the main technical indicators have the following values:
- −
- Aeration time—9–12 h;
- −
- Sludge recirculation coefficient—0.8–1.0;
- −
- Concentration of dissolved oxygen—4–6 mg/L;
- −
- Ash content—35–40%;
- −
- Sludge dosage—4–6 g/L;
- −
- Sludge index—100–140 cm3/g;
- −
- Electrode potential—100–300 mV.
Quality values of treatment achieved after biological treatment: BOD—3.0 mg/L, total nitrogen—9.5–10.0 mg/L. The average values of the wastewater quality indicators for the previous three years are shown in Table 1.

Table 1.
Information on the actual values of quality indicators and pollutants in the composition of wastewater in the location of the wastewater outlet and in the composition of wastewater entering the wastewater treatment plant for 2018–2020.
Therefore, between 25 and 26 January 2021, the laboratory of the treatment facilities of the Municipal Enterprise “Miskvodokanal” (Sumy, Ukraine) recorded an excess of the permissible concentrations of pollutants in the wastewater received by the WWTP according to the following indicators (Table 2).
Table 2.
Indicators of wastewater, Sumy region (Ukraine).
Significant fluctuations in the quality of incoming wastewater were recorded in terms of main indicators: ammonium nitrogen and phosphate content, as well as high concentrations of other pollutants.
Changes in wastewater composition in recent years, the appearance of toxic compounds, bactericidal substances, and anionic surfactants, negatively affect the biological treatment process. Additionally, low winter air temperatures slow the rate of biological processes, further reducing the quality of wastewater treatment.
Figure 4 shows photos of the urban wastewater treatment plant in Sumy. Wastewater and activated sludge samples were taken from them.
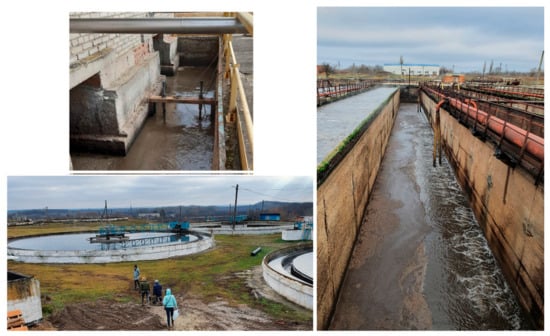
Figure 4.
Local WWTP (2021): the measuring instruments are installed at the head of the operating system after the mechanical grids.
2.2. Structure and Implementation of the Software of the Information System to Determine the Quality of Wastewater Entering the Biological Treatment Plant
Based on the above, it is reasonable to propose a scheme of data processing, taking into account the emergencies that may arise as a result of accidental emissions and sudden releases of pollutants (Figure 5).
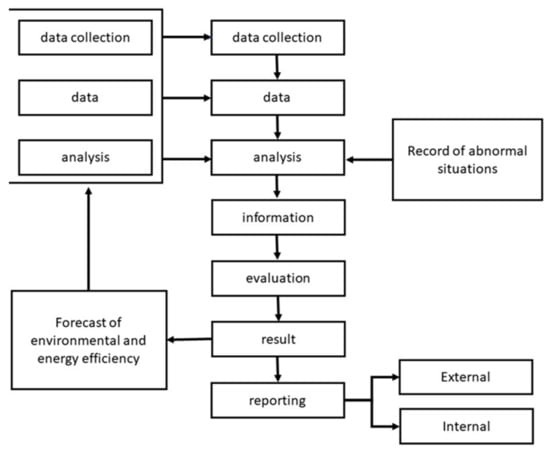
Figure 5.
Scheme of processing environmental data of water and wastewater utilities, taking into account the potential emergencies.
In general, the assessment of material flows has the following objectives: visualisation of individual material flows; unification of the system of representation of material and energy flows; development and maintenance of a unified database and targeted provision of information to decision makers; definition of responsibility for maintaining quality information about flows; and control of compliance with environmental and economic objectives of possible impacts of material flows in any decision-making processes.
The methodology of environmental management of wastewater treatment plants, when complementing the classical approaches to the task of predicting emergencies, both in distributed elements of wastewater and treatment systems, will simultaneously meet the requirements of ISO 9001 “Quality Management Systems”, ISO 14001 “Environmental Management Systems”, ISO 50001 “Energy Management Systems”, and ISO 31000 “Risk Management” (Figure 6).
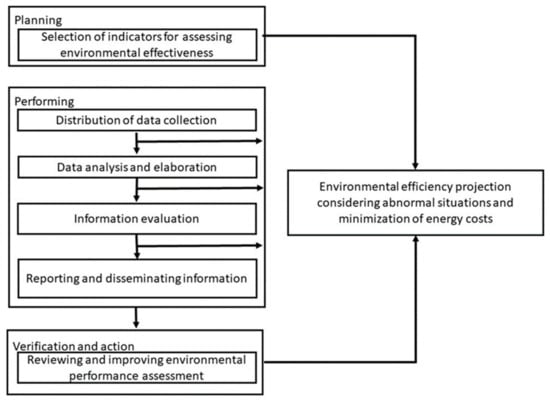
Figure 6.
Methodology for determining the environmental effectiveness of biological treatment facilities Municipal Enterprise “Miskvodokanal” taking into account the possibility of emergencies in water bodies.
For the step-by-step implementation of such a methodology, software has been created, whose tasks are:
- Time-synchronised acquisition and storage of information in near-real-time mode (RTM) of fast-acting—the data come from the inlet of the WWTP:
- −
- pH;
- −
- Oxidation reduction potential (ORP);
- −
- Electrical conductivity;
- −
- Temperature.
- Maintenance of a database of all parameters and synchronizing them by process time.
- Graphical display of all data in the form of two-dimensional graphs and three-dimensional surfaces.
- Ability to convert data to publicly available formats of tabular processors, such as the “.xls” format.
- Analytical module performs pre-processing of information: mathematical expectation, variance, and multiple correlations.
- Creation of a typical report on WWTP operation modes.
The creation of the monitoring circuit hardware was based on the fact that the operation of automatic pH (ORP) metres is based on measuring the electromotive force (EMF) value of the electrode system, which is proportional to the activity of hydrogen ions in the solution, pH (hydrogen index). The measuring circuit is essentially a voltmeter, which is calibrated directly in pH units for a particular electrode system (usually the measuring electrode is glass, and the auxiliary electrode is silver chloride).
Parameters of the pH measuring device (MP):
- Measurement range: 0…14 pH;
- Operating temperature range: −5…+110 °C;
- Pressure range of the measured medium: up to 6 bar;
- Minimum conductivity: 1 μS/cm.
Each primary transducer (PT) can be remotely operated from the sensor up to a distance of 800 m. The pH/ORP metre has a menu and provides a digital indication of pH, EMF, and temperature values, their conversion into proportional values of unified DC output signals, data exchange via RS-485 digital interface (ModBus RTU exchange protocol), and signalling of measured parameters exceeding the set values, as well as archiving and graphical display of measurement results.
When using a Modbus to HART converter, it is possible to produce a 4–20 mA analogue output signal with a superimposed HART digital signal.
Connection diagrams for integrating a pH (ORP) metre with flow metres (Figure 7).
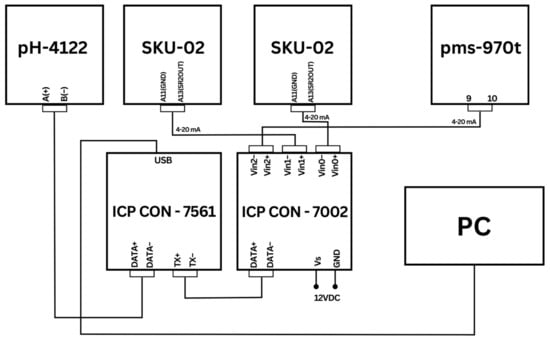
Figure 7.
Diagrams of integrating a pH(ORP)-meter with flow metres.
Placement of the pH, ORP, conductivity, and temperature measuring complexes of the wastewater channel after the grids (Figure 8).
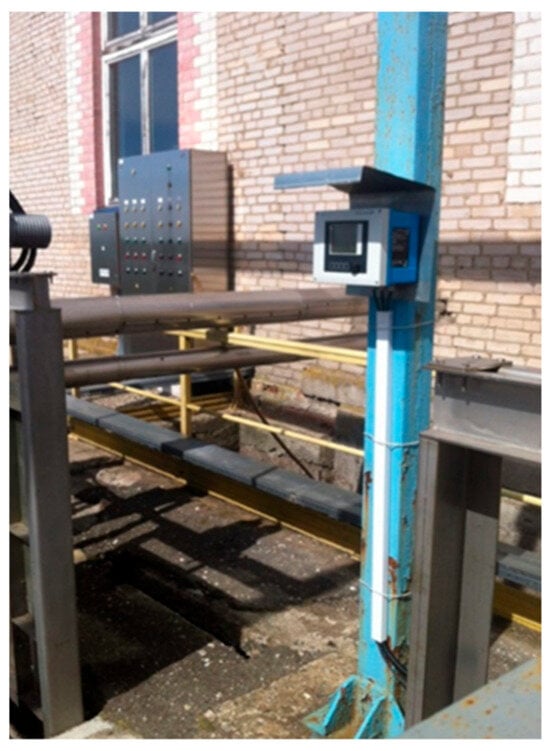
Figure 8.
Measuring complexes of pH, ORP, conductivity, and temperature.
The programme requires a Python interpreter of version 3.8 or higher. The programme also uses the following modules besides the built-in Python: numpy, pandas, requests, xlrd, XlsxWriter, PyQt5, and pyqtgraph. The programme uses a SQLite3 database for accounting.
The programme does not need to be configured and runs from a folder. The software interface is implemented using the Qt cross-platform framework. It is intuitive and concise.
The main window of the programme displays graphically the daily values of indicators such as pH, ORP, etc. (Figure 9). The first case is the temperature from the pH sensor and the second case is the temperature from the ORP sensor. Temperature meters are used there to correct the determination of their basic pH and ORP values.
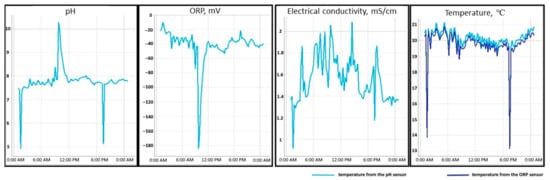
Figure 9.
Graphic display of wastewater indicators; diurnal dynamics.
The main window of the programme displays daily graphs with a sampling rate of 15 min for parameters such as pH, ORP, conductivity, and temperature, as well as section selection buttons. The following sections are present (grey transition buttons):
- −
- pH measurement (automatic recording to the database (DB) every 5 min);
- −
- ORP measurement (automatic recording to the database every 5 min);
- −
- Electrical conductivity measurements (automatic recording to the database every 5 min);
- −
- Temperature measurements (automatic recording in the database every 5 min);
- −
- Wastewater flow-rate measurements (manual recording in DB);
- −
- Results of laboratory analysis of water quality (manual recording of parameters in DB);
- −
- Archived data (all results of automatic recording to DB);
- −
- Analytical module for wastewater assessment.
2.3. Microbiological Study of Activated Sludge Condition
Hydrobiological analysis of activated sludge, microscopy using a video camera, recording images of the state of the structure of activated sludge, recording images of the species composition of biocenosis, and violations of the morphology of microorganisms were carried out [9].
The hydrobiological analysis of activated sludge consists of the following steps:
- (1)
- Visual examination of the sludge in a glass cylinder;
- (2)
- Identification of species, subspecies of organisms (for small flagellates, bacterial colonies, higher systematic ranks are used);
- (3)
- Determination of the number of each species by one of the quantitative counting methods, depending on the required accuracy of the conclusions;
- (4)
- Description of the functional state, internal structure, morphological changes in indicator organisms;
- (5)
- Determination of the size of some characteristic bioindicators is carried out if microscopic examination reveals their noticeable shredding, as well as to clarify species diagnosis;
- (6)
- Allocation of bioindicators to characteristic groups of organisms present in a given sludge sample (the main criteria for allocation are the nutritional needs of bioindicators, their relation to the concentration of dissolved oxygen, ecological plasticity, understood as the ability to exist and adapt to a wide range of environmental changes, and resistance to toxic wastewater);
- (7)
- Final assessment of the biocenosis, its assignment to one of the specific types, and characteristics of the established type.
Counting the number of species: the mixed sample was counted using microscopy. The amount of each individual species in 1 drop (0.01 mL) was examined. The general characteristics of the sludge according to the expert assessment are given in Table 3 according to the methodology [10].
Table 3.
Characterisation of the state of activated sludge of wastewater treatment plants according to species diversity.
The microscopy of all activated sludge samples was also systematised and processed using a digital imaging system “SEO Scan ICX 285 AK-F IEE-1394” and a morphometric programme “SEO Image Lab 2.0” (Sumy, Ukraine).
3. Results and Discussion
3.1. Analysis of the Results of the Use of the Information System to Determine the Quality of Wastewater Entering the Biological Treatment Plant
Abiotic stressors can have both catalytic effects on the activated sludge microbiome (e.g., nutrient additives) and inhibitory effects. The conditions of the neutral environment (pH = 6.5–7.8) are optimal for biocenosis. When the pH changes to the acid side, there is a decrease in the intensity of microorganism metabolism, deflocculation of activated sludge flakes (flakes are pulled into bundles, and the sludge is crushed and lightened) and, accordingly, there is a decrease in the sedimentation capacity. At pH < 5.0, microorganisms are displaced by fungi. When the reaction of the medium changes to the alkaline side, in contrast, metabolic processes are more intensive, and an increased pH (9.5 units and above) causes the death of the microbial population [11].
Over a period of two months, using the information system, data sets on wastewater quality indicators were generated (Figure 10). Sample size is the total number of observation units (54.328 points), and registration of indicator values were taken every 5 min.
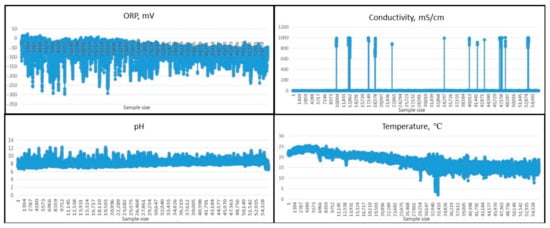
Figure 10.
Real-time measurement parameters.
The pH indicator values of wastewater at the inlet of the system have unacceptable values (recorded in the software database of the operating system); there are periods of up to 2 h during which the pH value is higher than 8.5 pH units (amplitude reaching values of about 10). Such a fixed long-term active reaction of the water solution coming to the activated sludge unambiguously provokes the death of the microbial population of the latter and blocks the normative wastewater treatment at the sewage treatment plant.
Violations in the technological regimes of biotreatment plants for both industrial and domestic wastewater, in particular, high loads and volley discharges of highly toxic substances, or a decrease in the concentration of dissolved oxygen or a sharp change in the pH of the environment, cause a decline in the biodegradative capacity and functional activity of biocenosis microorganisms, lead to anthropogenic eutrophication and chemical pollution of the hydrographic network with substances in different classes of hazards [12].
When studying industrial facilities such as biological treatment plants, it becomes necessary to establish the most likely relationships and interdependencies between two or more variables; identifying relationships between different indicators, factors, and attributes is a difficult task [13,14]. To find such mathematical functional or structural dependencies between two or more variables (based on accumulated experimental data), correlation analysis methods are very useful.
Correlation analysis answers the statistical hypothesis about the absence or presence of a relationship between variables with a certain predetermined confidence level.
The linear correlation coefficient is widely used to quantify the density of a relationship [15,16,17]. If the values of variables X and Y are given, it is calculated using the formula:
where is the average value of the product of physical quantities investigated for the presence of linear relationships, , are the average values of physical quantities investigated for the presence of linear relationships, and , are the standard mathematical deviations of the examined for the presence of linear relationships of physical quantities.
The correlation coefficient takes on a value from −1 to +1 (σ—variance).
If |r| < 0.30, then the relationship between the features is weak;
0.30 ≤ |r| ≤ 0.70—moderate relationship;
|r| > 0.70—a strong or dense relationship.
The correlation coefficient can vary within the limits −1 ≤ r ≤ 1 and the closer it is modulo one, the tighter the linear correlation dependence—the closer the points are located to the line, the more qualitative and reliable the linear model. If either r = −1, then r = 1. If either r = −1 or r = 1, it is a strict linear relationship, in which all empirical points will be on the constructed line. On the contrary, the closer to zero, the further the points are scattered, and the less linear dependence is expressed.
When |r| = 1, the relationship is functional.
If |r| ≈ 0, there is no linear relationship between X and Y. However, a non-linear interaction is possible and this requires additional verification.
When assessing a linear multiple relationship, the multiple correlation coefficient is calculated. It reflects the density of the relationship between the dependent variable and the variations of all independent variables included in the analysis:
where —factor dispersion;
—total dispersion.
The coefficient of determination is the private analogue of the empirical coefficient of determination. It represents the square of the correlation coefficient: —the coefficient of determination shows the proportion of variation in the result (physical quantity) Y, which is caused by the influence of a trait factor (physical quantity) X. The linear coefficient of determination can vary within the range of , and the closer it is to unity, the better the linear model approximates the empirical data.
When assessing the closeness of the relationship between the outcome Y and two factor attributes X1, X2, the multiple correlation coefficient can be determined by the formula:
where r is the pairwise correlation coefficients between the features.
The multiple correlation coefficient varies from 0 to 1 and is a positive value: 0 < R < 1.
R ≤ 0.3—there is practically no relationship (either not all important factors of the relationship are taken into account, or the wrong form of the regression equation is chosen; it is necessary to review the variables included in the model and possibly its type);
0.3 < R ≤ 0.5—weak relationship;
0.5 < R ≤ 0.7—moderate relationship;
R > 0.7—strong relationship.
Interpreting Pearson’s correlation coefficient values is dependent on their absolute magnitudes [18]. Possible values of the correlation coefficient range from 0 to ±1. The greater the absolute value of rxy, the stronger the relationship between the two variables. rxy = 0 indicates a complete absence of a relationship. rxy = 1 signifies the presence of an absolute (functional) relationship. To assess the strength or intensity of the correlation, commonly accepted criteria are typically used. According to these criteria, absolute values of rxy < 0.3 denote a weak correlation, values of rxy from 0.3 to 0.7 indicate a moderate correlation, and values of rxy > 0.7 suggest a strong correlation. To evaluate the strength of the correlation relationship, Cheddock’s scale can be applied. According to this scale, values of the absolute correlation coefficient rxy less than 0.3 indicate a weak strength of correlation, from 0.3 to 0.5—a moderate strength, from 0.5 to 0.7—a significant strength, from 0.7 to 0.9—a high strength, and more than 0.9—a very high strength of correlation.
The processing of the data obtained using mathematical statistics is presented in Table 4.
Table 4.
Analytical module of the wastewater programme.
Evaluation of the results of the static analysis demonstrates the following relationships (important from the technological point of view):
- −
- Strong: between pH and temperature—correlation coefficient 0.802;
- −
- Moderate: between pH and ORP—correlation coefficient 0.692;
- −
- Moderate: between pH and electrical conductivity (EC)—correlation coefficient 0.562;
- −
- Moderate: between conductivity and temperature—correlation coefficient 0.516.
The other correlations are characterised as weak, but they do exist.
The higher the correlation coefficient between the factors, the greater their mutual influence on the purification efficiency in the activated sludge system, which indicates the synergetic effect of their summation.
3.2. Experimental Determination of the Presence of Sulphur-Containing Toxic Substances in the WWTP Inflow and Their Effect on Activated Sludge
The increase in activated sludge biomass is not a full-fledged characteristic of the ongoing processes of toxicant degradation and efficiency of biotreatment plants. Under conditions favourable for microorganism life activity, more advanced species, up to predators, appear in biocenosis. Rotifers and infusoria belong to predators of the third trophic level. The dynamics of changes in their numbers, and the succession of the microbiome of activated sludge provides judgements about the quality of biotreatment and sustainability of activated sludge [19].
When analysing the results of the observations, patterns of changes in the species’ composition of the cenosis of activated sludge and the morphology of microorganisms were determined from the impact of incoming toxic substances. From the typical changes in cenosis, recorded with the help of a video camera, an album was compiled to express the determination of the causes of the disorders in the cenosis of activated sludge (Figure 11).
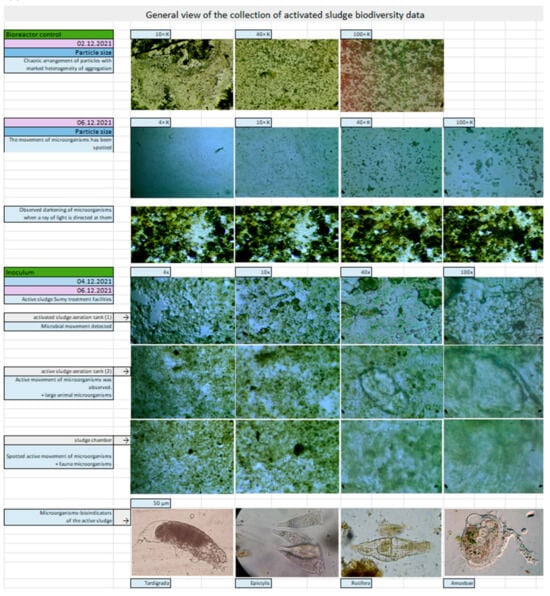
Figure 11.
Systematisation of the database on the activity of activated sludge microorganisms.
Changes in sludge cenosis occur within 2–5 h after a toxic substance enters the aeration tank. Its definition using the hydrobiological method is possible within one hour after sampling; therefore this method can be called an express method because of its simplicity and the short time it takes to determine the causes of the violations. The intake of hard-to-oxidise organic substances with concentrations above 400–600 mg/L leads to the appearance of a large number of small shell amoebas within 2–3 h from the beginning of the intake. When these substances are consumed for more than 2–3 periods of aeration, an increase in the number of small flagellates is observed due to the ebb of activated sludge flakes.
The intake of ammonium nitrogen at concentrations above 60–70 mg/L leads to an increase in the number of filamentous forms of microorganisms, Actinomycetes. The sludge index increases to 160–180 mL/g. At low COD load, the process of nitrification and simultaneous denitrification continues, and the formation of nitrogen bubbles leads to the floating of Actinomycetes on the surface of the aeration tank in the form of a grey, light foam. In the aeration tank, foaming occurs due to the development of Actinomycetes of the genus Microthrix [20].
The appearance of planktonic Gromia amoebas indicates the ingress of concentrations of petroleum products of more than 5–8 mg/L. At the concentration of petroleum products, more than 15–20 mg/L Gromia are present in large quantities in the sludge.
The recorded value of sulphide ions and hydrogen sulphide concentrations (in total) ranged between 0.22 and 1.3 mg/L. Such concentrations of sulphur-containing toxic substances are critically incompliant with biological treatment technology with activated sludge used at treatment facilities. Microorganisms at sharp fluctuations in hydrogen sulphide loads (in recalculation of sulphide ion) up to 0.10 mg/L and more experience stress influence, leading to a lethal result of total biocenosis or a separate indicator species [21,22].
In some cases, it is advisable to use morphological changes in indicator microorganism species to determine the type of toxicant. The class of infusoria is the most indicative. For example, under favourable conditions, a large number of attached colonial infusoria of all species with open peristomes are observed in the activated sludge and are more abundant than all free-floating infusoria species.
When hard-to-oxidise industrial effluents are introduced, not only does the number of small shell benthic amoebas increase significantly, but the zooids of colonial infusoria also cysticise. The free-floating species of infusoria become dominant in biocenosis [23].
According to the data obtained (Table 5), changes in the structure of biocenosis occur with increasing toxic load: the number of predators, especially rotifers, decreases and the number of protozoa (flagellates and amoebae) increases. If in the initial wastewater protozoa constituted 4% of the total biocenosis and activated sludge was characterised as intensively nitrifying, then at a load of S2− 0.5 mg/dm3 in tank 1—already 31% (against 23% of rotifers), which indicates a decrease in the nitrifying ability of activated sludge, its condition was assessed as “satisfactory”. At a load of S2− 1.5 mg/dm3 in tank 2, the ratio between protozoa and predators practically equalized, 52% vs. 47%, of which the rotifers were only 13%. This is also consistent with the research [24].
Table 5.
Comparative assessment of activated sludge biocenosis.
The high diversity of microorganisms and their simultaneous uneven distribution depends on wastewater flow rate, wastewater composition and dissolved oxygen concentration, temperature, and pH. The experiments demonstrate that the maintenance of stable key parameters, including wastewater flow rate and biochemical oxygen demand, leads to the development of a particular composition within the activated sludge biocenosis, which is supported by multiple studies [25,26,27,28].
The study of the effect of wastewater on the activated sludge of wastewater treatment plants (Table 4) showed the depressing effect of such exposure, up to the complete death of the microorganisms in activated sludge. In general, the activated sludge microorganism population, which provides biodegradation of C, N, P, S, and other elements in biological treatment plants, died under the influence of wastewater due to the fact that the activated sludge consortium is negatively affected primarily by the high pH of such a water solution [29]. Violations in the technological regimes of domestic wastewater treatment plants, in particular, high loads and volley releases of highly toxic substances, a decrease in the concentration of dissolved oxygen, or a sudden change in pH of the environment, provoke a decrease in the biodegradability and functional activity of biocenosis microorganisms (up to death), leading to anthropogenic eutrophication and chemical pollution of substances in various classes of geo-ecosystem hazard [30].
At the same time, at the moment, the inflow of hazardous substances for biological sewage treatment plants is unsteady without the possibility of determining in advance (before their fixation at the treatment plants) their actual volume and degree of toxicity [31].
3.3. Concept of the Management of the Biological Wastewater Treatment Process
In the current practice of designing wastewater treatment plants, there are significant reservations in terms of optimising the control of the technological process of biological treatment. The creation of control systems with a higher degree of optimality can potentially have a significant economic effect. At the same time, according to specialists in the field of control systems, the labour intensity of procedures for the synthesis of control systems is distributed as follows: 20%—carrying out formal procedures of control automation system (ACS) synthesis, and 80%—synthesis of mathematical model of control object. The first stage of synthesis is not a big problem; this field of technology is sufficiently developed to solve the problem of synthesis of ACS in this class [32]. Thus, in the first stage of the project, we set the task of synthesising an adequate mathematical model of the control object.
Figure 12 shows the structural diagram of the control system. The control system implements a classical feedback scheme. There are two sub-models in the structure of the control object: the active sludge medium and the active sludge as a biological system. The vector of control actions affects the activated sludge indirectly, through the active sludge environment. The activated sludge environment influences the activated sludge through factors, some of which are recorded by sensors and used to implement the deviation feedback loop. In addition to controlling influences, the active sludge environment is influenced by both external environmental factor Z and products of the process of life activity of the active sludge itself Z2.
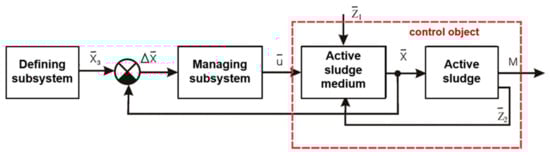
Figure 12.
Block diagram of the control system.
Thus, the automatic control system maintains the preset dynamic values of the activated sludge medium in accordance with their preset values 3.
In terms of the procedure for synthesising a mathematical model, activated sludge is a rather complex system. Firstly, the active sludge includes a large number of species of organisms. Secondly, the set of connections between them and the environment is also wide. Therefore, in the widespread practise of modelling processes in activated sludge, the most common is the use of regression models. In this case, the modelling object is represented as a “black box”, i.e., a converter of inputs into outputs. In this case, the internal structure of the object is not considered. The description of the system in the form of a “black box” is usually resorted to when it is impossible or difficult to describe the internal structure or the internal system of cause–effect relations of the simulation object [33,34].
An alternative approach to mathematical model synthesis is a causal model, i.e., a model based on analysis of cause–effect relationships inside the simulation object. An essential advantage of the causal model is the possibility to determine the dynamic properties of the system, going far beyond the limits of knowledge obtained empirically.
When applied to modelling activated sludge, synthesis of its causal model, in its pure form, is an unsolvable problem. An attempt to synthesise a pure causal model is connected with formalisation of causal relations, which have not been sufficiently studied. In particular, these are, first of all, processes within a living cell [35,36,37].
However, it seems possible to use a combined approach, i.e., to use regression and causal modelling when synthesising an active sludge model. In this approach, those elements that can be analysed by their internal structure are causally described, and the elements that cannot be analysed are described using regression equations [38,39,40].
To synthesise a mathematical model, the concept of a “factor function” is introduced. It reflects the influence of a certain factor on a certain species of microorganism. The differential equation of the dynamics of the population of the i-th species of microorganism in the activated sludge is described by Equation (4):
where Mj is the number of the population of the j-th species of microorganisms,
μj_max is the maximum growth rate of the population of the j-th species of microorganism,
Fj is global factor function of j-th species of microorganism (5)
ƒj,i is local factor function of the i-th factor for the j-th species of microorganism, number of factors in the model.
Alternative variant of global factor function (6):
The approximating expression for the local factor function of the i-th factor for the j-th species of microorganism is as follows (7):
where χi is the current value of the j-th factor,
Χopt_j,i is the optimal value of the i-th factor for the j-th species of microorganism,
σj,i is the coefficient of the width of the positive range of the local factor function of the i-th factor for the j-th microorganism species.
This expression, as a function of the factor, has a hyperbolic form, generally presented in Figure 13.
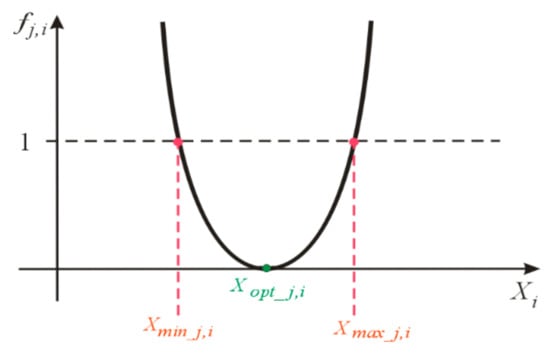
Figure 13.
General view of the local factor function.
Setting the parameters of the local factor function (8):
The approach to modelling biological objects under liquid medium conditions described above can be demonstrated with the realisation of a mathematical model of the simplest process of growth of the monoculture population (Figure 14). For the ease of intuitive perception of model properties and estimation of its adequacy, we consider the simplest situation with only two factors that influence population growth. The first factor is the concentration of nutrients (feed) in the environment. The second factor is the concentration of monoculture products (depressing population growth).
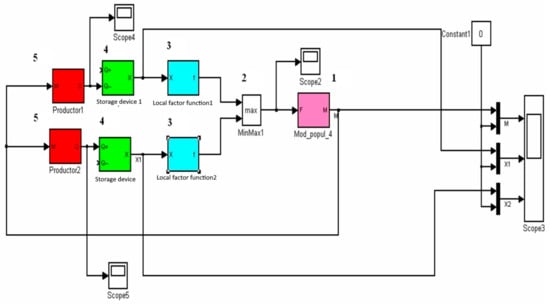
Figure 14.
Implementation of the two-factor process model.
A number of standard functional blocks are distinguished in the structure of the model:
- −
- Population model (block 1);
- −
- Global factor function determinant (block 2);
- −
- Determinant of a local factor function (block 3);
- −
- Factor state determinant (block 4);
- −
- Factor flow calculator (block 5).
The application of these approaches that allows the implementation of an integrated decision support system (DSS) in wastewater treatment plants is presented in Figure 15.
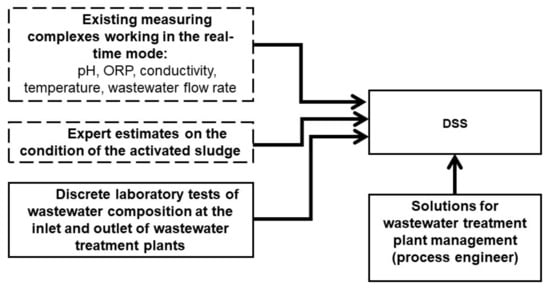
Figure 15.
Information flows of WWTP.
4. Conclusions
The software for the system of real-time collection of information about quantitative and qualitative indicators of wastewater allows for the better control of the biological processes of wastewater treatment, providing registration and maintenance of the database regarding the values of wastewater indicators coming into the “head” of a sewage treatment plant; formation of the reporting table; and determination of dependencies between input parameters and output (condition of activated sludge) to form a knowledge base of the wastewater treatment process. Therefore, technological prerequisites for the construction of future forecasts of wastewater quality after treatment in sewage treatment plants, depending on measurements of pH, ORP, conductivity, temperature, and other parameters, and inclusion of the created software in case of modernisation (reconstruction) of wastewater treatment plants, are included in the overall management system.
The values of the “pH” indicator of wastewater at the inlet systematically have unacceptable values (recorded in the software database of the operating system); there are periods of up to 2 h during which the pH is higher than 8.5 (amplitude reaches values of about 10). Such a fixed long-term active reaction of the water solution coming to the activated sludge unequivocally provokes the death of the microbial population of the latter and blocks the normative treatment of sewage by the WWTP.
The correlation analysis of the relationship between the composition of wastewater flowing into the treatment shows the following values: strong—between pH and temperature, correlation coefficient 0.802; moderate—between pH and ORP, correlation coefficient 0.692; moderate—between pH and electrical conductivity, correlation coefficient 0.562; moderate—between conductivity and temperature, correlation coefficient 0.516. A strong correlation between pH and temperature confirms the expert opinion: the main industrial enterprise that releases alkaline water that poses the main threat to activated sludge is the textile industry facility; the temperature of its effluent is approximately 60 °C.
Intolerable concentrations of extremely dangerous sulphur-containing toxicants flow to the inlet of the wastewater treatment plant. The recorded value range of sulphide ion and hydrogen sulphide concentration (in total) is 0.22–1.3 mg/L. Such concentrations of a sulphur-containing toxicant are unacceptable for the technology of biological treatment with activated sludge used in the wastewater treatment plant, and we can conclude, since no such exceedances were recorded at the impact monitoring control points, that the toxicant is formed in the sewage network itself in the presence of an alkaline environment and other accompanying factors (temperature and time of water medium transportation). Thus, the future forecasting system of wastewater quality after treatment in sewage treatment plants was created, depending on the measurement in the RTM, indicators of pH, ORP, conductivity, temperature, the inclusion of the software created, and the modernisation (reconstruction) of sewage treatment plants, in the overall management system.
The realisation of a mathematical model of a simple process of population growth of monoculture with two factors that affect population growth (nutrient concentration and concentration of monoculture production concentration) was presented. To synthesise the mathematical model, we introduced a “factor function” reflecting the influence of a certain factor on a certain species of microorganisms. The differential equation of the dynamics of the number of i-th species of microorganisms in the activated sludge was described. The applied system of automated monitoring of wastewater parameters with expert assessment of activated sludge with a unified mathematical model of approaches allows the implementation of a comprehensive decision support system in the WWTP. The limitation of use is determined by the number of measuring instruments capable of measuring wastewater quality indicators in real time. However, this requires the construction of mathematical models that would take into account the cause–effect relations that operate under conditions of incomplete technological information and the potential presence of emergencies due to natural disasters and military activities.
Author Contributions
Conceptualisation, D.A., Y.C. and V.S.; software, D.A.; validation, L.S. and H.R.; formal analysis, V.S. and V.C.; investigation, D.A., V.S. and Y.C.; writing—original draft preparation, D.A., V.S. and Y.C.; writing—review and editing, L.S., M.F., M.B. and H.R.; visualisation, D.A. and V.C.; supervision, H.R. All authors have read and agreed to the published version of the manuscript.
Funding
This research and APC was funded by the Faculty of Tropical AgriSciences, Czech University of Life Sciences Prague, grant number IGA (20233111).
Data Availability Statement
The data sets generated during and/or analysed during the current study are available from the authors on request.
Acknowledgments
This research project was carried out as a planned research project of the Department of Ecology and Environmental Protection Technologies of Sumy State University, related to the topics ‘Assessment of the technogenic load of the region with changes in industrial infrastructure’ according to the scientific and technical programme of the Ministry of Education and Science of Ukraine (state registration no 0121U114478). This research was supported by ERA-NET Cofund AquaticPollutants, Thematic Annual Programming Action—Measuring of Inputs and Taking Actions to Reduce CECs, Pathogens and Antimicrobial Resistant Bacteria in the Aquatic Ecosystems (inland and marine) (RedCoPollutants). Furthermore, Yelizaveta Chernysh and Hynek Roubík should be both treated as equal corresponding authors.
Conflicts of Interest
The authors declare no conflict of interest.
References
- Smol, M.; Mejia, A.; Howarth, M. Business Opportunities in the Water and Wastewater Sector Through the ReSOLVE Framework. In Water in Circular Economy; Springer: Berlin/Heidelberg, Germany, 2023; pp. 225–233. [Google Scholar]
- Schneider, M.Y.; Quaghebeur, W.; Borzooei, S.; Froemelt, A.; Li, F.; Saagi, R.; Wade, M.J.; Zhu, J.-J.; Torfs, E. Hybrid Modelling of Water Resource Recovery Facilities: Status and Opportunities. Water Sci. Technol. 2022, 85, 2503–2524. [Google Scholar] [CrossRef] [PubMed]
- Hernández-Chover, V.; Castellet-Viciano, L.; Bellver-Domingo, Á.; Hernández-Sancho, F. The Potential of Digitalization to Promote a Circular Economy in the Water Sector. Water 2022, 14, 3722. [Google Scholar] [CrossRef]
- Castellet, L.; Molinos-Senante, M. Efficiency Assessment of Wastewater Treatment Plants: A Data Envelopment Analysis Approach Integrating Technical, Economic, and Environmental Issues. J. Environ. Manag. 2016, 167, 160–166. [Google Scholar] [CrossRef] [PubMed]
- Ramírez-Melgarejo, M.; Güereca, L.P.; Gassó-Domingo, S.; Salgado, C.D.; Reyes-Figueroa, A.D. Eco-Efficiency Evaluation in Wastewater Treatment Plants Considering Greenhouse Gas Emissions through the Data Envelopment Analysis-Tolerance Model. Environ. Monit. Assess. 2021, 193, 301. [Google Scholar] [CrossRef] [PubMed]
- Shen, Y.; Li, H.; Zhang, B.; Cao, Y.; Guo, Z.; Gao, X.; Chen, Y. An Artificial Neural Network-Based Data Filling Approach for Smart Operation of Digital Wastewater Treatment Plants. Environ. Res. 2023, 224, 115549. [Google Scholar] [CrossRef] [PubMed]
- Ramkumar, D.; Jothiprakash, V.; Patil, B.N. Performance Assessment of Sewage Treatment Plants Using Compliance Index. J. Water Sanit. Hyg. Dev. 2022, 12, 485–497. [Google Scholar] [CrossRef]
- Tertouche, S.A.; Bellebia, S.; Bengharez, Z.; Zian, Z.; Jellali, S. Performance Assessment of Wastewater Treatment Plants (WWTPs) and Application of Electrocoagulation Process to Improve Their Operation. Pol. J. Environ. Stud. 2021, 30, 5273–5284. [Google Scholar] [CrossRef]
- Campos, J.L.; Valenzuela-Heredia, D.; Pedrouso, A.; Val del Río, A.; Belmonte, M.; Mosquera-Corral, A. Greenhouse Gases Emissions from Wastewater Treatment Plants: Minimization, Treatment, and Prevention. J. Chem. 2016, 2016, 3796352. [Google Scholar] [CrossRef]
- Chub, I.M.; Bulgakova, O.V. Guidelines for Practical Classes, Completion of Term Papers, and Self-Study on the Subject “Microbiology”. Kharkiv, 2019; p. 78. Available online: http://eprints.kname.edu.ua/52893/ (accessed on 2 May 2023).
- Baldwin, D.D.; Campbell, C.E. Short-Term Effects of Low PH on the Microfauna of an Activated Sludge Wastewater Treatment System. Water Qual. Res. J. 2001, 36, 519–535. [Google Scholar] [CrossRef]
- Nasr, M. Aquatic Pollution and Wastewater Treatment System. In Algae and Aquatic Macrophytes in Cities; Elsevier: Amsterdam, The Netherlands, 2022; pp. 23–37. [Google Scholar] [CrossRef]
- Spiller, M. Measuring Adaptive Capacity of Urban Wastewater Infrastructure—Change Impact and Change Propagation. Sci. Total Environ. 2017, 601–602, 571–579. [Google Scholar] [CrossRef]
- Shtepa, V.N.; Alekseevsky, D.G.; Zayets, N.A. Methodological support for environmental safety management of local wastewater treatment systems. In Scientific and Technological Progress in Housing and Communal Services: Collection of Works: In 2 parts. Institute of Housing and Communal Services of NASB; Kitikov, V.O., Ed.; Belarusian State Technical University: Minsk, Belarus, 2021; pp. 215–221. [Google Scholar]
- Najarzadeh, D. Conservative Confidence Intervals on Multiple Correlation Coefficient for High-Dimensional Elliptical Data Using Random Projection Methodology. J. Appl. Stat. 2022, 49, 64–85. [Google Scholar] [CrossRef]
- Smith, G. Chapter 10—Multiple Regression. In Essential Statistics, Regression, and Econometrics; Smith, G., Ed.; Academic Press: Cambridge, MA, USA, 2012; pp. 297–331. [Google Scholar]
- Johnson, R.L.; Penny, J. Split-Half Reliability. In Encyclopedia of Social Measurement; Elsevier: Amsterdam, The Netherlands, 2005; pp. 649–654. [Google Scholar] [CrossRef]
- Pearson Correlation. ScienceDirect. Available online: https://www.sciencedirect.com/topics/computer-science/pearson-correlation (accessed on 7 May 2023).
- Babko, R.; Pliashechnyk, V.; Zaburko, J.; Danko, Y.; Kuzmina, T.; Czarnota, J.; Szulżyk-Cieplak, J.; Łagód, G. Ratio of Abundances of Ciliates Behavioral Groups as an Indicator of the Treated Wastewater Impact on Rivers. PLoS ONE 2022, 17, e0275629. [Google Scholar] [CrossRef] [PubMed]
- Jaromin-Gleń, K.; Babko, R.; Łagód, G.; Sobczuk, H. Community Composition and Abundance of Protozoa Under Different Concentration of Nitrogen Compounds at “Hajdow” Wastewater Treatment Plant/Zbiorowiska Pierwotniaków I Ich Liczebność W Oczyszczalni Ścieków „Hajdów” Przy Różnych Stężeniach Związków Azotu. Ecol. Chem. Eng. S 2013, 20, 127–139. [Google Scholar] [CrossRef]
- Wilson, E.V. Research in the Field of Removing Reduced Sulfur Compounds from Wastewater. Eurasian Sci. Bull. 2013, 3, 149. Available online: https://cyberleninka.ru/article/n/issledovaniya-v-oblasti-udaleniya-vosstanovlennyh-soedineniy-sery-iz-stochnyh-vod (accessed on 17 May 2023).
- Wilson, E.V.; Litvinenko, V.A.; Obukhov, D.I. Methods for Removing Reduced Sulfur Compounds from Groundwater. IOP Conf. Ser. Mater. Sci. Eng. 2020, 913, 042045. [Google Scholar] [CrossRef]
- Biliavtseva, V. Methods of wastewater treatment with the help of aquatic organisms. Colloq.-J. 2021, 17, 54–63. [Google Scholar] [CrossRef]
- Austigard, Å.D.; Svendsen, K.; Heldal, K.K. Hydrogen Sulphide Exposure in Waste Water Treatment. J. Occup. Med. Toxicol. 2018, 13, 10. [Google Scholar] [CrossRef] [PubMed]
- Liwarska-Bizukojc, E. Composition of activated sludge biocenosis in the example of municipal wastewater treatment plant for a city of Zgierz. Ochr. Srodowiska 2017, 39, 3–7. [Google Scholar]
- Sobczyk, M.; Pajdak-Stós, A.; Fiałkowska, E.; Sobczyk, Ł.; Fyda, J. Multivariate Analysis of Activated Sludge Community in Full-Scale Wastewater Treatment Plants. Environ. Sci. Pollut. Res. 2021, 28, 3579–3589. [Google Scholar] [CrossRef]
- Paździor, K.; Bilińska, L. Microscopic Analysis of Activated Sludge in Industrial Textile Wastewater Treatment Plant. Autex Res. J. 2022, 22, 358–364. [Google Scholar] [CrossRef]
- Madoni, P. A Sludge Biotic Index (Sbi) For The Evaluation of the Biological Performance of Activated Sludge Plants Based on the Microfauna Analysis. Wat. Res. 1994, 28, 67–75. Available online: https://portal.camins.upc.edu/materials_guia/250655/2014/Madoni,%201994%20(SBI).pdf (accessed on 20 June 2023). [CrossRef]
- Leal, C.; Val del Río, A.; Ferreira, E.C.; Mesquita, D.; Amaral, A.L. Validation of a Quantitative Image Analysis Methodology for the Assessment of the Morphology and Structure of Aerobic Granular Sludge in the Presence of Pharmaceutically Active Compounds. Environ. Technol. Innov. 2021, 23, 101639. [Google Scholar] [CrossRef]
- Dychko, A.; Remez, N.; Kyselov, V.; Kraychuk, S.; Ostapchuk, N.; Kniazevych, A. Monitoring a nd Biochemical Treatment of Wastewater. J. Ecol. Eng. 2020, 21, 150–159. [Google Scholar] [CrossRef]
- Flores-Alsina, X.; Ramin, E.; Ikumi, D.; Harding, T.; Batstone, D.; Brouckaert, C.; Sotemann, S.; Gernaey, K.V. Assessment of Sludge Management Strategies in Wastewater Treatment Systems Using a Plant-Wide Approach. Water Res. 2021, 190, 116714. [Google Scholar] [CrossRef] [PubMed]
- Alekseevsky, D.G.; Chernysh, Y.Y.; Shtepa, V.N. Formalization of the Task of Creating a Mathematical Model of Combined Wastewater Treatment Processes. J. Eng. Sci. 2021, 8, H1–H7. [Google Scholar] [CrossRef]
- Ekman, M. Bilinear Black-Box Identification and MPC of the Activated Sludge Process. J. Process. Control. 2008, 18, 643–653. [Google Scholar] [CrossRef]
- Szeląg, B.; Gawdzik, A.; Gawdzik, A. Application of Selected Methods of Black Box for Modelling the Settleability Process in Wastewater Treatment Plant. Ecol. Chem. Eng. S 2017, 24, 119–127. [Google Scholar] [CrossRef][Green Version]
- Banadda, N.; Nhapi, I.; Kimwaga, R. A review of modeling approaches in activated sludge systems. J. Environ. Sci. Technol. 2011, 5, 397–408. [Google Scholar]
- Mąkinia, J.; Zaborowska, E. Mathematical Modelling and Computer Simulation of Activated Sludge Systems; IWA Publishing: London, UK, 2020; ISBN 9781780409528. [Google Scholar]
- Kim, Y.; Lee, S.; Cho, Y.; Kim, M. Analysis of Causal Relationships for Nutrient Removal of Activated Sludge Process Based on Structural Equation Modeling Approaches. Appl. Sci. 2019, 9, 1398. [Google Scholar] [CrossRef]
- Richardson, E.E.; Hanson, A.T. Regression Modeling of Ozonation Process in Wastewater Treatment Plants for Reduction of Waste Activated Sludge. Ozone. Sci. Eng. 2014, 36, 451–464. [Google Scholar] [CrossRef]
- Smets, I.Y.; Haegebaert, J.V.; Carrette, R.; Van Impe, J.F. Linearization of the Activated Sludge Model ASM1 for Fast and Reliable Predictions. Water Res. 2003, 37, 1831–1851. [Google Scholar] [CrossRef]
- Liu, Y.; Yuan, L.; Li, D.; Li, Y.; Huang, D. Process Monitoring of Quality-Related Variables in Wastewater Treatment Using Kalman-Elman Neural Network-Based Soft-Sensor Modeling. Water 2021, 13, 3659. [Google Scholar] [CrossRef]


Disclaimer/Publisher’s Note: The statements, opinions and data contained in all publications are solely those of the individual author(s) and contributor(s) and not of MDPI and/or the editor(s). MDPI and/or the editor(s) disclaim responsibility for any injury to people or property resulting from any ideas, methods, instructions or products referred to in the content. |
© 2023 by the authors. Licensee MDPI, Basel, Switzerland. This article is an open access article distributed under the terms and conditions of the Creative Commons Attribution (CC BY) license (https://creativecommons.org/licenses/by/4.0/).