Review

Surface Velocity to Depth-Averaged Velocity—A Review of Methods to Estimate Alpha and Remaining Challenges

1
National Institute of Water and Atmospheric Research (NIWA), Christchurch 8011, New Zealand
2
Tasman District Council, Nelson 7050, New Zealand
3
Division of Hydraulic Engineering and River Morphology, Leichtweiß Institute for Hydraulic Engineering and Water Resources, TU Braunschweig, 38106 Braunschweig, Germany
4
Queensland Government, Mareeba, QLD 4880, Australia
5
Meisser Surveying AG, 7000 Chur, Switzerland
*
Author to whom correspondence should be addressed.
Water 2023, 15(21), 3711; https://doi.org/10.3390/w15213711
Submission received: 6 September 2023 / Revised: 4 October 2023 / Accepted: 18 October 2023 / Published: 24 October 2023
(This article belongs to the Special Issue River Flow Monitoring: Needs, Advances and Challenges)

Abstract

:
The accuracy of discharge measurements derived from surface velocities are highly dependent on the accuracy of conversions from surface velocity u s to depth-averaged velocity U . This conversion factor is typically known as the ‘velocity coefficient’, ‘velocity index’, ‘calibration factor’, ‘alpha coefficient’, or simply ‘alpha’, where α = U / u s . At some field sites detailed in situ measurements can be made to calculate alpha, while in other situations (such as rapid response flood measurements) alpha must be estimated. This paper provides a review of existing methods for estimating alpha and presents a workflow for selecting the appropriate method, based on available data. Approaches to estimating alpha include: reference discharge and surface velocimetry measurements; extrapolated ADCP velocity profiles; log law profiles; power law profiles; site characteristics; and default assumed values. Additional methods for estimating alpha that require further development or validation are also described. This paper then summarises methods for accounting for spatial and temporal heterogeneity in alpha, such as ‘stage to alpha rating curves’, ‘site alpha vs. local alpha’, and ‘the divided channel method’. Remaining challenges for the accurate estimation of alpha are discussed, as well as future directions that will help to address these challenges. Although significant work remains to improve the estimation of alpha (notably to address surface wind effects and velocity dip), the methods covered in this paper could provide a substantial accuracy improvement over selecting the ‘default value’ of 0.857 for alpha for every discharge measurement.

1. Introduction

Surface velocimetry methods have long existed for making river flow measurements [1]. A wide range of equipment and techniques exist for measuring surface velocities, such as timed floats [2], Surface Velocity Radar (SVR) [3,4], and surface image velocimetry [5]. Surface image velocimetry provides the advantage of rapidly capturing flow information at a site, with full coverage of a river cross section from a short video. This is particularly useful during changing flow conditions [6,7] and when loop ratings exist [8]. Surface image velocimetry can either use oblique imagery (recorded at an angle to the water surface), or nadir (down-looking) imagery. Oblique imagery is typically recorded with cameras mounted on riverbanks or bridges [6,7], while nadir imagery is typically recorded from helicopters [9], drones [10], and aircraft [11]. Cameras usually operate in the visible portion of the electromagnetic spectrum (i.e., RGB); however, progress has been made with near infrared imagery for night operations [12] or by using thermal infrared cameras [13,14,15]. Surface image velocimetry relies on the motion of tracers on the water surface. These tracers can either be natural properties of the flow, such as turbulent surface features [11], thermal fluctuations [15], floating debris, and foam [7], or they can be artificially introduced [16,17].
After recording imagery of the water surface (e.g., videos with a consistent time interval between frames), the imagery is typically stabilised and orthorectified through the use of Ground Control Points (GCPs) [18,19,20], then processed to obtain surface velocities. There are many established algorithms for evaluating surface velocities, for example: Large Scale Particle Image Velocimetry (LSPIV) [5,21,22]; Space Time Image Velocimetry (STIV) [23]; Particle Tracking Velocimetry (PTV) [24]; Surface Structure Image Velocimetry (SSIV) [25]; and Feature Tracking Velocimetry (FTV) [26]. There are also multiple existing software packages and toolboxes for evaluating surface velocities, such as: Fudaa-LSPIV [22,27]; Hydro-STIV [28]; RIVeR [24]; RIVeR-STIV [29]; KLT-IV [30]; OpenRiverCam [31]; and TRiVIA [32]. Once the surface velocities are calculated, they can be time-averaged and then converted to depth-averaged velocities U , by multiplication with a number known as the ‘velocity coefficient’, ‘velocity index’, ‘calibration factor’, or ‘alpha’, where α = U / u s and u s is the time-averaged surface velocity. Depth-averaged velocities are then combined with a cross section of depth to obtain discharge. Only the component of depth-averaged velocity that is normal to the cross section is used for the discharge calculations. The cross section of depth is used to calculate ‘cross sectional area bins’, d A n , which correspond to each of the depth-averaged velocities U n , with discharge calculated as Q = n = 1 N U n d A n . Beyond this brief introduction, practical information on how to apply surface velocimetry measurement methods can be found in the references within this paper, such as [27,28,30,33,34,35,36].
A significant source of uncertainty for discharge estimates from surface velocity methods is the conversion from surface velocity to depth-averaged velocity (i.e., the estimation of α). The standard value considered for α is 0.85 or 0.86 [1], which is derived from velocity profiles that follow a 1/6th power law [37], resulting in an α value of 0.857 (to three significant figures). This standard α value serves as an acceptable approximation when no site-specific data are available and is generally applicable for many flow scenarios, such as in wide rectangular channels, where the depth significantly exceeds the roughness height. Alpha is typically computed as a single value for a whole cross section and is often assumed to remain constant for different water levels. However, in practice, α exhibits substantial natural variability due to factors such as variations in the site geometry, flow conditions, the extent of flow (such as overbank flow on floodplains), and the influence of wind on the water’s surface. Commonly reported ranges for α fall between 0.84 and 0.90 [38] and 0.7 to 0.9 [39]. Some extreme values exceeding 1.1 have also been reported, which are attributed to irregular velocity profiles or wind effects [39]. In general, smaller rivers with rough beds tend to exhibit lower α values, whereas artificial concrete channels tend to have higher α values [40]. The variability in α can be reduced by carefully selecting measurement sites, for example, avoiding locations with submerged vegetation [41], wake effects (e.g., bridge piers), changing channel geometry (e.g., channel constrictions), and strong winds [33].
Although α is a critical component of flow measurements using surface velocimetry, there is a lack of published information on the best way to estimate this parameter. This paper seeks to address this knowledge gap by detailing existing methods for estimating α and summarising future research that is needed. Seven methods to estimate alpha are provided, with the appropriate method depending on data availability.

2. Methods to Estimate α

2.1. Alpha—Default Value

The standard approach is to assume a constant alpha value of 0.85 or 0.86 [1]. This alpha value is derived from the integration of a velocity profile following a 1/6th power law, yielding a value of 0.857 [37]. It is employed as the ‘site’ alpha value and is applied uniformly to all velocity profiles within a cross section. This method does not take into account any site-specific characteristics or flow physics and serves as a ‘default value’ when no additional information is available.
In the case of deep, hydrodynamically smooth channels characterized by low relative roughness, the default α value is suitable when no other data are available [4]. However, as relative roughness increases, such as in shallow and rough bed flows, alpha departs from the default value, resulting in larger errors [4].

2.2. Site Alpha from Reference Discharge and Discharge from Surface Velocimetry with αi = 1

The most direct way to determine a site-averaged α value is from the ratio of an accurate reference discharge measurement Q R e f to that calculated from surface velocimetry Q S using an initial α value of αi = 1 [42] (a similar method was developed by Le Coz et al. [6] using near surface ADCP velocities).
α = Q R e f Q S , α i = 1
This equation originates from the premise that the measured reference discharge Q R e f (e.g., from an ADCP) and discharge from surface velocimetry Q S will be equal if an appropriate site-averaged α value is selected:
Q S = n = 1 N α u s , n d A n = Q R e f
α n = 1 N 1 u s , n d A n = Q R e f
α = Q R e f n = 1 N 1 u s , n d A n = Q R e f Q S , α i = 1
where there are N surface velocimetry sections, with indices from n = 1   to   n = N , the time-averaged surface velocity at section n is u s , n , and the incremental cross-sectional area of section n is d A n . The derivation makes use of the relationship that n = 1 N 1 u s , n d A n equals the discharge from surface velocimetry with an initial alpha value of 1 (αi = 1), which can be easily and conveniently calculated using existing software tools.
Q R e f will typically be measured with an ADCP using a moving-boat gauging or section-by-section method (i.e., SxS Pro); however, it can also be obtained using any other reliable contact discharge measurement method (e.g., current meters, Pressure Operated Electronic Meter (POEM), dilution gauging). Q S , α i = 1 can be found using appropriate surface velocimetry software (e.g., Fudaa-LSPIV or Hydro-STIV) by computing discharge at the cross section with an initial alpha value of 1 (Figure 1).
This method offers several advantages as it directly measures surface velocities, eliminating the need for extrapolation from in situ velocity measurements (e.g., from ADCPs), which can have significant uncertainties near the surface due to their blanking distances. By applying this approach repeatedly across various discharges (or stage levels), it allows for the construction of a site-specific stage–alpha rating curve (see Section 3), enabling α to be interpolated between and extrapolated beyond the range of reference measurements. This enables a more accurate estimation of α for flood flow gauging, where in situ measurements are not possible. This approach can also be applied at sites where surface velocities have been obtained from SVR rather than surface image velocimetry.
A disadvantage of this method is that it only provides a single average alpha value (i.e., site alpha) for a cross section, without any information on spatial variability in alpha across the channel, let alone longitudinally in the streamwise direction. However, this ‘disadvantage’ does make the method practical and easy to use. If the reference discharge can be partitioned, it is also possible to use this method to calculate α for different parts of the channel (see Section 5), which may be useful if there is flood plain flow where α varies significantly from the main channel.
Finally, the accuracy of this method is also dependent on the accuracy of the reference discharge measurement Q R e f . If accurate surface velocities are measured, then it may also be possible to exploit this information to improve the accuracy of Q R e f . For example, if an ADCP is being used for the reference discharge measurement, then the surface velocities that are directly measured can be used for extrapolation of the ADCP data to the water’s surface. This is easier to implement if the ADCP measurements were conducted in sections (i.e., SxS Pro), with surface velocities sampled at the same spatial locations as each of the ADCP velocity profiles.

2.3. Site Alpha from Extrapolated Velocity Profiles

Site-averaged alpha can also be estimated from ADCP or current meter velocity profiles [33,39]. For ADCP data, this is easily achieved by velocity profile extrapolation in the software QRev, with data displayed as normalised elevation (i.e., z / H ) on the y axis and normalised velocity (i.e., u / U ) on the x axis (Figure 2). User judgement is then needed to choose an extrapolation to the bed and to the surface that best fits the data (for example, a power law). The value of normalised velocity where the extrapolation intersects the surface (i.e., green crosses in Figure 2) is then used to calculate alpha. Site-averaged alpha is obtained as α = 1 Normalized   velocity   at   surface = U u s [39]. In QRev, the ‘subsection’ can also be set to only use data from the central part of the channel. In QRevInt (i.e., the international version of QRev), it is also possible to compute discharge-weighted average velocity profiles [43], providing a better alternative than using ‘subsections’.
While this method proves convenient and practical for field hydrologists, it does come with the drawback of uncertainties when extrapolating to the water’s surface. Considerable velocity disparities may arise between the measured ADCP data and the actual water surface due to factors such as wind or secondary currents, as well as the suppression of eddies/mixing by the water surface, which could make the extrapolation subjective. In QRevInt, the average velocity used for normalisation does not currently include extrapolated areas and thus is not exactly equal to U . This can introduce uncertainties into the estimates of α, notably when extrapolation areas are large. Future versions of QRevInt are expected to show α directly.
For practicality, this method combines all ADCP data into one velocity profile. This enables this method to be applied even when data are collected from a moving-boat ADCP gauging, since turbulent instantaneous velocities are combined into a time- and space-averaged (i.e., cross-section-averaged) velocity profile. If ADCP data are collected in sections, then it is also possible to generate individual velocity profiles and alpha coefficients for each section. This will better represent the variability in alpha across the cross section for the measured flow but may not improve accuracy outside of these flow conditions, since local alpha values will vary with local hydraulic conditions.

2.4. Alpha from Log Law Profiles—Extending from Bed to Surface

2.4.1. Alpha from Log Law Profiles—Theory and Derivations

Accurate estimates of α values are also crucial for sites where calibration data are unavailable or during extreme conditions, such as floods, when other measurements are not practical or viable due to safety concerns. Any α estimates rely on inherent assumptions about the shape of velocity profiles. Following Smart and Biggs [37] and assuming no flow acceleration, secondary currents, or surface wind drag, it is possible to approximate a logarithmic velocity profile [44] extending from the riverbed to the water’s surface.
As shown by Le Coz et al. [6]; Welber et al. [4]; Fujita [40]; and Smart and Biggs [37], α can be estimated from the log law roughness length scale Z 0 as follows:
u u = 1 κ   l n z Z 0 u = 0   at   z = Z 0   (roughness scale)
u s = u κ   l n H Z 0   mean   surface   velocity   u s   at   z = H
U = 1 H Z 0 z = Z 0 z = H u κ l n z Z 0 d z     depth   average   Equation   ( 5 )   from   z = Z 0   to   z = H
U = u κ H H Z 0 l n H Z 0 1   evaluate   Equation   (7)
α = U u s = H H Z 0 1 l n H Z 0   Equation   (8) / Equation   (6)
with time-averaged streamwise velocity u at an elevation z above the log profile zero plane, depth-averaged velocity U , friction velocity   u , Von Kármán constant κ (Von Kármán constant is typically taken as ~0.4; however, debate is ongoing as to its exact value, with recent research indicating a value of ~0.405 [45]), log law roughness scale Z 0 , and flow depth H above the log law origin.
While theoretically valid, Equation (9) is not practical to use, since Z 0 cannot be reliably estimated ( Z 0 incorporates both the bed roughness and the overlying flow conditions), but is typically obtained by log law fits to measured velocity profiles. For low relative roughness where H Z 0 and assuming u = g H S (i.e., uniform, turbulent 2D open-channel flow), Equation (9) can be improved to remove Z 0 [37,42]:
U u s = H H Z 0 u κ u s   substitute   in   1 l n H Z 0 = u κ u s   from   Equation   (6)
U u s = 1 u κ u s   for   cases   where   H Z 0
α = U u s = 1 g H S κ u s   assuming   u = g H S   substitute   into   Equation   (11)
where g is gravitational acceleration, S is the energy slope (assumed to be parallel to the free-surface slope and parallel to the bed slope for steady uniform flows) with S = sin θ s , where θ s is water surface angle.
Typically H Z 0 ; however, for shallower flows with high relative roughness, an expression can also be found for Z 0 [42]:
u s κ u = l n H Z 0   rearrange   Equation   (6)
e u s κ u = H Z 0   rearrange   Equation   (13)
Z 0 = H e u s κ u   rearrange   Equation   (14)
This expression for Z 0 can then be used to improve Equation (12) and estimate α for shallower flows with high relative roughness [42]:
U u s = H H H e u s κ u u κ u s   substitute   Equation   (14)   into   Equation   (10)
U u s = 1 1 e u s κ u u κ u s   simplify   Equation   (16)
α = U u s = 1 1 e u s κ g H S g H S κ u s   assuming   u = g H S   substitute   into   Equation   (17)
If a log law profile is appropriate, Equation (18) provides a practical way to estimate α , since H , u s and S can all be measured directly.
An advantage of Equation (18) is that all of the input parameters can be obtained from remote sensing data, enabling estimation of alpha for channels and flows where contact measurements are not possible. For example, u s is obtained directly from measured surface velocities (see Section 2.4.2 below) and S can be estimated from surveys of the channel waters edge (or existing topographic maps). Depth is the most challenging parameter to remotely sense; however, there are a wide range of possible methods [34], such as through water imagery corrected for surface refraction [46]; turbulence metrics [10,47,48]; colour (i.e., spectral attenuation and scattering of light with depth) [49,50,51]; surface wave analysis [49,52]; Ground Penetrating Radar (GPR) [53,54]; and bathymetric LiDAR [49,55,56]. Although these methods are promising, they are not yet routinely used for operational hydrometry. Some of these methods are also not feasible for highly turbid flood waters (i.e., through water imagery, bathymetry from colour, and bathymetric LiDAR). This is an important limitation if bathymetry and surface velocities need to be measured concurrently (i.e., flood discharge gauging at unstable cross sections where geomorphic change is occurring).
A downside of Equation (18) is that it assumes that a logarithmic profile adequately approximates the velocity distribution from the bed to the water surface. However, this can deviate from reality, particularly as relative roughness increases, and further work on compound velocity profiles is needed.

2.4.2. Alpha from Log Law Profiles—Practical Implementation

To practically estimate site-averaged α from log law velocity profiles using Equation (12) or Equation (18), site-averaged parameters are needed [42]. The cross-sectional mean depth H is found as:
H = A b
with cross-sectional area A and cross-sectional width b (i.e., water surface width).
Next, a cross-section-averaged surface velocity is required. However, it is essential to exercise caution when estimating u s for an entire cross section as opposed to a single vertical u s , n . Calculating the ‘average’ surface velocity using software such as Hydro-STIV involves computing the arithmetic mean of the surface velocity sections (i.e., 1 N n = 1 N u s , n ), which assigns equal weight to each surface velocity measurement. This approach is problematic as it does not consider variations in the channel’s cross-sectional area (for example, higher flow in the centre of the channel where it is deeper and faster) and treats near-bank surface velocities with the same significance. To address this issue, it is advisable to calculate an area-weighted cross-section-averaged surface velocity:
u s = 1 A n = 1 N u s , n d A n
where u s , n is the time-averaged surface velocity in section n , and d A n is the area of section n .
This equation can then be simplified further for practical implementation, since the summation of area-weighted surface velocity n = 1 N u s , n d A n is simply the discharge with an initial alpha value of α i = 1 , which is Q S , α i = 1 :
Q S , α i = 1 = n = 1 N 1 u s , n d A n
Using software such as Hydro-STIV of Fudaa-LSPIV and setting α i = 1 it is straight forward to evaluate Q S , α i = 1 (see Section 2.2 and Figure 1). Thus, u s becomes:
u s = Q S , α i = 1 A
For channels where H Z 0 , Equation (22) can be substituted into Equation (12) to obtain:
α = 1 A g H S κ Q S , α i = 1
For channels with shallower flows, a log law profile, and higher relative roughness, Equation (22) can be substituted into Equation (18) to obtain:
α = 1 1 e Q S , α i = 1 κ A g H S A g H S κ Q S , α i = 1
These equations provide a practical way to estimate α from only remote sensing data and existing surface image velocimetry software packages.
Finally, an alternative implementation method is to compute ‘local’ α values from Equation (18) at multiple verticals across the cross section (with corresponding local u s and H values). If each local alpha value corresponds to a ‘section’ of the channel, then site-averaged alpha can be found as the discharge weighted average of the ‘local’ α values for all the sections across the channel.

2.4.3. Alpha from Log Law Profiles—Limitations

This approach relies on the approximation that a logarithmic velocity profile extends from the riverbed to the water surface. In reality, a linear region is typically found near the riverbed for rough beds [57,58,59], and the turbulent outer region typically presents a velocity dip near the surface that can be represented by Coles wake law and Coles wake parameter [60,61,62]. Progress has been made on the inclusion of a linear near-bed region for estimating α for shallow flows [59]; however, this work relies on knowledge of Z 0 , making it impractical for implementation to estimate alpha from data for which Z 0 is not known. At very high relative roughness, there may be no log region present, and the velocity profile may be better described by a linear region from the bed to the water’s surface; in this case, α = 0.5 [59]. Further work on compound profiles and how to practically estimate α is needed. Significant limitations also exist around the assumption of uniform, turbulent 2D open-channel flow (i.e., u = g H S ), since this is not valid for sites where flow is 3D [63].

2.5. Alpha from Power Law Profiles—Extending from Bed to Surface

2.5.1. Alpha from Power Law Profiles—Theory and Derivations

Velocity profiles can also be parameterised by a power law, with α estimated from the power law exponent [4,37,40,64]. Similar to the use of logarithmic velocity profiles in Section 2.4, the velocity profile is approximated as extending from the bed to the surface. The derivation, following Smart and Biggs [37] is as follows:
u u = a z d M   with roughness scale   d   and power law exponent   M
u s = a u H d M u s   is   time - averaged   surface   velocity   at   z = H
U = a u M + 1 H d M   average   Equation   ( 26 )   from   z = 0   to   H  
α = U u s = 1 M + 1   Equation   (27)/Equation   (26)
Caution should be applied when using Equation (28) because power laws are also routinely expressed in the following form:
u u = a z d 1 m   where   1 m   is   the   power   law   exponent
Using the form of the power law from Equation (29) yields the following α equation:
α = 1 M + 1 = 1 1 m + 1 = m m + 1
Power law exponents expressed as 1 m are used by Welber et al. [4], Johnson and Cowen [64], Fujita [40], and others. Equivalent results are obtained when using M or 1 m with the appropriate form of Equation (30). The power law ‘exponent’ in QRev is provided as M , which corresponds to the equation α = 1 M + 1 .

2.5.2. Alpha from Power Law Profiles—Practical Implementation

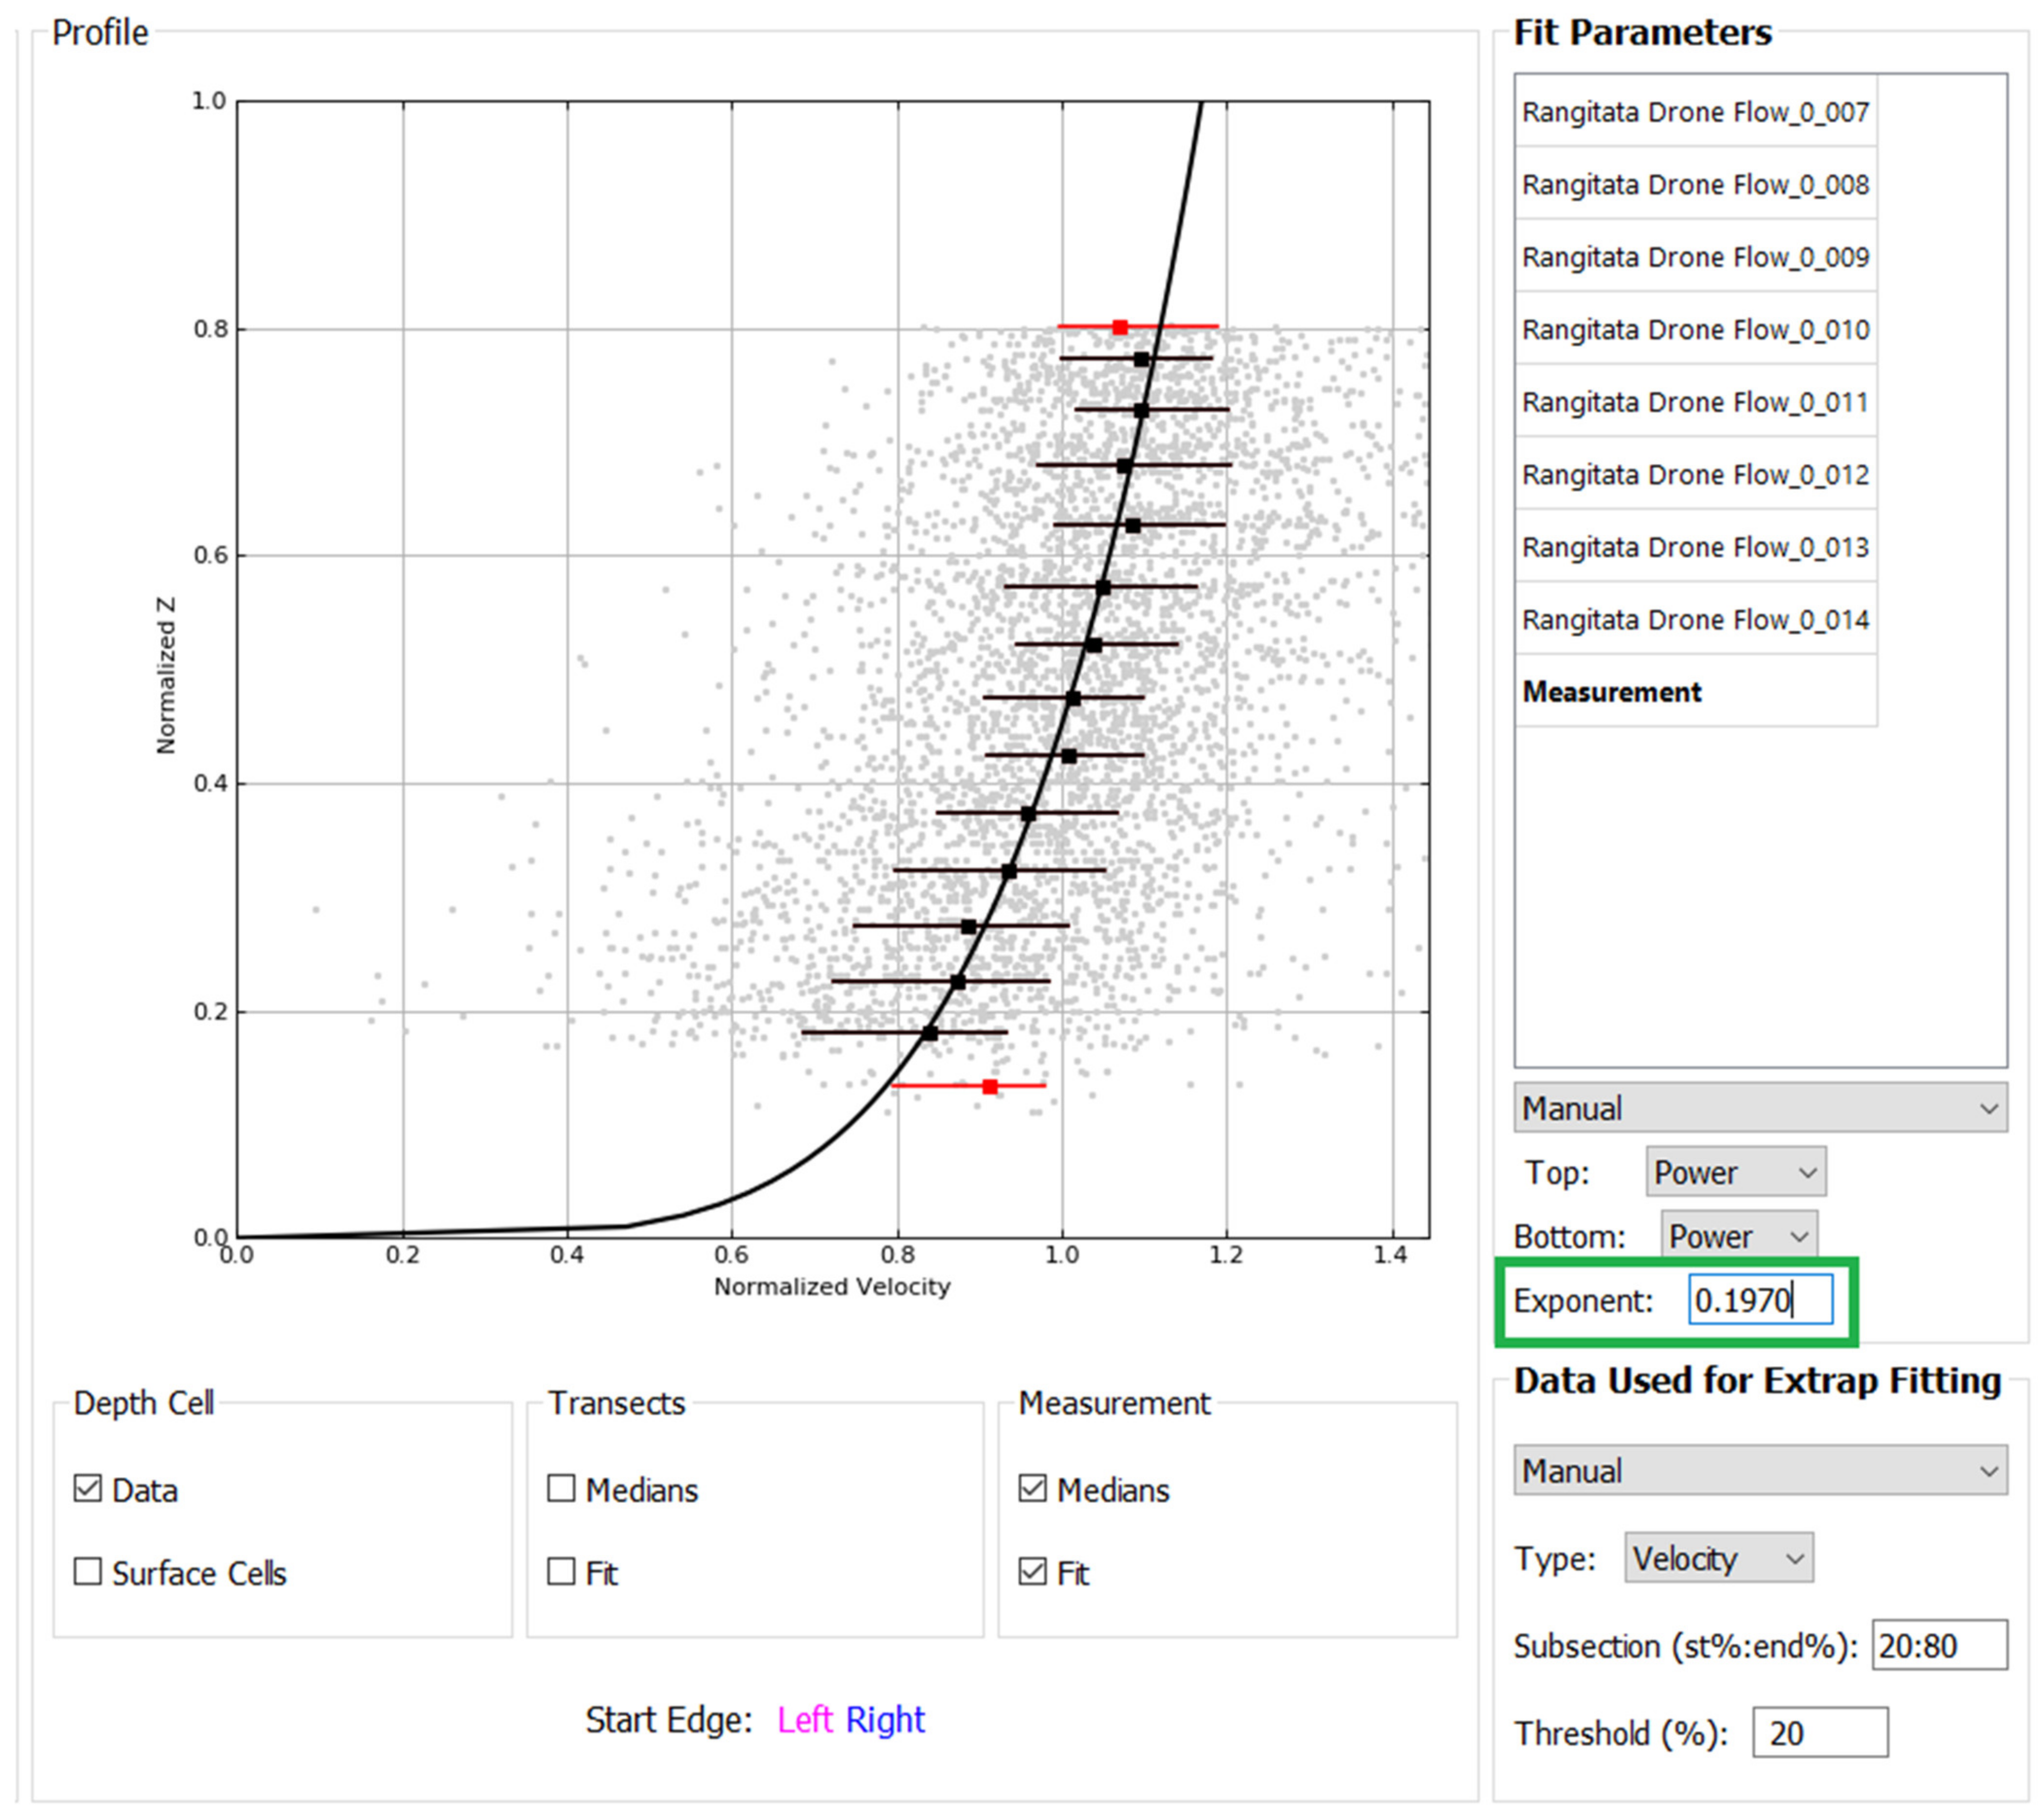
Power law exponents can be easily found in QRev (e.g., Biggs et al. [42]), similar to the method used in Section 2.3. First, the ADCP measurement is loaded in QRev, then navigate to ‘Extrapolation’ then ‘Velocity’ and specify the subsection as 20% to 80% (Figure 3), focusing on data from the central part of the channel while avoiding the near-bank regions. The data will be presented with normalized elevation ( z / H ) on the y-axis and normalized velocity ( u / U ) on the x-axis. Next, opt for the ‘power’ extrapolation for both the ‘top’ and ‘bottom’ sections of the ADCP data. The power law is then automatically (or manually) fitted to the data. This provides the power law exponent M (Figure 3), which can be used to estimate alpha using the equation α = 1 M + 1 . In QRevInt (i.e., the international version of QRev) discharge-weighted average velocity profiles can be used [43], providing a better alternative than using ‘subsections’.

2.5.3. Alpha from Power Law Profiles—Limitations

While this method proves convenient and valuable at most gauging sites, it shares similar limitations to the use of logarithmic velocity profiles (see Section 2.4). This is because it assumes that the vertical distribution of velocities adheres to a well-defined equation from the riverbed to the water surface. This can result in poor representation of near-bed and near-surface regions (i.e., linear near-bed region and surface velocity dip).
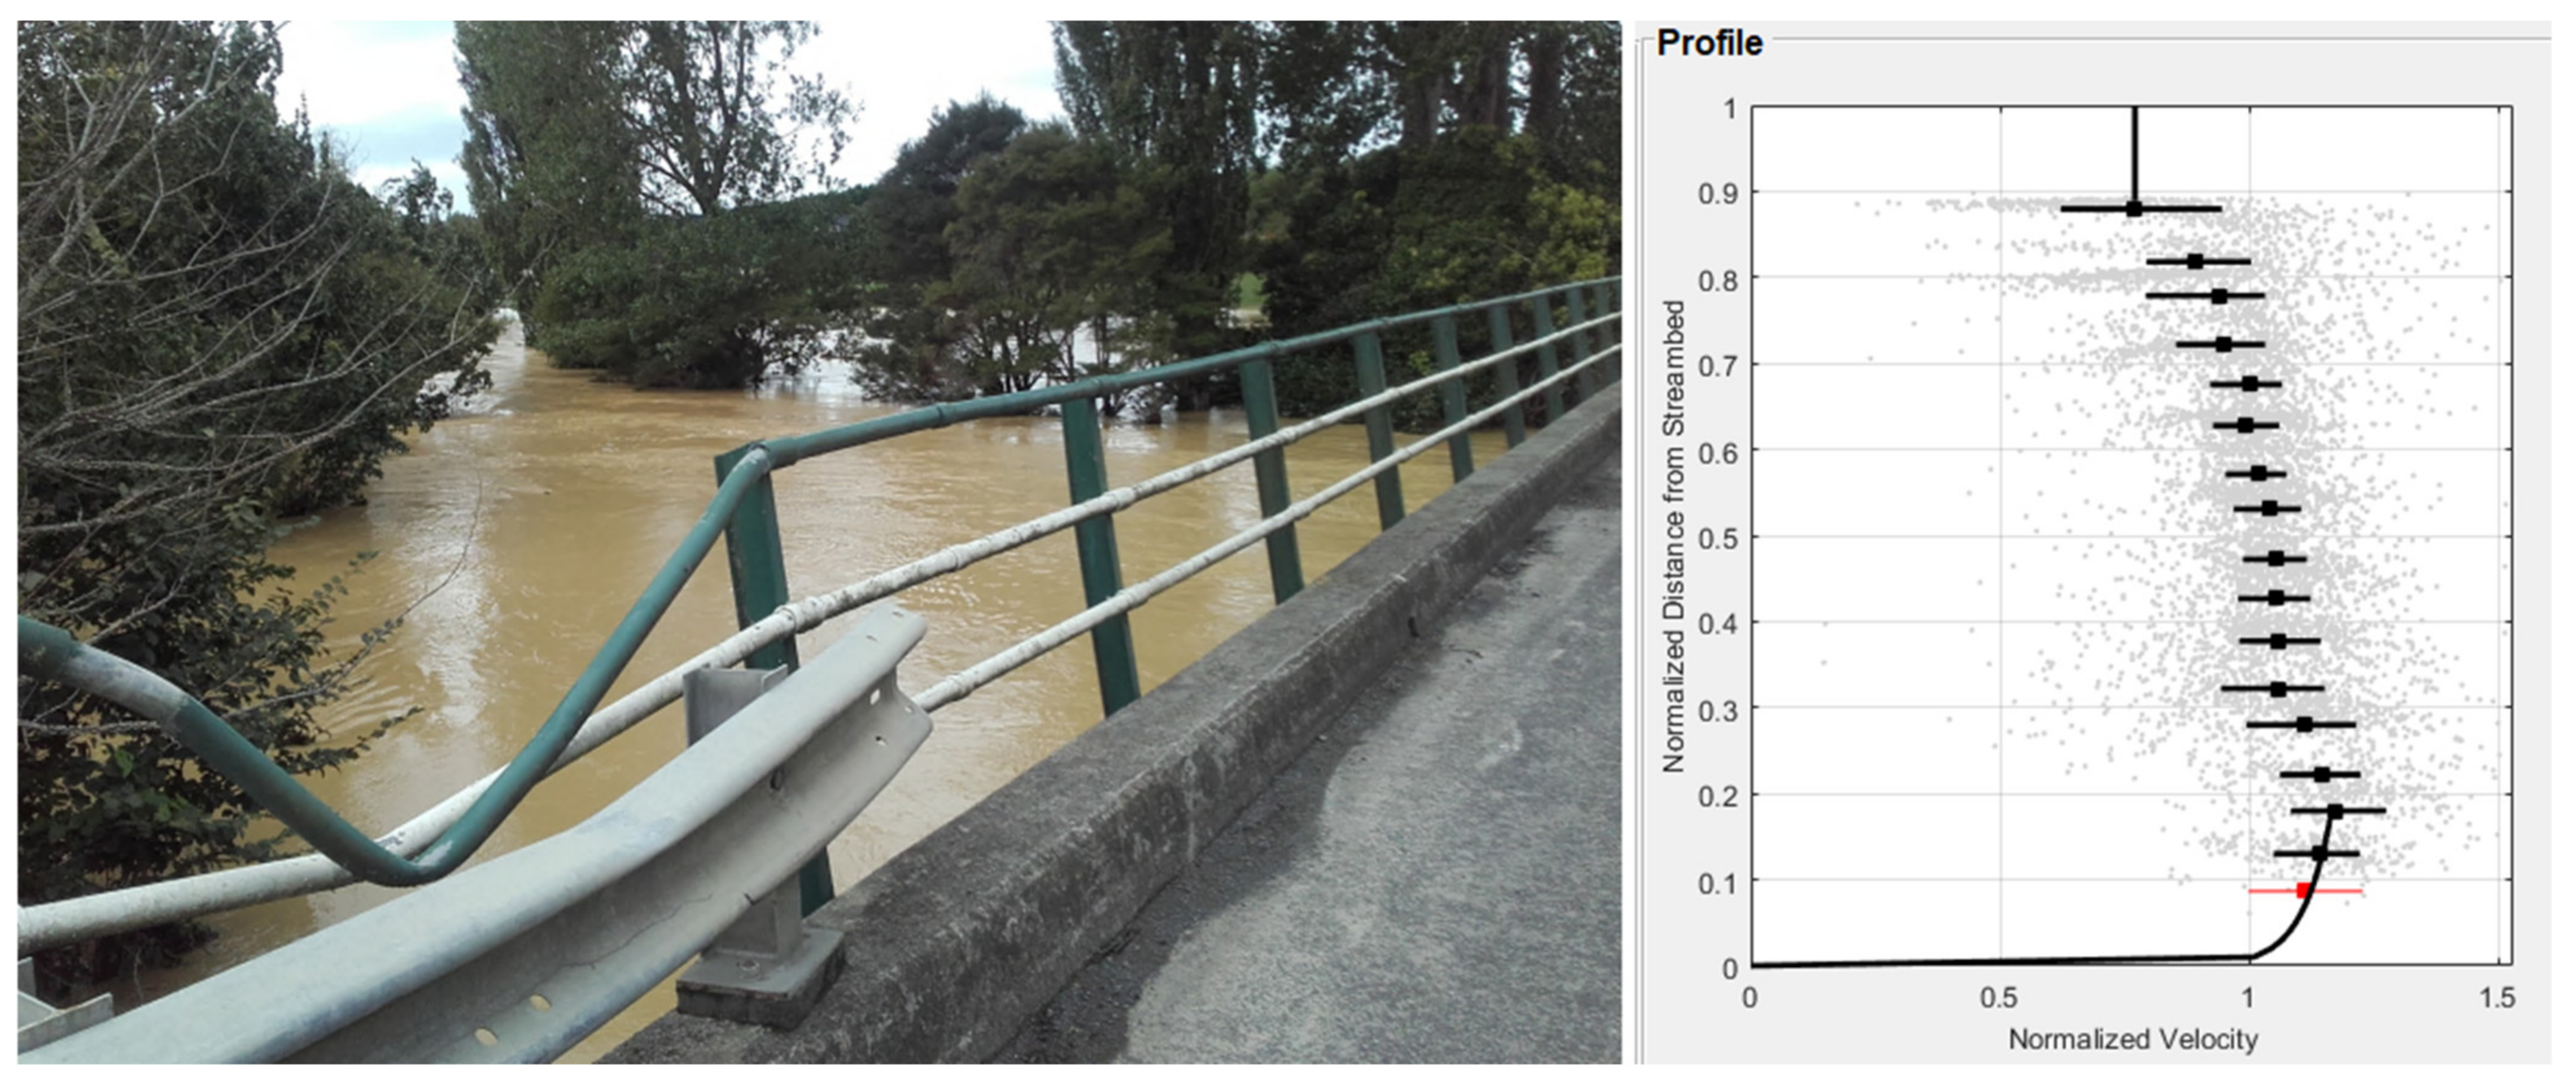
Large errors can also be introduced if power law or log law profiles are used at sites where flow is highly non-uniform and/or three-dimensional, for example, sites with surface wind, bridge piers, wakes, accelerating flows, secondary currents, bars, debris, and other sources of flow resistance in the water column, such as aquatic vegetation [41,65] or submerged riparian vegetation (Figure 4). For sites with these characteristics, the use of log law or power law velocity profiles is inappropriate.

2.6. Alpha Estimation from Site Characteristics

Alpha can also be estimated from site characteristics based on visual assessment and comparison with similar sites. While this method is subjective, it is likely to provide greater accuracy than relying on a default value of α = 0.857 (Section 2.1). There is some variability in the guidance provided for estimating α, with the opinions of selected experts provided below:
Turnipseed and Sauer [38] suggest choosing α values ranging between 0.84 and 0.90. Lower values are recommended for irregular rough streambeds, while higher values are suitable for smoother beds, such as concrete-lined channels.
Hauet et al. [39] conducted an analysis of data from 3611 gaugings across 176 sites and observed that α generally increases with depth. However, they did not find a clear relationship between α and bed roughness or relative roughness. They provided the following general recommendations:
  • Natural rivers: ‘For water depth less than 2 m: consider using α = 0.8 with an uncertainty of about ±15% at 90% confidence level. For greater water depth, consider using α = 0.9 with an uncertainty of about ±15% at 90% confidence level.’
  • Artificial concrete channels: ‘Consider using α = 0.9 with an uncertainty of about ±15% at 90% confidence level.’
Le Coz et al. [66] and Fujita [40] recommend using a default α value of 0.85 for reasonably uniform flows. Alternatively, they suggest selecting α based on site roughness and an estimation of the likely power law exponent (Table 1).
Hauet et al. [39] and Welber et al. [4] investigated the feasibility of predicting α based on relative roughness, defined in terms of d50 and depth, but did not establish a clear relationship. However, Smart [67] identified a general relationship between α and relative roughness or relative depth, defined in terms of depth and d84, using the Hicks and Mason [68] dataset encompassing over 100 New Zealand rivers. While the data presented by Smart [67] exhibited significant variability, distinct trends emerged, which may be useful for estimating alpha in shallow rivers with rough beds (Table 2). The difference in results between Smart [67], Hauet et al. [39], and Welber et al. [4] may be explained by Smart [67], including slope, since U was normalised by u in his analysis.
Although these approaches are not perfect substitutes for gathering data directly at the gauging site for alpha calculation, they are likely to offer a better estimate of α than opting for the default value of α = 0.857 (Section 2.1). Finally, caution should be applied when estimating alpha from site characteristics and relative roughness, since river morphology and larger-scale bedforms can also influence relative roughness and alpha.

2.7. Alpha—Additional Methods

2.7.1. Alpha from Shape Factor

Another method for remotely estimating alpha was developed by Johnson and Cowen [64] based on the ‘shape factor’ H S F . This method assumes a power law velocity profile, then finds the power law exponent m [64,69] from the following:
m = 2 H S F 1
The shape factor is then found from:
H S F = 1 G C f / 2 1
where G is the ‘Clauser shape parameter’, and C f is the skin friction co-efficient [64,70]. The data from Johnson and Cowen [64] indicate that G = 5.73 can be used for gravel beds and G = 4.8 can be used for smoother beds.
Finally, the skin friction co-efficient can be obtained from:
C f = τ w 0.5 ρ u 2
where τ w is bed shear stress, ρ is water density, and u is the boundary layer freestream velocity, which is taken to be the surface velocity in open-channel flow u u s [64,71].
Bed shear stress can be estimated from turbulence dissipation [72], or from depth and slope, using the standard relationship τ w = ρ g H S f , where g is gravitational acceleration, H is flow depth, and S f is friction slope. As discussed in Section 2.4, there are a range of methods for remotely sensing depth; however, additional measurements of slope are required (similar to estimating alpha from log law profiles).
Following estimation of the power law exponent m using Equations (31)–(33), alpha can be obtained using Equation (30) from Section 2.5:
U u s = α = m m + 1
This method has promise; however, it does introduce additional parameters that need to be resolved, and additional experiments are needed to verify the value of G for a range of relative roughness values [64]. It is also unclear how relative roughness would be practically measured in the field (particularly from remote sensing data), with this information needed to select the appropriate value of G . It would also be prudent to determine whether G is consistent in field settings and verify that it can be reliably estimated. Finally, this method also suffers from the same limitations as the methods in Section 2.4 and Section 2.5, since a specific velocity profile shape is assumed, which may result in poor representation of the near-bed and near-surface regions.

2.7.2. Alpha from Surface Velocity Fluctuations

Theoretically, α can also be estimated from logarithmic velocity profiles and surface turbulence [37]. This method relies on published vertical profiles of streamwise turbulence σ u z , normalised by friction velocity u [73]. If σ u H is measured, then u can be estimated from the published profiles and used in Equation (17) to estimate α. However, when this approach was tested by Smart and Biggs [37] using the high-resolution laboratory data from Cameron et al. [74], it was found to have poor predictive performance. This was likely due to the variation in σ u H / u as relative roughness changed. Further investigation is needed to develop and validate this approach.

3. Stage to Alpha Rating Curves

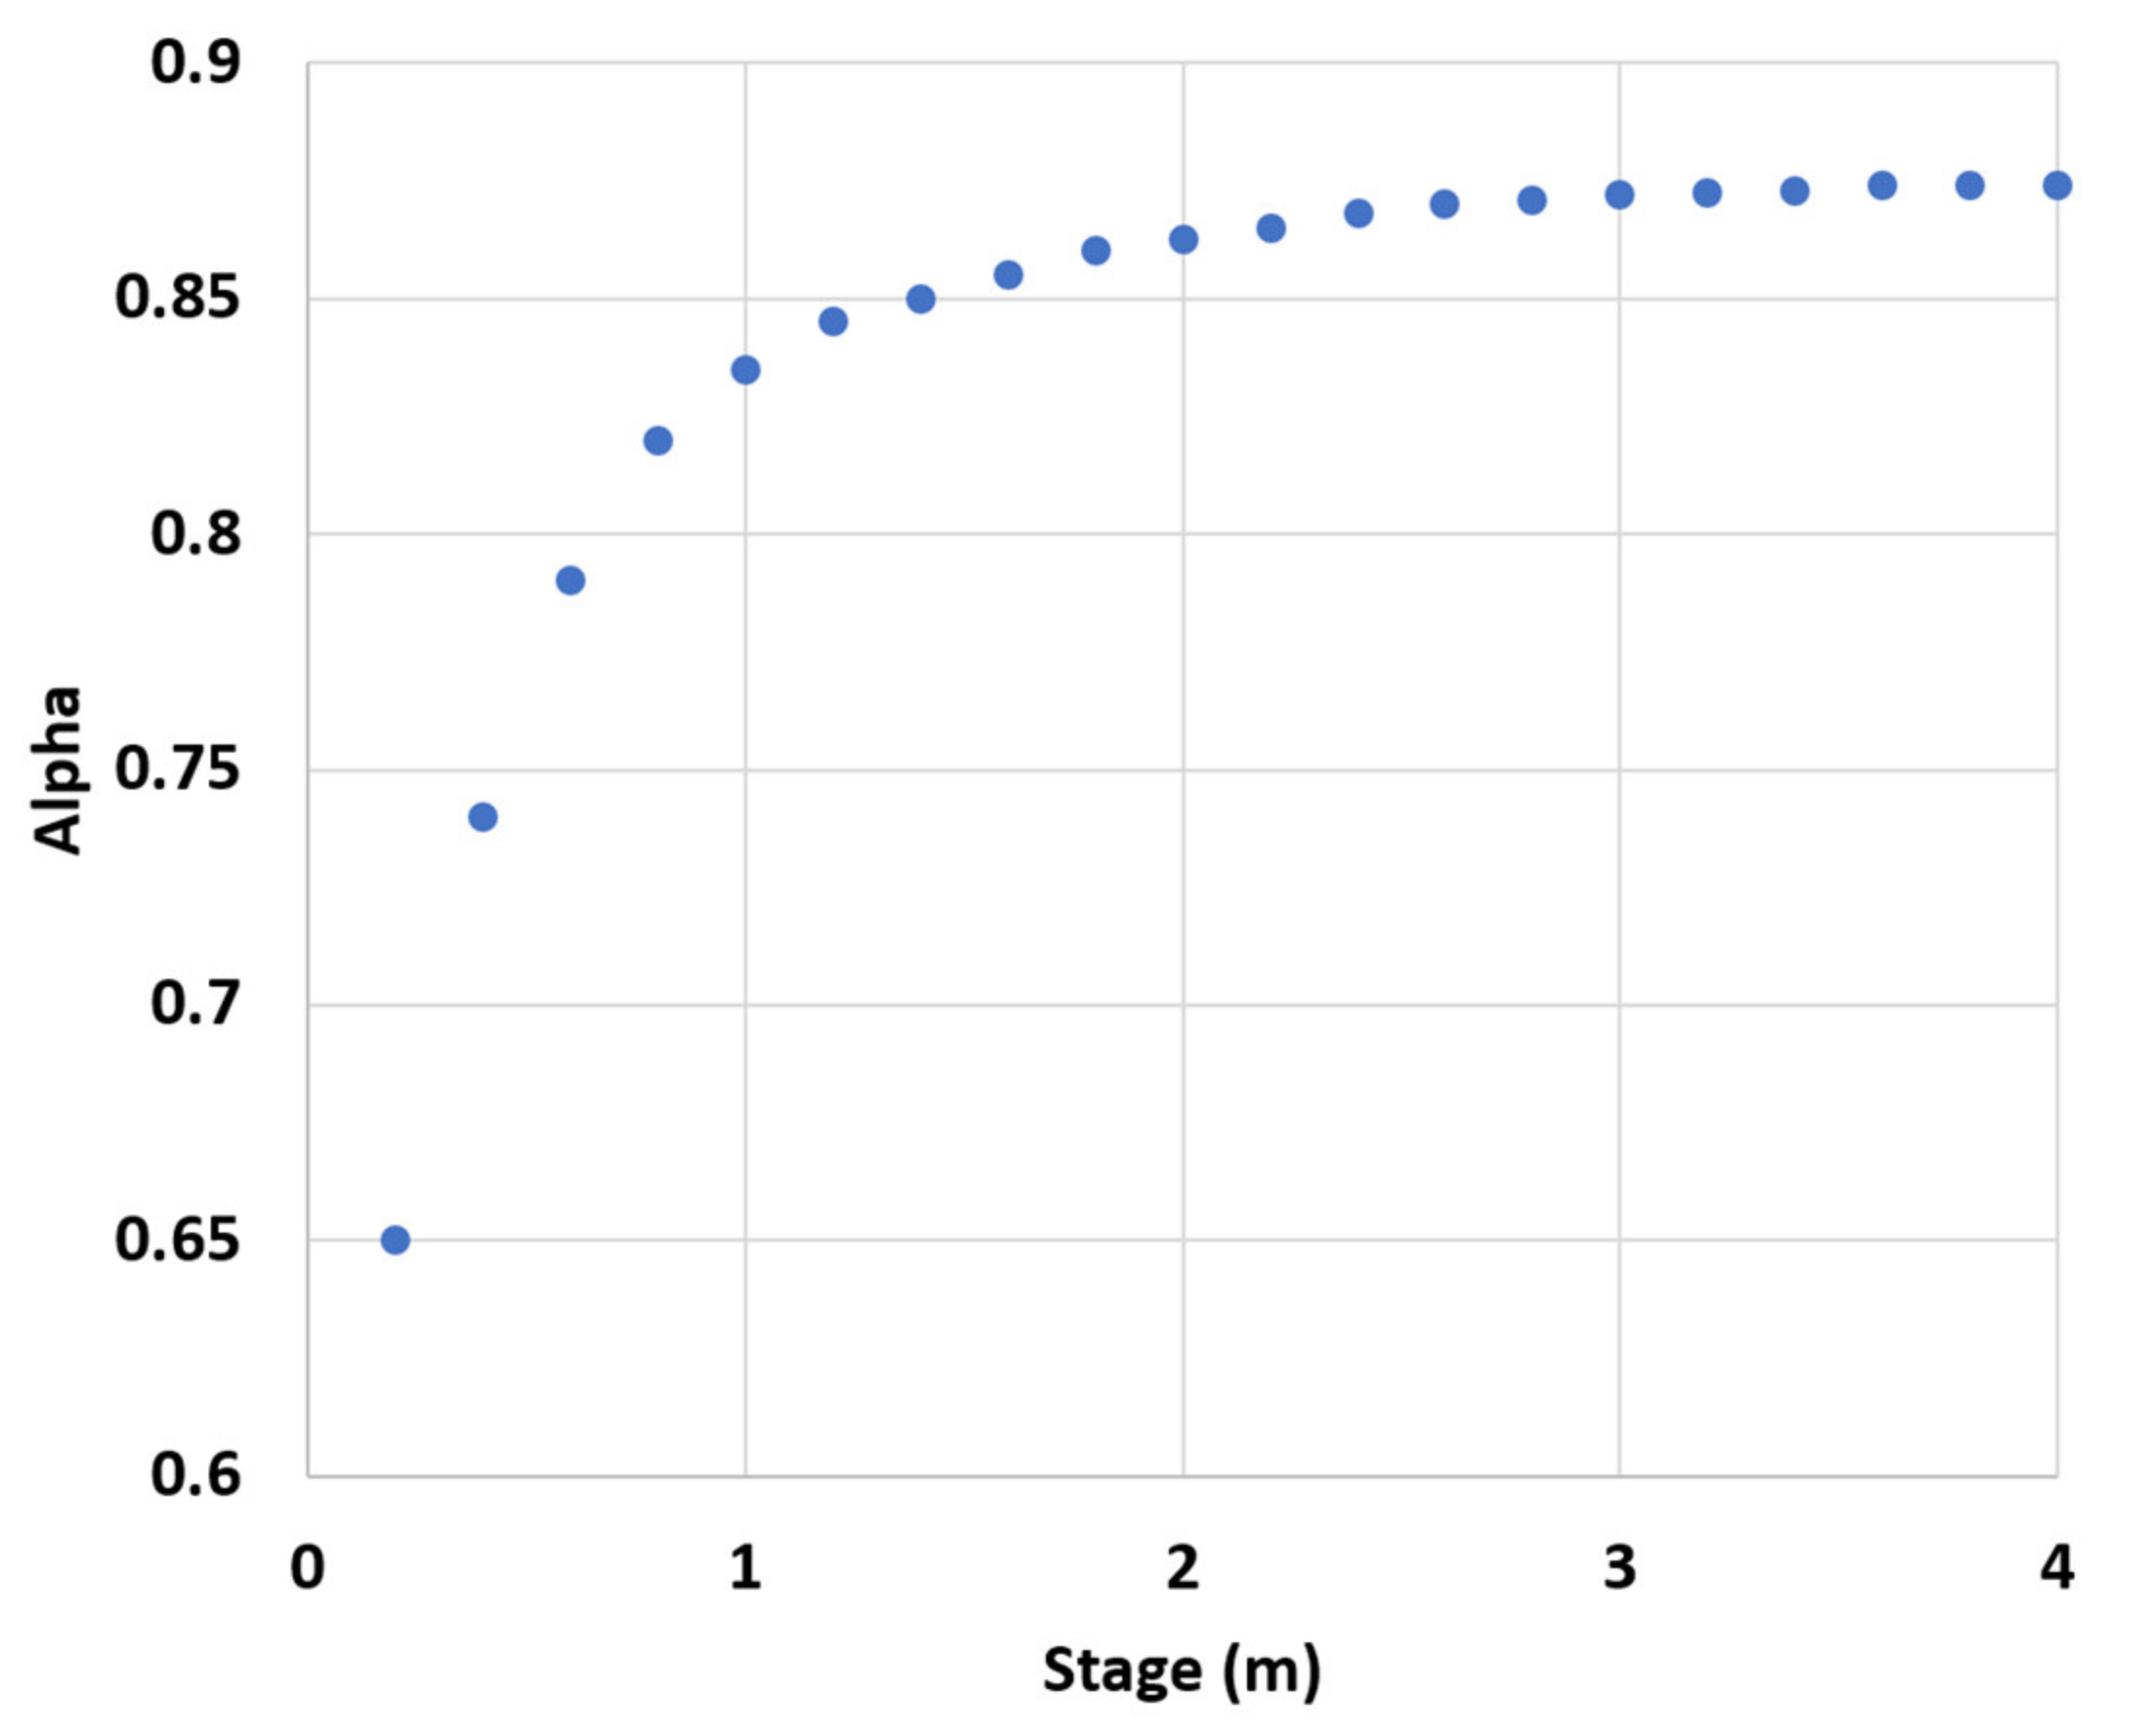
Alpha will change with stage (i.e., water level) if velocity profile shapes are changing. This will typically occur as the water depth, relative roughness, and surface velocities change (see Section 2.4, Section 2.5 and Section 2.6). Site α values can be recorded at multiple flows and plotted against stage (Figure 5) to generate a site-specific ‘stage-alpha rating curve’ (the first known use of stage–alpha rating curves was in early 1900s French hydrometry reports). An extrapolation of this curve can then be used to estimate site-specific α values for extreme flow conditions, including floods. Stage–alpha rating curves can also be used for interpolation to estimate alpha at water levels between those where measurements occurred.
Care must be taken when extrapolating stage–alpha rating curves if there are discontinuities in the hydraulic conditions in the extrapolated region, such as over-topping channel banks (e.g., floodplain flow) or instream obstacles increasing turbulence/friction (e.g., riparian vegetation that becomes submerged at higher water levels). When extrapolating an alpha rating and discontinuities in hydraulic conditions are present, it is prudent to use the divided channel method (see Section 5) and only use the extrapolated stage–alpha rating curve for the central part of the channel.

4. Site Alpha vs. Local Alpha

Applying a site-averaged alpha value is practical and effective. However, in reality alpha will vary in space across a cross section. The accuracy of site α relies on underestimates and overestimates of the discharge due to localised errors in α balancing out. This will occur when the site α values are calculated directly from a reference discharge (Section 2.2); however, if α is estimated from a single normalised velocity profile comprising combined measurements from a cross section (Section 2.3), then α is not discharge weighted. For rectangular cross sections, this should not introduce significant errors, as the depth (and relative roughness) will typically be consistent across a cross section. However, for channels with heterogenous cross sections (i.e., compound channels consisting of a deep part of the channel that conveys the most flow and broad shallower areas), the accuracy of site α from a single normalised velocity profile may decrease. To address these cases, individual α values can be calculated for each section across the cross section (see below), or a broader division of the channel can occur (see Section 5 on the ‘Divided channel method’).
For the ‘local alpha’ approach, a different α value is assigned to each surface velocimetry section. Typically, this involves using an ADCP to collect velocity profile data at various vertical positions across a river channel (e.g., by using the software SxS Pro). These velocity profiles are then used to calculate local α values that correspond to each surface velocimetry section. Subsequently, these local α values can be input into software applications such as Hydro-STIV or Fudaa-LSPIV at corresponding locations across the cross section to calculate discharge. This approach yields excellent correspondence between the reference discharge (derived from ADCP data) and the discharge derived from surface velocimetry measurements, since both the reference discharge and local α are derived from the same ADCP data. However, outside of this reference gauging, the accuracy of local alpha values and thus discharge can rapidly deteriorate as the depth, relative roughness, and hydraulic conditions change.

5. Divided Channel Method

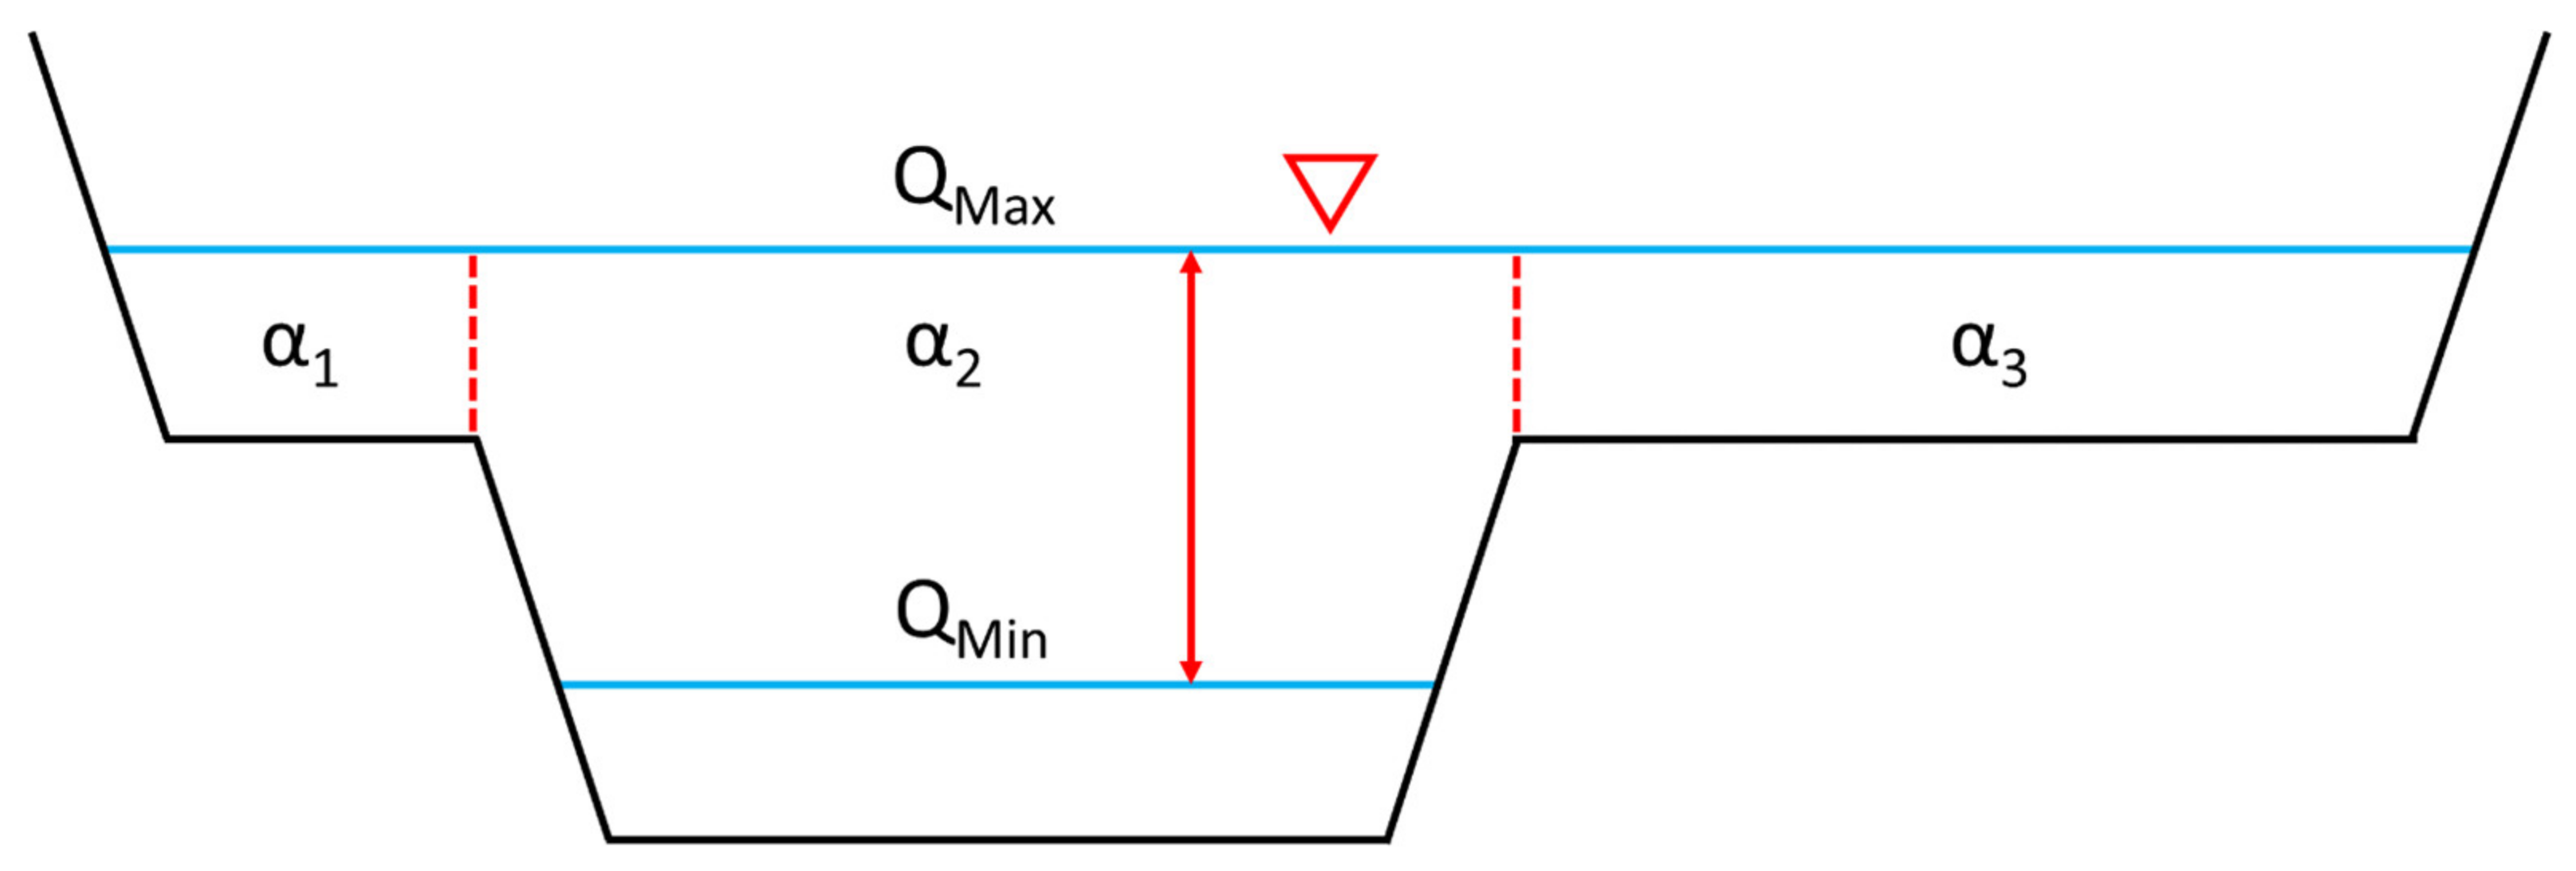
In certain scenarios, applying a single α value across the entire channel may not be suitable. This situation can arise during significant floods when flow overtops the main channel’s banks. In such cases, the α value employed for the central portion of the channel may not be appropriate for the shallow and comparatively rough peripheral regions, such as floodplains. For flood flows in compound channels (see Figure 6), the ‘divided channel method’ can be applied, which involves using separate α values for the main channel and the overbank regions. Alpha values in the main channel will typically be known from previous measurements (i.e., Section 2.2 and Section 2.3), or extrapolated (Section 3), whereas measurement data for estimating alpha in the overbank regions are unlikely to exist. Alpha in these regions may need to be estimated from an assumed velocity profile shape (Section 2.4 and Section 2.5) or from site characteristics (Section 2.6).
This approach strikes an effective balance by accommodating site geometry and flow variability through the use of 2–3 α coefficients. It is much more practical than the application of distinct α coefficients for each surface velocimetry section (see Section 4).

6. How to Select the Optimal Method for Estimating Alpha

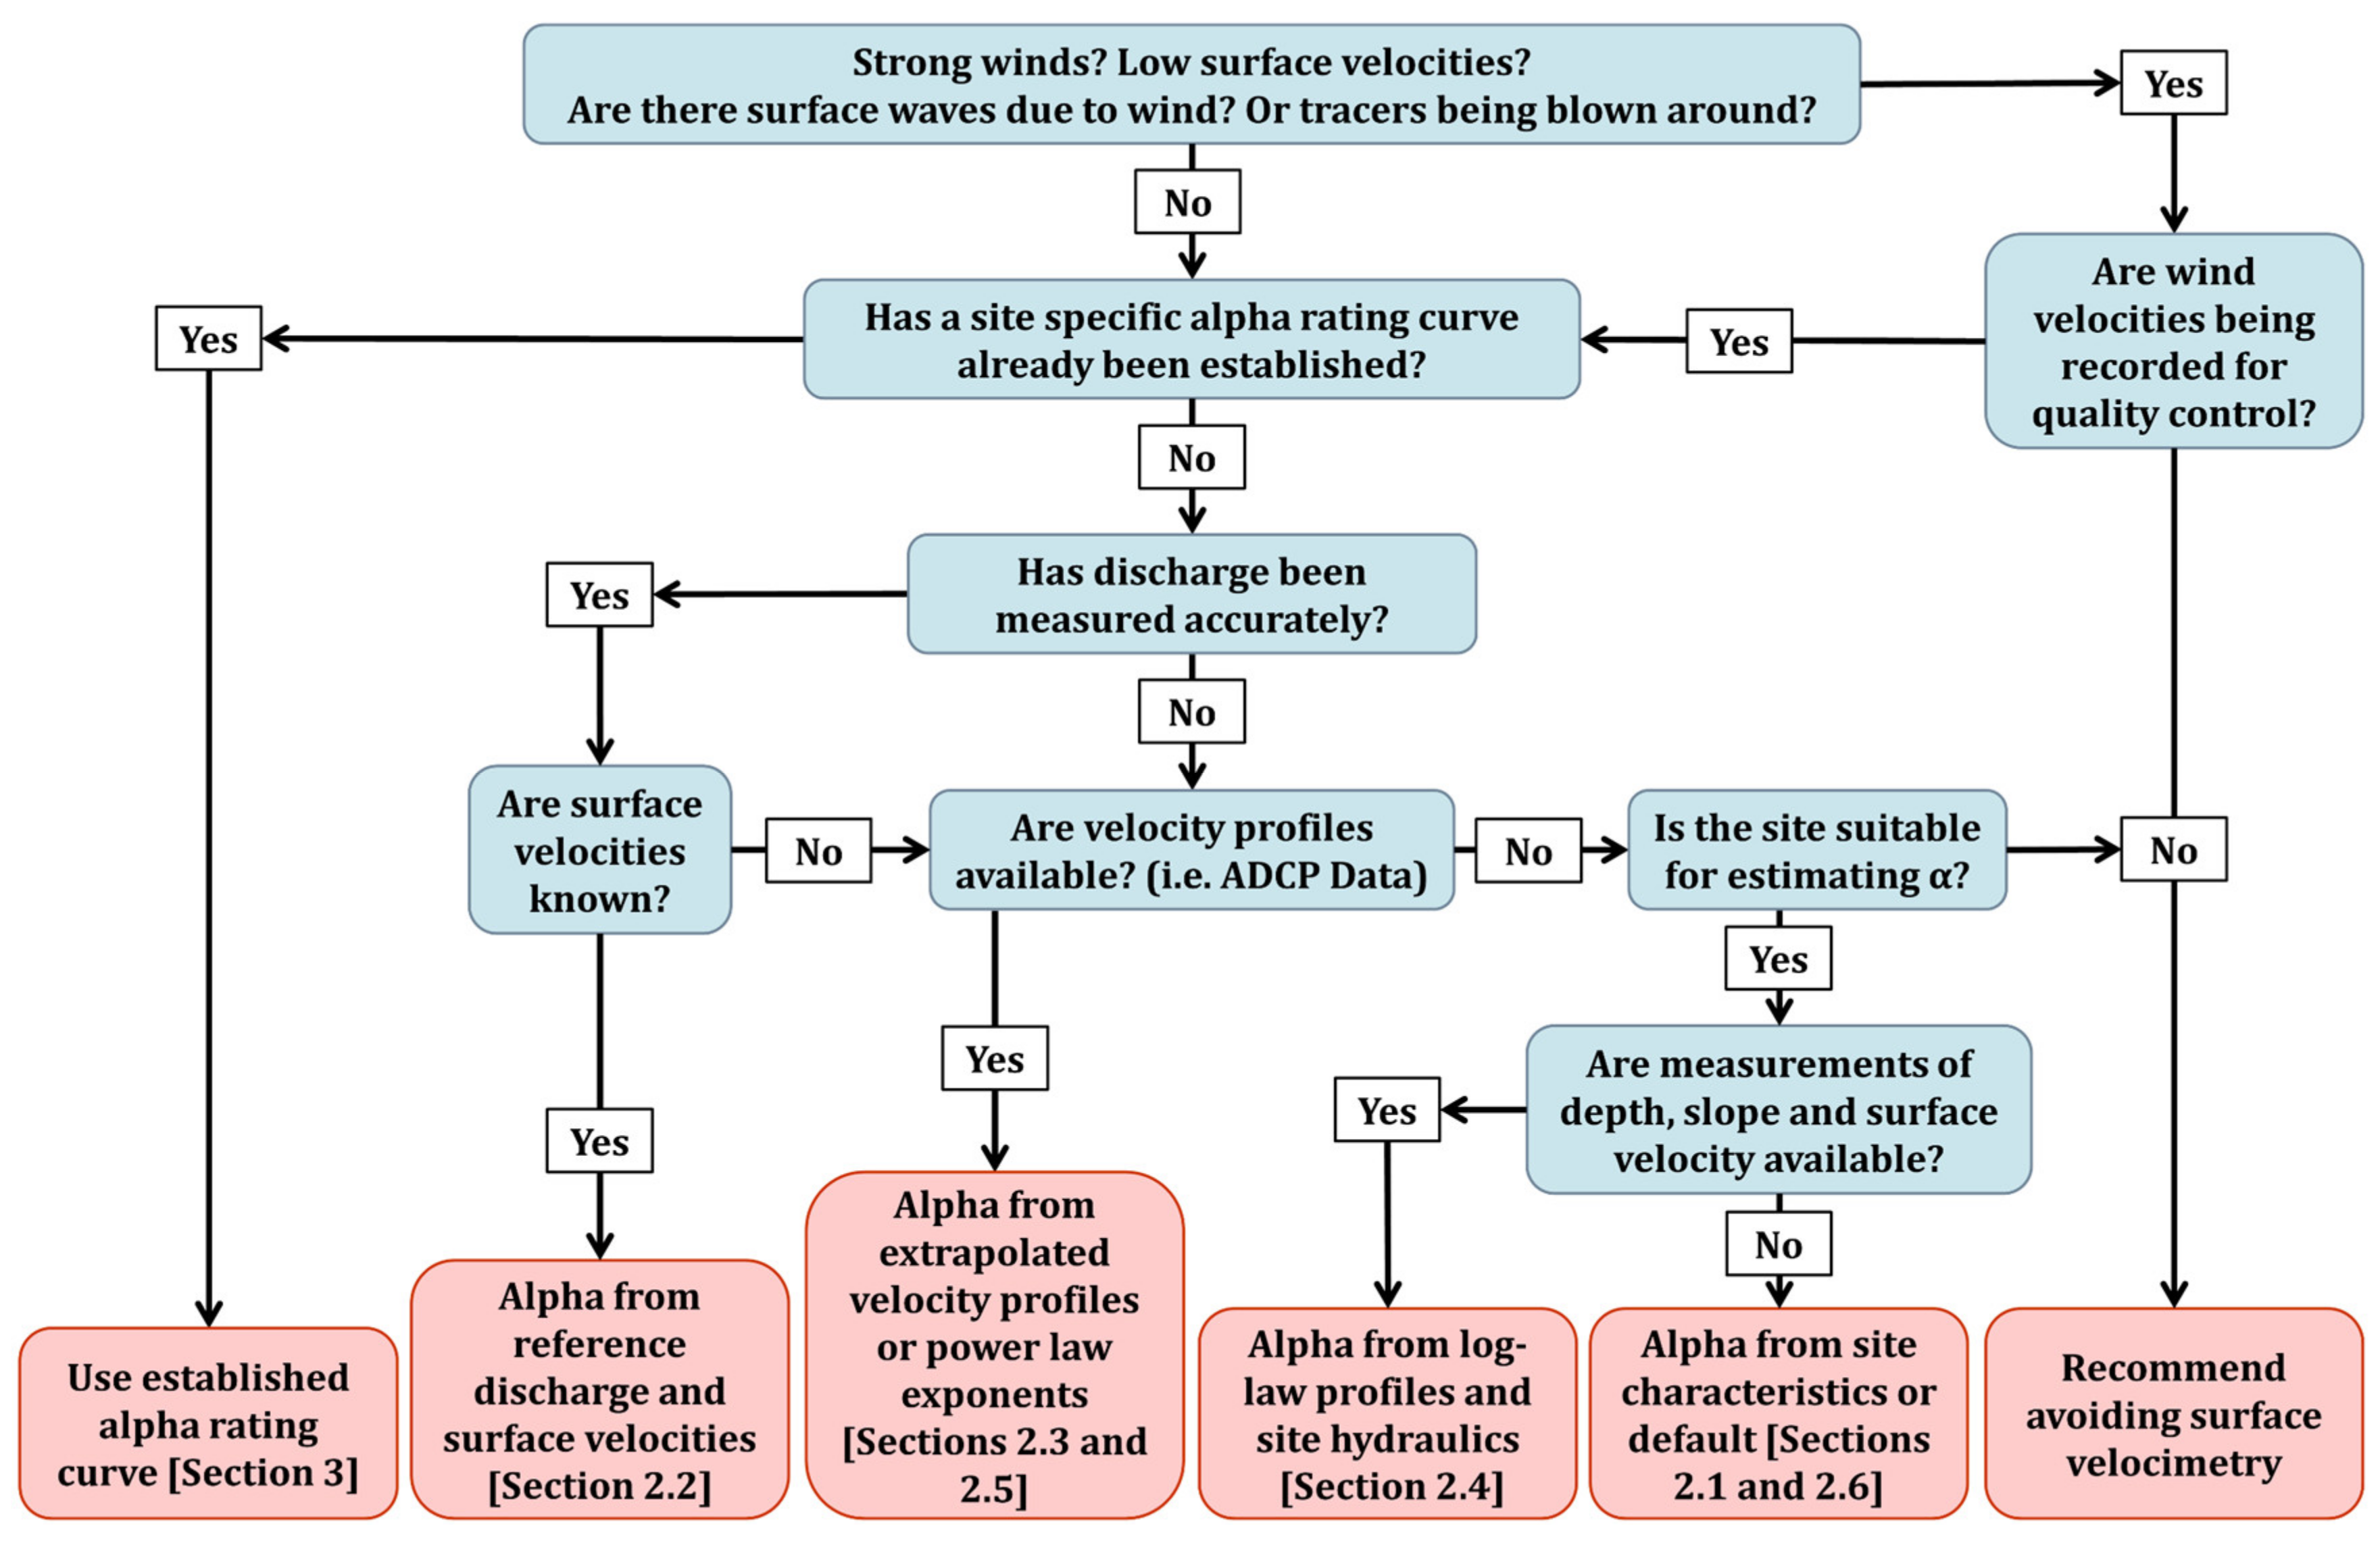
Selection of the optimal method for estimating α will depend on the channel characteristics and data availability. A workflow diagram for selecting the α estimation method is provided in Figure 7 [42]. The order of the workflow outputs from left to right shows the preference for the methods. Typically, ‘Alpha from extrapolated velocity profiles or power law exponents (Section 2.3 and Section 2.5)’ is preferred over ‘Alpha from log-law profiles and site hydraulics (Section 2.4)’, since the former incorporates direct measurements of velocity profiles (i.e., from ADCP data), whereas the latter relies on measurements of slope (which are often uncertain) and assumes a logarithmic profile extending from the riverbed to the surface.

7. Remaining Challenges and Future Directions

7.1. Surface Wind

Surface wind presents a significant challenge for surface velocimetry methods, as highlighted in the research conducted by Hauet et al. [39] and Peña-Haro et al. [75]. When wind blows upstream, it reduces surface velocities and increases α values. Conversely, when wind blows downstream, it increases surface velocities and decreases α values. Analysing the impact of wind on water surface velocity is a complex endeavour due to several influencing factors, including wind shear stress (from wind velocity profiles and turbulence), fetch, surface roughness (i.e., waves), the type of surface tracers used (such as wood shavings or surface features including boils and eddies), and the turbulent mixing characteristics of the channel itself. These factors and the feedback loop between wind, surface waves, surface roughness, and surface shear stress make it very challenging to address wind effects analytically [67].
Wind effects are more significant when surface velocities are low and less significant when surface velocities are high (e.g., fast-flowing and highly turbulent flood waters). This is because wind-disturbed surface water is more rapidly mixed throughout the water column when surface velocities and turbulence are higher. Furthermore, wind-induced velocity changes at the surface are relatively less importance when surface velocities are higher (i.e., wind-induced errors expressed as a percentage of surface velocity).
There is currently a lack of suitable high-resolution datasets for detailed analysis of the effect of wind on surface velocities and velocity profiles [62]. Synchronous measurements of velocity profiles, surface velocities, and wind profiles are needed to better understand the physics of this problem [62]. Until this has been achieved, care should be taken when performing surface velocimetry measurements in windy conditions (Figure 7). Typically, measurements should be avoided when surface velocities are low and winds are high, or reference wind measurements should be made to characterise potential effects on the flow measurements [42]. For STIV, some progress has been made on filtering (during suboptimal conditions) to remove surface textures that are not advected at the surface velocity [76]; however, this does not negate errors from wind-induced motion of tracer particles and alteration of surface velocities. Practical advice is also provided by Randall [33] that surface image velocimetry should be avoided in the presence of noticeable wind-related effects on the water surface, including wind-generated surface waves, ripples, or a discernible motion of tracer particles due to the wind.

7.2. Secondary Currents

Secondary currents can have a significant impact on α [64,77,78]; however, further work is needed to investigate these impacts, and how to separate the effects of secondary currents from air–water interactions (i.e., wind) at the surface. This work would help to define suitable locations on rivers for making surface velocimetry measurements for discharge. Since the accuracy of discharge estimates is highly dependent on the selection of an appropriate α value, there may be areas of rivers such as bends, downstream from bridge piers, or near aquatic vegetation [41], where flow is highly three-dimensional and α varies significantly in space and time (i.e., at different flows). At these locations, the application of surface velocimetry methods for discharge gauging may be inappropriate.
Suitable measurement sites for surface velocimetry are typically straight river reaches with consistent slope, consistent cross-sectional area (i.e., flow not accelerating/deceleration due to constrictions), high aspect ratio (i.e., width divided by depth), and no significant underwater obstructions (i.e., vegetation, bridge piers, and large boulders). However, there is little information available on the magnitude of errors that can occur if these conditions are not achieved. Detailed investigations of discharge accuracy from surface velocimetry methods as a function of site characteristics would be very useful for the research community.

7.3. Other Challenges

The development of compound velocity profiles that are both accurate and practical to implement for estimating α provides an ongoing challenge. The lack of direct measurements of surface velocities in high-resolution datasets such as that of Cameron et al. [74] exacerbates this problem. There is also a lack of high-resolution datasets covering supercritical flow conditions that include both velocity profile measurements and surface velocities.
The use of Direct Numerical Simulation (DNS) Open-Channel Flow (OCF) datasets to investigate velocity profiles and α is appealing; however, there is currently a lack of suitable datasets that cover a wide range of bed roughness and flow conditions. DNS OCF datasets currently also have major limitations at the water surface, where boundary conditions are imposed that ignore air–water interactions [62]. For accurate estimation of alpha, the accuracy of surface velocities and the near surface region is critical; unfortunately, this is lacking in current DNS OCF datasets.
Challenges to practical estimation of α also exist for logarithmic velocity profiles over rough beds, such as how best to define and include: bed level (or mean bed level); log law origin; and zero plane displacement.
Challenges also exist around the assumption of uniform, turbulent 2D open-channel flow in Section 2.4 (i.e., u = g H S ), since this is not valid for sites where flow is 3D [63]. There are also ongoing challenges with how to practically measure S and at what spatial scale these measurements should be made.
In operational hydrometry, hydrometric stations are commonly installed under bridges to protect them from flooding. Similarly, gauging is generally carried out from bridges, for ease of access and instrument deployment. These sites often have non-uniform geometry (i.e., a constriction to flow under the bridge) or have instream flow resistance and wakes from bridge piers. In these conditions, the assumption of uniform, turbulent 2D open-channel flow will not be valid, and power or log laws should not be used. Bridges can also become significant sources of flow resistance, with discontinuities occurring at high water levels if flow impacts the upper bridge structure, or debris dams occur. This causes a discontinuity in the stage–alpha relationship, making it very challenging to estimate and extrapolate alpha at peak flood discharges. The use of cableways and drones can help to overcome these issues; however, bridges remain a significant issue for the use of alpha and surface velocimetry for many operational hydrometric agencies.
Challenges also remain for assessing the uncertainty of estimates of alpha, based on the availability and uncertainty of input measurement data. These uncertainties in alpha will then propagate to uncertainties in discharge.
There are many other sources of uncertainty for discharge accuracy from surface velocimetry beyond α [19,36,79]. Notable examples are errors in imagery orthorectification and bathymetry errors. Bathymetry measurement/estimation for flood discharge gauging presents an ongoing challenge, and work is needed to investigate the magnitude of errors that are likely to occur if bathymetry is only measured before/after a flood event, but geomorphic change has occurred during the flood.

7.4. Future Directions

The following work could be undertaken to improve knowledge in this field of research:
  • Re-analysis of existing datasets (e.g., Welber et al. [4]; Hauet et al. [39]) with the inclusion of slope, which is a key driver of the shape of logarithmic velocity profiles (Section 2.4), and thus α.
  • Conduct a systematic high-resolution laboratory investigation into the effect of surface wind on velocity profiles and α [62].
  • Further investigate the turbulent outer region, secondary currents, compound velocity profiles, and how to practically estimate α using these compound profiles.
  • Conduct a detailed field investigation into the spatial heterogeneity of α; the characteristics that make a measurement site suitable for the estimation of α; and the errors that may occur if these characteristics are not present.
  • Develop methods to infer flow non-uniformity (e.g., acceleration/deceleration, convergence/divergence, secondary currents, etc.) from the surface velocity field.

8. Summary

Appropriate selection of α greatly influences the accuracy of discharge measurements obtained from surface velocities. In this paper we provide a range of methods for estimating α, depending on available field data. Ideally α will be derived from accurate reference discharge measurements and surface velocities (Section 2.2). Alpha values can be evaluated at multiple water levels to create ‘Stage to α rating curves’ (Section 3), enabling estimation of α at levels between measurement points, and also extrapolation to high flows, beyond those that can be measured with ADCPs and other contact equipment.
For sites without accurate reference discharge and surface velocity measurements, α can be estimated from: measured velocity profiles (Section 2.3); velocity profile theory using a log law (Section 2.4) or power law (Section 2.5); site characteristics (Section 2.6); or the default value of 0.857 (Section 2.1). Alpha coefficients can either be applied to: the entire cross section (i.e., ‘site α’); individual sections of a channel (i.e., ‘local α’) (Section 4); or parts of the channel with similar characteristics (i.e., the ‘divided channel method’) (Section 5). A workflow for determining the optimal method for estimating α from available data is provided in Section 6.
Challenges remain for the accurate estimation of α, such as the impacts of surface wind (Section 7.1), secondary currents (Section 7.2), and how to practically estimate α using more accurate compound velocity profiles (Section 7.3). Further work is needed to address these challenges and improve predictions of α (Section 7.4). More accurate estimates of α will then translate to more accurate estimates of discharge from surface velocities, with wide-ranging and important implications for water resources management, hydrology, flood management, and environmental monitoring.

Author Contributions

Conceptualization, H.B., G.S., M.D. (Martin Doyle) and J.A.; methodology, H.B., G.S. and M.D. (Martin Doyle); software, H.B. and N.E.; formal analysis, G.S., H.B. and N.E.; investigation, H.B., G.S., M.D. (Martin Doyle), N.E., J.A., M.R. and M.D. (Martin Detert); resources, H.B.; writing—original draft preparation, H.B., G.S., M.D. (Martin Doyle), N.E., J.A., M.R. and M.D. (Martin Detert); writing—review and editing, H.B., G.S., M.D. (Martin Doyle), M.D. (Martin Detert), N.E., J.A. and M.R.; visualization, H.B.; supervision, G.S., H.B. and J.A.; project administration, H.B.; funding acquisition, H.B. All authors have read and agreed to the published version of the manuscript.

Funding

This publication was funded by NIWA through the eFlows project FWWA2302 ‘Velocity Profiles’. The fundamental background work was funded by the Ministry of Business Innovation and Employment (MBIE) under Envirolink Advice Contract C01X2008 2115-TSDC176 and the ‘Drone Flow’ research programme C01X1812, the support of which is gratefully acknowledged.

Data Availability Statement

This is a review paper and data availability is not applicable.

Acknowledgments

The authors would like to thank Alex Hauet and Jérôme Le Coz for their insightful comments and suggestions that significantly improved an initial draft of the manuscript. The authors would also like to thank an anonymous reviewer who provided valuable comments and suggestions that significantly improved the manuscript. The authors would like to thank Mike Ede, Nicholas Holwerda, Michael McDonald, David Plew, Doug Booker, Richard Measures, Hamish Sutton, Alec Dempster, Hayden McDermott, Duncan Macpherson, Jo Bind, Brendon Smith, Andrew Starr, Farhad Akbarpour, Stuart Cameron, and Vladimir Nikora for their contributions to the development of this work. The authors would like to thank Hydro Technology Institute Ltd. (the developers of Hydro-STIV) for collaborating on the project.

Conflicts of Interest

The authors declare no conflict of interest. The funders had no role in the design of the study; in the collection, analyses, or interpretation of data; in the writing of the manuscript; or in the decision to publish the results.

References

  1. Rantz, S. Measurement and computation of stream-flow: Measurement of stage and discharge. In U.S. Geological Survey Water Supply Paper 2175; United States Government Printing Office: Washington, DC, USA, 1982. [Google Scholar] [CrossRef]
  2. Buchanan, T.J.; Somers, W.P. Discharge Measurements at Gaging Stations. In United States Geological Survey 1969; US Government Printing Office: Washington, DC, USA, 1969. [Google Scholar]
  3. Costa, J.E.; Spicer, K.R.; Cheng, R.T.; Haeni, F.P.; Melcher, N.B.; Thurman, E.M.; Plant, W.J.; Keller, W.C. measuring stream discharge by non-contact methods: A Proof-of-Concept Experiment. Geophys. Res. Lett. 2000, 27, 553–556. [Google Scholar] [CrossRef]
  4. Welber, M.; Le Coz, J.; Laronne, J.B.; Zolezzi, G.; Zamler, D.; Dramais, G.; Hauet, A.; Salvaro, M. Field assessment of noncontact stream gauging using portable surface velocity radars (SVR). Water Resour. Res. 2016, 52, 1108–1126. [Google Scholar] [CrossRef]
  5. Fujita, I.; Muste, M.; Kruger, A. Large-scale particle image velocimetry for flow analysis in hydraulic engineering applications. J. Hydraul. Res. 1998, 36, 397–414. [Google Scholar] [CrossRef]
  6. Le Coz, J.; Hauet, A.; Pierrefeu, G.; Dramais, G.; Camenen, B. Performance of image-based velocimetry (LSPIV) applied to flash-flood discharge measurements in Mediterranean rivers. J. Hydrol. 2010, 394, 42–52. [Google Scholar] [CrossRef]
  7. Al-Mamari, M.M.; Kantoush, S.A.; Kobayashi, S.; Sumi, T.; Saber, M. Real-Time Measurement of Flash-Flood in a Wadi Area by LSPIV and STIV. Hydrology 2019, 6, 27. [Google Scholar] [CrossRef]
  8. Muste, M.; Ho, H.-C.; Kim, D. Considerations on direct stream flow measurements using video imagery: Outlook and research needs. J. Hydro-Environ. Res. 2011, 5, 289–300. [Google Scholar] [CrossRef]
  9. Detert, M.; Weitbrecht, V. Helicopter-based surface PIV experiments at Thur River. In Proceedings of the River Flow, Lausanne, Switzerland, 3–5 September 2014. [Google Scholar]
  10. Detert, M.; Johnson, E.D.; Weitbrecht, V. Proof-of-concept for low-cost and non-contact synoptic airborne river flow measurements. Int. J. Remote Sens. 2017, 38, 2780–2807. [Google Scholar] [CrossRef]
  11. Legleiter, C.J.; Kinzel, P.J.; Laker, M.; Conaway, J.S. Moving Aircraft River Velocimetry (MARV): Framework and Proof-of-Concept on the Tanana River. Water Resour. Res. 2023, 59, e2022WR033822. [Google Scholar] [CrossRef]
  12. Hutley, N.R.; Beecroft, R.; Wagenaar, D.; Soutar, J.; Edwards, B.; Deering, N.; Grinham, A.; Albert, S. Adaptively monitoring streamflow using a stereo computer vision system. Hydrol. Earth Syst. Sci. 2023, 27, 2051–2073. [Google Scholar] [CrossRef]
  13. Puleo, J.A.; McKenna, T.E.; Holland, K.T.; Calantoni, J. Quantifying riverine surface currents from time sequences of thermal infrared imagery. Water Resour. Res. 2012, 48, 1–20. [Google Scholar] [CrossRef]
  14. Kinzel, P.J.; Legleiter, C.J. sUAS-Based Remote Sensing of River Discharge Using Thermal Particle Image Velocimetry and Bathymetric Lidar. Remote Sens. 2019, 11, 2317. [Google Scholar] [CrossRef]
  15. Schweitzer, S.A.; Cowen, E.A. Instantaneous River-Wide Water Surface Velocity Field Measurements at Centimeter Scales Using Infrared Quantitative Image Velocimetry. Water Resour. Res. 2021, 57, e2020WR029279. [Google Scholar] [CrossRef]
  16. Detert, M.; Cao, L.; Albayrak, I. Airborne Image Velocimetry Measurements at the Hydropower Plant Schiffmühle on Limmat River, Switzerland. In Proceedings of the 2nd International Symposium and Exhibition on Hydro-Environment Sensors and Software (HydroSenSoft), Madrid, Spain, 26 February–3 March 2019. [Google Scholar]
  17. Biggs, H.J.; Smith, B.; Detert, M.; Sutton, H. Surface image velocimetry: Aerial tracer particle distribution system and techniques for reducing environmental noise with coloured tracer particles. River Res. Appl. 2022, 38, 1192–1198. [Google Scholar] [CrossRef]
  18. Ljubičić, R.; Strelnikova, D.; Perks, M.T.; Eltner, A.; Peña-Haro, S.; Pizarro, A.; Sasso, S.F.D.; Scherling, U.; Vuono, P.; Manfreda, S. A comparison of tools and techniques for stabilising unmanned aerial system (UAS) imagery for surface flow observations. Hydrol. Earth Syst. Sci. 2021, 25, 5105–5132. [Google Scholar] [CrossRef]
  19. Le Coz, J.; Renard, B.; Vansuyt, V.; Jodeau, M.; Hauet, A. Estimating the uncertainty of video-based flow velocity and discharge measurements due to the conversion of field to image coordinates. Hydrol. Process. 2021, 35, e14169. [Google Scholar] [CrossRef]
  20. Peña-Haro, S.; Ljubičić, R.; Strelnikova, D. Geometric correction and stabilization of images collected by UASs in river monitoring. In Unmanned Aerial Systems for Monitoring Soil, Vegetation, and Riverine Environments 2023; Elsevier: Amsterdam, The Netherlands, 2023. [Google Scholar] [CrossRef]
  21. Muste, M.; Fujita, I.; Hauet, A. Large-scale particle image velocimetry for measurements in riverine environments. Water Resour. Res. 2008, 44, 1–14. [Google Scholar] [CrossRef]
  22. Le Coz, J.; Jodeau, M.; Hauet, A.; Marchand, B.; Le Boursicaud, R. Image-based velocity and discharge measurements in field and laboratory river engineering studies using the free Fudaa-LSPIV software. In Proceedings of the River Flow, Lausanne, Switzerland, 3–5 September 2014. [Google Scholar]
  23. Fujita, I.; Notoya, Y.; Tani, K.; Tateguchi, S. Efficient and accurate estimation of water surface velocity in STIV. Environ. Fluid Mech. 2018, 19, 1363–1378. [Google Scholar] [CrossRef]
  24. Patalano, A.; García, C.M.; Rodríguez, A. Rectification of Image Velocity Results (RIVeR): A simple and user-friendly toolbox for large scale water surface Particle Image Velocimetry (PIV) and Particle Tracking Velocimetry (PTV). Comput. Geosci. 2017, 109, 323–330. [Google Scholar] [CrossRef]
  25. Leitão, J.P.; Peña-Haro, S.; Lüthi, B.; Scheidegger, A.; de Vitry, M.M. Urban overland runoff velocity measurement with consumer-grade surveillance cameras and surface structure image velocimetry. J. Hydrol. 2018, 565, 791–804. [Google Scholar] [CrossRef]
  26. Cao, L.; Weitbrecht, V.; Li, D.; Detert, M. Airborne Feature Matching Velocimetry for surface flow measurements in rivers. J. Hydraul. Res. 2020, 59, 637–650. [Google Scholar] [CrossRef]
  27. Jodeau, M.; Hauet, A.; Le Coz, J.; Faure, J.; Bodart, G. Fudaa-LSPIV Version 1.9.2 User Manual. EDF and INRAE 2022, Lyon, France. Available online: https://forge.irstea.fr/attachments/download/3031/User%20Manual%20Fudaa-LSPIV%201.9.2.pdf (accessed on 19 October 2023).
  28. Hydro Technology Institute Ltd. Hydro-STIV Operation Manual; Hydro Technology Institute Ltd.: Osaka, Japan, 2023. [Google Scholar]
  29. Patalano, A. River-STIV Software (Released 2018). Available online: https://riverdischarge.blogspot.com/p/download-river.html (accessed on 19 October 2023).
  30. Perks, M.T. KLT-IV v1.0: Image velocimetry software for use with fixed and mobile platforms. Geosci. Model Dev. 2020, 13, 6111–6130. [Google Scholar] [CrossRef]
  31. Winsemius, H.; Annor, F.; Hagenaars, R.; Luxemburg, W.; Van den Munckhoff, G.; Heeskens, P.; Dominic, J.; Waniha, P.; Mahamudu, Y.; Abdallah, H.; et al. OpenRiverCam, open-source operational discharge monitoring with low-cost cameras. In Proceedings of the EGU General Assembly, Online, 19–30 April 2021. [Google Scholar] [CrossRef]
  32. Legleiter, C.J.; Kinzel, P.J. The Toolbox for River Velocimetry using Images from Aircraft (TRiVIA). River Res. Appl. 2023, 39, 1457–1468. [Google Scholar] [CrossRef]
  33. Randall, M. National Industry Guidelines for Hydrometric Monitoring—Part 11: Application of Surface Velocity Methods for Velocity and Open Channel Discharge Measurements; Bureau of Meteorology Publication: Melbourne, Australia, 2021. [Google Scholar]
  34. Biggs, H. Drone Flow User Guide v1.1-River Remote Sensing and Surface Velocimetry; National Institute of Water and Atmospheric Research (NIWA) Report 2022; NIWA: Christchurch, New Zealand, 2022. [Google Scholar] [CrossRef]
  35. Jolley, M.J.; Russell, A.J.; Quinn, P.F.; Perks, M.T. Considerations When Applying Large-Scale PIV and PTV for Determining River Flow Velocity. Front. Water 2021, 3, 709269. [Google Scholar] [CrossRef]
  36. Detert, M. How to Avoid and Correct Biased Riverine Surface Image Velocimetry. Water Resour. Res. 2021, 57, e2020WR027833. [Google Scholar] [CrossRef]
  37. Smart, G.M.; Biggs, H.J. Remote gauging of open channel flow: Estimation of depth averaged velocity from surface velocity and turbulence. In Proceedings of the River Flow, Delft, The Netherlands, 6–10 July 2020. [Google Scholar] [CrossRef]
  38. Turnipseed, D.; Sauer, V. Discharge measurements at gaging stations (No. 3-A8). In United States Geological Survey Report; United States Geological Survey: Reston, VA, USA, 2010. [Google Scholar] [CrossRef]
  39. Hauet, A.; Morlot, T.; Daubagnan, L. Velocity profile and depth-averaged to surface velocity in natural streams: A review over a large sample of rivers. In Proceedings of the River Flow, Lyon, France, 5–8 September 2018. [Google Scholar]
  40. Fujita, I. Principles of surface velocity gaugings. In Proceedings of the 4th IAHR-WMO-IAHS Training Course on Stream Gauging, Lyon, France, 5–8 September 2018. [Google Scholar]
  41. Biggs, H.J.; Nikora, V.I.; Gibbins, C.N.; Cameron, S.M.; Papadopoulos, K.; Stewart, M.; Fraser, S.; Vettori, D.; Savio, M.; O’Hare, M.T.; et al. Flow interactions with an aquatic macrophyte: A field study using stereoscopic particle image velocimetry. J. Ecohydraulics 2019, 4, 113–130. [Google Scholar] [CrossRef]
  42. Biggs, H.; Smart, G.; Doyle, M.; Holwerda, H.; McDonald, M.; Ede, M. River discharge from surface velocity measurements—A field guide for selecting alpha. In Envirolink Advice Report 2021; Envirolink: Christchurch, New Zealand, 2021. [Google Scholar] [CrossRef]
  43. Lennermark, M.; Hauet, A. Developing a post-processing software for ADCP discharge measurement piloted by an international and inter-agency group: A unique, ambitious experience… and one that works! In Proceedings of the EGU General Assembly, Vienna, Austria, 23–27 May 2022. [Google Scholar] [CrossRef]
  44. Keulegan, G.H. Laws of turbulent flow in open channels. J. Res. Natl. Bur. Stand. 1938, 21, 707. [Google Scholar] [CrossRef]
  45. Smart, G. A base for the log law and von Karman’s constant problem. J. Hydraul. Res. 2022, 60, 935–943. [Google Scholar] [CrossRef]
  46. Dietrich, J.T. Bathymetric Structure-from-Motion: Extracting shallow stream bathymetry from multi-view stereo photogrammetry. Earth Surf. Process. Landf. 2017, 42, 355–364. [Google Scholar] [CrossRef]
  47. Johnson, E.D.; Cowen, E.A. Remote monitoring of volumetric discharge employing bathymetry determined from surface turbulence metrics. Water Resour. Res. 2016, 52, 2178–2193. [Google Scholar] [CrossRef]
  48. Jin, T.; Liao, Q. Application of large scale PIV in river surface turbulence measurements and water depth estimation. Flow Meas. Instrum. 2019, 67, 142–152. [Google Scholar] [CrossRef]
  49. Polcyn, F.; Brown, W.; Sattinger, I. The measurement of water depth by remote sensing techniques. In Report for the Spacecraft Oceanography Project 1970; The University of Michigan: Ann Arbour, MI, USA, 1970. [Google Scholar]
  50. Lyzenga, D.R. Passive remote sensing techniques for mapping water depth and bottom features. Appl. Opt. 1978, 17, 379–383. [Google Scholar] [CrossRef]
  51. Legleiter, C.J. The optical river bathymetry toolkit. River Res. Appl. 2021, 37, 555–568. [Google Scholar] [CrossRef]
  52. Dolcetti, G.; Hortobágyi, B.; Perks, M.; Tait, S.J.; Dervilis, N. Using Noncontact Measurement of Water Surface Dynamics to Estimate River Discharge. Water Resour. Res. 2022, 58, e2022WR032829. [Google Scholar] [CrossRef]
  53. Melcher, N.B.; Costa, J.E.; Haeni, F.P.; Cheng, R.T.; Thurman, E.M.; Buursink, M.; Spicer, K.R.; Hayes, E.; Plant, W.J.; Keller, W.C.; et al. River discharge measurements by using helicopter-mounted radar. Geophys. Res. Lett. 2002, 29, 41. [Google Scholar] [CrossRef]
  54. Hong, J.-H.; Guo, W.-D.; Wang, H.-W.; Yeh, P.-H. Estimating discharge in gravel-bed river using non-contact ground-penetrating and surface-velocity radars. River Res. Appl. 2017, 33, 1177–1190. [Google Scholar] [CrossRef]
  55. Mandlburger, G.; Pfennigbauer, M.; Schwarz, R.; Flöry, S.; Nussbaumer, L. Concept and Performance Evaluation of a Novel UAV-Borne Topo-Bathymetric LiDAR Sensor. Remote Sens. 2020, 12, 986. [Google Scholar] [CrossRef]
  56. Kinzel, P.J.; Legleiter, C.J.; Grams, P.E. Field evaluation of a compact, polarizing topo-bathymetric lidar across a range of river conditions. River Res. Appl. 2021, 37, 531–543. [Google Scholar] [CrossRef]
  57. Aberle, J. Spatially averaged near-bed flow field over rough armor layers. In Proceedings of the River Flow, Lisbon, Portugal, 6–8 September 2006. [Google Scholar]
  58. Smart, G.M.; Plew, D.; Gateuille, D. Eddy Educed Entrainment. In Proceedings of the River Flow, Braunschweig, Germany, 8–10 September 2010. [Google Scholar]
  59. Smart, G.M.; Biggs, H.J. Effects of shallow flows on the ratio of depth averaged velocity to water surface velocity. In Proceedings of the Weathering the Storm: NZHS, NZ Rivers Group & NZFSS Conference, Invercargill, New Zealand, 1–4 December 2020. [Google Scholar]
  60. Coles, D. The law of the wake in the turbulent boundary layer. J. Fluid Mech. 1956, 1, 191–226. [Google Scholar] [CrossRef]
  61. Muste, M.; Lyn, D.A.; Admiraal, D.; Ettema, R.; Nikora, V.I.; García, M.H. (Eds.) Experimental Hydraulics: Methods, Instrumentation, Data Processing and Management: Volume I: Fundamentals and Methods; CRC Press: Boca Raton, FL, USA, 2017. [Google Scholar]
  62. Eickelberg, N. Investigations of Velocity Profiles in Open Channel Flow Streams with Particular Focus on the Effects of Water Surface Wind. Master’s Thesis, Technical University of Braunschweig, Braunschweig, Germany, 2023. [Google Scholar]
  63. Detert, M. Hydrodynamic Processes at the Water-Sediment Interface of Streambeds. Ph.D. Thesis, University of Karlsruhe, Karlsruhe, Germany, 2008. [Google Scholar]
  64. Johnson, E.D.; Cowen, E.A. Remote determination of the velocity index and mean streamwise velocity profiles. Water Resour. Res. 2017, 53, 7521–7535. [Google Scholar] [CrossRef]
  65. Smart, G.M. Turbulent Velocity Profiles and Boundary Shear in Gravel Bed Rivers. J. Hydraul. Eng. 1999, 125, 106–116. [Google Scholar] [CrossRef]
  66. Le Coz, J.; Duby, P.; Dramais, G.; Camenen, B.; Laronne, J.; Zamler, D.; Zolezzi, G. Use of emerging non-intrusive techniques for flood discharge measurements. In Proceedings of the 5th International Conference on Flood Management, Tokyo, Japan, 27–29 September 2011. [Google Scholar]
  67. Smart, G.M. Is delta alpha uniform charlie? In Proceedings of the International Surface Velocimetry Workshop, Hull, UK, 4–6 May 2021. [Google Scholar]
  68. Hicks, D.M.; Mason, P. Roughness characteristics of New Zealand Rivers: A handbook for assigning hydraulic roughness coefficients to river reaches by the “visual comparison” approach. In Water Resources Survey; DSIR Marine and Freshwater: Wellington, New Zealand, 1991. [Google Scholar]
  69. Hinze, J.O. Turbulence—An Introduction to Its Mechanism and Theory; McGraw–Hill: New York, NY, USA, 1959. [Google Scholar]
  70. Clauser, F.H. The turbulent boundary layer. Adv. Appl. Mech. 1956, 4, 1–51. [Google Scholar] [CrossRef]
  71. Nowell, A.R.; Church, M. Turbulent flow in a depth-limited boundary layer. J. Geophys. Res. Oceans 1979, 84, 4816–4824. [Google Scholar] [CrossRef]
  72. Johnson, E.D.; Cowen, E.A. Estimating bed shear stress from remotely measured surface turbulent dissipation fields in open channel flows. Water Resour. Res. 2017, 53, 1982–1996. [Google Scholar] [CrossRef]
  73. Nezu, I.; Nakagawa, H. Turbulence in Open Channel Flows; Balkema: Boca Raton, FL, USA, 1993. [Google Scholar]
  74. Cameron, S.M.; Nikora, V.I.; Stewart, M.T. Very-large-scale motions in rough-bed open-channel flow. J. Fluid Mech. 2017, 814, 416–429. [Google Scholar] [CrossRef]
  75. Peña-Haro, S.; Lüthi, B.; Lukes, R.; Carrel, M. Wind effect on image-based river surface velocity measurements. In Proceedings of the EGU General Assembly, Vienna, Austria, 3–8 May 2020. [Google Scholar]
  76. Fujita, I.; Shibano, T.; Tani, K. Application of masked two-dimensional Fourier spectra for improving the accuracy of STIV-based river surface flow velocity measurements. Meas. Sci. Technol. 2020, 31, 094015. [Google Scholar] [CrossRef]
  77. Sun, X.; Shiono, K.; Chandler, J.H.; Rameshwaran, P.; Sellin, R.H.; Fujita, I. Discharge estimation in small irregular river using LSPIV. Proc. Inst. Civ. Eng.-Water Manag. 2010, 163, 247–254. [Google Scholar] [CrossRef]
  78. Gunawan, B.; Sun, X.; Sterling, M.; Shiono, K.; Tsubaki, R.; Rameshwaran, P.; Knight, D.; Chandler, J.; Tang, X.; Fujita, I. The application of LS-PIV to a small irregular river for inbank and overbank flows. Flow Meas. Instrum. 2012, 24, 1–12. [Google Scholar] [CrossRef]
  79. Kim, Y. Uncertainty Analysis for Non-Intrusive Measurement of River Discharge Using Image Velocimetry. Ph.D. Thesis, University of Iowa, Iowa City, IA, USA, 2006. [Google Scholar]
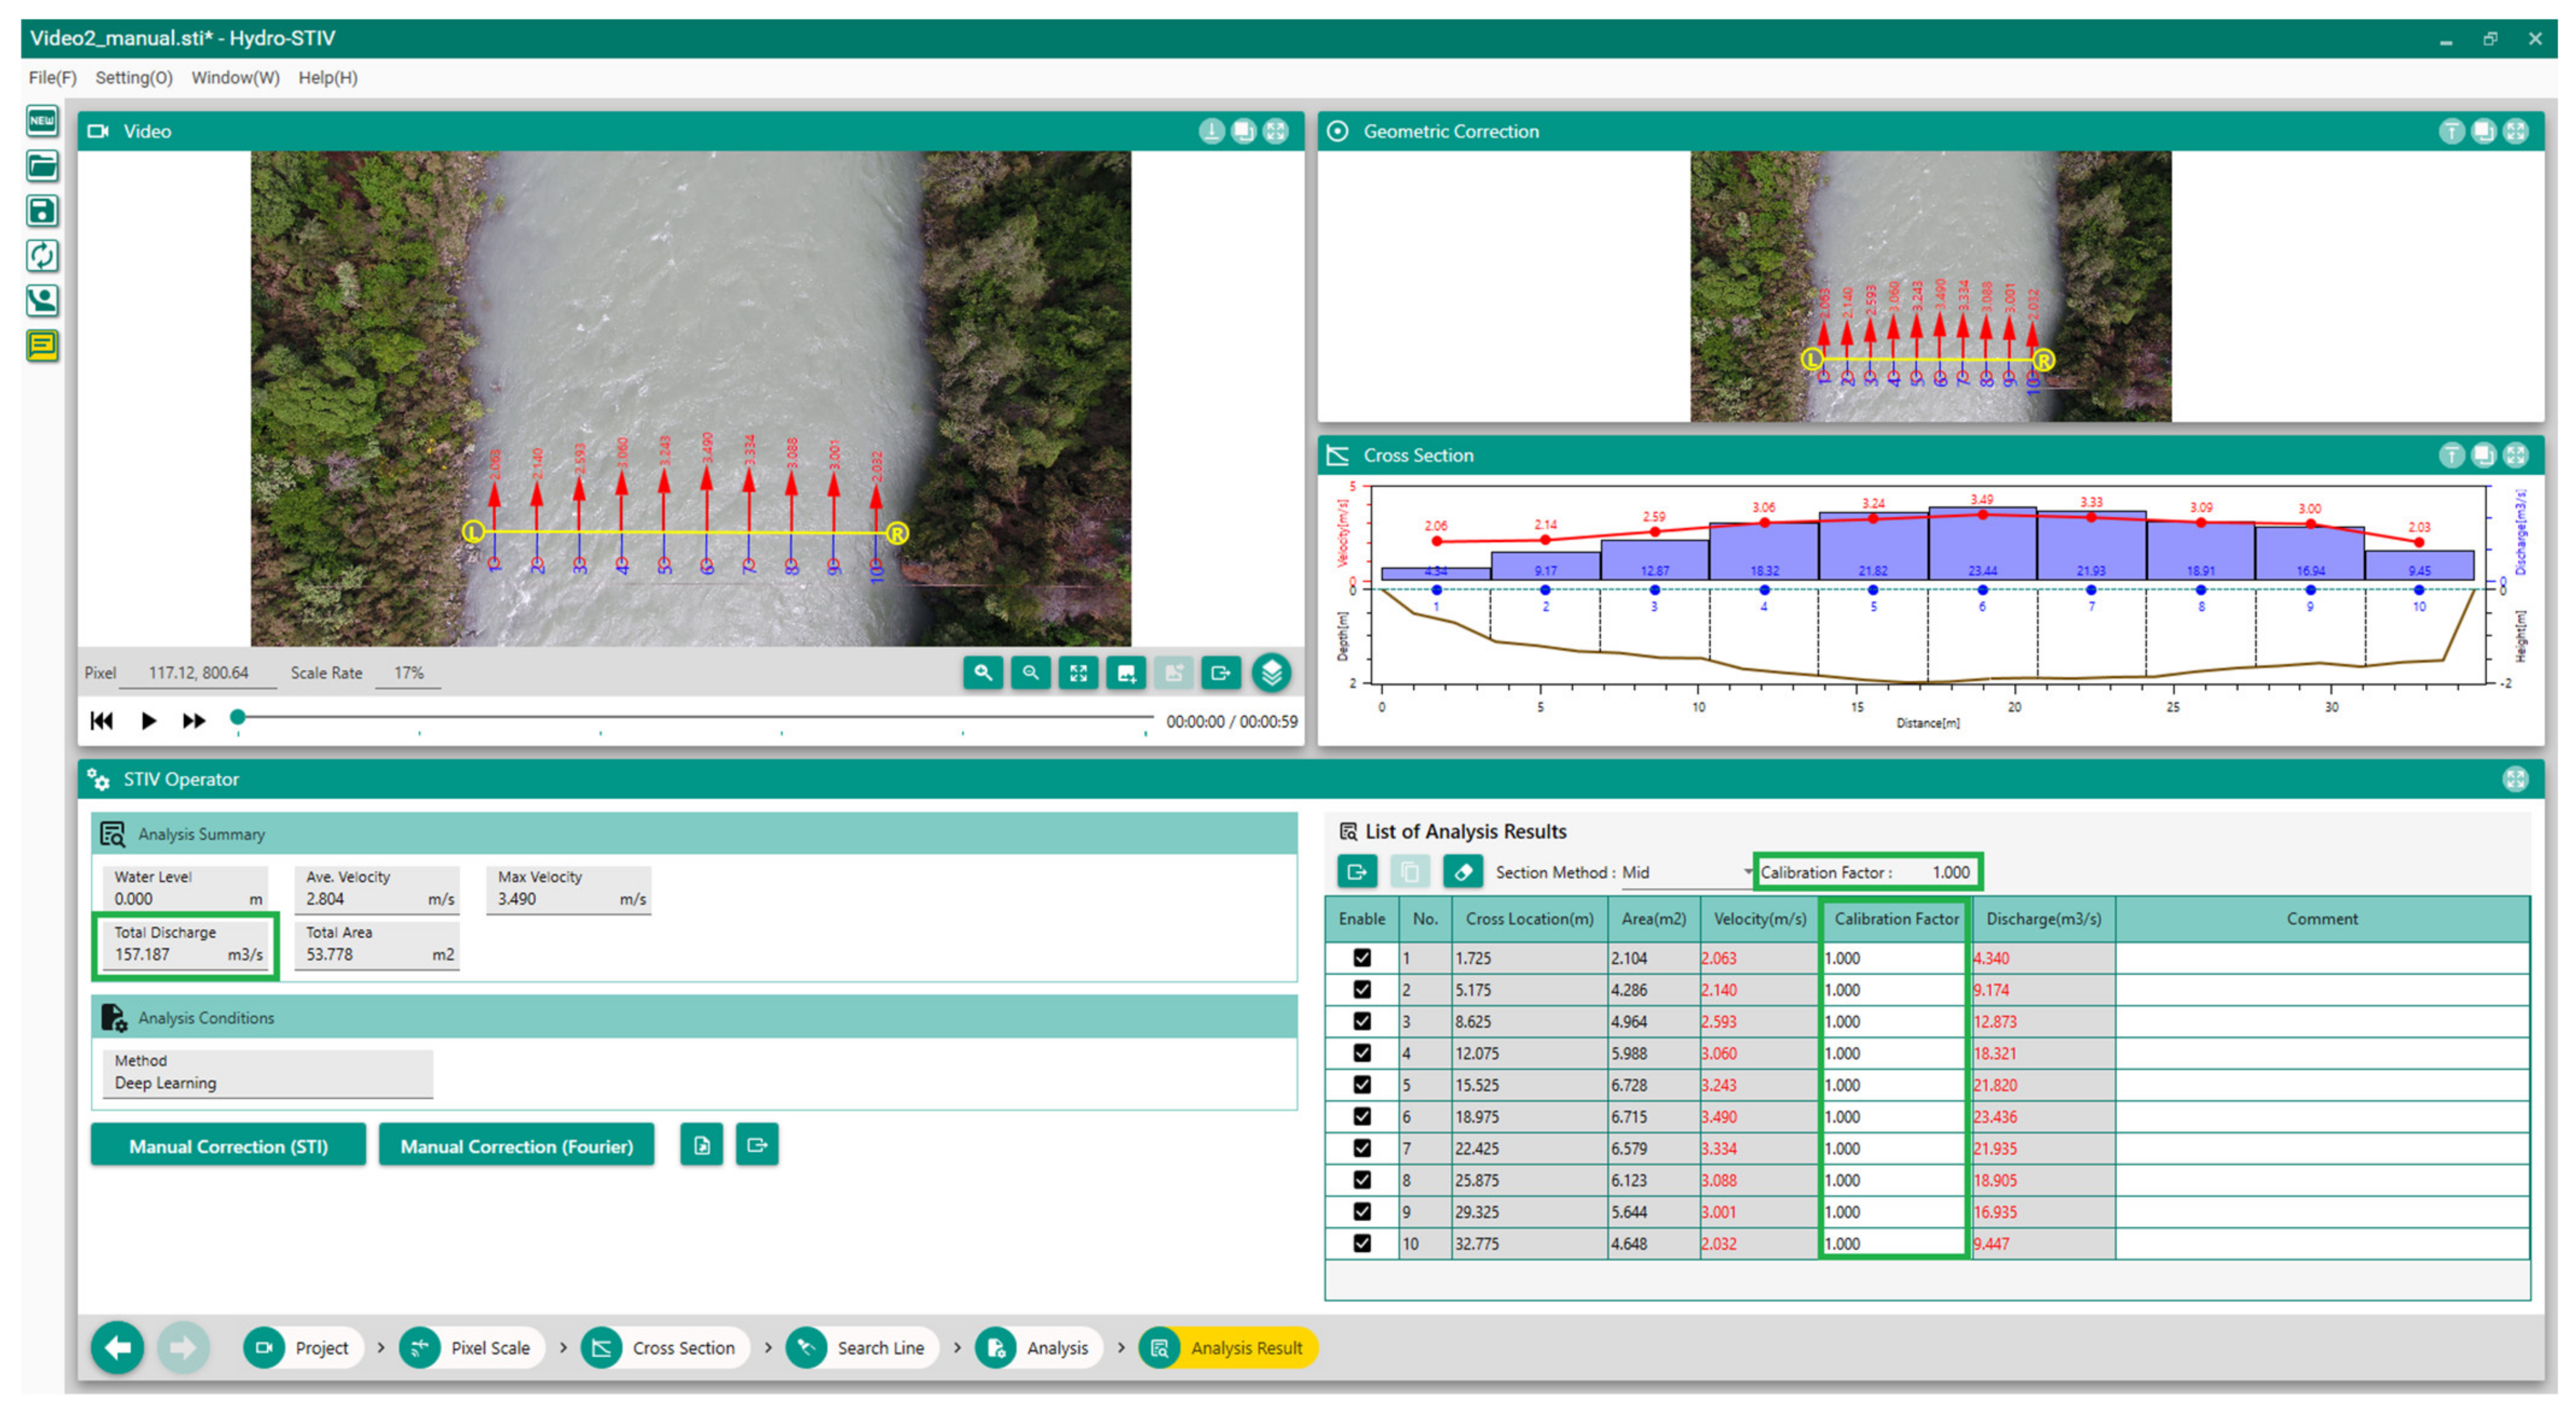
Figure 1. Discharge from surface image velocimetry in Hydro-STIV, with an initial alpha value of αi = 1, to obtain Q S , α i = 1 (Hurunui River, New Zealand). Green boxes show αi = 1 ‘Calibration Factor’ and the ‘Total Discharge’ obtained with this alpha Q S , α i = 1 .
Water 15 03711 g001
Figure 2. Estimating alpha in QRev from ADCP velocity profile extrapolation with power law extrapolation to the surface (left) and constant velocity extrapolation (right). The green X shows the normalized velocity indicated by the extrapolation, with alpha being the reciprocal of the normalised surface velocity. Data from the Hurunui River in New Zealand.
Water 15 03711 g002
Figure 3. Power law velocity profile in QRev (Rangitata River, New Zealand).
Water 15 03711 g003
Figure 4. Example of a flooded river site, where obstacles such as trees and bridge piers increase flow resistance within the water column, resulting in irregular velocity profiles. For such a site, methods that assume a specific underlying velocity profile shape are not appropriate for estimating alpha. Instead, alpha must be calculated from in situ measurement data (see Section 2.2 and Section 2.3).
Water 15 03711 g004
Figure 5. Theoretical example of a stage–alpha rating curve.
Water 15 03711 g005
Figure 6. Divided channel method, where separate alpha values are applied to the main channel and overbank flow regions.
Water 15 03711 g006
Figure 7. Workflow diagram for selecting the alpha estimation method.
Water 15 03711 g007
Table 1. Estimating α from site roughness and the anticipated power law profile exponent [40,42,66], with the power law exponent denoted as 1/m or M.
NormalSmoothRoughVery RoughExtreme Cases
m6–71042–3
M0.143–0.1670.10.250.333–0.5
α0.86–0.870.910.80.67–0.750.6–1.2
Table 2. Smart [67] provided data on relative depth, power law exponent M, and alpha. These data were derived from an analysis of 100+ New Zealand rivers using the Hicks and Mason [68] dataset, with alpha calculated as 1/(M + 1).
H/d84mMα
>306.250.160.86
10–305.260.190.84
2–101.720.580.63
<20.631.590.37
Disclaimer/Publisher’s Note: The statements, opinions and data contained in all publications are solely those of the individual author(s) and contributor(s) and not of MDPI and/or the editor(s). MDPI and/or the editor(s) disclaim responsibility for any injury to people or property resulting from any ideas, methods, instructions or products referred to in the content.