Article

Use of δ13C and δ15N as Indicators to Evaluate the Influence of Sewage on Organic Matter in the Zhangjiang Mangrove–Estuary Ecosystem, Southeastern China

1
Fisheries College, Jimei University, Jimei District, Xiamen 361021, China
2
Key Laboratory of Global Change and Marine-Atmospheric Chemistry, Xiamen 361000, China
*
Author to whom correspondence should be addressed.
Water 2023, 15(20), 3660; https://doi.org/10.3390/w15203660
Submission received: 16 September 2023 / Revised: 10 October 2023 / Accepted: 16 October 2023 / Published: 19 October 2023
(This article belongs to the Special Issue Coastal Ecology and Fisheries Management)

Abstract

:
Organic matter in the productive mangrove–estuary ecosystem plays an important role in global climate changes. In recent years, the eutrophication in such areas caused by anthropogenic inputs of sewage has been revealed, highlighting the need to understand its influence on organic matter. In this study, δ13C and δ15N were used to reveal the effects of sewage on organic matters in the Zhangjiang mangrove–estuary ecosystem. Our results indicate that sewage contributed the most of the total particulate organic matter (41%) in the Zhangjiang estuary, while mangrove plants contributed most of the soil organic matter (45%) in the neighboring Yunxiao mangrove. Phytoplankton was another important source of organic matter, accounting for about 21.8% and 49.8% of the particulate and soil organic matter, respectively. Sewage was also a major source of dissolved inorganic nitrogen, providing 28.9%, 12.2%, and 100% of the total NO3, NO2, and NH4+ in the Zhangjiang estuary, respectively. This may be the major reason for the productive phytoplankton here, which contributed 21.8% and 49.8% of the total particulate and soil organic matter in the study area. Our results reveal the direct contribution and the potential effects of sewage on the contents and bioavailability of organic matter in mangrove–estuary ecosystems, providing new insights into understanding the response of coastal areas to the influence of human activities.

1. Introduction

As the areas with the highest population density, estuaries have great significance in understanding the effects of human activities on marine environments [1,2]. In southeastern China, estuaries are usually fringed by mangroves [3]. This integrated mangrove–estuary ecosystem has been reported to be strongly influenced by the influx of agricultural, industrial, and domestic waters, causing several problems such as the eutrophication of waters [4,5,6], the degradation of mangroves, and the emission of greenhouse gases [7,8,9,10]. As the most productive ecosystem, the mangrove–estuary ecosystem has been reported to export about 29 Tg C year−1 of particulate organic carbon and 14 Tg C year−1 of dissolved organic carbon to the ocean [1], hence playing important roles in the marine carbon cycle and global climate change [8,9,11]. This highlights the need to understand the influence of anthropogenic sewage on the biogeochemical processes of organic matter in these areas.
The influx of sewage may effect organic matter in the mangrove–estuary ecosystem through the following paths: 1. the organic residues in industrial water and the residual baits, as well as the animal waste in agriculture water, may directly increase the amount of organic matter [4,5]; 2. the large amounts of nutrients transported by sewage may promote the production of mangroves and algae [5,8,12], hence increasing the amount of biogenic organic matter, which is usually characterized by higher bioavailability [13,14]; and 3. the simultaneous increase in the content and bioavailability of organic matter may accelerate the coupling cycles of carbon (C) and nitrogen (N) in such areas by facilitating the heterotrophic microbial processes [5,8,13]. This will further increase the release of greenhouse gases, which may largely offset the carbon sink function of the mangrove–estuary ecosystem [9,15,16]. Hence, it is urgent to distinguish the influence of sewage on organic matter in such areas, and the δ13C and δ15N of organic matter may provide help. In past years, the δ13C and C:N ratio were widely used as indicators in the source analysis of organic matter [17,18,19]. However, the variable C:N ratio caused by the microbial preference for N may raise the uncertainty of the source analysis. In comparison, δ15N may be more suitable, as the isotopic fractionation during the biogeochemical cycle of N is relatively small [20,21,22,23]. In recent years, δ15N has been used instead of the C:N ratio to analyze the source of organic matter in many areas [20,24,25]. Therefore, δ13C and δ15N may be helpful to distinguish the effects of sewage on organic matter in the mangrove–estuary ecosystem.
The Zhangjiang estuary (117.40–117.50° E, 23.88–23.93° N) is a semienclosed estuary in southeastern China, occupying 2360 ha and fringed by 117.9 ha of natural mangroves [10]. The dominant mangrove species here include Kandelia obovata, Aegiceras corniculatum, and Avicennia marina [9,10]. The eutrophication caused by the influx of agricultural and domestic water has been reported here for several years [3,4,9,10], while its influence on organic matter has not been well understood. The main aims of this study are as follows: 1. to observe the contents and the isotopic distribution (δ13C, δ15N) of organic matter in the Zhangjiang mangrove–estuary ecosystem, 2. to observe the direct contribution of sewage to organic matter here, and 3. to reveal the potential influences of anthropogenic sewage on the organic matter in such mangrove–estuary ecosystems. Our results build upon previous knowledge of the response of C and N cycles in coastal areas to the influences of human activities.

2. Materials and Methods

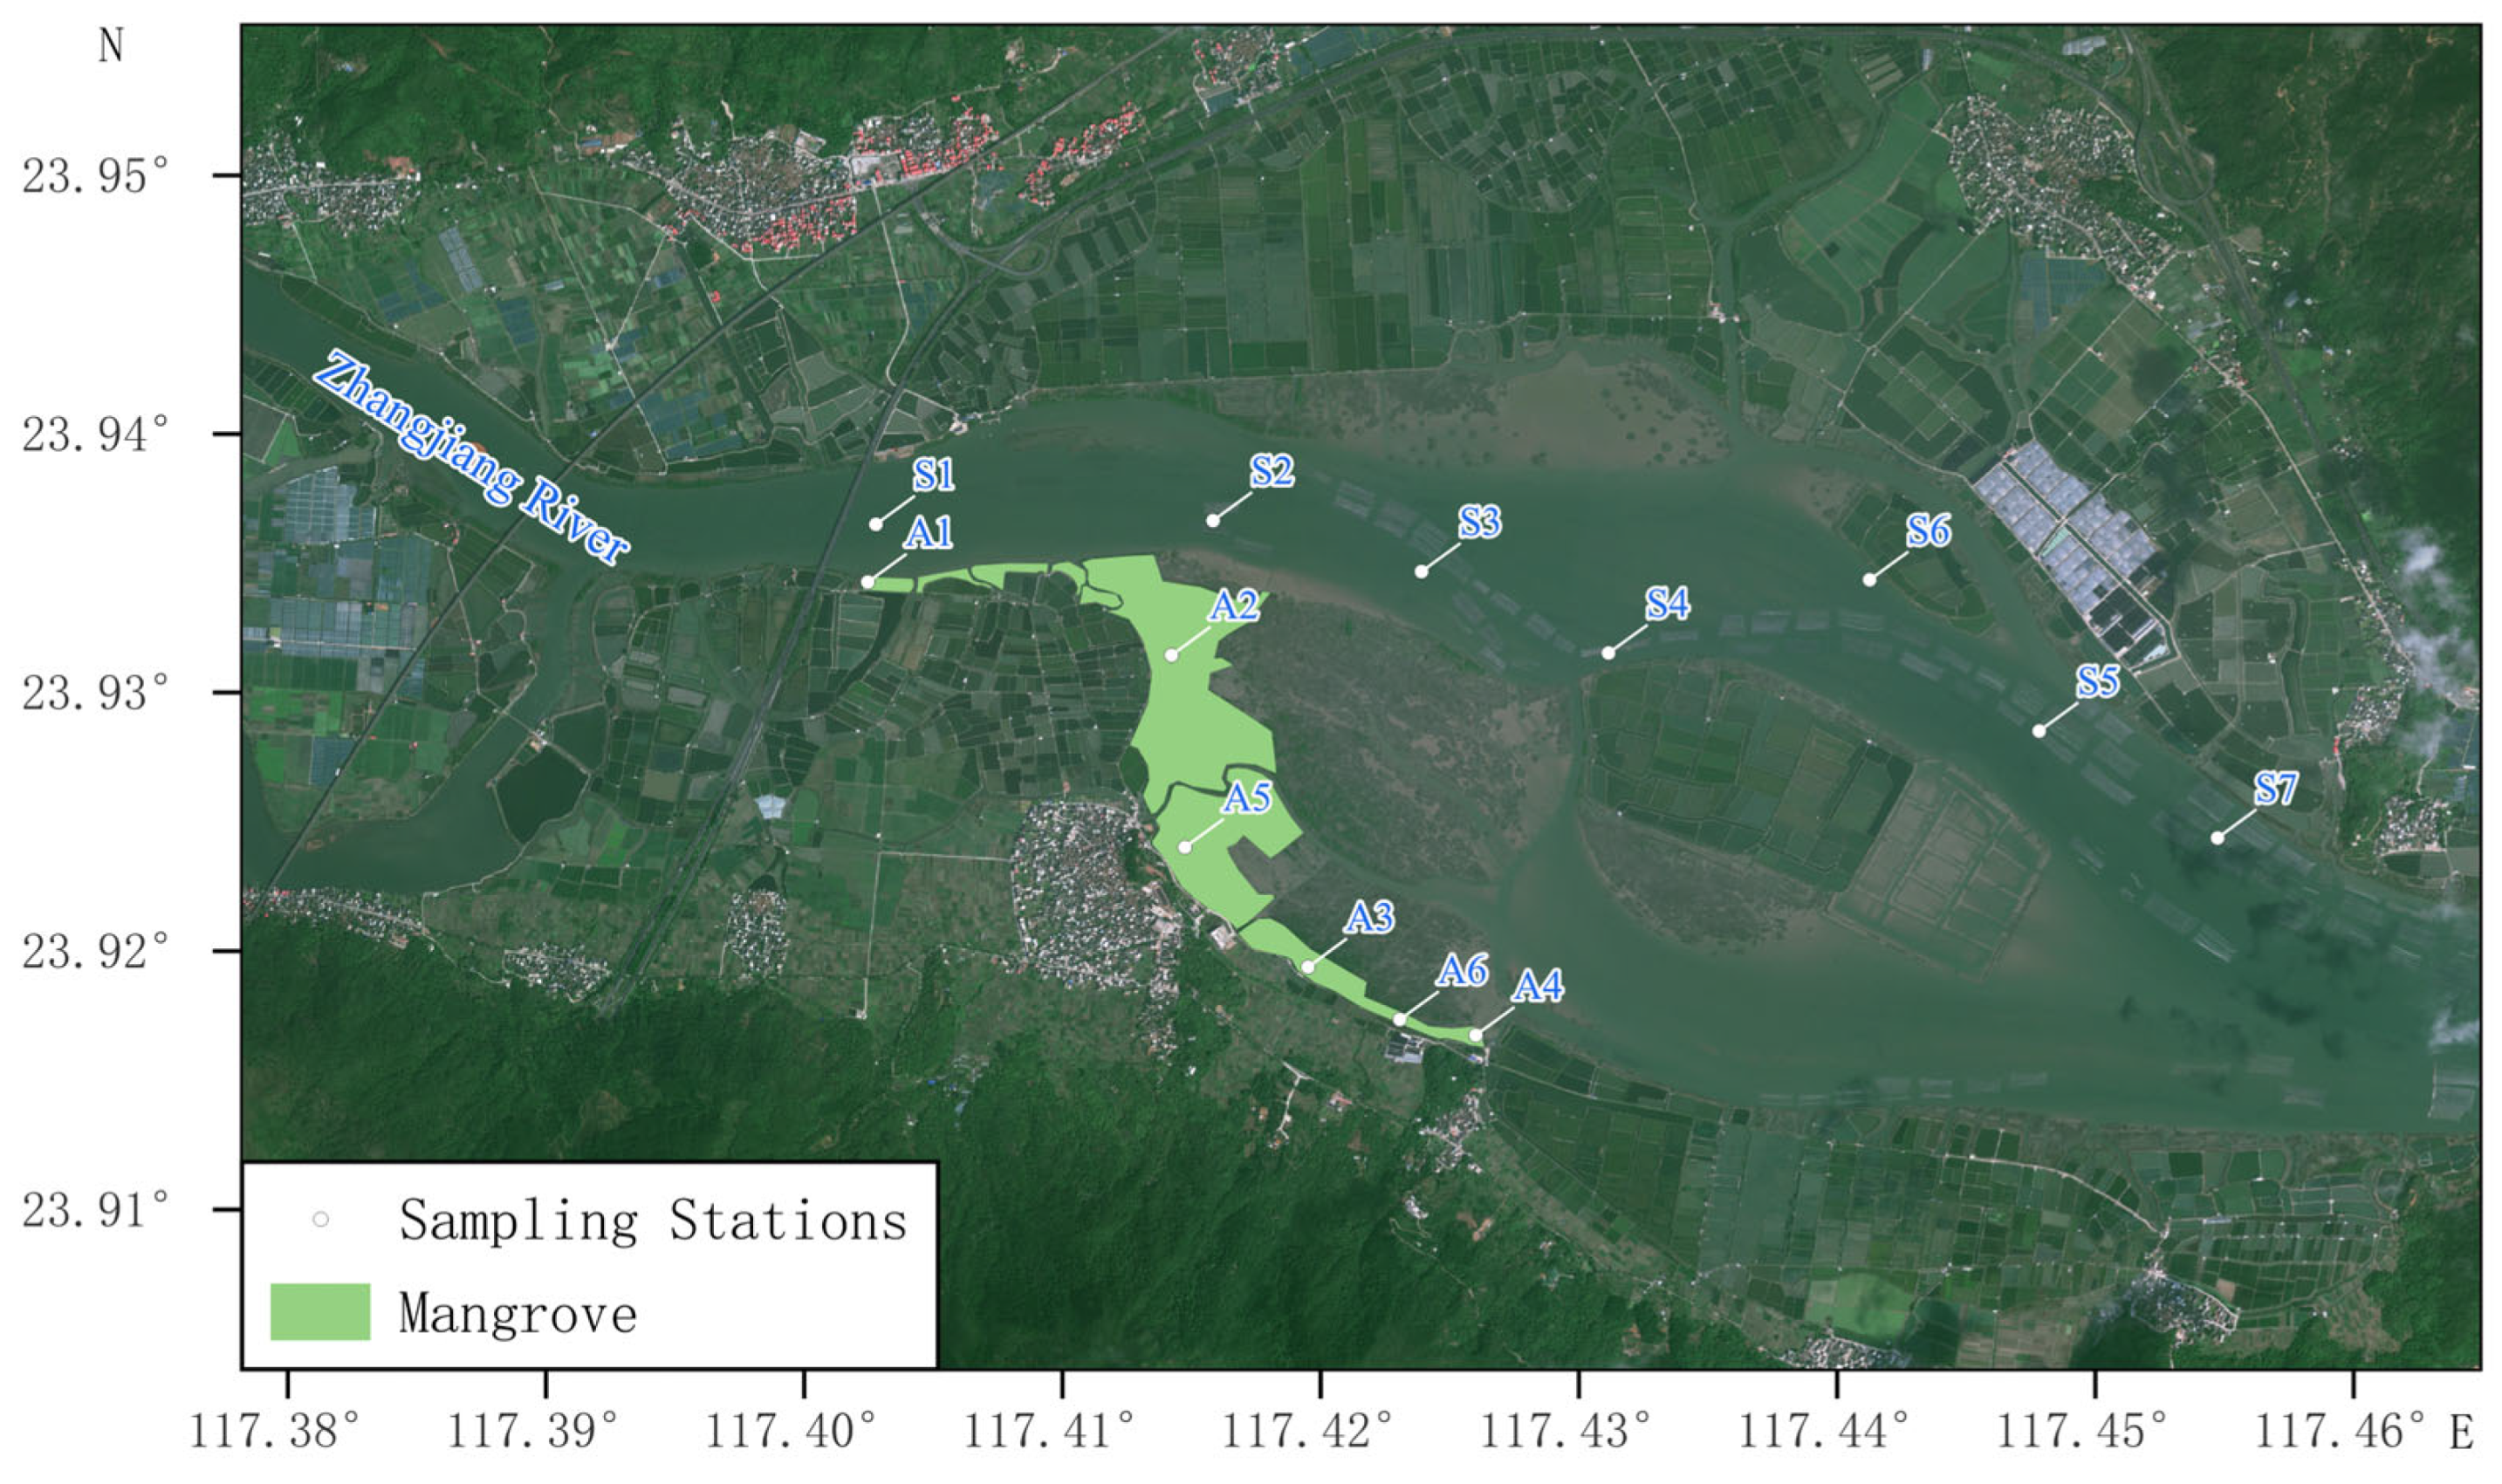
2.1. Sample Collection

A field sampling was carried out in December 2021, and the sampling locations are shown in Figure 1. Surface water (~0.5 m) in the Zhangjiang estuary and surface sediments (~5 cm) in the neighboring Yunxiao mangrove were collected to measure the contents and the isotopic values (δ13C, δ15N) of organic matter. In addition, the primary productions on the surface of the Zhangjiang estuary were also measured. All water samples were collected by Niskin bottles and kept at 4 °C before analysis. The temperature (T), salinity (S), the contents of dissolved oxygen (DO), and phycoerythrin and chlorophyll a (Chl a) in the Zhangjiang estuary were measured in situ using YSI 6600 multiprobe sensors (Yellow Springs Instrument Co., Yellow Springs, OH, USA). Mangrove sediments were collected by a core sampler and kept at −20 °C before analysis.

2.2. Dissolved Inorganic Nutrients

Concentrations of nitrate (NO3), nitrite (NO2), ammonia (NH4+), and silicate (SiO32−) were analyzed by a Lachat QuickChem 8500 autoanalyzer (Lachat Instruments, Loveland, CO., USA) after standard colorimetric methods. The content of phosphate (PO43−) was measured using a spectrophotometer via the standard molybdenum blue method. The nutrient detection limits were 0.05 μmol L−1 (NO3), 0.02 μmol L−1 (NO2), 0.03 μmol L−1 (NH4+), 0.02 μmol L−1 (PO43−), and 0.45 μmol L−1 (SiO32−), respectively.

2.3. Organic Carbon and Nitrogen

Particulate organic matter (POM) in water samples were collected by filtering 4 L of water through GF-75 filters (47 mm, 0.3 μm pore size). The filters were previously combusted for 4 h at 450 °C to remove organic matter. All water samples were then filtered through a 200 μm mesh sieve to remove large detritus. Then, water samples (without large detritus) were filtered by the precombusted GF-75 filters to collect particulate organic carbon (POC) and nitrogen (PN). The GF-75 filters were quickly washed using Milli-Q water following filtration and frozen at −20 °C until analysis. In the laboratory, the filters were treated with HCl vapor (48 h) to remove inorganic carbon and then dried at 60 °C. The contents of POC, PN, and the δ13C, δ15N of POM (δ13CPOM, δ15NPOM) were measured using a Finnigan Delta V Advantage isotope ratio mass spectrometer interfaced with a Carlo Erba NC 2500 elemental analyzer. The contents of the soil organic matter (SOM) in Yunxiao mangrove sediments and its δ13C, δ15N in (δ13CSOM, δ15NSOM) mangrove sediments were measured by the same method. The analytical precision is <0.2‰ in this study.

2.4. Primary Production

Primary production (PP) of phytoplankton was determined by a 13C uptake method: after collection, water samples were immediately transferred into three 125 mL pre-cleaned Nalgene polycarbonate bottles. After the addition of NaH13CO3 (the 13C concentration in the dissolved inorganic carbon was about 10 at-%), the bottles were incubated in an on-deck incubator filled with circulating water under the surface irradiance. Incubation experiments were started during the daytime and continued for 6–8 h. ZnCl2 was used to end the incubation and the particulate matter was filtered onto precombusted (450 °C, 4 h) GF-75 filters (47 mm, 0.3 μm pore size). The concentration and the 13C at-% of particulate organic carbon (POC) were determined by EA-IRMS, and the PP of phytoplankton was calculated as the follow equation:
PP = C ( A f A 0 ) t   ( A DIC A 0 ) f
where t is the incubation duration (h), C is the concentration of POC at the end of incubation, Af and A0 represent the abundance of 13C at the end and the start time of incubation, ADIC is the abundance of 13C substrate (measured by a Finnigan Delta V Advantage isotope ratio mass spectrometer interfaced with GasBench II), and f (1.025) is the correction coefficient [26].

2.5. Statistical Analysis

Pearson’s correlations analysis was conducted using the Statistical Package for Social Sciences program (version 19.0). The source analysis of organic matter based on δ13C, δ15N values was conducted by IsoSource (version 1.3), with an increment of 1% and a tolerance of 0.1%.

3. Results

3.1. Physicochemical Parameters

The basic physicochemical parameters of the Zhangjiang estuary are shown in Table 1. Surface temperatures (T) ranged from 17.5 to 17.9 °C (17.7 ± 0.2 °C, n = 7), with the maximum observed at station S6 and the minimum at S3. Surface salinity (S) and dissolved oxygen (DO) ranged from 19.2 to 22.3 (20.4 ± 0.9, n = 7) and 5.8 to 7.8 mg L−1 (6.4 ± 0.6 mg L−1, n = 7), respectively, and slightly increased from upstream to downstream. The contents of phycoerythrin and Chl a ranged from 0.699 to 4.940 μg L−1 (2.630 ± 1.350 μg L−1, n = 7) and 1.765 to 4.028 μg L−1 (2.779 ± 0.765 μg L−1, n = 7), with higher values observed upstream.

3.2. Nutrients Concentrations

The concentrations of NO3, NO2, and NH4+ ranged from 51.0 to 73.8 μmol L−1 (60.0 ± 8.0 μmol L−1, n = 7), 0.10 to 0.12 μmol L−1 (0.11 ± 0.01 μmol L−1, n = 7), and 605.6 to 1898.8 μmol L−1 (1050.2 ± 467.8 μmol L−1, n = 7), respectively (Table 2). The concentration of dissolved inorganic nitrogen (DIN) ranged from 664.4 to 1967.8 μmol L−1 (1117.9 ± 469.2 μmol L−1, n = 7), and NH4+ accounted more than 90% of the total DIN at most stations. Generally, the concentrations of DIN decreased from upstream to downstream. The concentration of PO43− and SiO32− ranged from 2.9 to 3.7 μmol L−1 (3.2 ± 0.3 μmol L−1, n = 7) and 77.4 to 101.5 μmol L−1 (90.0 ± 8.8 μmol L−1, n = 7), with the maximum observed at S3 and the minimum at S2 and S6, respectively. The spatial variations in PO43− and SiO32− were less than that of DIN. A notable feature of nutrient stoichiometry is that the ratios of N: P (352.2 ± 150.9, n = 7) were significantly higher than the Redfield ratios at all stations.

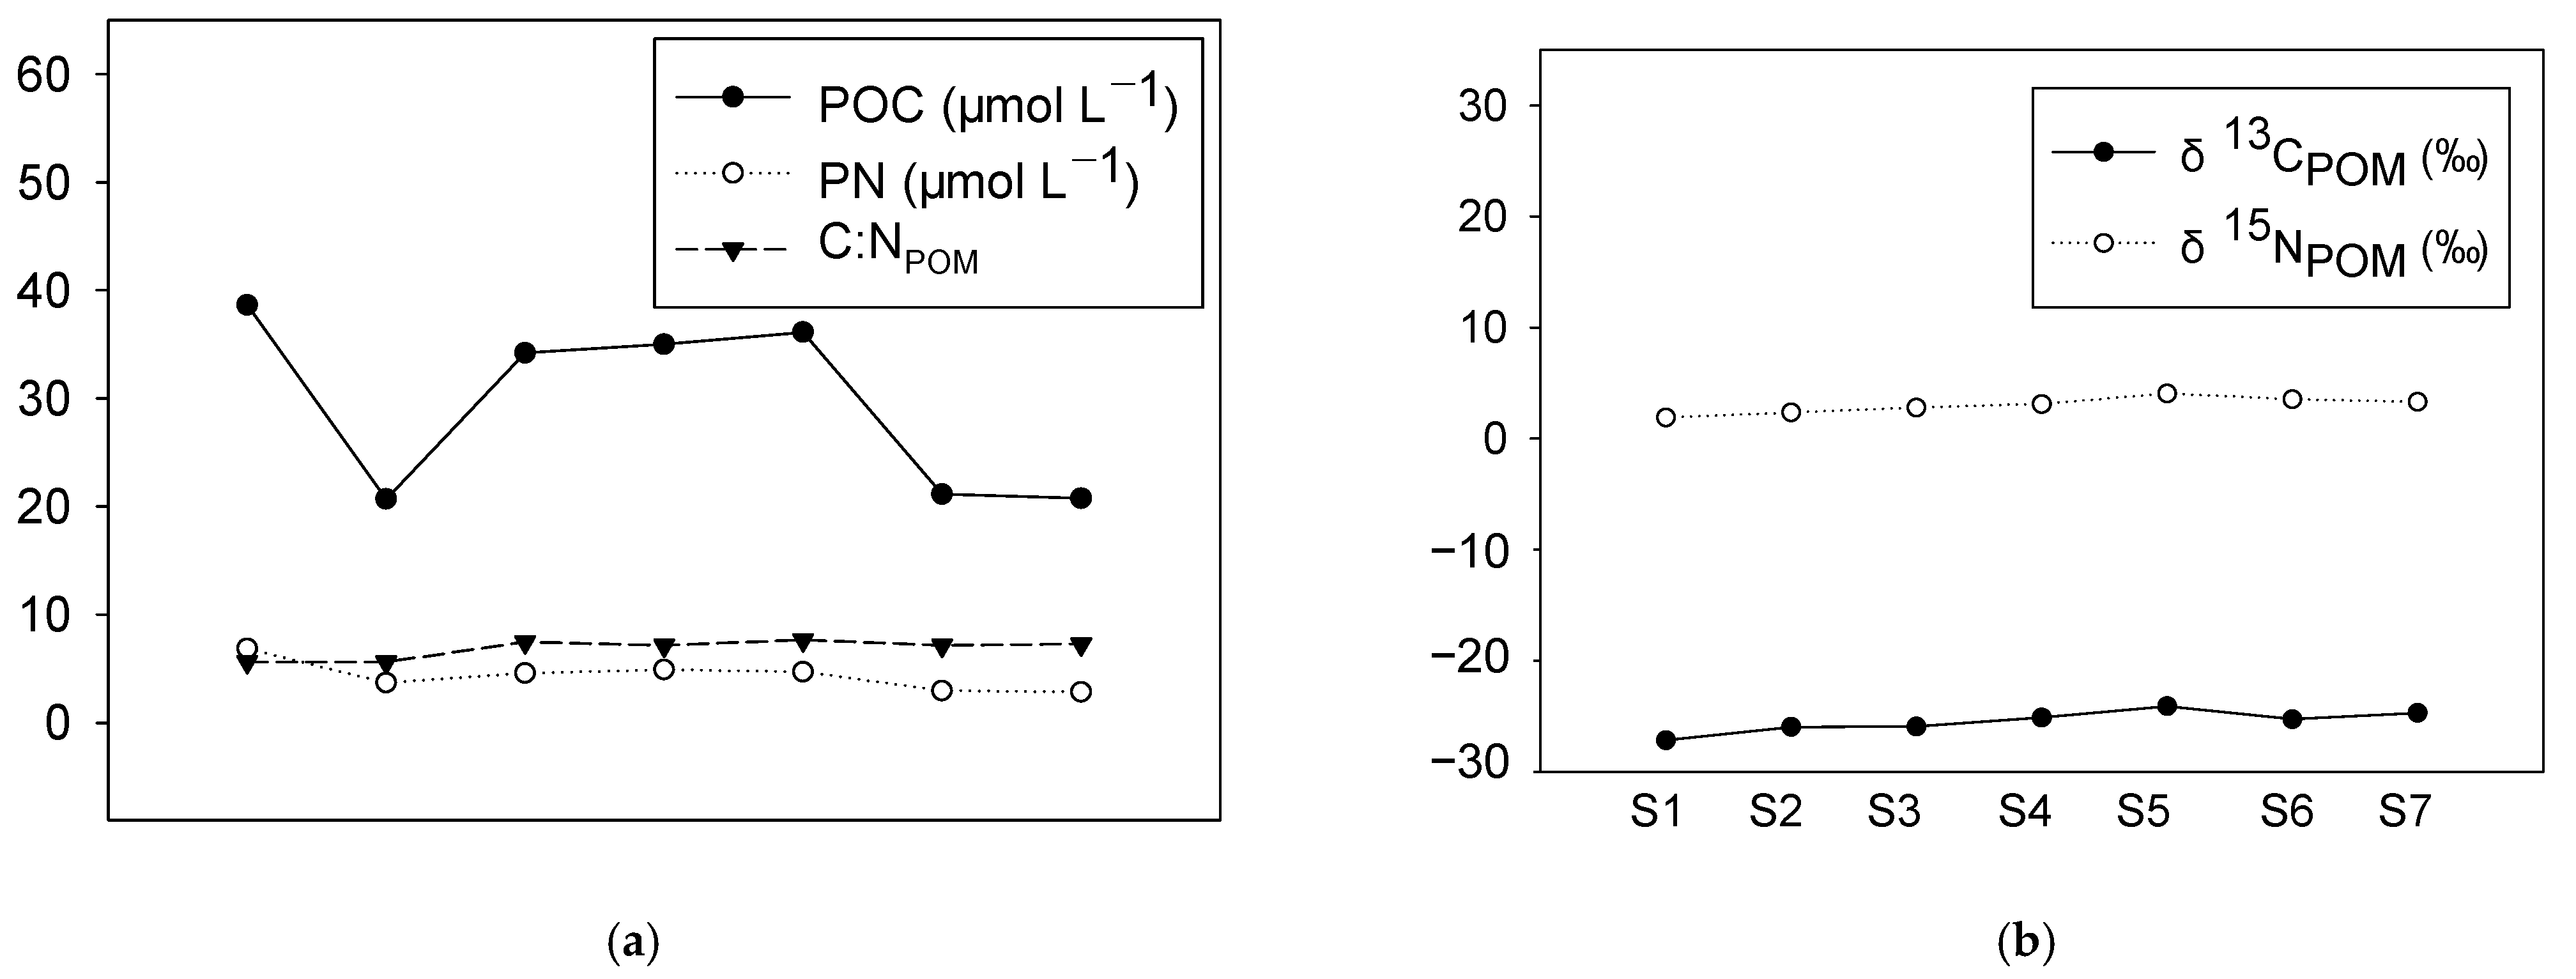
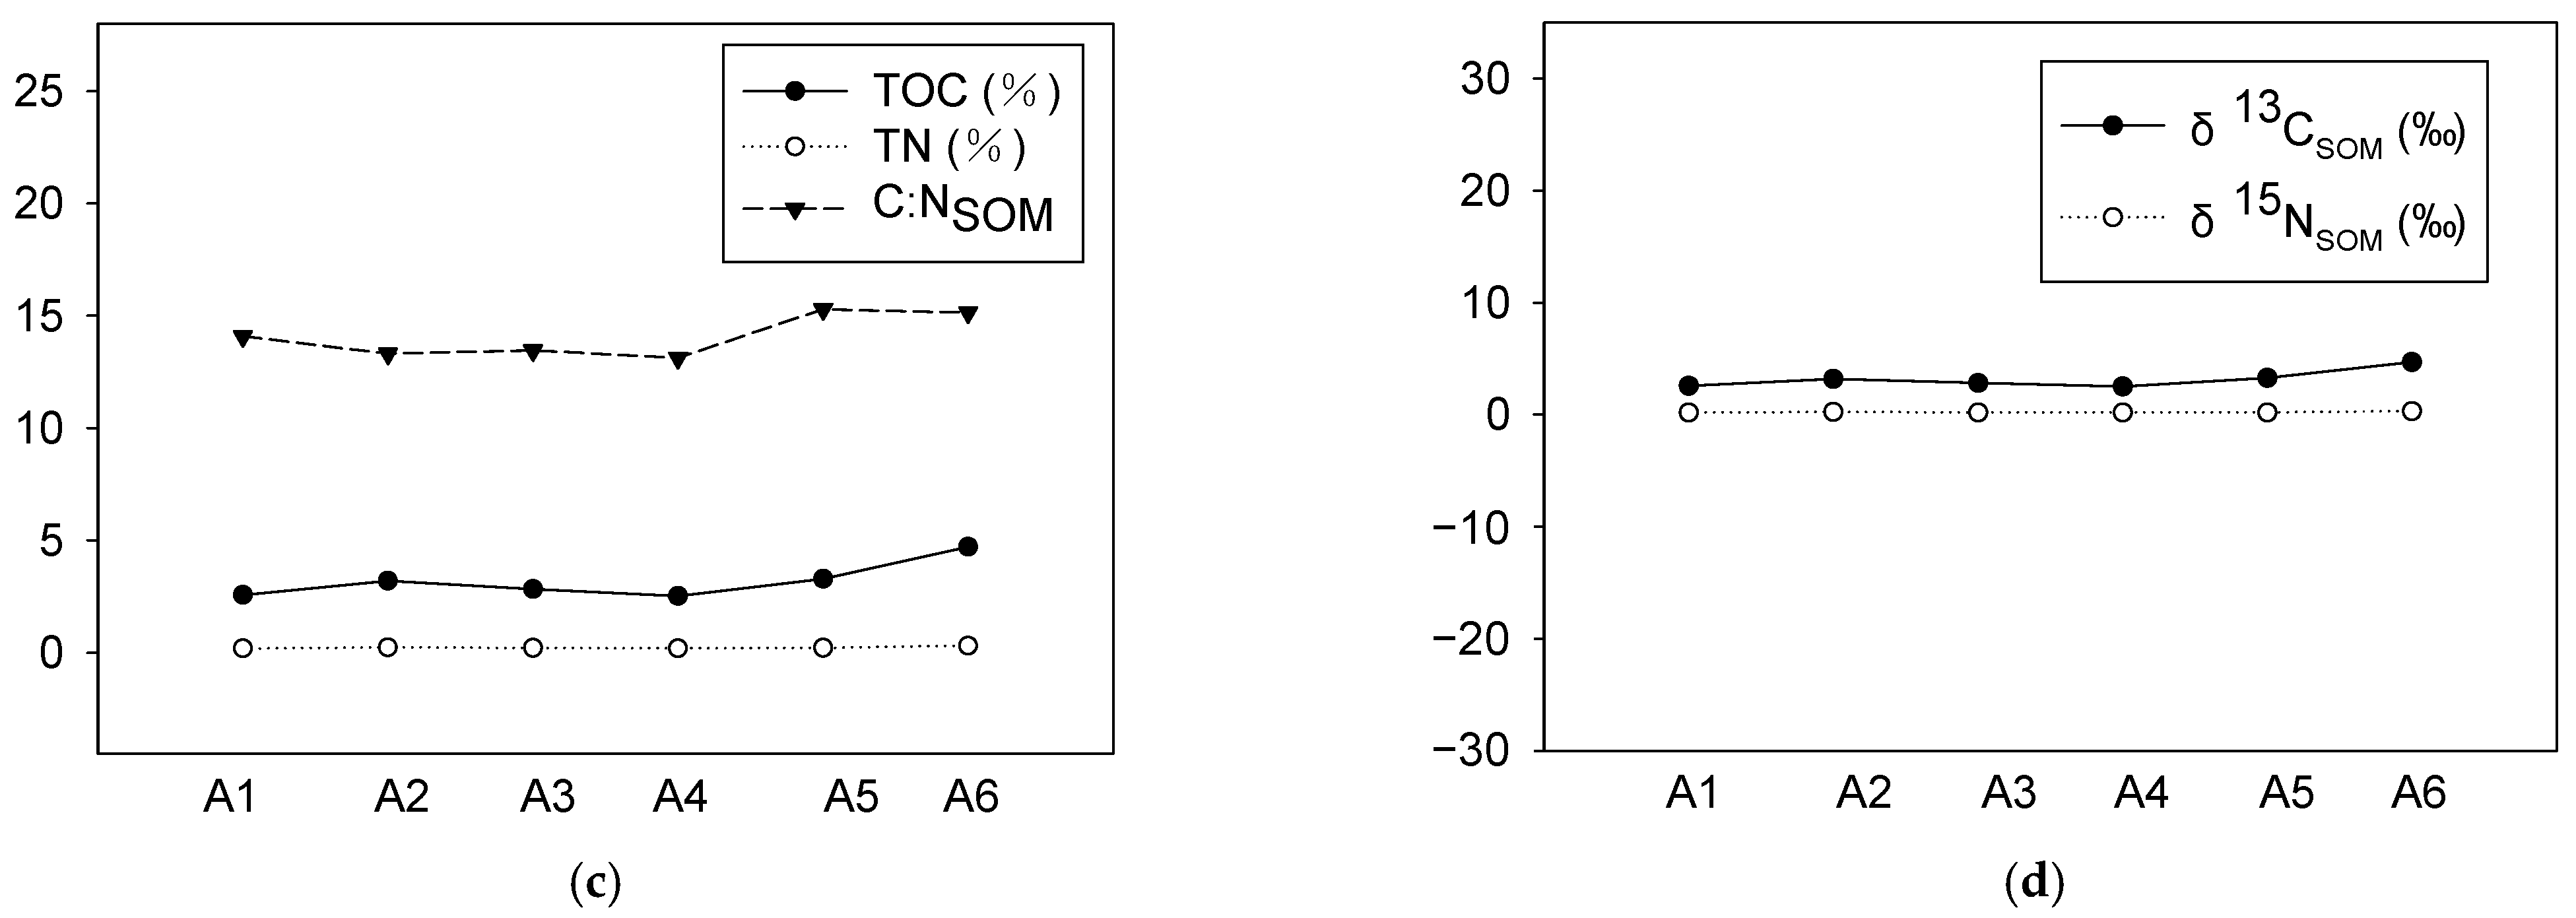
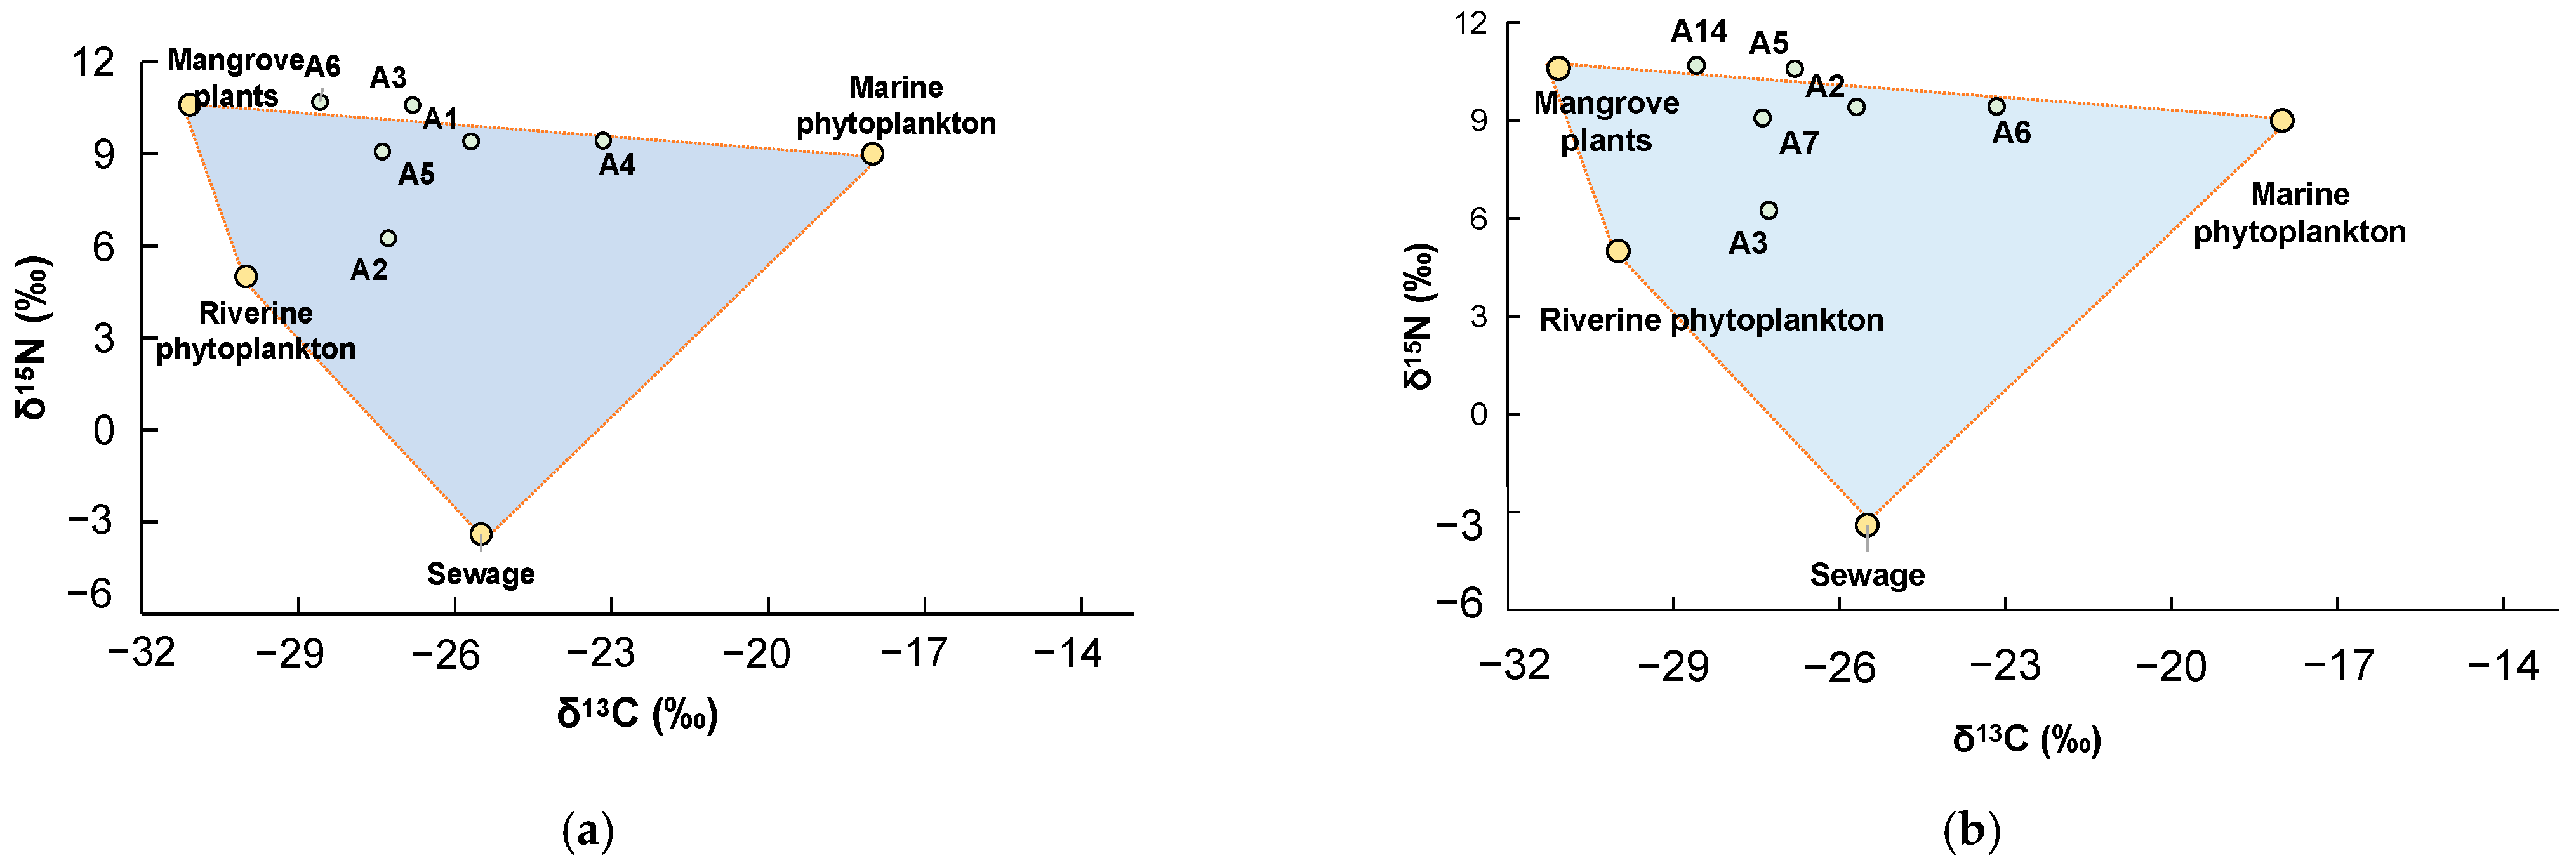
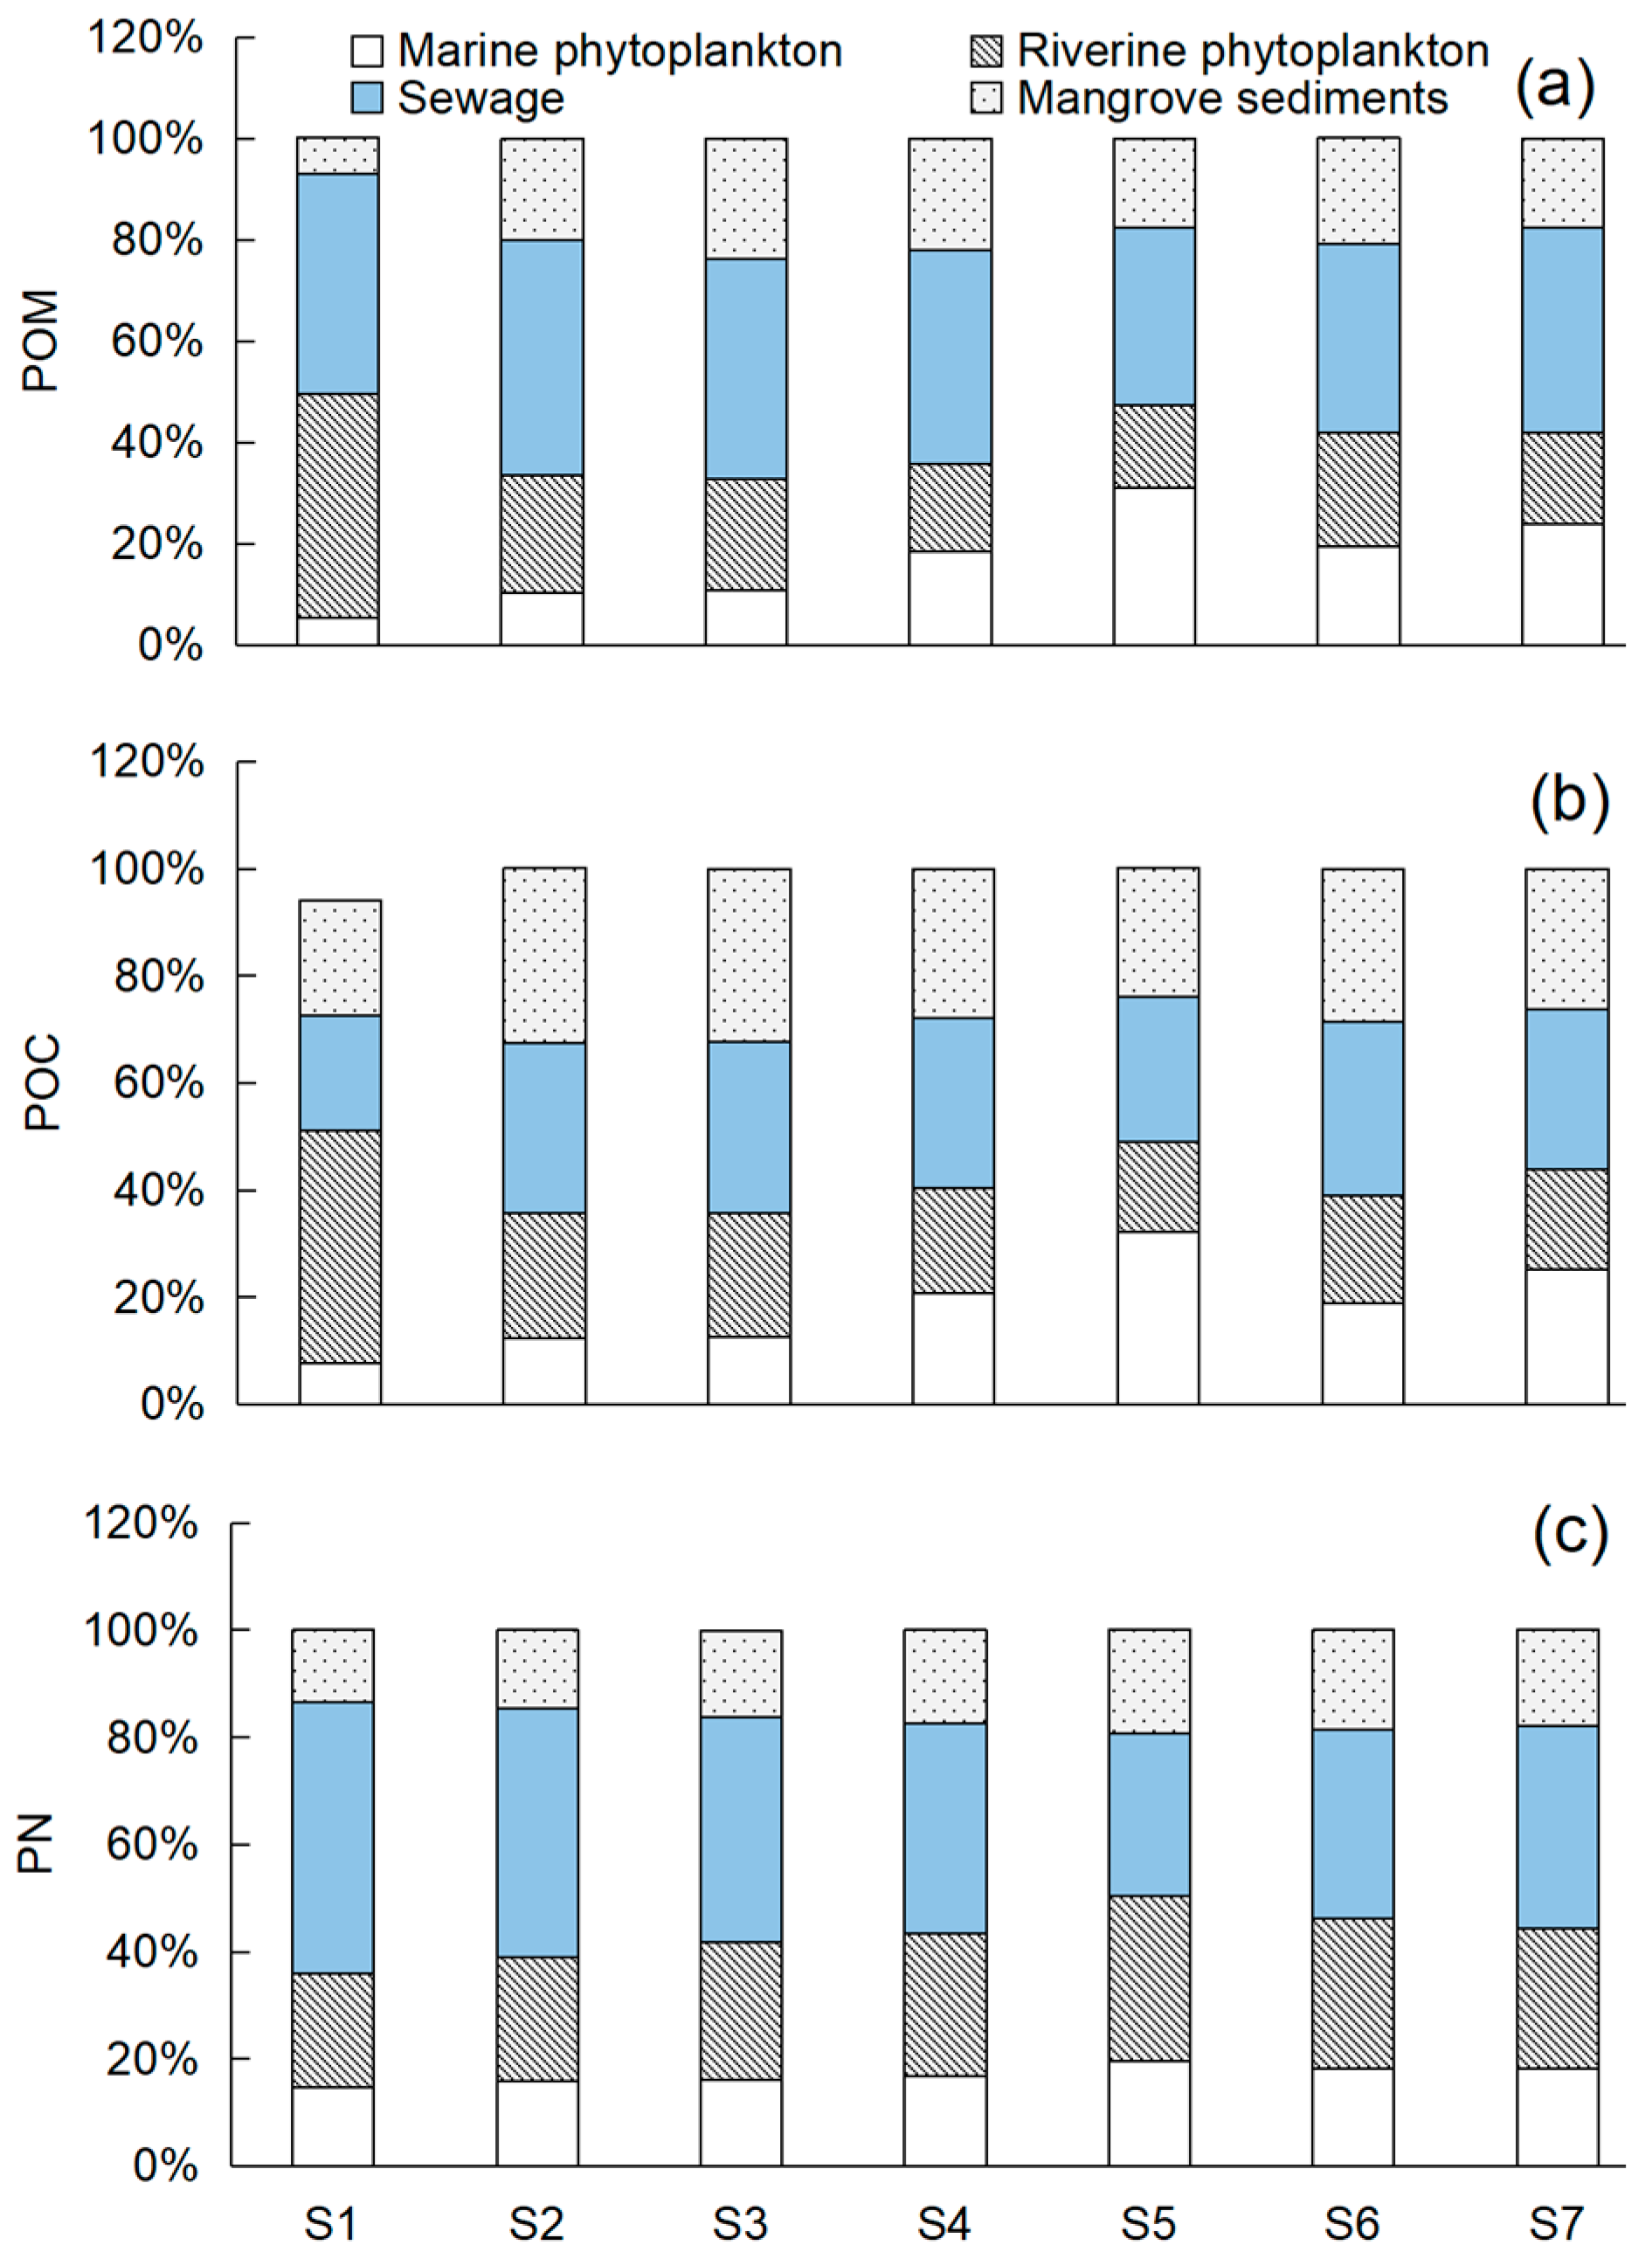
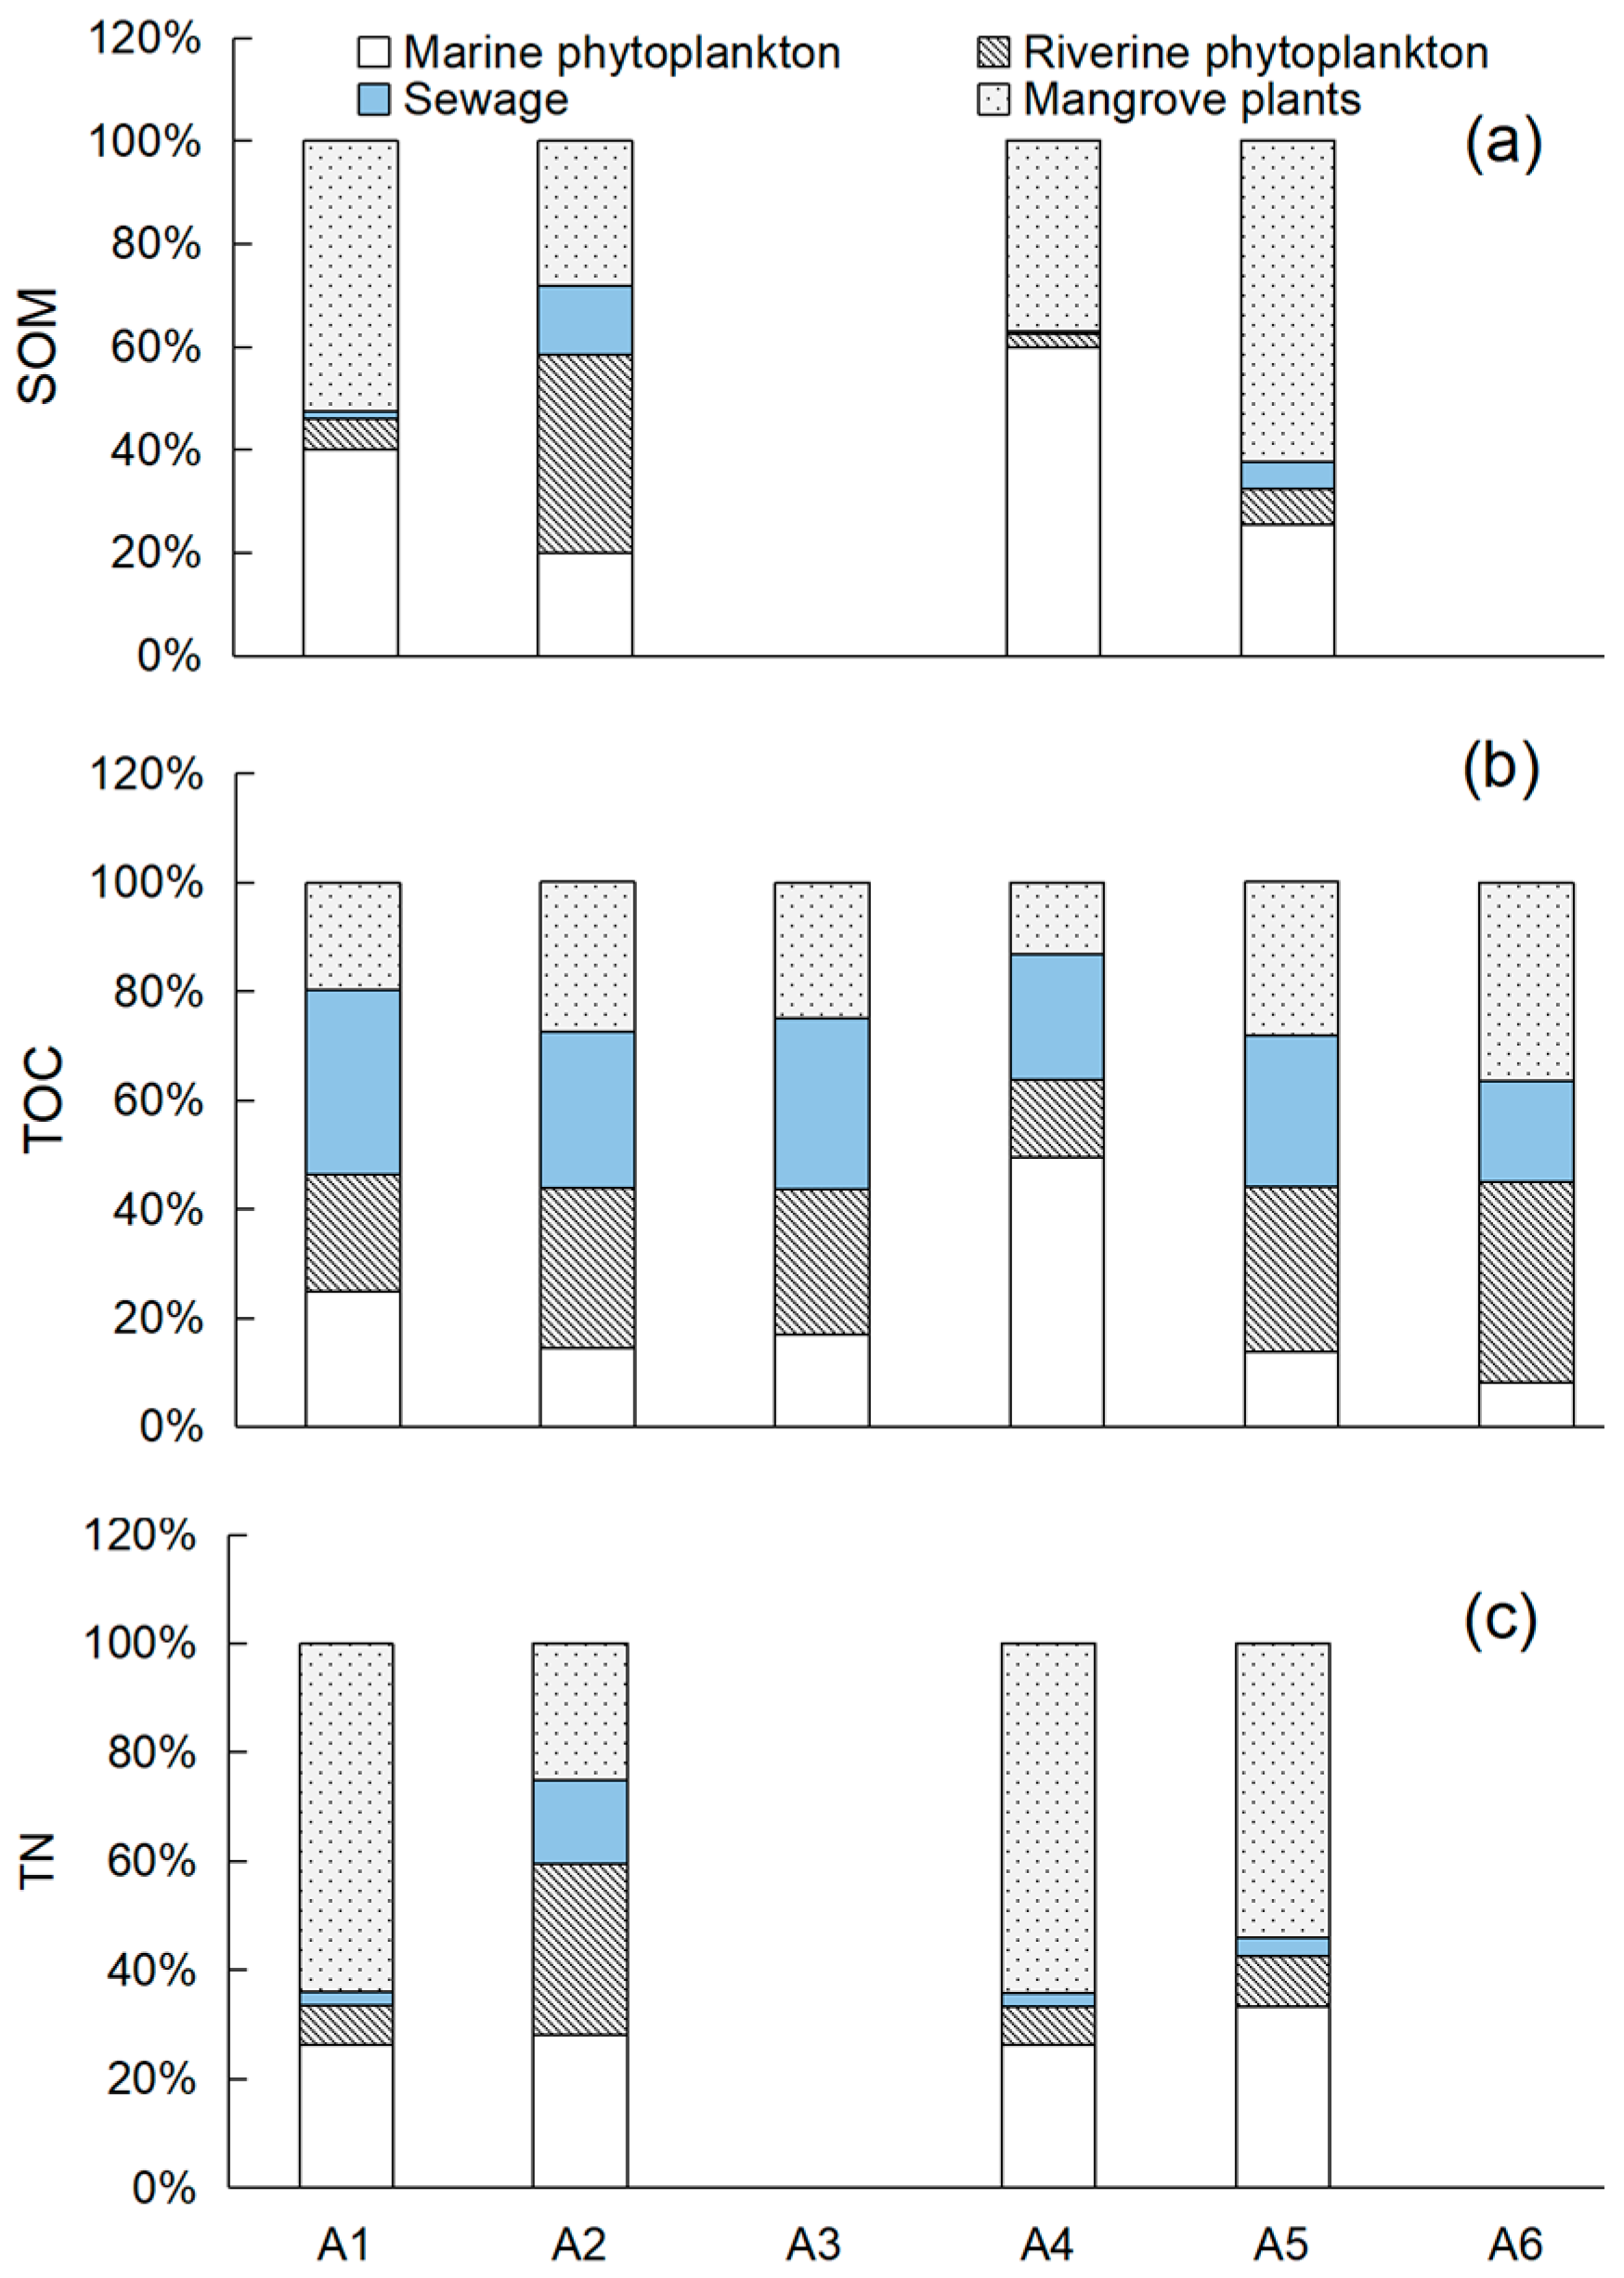
3.3. The Contents and the Isotopic Characters of Organic Matter

The concentrations of POC and PN in the Zhangjiang estuary ranged from 20.7 to 38.7 μmol L−1 (29.5 ± 8.2 μmol L−1, n = 7) and 2.0 to 6.9 μmol L−1 (4.4 ± 1.4 μmol L−1, n = 7), respectively, with both maximums observed at S1 and the minimum at S7 (Figure 2a). The C:N ratio of POM ranged from 5.6 to 7.7 (6.9 ± 0.9, n = 7), with the maximum observed at S5 and the minimum at S2 (Figure 2a). The δ13CPOM and δ15NPOM in the Zhangjiang estuary ranged from −27.4 to −24.1‰ (−25.5 ± 1.0‰, n = 7) and 1.9 to 4.1‰ (3.0 ± 0.7‰, n = 7), respectively, with both maximums observed at S5 and the minimum at S1 (Figure 2b).
The contents of total organic carbon (TOC) and nitrogen (TN) in the mangrove sediments ranged from 2.52 to 4.71% (3.19 ± 0.71%, n = 6) and 0.18% to 0.31% (0.23 ± 0.05%, n = 6), with both maximums observed at A6 and the minimum at A1 and A2, respectively (Figure 2c). The C:N ratio of SOM ranged from 13.1 to 15.3 (14.1 ± 0.9, n = 6), with relatively small variation (Figure 2c). The δ13C and δ15N of the SOM in the surface mangrove sediments (δ13CSOM and δ15NSOM) ranged from −28.6 to −23.2‰ (−26.5 ± 1.8‰, n = 6) and 6.3 to 10.7‰ (9.2 ± 1.6‰, n = 6), with the maximum observed at A4 and A6 and minimum at A6 and A2, respectively (Figure 2d).

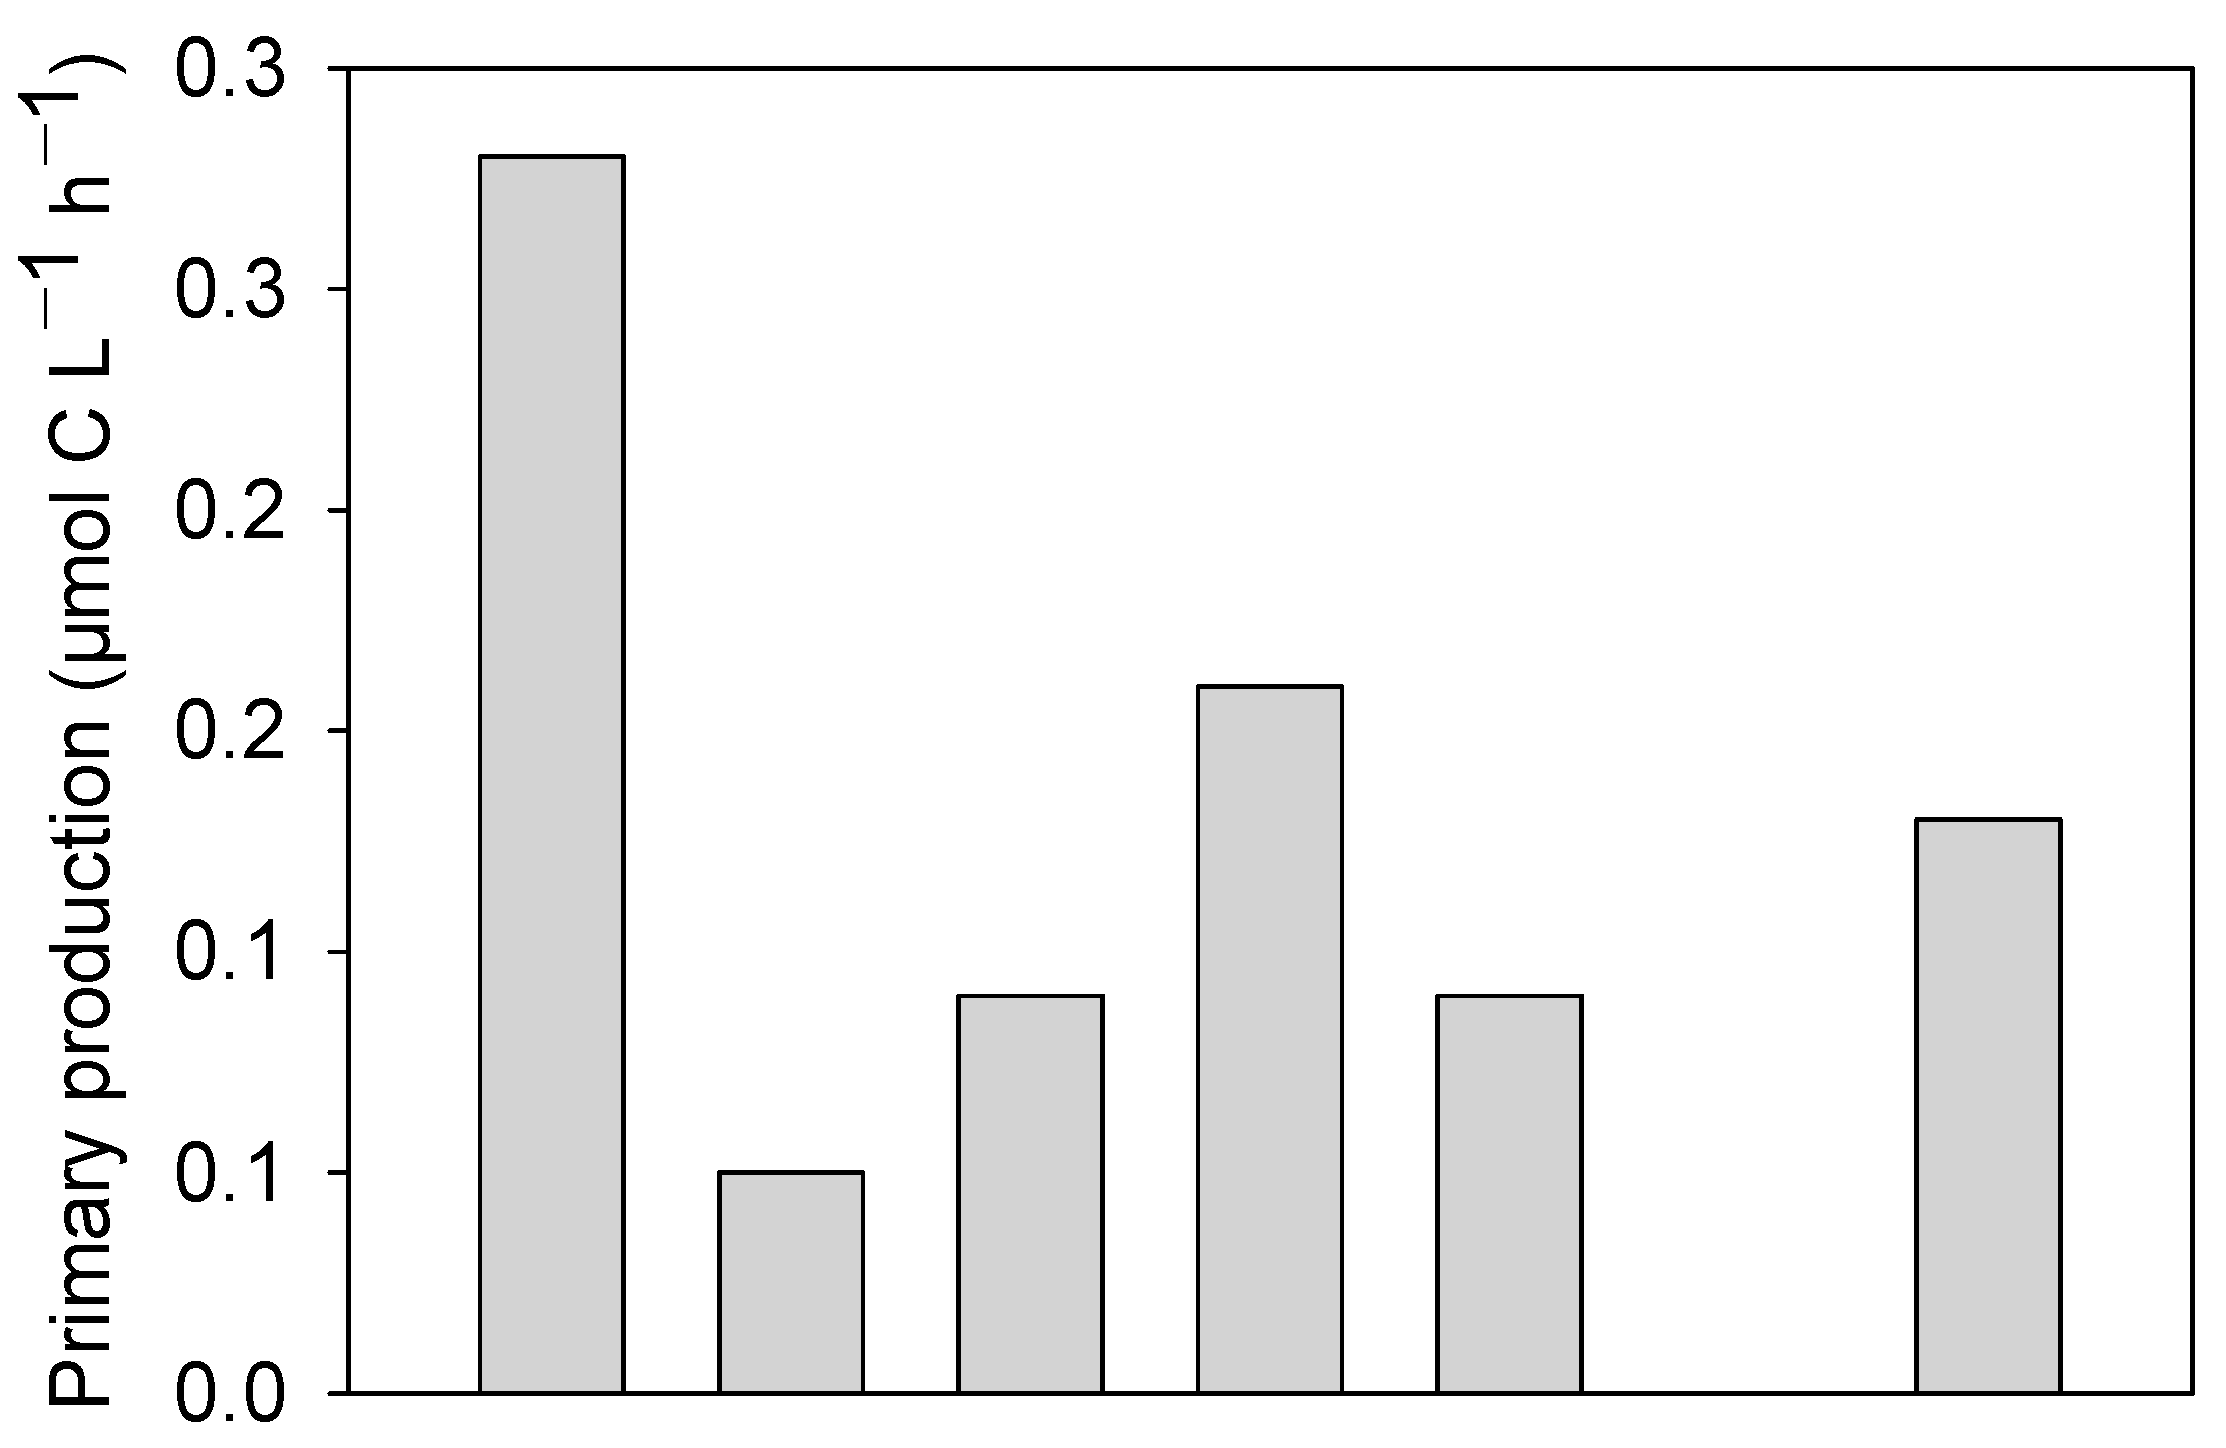
3.4. Primary Production

Surface PP in the Zhangjiang estuary ranged from 0.05 to 0.28 μmol C L−1 h−1 (0.13 ± 0.07 μmol C L−1 h−1, n = 6). The sample observed at S6 was lost. The highest PP was observed at S1, where a bloom of algae was also observed, and the lowest PP was observed at S2. Except for the maximum at S1, PP downstream was higher than that upstream (Figure 3).

4. Discussion

4.1. Contribution of Sewage to Organic Matter

Generally, the observed δ13C and δ15N in this study fell in the range of the reported values in similar areas (Table 3 and Table 4). Covariance between the organic C and N (POC and PN: r = 0.855 p < 0.01 n = 7, TOC and TN: r = 0.947 p < 0.01 n = 6) was observed during our investigation, indicating that δ15N may be more suitable than the widely used C:N ratio for the source analysis of organic matters. Hence, δ13C and δ15N were used to distinguish the contribution of anthropogenic sewage to organic matter in this study.
The major sources of POM in estuaries include the production of phytoplankton, the transport of sewage, and the influx of terrestrial soil [34,35,36,37,38,39,40,41]. For the Zhangjiang estuary, the inputs of the neighboring Yunxiao mangrove sediment may be the major source of terrestrial organic matter [27,28]. Hence, we propose that the POM in the Zhangjiang estuary was mainly composed of organic matter derived from phytoplankton production, sewage, and mangrove sediment. For the Yunxiao mangrove sediment, the production of mangrove plants may be the major source of SOM [2,27,28]. It has been reported that mangrove plants contributed more than 50% of the total carbon storage (95.9 Mg C ha−1) of the Yunxiao mangrove sediment [27]. The influences of anthropogenic sewage may also not be ignored, which may increase the content of SOM by directly importing external organic matter or by promoting the production of mangrove plants and algae [2,8,13]. Hence, SOM in the Yunxiao mangrove may mainly come from the production of mangrove plants, algae, and the inputs of sewage. However, as the benthic algae in Yunxiao mangrove was not collected, and its δ15N value was rarely reported, the contribution of benthic algae was not considered in this study.
Generally, organic matter derived from marine phytoplankton is characterized by higher δ13C (−16–−20‰) and δ15N (6–10‰) [42,43], while that from riverine phytoplankton is characterized by lower δ13C (−34–−26‰) but relatively higher δ15N (~5‰) [2,44]. The δ13C and δ15N of organic matter derived from terrestrial C3 plants (such as mangrove plants) range from −33‰ to −22‰ and 0‰ to 3‰, respectively [45,46], while that derived from terrestrial soil ranges from −27‰ to −24‰ and 0‰ to 2‰, respectively [47,48]. Organic matter in anthropogenic sewage has a similar range of δ13C (−28–−23‰) to terrestrial soil but a larger range of δ15N (−16.4–3‰) [17,23,49,50]. Based on the stable isotope conservation model, the contribution of different sources to the total organic matter can be observed by IsoSource [51]. In this study, the δ13C and δ15N of organic matters derived from mangrove plants (δ13C = −31.1‰, δ15N = 10.6‰, unpublished data, Table S1) and mangrove sediment (δ13C = −26.5‰, δ15N = 9.2‰) were observed by field measurement, while those of organic matters derived from anthropogenic sewage (δ13C = −25.5‰, δ15N = −3.4‰), marine (δ13C = −18‰, δ15N = 9‰), and riverine phytoplankton (δ13C = −30‰, δ15N = 5‰) were set with the median of the reported values [17,23,42,43,44,45,46,47,48,49,50].
According to Figure 4a, all the observed δ13CPOM and δ15NPOM fell into the coverage area of the four end elements. The contributions of the four members to POM, POC, and PN were calculated by IsoSource, respectively, and the results are as follows: 1. anthropogenic sewage was the major source of POM in the study area, accounting for about 35.5–46.5% (41.1 ± 4.0%, n = 7) of the total POM (Figure 5), with a higher contribution to PN (40.2 ± 6.8%, n = 7) than POC (29.5 ± 4.0%, n = 7); 2. riverine phytoplankton was another important source of POM, accounting for about 16.3–44.2% (23.4 ± 9.6%, n = 7) of the total POM, with a similar contribution to POC (23.6 ± 9.1%, n = 7) and PN (25.9 ± 3.1%, n = 7), and the calculated concentration of the POC derived from riverine phytoplankton (POCrphy) had a positive correlation with the contents of phycoerythrin (r = 814, p < 0.05, n = 7), Chl a (r = 771, p < 0.05, n = 7), and PP (r = 856, p < 0.05, n = 7), indicating the reliability of the source analysis; and 3. mangrove sediments and marine phytoplankton had similar contributions to POM (mangrove sediments: 17.1 ± 8.8%, n = 7; marine phytoplankton: 18.5 ± 5.4%, n = 7), while the contribution of mangrove sediments to the POC (27.6 ± 4.1%, n = 7) was obviously higher than that of marine phytoplankton (18.5 ± 8.4%, n = 7).
The source of SOM in the Yunxiao mangrove was also analyzed. Most of the observed δ13CSOM and δ15NSOM fell into the coverage area of the four end elements, except for the δ15NSOM observed at A3 and A6 (Figure 4b). Hence, the source of SOM and TN at A3 and A6 was not analyzed. The high values of δ15NSOM observed at A3 and A6 also indicate another potential source of SOM, most likely the production of benthic algae, which needs to be considered in future research. According to the calculated results, mangrove plants were the major contributor of SOM in the Yunxiao mangrove, accounting for about 21.1–62.4% (45.0 ± 15.4%, n = 4) of the total SOM (Figure 6), with a higher contribution to TN (51.9 ± 18.4%, n = 4) than TOC (24.9 ± 8.0%, n = 6). The production of marine algae was another important source of SOM (Figure 6), accounting for about 36.4 ± 17.6% (n = 4) of the total SOM. In comparison, the contributions of riverine algae (13.5 ± 16.7%, n = 4) and sewage (5.2 ± 5.9%, n = 4) were small. However, when considering the TOC and TN separately, the results are different. For the TOC, the average contribution ratios of the four sources were similar to each other, among which the contribution of sewage was slightly higher than the others (Figure 6). A significant contribution of marine phytoplankton was observed at A4, which is located at the seaward side and is under the strong effect of tide (Figure 1). For TN, the contribution ratio of the sewage was only 6%, which may be due to the following reasons: (1) A large portion of N imported by sewage to the mangrove may be removed by the water exchange between the mangrove and its fringe water. It has been reported that the mangrove ecosystem may be one of the major sources of nitrogen nutrients for its fringe water [10]. (2) The imports of external C may also facilitate the microbial denitrification and anaerobic ammonia oxidation [1,5,8,9,13], most of which are heterotrophic processes [8], which may further accelerate the removal of N from mangroves. Hence, most of the N imported by sewage may be removed from mangroves before being converted to the organic state. In comparison, the organic carbon in sewage, both in the dissolved or particle phase, seems to be more easily conserved in mangrove sediments, mostly due to its higher bioavailability and sedimentation rates [1,8,13,14].
Generally, anthropogenic sewage was the most important contributor to the POM in the Zhangjiang estuary, while mangrove plants were the major source of the SOM in the Yunxiao mangrove sediment. The production of algae (including marine and riverine species) was another important source of organic matter, which contributed about 21.8% of the total POM in the Zhangjiang estuary and 49.8% of the total SOM in the Yunxiao mangrove sediment. In addition, the production of benthic algae may be another source of SOM for the Yunxiao mangrove, which needs to be further investigated in the future.

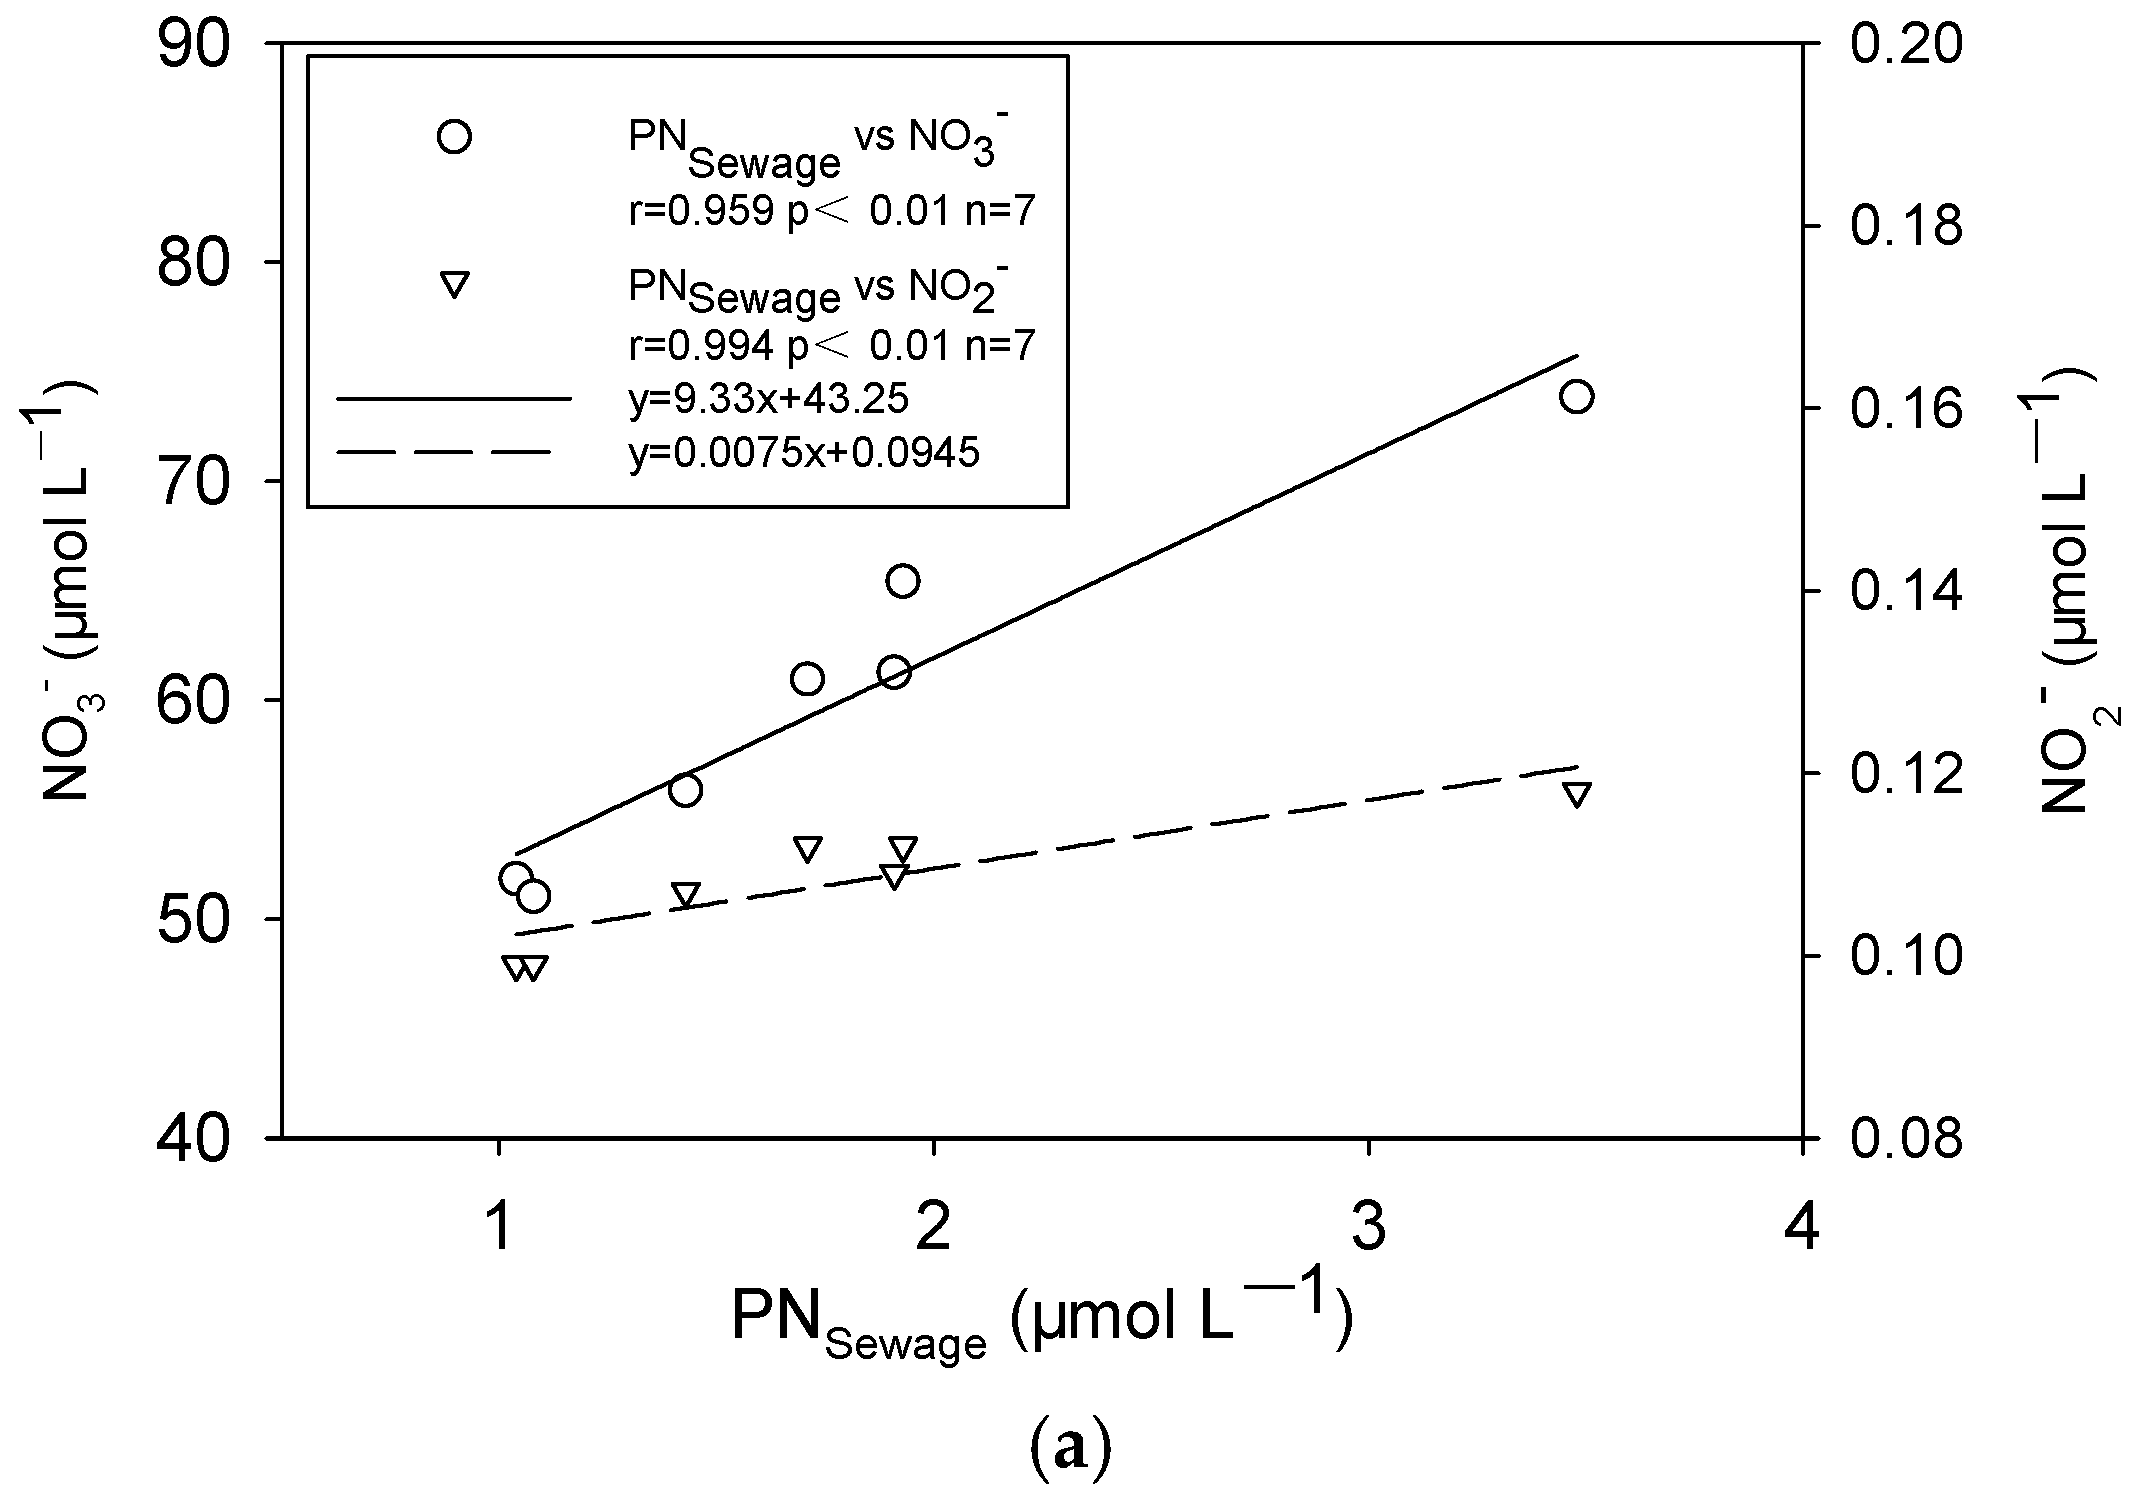
4.2. Potential Effects of Sewage on Organic Matters

The contents and the δ13C and δ15N of organic matter in coastal areas are influenced by many factors, such as the mixture of freshwater and seawater, biological production and degradation, and anthropogenic activities [52,53]. For the eutrophic Zhangjiang mangrove–estuary ecosystem, anthropogenic inputs of sewage may be one of the major regulators of the biogeochemical processes of organic matter. The direct contribution (41.1 ± 4.0%, n = 7) of sewage to the POM in the Zhangjiang estuary was observed in this study, while its potential effects should also be realized. We propose that sewage may potentially impact the contents, the δ13C and δ15N values, and the bioavailability of organic matter in the Zhangjiang mangrove–estuary ecosystem by regulating the biological production and degradation of organic matter.
For the POM in the Zhangjiang estuary, the active production of phytoplankton was closely related to the excess nutrients caused by sewage. It has been reported that the phytoplankton in the Zhangjiang estuary are mainly composed of riverine species [54]. During our investigation, positive correlations between the contents of NO3, Chl a, and POC derived from riverine phytoplankton (POCriverine) were observed (Table 5), indicating the obvious effects of the nutrient availability on the production of local phytoplankton. In addition, the positive correlations between the PN derived from sewage (PNsewage) and the contents of NO3 and NO2 and those between the POC derived from sewage (POCsewage), dissolved organic carbon (DOC, unpublished data, Table S1), and NH4+ were also observed in this study (Figure 7). Hence, we hypothesize that the inputs of PNsewage were closely accompanied by the inputs of NO3 and NO2. After setting the value of PNsewage to zero, the contents of the NO3 and NO2 derived from sources other than sewage were observed. Then, the contribution of the sewage to the total NO3 and NO2 was observed. Similarly, the contribution of sewage to the total NH4+ was observed based on the statistical correlations between the DOC, POCsewage, and NH4+. The results indicate that sewage contributed about 28.9% of the total NO3, 12.2% of the total NO2, and almost 100% of NH4+ in the Zhangjiang estuary. This indicates the strong effects of sewage on the nutrient condition in the study area. The promoted production of phytoplankton caused by the excess nutrients can further influence the δ13CPOM and δ15NPOM, as it may accelerate the accumulation of lighter isotopes (12C and 14N) in biogenic organic matter [55,56]. In this study, the lowest δ13CPOC and δ15NPN were observed at S1, at which a bloom of algae was observed, combined with the maximum of the POC, PN, and PP. In addition, the negative correlation between δ13CPOC, δ15NPN, and the content of Chl a was also observed (Table 5). Hence, the influx of nutrients in sewage may promote the production of phytoplankton and hence potentially influence the contents and the isotopic composition of POM in the Zhangjiang estuary [1,8,13,55,56].
For the SOM in the Yunxiao mangrove, anthropogenic sewage may produce potential effects through the following paths: 1. the external C and N may stimulate the microbial activities in mangrove sediments, such as the degradation of organics, the production of methane, and microbial denitrification [1,8,9], causing the isotope fractionation of C and N [55,56]; 2. the imported nutrients may also promote the production of mangrove plants and algae (planktonic or benthic) in mangroves, potentially increasing the carbon storage of the Yunxiao mangrove [27,28]. In addition, the increasing amounts of biogenic organic matter with higher bioavailability may further facilitate microbial activity [1,8,13], further impacting the isotopic characteristics of SOM. However, the nutrient condition of the Yunxiao mangrove sediment was not directly investigated in this study. Its relationship with the anthropogenic inputs of sewage, combined with its effects on SOM, need to be further investigated in future studies.

5. Conclusions

This study revealed the influences of anthropogenic sewage on the contents and the isotopic characteristics of organic matter in the Zhangjiang mangrove–estuary ecosystem. The major conclusions are as follows: 1. sewage was the major contributor of POM (~41% of the total POM) in the Zhangjiang estuary, while mangrove plants were the major contributor of SOM (~45% of the total SOM) in the Yunxiao mangrove; 2. the production of phytoplankton (including marine and riverine species) was another important source of organic matter in the Zhangjiang mangrove–estuary ecosystem, accounting for about 21.8% of the total POM in the Zhangjiang estuary and 49.8% of the total SOM in the Yunxiao mangrove sediments; and 3. sewage may impact the contents and the isotopic characters of organic matter in the study area by the direct import of organic matter or by promoting the biological production or degradation of organic matter. This study indicates that the δ13C and δ15N of organic matter can efficiently indicate the influences of anthropogenic sewage on the coastal C and N cycles and may provide new insights in understanding the response of coastal areas to the influence of human activities.

Supplementary Materials

The following supporting information can be downloaded at https://www.mdpi.com/article/10.3390/w15203660/s1, Table S1: The δ13C, δ15N of mangrove plants in the Yunxiao mangroves. Table S2: The concentration of dissolved organic carbon in the Zhangjiang estuary.

Author Contributions

Conceptualization, D.L.; methodology, D.L.; software, J.L.; formal analysis, D.L.; investigation, D.L., T.C. (Tianshu Chu), and Z.L.; data curation, D.L.; writing—original draft preparation, D.L.; writing—review and editing, D.L., J.Y. and T.C. (Tajen Chu); funding acquisition, D.L. All authors have read and agreed to the published version of the manuscript.

Funding

This work was supported by the National Natural Science Foundation of China (42306053), the Natural Science Foundation of Fujian Province, China (2021J05156, 2020J01667), and the Open fund of the Key Laboratory of Global Change and Marine-Atmospheric Chemistry (GCMAC2310).

Data Availability Statement

Not available.

Acknowledgments

We are grateful to the Zhangjiangkou Wetland Ecosystem Field Research Base of Xiamen University for the help while sampling and the sharing of background information.

Conflicts of Interest

The authors declare no conflict of interest.

References

  1. Alongi, D.M. Carbon cycling and storage in mangrove forests. Annu. Rev. Mar. Sci. 2014, 6, 195–219. [Google Scholar] [CrossRef]
  2. Bianchi, T.S. The Role of Terrestrially derived organic carbon in the coastal ocean: A changing paradigm and the priming effect. Proc. Natl. Acad. Sci. USA 2011, 108, 19473–19481. [Google Scholar] [CrossRef] [PubMed]
  3. Wu, H.; Liu, J.L.; Bi, X.Y.; Lin, G.H.; Feng, C.C.; Li, Z.J.; Qi, F.; Zheng, T.L.; Xie, L.Q. Trace metals in sediments and benthic animals from aquaculture ponds near a mangrove wetland in Southern China. Mar. Pollut. Bull. 2017, 117, 486–491. [Google Scholar] [CrossRef] [PubMed]
  4. Wu, H.; Peng, R.; Yang, Y.; He, L.; Wang, W.Q.; Zheng, T.L.; Lin, G.H. Mariculture pond influence on mangrove areas in South China: Significantly larger nitrogen and phosphorus loadings from sediment wash-out than from tidal water exchange. Aquaculture 2014, 426–427, 204–212. [Google Scholar] [CrossRef]
  5. Trott, L.A.; Alongi, D.M. The impact of shrimp pond effluent on water quality and phytoplankton biomass in a tropical mangrove estuary. Mar. Pollut. Bull. 2000, 40, 947–951. [Google Scholar] [CrossRef]
  6. Howarth, L.M.; Filgueira, R.; Jiang, D.; Koepke, H.; Frame, M.K.; Buchwald, C.; Finnis, S.; Chopin, T.; Grant, J. Using acroalgal bioindicators to map nutrient plums from fish farms and ohter source at a bay-wide scale. Aquac. Env. Interac. 2019, 11, 671–684. [Google Scholar] [CrossRef]
  7. Pendleton, L.; Donato, D.C.; Murray, B.C.; Crooks, S.; Jenkins, W.A.; Sifleet, S.; Craft, C.; Fourqurean, J.W.; Kauffman, J.B.; Marbà, N.; et al. Estimating global “blue carbon” emissions from conversion and degradation of vegetated coastal ecosystems. PLoS ONE 2012, 7, e43542. [Google Scholar] [CrossRef]
  8. Reis, C.R.G.; Reed, S.C.; Oliveira, R.S.; Nardoto, G.B. Isotopic evidence that nitrogen enrichment intensifies nitrogen losses to the atmosphere from subtropical mangroves. Ecosystems 2019, 22, 1126–1144. [Google Scholar] [CrossRef]
  9. Chen, G.C.; Chen, B.; Yu, D.; Tam, N.; Ye, Y.; Chen, S.Y. Soil greenhouse gas emissions reduce the contribution of mangrove plants to the atmospheric cooling effect. Environ. Res. Lett. 2016, 11, 124019. [Google Scholar] [CrossRef]
  10. Wang, F.F.; Xiao, K.; Santos, I.R.; Lu, Z.Y.; Tamborski, J.; Wang, Y.; Yan, R.F.; Chen, N.W. Porewater exchange drives nutrient cycling and export in a mangrove-salt marsh ecotone. J. Hydrol. 2022, 606, 127401. [Google Scholar] [CrossRef]
  11. Gu, X.X.; Qiao, P.Y.; Krauss, K.K.; Lovelock, C.E.; Adams, J.B.; Chapman, S.K.; Jennerjahn, T.C.; Lin, Q.L.; Chen, L.Z. Changes in mangrove blue carbon under elevated atmospheric CO2. Ecosyst. Health Sust. 2023, 9, 0033. [Google Scholar] [CrossRef]
  12. Mckinnon, A.D.; Trott, L.A.; Alongi, D.M.; Davidson, A. water column production and nutrient characteristics in mangrove creeks receiving shrimp farm effluent. Aquac. Res. 2002, 33, 55–73. [Google Scholar] [CrossRef]
  13. Kristensen, E.; Bouillon, S.; Dittmar, T.; Marchand, C. Organic carbon dynamics in mangrove ecosystems: A review. Aquat. Bot. 2008, 89, 201–219. [Google Scholar] [CrossRef]
  14. Guallar, C.; Flos, J. Linking phytoplankton primary production and chromophoric dissolved organic matter in the sea. Prog. Oceanogr. 2019, 176, 102116. [Google Scholar] [CrossRef]
  15. Castillo, J.A.A.; Apan, A.A.; Maraseni, T.N.; Salmo, S.G. Soil greenhouse gas fluxes in tropical mangrove forests and in land uses on deforested mangrove lands. Catena 2017, 159, 60–69. [Google Scholar] [CrossRef]
  16. Ho, D.T.; Ferrón, S.; Engel, V.C.; Larsen, L.G.; Barr, J.G. Air-water gas exchange and CO2 flux in a mangrove-dominated estuary. Geophys. Res. Lett. 2014, 41, 108–113. [Google Scholar] [CrossRef]
  17. Liu, K.K.; Kao, S.J.; Wen, L.S.; Chen, K.L. Carbon and nitrogen isotopic compositions of particulate organic matter and biogeochemical processes in the eutrophic Danshuei esturary in Northern Taiwan. Sci. Total Environ. 2007, 382, 103–120. [Google Scholar] [CrossRef]
  18. Yang, B.; Cao, L.; Liu, S.M.; Zhang, G.S. Biogeochemistry of bulk organic matter and biogenic elements in surface sediments of the Yangtze River estuary and Adjacent Sea. Mar. Pollut. Bull. 2015, 96, 471–484. [Google Scholar] [CrossRef]
  19. Hu, J.F.; Peng, P.A.; Jia, G.D.; Mai, B.X.; Zhang, G. Distribution and sources of organic carbon, nitrogen and their isotopes in sediments of the subtropical Pearl River estuary and the adjacent shelf, Southern China. Mar. Chem. 2006, 98, 274–285. [Google Scholar] [CrossRef]
  20. Wu, Y.; Zhang, J.; Li, D.J.; Lu, H.W.X. Isotope variability of particulate organic matter at the PN section in the East China Sea. Biogeochemistry 2003, 65, 31–49. [Google Scholar] [CrossRef]
  21. Cifuentes, L.A.; Sharp, J.H.; Fogel, M.L. Stable carbon and nitrogen isotope biogeochemistry in the Delaware Estuary. Limnol. Oceanogr. 1988, 33, 1102–1115. [Google Scholar] [CrossRef]
  22. Granger, J.; Sigman, D.M.; Rohde, M.M.; Maldonado, M.T.; Tortell, P.D. N and O isotope effects during nitrate assimilation by unicellular prokaryotic and eukaryotic plankton cultures. Geochim. Cosmochim. Acta 2010, 74, 1030–1040. [Google Scholar] [CrossRef]
  23. Andrews, J.E.; Greenaway, A.M.; Dennis, P.F. Combined carbon isotope and C/N ratios as indicators of source and fate of organic matter in a poorly flushed, tropical estuary: Hunts bay, Kingston harbour, Jamaica. Estuar. Coast. Shelf Sci. 1998, 46, 743–756. [Google Scholar] [CrossRef]
  24. Sweeney, R.E.; Kalil, E.K.; Kaplan, I.R. Characterization of domestic and industrial sewage in Southern California coastal sediments using nitrogen, carbon, sulphur and uranium tracers. Mar. Environ. Res. 1980, 3, 225–243. [Google Scholar] [CrossRef]
  25. Wada, E.; Minagawa, M.; Mizutani, H.; Tsuji, T.; Karasawa, K. Biogeochemical studies on the transport of organic matter along the Otsuchi river watershed, Japan. Estuar. Coast. Shelf Sci. 1987, 25, 321–336. [Google Scholar] [CrossRef]
  26. Hama, T.; Miyazaki, T.; Ogawa, Y.; Iwakuma, T.; Takahashi, M.; Otsuki, A.; Ichimura, S. Measurement of photosynthetic production of a marine phytoplankton population using a stable 13C isotope. Mar. Biol. 1983, 73, 31–36. [Google Scholar] [CrossRef]
  27. Gao, Y. Studies on Distribution Patterns of and Controlling Factors for Soil Carbon Pools of Selected Mangrove Wetlands in China. Ph.D. Thesis, Tsinghua University, Beijing, China, 2019. (In Chinese with English Abstract). [Google Scholar]
  28. Bai, Y. Investigating the Distribution and Sources of Organic Matter in Surface Sediment of Mangrove Wetland in Zhangjiang Estuary (China) Using Elemental, Isotopic and Fatty Acid Biomarkers. Master’s Thesis, Xiamen University, Fujian, China, 2009. (In Chinese with English Abstract). [Google Scholar]
  29. Wu, G. Organic Carbon Sources and Microbial Carbon Assimilation in Mangrove Ecosystems. Ph.D. Thesis, Xiamen University, Fujian, China, 2018. (In Chinese with English Abstract). [Google Scholar]
  30. Machiwa, J.F. Spatial zonation of benthic macrofauna and possible effects of sewage discharge on it in Futian mangrove swamp, Shenzhen. Tanz. J. Sci. 2000, 26, 15–28. [Google Scholar] [CrossRef]
  31. Zhang, J.; Wu, Y.; Jennerjahn, T.C.; Ittekkot, V.; He, Q. Distribution of organic matter in the Changjiang (Yangtze river) estuary and their stable carbon and nitrogen isotopic ratios: Implications for source discrimination and sedimentary dynamics. Mar. Chem. 2007, 106, 111–126. [Google Scholar] [CrossRef]
  32. Mou, X.Y. The Isotopic Composition of Carbon and Nitrogen in Suspended Particulate Organic Matter in the Daya Bay and the Jiaozhou Bay. Master’s Thesis, Xiamen University, Fujian, China, 2018. (In Chinese with English Abstract). [Google Scholar]
  33. Sigleo, A.C.; Macko, S.A. Carbon and Nitrogen Isotopes in Suspended Particles and Colloids, Chesapeake and San Francisco Estuaries, U.S.A. Estuar. Coast. Shelf Sci. 2002, 54, 701–711. [Google Scholar] [CrossRef]
  34. Tucker, J.; Sheats, N.; Giblin, A.E.; Hopkinson, C.; Montoya, J.P. Using stable isotopes to trace sewage derived material through Boston harbor and Massachusetts bay. Mar. Environ. Res. 1999, 48, 353–375. [Google Scholar] [CrossRef]
  35. Ostrom, N.E.; Macko, S.A.; Deibel, D.; Thompson, R.J. Seasonal variation in the stable carbon and nitrogen isotope biogeochemistry of a coastal cold ocean environment. Geochim. Cosmochim. Acta 1997, 61, 2929–2942. [Google Scholar] [CrossRef]
  36. Mcclelland, J.W.; Valiela, I. Linking nitrogen in estuarine producers to land derived sources. Limnol. Oceanogr. 1998, 43, 577–585. [Google Scholar] [CrossRef]
  37. Lehmann, M.F.; Bernasconi, S.M.; Barbieri, A.; McKenzie, J.A. Preservation of organic Matter and alteration of its carbon and nitrogen isotope composition during simulated and in Situ early sedimentary diagenesis. Geochim. Cosmochim. Acta 2002, 66, 3573–3584. [Google Scholar] [CrossRef]
  38. Wang, X.C.; Ma, H.Q.; Li, R.H.; Song, Z.S.; Wu, J.P. Seasonal fluxes and source variation of organic carbon transported by two major Chinese rivers: The Yellow river and Changjiang (Yangtze) river. Glob. Biogeochem. Cycles 2012, 26, GB2025.1–10. [Google Scholar] [CrossRef]
  39. Yu, F.L.; Zong, Y.Q.; Lloyd, J.M.; Huang, G.Q.; Leng, M.J.; Kendrick, C.; Lamb, A.L.; Yim, W.W. Bulk organic δ13C and C/N as indicators for sediment sources in the Pearl river delta and estuary, Southern China. Estuar. Coast. Shelf Sci. 2010, 87, 618–630. [Google Scholar] [CrossRef]
  40. Cai, D.L.; Tan, F.C.; Edmond, J.M. Sources and transport of particulate organic carbon in the Amazon river and estuary. Estuar. Coast. Shelf Sci. 1988, 26, 1–14. [Google Scholar] [CrossRef]
  41. Mortillaro, J.M.; Abril, G.; Moreira-Turcq, P.; Sobrinho, R.L.; Perez, M.; Meziane, T. Fatty acid and stable isotope (δ13C, δ15N) signatures of particulate organic matter in the lower Amazon river: Seasonal contrasts and connectivity between Floodplain lakes and the mainstem. Org. Geochem. 2011, 42, 1159–1168. [Google Scholar] [CrossRef]
  42. Hamilton, S.K.; Lewis, W.M., Jr. Stable carbon and nitrogen isotopes in algae and detritus from the Orinoco river floodplain, Venezuela. Geochim. Cosmochim. Acta 1992, 56, 4237–4246. [Google Scholar] [CrossRef]
  43. Kuramoto, T.; Minagawa, M. Stable Carbon and nitrogen isotopic characterization of organic matter in a mangrove ecosystem on the Southwestern coast of Thailand. J. Oceanogr. 2001, 57, 421–431. [Google Scholar] [CrossRef]
  44. Bristow, L.A.; Jickells, T.D.; Weston, K.; Marca, A.D.; Parker, E.R.; Andrews, J.E. Tracing estuarine organic matter sources into the Southern North sea using C and N isotopic signatures. Biogeochemistry 2013, 113, 9–22. [Google Scholar] [CrossRef]
  45. Benner, R.; Fogel, M.L.; Sprague, E.K.; Hodson, R.E. Depletion of 13C in lignin and its implications for stable carbon isotope studies. Nature 1987, 329, 708–710. [Google Scholar] [CrossRef]
  46. Boschker, H.T.; Moerdijk, T.C.; Breugel, P.V.; Houtekamer, M.; Middelburg, J.J. A versatile method for stable carbon isotope analysis of carbohydrates by high performance liquid chromatography and isotope ratio mass spectrometry. Rapid Commun. Mass Spectrom. 2008, 22, 3902–3908. [Google Scholar] [CrossRef] [PubMed]
  47. Mccallister, S.L.; Bauer, J.E.; Ducklow, H.W.; Canuel, E.A. Sources of estuarine dissolved and particulate organic matter: A multi-tracer approach. Org. Geochem. 2006, 37, 454–468. [Google Scholar] [CrossRef]
  48. Qian, Y.; Ii, M.C.K.; Svalberg, J.; Walker, J. Suspended particulate organic matter (SPOM) in gulf of Mexico estuaries: Compound specific isotope analysis and plant pigment compositions. Org. Geochem. 1996, 24, 875–888. [Google Scholar] [CrossRef]
  49. Thornton, S.F.; McManus, J. Application of organic carbon and nitrogen stable isotope and C/N ratios as source indicators of organic matter provenance in estuarine systems evidence from the Tay estuary, Scotland. Estuar. Coast. Shelf. Sci. 1994, 38, 219–233. [Google Scholar] [CrossRef]
  50. Debruyn, A.M.H.; Rasmussen, J.B. Quantifying assimilation of sewage derived organic matter by riverine benthos. Ecol. Appl. 2002, 12, 511–520. [Google Scholar] [CrossRef]
  51. Phillips, D.L.; Gregg, J.W. Source partitioning using stable isotopes: Coping with too many sources. Oecologia 2003, 136, 261–269. [Google Scholar] [CrossRef]
  52. Green, P.A.; Vörösmarty, C.J.; Meybeck, M.; Galloway, J.N.; Peterson, B.J.; Boyer, E.W. Preindustrial and contemporary fluxes of nitrogen through rivers: A global assessment based on typology. Biogeochemistry 2004, 68, 71–105. [Google Scholar] [CrossRef]
  53. Neumann, B.; Vafeidis, A.T.; Zimmermann, J.; Nicholls, R.J. Future coastal population growth and exposure to sea level rise and coastal flooding: A global assessment. PLoS ONE 2015, 10, e0118571. [Google Scholar] [CrossRef]
  54. Chen, C.P.; Gao, Y.H.; Lin, P. Seasonal change of phytoplankton community in waters of mangrove in the estuarine of the Zhangjiang river, Fujiang Province, China. Mar. Sci. 2007, 31, 25–31. [Google Scholar] [CrossRef]
  55. Altabet, M.A.; Francois, R. Nitrogen isotope biogeochemistry of the Antarctic Polar Frontal Zone at 170°W. Deep. Sea Res. Part II Top. Stud. Oceanogr. 2001, 48, 4247–4273. [Google Scholar] [CrossRef]
  56. DiFiore, P.J.; Sigman, D.M.; Karsh, K.L.; Trull, T.W.; Dunbar, R.B.; Robinson, R.S. Poleward decrease in the isotope effect of nitrate assimilation across the Southern Ocean. Geophys. Res. Lett. 2010, 37, L17601. [Google Scholar] [CrossRef]
Figure 1. The sampling stations in Zhangjiang mangrove–estuary ecosystem.
Water 15 03660 g001
Figure 2. The contents, C:N ratios, and the isotopic characters of organic matter: (a) the contents and the C:N ratio of particulate organic carbon and nitrogen; (b) the δ13C and δ15N of particulate organic matter; (c) the contents and the C:N ratio of soil organic carbon and nitrogen; and (d) the δ13C and δ15N of soil organic matter.
Water 15 03660 g002aWater 15 03660 g002b
Figure 3. The surface primary production in the Zhangjiang estuary.
Water 15 03660 g003
Figure 4. The relationship between δ13C and δ15N of organic matter: (a) particulate organic matter in the Zhangjiang estuary; (b) soil organic matter in the Yunxiao mangrove.
Water 15 03660 g004
Figure 5. The contribution of the major sources to particulate organic matters: (a) particulate organic matters (POM); (b) particulate organic carbon (POC); and (c) particulate nitrogen (PN).
Water 15 03660 g005
Figure 6. The contribution of the major sources to soil organic matters: (a) soil organic matters (SOM); (b) total organic carbon (TOC); and (c) total nitrogen (TN).
Water 15 03660 g006
Figure 7. The results of Pearson’s correlation analysis: (a) the correlations between particulate nitrogen derived from sewage (PNsewage) with NO3 and NO2; (b) the correlations between particulate organic carbon derived from sewage (POCsewage) with dissolved organic carbon (DOC, unpublished data) and NH4+.
Water 15 03660 g007aWater 15 03660 g007b
Table 1. The physicochemical parameters at the sampled stations in the Zhangjiang estuary.
StationT (°C)SDO (mg L−1)Phycoerythrin (μg L−1)Chl a (μg L−1)
S117.720.05.814.944.03
S217.620.36.043.273.40
S317.519.16.433.853.31
S417.520.46.082.192.48
S517.620.56.301.712.51
S618.020.37.791.751.76
S717.622.36.510.6991.96
Table 2. The concentration of dissolved inorganic nutrients at the sampled stations.
StationNO3NO2NH4+PO43−SiO32−
S173.80.118621.73.3498.6
S261.00.1121067.02.9189.9
S365.40.11214273.73101.5
S461.30.10918993.0392.4
S555.90.107895.33.0789.5
S651.80.0986605.62.9977.4
S751.00.0993836.33.2280.3
Note: The unit of the concentration of nutrients is μmol L−1.
Table 3. δ13C and δ15N of soil organic matter in mangrove sediments.
Research Areasδ13C (‰)δ15N (‰)References
Yunxiao mangrove sediments−28.6–−23.26.3–10.7This study
Yunxiao mangrove sediments−25.5–−21.6 4.7–7.8[27,28]
Gaoqiao mangrove sediments−26.68 ± 0.38-
Dongzhai harbor mangrove sediments−24.87 ± 1.76 -
Wenchang mangrove sediments−26.29 ± 1.02 -
Jiulong River estuary mangrove sediments−28.2–−23.02.4–11.2[29]
Futian mangrove sediments−28.0 ± 0.3 -[30]
Table 4. δ13C and δ15N of particulate organic matter in estuaries and gulfs.
Research Areasδ13C (‰)δ15N (‰)References
Zhangjiang esturay−27.1~−24.11.9 ~ 4.1This study
Danshuei estuary−25.5~−19.0−16.4~3.8[17]
Yangtze river−29.2~−25.82.4~7.0[31]
Daya bay−25.7~−16.9−6.3~10.4[32]
Jiaozhou bay−28.6~−21.2−3.1~13.2[33]
Potomac river−27.3~−18.43.1~11.6
Chesapeake bay−26.9~−17.55.0~9.5
San Francisco bay−26.4~−26.00.7~1.0
Boston harbor−26.9~−17.55.0~9.5[34]
Delaware estuary−23.1~−18.75.5~12.2[21]
Conception bay−27.2~−21.63.7~8.4[35]
Traverse bay−30.7~−23.91.7~11.6[36]
Lugao bay−29.9~−26.94.7~7.0[37]
Yellow river−25.6~−23.1-[38]
Pearl river−25.6~−24.3-[39]
Amazon river−28.4~−17.53.6 ± 1.5[40,41]
Table 5. The results of Pearson’s correlation analysis.
Chl a (μg L−1)NO3 (μmol L−1)
POCriveriner = 0.771 p < 0.01 n = 7r = 0.896 p < 0.01 n = 7
δ13CPOMr = −0.802 p < 0.05 n = 7r = −0.833 p < 0.05 n = 7
δ15NPOMr = −0.835 p < 0.05 n = 7r = −0.810 p < 0.05 n = 7
Disclaimer/Publisher’s Note: The statements, opinions and data contained in all publications are solely those of the individual author(s) and contributor(s) and not of MDPI and/or the editor(s). MDPI and/or the editor(s) disclaim responsibility for any injury to people or property resulting from any ideas, methods, instructions or products referred to in the content.

