Article

Impact of Water Level Fluctuation on Microplastic Transportation and Redistribution in a Floodplain Lake System

1
College of Water Conservancy and Hydropower Engineering, Hohai University, Nanjing 210024, China
2
Jiangxi Water Resources Institute, Nanchang 330013, China
3
College of Hydraulic and Civil Engineering, Xinjiang Agricultural University, Urumqi 830052, China
4
China Railway Water Conservancy & Hydropower Planning and Design Group Co., Ltd., Nanchang 330029, China
*
Author to whom correspondence should be addressed.
Water 2023, 15(20), 3658; https://doi.org/10.3390/w15203658
Submission received: 15 July 2023 / Revised: 16 September 2023 / Accepted: 25 September 2023 / Published: 19 October 2023
(This article belongs to the Section Hydraulics and Hydrodynamics)

Abstract

:
Microplastic contamination is a challenge in aquatic systems. Among these, floodplains exhibit their cyclical hydrological patterns with substantial fluctuations in water levels caused by annual floods or discharges from rivers into lakes. The influence of water level fluctuation on microplastics within complex floodplain systems has received limited attention in existing studies. This study employs hydrological data and a physics-based hydrodynamic model to assess the effects of water level fluctuations on the transport and redistribution of microplastics within Poyang Lake from 2018 to 2025. High spatiotemporal distribution variability in microplastic concentrations was found within the flood and drought periods. Furthermore, the residence rate of microplastics was assessed based on the microplastic concentration variations in the computational time. A gradual drop in the average discharge rate of microplastics was assessed at the outlet of Poyang Lake. The microplastics are more likely to drain into the Yangtze River in the high water-level period. Meanwhile, under the influence of hydrodynamics, local topography, and water level fluctuation, an accumulation of microplastics appears on the shallow shoals of the western and eastern regions of Poyang Lake, especially in the Gan River. Overall, by means of numerical simulation, the aim of our study is to serve as a reference and advance our understanding of the transportation patterns of microplastics at the aquatic–terrestrial interface.

1. Introduction

Microplastics (MPs), which refer to plastic particles smaller than 5 mm in size, have been the subject of numerous studies worldwide. This attention is driven by the significant influx of plastic debris into both terrestrial and aquatic environments each year, leading to their widespread distribution from soil to water and even the atmosphere [1,2,3,4,5]. Two primary categories of microplastics have been distinguished based on their sources. Primary microplastics originate from products such as cosmetics, paints, and textiles found in household wastewater, as well as from plastic industry pellets. Secondary microplastics arise from the fragmentation of larger plastic materials, primarily due to processes such as biodegradation, physical wear, photodegradation, and chemical breakdown [6,7,8,9]. Considering their capability and migration capacity in chemical pollutants and pathogens, microplastics inevitably accumulate and have an adverse impact on the human body through the food chain [10,11,12,13]. In recent years, an increasing number of researchers have recognized the significance of microplastics in natural environments due to their potential to cause substantial environmental pollution.
To date, only a limited number of studies have investigated the characteristics of microplastics within lake systems when compared to other aquatic systems such as oceans or rivers [14,15,16]. Nevertheless, insights from modeling work [17] revealed that over 95.3% of mismanaged plastic waste has been localized on land since the 1960s, thereby constituting a significant pool of plastic debris within terrestrial systems. In this context, lakes, with their widespread distribution across various countries and regions, have emerged as effective indicators of localized microplastic pollution [18]. Once microplastics are transported into a lake system, their trajectory patterns within the system are in response to adjacent circulation patterns and diffusion processes [19]. It is generally accepted that relatively lower flow rates in lake systems lead to relatively stable circulation systems between the water body and sediment layer, subsequently allowing for microplastics to be deposited. Therefore, particularly in stagnant regions, when microplastic particles are introduced to the systems, there is a possibility that a portion of the total amount of microplastics could become trapped either temporarily or permanently [20]. The longer plastic debris is retained in a system, the more likely it tends to undergo complex biotic and abiotic processes, including, but not limited to, weathering and degradation, the release of toxic compounds and heavy metals, or microbial colony formation on its surface [21]. In addition, variations in hydrodynamic conditions such as water level have a nonnegligible influence on the transport of microplastics in floodplain lake systems. A few previous studies have investigated the variations in microplastic concentrations in river and lake sediments in response to water level fluctuations [22,23]. For instance, Garello et al. [24] conducted field observations in river-side bars and observed a decrease in microplastic (MP) concentrations as the water level dropped. This finding aligns with Campanale et al. [25], who established a positive correlation between MP concentration, water level, and flow velocity in the Ofanto river. Hengstmann et al. [26] noted higher MP concentrations in lakeshore sediments during March, attributed to elevated water levels compared to September. Thus, the positive statistical correlation between the microplastic concentrations and the water level may be attributed to the relatively long residence time of microplastics during the flood period, and the increased number of microplastics transported from land to lake is linked with high water levels.
In contrast to laboratory and field observations of microplastics in aquatic systems, the modelling of plastic transportation is still at a relatively early stage. Coupled hydrodynamic and Lagrangian particle tracking models can reveal the movement of plastic debris and the distribution of floating plastic pollutants across various regions of the world’s oceans, at either a basin or subbasin level [27,28,29]. However, microplastics originating from uniformly distributed sources and either open boundary problem or beaching processes were overlooked, leading to substantial discrepancies among these numerical simulations. The particle-tracking model was further improved to predict the transport and fate of plastic debris in the Aegean Sea [30]. In the model, the emission of particles was distributed from clustered sources represented as coastal cities, rivers, ports, etc. Extra sources were also imposed to evaluate their influence on the simulation outcomes. The observations indicated were roughly consistent for transport pathways of particles, although the beaching of plastics was not specified in the model. Another attempt to investigate the distribution of plastic debris was reported by Liubartseva et al. [31], who divided the simulated domain within the Mediterranean Sea into three distinct environmental compartments: the sea surface, the coastlines, and the seabed. The combination of the 2D Lagrangian particle tracking model together with wave-dependent currents calculated from a coupled hydrodynamic model highlighted the effect of Stokes drift in the transport of plastics [31].
Nonetheless, Lagrangian models, which monitor individual particles, demand substantial computational resources. These models are not ideally suited for simulating plastic transport processes such as deposition, erosion, aggregation, and fragmentation. Moreover, the discrepancies among the aforementioned modelling results indicate that the realistic situation is highly complex and dynamic, owing in part to the fundamental mechanisms associated with external hydrological factors, such as transport by wave action [32], discharge [33], Stokes drift, beaching and sedimentation, buoyancy [31] in different aquatic environments, and even biological processes. However, the accuracy of numerical simulations in capturing the advection and dispersion of microplastics has not undergone comprehensive validation. This lack of verification can be partly attributed to the limited availability of measurements, whether from laboratory experiments or field studies. Meanwhile, the fate and transport of microplastics in water are also generally thought to be driven by the internal physical properties of particles, particularly density, size, and shape, which are highly sensitive and may change over time as a result of biological/chemical degradation, biofilm growth, coagulation, or fragmentation processes [34,35,36,37,38,39]. Therefore, a particular consideration was given to the properties of particles. For example, there have been several size-dependent models, in which both the fragmentation processes and individually varying size, shape, and density are in relation to mechanical forces exerted on the plastic debris [40,41]. Although, as shown in Table 1, an increasing number of researchers have realized the importance of microplastics and have fostered numerical simulations to quantify microplastic transportation in recent years, the interaction between microplastics and their adjacent environment is still far from being elucidated.
In the large-scale modelling domain, the coupling of a powerful hydrodynamic system, TELEMAC-2D, with GAIA, which simulates the movement of water and its associated properties in a grid system, allows for detailed analysis of fluid dynamics and interactions. Note that the representation of the true movement of particles may be better addressed by using the Lagrangian model than the spatially fixed Eulerian method. In this study, nevertheless, TELEMAC-2D coupled with the GAIA module is used to carry out the numerical simulation due to its inherent flexibility and better efficiency. Adequate parameterization and validation are required to mitigate biases resulting from the increased complexity. The objectives of this study are to reduce the scientific gaps concerning the fate of microplastics in China’s largest floodplain lake by means of numerical simulation. Our study concerning microplastics mainly focuses on these aspects: (1) the spatiotemporal variation between flood and drought periods, (2) the accumulation effect of microplastics in different local regions, and (3) the retention time of plastic pollutants in Poyang Lake. To this end, field observations [50], acting as an initiative source, are used to simulate the transport mechanisms of microplastics in the lake.
The rest of this paper is organized as follows. The study area and data are introduced in Section 2.1. Section 2.2 presents the setting of the numerical model. The model results are presented in Section 3. Finally, the discussion and conclusions are delivered in Section 4 and Section 5, respectively.

2. Methods and Materials

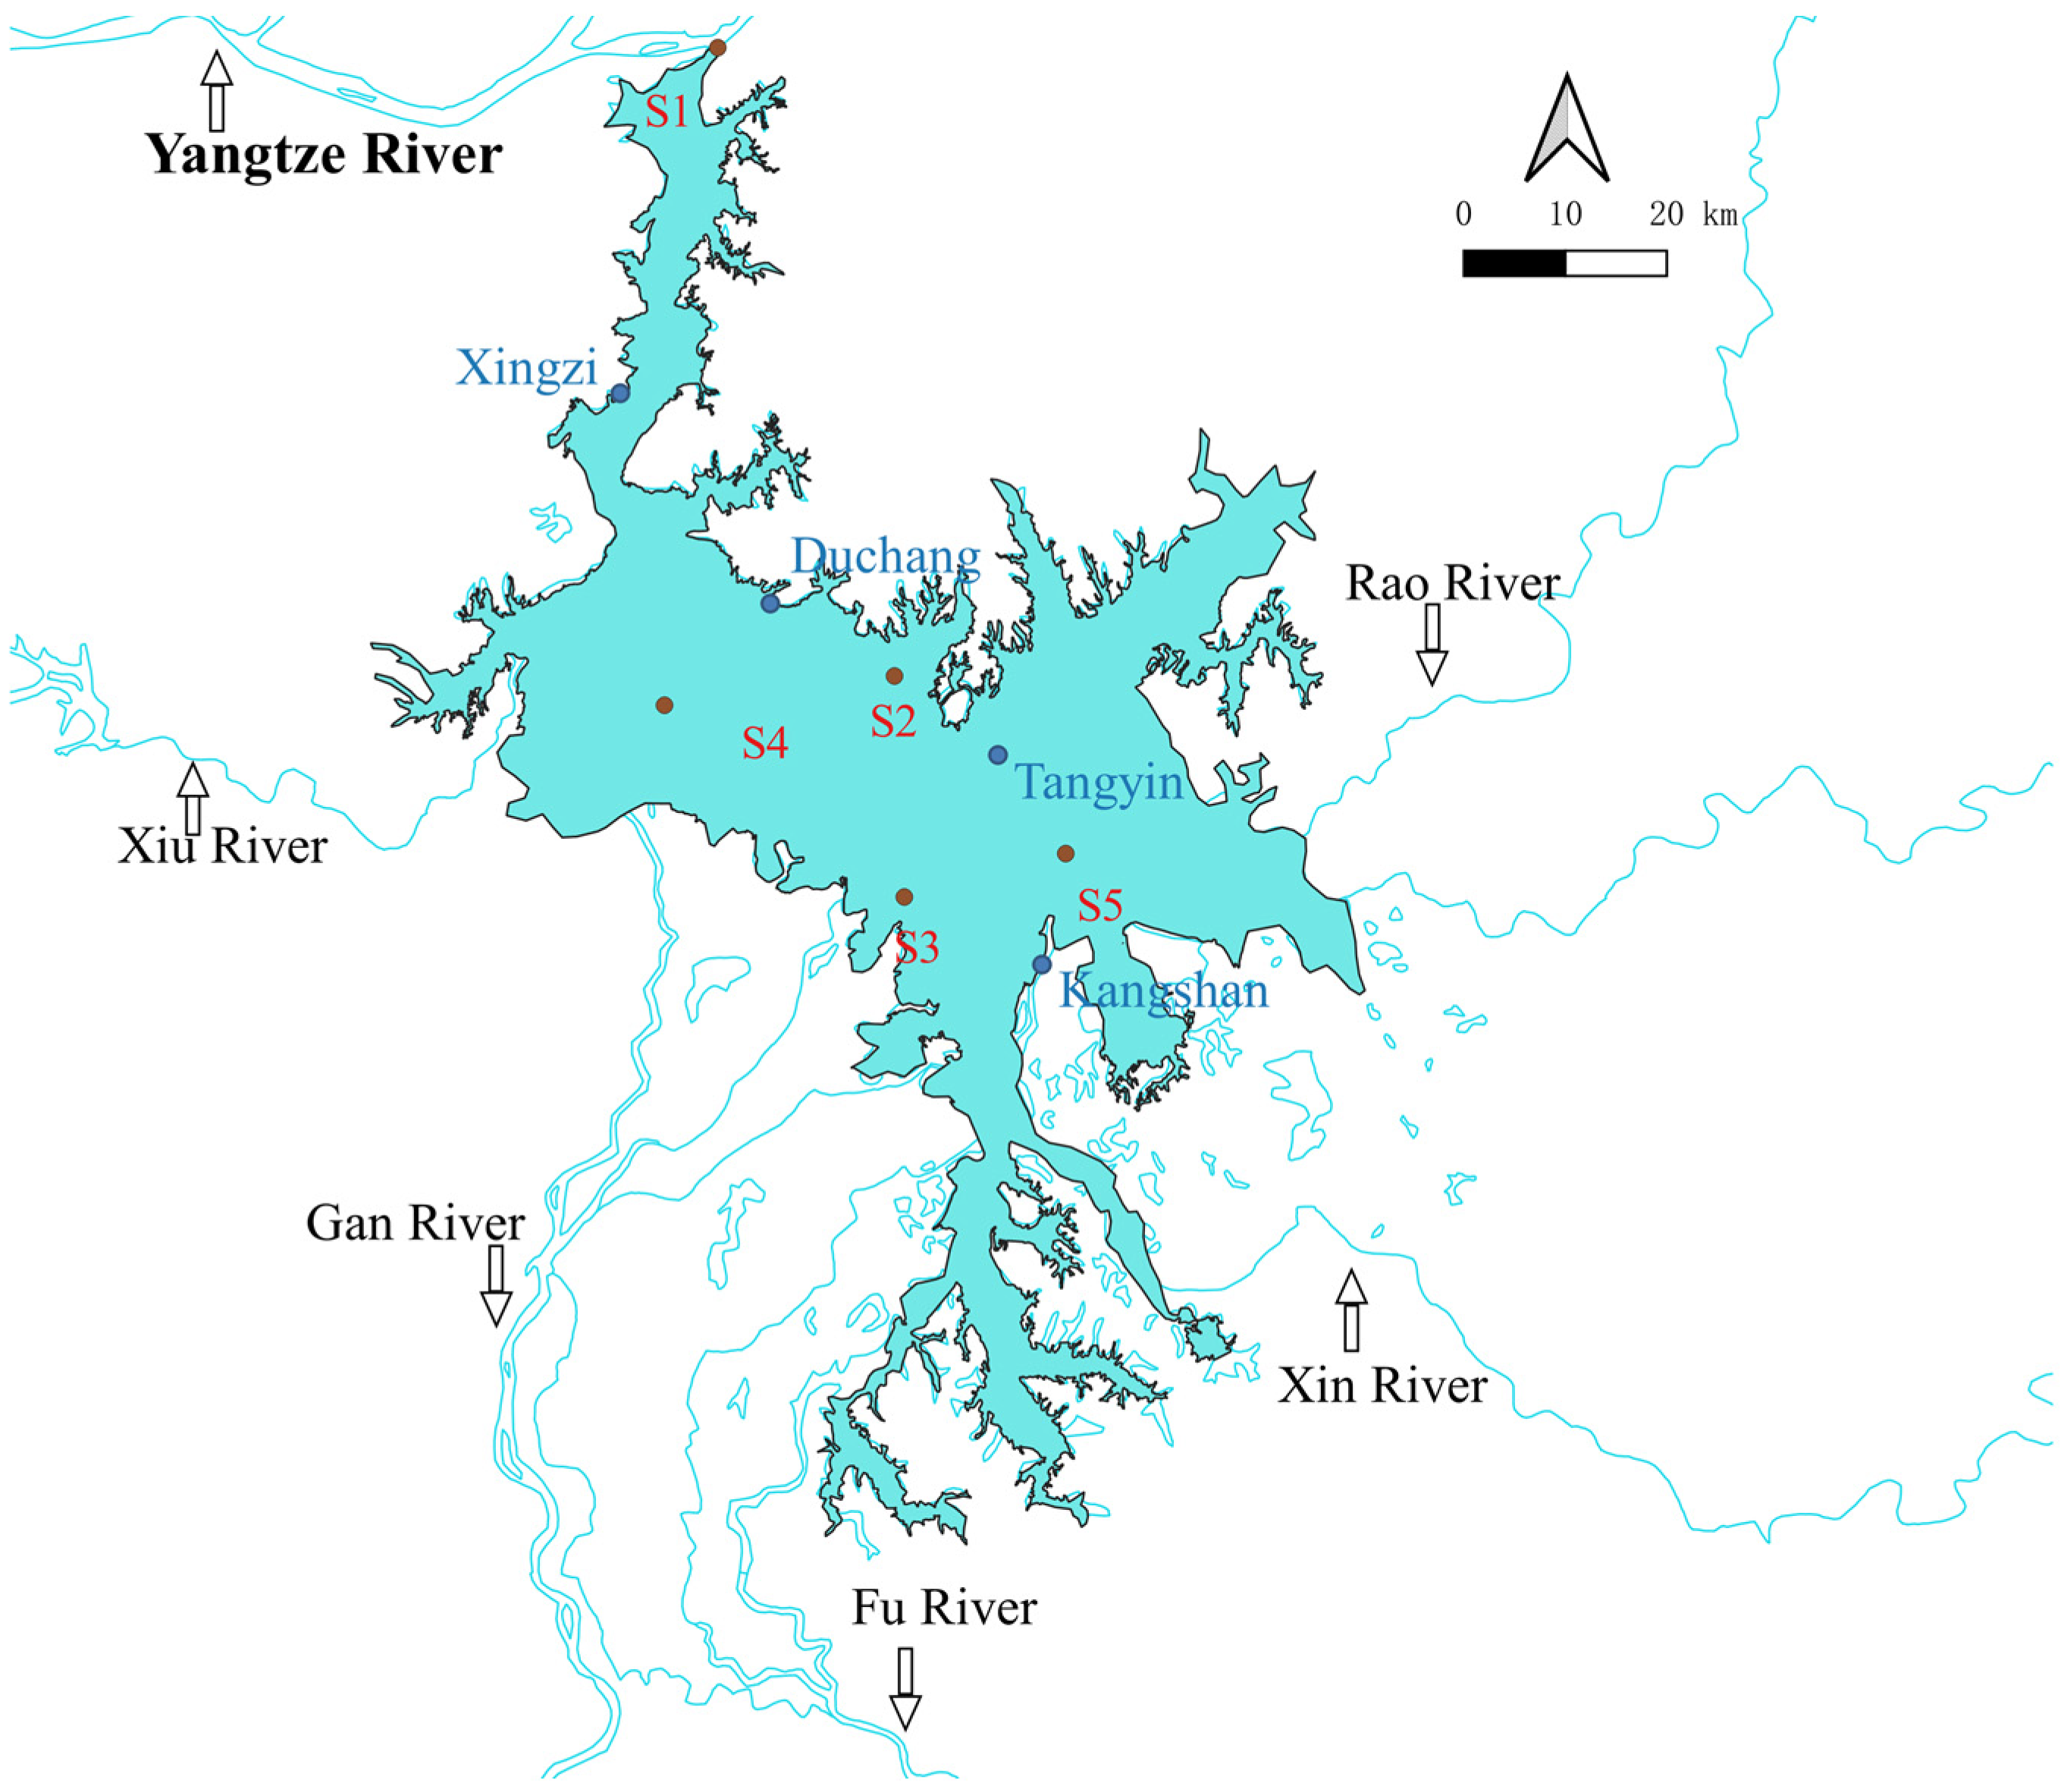
2.1. Study Area and Data

Poyang Lake (28.5–29.9° N, 115.7–116.9° E), situated in the southeastern part of China, features meandering shorelines, with a maximum length of 170 km and an average width of 17 km [51], as illustrated in Figure 1. The Poyang Lake watershed covers 162,225 km2, accounting for 9% of the Yangtze River Basin area. During flood periods, more than 80% of Poyang Lake exhibits water depths shallower than 6 m, as deduced from prior modelling outcomes by Li et al. [52]. The geographical makeup of Poyang Lake is intricate, encompassing attributes such as narrow and deep passages, islands, and expansive regions of shallow floodplain. The lake bottom elevation generally descends from over 14 m in the southern deltas (upstream) to below −2 m in the northern channels (downstream), which leads to a decrease in water levels from Kangshan (upstream) to Hukou (downstream). Poyang Lake receives water from five tributaries within its catchment area, subsequently releasing it into the Yangtze River through a narrow passage known as the Hukou outlet, located at the northern extremity of the lake. The gradient of water levels between the upstream and downstream regions coincides with the inverse trend in water levels. The Yangtze River discharge has a periodic and seasonal variation, varying from 8.1 × 10³ m3/s to 44.4 × 10³ m3/s over 1960–2010. The catchment inflow also varies considerably throughout the year, with a mean value between 1.4 × 10³ m3/s and 12.0 × 10³ m3/s based on a long-term observation from 1953 to 2010 [53].
It has been generally identified that a time lag exists in the peak discharge of the Yangtze River between July and September, just immediately after the arrival of the maximum catchment inflow between April and June [54]. Spatiotemporal and interconnected variations in the catchment inflows and Yangtze River flow foster the dynamic oscillation in the water level. Regarding water level, the hydrological patterns in Poyang Lake encompass four distinct phases: (1) a rising period (March–June), (2) a high water period (July–August), (3) a declining period (September–October), and (4) a low water period (November–February). The lake’s expanse varies, ranging from inundating vast floodplain areas during high water levels, surpassing 3000 km2, to contracting to less than 1000 km2 during low water levels [55,56]. In the rising period (March–June), Poyang Lake’s water level is primarily influenced by seasonal fluctuations in catchment inflows, particularly during instances of severe flooding [57,58]. However, during the high water-level and recession periods, changes in the Yangtze River’s flow dynamics significantly impact the river’s impeding force on the outflow from Poyang Lake [58], subsequently affecting the lake’s water level, storage capacity, and associated seasonal changes [54]. Throughout the low water-level phase (November–February), the water level in Poyang Lake is mainly governed by both the lake’s catchment area and the effects of the Yangtze River.
Economic development and the extensive application of plastics have led to a considerable amount of plastic waste and are major sources of microplastics in the environment [59]. Numerous studies have reported the prevalence of microplastic pollution in some lakes, including Poyang Lake, in China [60,61,62,63]. Since the 1960s, Poyang Lake has experienced much more frequent periodic flood and drought periods due to naturally occurring climate variability coinciding with increased anthropogenic activities [64,65]. Therefore, this area of floodplain systems, as a transition zone between fluvial and terrestrial environments, can play a key role in the deposition and relocation of microplastics [66,67].

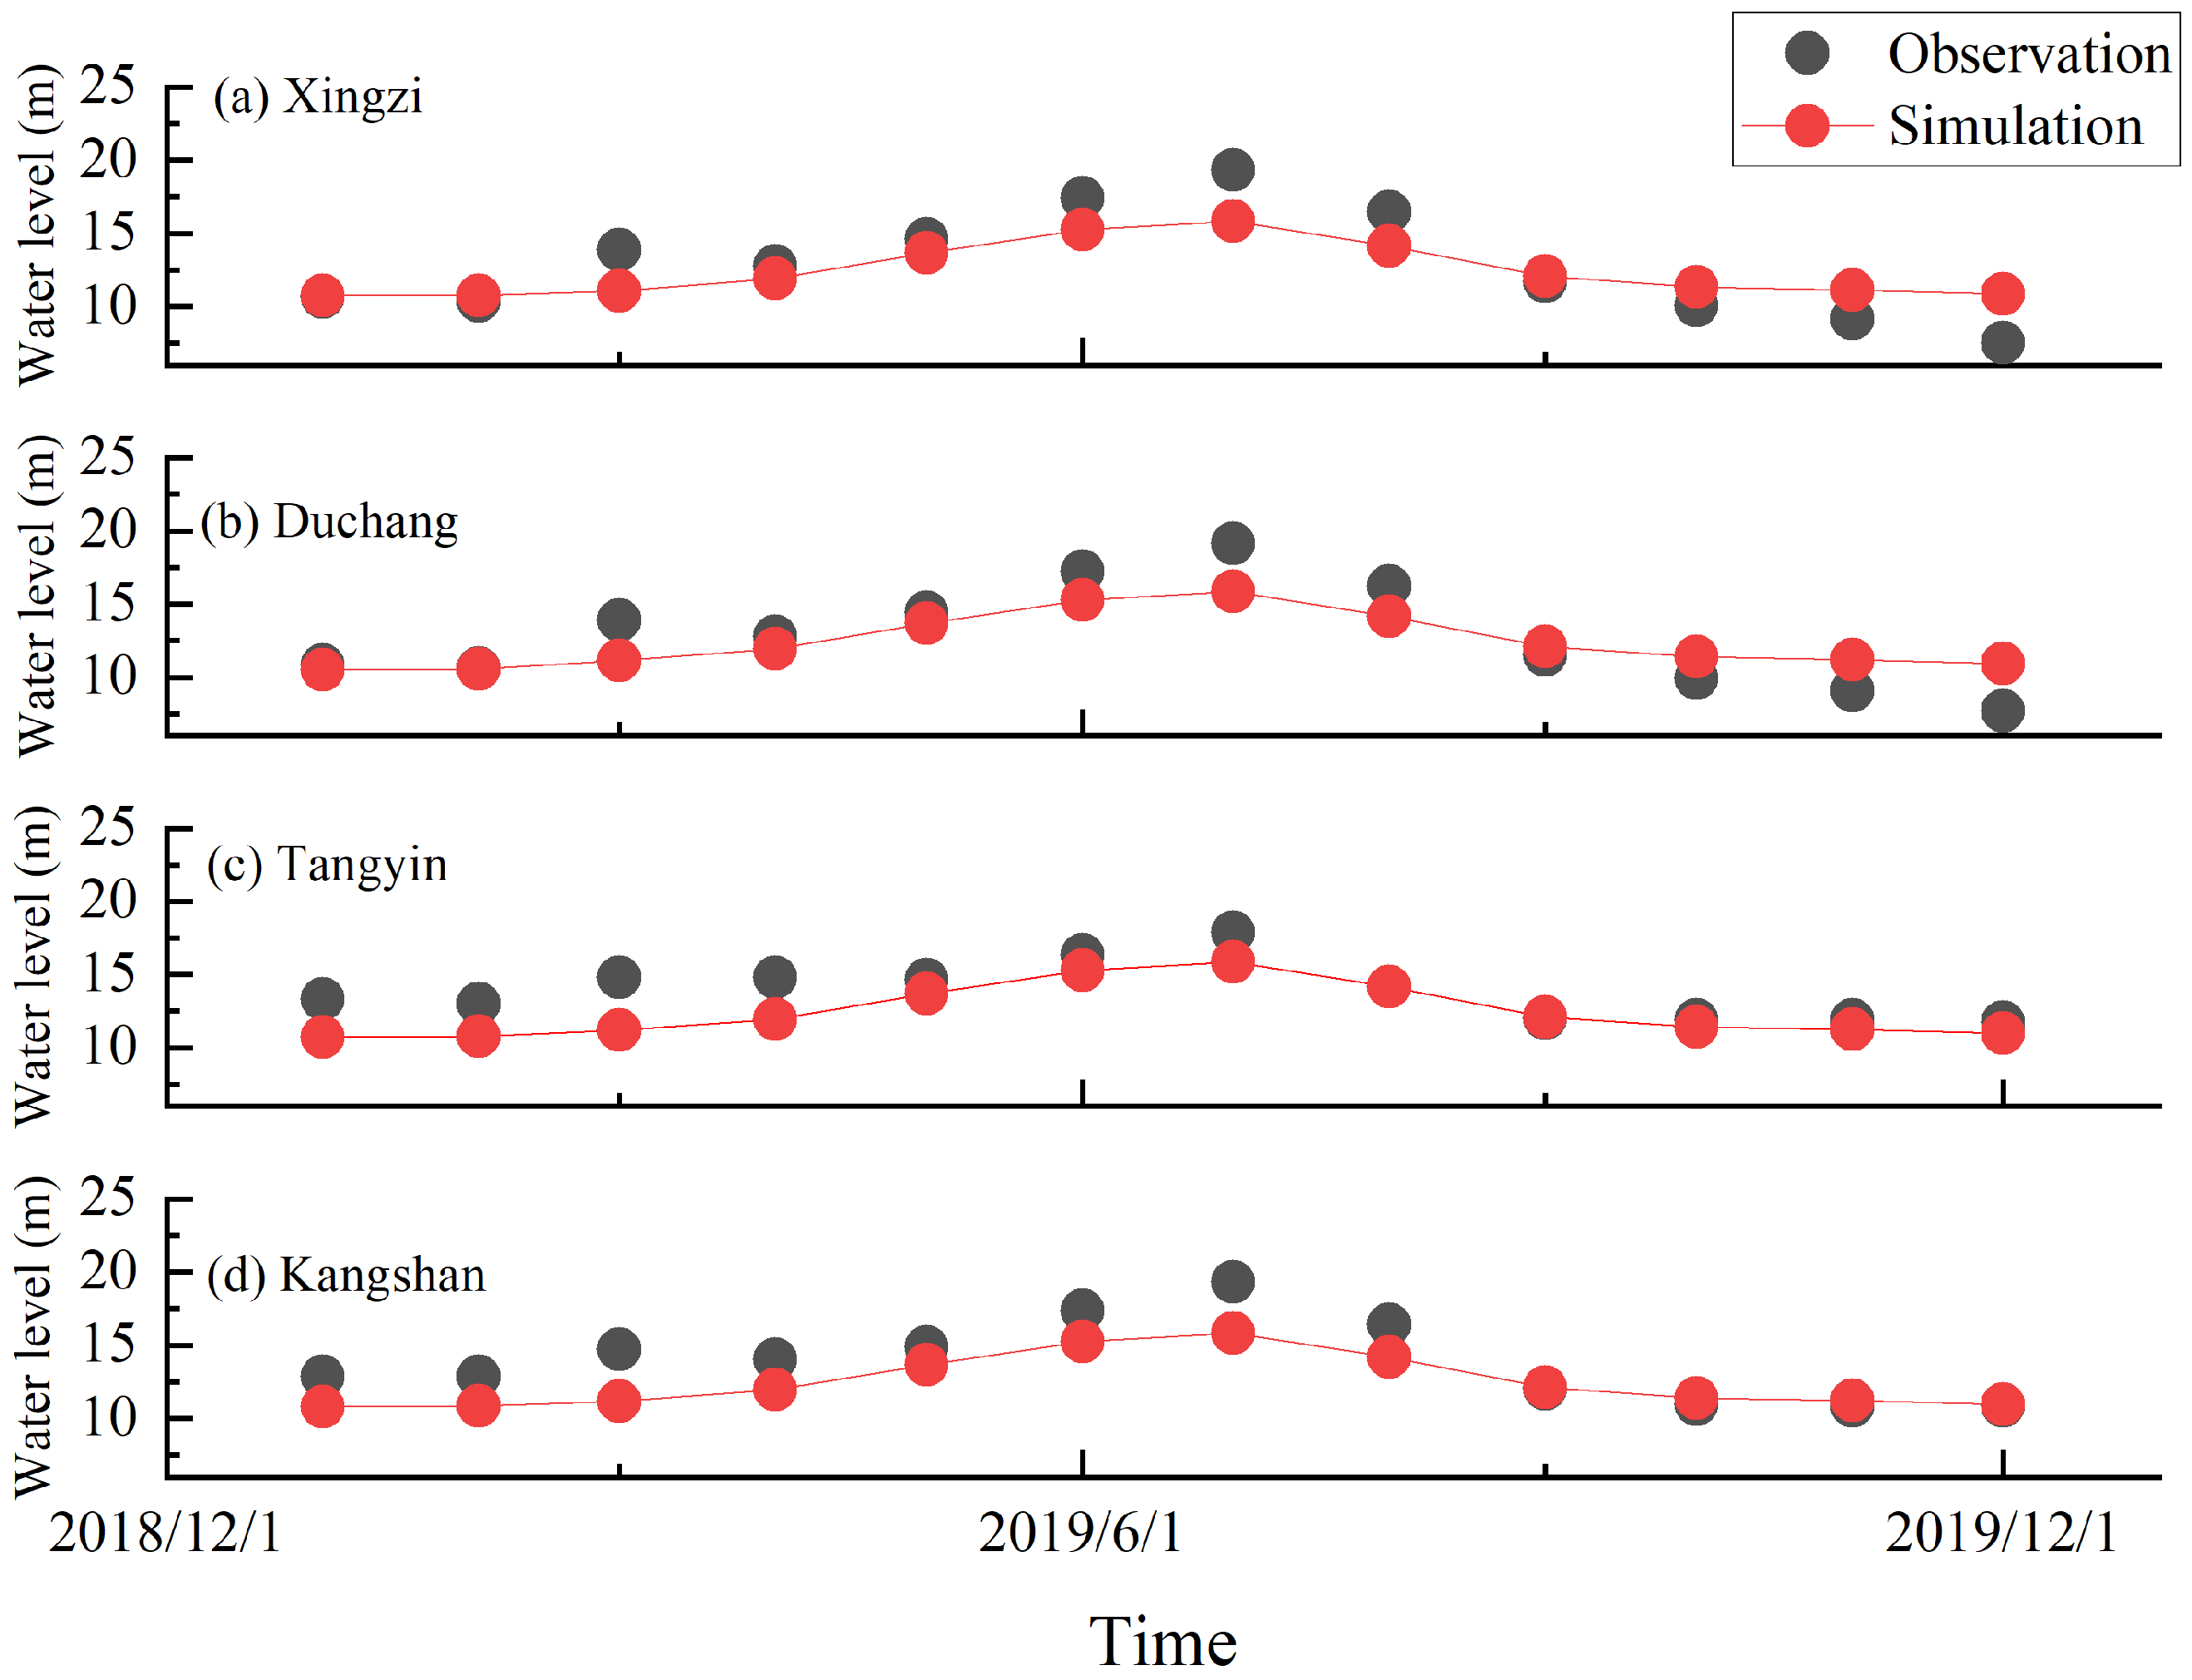
2.2. Numerical Model

The numerical simulation is conducted utilizing the TELEMAC model system (http://www.opentelemac.org/, accessed on 24 September 2023), which is an open-source integrated modelling tool for numerical simulations developed by the LNHE (Laboratoire National d’Hydraulique et Environnement) of EDF (Electricité de France). The TELEMAC model system, with its diverse components (e.g., TELEMAC-2D, TOMAWAC, and GAIA), offers a comprehensive approach for investigating and analyzing hydraulic and environmental phenomena [68,69]. Within this system, TELEMAC-2D serves as a constituent component, using the finite element method (FEM) to solve the Saint Venant equations or SWEs (shallow water equations) on grids, providing hydrodynamic information in the simulation domain. By coupling TELEMAC-2D with the GAIA module, the transportation of particulate tracers can be modelled, which has been widely implemented for sediment investigation [70,71]. In this study, the transport of microplastic particles is modelled as sphere particles with specific densities and sizes using TELEMAC-2D and GAIA modules. The solved equations for hydrodynamics and the microplastic concentration are as follows:
h t + ( h u ) x + ( h v ) y = 0
u t + u u x + v u y = g η x + 1 h div ( h v t u ) + F x
v t + u v x + v v y = g η y + 1 h div ( h v t v ) + F y
h C t + h u C x + h v C y = x ( h ε S C x ) + y ( h ε S C y ) + E D
where h is the flow depth [m]; η is the water surface elevation [m]; u and v are velocity components in the x- and y-directions [m/s], respectively; t is time [s]; g is gravitational acceleration [m/s2]; vt is the diffusion coefficient [m2/s]; Fx and Fy are source or sink terms of fluid in the x- and y-directions [m/s], respectively; C is the microplastic concentration [g/L]; ε S is the turbulent diffusivity of the microplastics [m2/s]; and E and D are the source and sink terms of microplastics.
Based on the topographic data of Poyang Lake, the computational domain of the hydrodynamic TELEMAC-2D model was determined, which spanned 100 km in longitude and 150 km in latitude. The topography was discretized by 30,967 elements and 18,747 nodes (Figure 2) using BlueKenue (https://www.nrc-cnrc.gc.ca/eng/eng/solutions/-advisory/blue_kenue_index.html, accessed on 24 September 2023). To accurately capture the variations in the lakeshore of Poyang Lake and optimize the efficiency of the hydrodynamic model, the element sizes within the model domain are carefully selected, ranging from 55 to 2500 m. The largest element sizes are located in the central region of the lake, while the smallest cells are positioned around the primary tributary. This spatial distribution of element sizes enables a more precise representation of the lakeshore characteristics and enhances the overall performance of the hydrodynamic model. The average error of the water level assessment from June 2019 to December 2019 at stations Xingzi, Duchang, Tangyin, and Kangshan is approximately 14% (Figure 3), within the same order of error observed in similar studies [72,73]. Considering the substantial fluctuations in water levels during flood and drought events, the simulation is run on non-structured triangular elements due to their exceptional adaptability to complex topography and sensitive shorelines.
A total of nine open boundaries have been identified within the model domain, which encompass the inflows from five tributaries: the Rao, Xin, Fu, Gan, and Xiu Rivers, along with the outflow into the Yangtze River. The Gan River has been further subdivided into its northern, middle, and southern branches, while the Fu River is divided into its northern and southern branches. To ensure the accuracy of the model verification runs, measured discharge and water level data during the period of July to December 2018 were obtained from adjacent monitoring stations for calibration purposes. The simulation input data for future years were set to be the same as the existing data in recent years, assuming that the interannual variation in the hydrodynamic conditions is stable in the Poyang Lake system.
To ensure the accuracy and stability of the model calculation, the initialization of the simulation is chosen as the “cold start” option in TELEMAC, which allocates the initial values for each physical parameter, such as the water level and concentration of microplastics. The initial water level is set as 18.0 m and the initial concentrations of microplastics are assigned as the same proportion in the in situ data of Jian et al. [50]. Note that the measured concentrations were in the units of counts/m3. The inflow concentrations of microplastics were calculated according to the field observations of Jian et al. [50] in the Poyang Lake system (Table 2). According to the in situ measurement of Poyang Lake and its catchment area [48,50], PE accounts for the majority of the polymer components of microplastics. A representative size of 750 μm [50] and density of 0.91 g/cm3 [48] were thus selected in this study.

3. Results

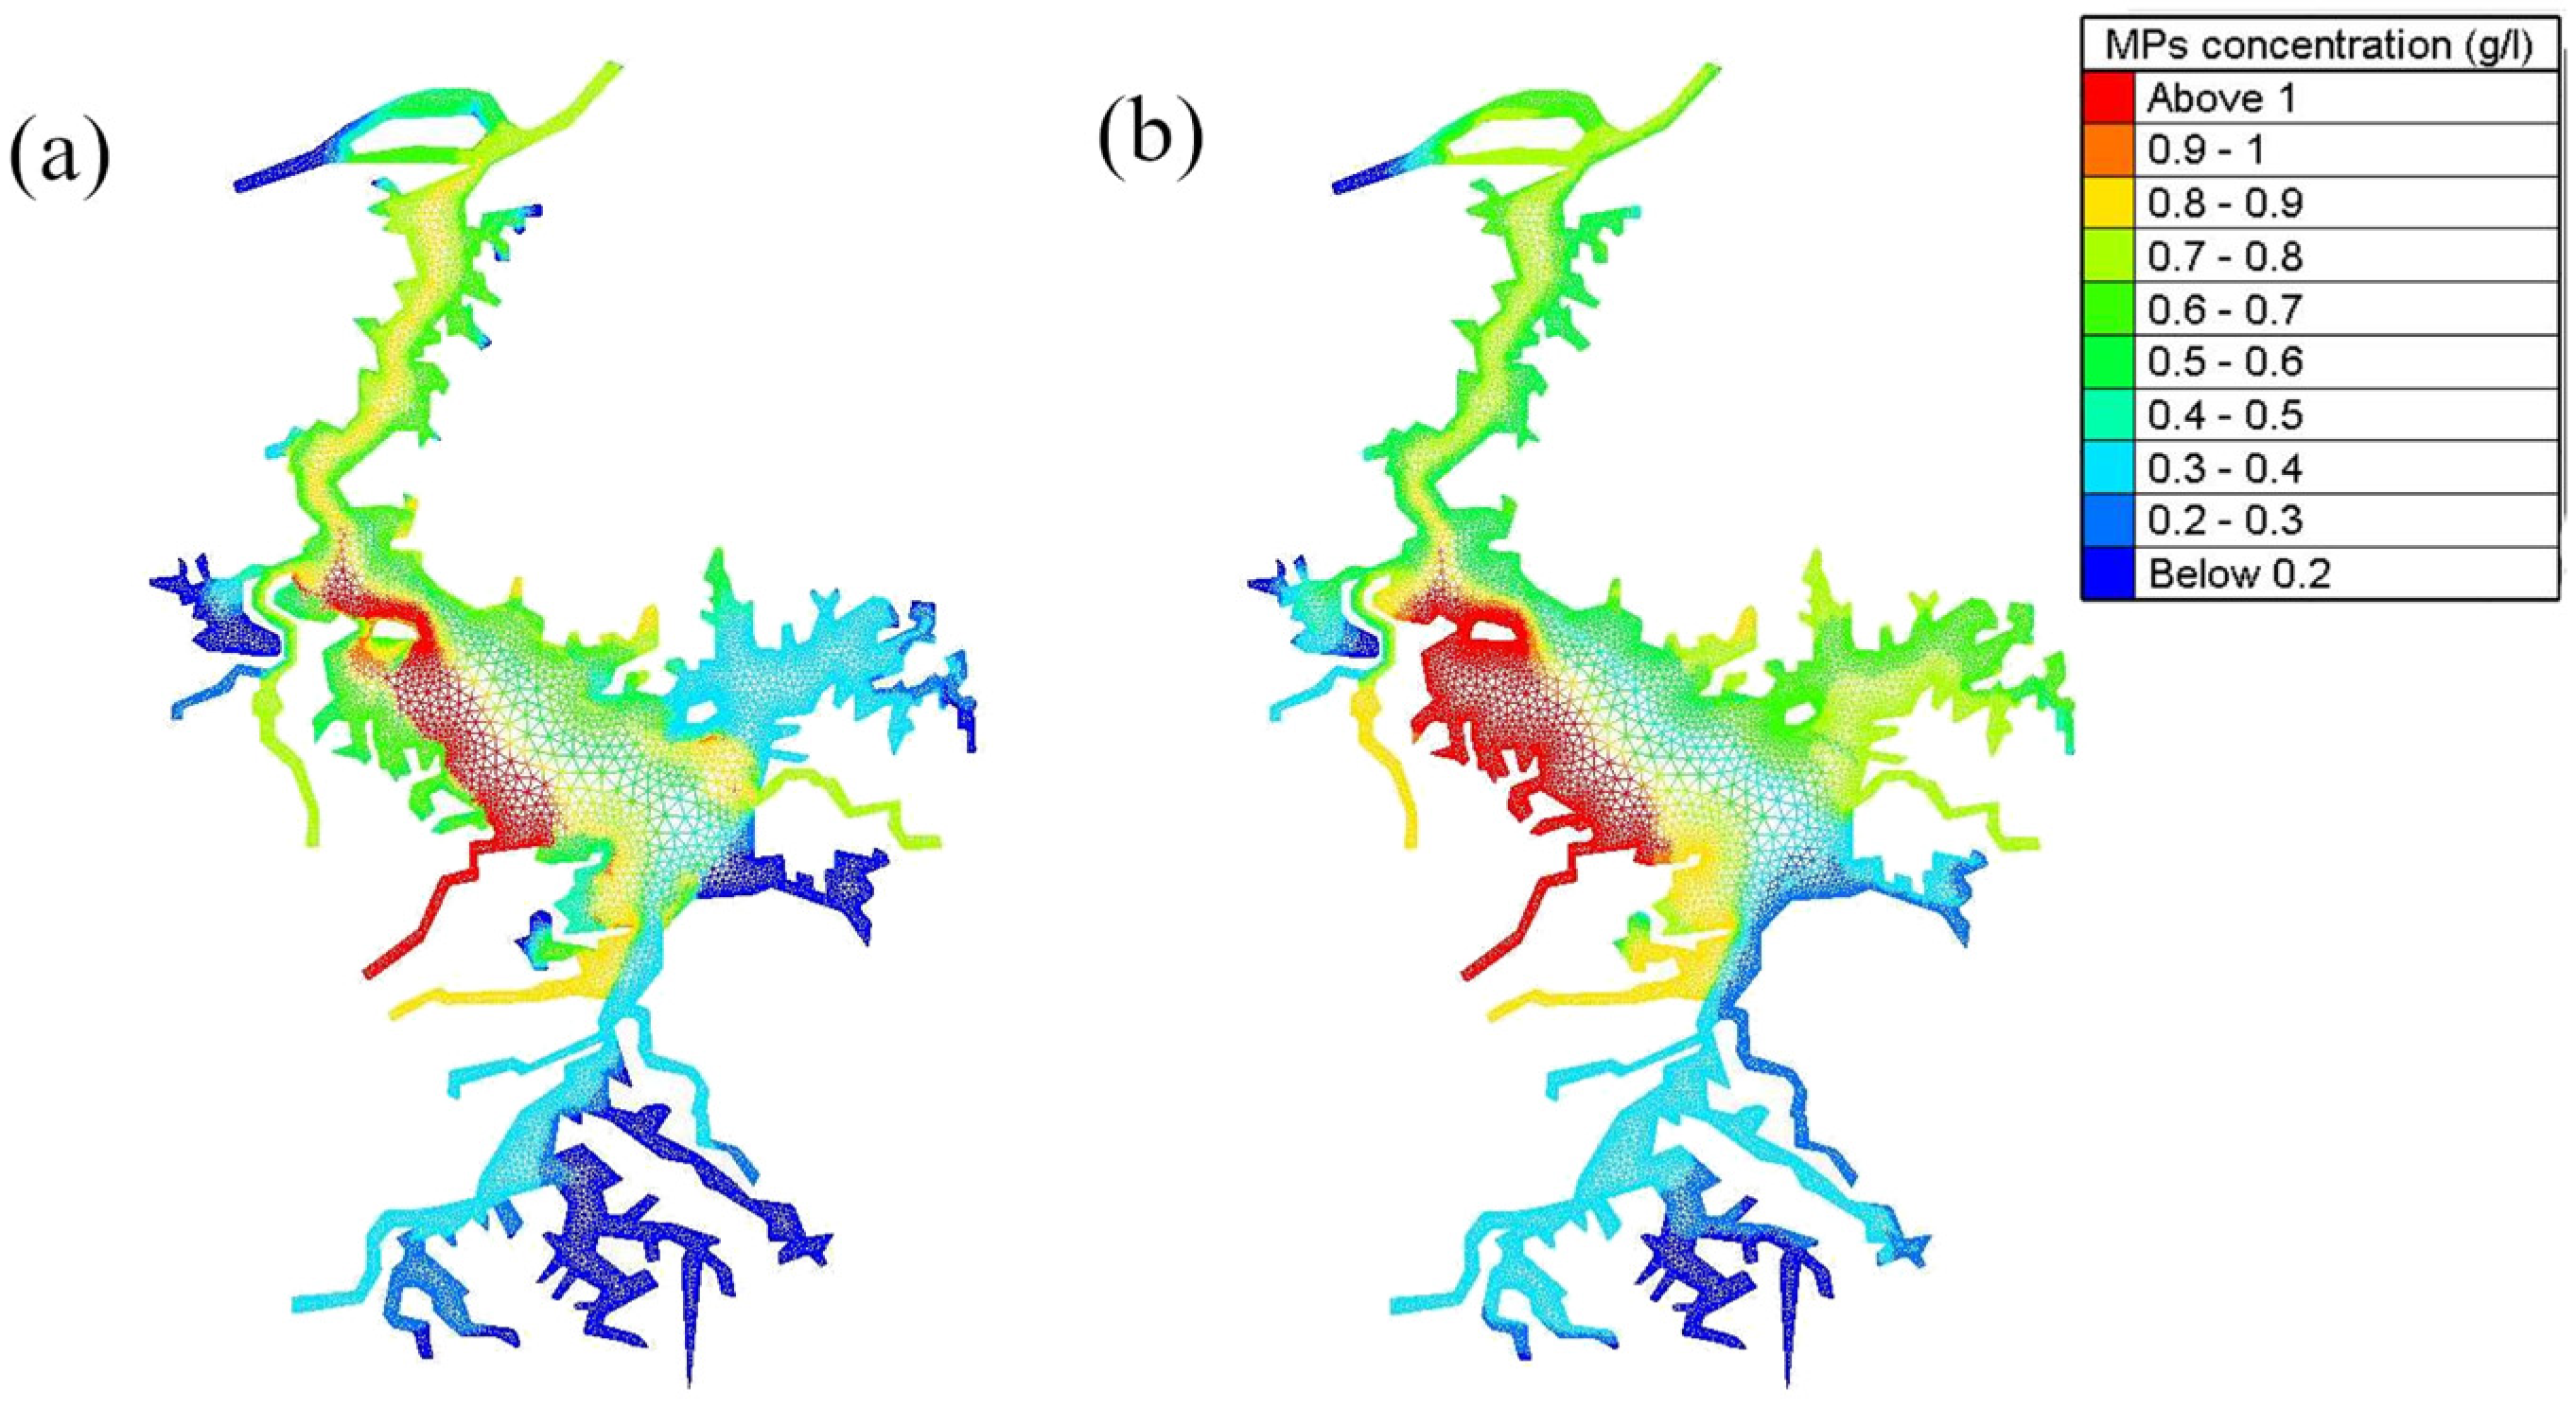
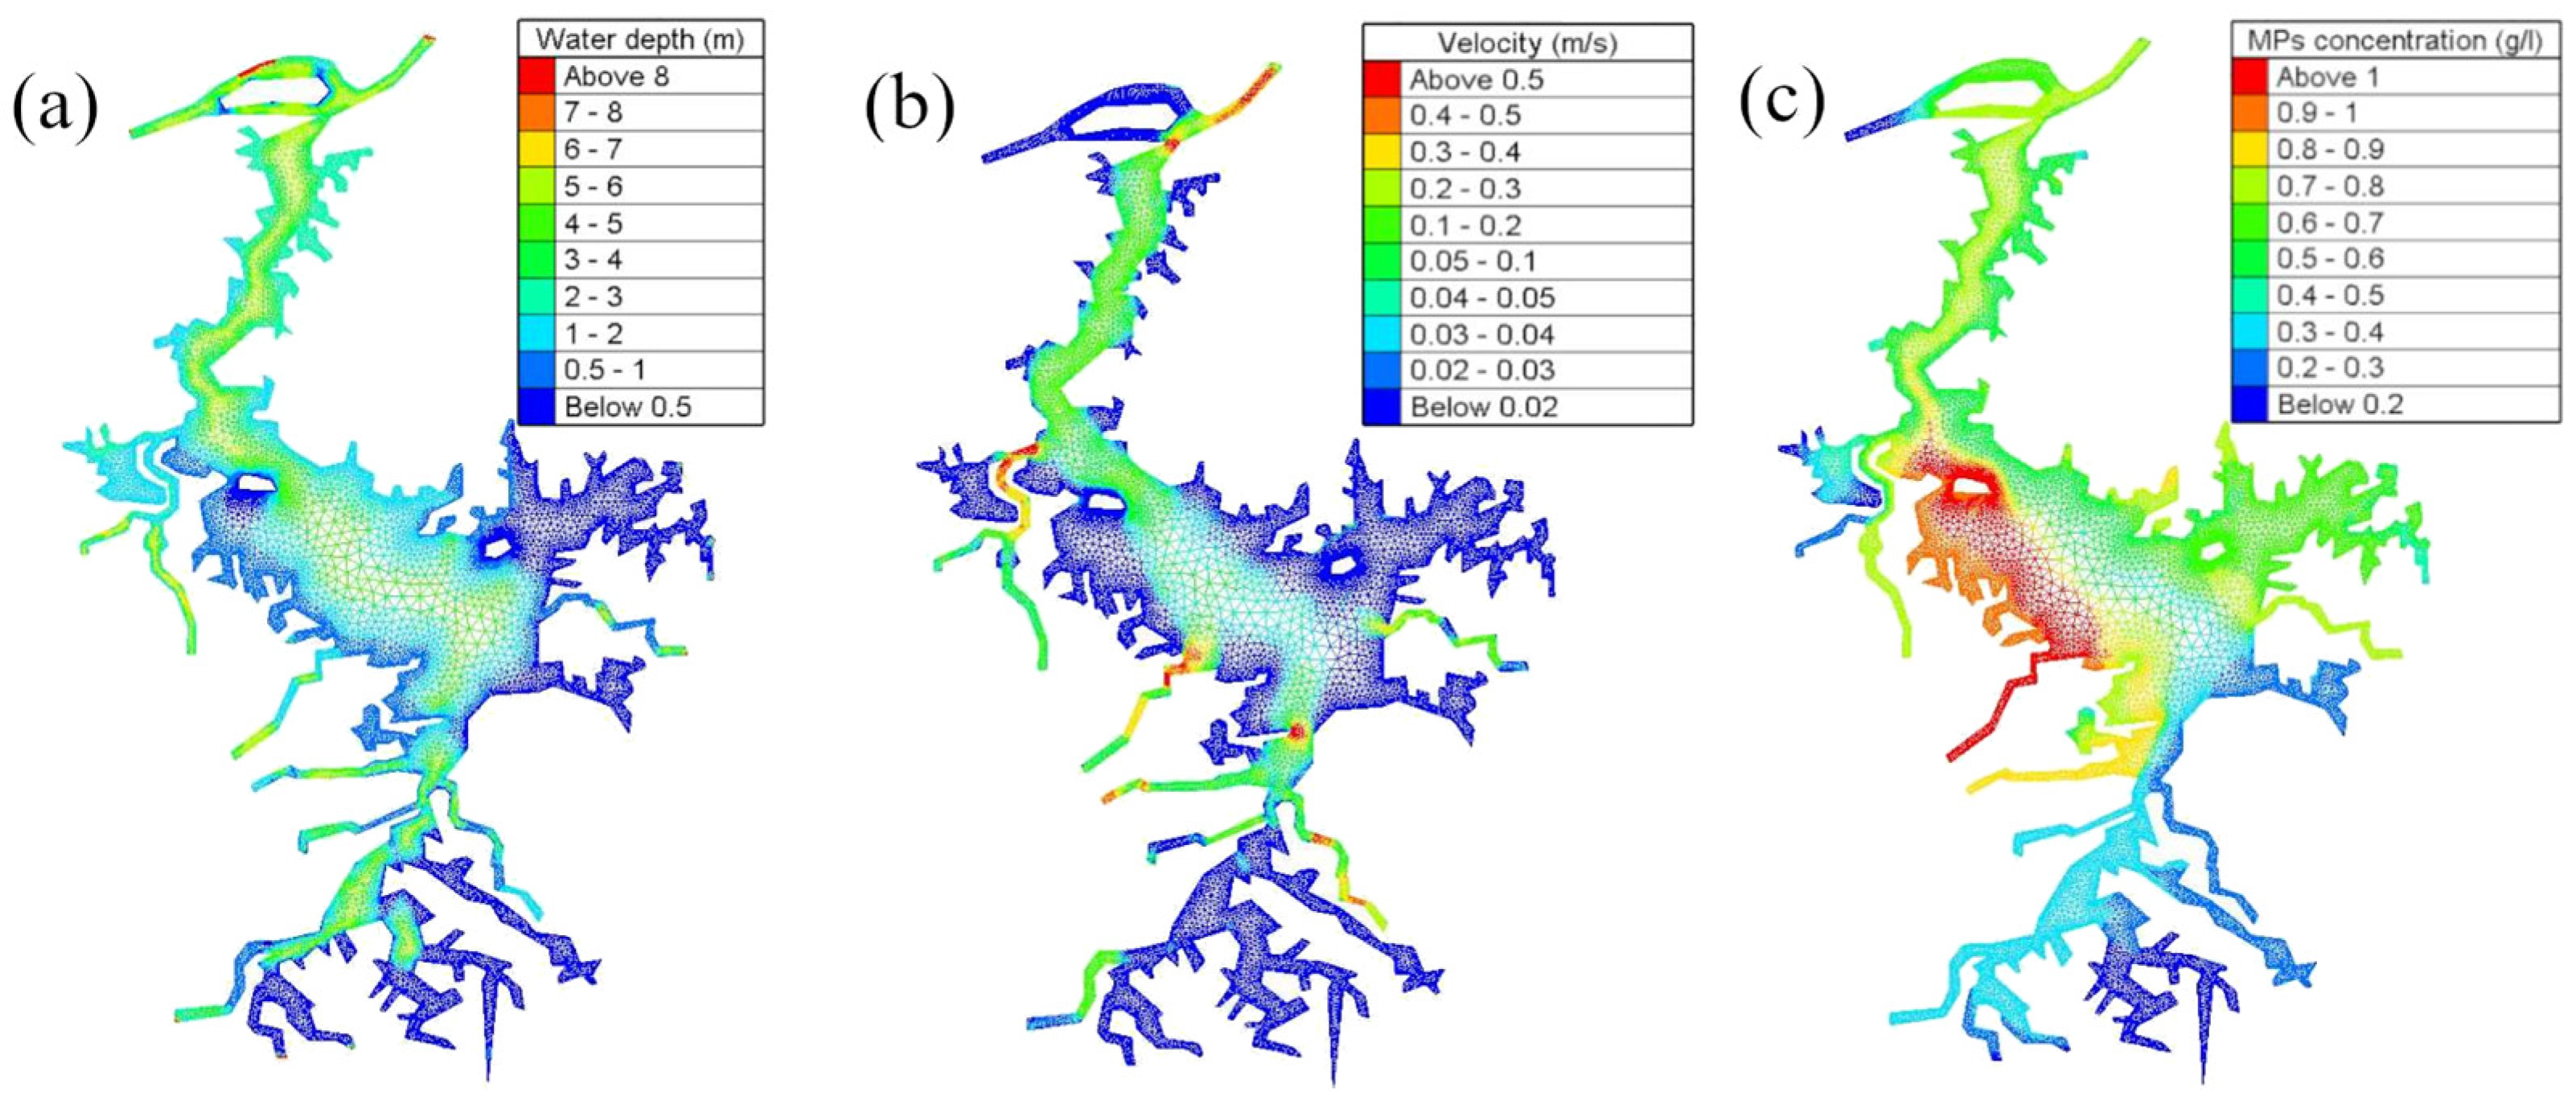
3.1. The Spatial Distribution of Microplastics in Poyang Lake

In terms of the spatial variability of microplastic concentrations in 2018, the shoreline extending from the mouth of the lake to the middle branch of the Gan River exhibited notably higher concentrations, surpassing 1 g/L (Figure 2). These elevated concentrations can be attributed to the influence of water flow from the Gan River, which triggers vigorous horizontal mixing in that specific region. In contrast, the eastern side, including the area from the lake’s mouth to the Rao River, as well as the southern region, with its shallow shoals along the eastern side, exhibited relatively lower concentrations of less than 0.5 g/L. Despite the lack of available field observations for metric-based validation of the model prediction, a substantial degree of qualitative concurrence is evident when comparing the model results to earlier studies conducted on the Poyang Lake system [50,63]. Both the field observations and the model reveal the occurrence of elevated microplastic levels in the middle region and proximate to the five primary tributaries. This congruity reinforces the alignment between the in situ data and the model outcomes.
At the end of the simulation in 2025, the western region of Poyang Lake, spanning from the north branch to the middle branch of the Gan River, is anticipated to maintain its status as the foremost area plagued by severe pollution. This region is expected to exhibit an average microplastic concentration exceeding 1 g/L (Figure 2), while the concentrations of microplastics on the eastern side are predicted to rise to approximately 0.8 g/L (Figure 2). The long-term accumulation of plastic debris in Poyang Lake takes place in the western and eastern regions. More specifically, the concentrations gathering along the western and eastern regions are approximately 2–3 times larger than those in the other regions from 2018–2025.
Turning the focus to the southern region of the lake, in both 2018 and 2025, a vast area of lowest concentrations represents relatively moderate hydrodynamics away from the influence of riverine currents. In 2018, the high microplastic concentrations near the mouth of the lake indicate that plastic debris is transported to the Yangtze River since it is the only outlet in our model. Conversely, after two months of model integration, the relatively moderate concentrations in the mouth demonstrate an annual reduction in microplastic influx into the Yangtze River. It is generally accepted that the northwards currents discharging into the Yangtze River, amounting to an annual average of 145 billion cubic meters, could determine the destiny of suspended and settling microplastics within the riverbed [63]. Moreover, the accumulation effect of microplastic concentrations along the western shore, from the northern branch to middle branch of Gan River, can be influenced by geography and topography; their effects will be interpreted in the Discussion section.

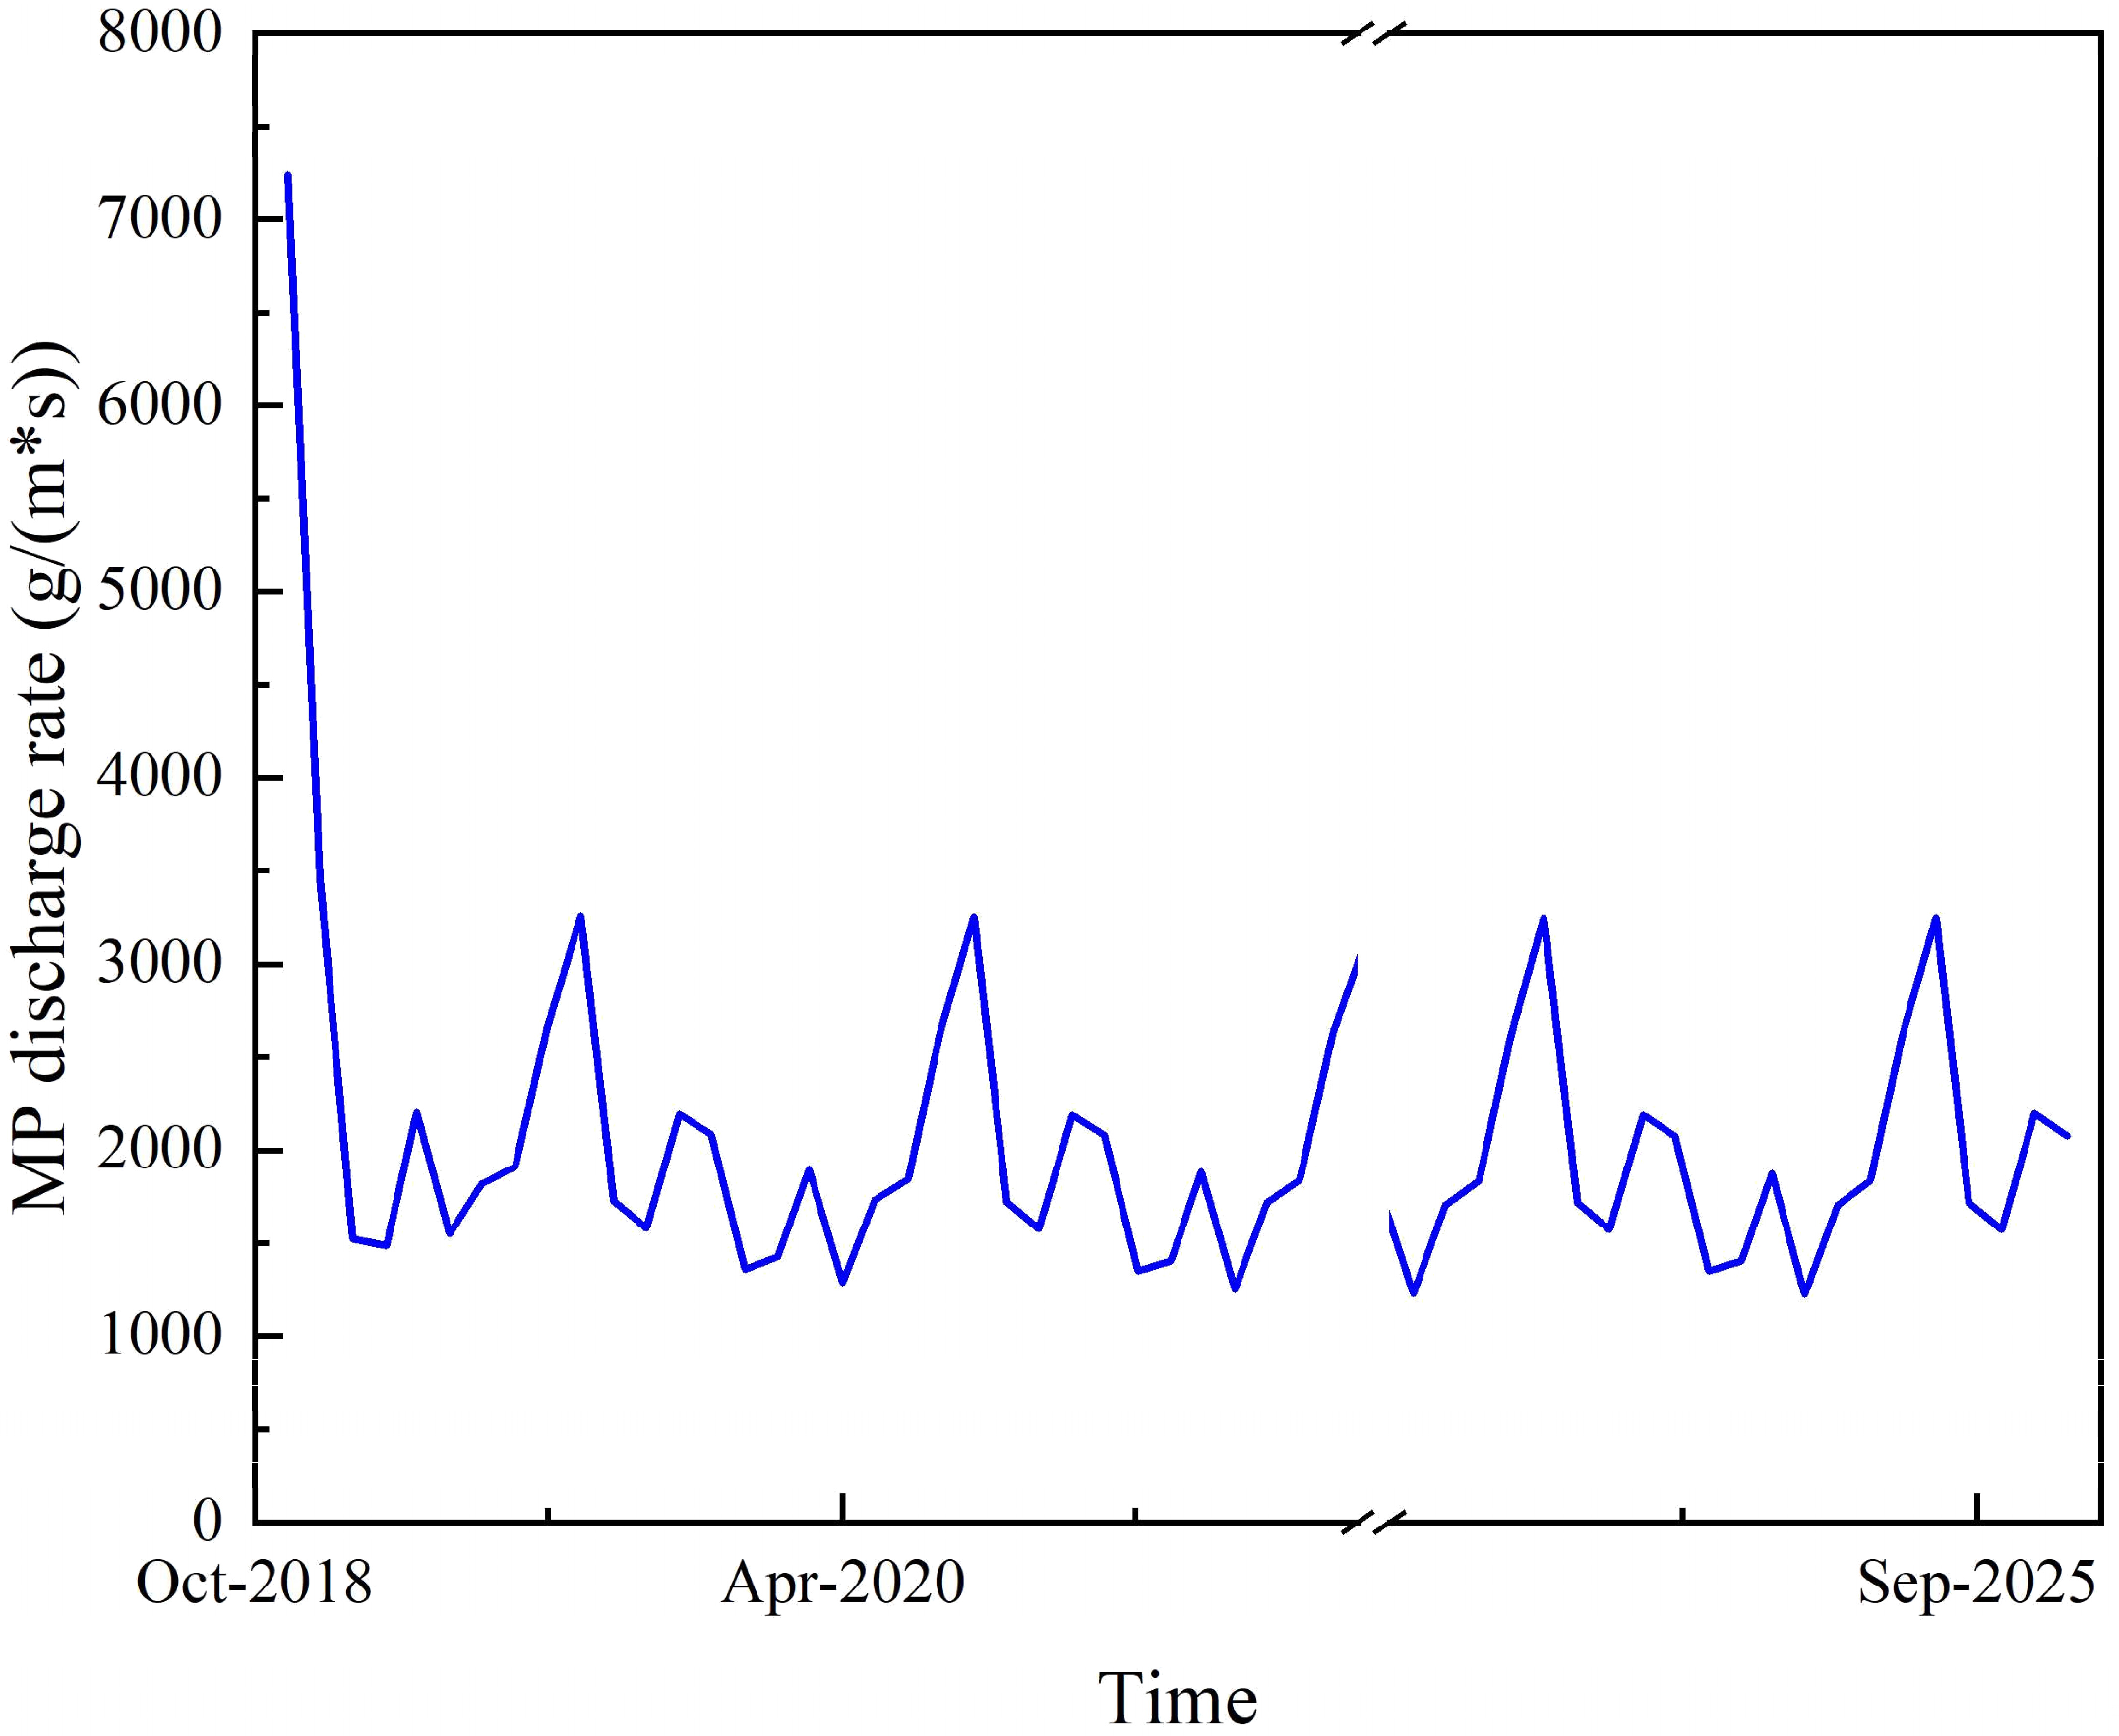
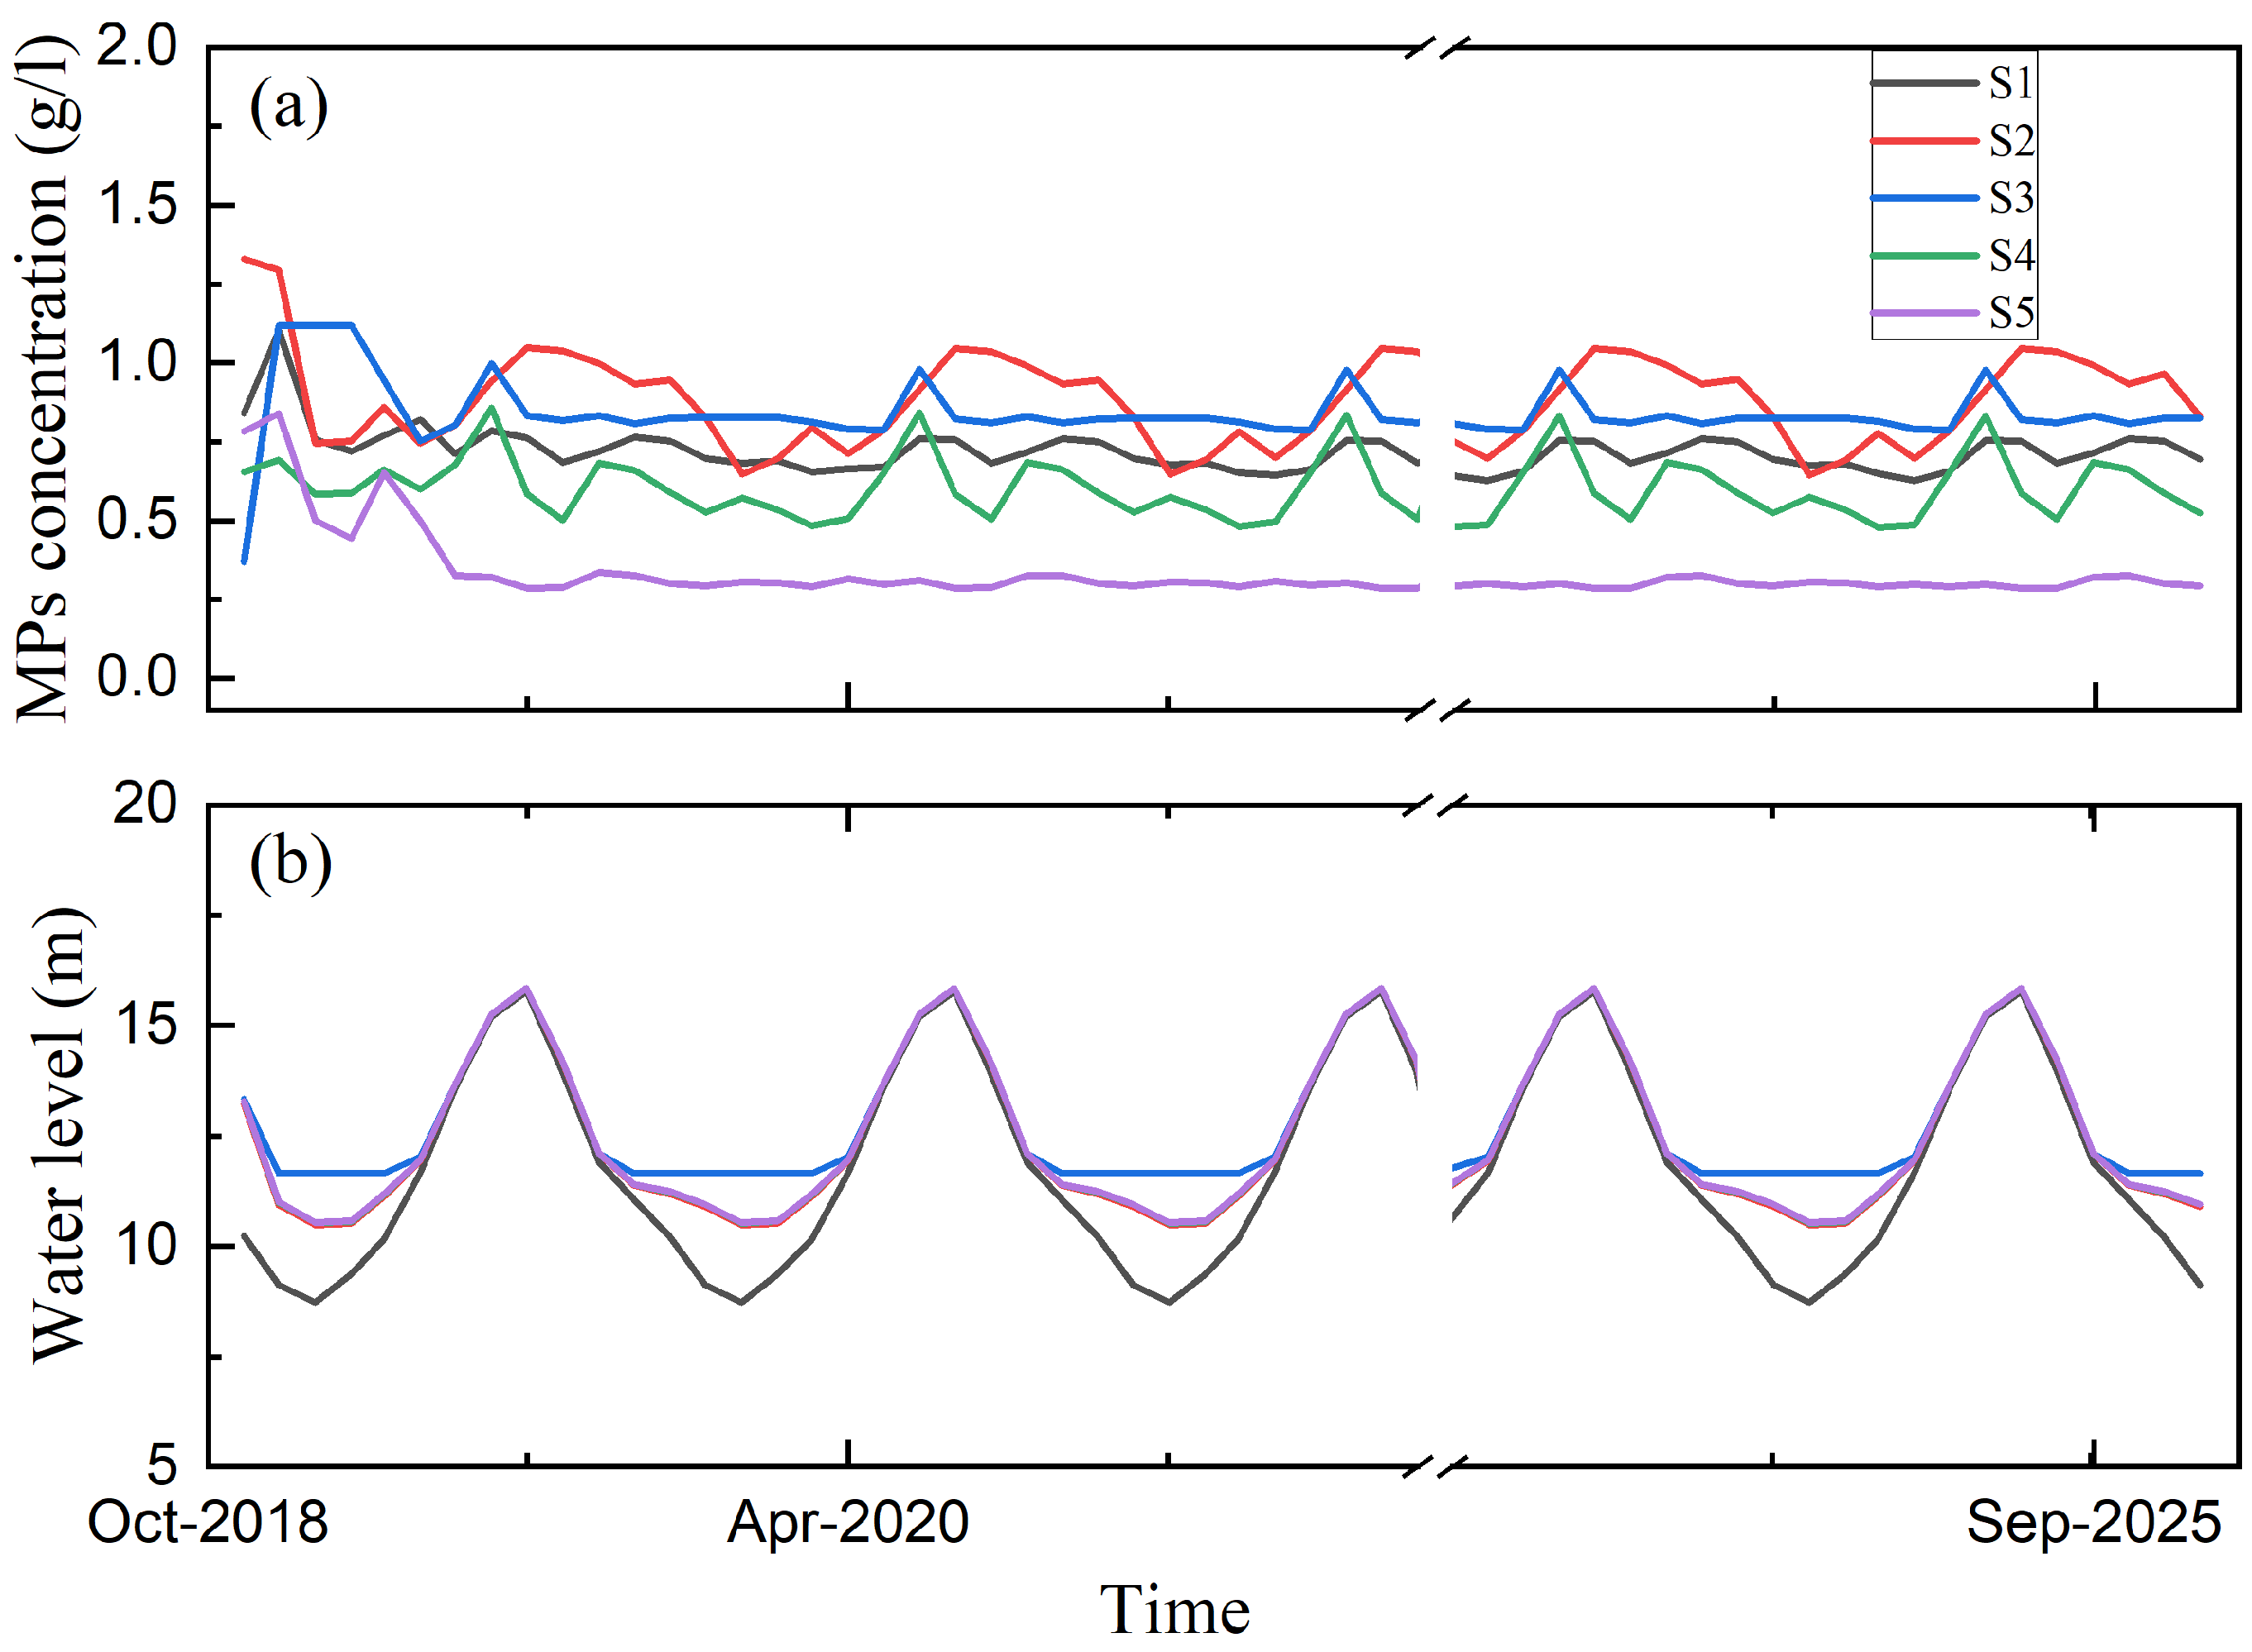
3.2. The Temporal Variation in Microplastics Transport in Poyang Lake

The monthly-averaged discharge rates of microplastics were calculated along the outlet of the simulation domain, which reflects the emission influx downstream of the Yangtze River. The discharge rates exhibit both short-term fluctuations and long-term variations, indicating the influence of various factors such as seasonal variations, human activities, and environmental changes. A clear seasonal variation is shown during 2018–2025 (Figure 4) after the initial convergence period of the model. On average, the discharge rate of microplastics is 1621 g/(m·s) in spring, reaches a maximum value of 2534 g/(m·s) in summer, then decreases to 1948 g/(m·s) and 1575 g/(m·s) in autumn and winter, respectively. The peak value of monthly discharge rates is found in August with 3254 g/(m·s) and the lowest value, 1243 g/(m·s), appears in April.
Five sites are considered to further analyze the polluted situation of the main area of Poyang Lake (Figure 1), i.e., S1 (outlet), S2 (north–central region), S3 (Nanjishan Wetland National Nature Reserve), S4 (northeast region), and S5 (southeast region). To depict the influx distribution in Poyang Lake, we mapped the model outcomes within the selected five sites over the seven-year interval (2018–2025). This selection was implemented to depict small-scale peculiarities and to facilitate comparisons of microplastic concentration values in Poyang Lake. Among the sampled locations, Site S3 consistently exhibited the highest microplastic concentration, which may be attributed to the convergence of three major river inflows, i.e., the Xin, Fu, and Gan rivers. Site S4 exhibited the second highest concentration of microplastics, while Site S2 demonstrated a similar level of microplastic concentration. In contrast, Site S5 displayed the lowest microplastic concentration among the investigated sites. Notably, Site S2 displayed significant fluctuations in microplastic concentration, with a remarkable outlier indicating a sharp increase in April 2019. Over the period spanning from 2018 to 2025, the annual peak values at Site S2 exhibited a declining trend.
To investigate the temporal variations in microplastics, the residence rate of the microplastics at each site was derived from the time of peak of microplastic concentrations and those on the last day of the computational period at the selected site. In the main lake area, it was observed that the residence rate of microplastics was relatively low in the eastern sites at the same latitude compared to the western sites (Figure 5). Specifically, Sites S2 and S5 exhibited residence rates of microplastics below 40%. A notably higher residence rate of microplastics, amounting to 73.8%, was recorded at the site near Nanji Mountain Nature Reserve (S3). This elevated rate could potentially be attributed to the site’s close proximity to the shoreline, coupled with significant pollution stemming from the tributaries of the Gan River.

4. Discussion

4.1. Microplastic Transportation in the Poyang Lake Catchment River System

Poyang Lake, together with its surrounding catchment area, forms a complex and interconnected ecological system known as the Poyang Lake catchment river system [74]. Its catchment area encompasses a network of rivers, streams, and tributaries that contribute to the water inflow of the lake, with the Yangtze River serving as the solitary outflow channel. The water exchange and interactions between the lake and the river play crucial roles in shaping the hydrological regime, nutrient dynamics, and sediment transport within the system. This intricate relationship influences the overall ecological equilibrium of the lake and has significant implications for regional water resource management. Among the ecological threats to the Poyang Lake catchment river system, the issue of microplastic pollution has emerged as a pressing concern. The presence of microplastics in Poyang Lake and its surrounding rivers poses potential risks to the ecosystem, wildlife, and human health. In this study, the situation of microplastic pollution within Poyang Lake was investigated by numerical model.
The flow velocity (Figure 6b) in Poyang Lake and the averaged profiles of micro-plastics (Figure 6c) in the water body over 2018–2025 were calculated, which showed a significant spatial variation for both microplastic concentrations and velocity profiles. In general, areas with elevated concentration patterns often align with the spatial distribution of plastic debris inputs. Rivers characterized by higher runoff rates are more likely to be densely populated, thus leading to a higher discharge of plastic waste. Compared with other regions, it is interesting to note that the microplastic concentrations along the western shoreline of Poyang Lake are relatively high during the first few months of the computational period. This may be attributed to its complex terrain comprising six tributaries along this side, which can be seen as point sources of microplastics in the adjacent regions.
Furthermore, numerous studies have suggested that microplastic pollution is tremendously influenced by geographical and topographic cues, including the morphology and scale of lakes and even the presence of water conservancy establishments, such as dams [62,63,75]. When looking at the geography and topography of Poyang Lake, we can visually recognize a wide southern region and a narrow connecting channel northwards to the Yangtze River. The microplastic concentrations will be further diluted, and the impact of riverine plastic debris sources can be reduced, once microplastics are transported into the southern region. In the meantime, a certain fraction of water flows is blocked by the narrow northern channel, creating a circulation pathway and, thus, contributing to accumulation of microplastics in the middle region.
Remarkably higher microplastic concentrations were found on eastern shoals and shoreline after few months of iteration, especially in the drought period. To evaluate and depict the microplastic concentrations in Poyang Lake, we selected five representative sites and exhibited the spatial trends in Figure 7.
The microplastic concentrations show a dramatic decrease in the western region after a few months of model integration, while in the eastern region, a gradual increase always appears during periods of rising water levels. To some extent, both low water levels coupled with low velocity and large areas of shallow shoals are likely the main factors facilitating the accumulation of microplastics in the eastern region during the drought period (Figure 8).
In addition, Poyang Lake plays a vital role as both a reservoir and a freshwater source for the Yangtze River. Given its status as a significant component of the Yangtze River basin, pollution or contamination in Poyang Lake can significantly impact the water quality and ecosystem health of the downstream Yangtze River. Consequently, the microplastic influx from Poyang Lake into the Yangtze River was also investigated in this study to help assess the overall contamination level and potential risks to the downstream regions. A seasonal variation was shown in the discharge at the outlet, wherein the microplastic discharge rates always reach the peak around August. This phenomenon can be attributed in part to how Poyang Lake interacts with its main tributaries through conjunctions. An important process among these complex interactions is the occurrence of inundation, which affects the temporary variations in water level and inundation extent [76,77].
The lake receives runoff from the catchment area through five tributary rivers: the Xiu, Gan, Fu, Xin, and Rao Rivers. It then discharges into the Yangtze River via the narrow outlet known as Hukou, situated at the northern extremity of the lake. During the flood period spanning from April to June, a significant surge in pressure occurs due to the presence of the largest outflow directed towards the Yangtze River. Once the blocking pressure is over a threshold, an outflow blocking effect is created, and reverse flow will be induced from the Yangtze River into Poyang Lake [58]. The blocking effect flow will be further amplified when the discharge of Poyang Lake reaches the peak from July to September [53]. The runoff from the tributaries dramatically dropped to the lowest level from November to December, leading to the emergence of a wide range of typical shallow wetlands and shoals, which facilitated the beaching of microplastics. The spatial and temporal patterns of these two hydrological processes reveal significant fluctuations in the water level and surface area both within and between different years [53].
During the period from July to February, the reduction in discharge rates of microplastics into the Yangtze River was attributed to several reasons. For instance, the decrease in the high water-level period (July to September) primarily results from the reverse flow into Poyang Lake. However, during the low water-level period, the discharge rates of microplastics are predominantly influenced by Poyang Lake’s catchment, and the impact of the Yangtze River is negligible. Here, the variations in the discharge rates of microplastics prioritize the lake–river hydrodynamics during different water level periods in Poyang Lake.

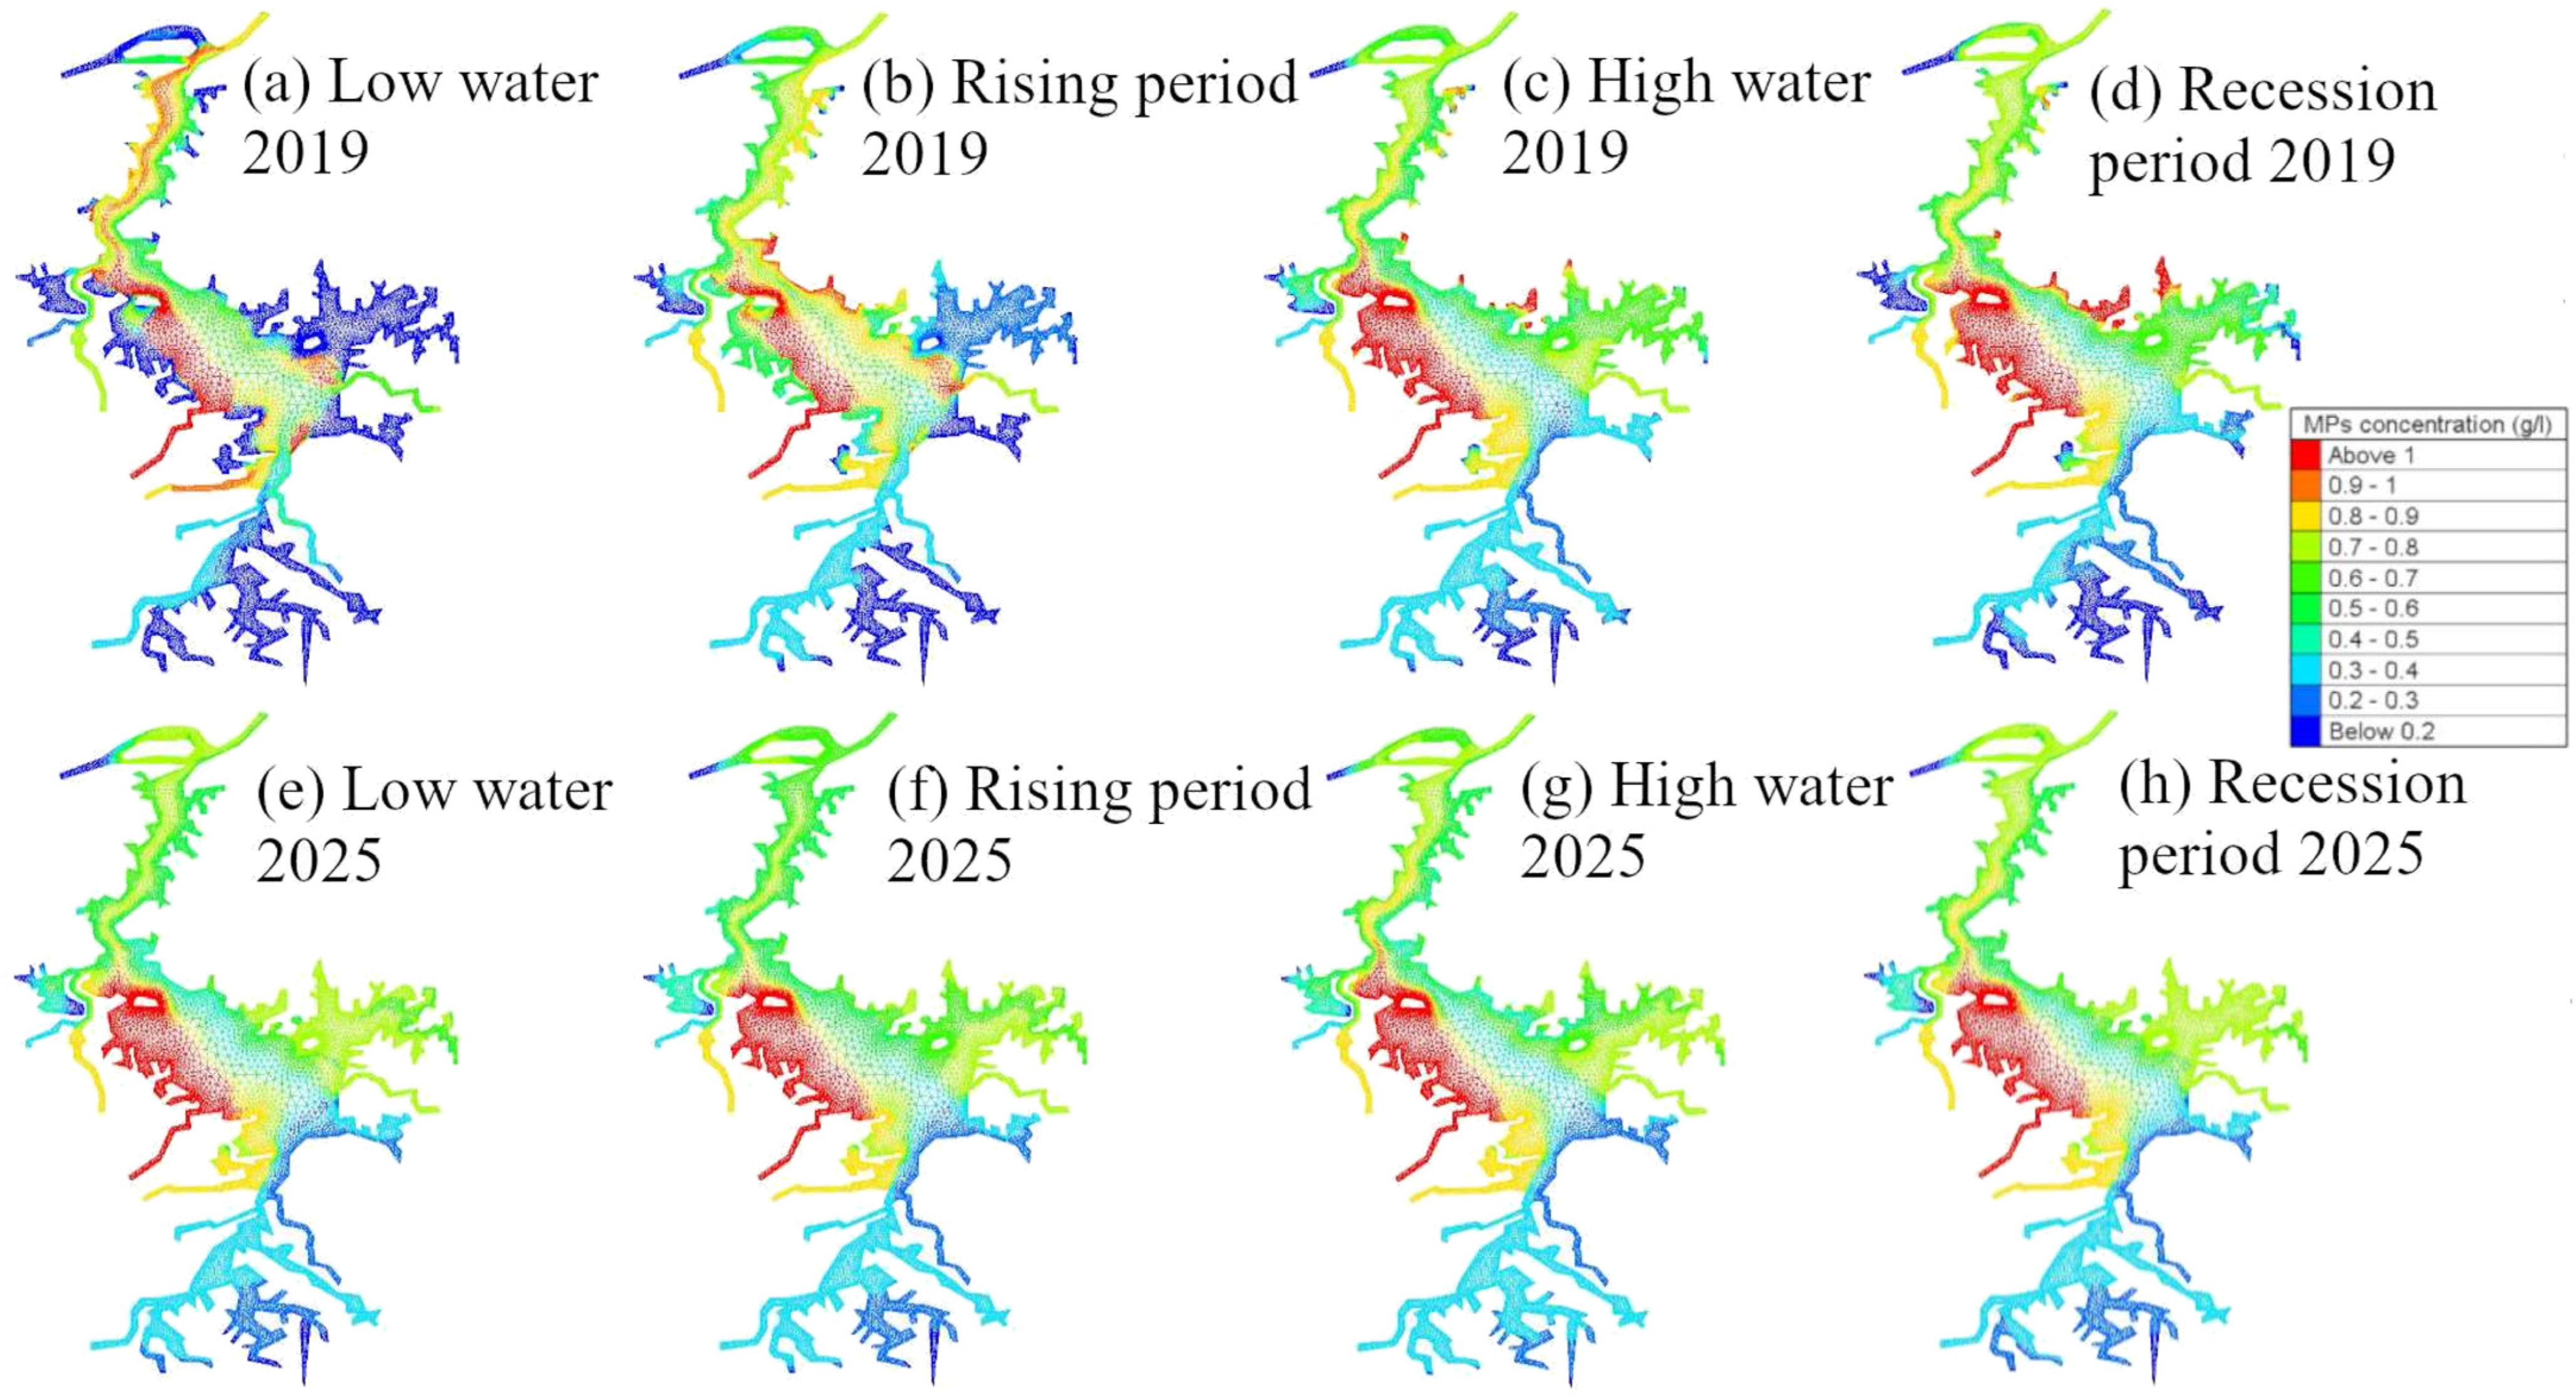
4.2. The Distribution of Microplastics in Floods and Droughts

The distribution of microplastics in the flood period and drought period varied heterogeneously in space (Figure 8). During the floods, more microplastics appeared on the western shoreline than the eastern region. That may be because runoff in the Gan River, located on west side, is greater than that in the eastern tributary, the Xin River. Owing to the strong runoff in the western region, the microplastics will be transported to other regions with the flow if there is no continuous microplastic influx from tributaries into the lake (Figure 8). The simulation model we employed does not incorporate the year-to-year and seasonal trends in plastic inputs, primarily due to the lack of data related to these specific variations. When compared with the extremely high microplastic concentrations in the western region during the first few months, the relatively less affected areas are situated in the eastern region, which can be attributed to fewer plastic debris sources, i.e., only the Rao River in the eastern region. Note that runoff is significantly reduced during drought periods, which may cause the microplastic accumulation on the eastern shoreline (Figure 6). During the droughts in 2019 and 2025, a large area of local shallow shoals and meandering shoreline on the eastern region were beneficial for the accumulation of microplastics, which reinforces the key role of water level fluctuation and emphasizes its effect on the assessment of microplastics pollution in similarly complex floodplain lakes. The water level fluctuations from 2018 to 2025 yielded distinctive responses among the five selected sites (Figure 7). During periods of elevated water levels, there was a moderate rise in microplastic concentrations at S1 and S5 (S1: 7.99 ± 0.61%; S5: 1.29 ± 0.91%) compared to the mean values. Additionally, a more substantial increase in MP concentrations was observed at S2, S3, and S4 (S2: 20.92 ± 0.03%; S3: 18.47 ± 0.37%; S4: 41.44 ± 0.59%). These observations suggest that the periodic water level fluctuations contributed to the accumulation of MP concentrations within the central regions of the Poyang Lake system. Despite the absence of existing literature on water level fluctuations and microplastic abundance within lake systems, our findings align closely with a study by Oo et al. [78]. In their investigation, the abundance of microplastics was directly linked to tidal fluctuations, resulting in the accumulation of microplastics in the estuary under study. These results suggest that the distribution of microplastic concentrations is closely connected to hydrodynamic conditions and topographical features.
In a realistic environment, one can speculate the increasing river discharge resulting in an increase in microplastic concentrations. According to Tramoy et al. [79], flood events may effectively flush plastic debris downwards owing to the high flow rates. There are some mechanisms behind this: (1) indirect microplastic flux from tributaries; (2) resuspension from the bottom and shoreline; and (3) direct input into lakes or riverine systems, which is closely related to dense inhabitation and anthropogenic activities including agriculture, shipping, and fisheries [80].
Around Poyang Lake, there are a total of seven wastewater treatment plants, with five located in the northern region and two in the central region. The sewage effluents from these plants contribute to a huge number of plastic pollutants into the lake. More than ten thousand vessels and one hundred thousand people live on the fishery in Poyang Lake. Hence, vigorous fishing activities may also serve as a significant source of microplastic pollution [63]. Moreover, urbanization and industrialization are believed to lead to local microplastic pollution [81], although these processes are not balanced in the Poyang Lake district. More specifically, the peripheral region has a higher level of economic development, and economic variations exist between the east and the west [18]. It is important to note that the microplastic input also corresponds to emissions from peripheral inhabitants and fishery activities in Poyang Lake. Even though there are numerous microplastic sources, the input from rivers exerts a great contribution to microplastic pollution [31,80,82]. The riverine microplastic sources in our study can, therefore, demonstrate a relatively good agreement with in situ observations [50,63].
The identification of input sources and their respective contributions can be utilized in future studies, provided that the relevant data are available. However, our simulation model does not encompass anthropogenic activities. It is necessary to conduct additional research to assess the microplastic contamination stemming from anthropogenic actions, particularly within economically developed urban areas with high population densities.

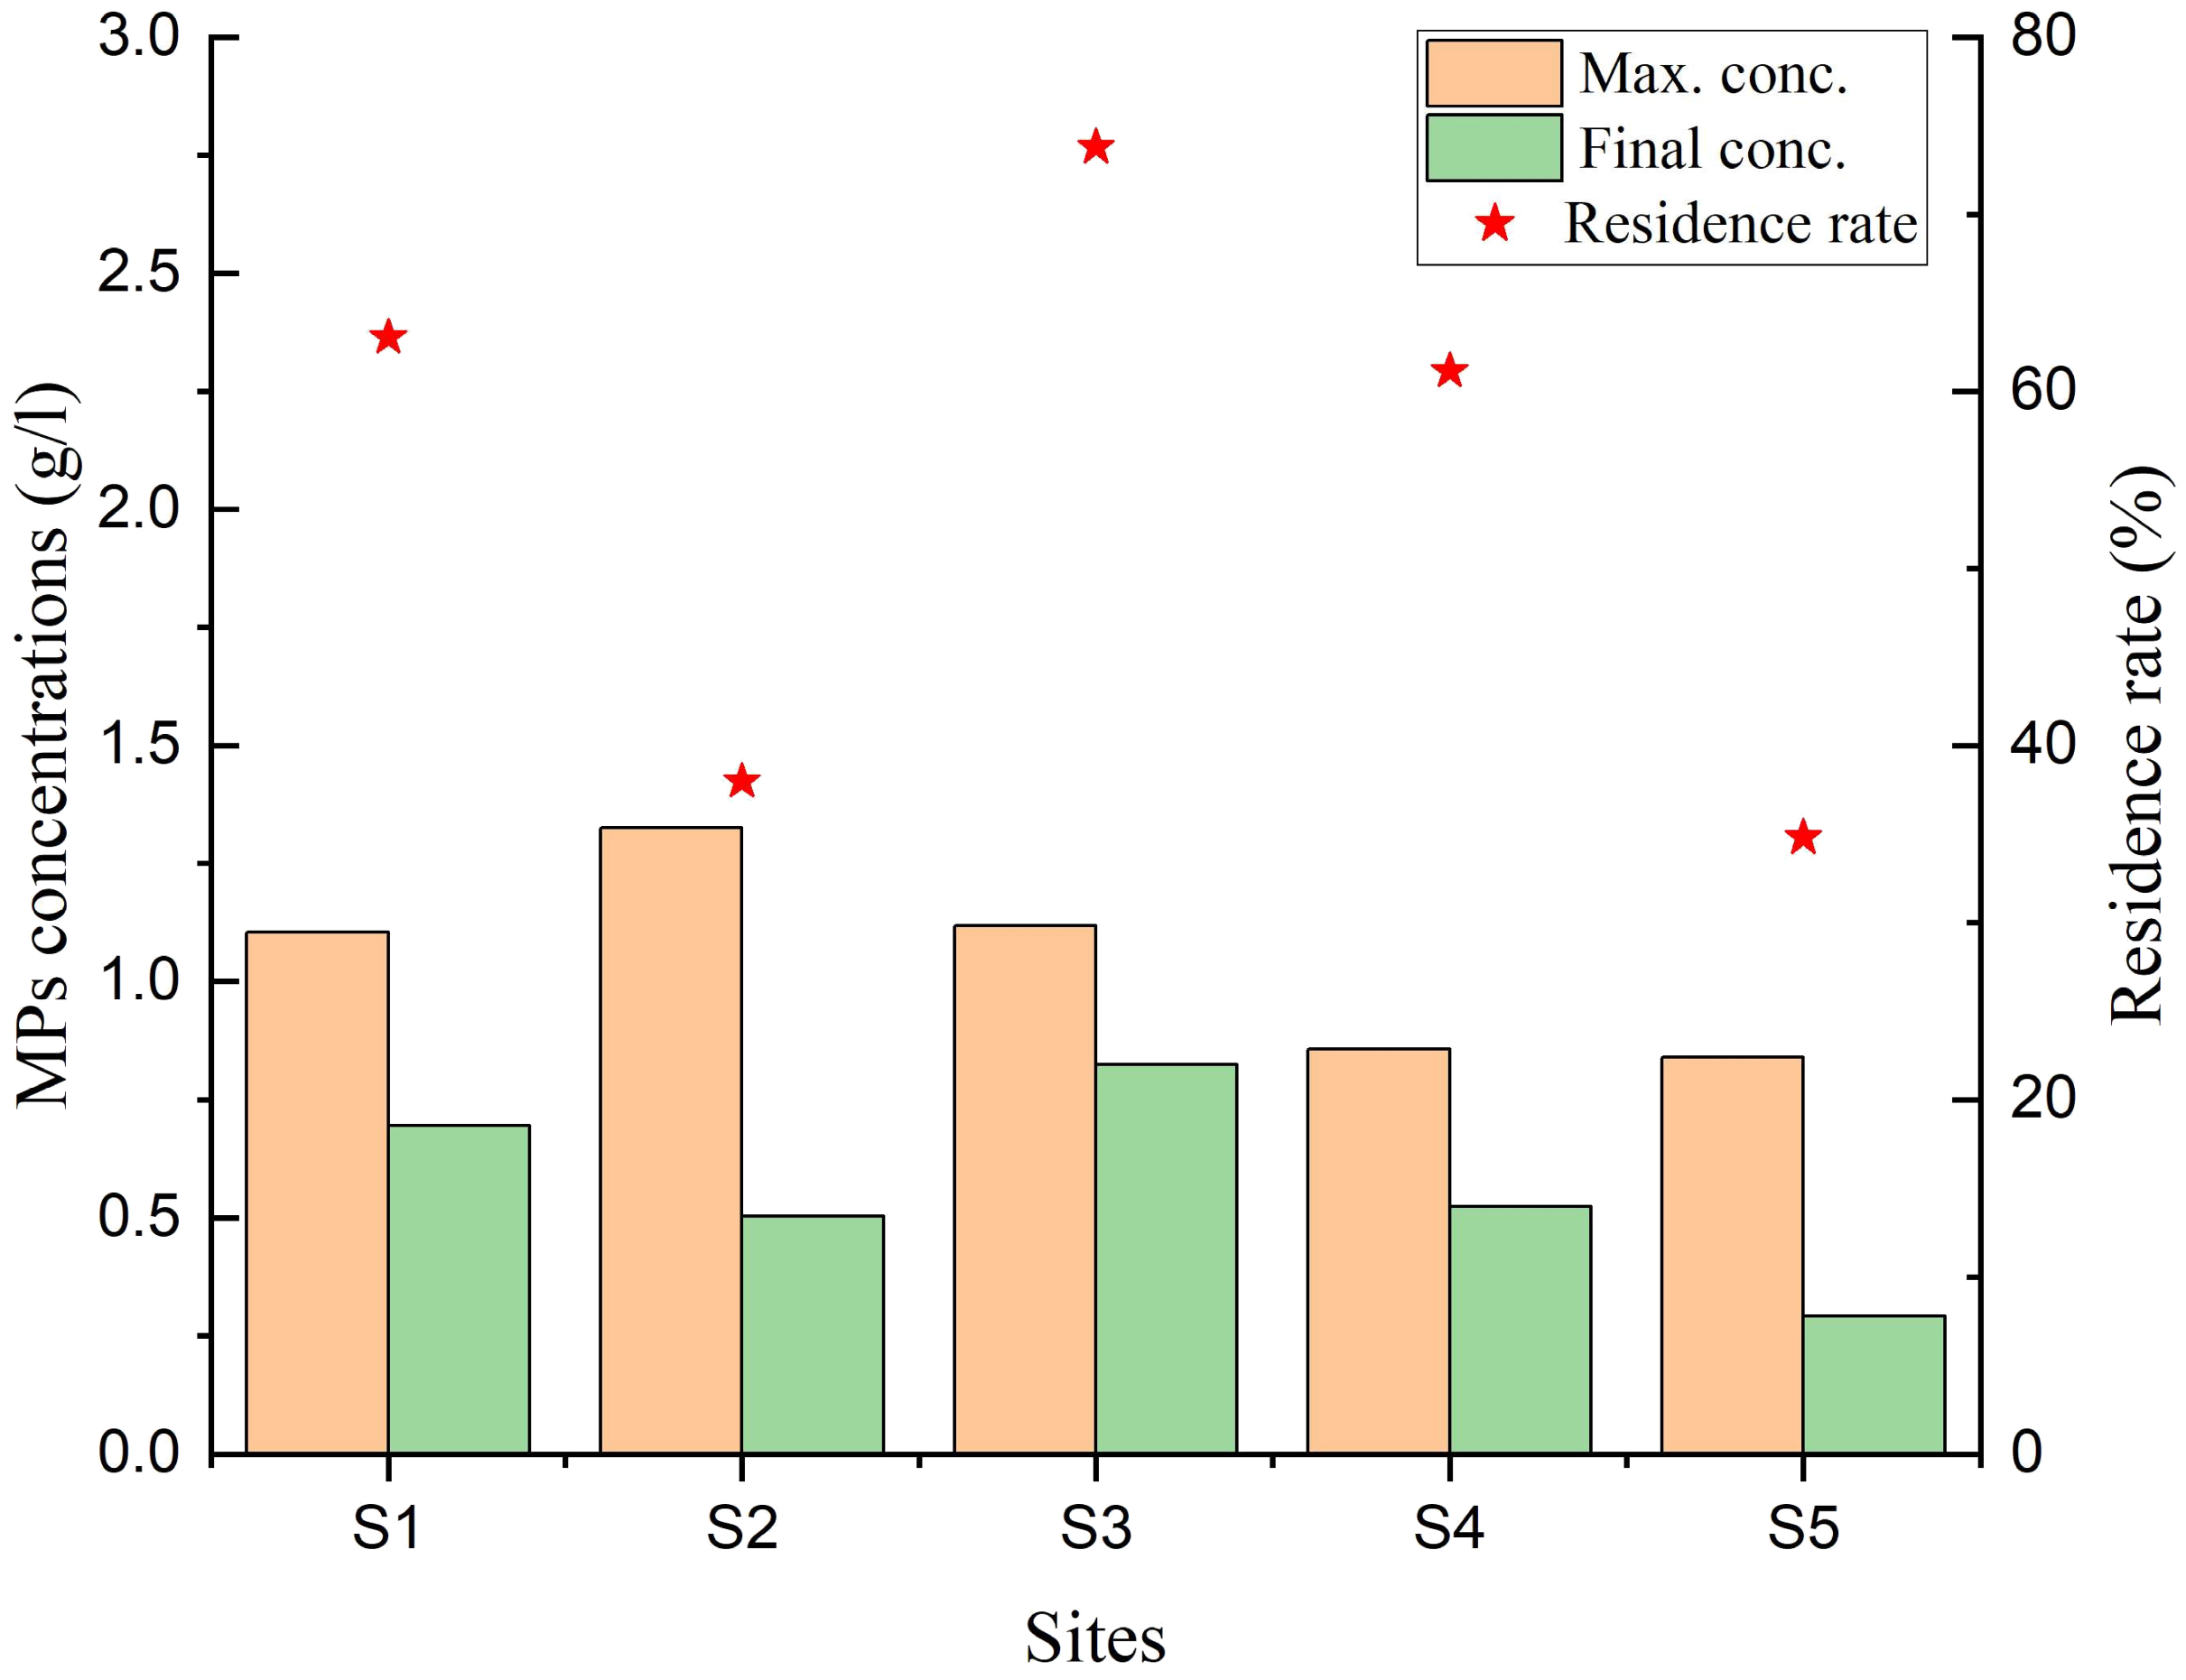
4.3. The Microplastic Residence Rate in Poyang Lake

The residence rate of microplastics refers to the proportion or percentage of microplastic particles that remain within a given environment over a certain period, which plays a crucial role in understanding the fate and persistence of contaminants within the water column and associated ecosystems. Microplastics exhibit various behaviors that influence their residence time, including buoyancy, settling velocity, and interactions with organisms and environmental factors [83]. Factors such as the influx of microplastics from external sources, the characteristics of the lake itself, sedimentation processes, and degradation mechanisms all contribute to the residence rate. Additionally, the interactions between microplastics and lake organisms, such as zooplankton and fish, can affect their residence time and potential bioaccumulation in the food web [84]. Furthermore, the extended residence period of the lake water would facilitate the breakdown of larger plastic items into microplastics, leading to their ongoing accumulation in the respective regions. By investigating and understanding the residence rate of microplastics, one can gain insights into their distribution, transport, and ecological impacts within lake ecosystems.
In the Poyang Lake system, the residence rates moderately differ between the western and eastern region of Poyang Lake (one-way ANOVA, p = 0.19). Approximately 50% of microplastics will still be retained in the western and eastern regions in 2025, especially the shallow shoals and shoreline. The long residence time is likely due to the highly complex and unstable hydrodynamic conditions in the Poyang Lake water system. For instance, the flow velocity is relatively high in the western region, where floating microplastics may flush into the outlet of the lake or dissipate to other regions. Additionally, the dramatic water level fluctuation during seasonal flood and drought switching may enhance the accumulation and result in longer residence times of microplastics in stagnant areas, such as the eastern region. Intrinsic and extrinsic factors, including particle size, polymer density, water temperature, and hydrodynamics, have notable influences on the residence times of microplastics [38,83,85] and thus control the transport of microplastics and their potential threat to the environment [84,86]. Our model reveals the behavior of the microplastics over the extent of the entire lake system with respect to hydrodynamic conditions and breaks the spatiotemporal limit to simulate residence times in the Poyang Lake system.
The proposed model does not incorporate the intricate biological and chemical processes within lake systems, which shows the necessity for further investigations into the mechanisms that govern the distribution and residence times of microplastics within lake systems, particularly under conditions of high hydrodynamic instability. Although it is commonly acknowledged that irregular particles tend to have longer residence times than spheres due to increased drag forces acting on them, particle shape and roundness exert a lesser impact on microplastic residence times than factors such as density and size [85]. As a result, treating each microplastic as a regular Euclidean particle in our model does not pose a technical challenge when simulating their transport.

5. Conclusions

In this study, we conducted a numerical simulation using the TELEMAC-2D model coupled with the GAIA module to investigate the transport of microplastics under water level fluctuations in Poyang Lake. The conclusions are summarized as follows:
(1) The TELEMAC-2D model and GAIA module can simulate the transport of microplastics in Poyang Lake. The simulation results revealed significant spatial heterogeneity in the distribution of microplastics within the lake. Specifically, the western shoreline exhibited high levels of microplastic contamination, attributed to the greater runoff from the Gan River during flood events. Furthermore, the periodic fluctuations in water levels and the lake’s topography were found to be key factors influencing the distribution of microplastics in the lake.
(2) Seasonal variations in the distribution of microplastic concentrations were observed, with an increase in the flood season and a gradual decrease in the drought season. Microplastics were found to accumulate on the eastern shoreline due to weak runoff in that region during droughts. Furthermore, the microplastic influx from Poyang Lake into the Yangtze River demonstrated seasonal peaks in discharge rates in August and a trough in April. These variations can be attributed to the intricate interactions and inundation events within the system. The findings highlight the significance of considering the hydrodynamic processes and complex dynamics of the Poyang Lake catchment river system in the management and mitigation of microplastic pollution.
(3) The residence rate of microplastics in Poyang Lake signifies the proportion of microplastic particles that remain within the lake system over time. A moderate difference in residence rates was observed between the western and eastern regions of Poyang Lake (one-way ANOVA, p = 0.19). By 2025, according to the models, approximately 50% of microplastics will persist in the lake system, particularly in the shallow shoals and shoreline areas. It is important to note that the model employed in this study did not consider biological and chemical processes, emphasizing the necessity for future research to gain a better understanding of these complex factors.

Author Contributions

Conceptualization, Y.Z.; methodology, Y.Z.; writing—original draft, Y.Z.; funding acquisition, Y.Z. and W.D.; supervision, W.D.; writing—review and editing, W.D and X.L.; software, X.L. All authors have read and agreed to the published version of the manuscript.

Funding

This research was funded by the National Key Research and Development project (2022YFC3105900), the Science and Technology Research Project of Water Resources Department of Jiangxi Province of China (Grant Nos. 202325ZDKT20 & 202123YBKT12), the Science and Technology Research Project of Water Resources Department of Jiangsu Province of China (Grant No. 2021020), and the Science and Technology Research Project of Education Department of Jiangxi Province of China (Grant No. GJJ215906).

Data Availability Statement

The data presented in this study are available on request from the first author (Y.Z.).

Acknowledgments

This study was carried out at College of Water Conservancy and Hydropower Engineering, Hohai University, China.

Conflicts of Interest

The authors declare no conflict of interest.

References

  1. Alomar, C.; Estarellas, F.; Deudero, S. Microplastics in the mediterranean sea: Deposition in coastal shallow sediments, spatial variation and preferential grain size. Mar. Environ. Res. 2016, 115, 1–10. [Google Scholar] [CrossRef] [PubMed]
  2. Kanhai, L.D.K.; Gårdfeldt, K.; Lyashevska, O.; Hassellöv, M.; Thomicroplasticson, R.C.; O’Connor, I. Microplastics in sub-surface waters of the Arctic Central Basin. Mar. Pollut. Bull. 2018, 130, 8–18. [Google Scholar] [CrossRef] [PubMed]
  3. Peeken, I.; Primpke, S.; Beyer, B.; Gütermann, J.; Katlein, C.; Krumpen, T.; Bergmann, M.; Hehemann, L.; Gerdts, G. Arctic sea ice is an important temporal sink and means of transport for microplastic. Nat. Commun. 2018, 9, 1505. [Google Scholar] [CrossRef]
  4. Sun, J.; Zhu, Z.; Li, W.; Yan, X.; Wang, L.; Zhang, L.; Jin, J.; Dai, X.; Ni, B. Revisiting microplastics in landfill leachate: Unnoticed tiny microplastics and their fate in treatment works. Water. Res. 2021, 190, 116784. [Google Scholar] [CrossRef] [PubMed]
  5. Weiss, L.; Ludwig, W.; Heussner, S.; Canals, M.; Ghiglione, J.; Estournel, C.; Constant, M.; Kerherve, P. The missing ocean plastic sink: Gone with the rivers. Science 2021, 373, 107–111. [Google Scholar] [CrossRef]
  6. Andrady, A.L. Microplastics in the marine environment. Mar. Pollut. Bull. 2011, 62, 1596–1605. [Google Scholar] [CrossRef]
  7. Pathak, V.M. Review on the current status of polymer degradation: A microbial approach. Bioresour. Bioprocess. 2017, 4, 15. [Google Scholar] [CrossRef]
  8. Da Costa, J.P.; Nunes, A.R.; Santos, P.S.M.; Girão, A.V.; Duarte, A.C.; Rocha-Santos, T. Degradation of polyethylene microplastics in seawater: Insights into the environmental degradation of polymers. J. Environ. Sci. Health A 2018, 53, 866–875. [Google Scholar] [CrossRef]
  9. Corcoran, P.L.; Belontz, S.L.; Ryan, K.; Walzak, M.J. Factors controlling the distribution of microplastic particles in benthic sediment of the thames river, Canada. Environ. Sci. Technol. 2020, 54, 818–825. [Google Scholar] [CrossRef]
  10. Sgier, L.; Freimann, R.; Zupanic, A.; Kroll, A. Flow cytometry combined with viSNE for the analysis of microbial biofilms and detection of microplastics. Nat. Commun. 2016, 7, 11587. [Google Scholar] [CrossRef]
  11. Hartmann, N.B.; Rist, S.; Bodin, J.; Jensen, L.H.; Schmidt, S.N.; Mayer, P.; Meibom, A.; Baun, A. Microplastics as vectors for environmental contaminants: Exploring sorption, desorption, and transfer to biota. Integr. Environ. Asses. 2017, 13, 488–493. [Google Scholar] [CrossRef]
  12. Caruso, G. Microplastics as vectors of contaminants. Mar. Pollut. Bull. 2019, 146, 921–924. [Google Scholar] [CrossRef] [PubMed]
  13. Wu, X.; Pan, J.; Li, M.; Li, Y.; Bartlam, M.; Wang, Y. Selective enrichment of bacterial pathogens by microplastic biofilm. Water. Res. 2019, 165, 114979. [Google Scholar] [CrossRef]
  14. Li, B.; Li, B.; Jia, Q.; Hong, B.; Xie, Y.; Yuan, X.; Peng, J.; Cai, Y.; Yang, Z. Source or sink role of an urban lake for microplastics from Guangdong-Hong Kong-Macao greater bay area, China. Environ. Res. 2023, 224, 115492. [Google Scholar] [CrossRef] [PubMed]
  15. Mercy, F.T.; Alam, A.R.; Akbor, M.A. Abundance and characteristics of microplastics in major urban lakes of Dhaka, Bangladesh. Heliyon 2023, 9, e14587. [Google Scholar] [CrossRef] [PubMed]
  16. Koelmans, A.A.; Redondo-Hasselerharm, P.E.; Nor, N.H.M.; Gouin, T. On the probability of ecological risks from microplastics in the Laurentian Great lakes. Environ. Pollut. 2023, 325, 121445. [Google Scholar] [CrossRef]
  17. Isobe, A.; Iwasaki, S. The fate of missing ocean plastics: Are they just a marine environmental problem? Sci. Total Environ. 2022, 825, 153935. [Google Scholar] [CrossRef] [PubMed]
  18. Liu, Z.; Wang, X.; Jia, S.; Mao, B. Multi-methods to investigate spatiotemporal variations of nitrogen-nitrate and its risks to human health in China’s largest fresh water lake (Poyang Lake). Sci. Total Environ. 2023, 863, 160975. [Google Scholar] [CrossRef]
  19. Pilechi, A.; Mohammadian, A.; Murphy, E. A numerical framework for modeling fate and transport of microplastics in inland and coastal waters. Mar. Pollut. Bull. 2022, 184, 114119. [Google Scholar] [CrossRef]
  20. Monsen, N.E.; Cloern, J.E.; Lucas, L.V.; Monismith, S.G. A comment on the use of flushing time, residence time, and age as transport time scales. Limnol. Oceanogr. 2002, 47, 1545–1553. [Google Scholar] [CrossRef]
  21. Manzoor, S.; Naqash, N.; Rashid, G.; Singh, R. Plastic material degradation and formation of microplastic in the environment: A review. Mater. Today-Proc. 2022, 56, 3254–3260. [Google Scholar] [CrossRef]
  22. Dean, B.Y.; Corcoran, P.L.; Helm, P.A. Factors influencing microplastic abundances in nearshore, tributary and beach sediments along the Ontario shoreline of Lake Erie. J. Great. Lakes. Res. 2018, 44, 1002–1009. [Google Scholar]
  23. Imhof, H.K.; Wiesheu, A.C.; Anger, P.M.; Niessner, R.; Ivleva, N.P.; Laforsch, C. Variation in plastic abundance at different lake beach zones—A case study. Sci. Total Environ. 2018, 613, 530–537. [Google Scholar]
  24. Garello, N.A.; Blettler, M.C.M.; Espínola, L.A.; Rodrigues, S.; Rimondino, G.N.; Wantzen, K.M.; Rabuffetti, A.P.; Girard, P.; Malanca, F.E. Microplastics distribution in riverside bars: The combined effects of water level and wind intensity. Sci. Total Environ. 2023, 897, 165406. [Google Scholar]
  25. Campanale, C.; Suaria, G.; Bagnuolo, G.; Baini, M.; Galli, M.; De Rysky, E.; Ballini, M.; Aliani, S.; Fossi, M.C.; Uricchio, V.F. Visual observations of floating macro litter around Italy (Mediterranean Sea). Mediterr. Mar. Sci. 2019, 20, 271–281. [Google Scholar] [CrossRef]
  26. Hengstmann, E.; Weil, E.; Wallbott, P.C.; Tamminga, M.; Fischer, E.K. Microplastics in lakeshore and lakebed sediments-External influences and temporal and spatial variabilities of concentrations. Environ. Res. 2021, 197, 111141. [Google Scholar]
  27. Fossi, M.C.; Romeo, T.; Baini, M.; Panti, C.; Marsili, L.; Campani, T.; Canese, S.; Galgani, F.; Druon, J.; Airoldi, S.; et al. Plastic debris occurrence, convergence areas and fin whales feeding ground in the Mediterranean marine protected area pelagos sanctuary: A modeling approach. Front. Mar. Sci. 2017, 4, 167. [Google Scholar] [CrossRef]
  28. Mansui, J.; Molcard, A.; Ourmières, Y. Modelling the transport and accumulation of floating marine debris in the Mediterranean basin. Mar. Pollut. Bull. 2015, 91, 249–257. [Google Scholar] [CrossRef]
  29. Zambianchi, E.; Trani, M.; Falco, P. Lagrangian transport of marine litter in the Mediterranean Sea. Front. Env. Sci-Switz. 2017, 5, 5. [Google Scholar] [CrossRef]
  30. Politikos, D.V.; Ioakeimidis, C.; Papatheodorou, G.; Tsiaras, K. Modeling the fate and distribution of floating litter particles in the Aegean Sea (E. Mediterranean). Front. Mar. Sci. 2017, 4, 191. [Google Scholar] [CrossRef]
  31. Liubartseva, S.; Coppini, G.; Lecci, R.; Clementi, E. Tracking plastics in the mediterranean: 2D Lagrangian model. Mar. Pollut. Bull. 2018, 129, 151–162. [Google Scholar] [CrossRef]
  32. De Leo, A.; Cutroneo, L.; Sous, D.; Stocchino, A. Settling velocity of microplastics exposed to wave action. J. Mar. Sci. Eng. 2021, 9, 142. [Google Scholar] [CrossRef]
  33. Castro-Jiménez, J.; González-Fernández, D.; Fornier, M.; Schmidt, N.; Sempéré, R. Macro-litter in surface waters from the rhone river: Plastic pollution and loading to the NW Mediterranean Sea. Mar. Pollut. Bull. 2019, 146, 60–66. [Google Scholar] [CrossRef]
  34. Nizzetto, L.; Bussi, G.; Futter, M.N.; Butterfield, D.; Whitehead, P.G. A theoretical assessment of microplastic transport in river catchments and their retention by soils and river sediments. Environ. Sci. Proc. Imp. 2016, 18, 1050–1059. [Google Scholar] [CrossRef] [PubMed]
  35. Rummel, C.D.; Jahnke, A.; Gorokhova, E.; Kühnel, D.; Schmitt-Jansen, M. Impacts of Biofilm Formation on the Fate and Potential Effects of Microplastic in the Aquatic Environment. Environ. Sci. Tech. Let. 2017, 4, 258–267. [Google Scholar] [CrossRef]
  36. Hoellein, T.J.; Shogren, A.J.; Tank, J.L.; Risteca, P.; Kelly, J.J. Microplastic deposition velocity in streams follows patterns for naturally occurring allochthonous particles. Sci. Rep. 2019, 9, 3740. [Google Scholar] [CrossRef]
  37. Li, Y.; Li, M.; Li, Z.; Yang, L.; Liu, X. Effects of particle size and solution chemistry on triclosan sorption on polystyrene microplastic. Chemosphere 2019, 231, 308–314. [Google Scholar] [CrossRef]
  38. Waldschläger, K.; Schüttrumpf, H. Effects of Particle Properties on the Settling and Rise Velocities of Microplastics in Freshwater under Laboratory Conditions. Environ. Sci. Technol. 2019, 53, 1958–1966. [Google Scholar] [CrossRef]
  39. Kaandorp, M.L.A.; Dijkstra, H.A.; van Sebille, E. Closing the Mediterranean marine floating plastic mass budget: Inverse modeling of sources and sinks. Environ. Sci. Technol. 2020, 54, 11980. [Google Scholar] [CrossRef]
  40. Aoki, K.; Furue, R. A model for the size distribution of marine microplastics: A statistical mechanics approach. PLoS ONE 2021, 16, e0259781. [Google Scholar] [CrossRef]
  41. Klink, D.; Peytavin, A.; Lebreton, L. Size dependent transport of floating plastics modeled in the global ocean. Front. Mar. Sci. 2022, 9, 903134. [Google Scholar] [CrossRef]
  42. Aliani, S.; Molcard, A. Hitch-hiking on floating marine debris: Macrobenthic species in the Western Mediterranean Sea. Hydrobiologia 2003, 503, 59–67. [Google Scholar] [CrossRef]
  43. Liubartseva, S.; Coppini, G.; Lecci, R.; Creti, S. Regional approach to modeling the transport of floating plastic debris in the Adriatic Sea. Mar. Pollut. Bull. 2016, 103, 115–127. [Google Scholar] [CrossRef] [PubMed]
  44. Kooi, M.; Nes, E.H.V.; Scheffer, M.; Koelmans, A.A. Ups and downs in the ocean: Effects of biofouling on vertical transport of microplastics. Environ. Sci. Technol. 2017, 51, 7963. [Google Scholar] [CrossRef]
  45. Lobelle, D.; Kooi, M.; Koelmans, A.A.; Laufkotter, C.; Jongedijk, C.E.; Kehl, C.; van Sebille, E. Global Modeled Sinking Characteristics of Biofouled Microplastic. J. Geophys. Res-Oceans. 2021, 126, e2020JC017098. [Google Scholar] [CrossRef]
  46. Fischer, R.; Lobelle, D.; Kooi, M.; Koelmans, A.; Onink, V.; Laufkötter, C.; Amaral-Zettler, L.; Yool, A.; van Sebille, E. Modelling submerged biofouled microplastics and their vertical trajectories. Biogeosciences 2022, 19, 2211–2234. [Google Scholar] [CrossRef]
  47. Jalón-Rojas, I.; Wang, X.H.; Fredj, E. A 3D numerical model to track marine plastic debris (TrackMPD): Sensitivity of microplastic trajectories and fates to particle dynamical properties and physical processes. Mar. Pollut. Bull. 2019, 141, 256–272. [Google Scholar] [CrossRef]
  48. Shen, Z.; Wang, H.; Liang, D.; Yan, Y.; Zeng, Y. The fate of microplastics in estuary: A quantitative simulation approach. Water. Res. 2022, 226, 119281. [Google Scholar] [CrossRef] [PubMed]
  49. Shettigar, N.A.; Riom, W.; Bi, Q.; Toorman, E.A. Modelling Particle Size Distribution in TELEMAC-2D with Population Balance Method. Available online: https://www.researchgate.net/publication/367295146_Modelling_particle_size_distribution_in_TELEMAC-_2D_with_Population_Balance_Method (accessed on 19 October 2022).
  50. Jian, M.; Zhang, Y.; Yang, W.; Zhou, L.; Liu, S.; Xu, E.G. Occurrence and distribution of microplastics in China’s largest freshwater lake system. Chemosphere 2020, 261, 128186. [Google Scholar] [CrossRef]
  51. Wei, Y.; Zhang, J.; Zhang, D.; Tu, T.; Luo, L. Metal concentrations in various fish organs of different fish species from Poyang Lake, China. Ecotox. Environ. Safe. 2014, 104, 182–188. [Google Scholar] [CrossRef] [PubMed]
  52. Li, Y.; Zhang, Q.; Yao, J.; Werner, A.D.; Li, X. Hydrodynamic and hydrological modeling of the Poyang Lake catchment system in China. J. Hydrol. Eng. 2014, 19, 607–616. [Google Scholar] [CrossRef]
  53. Yao, J.; Zhang, Q.; Ye, X.; Zhang, D.; Bai, P. Quantifying the impact of bathymetric changes on the hydrological regimes in a large floodplain lake: Poyang Lake. J. Hydrol. 2018, 561, 711–723. [Google Scholar] [CrossRef]
  54. Guo, H.; Hu, Q.; Zhang, Q.; Feng, S. Effects of the three gorges dam on Yangtze River flow and river interaction with Poyang Lake, China: 2003–2008. J. Hydrol. 2012, 416, 19–27. [Google Scholar] [CrossRef]
  55. Feng, L.; Hu, C.; Chen, X.; Cai, X.; Tian, L.; Gan, W. Assessment of inundation changes of Poyang Lake using MODIS observations between 2000 and 2010. Remote Sens. Environ. 2012, 121, 80–92. [Google Scholar] [CrossRef]
  56. Zhang, Q.; Werner, A.D. Hysteretic relationships in inundation dynamics for a large lake–floodplain system. J. Hydrol. 2015, 527, 160–171. [Google Scholar] [CrossRef]
  57. Shankman, D.; Keim, B.D.; Song, J. Flood frequency in China’s Poyang Lake region: Trends and teleconnections. Int. J. Climatol. 2006, 26, 1255–1266. [Google Scholar] [CrossRef]
  58. Hu, Q.; Feng, S.; Guo, H.; Chen, G.; Jiang, T. Interactions of the Yangtze River flow and hydrologic processes of the Poyang Lake, China. J. Hydrol. 2007, 347, 90–100. [Google Scholar] [CrossRef]
  59. Jambeck, J.R.; Geyer, R.; Wilcox, C.; Siegler, T.R.; Perryman, M.; Andrady, A.; Narayan, R.; Law, K.L. Plastic waste inputs from land into the ocean. Science 2015, 347, 768–771. [Google Scholar] [CrossRef]
  60. Su, L.; Xue, Y.; Li, L.; Yang, D.; Kolandhasamy, P.; Li, D.; Shi, H. Microplastics in Taihu Lake, China. Environ. Pollut. 2016, 216, 711–719. [Google Scholar] [CrossRef]
  61. Zhang, K.; Su, J.; Xiong, X.; Wu, X.; Wu, C.; Liu, J. Microplastic pollution of lakeshore sediments from remote lakes in Tibet plateau, China. Environ. Pollut. 2016, 219, 450–455. [Google Scholar] [CrossRef]
  62. Wang, W.; Yuan, W.; Chen, Y.; Wang, J. Microplastics in surface waters of Dongting Lake and Hong Lake, China. Sci. Total Environ. 2018, 633, 539–545. [Google Scholar] [CrossRef] [PubMed]
  63. Yuan, W.; Liu, X.; Wang, W.; Di, M.; Wang, J. Microplastic abundance, distribution and composition in water, sediments, and wild fish from Poyang Lake, China. Ecotox. Environ. Safe. 2019, 170, 180–187. [Google Scholar] [CrossRef]
  64. Nakayama, T.; Shankman, D. Impact of the Three-Gorges Dam and water transfer project on Changjiang floods. Global. Planet. Chang. 2013, 100, 38–50. [Google Scholar] [CrossRef]
  65. Ye, X.; Zhang, Q.; Bai, L.; Hu, Q. A modeling study of catchment discharge to Poyang Lake under future climate in China. Quatern. Int. 2011, 244, 221–229. [Google Scholar] [CrossRef]
  66. Weber, C.J.; Opp, C. Spatial patterns of mesoplastics and coarse microplastics in floodplain soils as resulting from land use and fluvial processes. Environ. Pollut. 2020, 267, 115390. [Google Scholar] [CrossRef] [PubMed]
  67. Weber, C.J.; Opp, C.; Prume, J.A.; Koch, M.; Andersen, T.J.; Chifflard, P. Deposition and in-situ translocation of microplastics in floodplain soils. Sci. Total Environ. 2022, 819, 152039. [Google Scholar] [CrossRef]
  68. Jia, L.; Wen, Y.; Pan, S.; Liu, J.T.; He, J. Wave–current interaction in a river and wave dominant estuary: A seasonal contrast. Appl. Ocean. Res. 2015, 52, 151–166. [Google Scholar] [CrossRef]
  69. Hashemi, M.R.; Neill, S.P.; Robins, P.E.; Davies, A.G.; Lewis, M.J. Effect of waves on the tidal energy resource at a planned tidal stream array. Renew. Energ. 2015, 75, 626–639. [Google Scholar] [CrossRef]
  70. Audouin, Y.; Benson, T.; Delinares, M.; Fontaine, J.; Glander, B.; Huybrechts, N.; Kopmann, R.; Leroy, A.; Pavan, S.; Pham, C.T.; et al. Introducing GAIA, the brand new sediment transport module of the TELEMAC- MASCARET system. In Proceedings of the XXVI TELEMAC-MASCARET User Conference, Toulouse, France, 15–17 October 2019. [Google Scholar]
  71. Villaret, C.; Hervouet, J.M.; Kopmann, R.; Merkel, U.; Davies, A.G. Morphodynamic modeling using the Telemac finite-element system. Comput. Geosci. 2013, 53, 105–113. [Google Scholar] [CrossRef]
  72. Li, B.; Yang, G.S.; Wan, R.R.; Li, H.P. Hydrodynamic and water quality modeling of a large floodplain lake (Poyang Lake) in China. Inviron. Sci. Pollut. Res. 2018, 25, 35084–35098. [Google Scholar] [CrossRef]
  73. Deng, Z.M.; Zhang, X.; Xiao, Y.; Pan, G.Y. Study of evolution of water level in Poyang Lake and impact factors. Eng. J. Wuhan Univ. 2015, 48, 615–621. [Google Scholar]
  74. Zhang, D.; Chen, P.; Zhang, Q.; Li, X. Copula-based probability of concurrent hydrological drought in the Poyang lake-catchment-river system (China) from 1960 to 2013. J. Hydrol. 2017, 553, 773–784. [Google Scholar] [CrossRef]
  75. Ballent, A.; Corcoran, P.L.; Madden, O.; Helm, P.A.; Longstaffe, F.J. Sources and sinks of microplastics in Canadian lake ontario nearshore, tributary and beach sediments. Mar. Pollut. Bull. 2016, 110, 383–395. [Google Scholar] [CrossRef] [PubMed]
  76. Marks, K.; Bates, P. Integration of high-resolution topographic data with floodplain flow models. Hydrol. Process. 2000, 14, 2109–2122. [Google Scholar] [CrossRef]
  77. Malhadas, M.S.; Silva, A.; Leitão, P.C.; Neves, R. Effect of the bathymetric changes on the hydrodynamic and residence time in Óbidos lagoon (Portugal). J. Coastal Res. 2009, 56, 549–553. [Google Scholar]
  78. Oo, P.Z.; Boontanon, S.K.; Boontanon, N.; Tanaka, S.; Fujii, S. Horizontal variation of microplastics with tidal fluctuation in the Chao Phraya River estuary, Thailand. Mar. Pollut. Bull. 2021, 173, 112933. [Google Scholar] [CrossRef]
  79. Tramoy, R.; Gasperi, J.; Dris, R.; Colasse, L.; Fisson, C.; Sananes, S.; Rocher, V.; Tassin, B. Assessment of the plastic inputs from the seine basin to the sea using statistical and field approaches. Front. Mar. Sci. 2019, 6, 151. [Google Scholar] [CrossRef]
  80. De Carvalho, A.R.; Riem-Galliano, L.; ter Halle, A.; Cucherousset, J. Interactive effect of urbanization and flood in modulating microplastic pollution in rivers. Environ. Pollut. 2022, 309, 119760. [Google Scholar] [CrossRef] [PubMed]
  81. Dai, L.; Wang, Z.; Guo, T.; Hu, L.; Chen, Y.; Chen, C.; Yu, G.; Ma, L.Q.; Chen, J. Pollution characteristics and source analysis of microplastics in the Qiantang River in southeastern China. Chemosphere 2022, 293, 133576. [Google Scholar] [CrossRef]
  82. Lebreton, L.; Greer, S.; Borrero, J. Numerical modeling of floating debris in the world’s oceans. Mar. Pollut. Bull. 2012, 64, 653–661. [Google Scholar] [CrossRef]
  83. Elagami, H.; Ahmadi, P.; Fleckenstein, J.H.; Frei, S.; Obst, M.; Agarwal, S.; Gilfedder, B.S. Measurement of microplastic settling velocities and implications for residence times in thermally stratified lakes. Limnol. Oceanogr. 2022, 67, 934–945. [Google Scholar] [CrossRef]
  84. Nelms, S.E.; Galloway, T.S.; Godley, B.J.; Jarvis, D.S.; Lindeque, P.K. Investigating microplastic trophic transfer in marine top predators. Environ. Pollut. 2018, 238, 999–1007. [Google Scholar] [CrossRef] [PubMed]
  85. Ahmadi, P.; Elagami, H.; Dichgans, F.; Schmidt, C.; Gilfedder, B.S.; Frei, S.; Peiffer, S.; Fleckenstein, J.H. Systematic evaluation of physical parameters affecting the terminal settling velocity of microplastic particles in lakes using CFD. Front. Environ. Sci-Switz. 2022, 10, 875220. [Google Scholar] [CrossRef]
  86. D’Avignon, G.; Gregory-Eaves, I.; Ricciardi, A. Microplastics in lakes and rivers: An issue of emerging significance to limnology. Environ. Rev. 2022, 30, 228–244. [Google Scholar] [CrossRef]
Figure 1. Map of the water system of Poyang Lake including five inflow rivers and an outflow downstream of the Yangtze River.
Water 15 03658 g001
Figure 2. The time–averaged distribution of microplastic concentrations in Poyang Lake during (a) 2018–2019 and (b) 2020–2025.
Water 15 03658 g002
Figure 3. The water levels from June 2019 to December 2019 at different stations.
Water 15 03658 g003
Figure 4. Discharge rate of microplastics along the outflow boundary to the Yangtze River during 2018–2025.
Water 15 03658 g004
Figure 5. The residence rate at five selected sites in Poyang Lake and the outflow boundary.
Water 15 03658 g005
Figure 6. The time–averaged results of (a) water depth, (b) water flow velocity, and (c) microplastic concentrations over 2018–2025.
Water 15 03658 g006
Figure 7. Temporal variation in (a) microplastic concentrations and (b) water levels at the studied sites during 2018–2025.
Water 15 03658 g007
Figure 8. Two–dimensional distribution of microplastic concentrations in low water, rising, high water, and recession periods in 2019 and 2015.
Water 15 03658 g008
Table 1. Comparison of setup specifications for numerical modelling the transport of microplastics.
ReferenceType of ModelPhysicsBiofilm
Horizontal AdvectionVertical AdvectionGain via CollisionsGain via Growth Loss via RespirationLoss via Explicit Grazing Loss via Viral Lysis
Aliani and Molcard, 2003 [42]Lagrangian particle trackingx
Mansui et al., 2015 [28]Lagrangian particle trackingx
Zambianchi et al., 2017 [29]Markov chain model x
Liubartseva et al., 2016 [43]Markov chain modellingx
Fossi et al., 2017 [27]Lagrangian particle trackingx
Politikos et al., 2017 [30]Lagrangian particle trackingx
Liubartseva et al., 2018 [31]Lagrangian particle trackingx
Kooi et al., 2017 [44]Lagrangian particle tracking xxx
Lobelle et al., 2021 [45]Lagrangian particle trackingxxxxx
Fischer et al., 2022 [46]Lagrangian particle tracking xxxxxx
Jalón-Rojas et al., 2019 [47]Non-Lagrangian particle trackingx x
Shen et al., 2022 [48]Lagrangian particle trackingx x
Shettigar et al., 2022 [49]Population Balance Method based on TELEMAC-2Dx
This studyTELEMAC-2D coupled with GAIAx
Table 2. The simulation conditions of microplastic inflow to the calculation domain.
Inflow BoundaryConcentration of Microplastics
(g/L)
Size
(μm)
Density
(kg/m3)
Xin river0.28750910
Rao river0.72
Xiu river0.3
Gan river (north tributary)0.8
Gan river (middle tributary)1.05
Gan river (south tributary)0.85
Fu river (north tributary)0.35
Fu river (south tributary)0.35
Disclaimer/Publisher’s Note: The statements, opinions and data contained in all publications are solely those of the individual author(s) and contributor(s) and not of MDPI and/or the editor(s). MDPI and/or the editor(s) disclaim responsibility for any injury to people or property resulting from any ideas, methods, instructions or products referred to in the content.

