Article

A Framework for Assessing Nature-Based Urban Stormwater Management Solutions: A Preliminary Spatial Analysis Approach Applied to Southeast Serbia

by
Borislava Blagojević
1,*,
Ljiljana Vasilevska
1,
Dimitra Anđelković
1,
Aleksandar Bogojević
1,2 and
Sérgio Lousada
3,4,5,6,7,*
1
Faculty of Civil Engineering and Architecture, University of Niš, 18000 Niš, Serbia
2
Department of Civil Engineering, Ruhr University in Bochum, 44801 Bochum, Germany
3
Department of Civil Engineering and Geology (DECG), Faculty of Exact Sciences and Engineering (FCEE), University of Madeira (UMa), 9000-082 Funchal, Portugal
4
CITUR—Madeira—Research Centre for Tourism Development and Innovation, 9000-082 Funchal, Portugal
5
VALORIZA—Research Centre for Endogenous Resource Valorization, Polytechnic Institute of Portalegre (IPP), 9000-082 Portalegre, Portugal
6
Research Group on Environment and Spatial Planning (MAOT), University of Extremadura, 06071 Badajoz, Spain
7
RISCO—Civil Engineering Department, University of Aveiro, 3810-193 Aveiro, Portugal
*
Authors to whom correspondence should be addressed.
Water 2023, 15(20), 3604; https://doi.org/10.3390/w15203604
Submission received: 30 August 2023 / Revised: 12 October 2023 / Accepted: 12 October 2023 / Published: 15 October 2023
(This article belongs to the Special Issue Civil Engineering, Hydraulics and Hydrology)

Abstract

:
The development of the stormwater management strategies, e.g., low-impact development (LID), water-sensitive urban design (WSUD), and sustainable drainage solutions (SUDS), was initiated in the mid-1980s as a set of engineering approaches and technologies to reduce the harmful effects of stormwater. Over time, all of them evolved in the holistic, multidisciplinary approaches and, today, they are increasingly viewed and implemented under the umbrella term “Nature-based Solutions” (NbS). The technical elements and measures of these NbS represent various technical solutions, implemented i.a., according to the suitability of the site to achieve their maximum efficiency. Currently, there are no standards or procedures for the application of NbS technologies in Serbia. To overpass this and encourage implementation, we carried out preliminary assessment of NbS elements suitability for application in eight urban settlements in the Region of Southern and Eastern Serbia. The assessment is based on publicly available data and performed according to the existing recommendations in the field of spatial planning and rainwater management for WSUD. The analyses were conducted by GIS tools that involved spatial analyses of various terrain characteristics and provided an insight into the criteria, i.e., constraints that are key to the placement of various technical elements, including bioretention, rain garden, and permeable pavement. Research findings point out that creation of the thematic maps with area suitability ratings for individual NbS stormwater elements might represent a good starting point for further investigation, planning, and design. The proposed framework for preliminary assessment is potentially useful for the countries and regions without regulations in the field of NbS for stormwater management.

1. Introduction

Rapid urbanization and climate change are decades-long global development trends and risks that, among other things, have shaped three basic challenges at the urban level that need to be urgently addressed: (1) improving the quality of life in cities, (2) reducing their ecological footprint, and (3) adapting cities to climate change [1]. One of the recognized problems within the aforementioned risks and challenges is the increasingly frequent flooding caused by stormwater, both at the macro and micro urban level. In an attempt to solve this problem in a sustainable and innovative way, several modern stormwater management (SM) approaches have been developed in the last few decades. The best known are Water Sensitive Urban Design (WSUD) in Australia [2,3,4], Sustainable Drainage System (SuDS) and Sustainable Urban Drainage System (SUDS) in Great Britain [5,6,7,8], Best Management Practices (BMPs) [9,10] and low-impact development (LID) in the United States [11,12,13], Alternative Techniques (ATs) in French-speaking countries [14], and source control in Canada [10].
Initially, their origin and purpose were motivated by the specific characteristics and problems of each country. Although the approaches were conceptually based in a completely different way compared to traditional SM, to replace and/or increase the capacity of the existing drainage system in urban watersheds by imitating the natural environment and cycle [13], the approaches had an emphasized engineering dimension and were primarily engaged in finding technical solutions for the problems of flooding of urban areas, reducing the amount of surface runoff, and improving its quality. However, most of them evolved in the meantime into integrated approaches, primarily in the sense of considering and including other development aspects—spatial, ecological, and social, as well as additional benefits of their application. It can be said that, today, almost all of the approaches are holistic. Moreover, their evolution enabled synergy with current urban planning and design concepts, primarily with those that are eco-oriented. Namely, these concepts, which were introduced in the last few decades in the wider discussions on global development changes, are also based on (re)integrating nature and natural processes into urban areas, which is increasingly considered as a sustainable solution for reduction or removal of the effects of rapid urbanization and climate change adaptation [15].
Four of the recently developed eco-oriented urban concepts, which have gained prominence in academic debates and are increasingly referred to in policy making, are the following: (1) Nature-based Solutions (NbS) [16,17]; (2) Ecosystem-based Adaptations (EbA) [18,19]; (3) Urban Green Infrastructure (UGI) [20]; and (4) Ecosystem Services (ESS) [21,22]. Due to numerous descriptions and the broad range of interested stakeholders who promote them, it is difficult to establish clear differences between these concepts and to determine their precise relationships. In addition, the concepts are closely interrelated, partly overlap, and partly complement each other [23]. They share many features, starting with urban green (and blue) spaces as their basic elements, multi-functionality, and the provision of multiple ESS, which could be the most widely used to enhance the role of nature in decision making [24]. It can be said that the biggest differences between concepts arise from the breadth of the scope and level of operationalization of each of them [23].
Focusing on the relation between eco-oriented approaches, especially NbS, and SM approaches, it can be concluded that there is a strong synergy between them; moreover, NbS can be considered the umbrella approach of the SM approaches. Our research is based on this initial assumption.
Preconditions for the origin and later evolution of modern SM approaches and their involvement and synergy with eco-oriented urban concepts and policy appeared under the paradigm “living with water” in the early 1980s, when there was a shift from the concept of water as “urban and city life enemy” and “hidden element behind pipes” towards water as an “element that contributes to the quality of life” [25]. In addition to creating opportunities for integrating modern approaches into the urban planning and design process, these circumstances have also led to radical changes in the urban planning and design paradigm [26], primarily in terms of the evolution of the role of urban SM in the planning process, their conceptual and methodological framework, and cumulative socio-economic and ecological benefits. The basic intention of the new conceptual framework is to establish a greater harmony between water as a key resource and the community in a sustainable, socially rational, and responsible way [27]. A close connection with nature and its involvement into the urban environment are at the core of this paradigm shift. In line with this, modern SM approaches offer a set of different technologies and treatment modes, which also represent evolution and innovation in relation to the traditional approach. There are four basic modes of runoff treatment, which can be applied separately or in combination: (1) infiltration; (2) disposal; (3) storage; and/or (4) re-use [28]. Each of them implies implementation of different technical elements. Although the typology and significance of an element varies depending on the approach [5,6,7], in general, technical elements are similar and serve the same purpose. The most known technical elements are (1) swales (dry or wet); (2) bioretentions; (3) trenches; (4) sand filters; (5) ponds and lakes; (6) porous paving; (7) wetlands; (8) rainwater tanks; (9) elements of landscape architecture; and 10) green roofs. Best practice examples indicate that the most widely used technical elements are bioretentions (i.e., rain gardens), vegetated swales, porous paving, and green roofs [29].
While developed countries have arrived to procedures, standards, and technical design solutions for elements in the SM NbS approach, the institutional implementation of this approach in developing countries like Serbia is limited due to the lack of an established planning framework, procedures, and standards [30]. The countries that join NbS SM approach in the current development phase can capitalize on the achievements to date, including growing scientific evidence about benefits, e.g., [29,31], detailed design guides and standard drawings [32], performance modelling software, e.g., EPA SWMM [33], but, also, the proofs about the malfunction [34]. Moreover, the source data required for evaluating preliminary options for NbS stormwater element implementation are now mostly publicly available on a regional, national, or global scale.
Therefore, the research goal in this paper is to propose a framework for a preliminary analysis concerning suitability of NbS for stormwater management. Furthermore, the proposed framework implicitly facilitates co-ordination among various stakeholders in the urban planning process. The proposed framework relies on publicly available data sources and is applied to urban settlements in the Region of Southern and Eastern Serbia.
In an attempt to suggest a conceptual framework for implementing the NbS SM approach, our research complements the three-stage framework for a city/region that has been proposed for incorporation of WSUD into local urban plans [35]. Stage 1 treats WSUD technology parameters from an engineering perspective and stage 2 from an urban planning perspective. Stages 1 and 2 are conducted in parallel. Stage 3 integrates stages 1 and 2 in one, providing selection of WSUD technologies based on the developed integrated criteria [35]. However, the starting point of the three-stage framework is beyond the current state of practice in developing countries such as Serbia. Thus, stage 0 is required to conduct preliminary analysis to serve as a base for the three-stage framework.
Our research provides such a stage 0, which encompasses elements of the analyses (reviews) at stages 1 and 2 but on a higher level. The analyses in the proposed stage 0 are put in a broad context, when the objectives of WSUD-like technologies or, collectively, NbS SM technologies are still not defined.
This paper is organized as follows. Section 2 describes the study area and data sources, as well as the methodological framework used to evaluate urban settlement areas suitable for different SM NbS technical elements and create thematic maps for location evaluation from publicly available data sources. Section 3 shows the results of the detected areas in the form of thematic maps for each studied SM NbS element for one urban settlement and a summary for all studied urban settlements. Section 4 discusses the results, highlighting the benefits and issues with data sources in the implemented approach for future applications. Section 5 gives the key conclusions of the presented work.

2. Data and Methods

2.1. Study Area

This study is conducted for eight urban settlements (USs) in the Region of Southern and Eastern Serbia in Southeast Europe (Figure 1), the least economically developed in Serbia. The USs are selected as suitable for the study according to population size (>25,000), different types of urban fabrics and density, diversity of topographic features, and relevant natural conditions.
Among the studied USs, the city of Niš (US#3 in Figure 1) is the largest with a population of 187,544 according to the 2011 Census [36] and is also the cultural, industrial, educational, and administrative centre of the study area. The range between the smallest, US1, with 27,333 inhabitants [36] and US3 includes three of four city size categories in Serbia according to hierarchical division of cities in [37]. The only first-tier city in Serbia is the capital Belgrade with more than 1 million inhabitants. The cities for this study were selected as representatives of various size categories: (1) US3 Niš as the second-tier city (the only one in the whole region); (2) US4 Leskovac and US5 Vranje as the third-tier cities; and (3) US1 Prokuplje, US2 Pirot, US6 Zaječar, US7 Bor, and US8 Knjaževac as the fourth-tier cities. Therefore, the study results allow others to replicate and build on them.

2.1.1. Present and Future Climate Conditions

The climate of Serbia is predominantly moderate-continental with more or less pronounced local characteristics [38]. Spatial distribution of climate parameters is determined by a variety of factors, where, for the study area, the geographic features that characterize the weather and climate include the valley of the Velika Morava River and its extensions along tributaries where US2−US5 are situated and the Carpathian Mountains, important for climate in US6−US8. According to the altitude, the studied USs belong to the lowlands of the country, the lowest being US6 at 144 m (above Adriatic Sea level), and the highest, US5, at 432 m.
The mean annual temperature in the recent 30-year period (1991–2020) observed for US3−US6 is 12.4 °C, 11.6 °C, 11.6 °C, and 11.4 °C, respectively, while annual precipitation sums are 613.8 mm, 660.6 mm, 606.0 mm, and 610.0 mm [39]. Besides the Pannonian Plain in the north of the Danube and Sava River, the study area is considered the driest in the country, with precipitation below the country annual average estimate of 730 mm for the 1946–2006 period [40]. In the period 2001–2020, potential evapotranspiration rates have increased by over 5% in most of Serbia and the impact of higher temperatures on evapotranspiration is notably increasing [41].
According to Vuković et al. [42] spatial distribution of temperature increase, intensification of high precipitation events, and decrease in summer precipitation by the year 2100 show intrusion of subtropical climate over Serbia and increase in high temperature and high precipitation risks. In that sense, the study area exhibits a significant anomaly in the rise in summer mean temperature and reduction in accumulated precipitation for the periods 2016–2035, 2046–2065, and 2081–2100 with respect to 1986–2005, according to the Representative Concentration Pathway 4.5 [42].
Both studies [41,42] point to increased risk from both droughts [41] and floods [42].

2.1.2. Stormwater Management

Urban drainage of the public spaces in the study area is managed by the local Public Communal Companies. Except in US5 and US8, where the sewer system is designed as separate, other USs’ sewer systems are combined or mixed. There are two wastewater treatment plants (WWTP) in operation (in US4 and US5), while the rest are under construction (US3) or designed, pending construction tendering process.
In 2020, National Alliance for Local Economic Development (NALED) published the situational analysis results in the wastewater management sector [43]. In addition to the general recommendation for prioritizing the construction of the WWTP for settlements with more than 10,000 inhabitants where recipients are smaller watercourses, especially those with a high degree of connection to public sewage systems, a specific recommendation calls for carrying out a detailed inspection of the existing sewer network to determine the necessary replacement, reconstruction, and existence of illegal connections. These illegal connections mean that users connected their homes and yards on the sewer system, be it combined or separate, and that there is no evidence about it in the local Public Communal Company. Among the recommendations for improving the reporting and information exchange system, it is noted that it would be necessary to define and build links of existing data and information [43]. Some of the data and information in question concerning the sewer system are crucial for stormwater system modelling. The contemporary systems comprise both grey, traditional, and green NbS technical elements.

2.2. Methodology

The methodological framework comprises two phases, the first is literature and public data sources review and the second spatial analysis (Figure 2). The steps in the first phase cover (1) selection of an appropriate NbS SM elements typology, (2) definition of evaluation criteria for their implementation, and (3) identification of publicly available data sources for the evaluation criteria application. The following steps in the second phase lead to the creation of thematic maps showing suitability of NbS SM elements: (1) spatial data (base data and maps) acquisition and processing to derive appropriate maps for constraint presentation, (2) transformation of derived maps into constraint maps, and (3) combining constraint maps to obtain thematic maps with constraint ratings for selected NbS SM elements.

2.2.1. NbS SM Elements Typology

Among the different SM approaches, NbS SM elements typology relies on the EPA LID/GI technology in this research, due to the EPA−SWMM software [33] capabilities intended for use in the next research/implementation phase. These elements are called LID controls in the EPA−SWMM [33] Hydrology menu, and they comprise (1) Rain Barrel, (2) Bio-Retention Cell, (3) Infiltration Trench, (4) Porous Pavement, (5) Vegetative Swale, (6) Green Roof, (7) Rain Garden, and (8) Rooftop Disconnection.
The Rooftop Disconnection, Rain Barrel, and Green Roof LID controls are not included in the research. The Rooftop Disconnection is not a technical element but a measure, while both Rain Barrel and Green Roof require a different type of the analysis compared to the rest of the elements that are fully “land-based”. Moreover, a conversion of flat roofs into peached roofs, instead of retrofitting into green roofs, is observed in the study area [44]. Regardless of the green roof benefits, e.g., [45], there is an absence of population interest for application of this element due to the inadequate socio-economic conditions for its implementation in the study area: higher installation and maintenance costs compared to the traditional solutions on one hand and mistrust of its operational capability and function on the other. An implementation of green roofs on public buildings is also not present in the study area due to the already mentioned lack of institutional implementation of the NbS SM approach.
Finally, a total of five NbS SM technical elements is considered for the study: (1) bio-retention cell, (2) rain garden, (3) infiltration trench, (4) porous pavement, and (5) vegetative swale.

2.2.2. Criteria for Implementation of NbS SM Elements

The natural and physical conditions for implementation of NbS SM elements are the base for our preliminary assessment. They include topographical features, hydrographic characteristics, geology and soil properties, and land use in the studied USs.
The preliminary assessment is conducted according to the site constraints shown in Table 1, translated into criteria for NbS SM element implementation. Table 1 is based on the original table in [46], where we kept SM elements corresponding to six considered for the study, eliminated three of nine constraints, and showed the constraint levels as digits 0, 1, and 2, appropriate for operations with layers in GIS. One of the eliminated constraints is related to salt water and, therefore, not applicable in the study area, while the constraints “hydraulic head loss” (loss of pressure required for an element operation) and “sediment load” require detailed data and cannot be a part of preliminary assessment.

2.2.3. Identification of Data Sources

The research was performed in two stages, one year apart. Stage one aimed at the USs in Southern Serbia (1 to 5 in Figure 1) and stage two, USs 6, 7, and 8 (Figure 1), in Eastern Serbia. The data sources identified for each constraint are shown in Table 2, followed by respective references. There are two different data sources for both constraint C–1 and C–2 in the studied USs, depending on the research phase (US1 to US5 and US6 to US8). The same data source is used for constraints C–3 and C–4 in all USs. Concerning constraint C–5, the data source for US1 is found through literature review, the data are not found for US2 and US5, which is denoted by “x”, a common data source is used for US3 and US4, while US6 to US8 have the same two data sources. For constraint C–6, in addition to the group display of data sources (for US1 and US2, US3, US4, and US5, and US6–US8), a share of mapped buildings is shown below the data sources.

2.2.4. The Acquired Data, Spatial Data Processing, and Constraint Mapping

For each US, the borders of the US proper were digitalized in the Geosrbija geoportal [49], and then the georeferenced shape files were imported into Quantum GIS (QGIS) [57].
As a part of topographical conditions, the steepness assessment (constraint C−1) is performed from the Digital Elevation Model (DEM). For each US from research phase one, the DEM is downloaded from the EU DEM platform [47], while the DEMs for the USs in research phase two are constructed in QGIS from Google Earth Pro data [48] (Table 2). EU DEM resolution is 25 m, with vertical accuracy of +/− 7 m RMSE [47], while the Google Earth Pro elevation data is based on the 30 m Shuttle Radar Topography Mission (SRTM), with an absolute vertical accuracy of 5 to 10 m [58].
The constraint slope maps are derived from the DEMs showing three slope classes: flat area (<1%), gentle slope (<5%), and steep slope (>5%). A threshold of 5% is adopted due to a slope constraint for porous pavement of 5%, e.g., [59], stricter than that for vegetative swale of 6% [46,59].
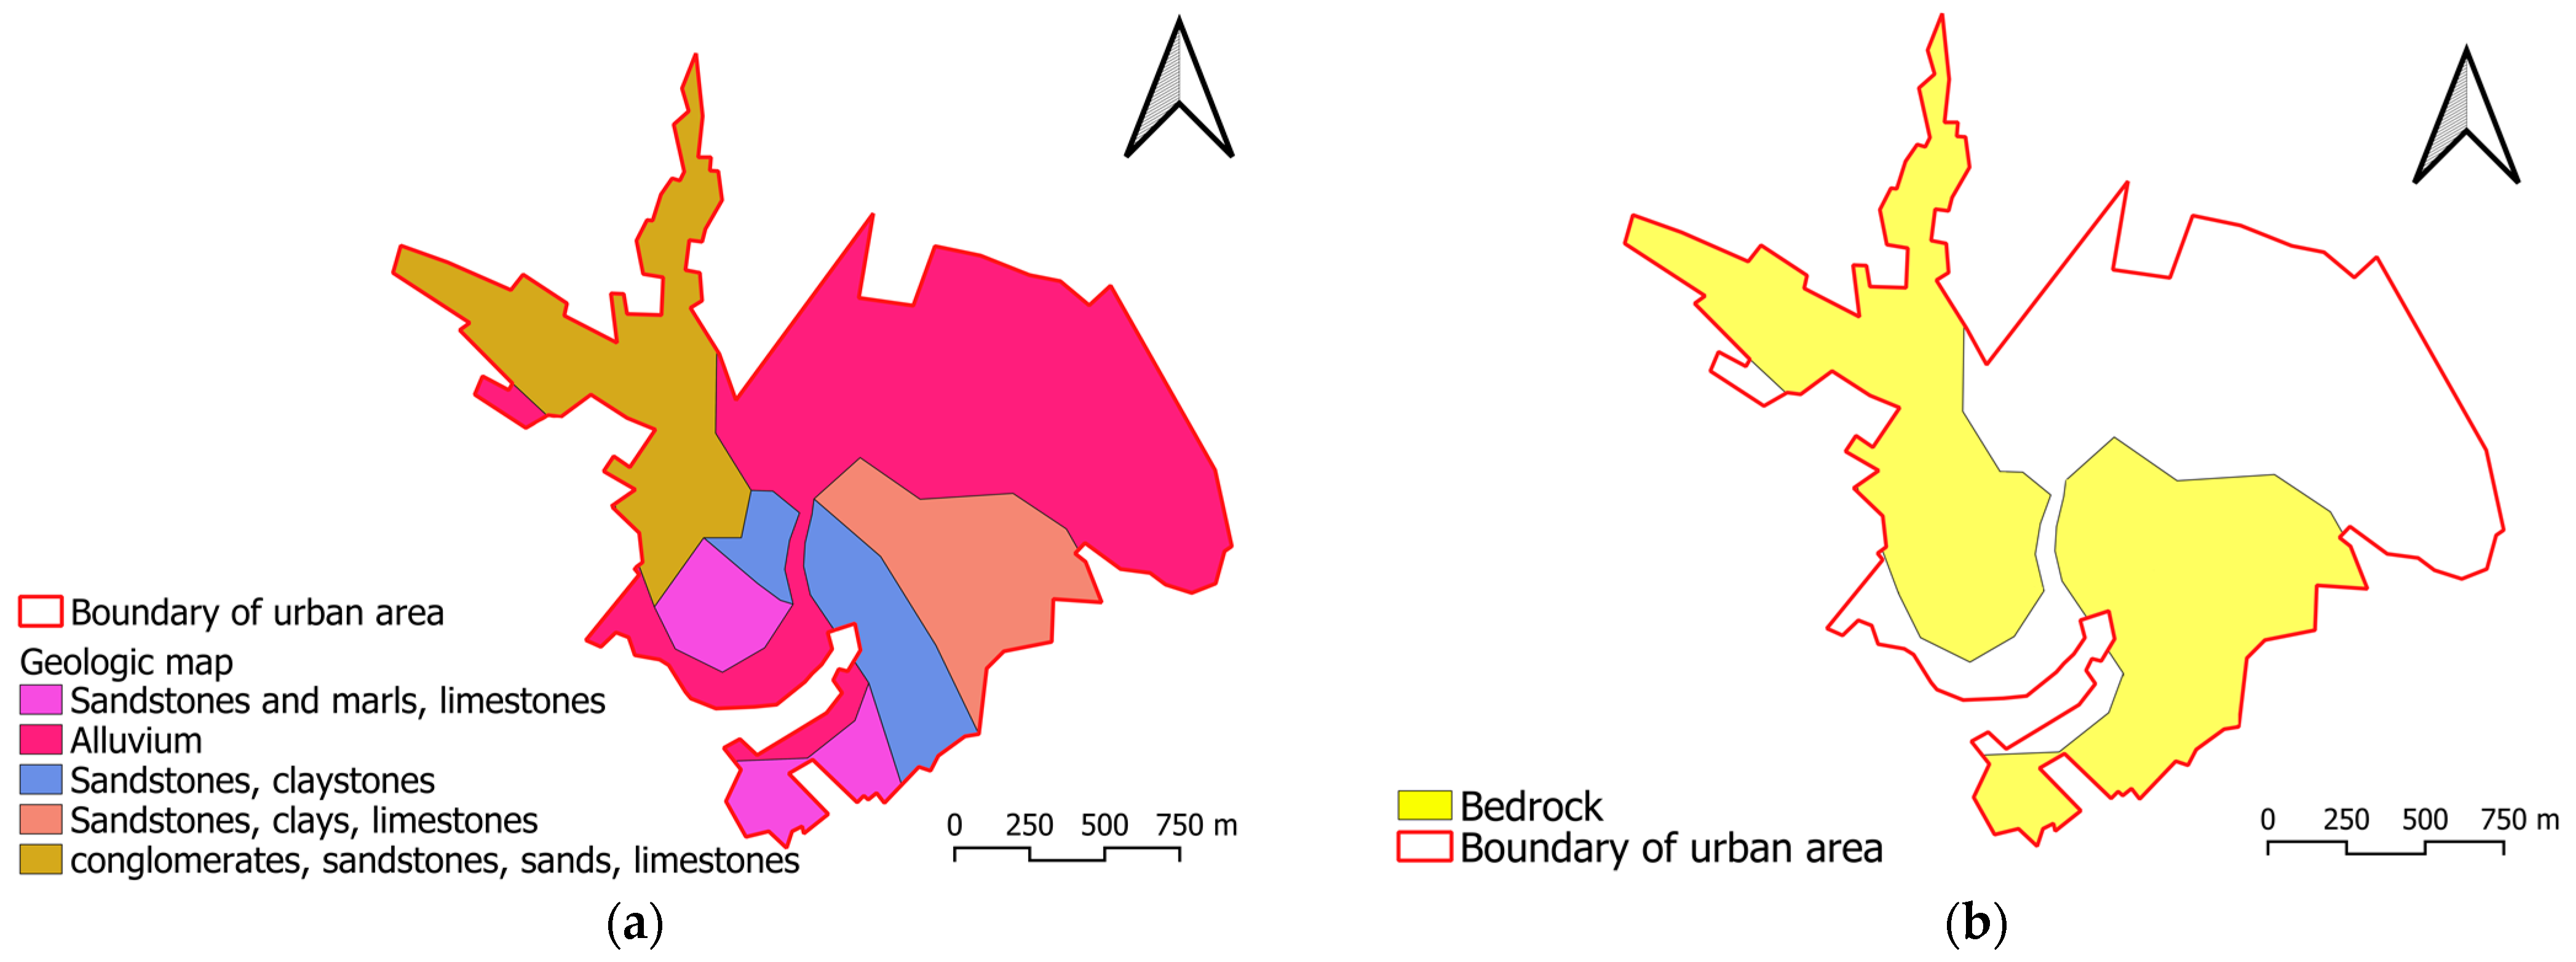
The locations of bedrock required for constraint C−2 are mapped based on two data sources: GeoSrbija [49], the National Spatial Data Infrastructure digital platform where the Geological Map of Serbia could be found, and a geological map from the Geological Information System of Serbia GeolISS [50]. Both these data sources are derived by digitizing physical 1:1,000,000 scale maps provided in the form of shapefiles. GeoSrbija [49] is used for US1−US5, while, for US6−US8, the data source is GeolISS [50]. The data source change was caused by the reduction in contents in the GeoSrbija [49] digital platform due to an intensive hacking attack in June 2022 [60] that occurred between the two research stages. The bedrock locations presenting constraints are mapped without knowledge about its depth.
Both constraint C−3 and C−4, referring to soil permeability, are defined from the data downloaded from the Harmonized World Soil data base of the UN Food and Agriculture Organization (FAO) [51]. The GIS layers created from the data for each US comprised two required classes presenting constraints: low- and high-permeability soils. Among the 7 soil permeability classes in [51], classes 1–3 are mapped as low and classes 5–7 as high-permeability soils. The resolution of the data is 30 arc-seconds or approximately 700 m for the given latitude of the US locations.
A hydrographic constraint, C−5, is assessed based on the publicly available groundwater monitoring data provided by the Republic Hydrometeorological Service of Serbia (RHMSS) [53]. The data are analyzed from the RHMSS Yearbooks for the 30-year period 1991–2020 [53]. To deduce if the groundwater table is high at the hydrologic station (piezometer) location, the threshold of gauged annual maxima is set to 2 m below ground level. The NbS elements with a primary infiltration role require at least 1 m distance of subgrade to the ground water table for operation (e.g., [46,59]). Hence, providing 1 m for the element structure below the ground and an additional 1 m of the required distance to the groundwater table leads to the applied 2 m threshold. The gauged groundwater tables higher than the threshold level are considered high and mapped along the corresponding terrain contour of the piezometer on both sides of the riverbed, forming the high groundwater table zone, i.e., constraint map.
Not all of the studied USs have the groundwater hydrological stations in the boundaries of the analyzed area or in its vicinity (denoted “x” in Table 2). Constraint C−5 is not applied in these USs. As US 1 was used as a pilot case, the data about groundwater table are found in [52]. Similar publicly available sources were not found for other USs.
An additional hydrographic constraint is considered under C−5, specifically, a 100-year flood hazard zone [54], although it could be interpreted as constraint C−6 land availability as well. It is applied for USs 6–8 from the second research phase because the flood hazard maps for Serbia were not publicly available during the first research stage.
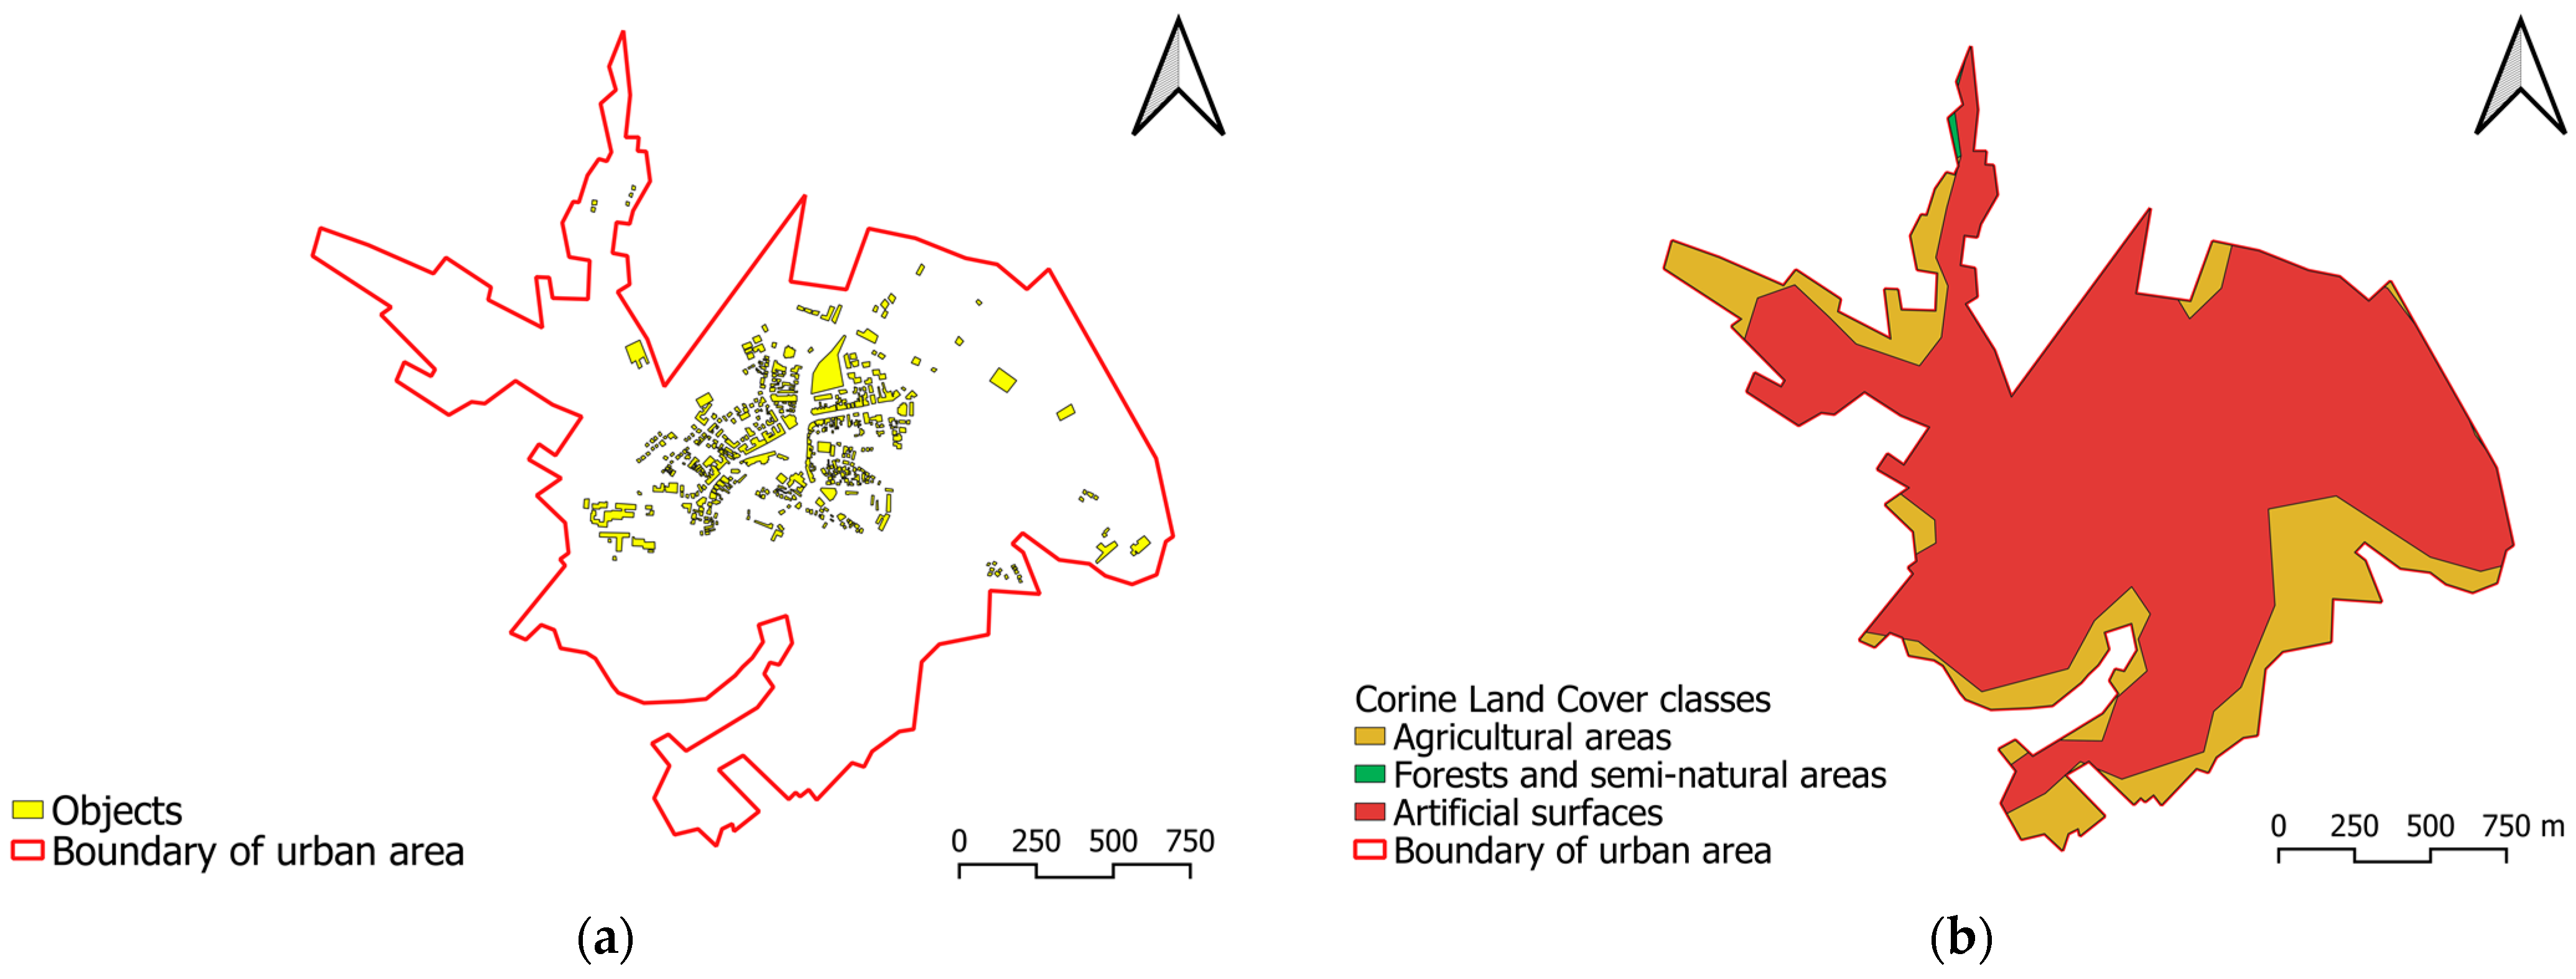
The Open Street Maps (OSM) data [55] in combination with the Corine Land Cover 2018 data [56] were used to assess land availability, as required for constraint C−6. Land availability is considered by a simple presentation of built-up areas at the level of larger buildings and parking lots under urban fabric land use classes of 25 ha/100 m (Min. mapping unit/width). Although a highly valuable data source, OSM has its known data incompleteness, an important one for this research being missing buildings in the dataset at the time the analysis was conducted. In the research pilot case, US 1, the augmentation of the buildings was performed by manual digitalization from the orthophoto based on the satellite imagery, one of the layers in GeoSrbija [49]. This was a labor-intensive and time-consuming operation for the US1 proper area of 7.74 km2 with 70% of buildings present in the OSM. The other methods for building augmentation involve sophisticated techniques, e.g., [61], beyond the scope of this research. Therefore, we adopted the existing data on buildings for the US2−US8 “as is” and provided an approximate share of mapped buildings in the OSM in the last row of Table 2. The results related to this constraint are interpreted with caution.

2.2.5. Thematic Maps for Preliminary Location Evaluation for NbS SM Technical Elements

The thematic maps for each NbS SM technical element are created from the corresponding GIS layers containing constraint ratings 0, 1, and 2 as shown in Table 1. The final result for each element in each US is obtained by overlaying layers of the constraints rated 1 and 2. Basic GIS tools are used in all operations, including measuring the area suitable (0), not suitable (1), and potentially suitable (2) for a particular NbS SM element in each US.

3. Results

3.1. Suitability Assessment Results at the Urban Settlement Level

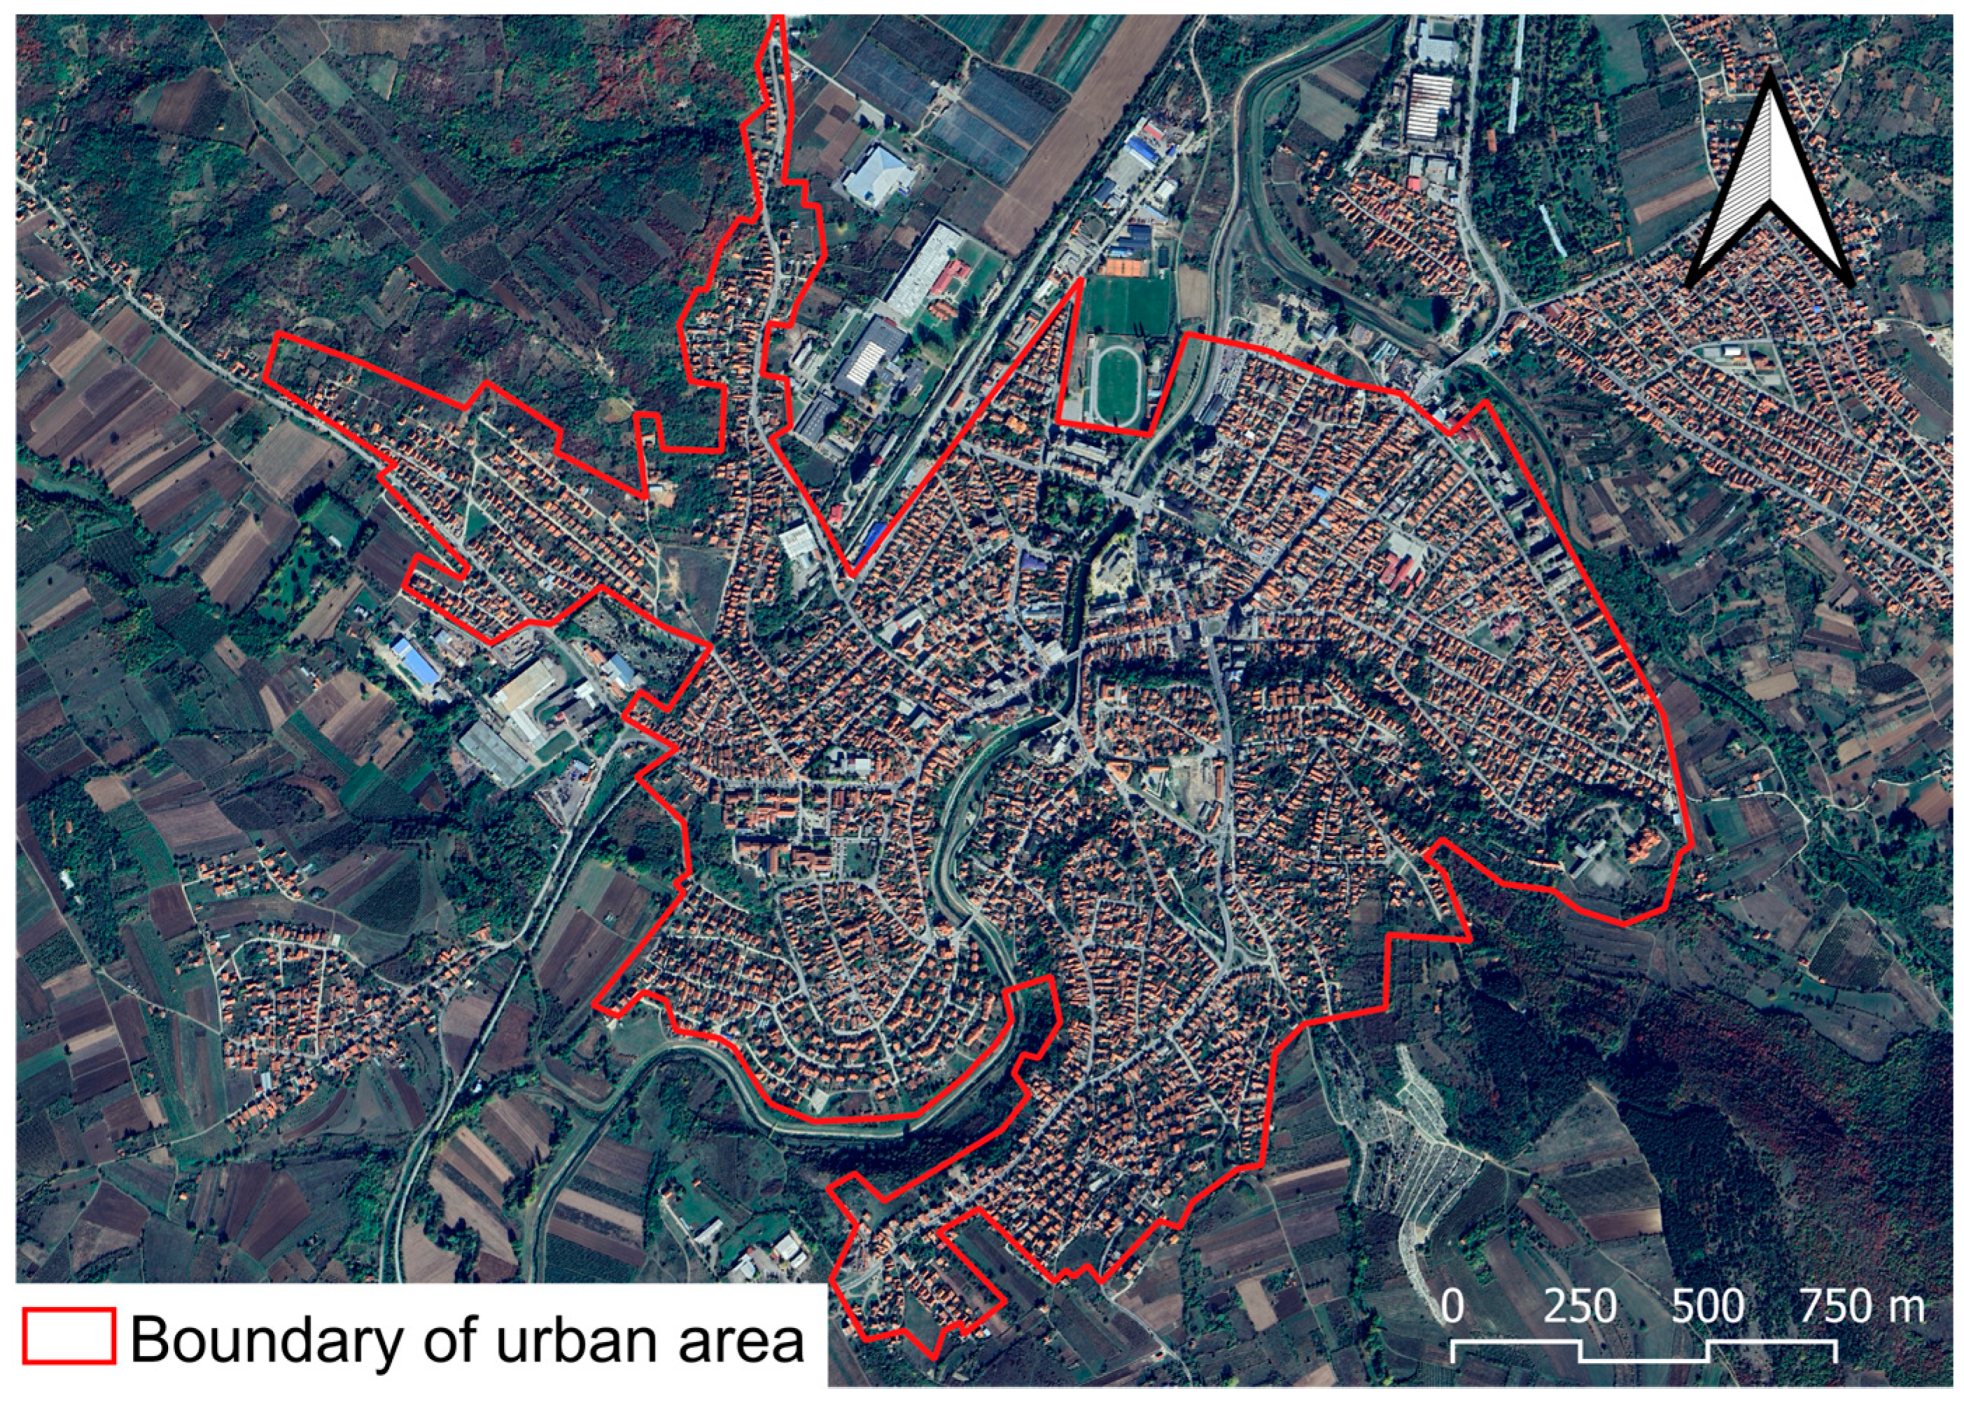
The results for one US comprise the review of created GIS layers with processed source data specific for individual constraints and thematic maps showing suitability for implementation of NbS SM elements. We selected US8 to present the results at the US level. Figure 3 shows the defined boundary of US8.

3.1.1. Source Data (Maps), Derived Maps, and GIS Layers Showing Constraints

The source data for identification of constraint levels for implementation of NbS SM elements in US 8 are illustrated in Figure 4, Figure 5, Figure 6, Figure 7 and Figure 8.

3.1.2. Thematic Maps Presenting Suitability for Implementation of NbS SM Elements

The results for US8 are grouped per NbS SM elements characterized by the same constraints. Figure 9a shows suitability of the US area for the runoff detention elements and Figure 9b for infiltration trench. Figure 10a presents conditions for installing porous pavement with infiltration and Figure 10b areas suitable for vegetative swale implementation.

3.2. Suitability of All USs per NbS SM Element

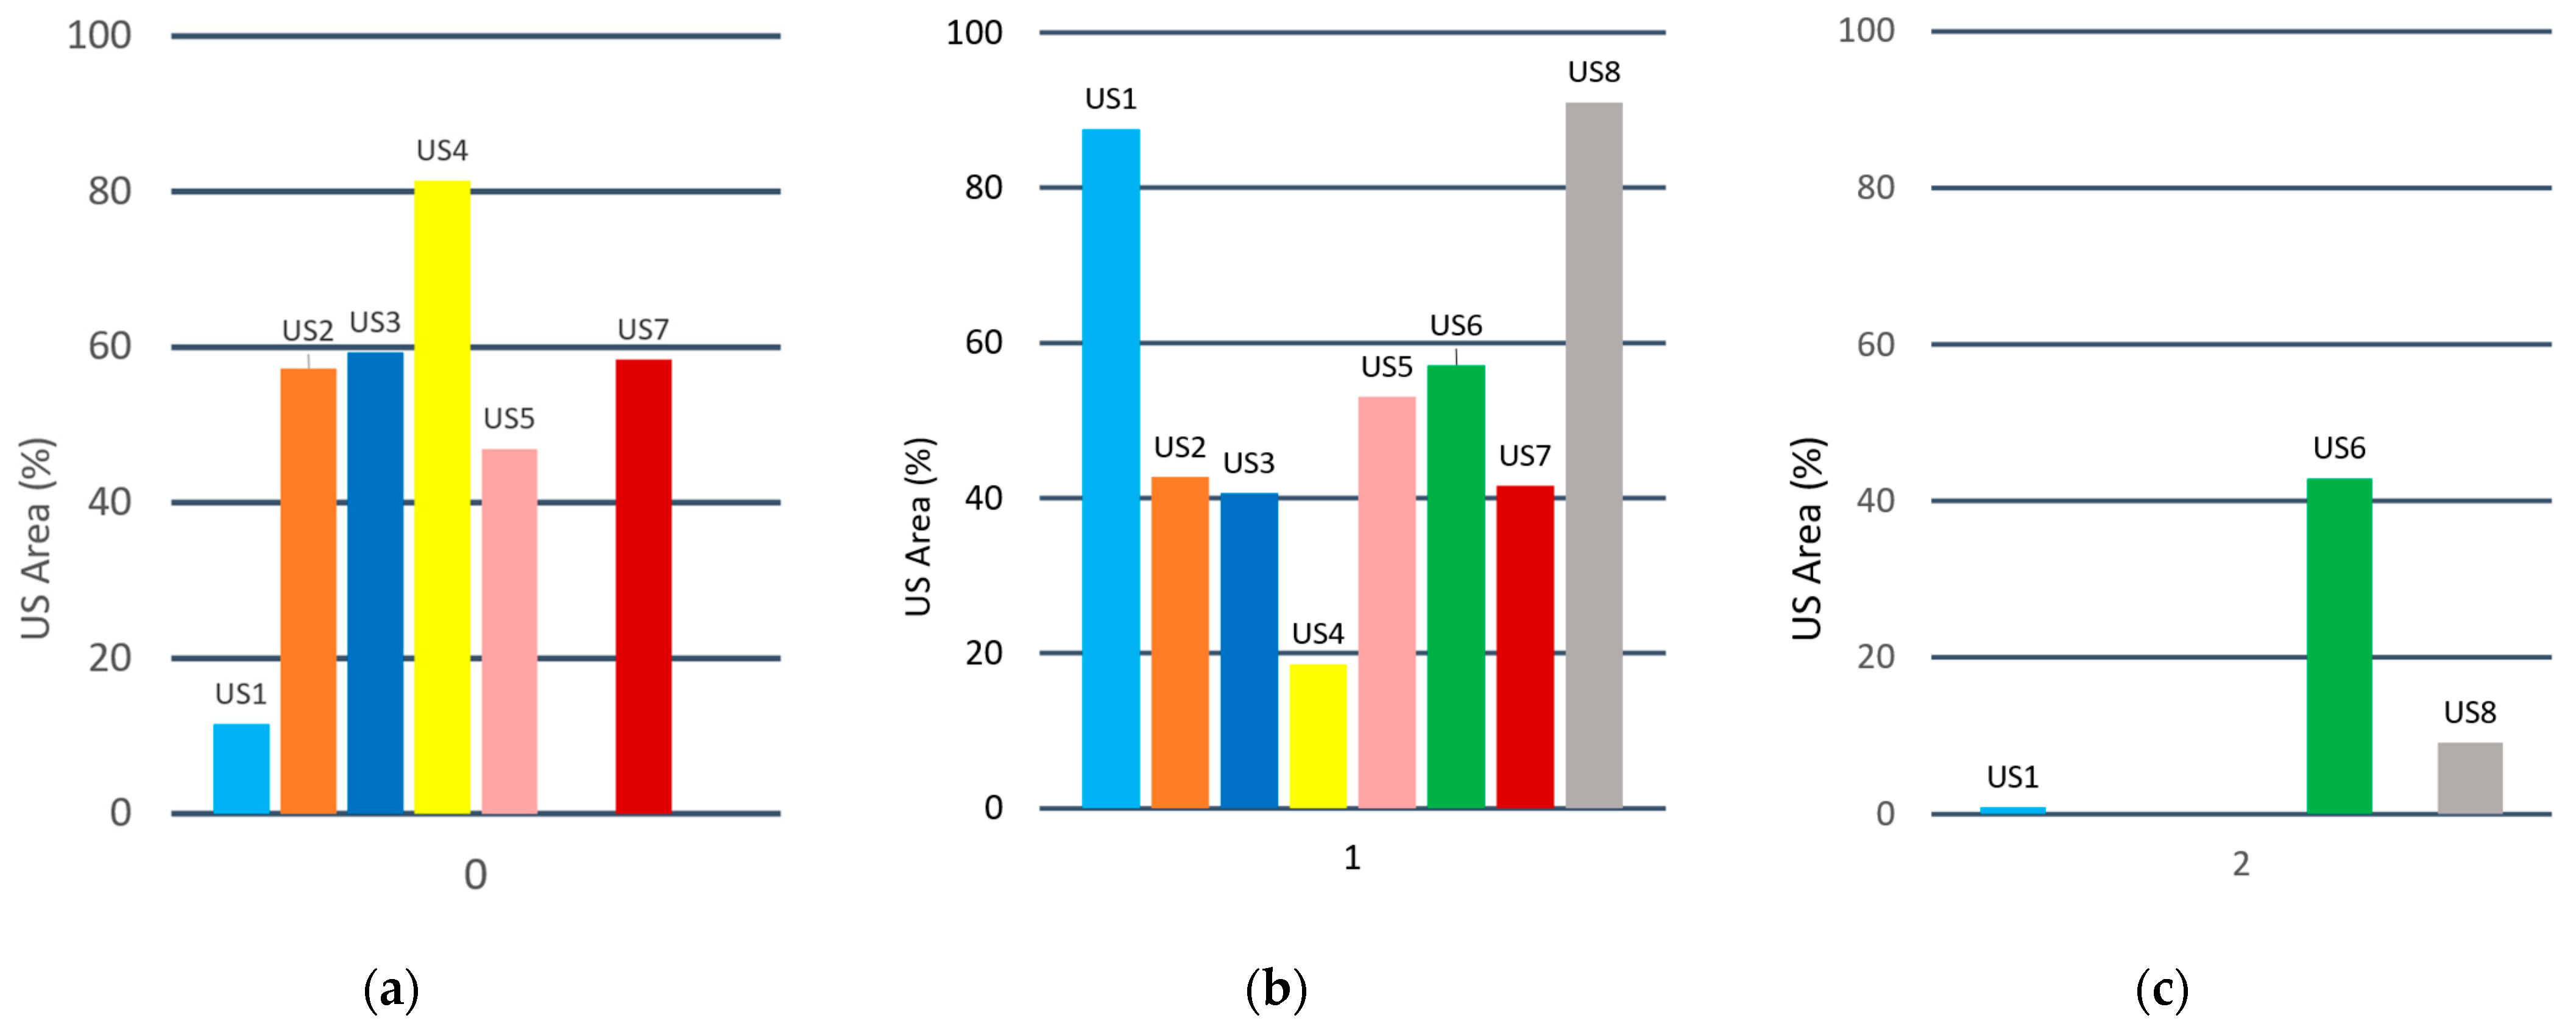
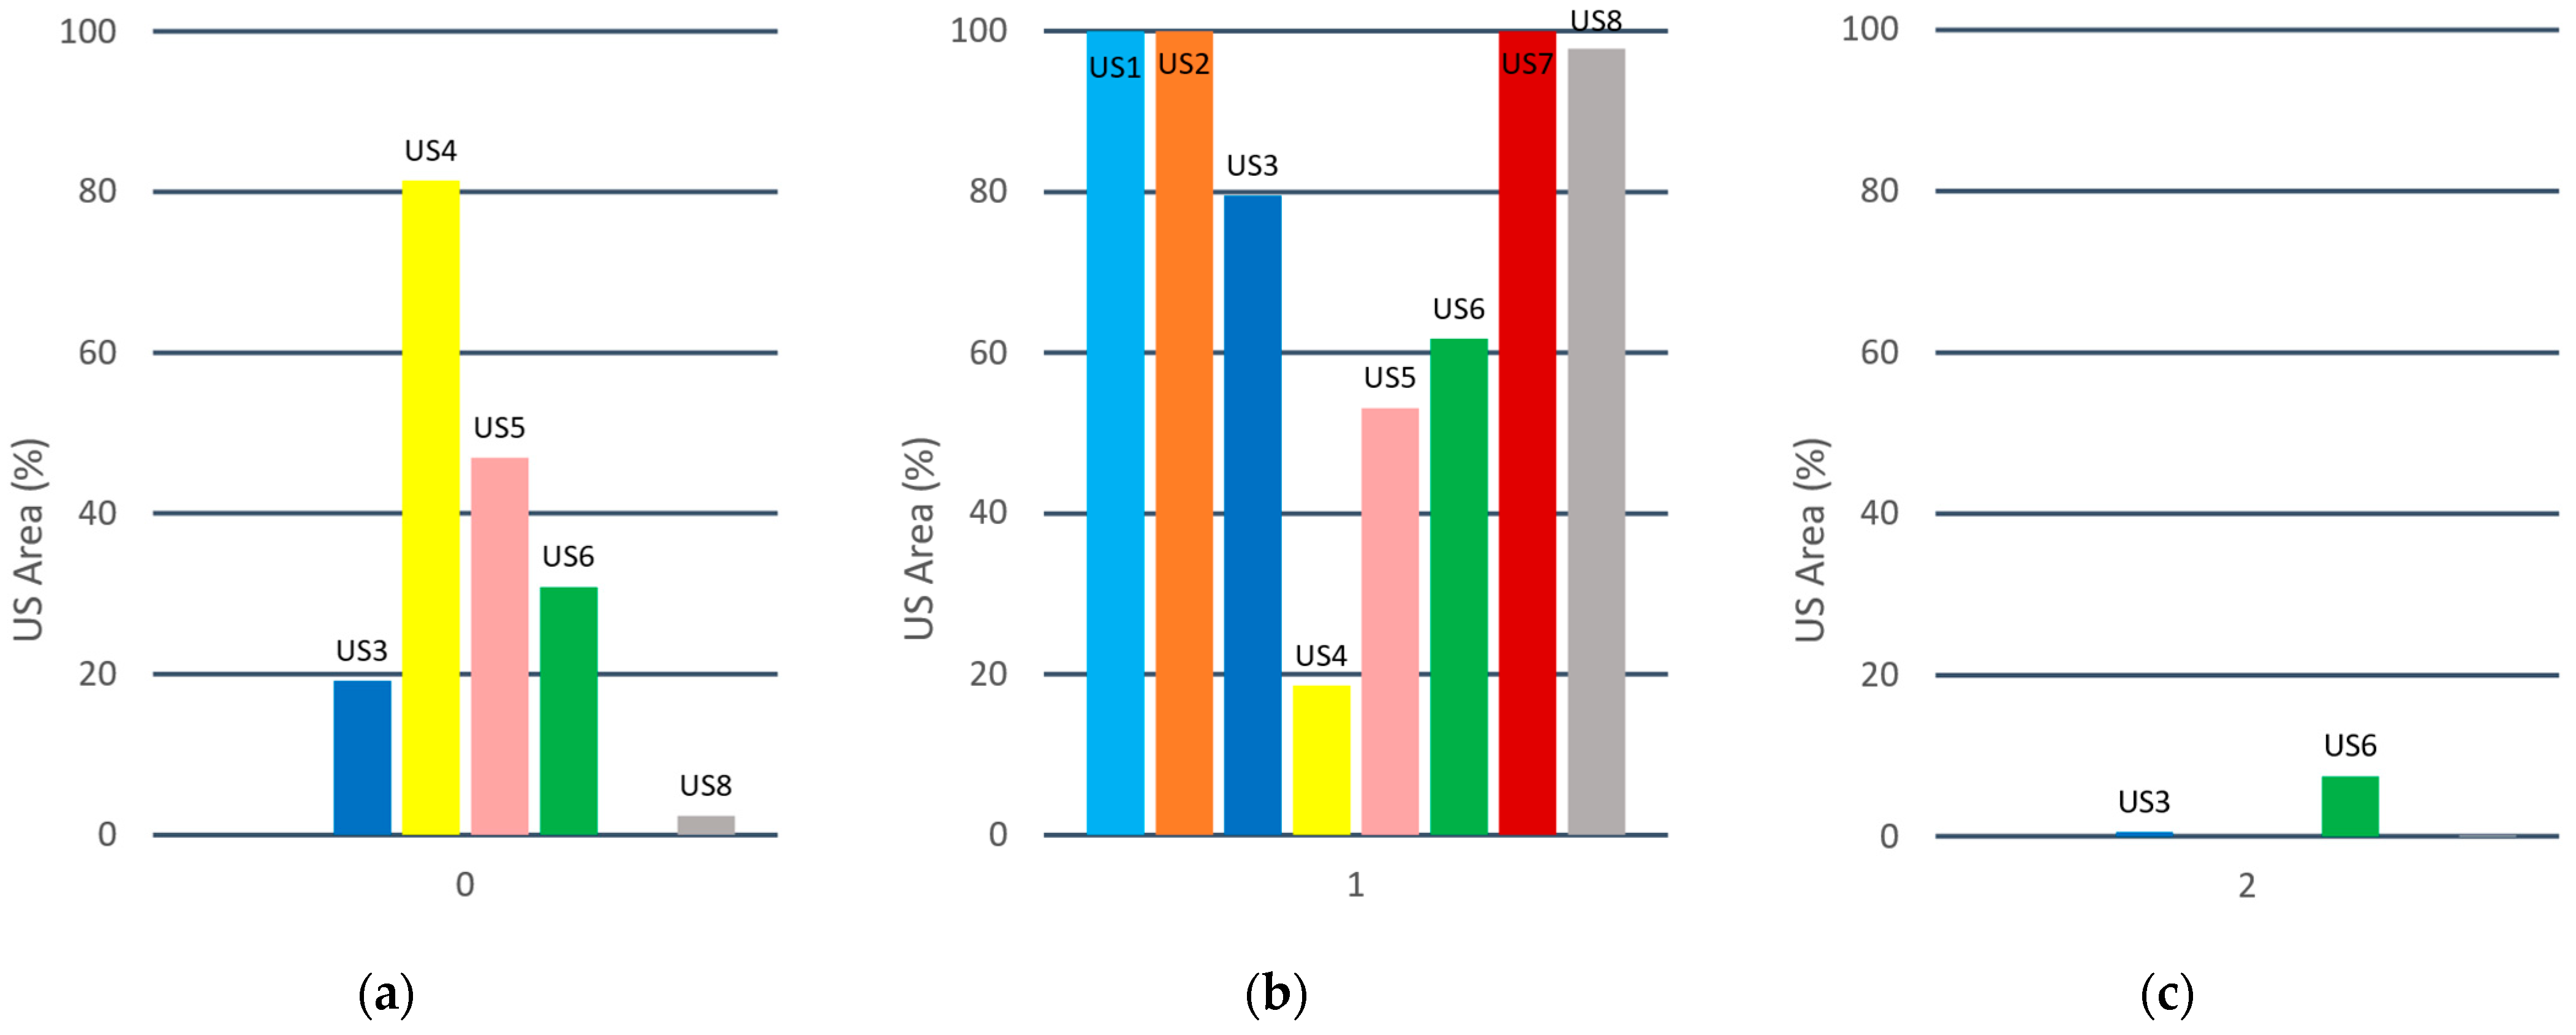
The summary of the results for all USs is shown in Figure 11, Figure 12 and Figure 13 and Table 3, focusing on the individual NbS SM elements. For the comparability of the results, the implementation potential of the technical elements is shown as a share (%) of the US proper area that is generally suitable, not suitable, and conditionally suitable for implementation of a particular element.
In half of the studied USs (US2, US3, US4, and US5), the preliminary results are “black and white” regarding implementation of individual NbS SM elements, where practically none of the elements can be modified to overcome area constraints (Figure 11c, Figure 12c, and Figure 13c; also rows “2” in Table 3).
Among the studied SM elements, vegetative swale (E5) is generally the most appropriate of all elements in a majority of the USs (Figure 13a, Table 3), followed by bioretention cell (E1), rain garden (E2), and porous pavement with runoff detention (E4b) as shown in Figure 11a and Table 3, and the least appropriate are infiltration trench (E3), and porous pavement with runoff detention (E4a) except in US4 and US5 (Figure 12a, Table 3).
The results are reviewed in Section 4, Discussion, mostly regarding NbS SM elements’ potential area assessment stemming from source data accuracy.

4. Discussion

Given the specific conditions of our research, that is the emphasis on the research framework rather than on source data accuracy, the results should be interpreted with caution, in particular, the obtained shares of the USs area, suitable for NbS elements. Table 3 shows a summary of the results and it should be interpreted in combination with the data provided in the last row of Table 2, showing a percentage of mapped buildings, important for the land availability constraint. From this perspective, the most reliable results are obtained for US1 and US7, followed by US2 and US3. In US4, US5, US6, and US8, and the share of mapped buildings is 40% and less.

4.1. Source Data

Using publicly available data in this research has its benefits and shortcomings. The obvious benefit is the possibility to conduct the research at all and to have a common ground for the research worldwide. However, the datasets with global or continental coverage come with shortcomings for use on a smaller scale like the urban scale used here.
The vertical accuracy of the used DEMs is coarse; as a consequence, the derived slope maps, transformed to the C−1 constraint maps, only roughly specify suitable and unsuitable terrain slopes.
The geological map provides an acceptable insight into the types of geological formations and the boundaries between them, but the depth to the bedrock (C−2 constraint) is unknown and additional data are required for a clear presentation of this constraint map.
The soil type datasets used refer to the top soil of undefined depth, according to the data sources [51]. The soil type is classified based on the dominant type in the soil map unit; thus, heterogeneity can be expected both across soil depth and the mapped soil unit. Given that the digitized source map has a 30 arc-second spatial resolution and presents the dominant soil type, the created C−3 and C−4 constraint maps are the least reliable of all the constraint maps. This issue is mostly pronounced in the smaller analyzed areas like US1 and US8.
The threat to NbS SM elements from high groundwater table was the most difficult constraint to map out (C−5) due to the absence of suitable spatial groundwater data and limited gauged groundwater table numerical data at all US locations. The analyzed groundwater gauge data were spatially interpolated to obtain a rough spatial representation of the respective high groundwater level constraint.
At this initial or preliminary assessment, a simple land availability constraint map (C−6) consisting of larger building footprints shown within urban fabric land classes is used. The effects of including all buildings and traffic-related structures on the C−6 constraint map are shown in the following subsection. It should be noted that land availability constraints include more details referring to physical structures like supply and other networks that were not considered at this assessment stage.

4.2. Land Availability Source Data Update Effects

Upon the OSM data update and synchronization with the official cadaster registry, we have conducted a comparative analysis of the effects of land availability data completeness and coverage on NbS suitability mapping, i.e., thematic maps. Spatial suitability analysis was conducted with the updated OSM data set, which includes street axis, parking lots, and a far larger number of buildings in US8, compared to the previous, i.e., initial data set version, which held only a limited number of larger buildings. The complete OSM data set was converted to a 2.5 m raster land availability grid with roads approximated by generating 6 m (two lanes) buffer zones around the road axis, and the parking lots and building footprints were rasterized.
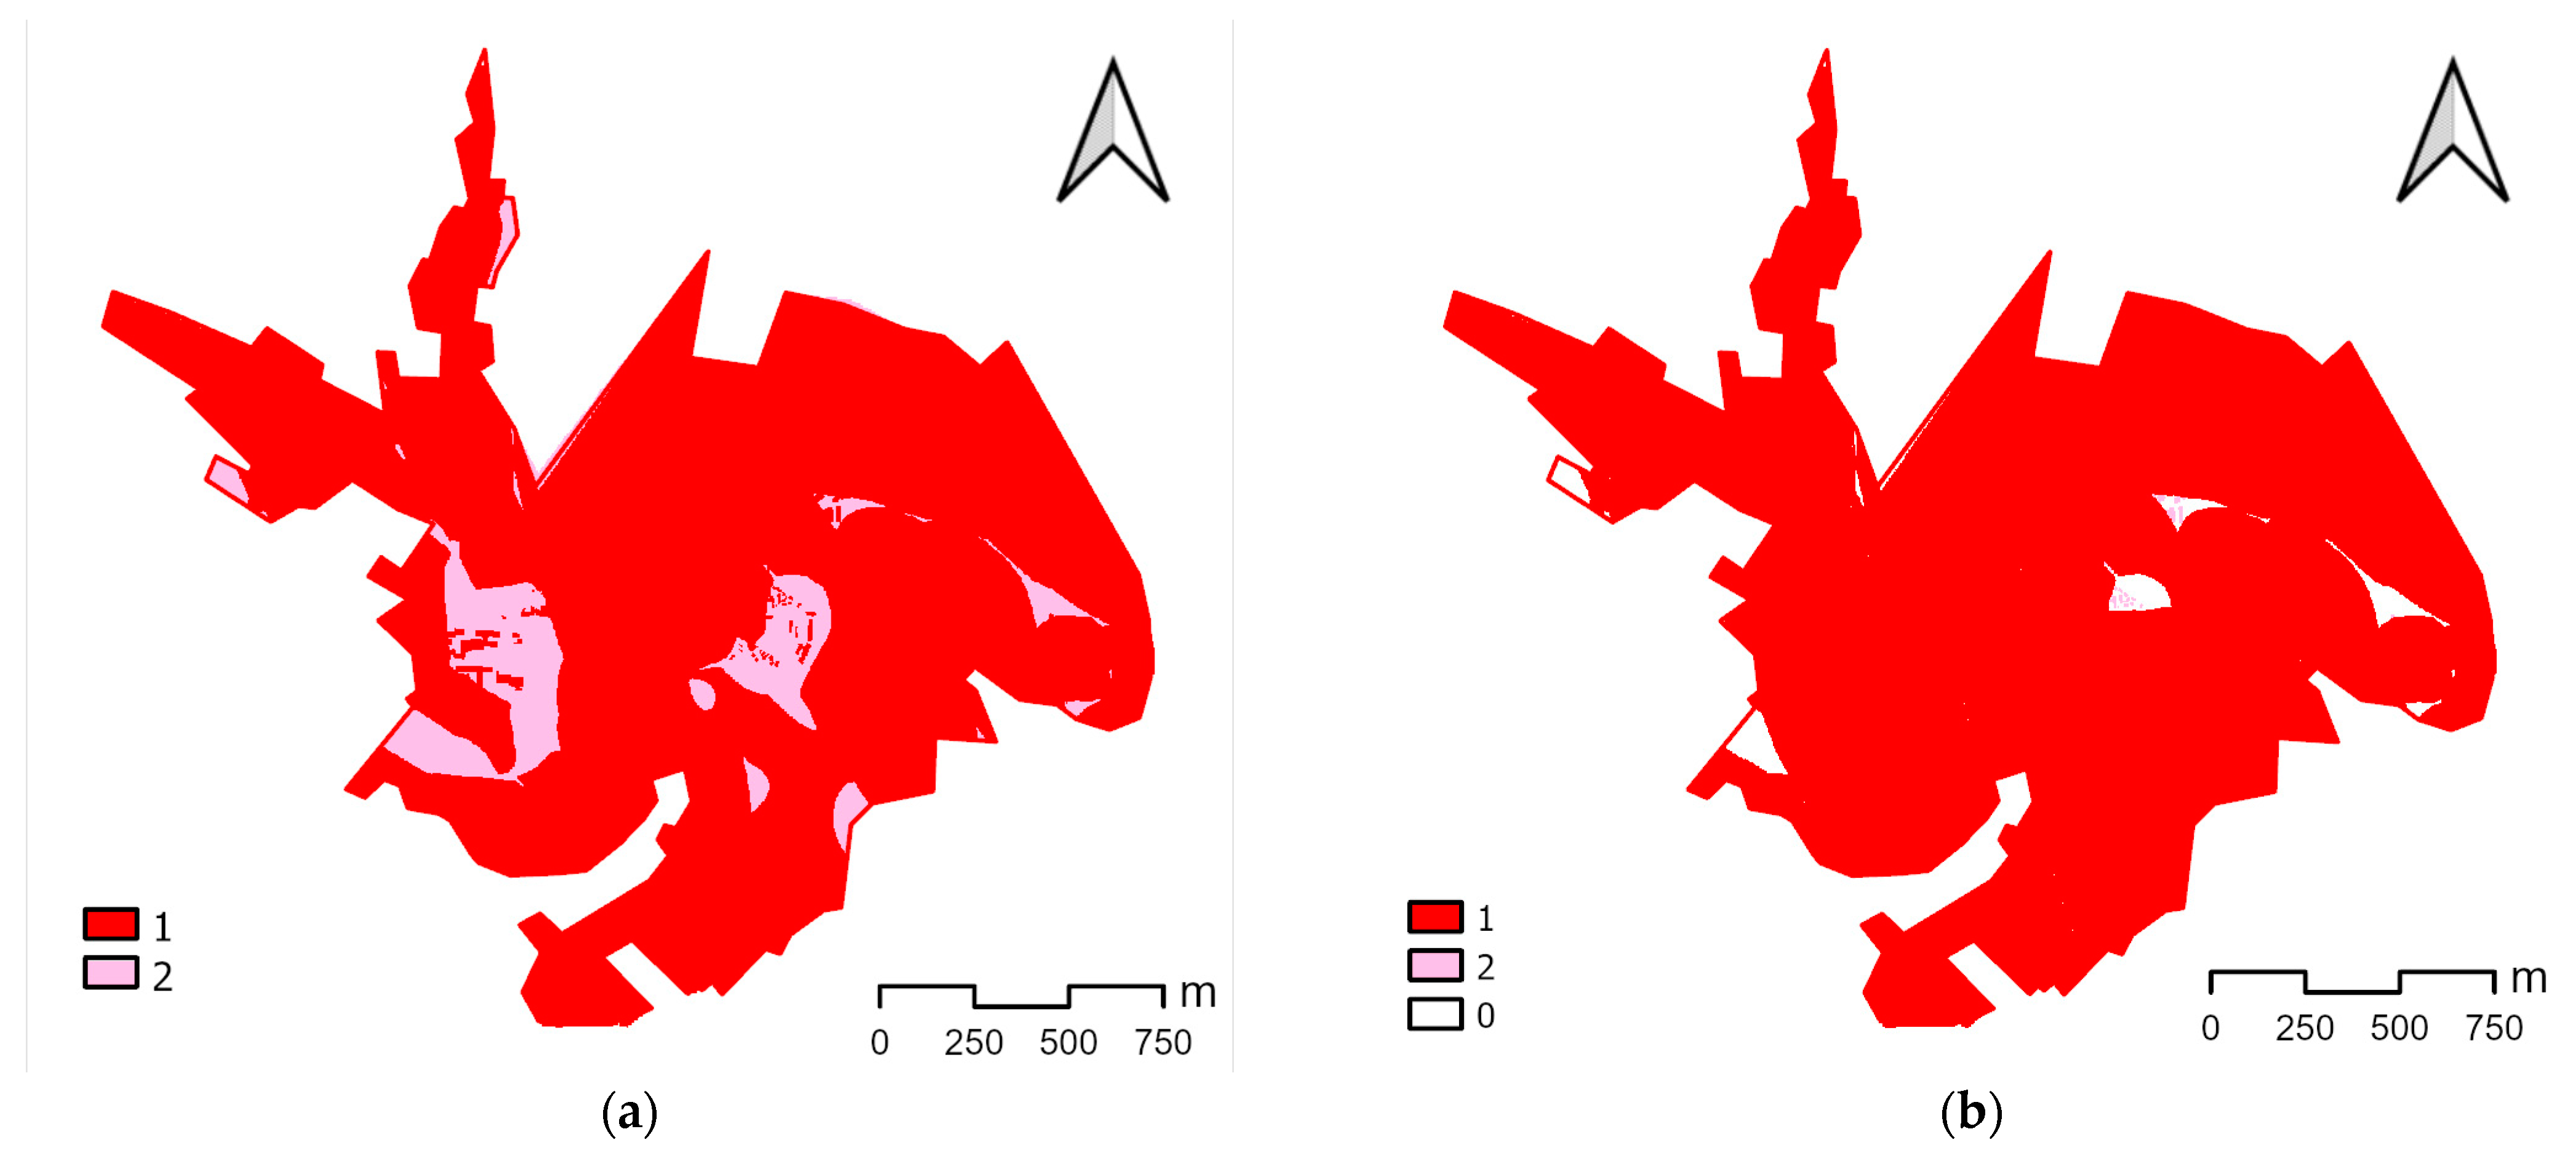
The result of area suitability reassessment in US8 is illustrated in Figure 14a and Figure 14b for the case of vegetative swale (E5), and the reassessed implementation potential of all NbS SM elements is shown in Table 4 by the digits and colors: 0 (white/transparent), area generally suitable; 1 (red), area generally not suitable; 2 (pink), area conditionally suitable with modification to the element(s) design.
The only significant change, as can be seen in Table 4, is noted for the vegetative swale (E5). This is not only the result of improved land availability source data but also the initial share of large area conditionally suitable for this element according to natural conditions. The changes in other elements are insignificant due to the initial large area unsuitability assessed based on natural conditions.
This exercise shows that unfavorable natural conditions may play a more significant role in the assessment of area suitability for NbS SM elements, compared to the physical constraints as treated under the land availability constraint in this assessment.

4.3. Transferability of the Research Results and Further Research and/or Implementation Steps

The transferability of the presented research results should focus on the framework and provision of more precise data at an individual US level, regarding all considered constraints.
An attempt to include more precise constraint data at the urban municipal scale for a broader range of SM elements is conducted also for the US3 in [30]. The analyzed area of US3 was smaller than the one studied in this research. There, the data about soil, geology, and water table were used from several geological projects and spatially interpolated to enable more precise definition of constraints, still at the urban planning level. This kind of project is obligatory in the process of issuing construction permit; hence, municipal and/or city institutions have the necessary data to start building their databases and use publicly available data merely for comparison.
The updated OSM data, as shown in Section 4.2, have led to an improvement in the spatial detail of suitable areas, although without significant changes to the shares of the areas for the analyzed US8, where the present natural constraints are dominant. Using a detailed Land Use/Land Cover classification data sets should lead to more refined results in the next phases of generating a detailed suitability map for the implementation of NbSs. Moreover, among the constraints that contribute to land availability reduction, the land ownership, planned land use, and already mentioned placement of supply and other networks and infrastructure are expected within review stage 2, dedicated to urban planning and design [35].
A rare result of previous research in the study area focused on smaller scale for application of NbS SM elements, like the implementation of vegetative swales (E5) in Duvanište residential district, City of Niš (US3), performed in [62]. However, this research, being an example of a review stage 2 analysis [35], presents an urban design perspective, whereas our research is focused on a broader, urban planning perspective.
To decrease the level of initial uncertainty of input data in this research and set a general framework, two constraints were not included: sediment load and hydraulic head loss. These constraints may have led to a decrease in the available area for the considered NbS SM elements in the cases where these constraints may preclude the use of an element. This limitation of our research may be overcome in the next implementing stage when NbS SM approach is further refined and stage 1 entered [35]. At that stage, more focused hydraulic engineering assessments are performed, e.g., [63,64,65]. Specifically, the pressure (head) loss coefficients are calculated within a drainage system, defining the changes between the hydraulic grade line and the total energy line, where the hydraulic grade line is the most crucial property for a drainage system operation [66].
When the objectives of NbS SM technologies are defined, an implementation of NbS SM elements would require a previous feasibility study, where it should be examined whether the investments are needed in basic sewage facilities and grey infrastructure, exclusively in NbS SM elements, or in their combination.
Further research directions are twofold. One is pointed out to the provision of more detailed source data for the assessment and the other to investigation of the elements/measures related to roofs: rooftop disconnection, rain barrel, and green roof.

5. Conclusions

In the preliminary investigation of nature-based solutions for stormwater management, the natural and physical conditions, i.e., constraints, for the implementation are considered in the proposed methodological framework. The publicly available data sets are used as source data for the research of suitability potential of five nature-based solution stormwater management elements in eight urban settlements from the Region of Southern and Eastern Serbia. The conclusions are as follows:
  • The proposed methodological framework is able to distinguish areas suitable for nature-based solutions with large variations between multiple urban settlements. This shows that the methodology is applicable for a preliminary suitability analysis and can be used to underpin the strategic decision making, needed in the field of nature-based solution application for further tackling of stormwater (and wastewater) management in developing countries like Serbia, given the current state of legislation and research in this field.
  • The preliminary assessment conducted in this investigation pointed out to the shortcomings with the selected publicly available sources, i.e., input data. However, an initial picture about suitability of all elements at an urban scale is useful for the studied urban settlements, while further refinement of the results based on more detailed source data for all constraints regarding included conditions is necessary.
  • Among the five studied nature-based solution stormwater management elements: (1) bio-retention cell, (2) rain garden, (3) infiltration trench, (4) porous pavement, and (5) vegetative swale, the least suitable for implementation in the majority of the studied urban settlements are the infiltration trench and porous pavement with runoff detention.
  • US3 (Leskovac) and US4 (Vranje), third-tier cities, which both hold functioning wastewater treatment plants, based on the stage 0 analysis, seem to be the most suitable for nature-based solution stormwater management elements implementation according to natural constraints.
  • The research findings indicate that among the smaller studied urban settlements, US2 (Pirot) and US7 (Bor), which belong to the fourth-tier city category, have a lot of potential for the implementation of nature-based solution stormwater management elements due to the natural conditions and lower built-up area density.
The results provided in the research require further verification on a wider set of data by the researchers but also by the respective institutions and decision makers to close the gap between the nature-based solution planning and implementation, for the start, by the civil/hydraulic engineers and urban planners. Moreover, the proposed framework could be applied for promoting the importance of nature-based solutions for stormwater management as a pilot or demonstration project, because neither the legislation related to urban water management nor the one related to urban planning recognizes the application of nature-based solutions for stormwater management in Serbia. This is an attempt to conceptually recognize the tools and methodology of integrating nature-based solutions into urban planning and design, which is preceded by a long-term process of change and adjustment of the management and planning paradigm in Serbia.

Author Contributions

Conceptualization, B.B. and L.V.; methodology, B.B., D.A. and A.B.; validation, B.B., D.A. and A.B.; formal analysis, B.B., D.A. and A.B.; investigation, B.B. and L.V.; resources, B.B. and L.V.; data curation, D.A. and A.B.; writing—original draft preparation, B.B., L.V. and S.L.; writing—review and editing, B.B., L.V. and S.L.; visualization, B.B. and D.A.; funding acquisition, B.B. and L.V. All authors have read and agreed to the published version of the manuscript.

Funding

This research was partially funded by Ministry of Education, Science and Technological Development of the Republic of Serbia, grant number 451-03-47/2023-01/200095. The APC was funded by B.B.

Data Availability Statement

The links to public data sources are provided in the references.

Acknowledgments

The presented research is a part of the project of Serbian Academy of Sciences and Arts Branch in Niš “An integral approach to stormwater management in urban catchments in the territory of South-eastern Serbia” (O−15−18). The authors would like to thank four anonymous reviewers for constructive comments that improved the manuscript.

Conflicts of Interest

The authors declare no conflict of interest. The funders had no role in the design of the study; in the collection, analyses, or interpretation of data; in the writing of the manuscript; or in the decision to publish the results.

References

  1. UN United Nations. World Urbanization Prospects: The 2009 Revision; United Nations Department of Economic and Social Affairs, Population Division: San Francisco, CA, USA, 2010. [Google Scholar]
  2. Whelans, C.; Maunsell, H.G.; Thompson, P. (Eds.) Planning and Management Guidelines for Water Sensitive Urban (Residential) Design; Department of Planning and Urban Development of Western Australia: Perth, Australia, 1994.
  3. Lloyd, S.D.; Wong, T.H.F.; Chesterfield, C.J. Water Sensitive Urban Design—A Stormwater Management Perspective; Cooperative Research Centre for Catchment Hydrology: Melbourne, Australia, 2002. [Google Scholar]
  4. Mouritz, M.; Evangelisti, M.; McAlister, T. Water Sensitive Urban Design. In Australian Runoff Quality; Wong, T.H.F., Ed.; Engineers Australia: Sydney, Australia, 2006; p. 5-1–5-22. [Google Scholar]
  5. Woods-Ballard, B.; Kellagher, R.; Martin, P.; Jefferies, C.; Bray, R.; č Shaffer, P. The SuDS Manual CIRIA C697; CIRIA: London, UK, 2007; Available online: http://observatoriaigua.uib.es/repositori/suds_manual.pdf (accessed on 15 July 2023).
  6. Digman, C.; Ashley, R.; Balmforth, D.; Balmforth, D.; Stovin, V.; Glerum, J. Retroffiting Urban Areas to Effectively Manage Surface Water; CIRIA C713; CIRIA: London, UK, 2012. [Google Scholar]
  7. Woods Ballard, B.; Wilson, S.; Udale-Clarke, H.; Illman, S.; Scott, T.; Ashley, R.; Kellagher, R. The SuDS Manual CIRIA C753; CIRIA: London, UK, 2015. [Google Scholar]
  8. Potter, K.; Vilcan, T. Managing Urban Flood Resilience through the English Planning System: Insights from the ‘SuDS-Face. Phil. Trans. R. Soc. A 2020, 378, 20190206. [Google Scholar] [CrossRef] [PubMed]
  9. US Environmental Protection Agency (EPA). National Pollutant Discharge Elimination System (NPDES) Definitions; 40 C.F.R.§ 122.2; US Environmental Protection Agency (EPA): Washington, DC, USA, 2011.
  10. Fletcher, T.D.; Shuster, W.; Hunt, W.F.; Ashley, R.; Butler, D.; Arthur, S.; Trowsdale, S.; Barraud, S.; Semadeni-Davies, A.; Bertrand-Krajewski, J.-L.; et al. SUDS, LID, BMPs, WSUD and More—The Evolution and Application of Terminology Surrounding Urban Drainage. Urban Water J. 2015, 12, 525–542. [Google Scholar] [CrossRef]
  11. US EPA. Low Impact Development (LID), a Literature Review; EPA-841-B-00-005; United States Environmental Protection Agency: Washington, DC, USA, 2000.
  12. Dietz, M.E. Low Impact Development Practices: A Review of Current Research and Recommendations for Future Directions. Water Air Soil Pollut. 2007, 186, 351–363. [Google Scholar] [CrossRef]
  13. Cooper, A. Stormwater Management Opportunities with Urban Re-Development 2011. Available online: https://www.waternz.org.nz/Attachment?Action=Download&Attachment_id=139 (accessed on 15 July 2023).
  14. Petrucci, G.; Deroubaix, J.-F.; De Gouvello, B.; Deutsch, J.-C.; Bompard, P.; Tassin, B. Rainwater Harvesting to Control Stormwater Runoff in Suburban Areas. An Experimental Case-Study. Urban Water J. 2012, 9, 45–55. [Google Scholar] [CrossRef]
  15. Handley, J.; Pauleit, S.; Gill, S. Landscape, Sustainability and the City. In Landscape and Sustainability; Benson, J.F., Roe, M., Eds.; Routledge: London, UK, 2007; pp. 167–195. [Google Scholar]
  16. Balian, E.; Eggermont, H.; Roux, X.L. Nature-Based Solutions in a BiodivERsA Context. In L-Outcomes of the Strategic Foresight Workshop; BiodivERsA Report: Brussels, Belgium, 2014. [Google Scholar]
  17. Doswald, N.; Osti, M. Ecosystem-Based Approaches to Adaptation and Mitigation—Good Practice Examples and Lessons Learned in Europe; BfN-Skripten, Bundesamt für Naturschutz: Bonn, Germany, 2011; Volume 306.
  18. Munang, R.; Thiaw, I.; Alverson, K.; Mumba, M.; Liu, J.; Rivington, M. Climate Change and Ecosystem-Based Adaptation: A New Pragmatic Approach to Buffering Climate Change Impacts. Curr. Opin. Environ. Sustain. 2013, 5, 67–71. [Google Scholar] [CrossRef]
  19. Brink, E. Cascades of Green: A Review of Ecosystem-Based Adaptation in Urban Areas. Glob. Environ. Chang. 2016, 36, 111–123. [Google Scholar] [CrossRef]
  20. Benedict, M.A.; McMahon, E.T. Green Infrastructure: Linking Landscapes and Communities; Island Press: Washington, DC, USA, 2006. [Google Scholar]
  21. M.E.A. Ecosystems and Human Well-Being: Synthesis; Island Press: Washington, DC, USA, 2005. [Google Scholar]
  22. Gómez-Baggethun, E.; Barton, D.N. Classifying and valuing ecosystem services for urban planning. Ecol. Econ. 2013, 86, 235–245. [Google Scholar] [CrossRef]
  23. Pauleit, S.; Zölch, T.; Hansen, R.; Randrup, T.B.; Bosch, C.K. Nature-Based Solutions and Climate Change—Four Shades of Green. In Nature-Based Solutions to Climate Change Adaptation in Urban Areas—Linkages between Science, Policy and Practice; Kabisch, N., Korn, H., Stadler, J., Bonn, A., Eds.; Springer Open: Berlin/Heidelberg, Germany, 2017. [Google Scholar]
  24. Haase, D.; Larondelle, N.; Andersson, E.; Artmann, M.; Borgström, S.; Breuste, J.; Gomez-Baggethun, E.; Gren, Å.; Hamstead, Z.; Hansen, R.; et al. A Quantitative Review of Urban Ecosystem Service Assessments: Concepts, Models, and Implementation. AMBIO 2014, 43, 413–433. [Google Scholar] [CrossRef] [PubMed]
  25. Mosatafavi, M.; Doherty, G. Ecological Urbanism; Harvard University, Graduate School of Design: Cambridge, MA, USA, 2010. [Google Scholar]
  26. Brown, P.; Keath, H.; Wong, T. Urban Water Management in Cities: Historical, Current and Future Regimes. Water Sci. Technol. 2009, 59, 847–855. [Google Scholar] [CrossRef] [PubMed]
  27. Vasilevska, L.; Vasilevska, M. Bringing Nature into Urban Areas through Implementation of Modern Stormwater Management Approaches: Examples from Vienna’s Neighbourhoods. In Proceedings of the International Conference on Urban Planning ICUP 2018, Nis, Serbia, 14–17 November 2018. [Google Scholar]
  28. Gordon-Walker, S.; Harle, T.; Naismith, I. Using Science to Create a Better Place. In Cost-Benefit of SUDS Retrofit in Urban Areas; Science Report—SC060024; Environmental Agency: Bristol, UK, 2007. [Google Scholar]
  29. Sui, X. č van de Ven, F.H. The Influence of Low Impact Development (LID) on Basin Runoff in a Half-Urbanized Catchment: A Case Study in San Antonio, Texas. J. Hydrol. 2023, 616, 128793. [Google Scholar] [CrossRef]
  30. Blagojević, B.; Vasilevska, L. Evaluating Options for Water Sensitive Urban Design in the Medijana Municipality. In Proceedings of the International Conference Contemporary Achievements in Civil Engineering, Subotica, Serbia, 24–25 April 2014; Volume 25, pp. 611–617. [Google Scholar] [CrossRef]
  31. Bai, Y.; Li, Y.; Zhang, R.; Zhao, N.; Zeng, X. Comprehensive Performance Evaluation System Based on Environmental and Economic Benefits for Optimal Allocation of LID Facilities. Water 2019, 11, 341. [Google Scholar] [CrossRef]
  32. ACO. StormBrixx Range: Stormwater Attenuation and Infiltration/Soakaway Crates. Available online: https://www.aco.co.uk/products/stormbrixx (accessed on 15 July 2023).
  33. US, E.P.A. Storm Water Management Model. Available online: https://www.epa.gov/water-research/storm-water-management-model-swmm (accessed on 15 July 2023).
  34. Vollaers, V.; Nieuwenhuis, E.; Van De Ven, F.; Langeveld, J. Root Causes of Failures in Sustainable Urban Drainage Systems (SUDS): An Exploratory Study in 11 Municipalities in The Netherlands. Blue-Green Syst. 2021, 3, 31–48. [Google Scholar] [CrossRef]
  35. Nunes, R.T.S.; Deletic, A.; Wong, T.H.F.; Prodanoff, J.H.A.; Freitas, M.A.V. Procedures for Integrating Water Sensitive Urban Design (WSUD) Technologies into the City Planning Process: Criteria for Street Scale Applied in Melbourne Region—Australia. In Proceedings of the 12nd International Conference on Urban Drainage ICU, Porto Alegre, Brazil, 11 September 2011. [Google Scholar] [CrossRef]
  36. Republički zavod za statistiku Republike Srbije. Available online: https://www.stat.gov.rs/sr-latn/oblasti/popis/popis-2011/popisni-podaci-eksel-tabele/ (accessed on 15 July 2023).
  37. Ministry for Environment and Spatial Planning of Republic of Serbia. Spatial Plan of the Republic of Serbia; Official Gazette of the Republic of Serbia No. 88/2010; Ministry for Environment and Spatial Planning of Republic of Serbia: Belgrade Serbia, 2010.
  38. Republic Hydrometeorological Service of Serbia (RHMSS). Available online: https://www.hidmet.gov.rs/ciril/meteorologija/klimatologija_srbije.php (accessed on 17 September 2023).
  39. Republic Hydrometeorological Service of Serbia (RHMSS). Available online: https://www.hidmet.gov.rs/ciril/meteorologija/klimatologija_srednjaci.php (accessed on 17 September 2023).
  40. Government of Republic of Serbia and Ministry of Agriculture and Environmental Protection (MAEP). Water Resources Management Strategy for the Republic of Serbia Territory until 2034; Official Gazette of the Republic of Serbia No. 3/2017; Government of Republic of Serbia and Ministry of Agriculture and Environmental Protection (MAEP): Belgrade, Serbia, 2017.
  41. Životić, L.; Vuković-Vimić, A. Soil Degradation and Climate Change in Serbia. Available online: https://www.undp.org/sites-/g/files/zskgke326/files/2022-07/Soil_degradation_and_climate_change_in_Serbia_web.pdf (accessed on 17 September 2023).
  42. Vuković, A.; Vujadinović, M.; Rendulić, S.; Đurđević, V.; Ruml, M.; Babić, V.; Popović, D. Global warming impact on climate change in Serbia for the period 1961-2100. Therm. Sci. 2018, 22, 2267–2280. [Google Scholar] [CrossRef]
  43. NALED. Analiza 360°—Stanje u Oblasti Upravljanja Otpadnim Vodama. Available online: https://naled.rs/publikacija.php?id=5100 (accessed on 16 September 2023).
  44. Milanović, D.; Blagojević, B.; Vasilevska, L. Nature Based Stormwater Management Solutions for Housing Area—Case Study of Roof Garden Implementation. In Proceedings of the International Symposium Water Resources Management: New Perspectives and Innovative Practices, Novi Sad, Serbia, 23–24 September 2021; Petrović, M., Gocić, M., Eds.; Futura: Novi Sad, Serbia, 2021; pp. 101–106. [Google Scholar]
  45. Shafique, M.; Kim, R.; Rafiq, M. Green roof benefits, opportunities and challenges—A review. Renew. Sustain. Energy Rev. 2018, 90, 757–773. [Google Scholar] [CrossRef]
  46. Department of Planning and Local Government. Water Sensitive Urban Design Technical Manual for the Greater Adelaide Region; Government of South Australia: Adelaide, Australia, 2010.
  47. Copernicus EU DEM. Available online: https://land.copernicus.eu/imagery-in-situ/eu-dem/eu-dem-v1.1 (accessed on 15 July 2023).
  48. Google LLC. Google Earth Pro. Available online: earth.google.com/web/ (accessed on 15 July 2023).
  49. Republic Geodetic Service of Serbia. GEOSRBIJA. Available online: https://a3.geosrbija.rs/ (accessed on 15 July 2023).
  50. Ministry of Mining and Energy Republic of Serbia. GEOLISS. Available online: https://geoliss.mre.gov.rs/ (accessed on 15 July 2023).
  51. UN, F.A.O. Harmonized World Soil Database v 1.2. Available online: https://www.fao.org/soils-portal/soil-survey/soil-maps-and-databases/harmonized-world-soil-database-v12/ru/ (accessed on 15 July 2023).
  52. Karaklajić, M. Natural Resources in Function of Prokuplje Municipality Regional Development. Master Thesis, University of Nis, Nis, Serbia, 2016. [Google Scholar]
  53. Republic Hydrometeorological Service of Serbia (RHMSS). Available online: https://www.hidmet.gov.rs/latin/hidrologija/podzemne/podzemne_godisnjaci.php (accessed on 15 July 2023).
  54. Srbijavode. Flood Hazard Maps. Available online: https://www.srbijavode.rs/karte-ugrozenosti-i-karte-rizika-od-poplava.html (accessed on 15 July 2023).
  55. Open Street Map (OSM). Available online: https://www.openstreetmap.org/ (accessed on 15 September 2023).
  56. Copernicus. Corine Land Cover. Available online: https://land.copernicus.eu/pan-european/corine-land-cover/clc2018 (accessed on 15 July 2023).
  57. QGIS Geographic Information System. Open Source Geospatial Foundation Project. Available online: http://qgis.org (accessed on 15 July 2023).
  58. Google Earth Engine Documentation. Available online: https://explorer.earthengine.google.com/#index (accessed on 17 September 2023).
  59. Minnesota Pollution Control Agency. Design Criteria for Permeable Pavement—Minnesota Stormwater Manual. Available online: https://stormwater.pca.state.mn.us/index.php?title=Design_considerations_for_green_stormwater_infrastructure_best_management_practices (accessed on 15 July 2023).
  60. GeoSrbija. Available online: https://geosrbija.rs/en/posts/ (accessed on 15 July 2023).
  61. Li, H.; Herfort, B.; Lautenbach, S.; Chen, J.; Zipf, A. Improving OpenStreetMap Missing Building Detection Using Few-Shot Transfer Learning in Sub-Saharan Africa. Trans. GIS 2022, 26, 3125–3146. [Google Scholar] [CrossRef]
  62. Dinić Branković, M.; Mitković, P.; Bogdanović Protić, I.; Igić, M.; Đekić, J. Bioswales as Elements of Green Infrastructure—Foreign Practice and Possibilities of Use in the District of the City of Nis, Serbia. In Proceedings of the 2nd International Conference on Urban Planning, Nis, Serbia, 14–17 November 2018; pp. 347–356. [Google Scholar]
  63. Lousada, S.; Cabezas, J.; Castanho, R.A.; Gómez, J.M.N. Hydraulic Planning in Insular Urban Territories: The Case of Madeira Island—Ribeira Brava. Water 2021, 13, 2951. [Google Scholar] [CrossRef]
  64. Lousada, S.; Alves, R.; Fernandes, M.; Gonçalves, L. Hydraulic Planning in Insular Urban Territories: The Case of Madeira Island—São João Stream, Funchal, Portugal. Water 2023, 15, 2075. [Google Scholar] [CrossRef]
  65. Lousada, S.; Alves, R.; Fernandes, M.; Gonçalves, L. Hydraulic Planning in Insular Urban Territories: The Case of Madeira Island—Ribeira Brava, Tabua. Water 2023, 15, 2609. [Google Scholar] [CrossRef]
  66. Akhter, F.; Hewa, G.A.; Ahammed, F.; Myers, B.; Argue, J.R. Performance Evaluation of Stormwater Management Systems and Its Impact on Development Costing. Water 2020, 12, 375. [Google Scholar] [CrossRef]
Figure 1. The urban settlements in the Region of Southern and Eastern Serbia selected for the study.
Water 15 03604 g001
Figure 2. A conceptual framework to assess suitability of the USs for implementation of NbS SM technical elements by spatial analysis.
Water 15 03604 g002
Figure 3. US8—the borders of the US proper. Background orthophoto: GeoSrbija [49].
Water 15 03604 g003
Figure 4. US 8—(a) DEM, (b) slope map with classification appropriate for the constraint C−1 assessment.
Water 15 03604 g004
Figure 5. US 8—(a) the geological source data, (b) constraint C−2 (bedrock location).
Water 15 03604 g005
Figure 6. US 8—(a) the source soil data, (b) constraints C−3 and C−4 (soil permeability).
Water 15 03604 g006
Figure 7. US 8—constraint C−5 (high groundwater table): (a) the zone of high groundwater table defined from gauged water table data, (b) 100-year flood zone within the trained riverbed.
Water 15 03604 g007
Figure 8. US 8—constraint C−6 (land availability): (a) mapped buildings and public parking lots (objects), (b) land use classes.
Water 15 03604 g008
Figure 9. US 8—(a) bioretention cell (E1), rain garden (E2), and porous pavement with runoff detention (E4b); (b) infiltration trench (E3). Color key: 0 (white), area generally suitable; 1 (red), area generally not suitable; 2 (pink), area conditionally suitable with modification to the element(s) design.
Water 15 03604 g009
Figure 10. US 8—(a) porous pavement with runoff detention (E4a); (b) vegetative swale (E5). Color key: 0 (white), area generally suitable; 1 (red), area generally not suitable; 2 (pink), area conditionally suitable with modification to the element(s) design.
Water 15 03604 g010
Figure 11. Bioretention cell (E1), rain garden (E2), and porous pavement with runoff detention (E4b)—the implementation potential in all USs shown in % of US proper area: (a) 0—area generally suitable; (b) 1—area generally not suitable; (c) 2—area conditionally suitable with modification to the element(s) design.
Water 15 03604 g011
Figure 12. Infiltration trench (E3) and porous pavement with runoff detention (E4a)—the implementation potential in all USs shown in % of US proper area: (a) 0—area generally suitable; (b) 1—area generally not suitable; (c) 2—area conditionally suitable with modification to the element(s) design.
Water 15 03604 g012
Figure 13. Vegetative swale (E5)—the implementation potential in all USs shown in % of US proper area: (a) 0—area generally suitable; (b) 1—area generally not suitable; (c) 2—area conditionally suitable with modification to the element design.
Water 15 03604 g013
Figure 14. Area suitability for E5 vegetative swale upon the source data set update for land availability constraint: (a) the US8 area; (b) zoom to the central US8 part where all suitability classes are present.
Water 15 03604 g014
Table 1. Site constraints for implementation of NbS SM elements shown as digits 0, 1, and 2 1. Based on [46].
LabelNbS SM ElementConstraint 2
C−1C−2C−3C−4C−5C−6
E1Bioretention Cell/System120211
E2Rain Garden120211
E3Infiltration trench111012
E4aPorous Pavement (infiltration)111011
E4bPorous Pavement (detention)120211
E5Vegetative Swale120021
Notes: 1 0—generally not a constraint, 1—constraint may preclude the use of this element, 2—constraint may be overcome with appropriate modification to design. 2 C−1: Steep site; C−2: shallow bedrock; C−3: low-permeability soils; C−4: high-permeability soils; C−5: high water table; C−6: land availability.
Table 2. The data sources for preliminary suitability assessment of NbS SM elements per US.
LabelSite ConstraintUS# 1
12345678
C−1Steep siteEU DEM [47]Google Earth Pro [48]
C−2Shallow bedrockGeological Map of Serbia [49]Geoliss [50]
C−3Low-permeability soilsHarmonized World Soil DB [51]
C−4High-permeability soils
C−5High groundwater table[52]xRHMSS [53]xRHMSS [53], FHM [54]
C−6Land availability 2OSM [55]OSM [55], CLC [56]OSM [55]OSM [55], CLC [56]
100%70%60%40%15%40%90%30%
Notes: 1 1—Prokuplje; 2—Pirot; 3—Niš; 4—Leskovac; 5—Vranje; 6—Zaječar; 7—Bor; 8—Knjaževac. 2 A share of mapped buildings compared to the ground truth is shown in the last row.
Table 3. Preliminary spatial analysis results per US and NbS SM element in % of the US area.
LabelNbS SM ElementConstraint Level 1US# 2
12345678
E1Bioretention Cell/System012578181470580
18843191953574291
2100004309
E2Rain Garden012578181470580
18843191953574291
2100004309
E3Infiltration trench0008181473102
11001001919536210098
200000700
E4aPorous Pavement (infiltration)0008181473102
11001001919536910098
E4bPorous Pavement (detention)012578181470580
18843191953574291
2100004309
E5Vegetative Swale0125781814722582
17743191953722063
211000052236
Notes: 1 0 (white), area generally suitable; 1 (red), area generally not suitable; 2 (pink), area conditionally suitable with modification to the element design. 2 1—Prokuplje; 2—Pirot; 3—Niš; 4—Leskovac; 5—Vranje; 6—Zaječar; 7—Bor; 8—Knjaževac.
Table 4. Preliminary spatial analysis results in US8 upon the source data set update for land availability constraint. NbS SM element suitability shown in % of the US8 area.
NbS SM Element LabelUS8
UpdatedInitialUpdated−Initial
012012012
E1, E2, E4b0946091903−3
E319812980−101
E4a19902980−110
E52752326335012−12
Note: 0 (white), area generally suitable; 1 (red), area generally not suitable; 2 (pink), area conditionally suitable with modification to the element design.
Disclaimer/Publisher’s Note: The statements, opinions and data contained in all publications are solely those of the individual author(s) and contributor(s) and not of MDPI and/or the editor(s). MDPI and/or the editor(s) disclaim responsibility for any injury to people or property resulting from any ideas, methods, instructions or products referred to in the content.