Article

Modeling of Monthly Rainfall–Runoff Using Various Machine Learning Techniques in Wadi Ouahrane Basin, Algeria

1
Department of Water Engineering and Hydraulic Structures, Faculty of Civil Engineering, Semnan University, Semnan 35131-19111, Iran
2
Water and Environment Laboratory, Faculty of Nature and Life Sciences, Hassiba Benbouali University of Chlef, Chlef 02180, Algeria
3
Construction and Project Management Research Institute, Housing and Building National Research Centre, Giza 12311, Egypt
4
Department of Civil, Environmental and Natural Resources Engineering, Lulea University of Technology, 97187 Lulea, Sweden
5
Civil Engineering Department, College of Engineering, Najran University, Najran 66291, Saudi Arabia
*
Authors to whom correspondence should be addressed.
Water 2023, 15(20), 3576; https://doi.org/10.3390/w15203576
Submission received: 6 September 2023 / Revised: 6 October 2023 / Accepted: 9 October 2023 / Published: 12 October 2023

Abstract

:
Rainfall–runoff modeling has been the core of hydrological research studies for decades. To comprehend this phenomenon, many machine learning algorithms have been widely used. Nevertheless, a thorough comparison of machine learning algorithms and the effect of pre-processing on their performance is still lacking in the literature. Therefore, the major objective of this research is to simulate rainfall runoff using nine standalone and hybrid machine learning models. The conventional models include artificial neural networks, least squares support vector machines (LSSVMs), K-nearest neighbor (KNN), M5 model trees, random forests, multiple adaptive regression splines, and multivariate nonlinear regression. In contrast, the hybrid models comprise LSSVM and KNN coupled with a gorilla troop optimizer (GTO). Moreover, the present study introduces a new combination of the feature selection method, principal component analysis (PCA), and empirical mode decomposition (EMD). Mean absolute error (MAE), root mean squared error (RMSE), relative RMSE (RRMSE), person correlation coefficient (R), Nash–Sutcliffe efficiency (NSE), and Kling Gupta efficiency (KGE) metrics are used for assessing the performance of the developed models. The proposed models are applied to rainfall and runoff data collected in the Wadi Ouahrane basin, Algeria. According to the results, the KNN–GTO model exhibits the best performance (MAE = 0.1640, RMSE = 0.4741, RRMSE = 0.2979, R = 0.9607, NSE = 0.9088, and KGE = 0.7141). These statistical criteria outperform other developed models by 80%, 70%, 72%, 77%, 112%, and 136%, respectively. The LSSVM model provides the worst results without pre-processing the data. Moreover, the findings indicate that using feature selection, PCA, and EMD significantly improves the accuracy of rainfall–runoff modeling.

1. Introduction

Accurate rainfall–runoff modeling has been one of the most popular subjects for hydrology researchers because of its importance for water resources planning and management, including dam design, reservoir operation planning, and flood mitigation management [1,2]. In addition, the development of these models enhances comprehension of the ongoing hydrological processes in the watersheds [3]. This topic has gained paramount attention in recent years because of the world’s declining water supply, which necessitates the development of accurate modeling techniques [4]. The intricate link between rainfall and runoff makes it difficult to estimate runoff accurately [5]. This can be attributed to the heterogeneous distribution and the spatial-temporal fluctuations of hydrological components [6]. In addition to rainfall, wind speed, temperature, solar radiation, evapotranspiration, and other meteorological factors, catchment-specific characteristics (e.g., land cover, topography, soil type, and slope) affect river runoff changes. As a result, developing accurate models to capture this dynamic and nonlinear natural phenomenon is challenging because these interrelated factors take place at many temporal and geographical scales [7]. Additionally, it is challenging to gather predictor variables from a catchment system using large samples. The difficulties of accurate and quantitative representation of the available data provide the key problems in the modeling process.
In general, there are two categories of hydrological models: (a) conceptual and physical-based models and (b) empirical or data-driven models. The former models need a lot of input parameters and a lot of hydro-meteorological information. The applicability of these models to represent hydrological processes is frequently limited by these constraints [8]. Also, in the absence of accurate data on meteorological and site-specific parameters, the data-driven models are suitable for modeling the rainfall–runoff process due to their minimal input dataset requirements [9]. Machine learning and data-driven models have been effectively used in recent years to simulate the nonlinear and nonstationary runoff phenomenon [10,11,12]. These approaches can be used to simulate hydrological processes due to various physical phenomena, such as the periodicity, pattern, or randomness of model input and target data [13,14].
Tikhamarine et al. [15] introduced the combination of Harris Hawks optimization (HHO) with a multi-layer perceptron neural network and least squares support vector machine (LSSVM) to predict the rainfall–runoff. Based on the autocorrelation function (ACF), partial ACF (PACF), and cross-correlation function, five alternative situations were explored. The performance of the suggested models was compared with data-driven methodologies integrated with particle swarm optimization (PSO). The findings showed that hybrid models trained using HHO exhibited better performance in forecasting runoff compared with integrated models with PSO. Additionally, coupling LSSVM with HHO resulted in a high degree of runoff prediction accuracy. Adnan et al. [16] examined the application of four machine learning techniques to estimate rainfall–runoff at an hourly timeframe in the Italian Samoggia River basin. The models included a multi-model simple averaging ensemble approach, multiple adaptive regression splines (MARS), an M5 model tree, as well as an adaptive neuro-fuzzy inference system (ANFIS) with fuzzy c-means (FCM) and the PSO algorithm. The outcomes of the developed models were compared with the theoretical EBA4SUB model using five statistics: mean absolute error (MAE), root mean squared error (RMSE), Nash–Sutcliffe efficiency (NSE), modified index of agreement, and scatter index. The MARS, ANFIS-FCM, and ANFIS-PSO offered equal accuracy, which was better than the M5 model. The machine approaches often outperformed the EBA4SUB when compared to the conceptual event-based method; however, in some instances, the latter method provided higher accuracy than the M5 model and MARS.
Mohammadi [11] reviewed the application of machine learning approaches (e.g., support vector machine (SVM), artificial neural network (ANN), and ANFIS) for hydrological subjects, including streamflow, rainfall–runoff, surface hydrology, and flood modeling. Furthermore, the benefits and drawbacks of popular machine learning models were critically examined in the field of runoff modeling. Okkan et al. [17] integrated ANN and support vector regression (SVR) into a conceptual rainfall–runoff model for monthly runoff simulation in the Gediz River Basin, Turkey. The nested hybrid models’ parameters were all calibrated at once. The nested hybrid models outperformed the standalone models and linked model versions in terms of mean and high flows, according to the performance metrics. Thus, the research affirmed the credibility of a modeling approach that combined a conceptual model and several machine learning approaches. Roy et al. [18] applied a deep neural network (DNN) and EO-ELM model that integrated an equilibrium optimizer (EO) and an extreme learning machine (ELM) for rainfall–runoff modeling in the UK’s River Fal at Tregony and the Teifi in Glanteifi. In order to deploy the suggested models, an ideal amount of lag inputs was determined using PACF. The proposed models were validated in terms of prediction accuracy using ELM, kernel ELM, PSO-based ELM, SVR, ANN, and gradient boosting machines. Additionally, the research applied a discrete wavelet-based dataset pre-processing approach to improve the performance of the suggested models. This research demonstrated how well EO-ELM and DNN may be used for rainfall–runoff modeling.
Waqas et al. [19] developed radial basis function (RBF)-SVM and M5 models to model the rainfall–runoff process in the Jhelum River Basin, Pakistan. The models were trained and tested using various combinations of datasets. Modeled and observed data were assessed using the coefficient of determination (R2), normalized RMSE, MSE, and coefficient of efficiency for the training and testing phases. According to the findings, gene expression programming was found to be the most precise and highly effective technique. Xiao et al. [20] developed a backpropagation neural network, a generalized regression neural network (GRNN), an ELM, and a wavelet neural network (WNN) for runoff forecasting in the Xijiang River. The GRNN model performed better in runoff forecasting by considering flood propagation time. The WNN model exhibited the highest accuracy in the 7-day lead time for water level. This study suggested a machine learning-based runoff forecasting model would enhance flood and drought early warning systems. Singh et al. [21] used MARS, SVM, multiple linear regression (MLR), and random forest (RF) for rainfall–runoff prediction in the Gola watershed, Uttarakhand. The performance of models was assessed using numerical indices (i.e., R2, RMSE, NSE, and percent bias) along with graphical charting (i.e., scatter plots, relative error plots, violin plots, line diagrams, and Taylor diagrams). In all case studies, the RF outperformed the other models in terms of daily runoff forecasting in both the training and testing phases.
After reviewing the literature, it is observed that many machine learning algorithms have been employed to mimic rainfall–runoff simulation. However, there is a lack of a comprehensive comparison of machine learning algorithms. In this regard, the main goal of this research is to simulate the rainfall–runoff phenomenon using standalone and hybrid machine learning models. ANN, LSSVM, K-nearest neighbor (KNN), M5 model, RF, MARS, and multivariate nonlinear regression (MNLR) are examples of conventional models. Meanwhile, hybrid models refer to LSSVM and KNN coupled with gorilla troop optimizer (GTO). Additionally, this study introduces a new combination of the feature selection method, principal component analysis (PCA), and empirical mode decomposition (EMD). The developed models are evaluated using MAE, RMSE, relative RMSE (RRMSE), person correlation coefficient (R), NSE, and Kling Gupta efficiency (KGE). The proposed models are applied to rainfall and runoff dataset records in Wadi Ouahrane, Algeria, because of the complex and nonlinear nature of runoff precipitation in this basin.

2. Materials and Methods

2.1. Multivariate Empirical Mode Decomposition (EMD)

EMD was introduced to decompose a signal of original data into finite and small oscillating modes. The oscillating methods are known as intrinsic mode functions (IMFs) and should meet the following criteria [22]:
  • Over the entire signal length, the number of zero-crossings and the number of local maxima and minima are either equal to or at least differ by one.
  • The average upper and lower envelopes calculated by local maxima and minima should be equal to zero.
EMD does not need to select the base function, and it is an alternative to signal decomposition methods such as the Fourier transform and the wavelet transform. In this process, the IMFs are obtained from the signal until they satisfy the above-mentioned criteria. The sifting method for extracting IMFs includes the following steps:
Step 1: Determine all the extreme points of the given signal.
Step 2: Use a cubic spline to fit the upper and lower envelopes of the signal.
Step 3: Calculate the average upper and lower envelopes using Equation (1) [23].
M ( t ) = e u p p e r t e l o w e r t 2
Step 4: Subtract the average from the data to create the IMF candidate using Equation (2).
h t = y t M t
Step 5: If h t satisfies the two criteria for IMFs, it is considered the first IMF; otherwise, y t is replaced with h t , and we go to step 1.
Step 6: The residual is regarded as new data, and steps 1–5 are applied. This process continues until the number of residues is constant or their trend is obtained. EMD is a simple and efficient method for the decomposition of signals. It is appropriate for identifying immediate frequency changes, especially for nonstationary signals.

2.2. Principle Component Analysis (PCA)

PCA is used for data pre-processing to identify the correlation among candidate factors. It converts the input variables into uncorrelated derived variables called principal components (PCs). Sums of PC variances are equal for the original and uncorrelated derived variables. PCs can be obtained using a linear function in Equation (3):
P C i = j = 1 N a i , j X j
where X j is the original variable, j is the index of the input variable, and i is the index of PC; a i , j and P C i are the eigenvalues and eigenvectors of the covariance matrix, respectively. The present study employs PCA because of the large size of the input dataset.

2.3. Multivariate Nonlinear Regression (MNLR)

MNLR is a nonlinear regression that estimates the nonlinear relationship between multiple inputs and output data. Equation (4) can be used for estimating the target variable.
R O u t p u t = i = 1 N W i X i 2 + i = 1 N W i X i + b
where W and b are the weight and bias parameters, respectively.

2.4. Artificial Neural Networks (ANNs)

ANN is a machine learning algorithm that solves linear or nonlinear regression and classification problems. It processes input and output data in a multi-layer network to find the relationship between variables. It consists of one input layer, one or multiple hidden layers, and one output layer, in which each layer comprises one or several neurons. Neurons are simple mathematical models of biological neurons. In the hidden layer, the weighted summation of back layer neurons is imposed on one stimulation function, and the stimulation function generates one output signal, which is the input of the subsequent layer neurons.

2.5. K-Nearest Neighbor (KNN)

KNN is a nonparametric machine learning algorithm that solves regression and classification problems without presuppositions about training data distribution. In this algorithm, training data are considered neighbor points. The inverse Euclidean distance between the testing data and neighbor points is regarded as the weight of these points. The shorter the Euclidean distance, the greater the weight. The neighbor points are sorted based on their weights, and the K neighbor points with the highest weights are selected. Then, the KNN computes the output of each input dataset using the weighted average of the K neighbor (Equation (5)) [24]:
R O u t p u t , i = j = 1 K W j R j j = 1 N W j
where R j is the jth observed runoff in the training period, R o u t p u t , i is the ith estimated runoff, and W j is the jth weight of the neighbor that can be calculated in Equation (6):
W j = 1 X X j
where X and X j are the testing and training input data, respectively. Figure 1 shows the KNN scheme for modeling runoff.

2.6. Multivariate Adaptive Regression Spline (MARS)

MARS is a nonparametric and nonlinear machine learning algorithm for solving various regression and classification problems. MARS divides the original dataset into multiple sub-datasets. Then, for each sub-dataset, the target variable is fit using a spline regression. The formulation for this process is given by:
R O u t p u t , i = b + j = 1 N β j h j X i
where b is the bias parameter, β is a constant coefficient, h is the basis function, and N is the number of basis functions [25].

2.7. M5 Model Tree (M5)

M5 is one of the tree-based machine learning algorithms used for modeling continuous variables. Its structure resembles a tree that consists of nodes, branches, and leaves. It splits the feature space into subsets, and a linear regression is fitted to the target variables of each subset. This process includes two steps: (1) growing the tree using input data and establishing linear regression at the end of each leaf, and (2) pruning extra branches to avoid overfitting. The splitting criterion is the maximum reduction in standard deviation, and it is calculated as follows [26]:
S D R = s d ( S ) + i = 1 N S i S s d S i
where S is a subset in the parent node, S i is a subset in the child node, and s d is the standard deviation for the input data.

2.8. Least Square Support Vector Machine (LSSVM)

The LSSVM is a modified version of the standard SVM. Unlike SVM, LSSVM employs linear equations instead of quadric programming and modifies SVM’s computation time efficiency and accuracy. LSSVM uses the following equation to estimate the output:
R O u t p u t , i = i = 1 N H X i , X α i + b
where α and b are lagrangian coefficients and bias, respectively. H is a kernel function that maps the nonlinear relation between input and output variables in low and high-dimensional feature space. This helps LSSVM solve the nonlinear problems in linear form. The linear, polynomial, sigmoid, and RBF are different types of kernel functions. However, the RBF is the most accurate kernel function that has been used in many studies. The RBF kernel functions are estimated as follows [27]:
H ( X , X i ) = exp X X i 2 2 σ 2
where σ represents the width of the kernel function. The main parameters of LSSVM are the penalty coefficient ( g a m m a ) and σ , in which g a m m a is used for computing α and b . The LSSVM scheme, including one input, hidden input, and final output, is demonstrated in Figure 2.

2.9. Random Forest Regression (RF)

RF is one of the ensemble machine learning algorithms that solves decision trees’ overfitting and instability problems. First, n random subsample from the original data is created. Then, for each subsample, one tree model is fitted, and RF integrates the generated results of all n trees into the outcome. In the present study, the M5 is considered an RF tree. For more information about RF, please see [28].

2.10. Gorilla Troop Optimizer (GTO)

GTO is based on the collaborative behavior of gorillas. This algorithm mimics five strategies of gorillas, including migration to unknown regions, migration to other gorillas, migration to other known locations, following the silverback, and competition for adult females [29]. The first three strategies are for exploration, and the remaining ones are for exploitation. Each artificial gorilla is considered one optimization problem solution, and the best gorilla in each iteration is regarded as a silverback. When r a n d < p , the first strategy of moving to an unknown region is selected. However, r a n d < 0.5 implies that the gorilla moves toward other gorillas, and if r a n d > 0.5 , the gorilla shall migrate to known locations. The three exploration strategies are given by [30]:
G X i i t e r + 1 = l b + r a n d 1 × u b l b , r a n d < p r a n d 2 C × X r + L × H r a n d 0.5 X i i t e r L × L × X i i t e r G X r i t e r 1 + r a n d 3 × X t G X r i t e r 1 , r a n d < 0.5
In this context, G X i i t e r + 1 is a new candidate position vector of gorilla, X i i t e r is the current position of gorilla, r a n d 1 , r a n d 2 , and r a n d 3 are random numbers in the range between 0 and 1. The p variable represents the probability of migration to unknown regions. X r and G T r are members of artificial gorillas that are randomly selected from the whole population. u b and l b are the upper and lower bounds of decision variables. C , L , and H can be calculated in Equations (12) and (13):
C = F × 1 i t e r M a x _ I t e r
F = cos 2 × r a n d 4 + 1
L = C × l
H = Z × X i t e r
Z = C , C
where i t e r refers to the current iteration, M a x _ I t e r is the maximum number of iterations, F is computed using Equation (8), c o s is a cosine function, and r a n d 4 is a random number in the range of [0, 1]. L is calculated using Equation (9), l is a random number ranging from 0 to 1, H is computed using Equation (11), and Z is a random value in the range between C and C . The fitness function of all G X is evaluated at the end of an exploration phase, and if the fitness function of G X i t e r is less than X i t e r , the G X i t e r is used as X i t e r . The best solution at this stage is the silverback gorilla.
GTO uses the silverback and competition for adult female strategies in the exploitation phase. Silverback is the head of the group that makes decisions and guides other gorillas to food sources. The young gorillas become mature and compete with other gorillas to select adult female gorillas. As per the below equation, these two strategies are mathematically modeled. If C W , the first strategy is followed; otherwise, the second strategy is selected. W can be set before running GTO in Equation (17).
G X i i t e r + 1 = L × M × X i t X s i l v e r b a c k , C W X s i l v e r b a c k X s i l v e r b a c k × Q X i t × Q × A C < W
where X s i l v e r b a c k is the position vector of the silverback, Q is the impact force, and A is the degree of violence in case of conflicts. Meanwhile, M , Q , and A are computed using the following Equations:
M = 1 N i = 1 N G X i t g 1 g
Q = 2 r a n d 5 1
A = β × E
where G X i i t e r is the current position of the candidate gorilla’s vector, N is the number of gorillas, r a n d 5 represents a random number between 0 and 1, and E simulates the violence effect on the solution’s dimensions. The values of g and E are calculated as follows:
g = 2 L
E = N 1 , r a n d 0.5 N 2 r a n d < 0.5
where N 1 is a normal value with a normal distribution in the problem’s dimensions and N 2 is a random number with a normal distribution.

2.11. Hybrid of LSSVM and KNN with Gorilla Troop Optimizer

Both LSSVM and KNN have essential parameters that should be selected before maneuvering them. However, choosing these parameters is still challenging for scientific societies. Using nature-based optimization algorithms can be an excellent solution to this challenge. Hence, in the present study, the GTO algorithm, as an efficient optimization algorithm, is used to determine the optimal LSSVM and GTO values. In this regard, the two-hybrid algorithms called KNN–GTO and LSSVM–GTO are defined. In KNN–GTO, the numbers of neighbors and input weight vectors are considered decision variables, whereas in LSSVM–GTO, penalty coefficients ( g a m m a ) and σ are decision variables. For finding the optimal parameters of KNN and LSSVM, GTO solves the following fitness function (Equation (23)) in a pre-defined maximum number of iterations:
f i t n e s s f u n c t i o n = i = 1 N R o u t p u t , i R o b s e r v e d , i 2 N
where R o b s e r v e d ,   i is the observed runoff. The pseudocodes of KNN–GTO and LSSVM–GTO are presented in Algorithm 1.
Algorithm 1. KNN–GTO and LSSVM–GTO
1: Initialize parameters of GTO
2: Load inputs and target variables dataset
3: Generate the initial population of GTO
4: Train and test KNN and LSSVM for each artificial gorilla
5: Calculate the fitness function (MSE) for each artificial gorilla
6: iter: =1
7: while iter < Max_Iter do
8:    Update the position of an artificial gorilla using Equations (10)–(19)
9:    iter: = iter + 1
10: end while
11: Return the best solution (optimal W and K for KNN, and gamma and σ for LSSVM)

2.12. Assessment Criteria

In this study, MAE, RMSE, RRMSE, R, NSE, and KGE metrics are used for assessing the performance of rainfall–runoff models using the following Equations [31,32]:
M A E = i = 1 N R o u t p u t , i R o b s e r v e d , i N
R M S E = i = 1 N R o u t p u t , i R o b s e r v e d , i 2 N
R R M S E = i = 1 N R o u t p u t , i R o b s e r v e d , i 2 N * s t d R o b s e r v e d 2
R = i = 1 N R o u t p u t , i R ¯ o u t p u t , i R o b s e r v e , i R ¯ o b s e r v e , i i = 1 N R o u t p u t , i R ¯ o u t p u t , i 2 i = 1 N R o b s e r v e , i R ¯ o b s e r v e , i 2
N S E = 1 i = 1 N R o b s e r v e , i R o u t p u t , i 2 i = 1 N R o b s e r v e , i R ¯ o b s e r v e , i 2
K G E = 1 R 1 2 + R ¯ o b s e r v e R ¯ o u t p u t 1 2 + s t d R o b s e r v e s t d R o u t p u t 1 2
where R o u t p u t , i , R o b s e r v e , i , R ¯ o u t p u t , R ¯ o b s e r v e , s t d R o u t p u t , s t d R o b s e r v e , and N are the output runoff, observed runoff, average output runoff, average observed runoff, standard deviation of output runoff, standard deviation of observed runoff, and number of data, respectively. The desired values of MAE and RMSE are zeros, and their undesired values are + . The desired values of RRMSE are in the range of [0, 0.5]. The R-value lies between −1 and 1, and R values close to 1 indicate good model performance. NSE = 1 denotes a perfect fit between the model and the data. KGE values range between − and 1, and values close to one indicate better model performance.

3. Case Study and Data Description

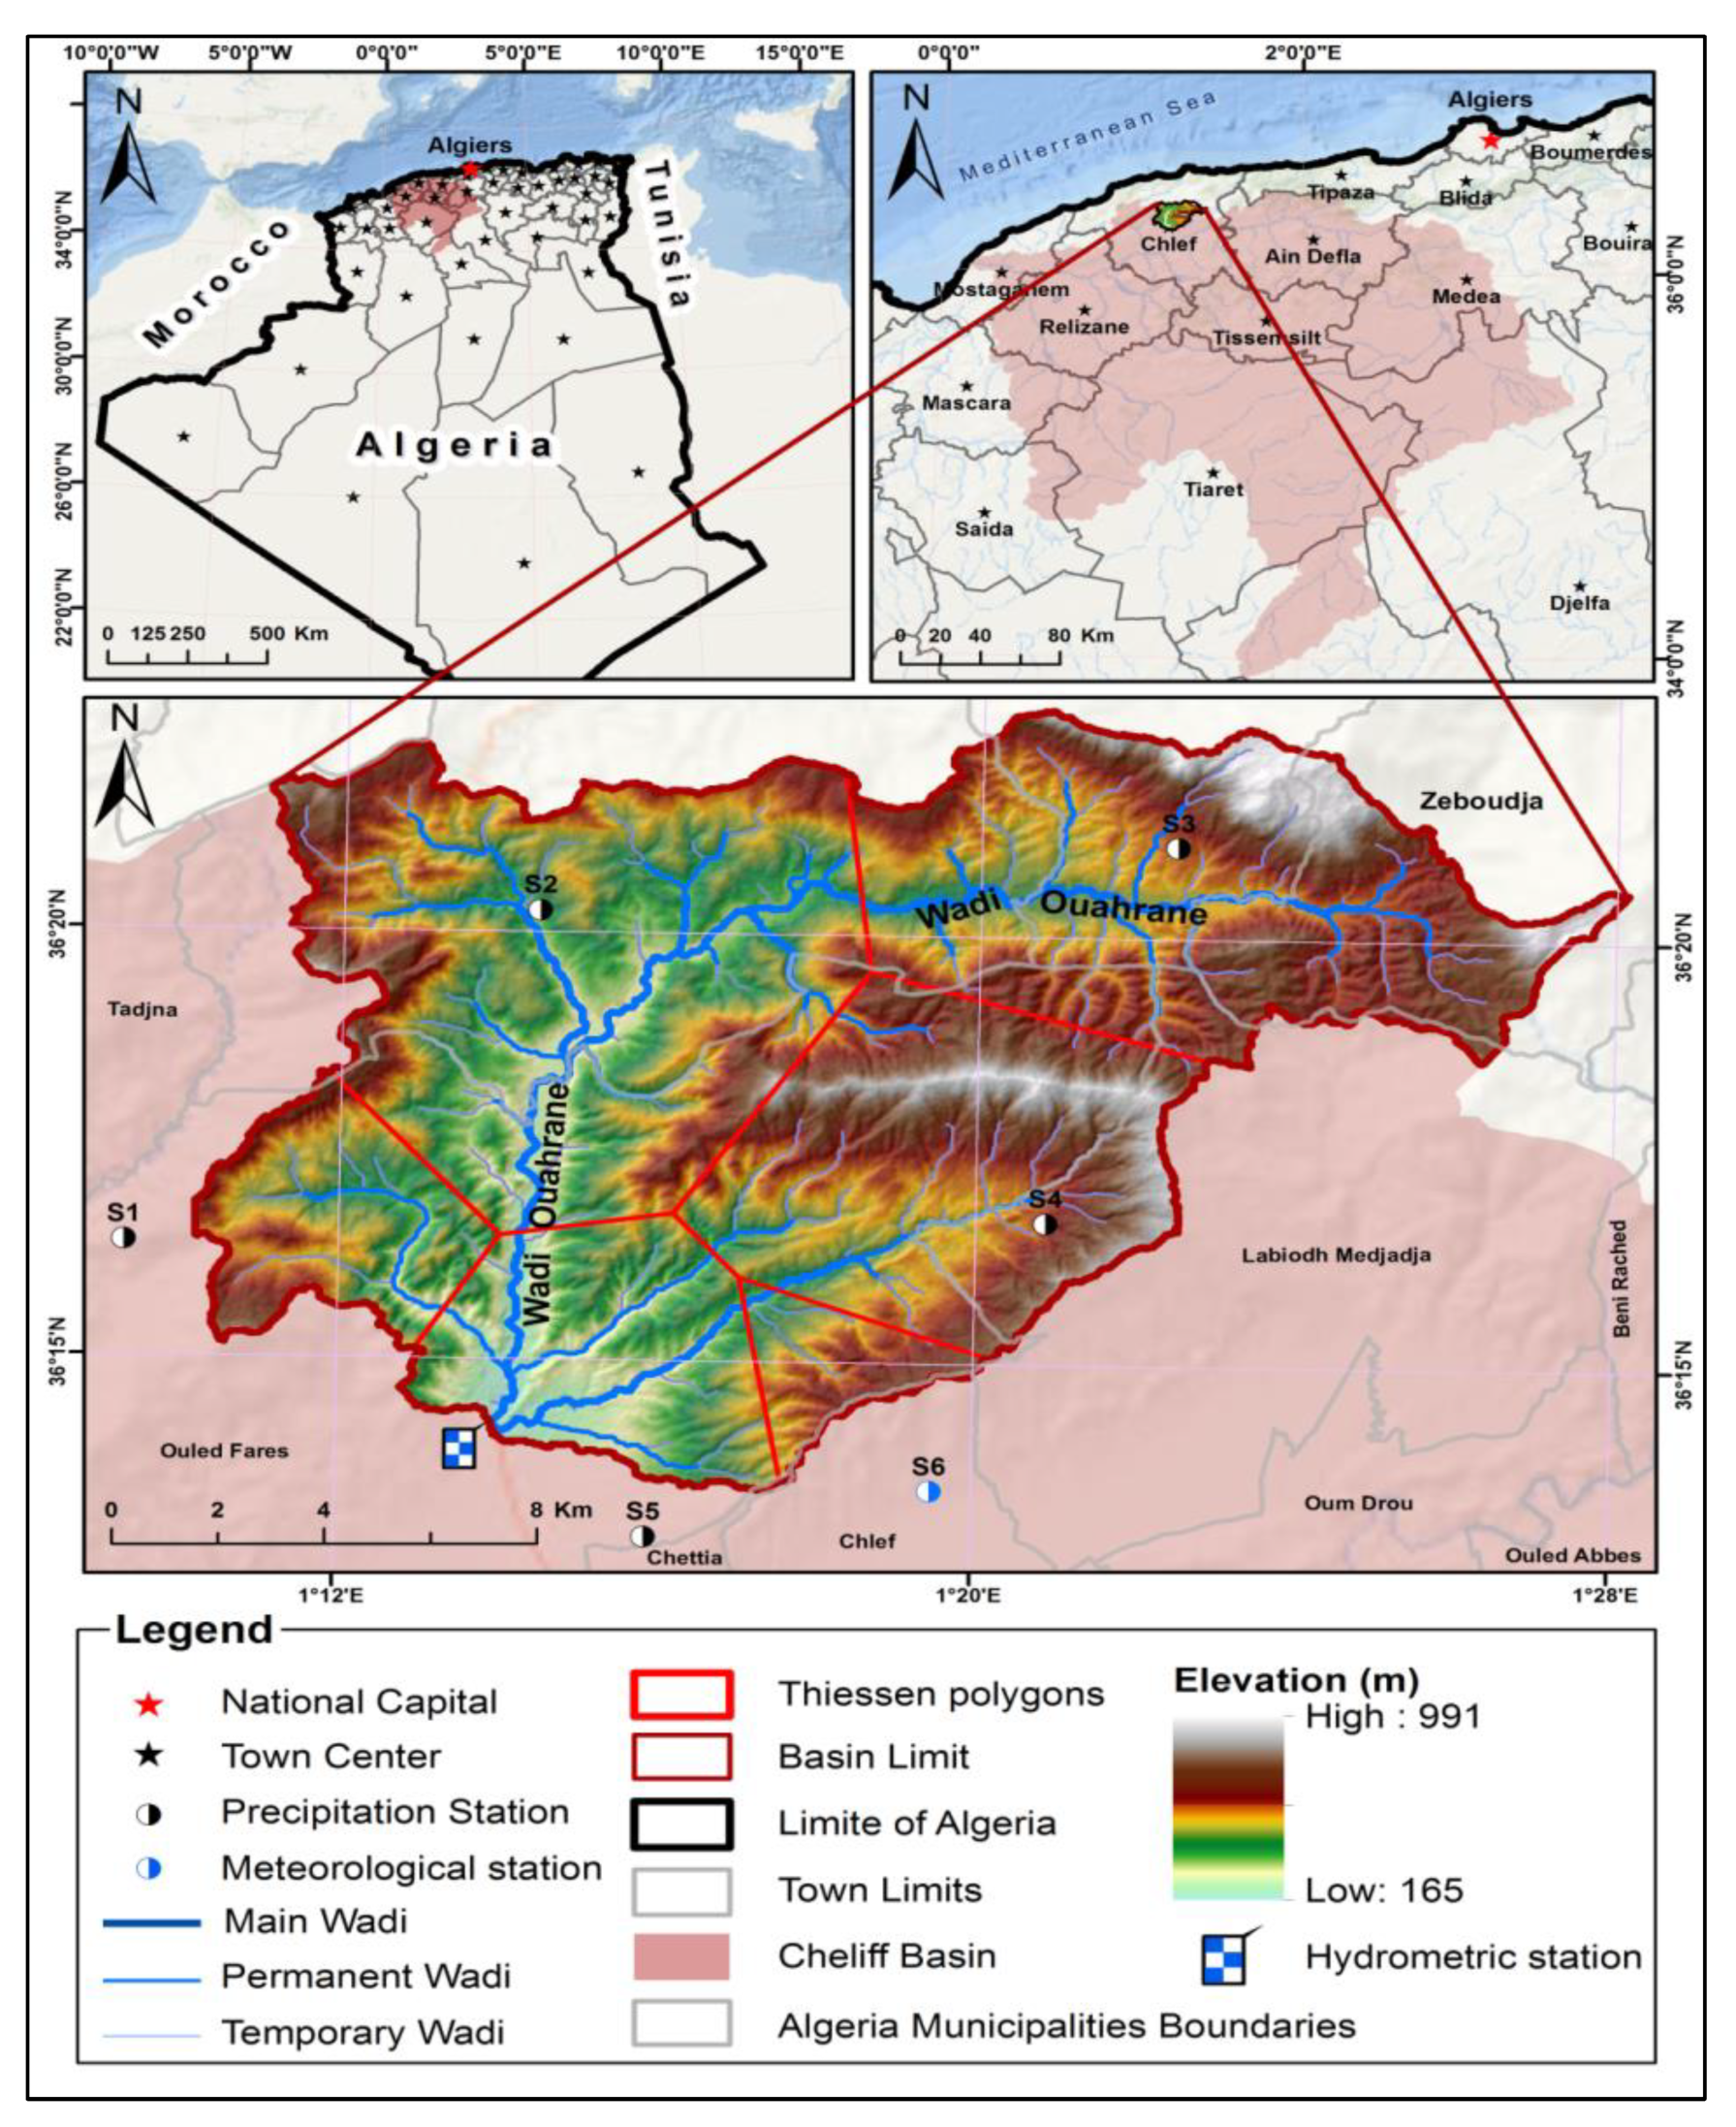
The study area is the Wadi Ouahrane basin in northern Algeria, which is located between 36°00′ N–36°24′ N and 01°00′ E–01°3′ E. This 270 km2 region is a section of the Wadi Cheliff basin (Figure 3). The research area was mapped using a digital elevation model (12.5 m horizontal resolution), which displays a maximum altitude of 991 m and a minimum altitude of 165 m. A little, few kilometers long tributary of Wadi Cheliff is called Wadi Ouahrane. The flow of water in this basin is controlled by six pluviometric stations. The Wadi Ouahrane basin is constrained by the Wadi Allala basin to the north, the Wadi Sly basin to the south, the Wadi Fodda basin to the east, and the Wadi Ras basin to the west. With an average interannual rainfall of 333 mm from 1972 to 2018, evapotranspiration (ET) is 1050 mm, and the mean annual flow is equal to 0.472 m3/s; this basin has a Mediterranean climate. The yearly average temperature is 18 Celsius. The monthly rainfall datasets were obtained at six stations between 1972 and 2018, and these dataset records are used in this study. The meteorological information was given by the National Meteorological Organization and the National Water Resources Agency of Algeria.
The correlation plot for the input and target variables is shown in Figure 4. In this figure, positive correlation shows a direct relationship between inputs and targets, negative correlation shows the inverse relationship, and close to zero correlation indicates no relation between inputs and targets. The maximum and minimum correlation between input and target variables in Figure 4 are related to R_S1 and Tmean, respectively. However, the correlation between inputs and targets is not close to 1 or −1. Also, the statistical criteria for input and target variables are presented in Table 1. According to this table, although the coefficient of variation in runoff data is lower than the inputs, its skewness coefficient is significantly higher than the inputs. Therefore, the runoff data studied do not follow the normal distribution and have high dispersion. These observations prove the nonlinear runoff production in this basin. Consequently, powerful nonlinear methods are expected to be needed for rainfall–runoff modeling in this basin.

4. Presented Framework for Modeling Rainfall–Runoff

The present study introduces a framework based on a combination of the feature selection method, PCA, EMD, and hybrids of KNN and LSSVM with GTO. In this framework, the most important inputs are selected using feature selection, and then the dataset is randomly divided into training and testing periods. The pseudocode of the applied feature selection method is illustrated in Algorithm 2. This feature selection method selects lagged inputs with a higher correlation with the target data.
Algorithm 2 feature selection
1: Load input data and target data
2: Apply lag times to input data
3: while i < number of input features do
4:          Calculate the Pearson correlation coefficient (R) between the feature and target data.
5:           If R < threshold of R
6:                 Remove feature from the input data
7:          end if
8:          i: = i + 1
9: end while
10: Apply PCA to the remaining input data
11: Return the final inputs list
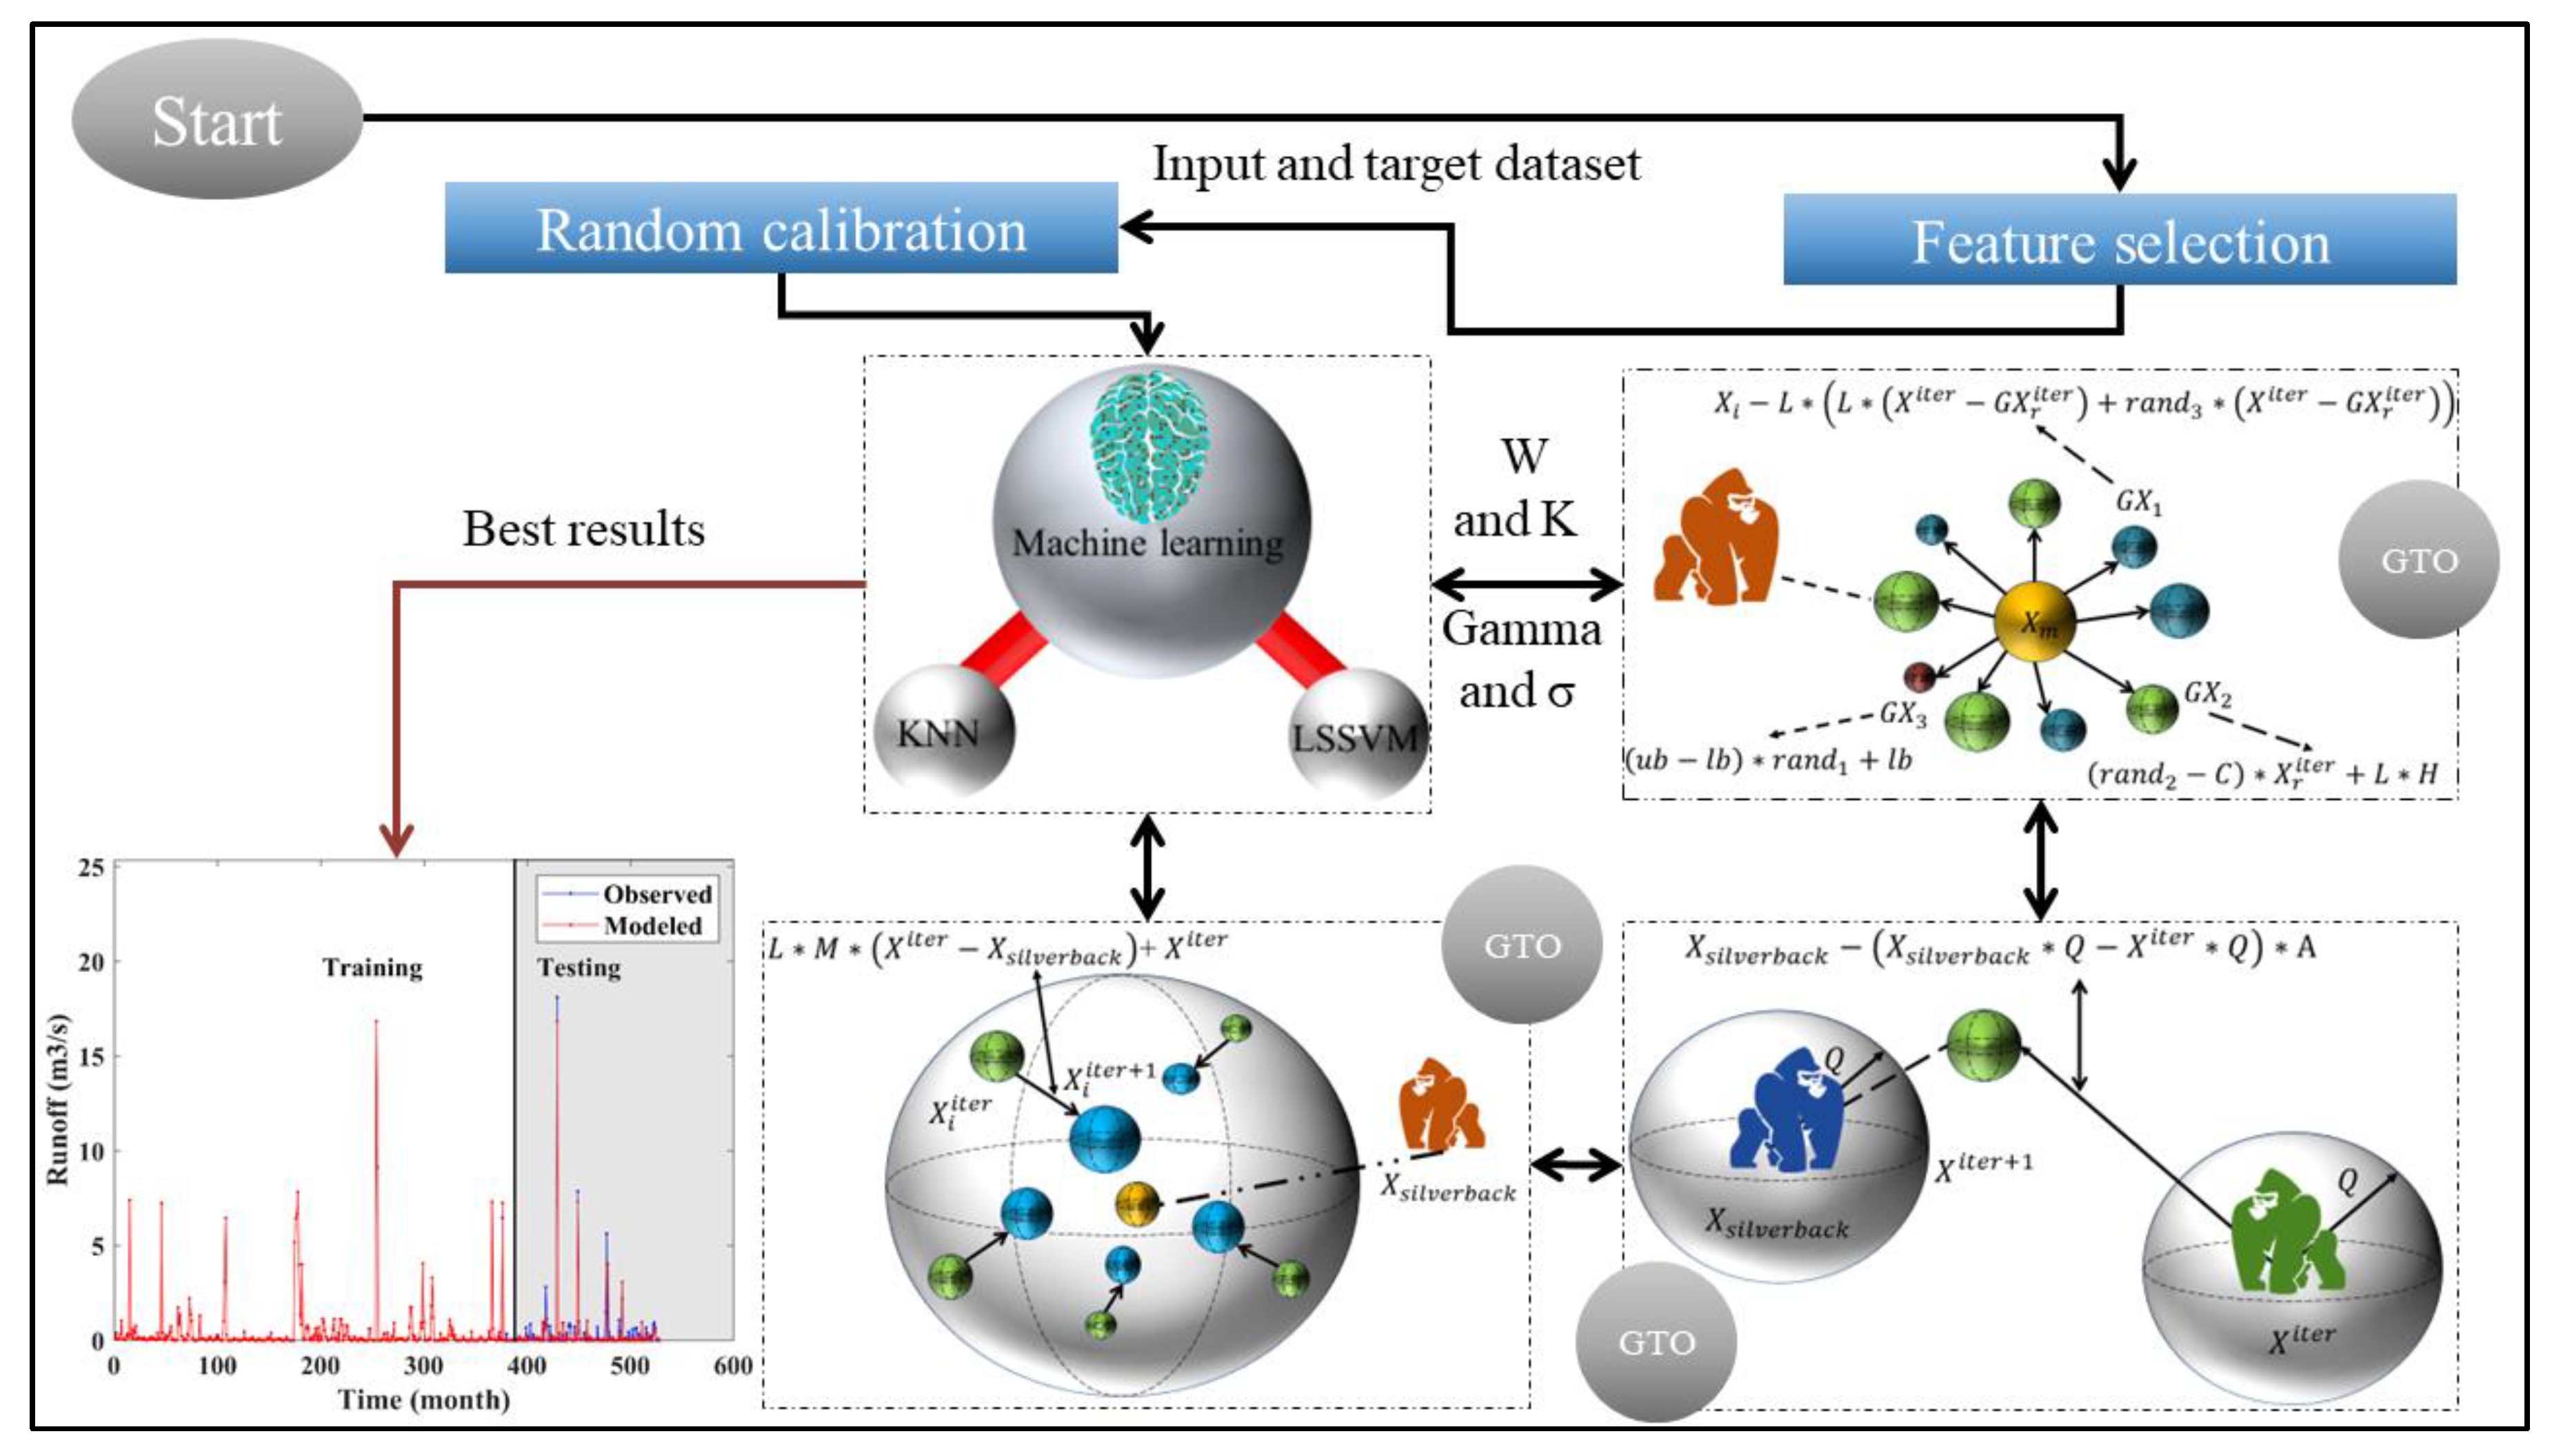
After feature selection, the size of the selected feature can be considerable; therefore, the PCA is used for dimension reduction. Then, the prepared dataset is used to apply the KNN–GTO and LSSVM–GTO models to simulate the rainfall–runoff phenomenon. Finally, the best of the results are selected according to different evaluation criteria. Furthermore, the results of the presented framework are compared with those of other machine learning algorithms, including MLR, KNN, ANN, M5, MARS, LSSVM, and RF, to validate the performance of the introduced framework. Figure 5 shows the scheme of the employed framework.

5. Results and Discussion

This study defines five scenarios for rainfall–runoff modeling (Table 2). In the first scenario, rainfall in six sections (Tmin, Tmean, Tmax, Rh_mean, and SW) is considered an input. The second scenario resembles the first scenario, with the difference that a 0 to 24-month lag time is imposed on input data and the R threshold is equal to 0.05. The third to fifth scenarios are the same as the second scenario in input data; however, the main difference is the application of IMF and the R threshold value of 0.1. The MaxNumIMF in the third to fifth scenarios equals 3, 4, and 5, respectively. Since the size of the input dataset in the third to fifth scenarios is large, the PCA is employed for dimension reduction.
The best parameters of the investigated algorithms are listed in Table 3. The grid search method estimates the parameters of ANN, LSSVM, M5, MARS, and RF. It is worth mentioning that MNLR does not have any parameters for implementation. The essential parameters of ANN are the number of neurons in the first and second layers. LSSVM and LSSVM–GTO can be implemented by defining gamma and sigma. The main essential parameters of M5 are min leaf size (minLSize) and split threshold (sThreshold), while MARS is developed by determining the maximum base function and model parameter (C). RF resembles the M5 tree, but it has another parameter called the number of trees (Num Tree). KNN and KNN–GTO are executed by selecting the K number of neighbors (K), but KNN–GTO has another main parameter, namely the weight of inputs (W).
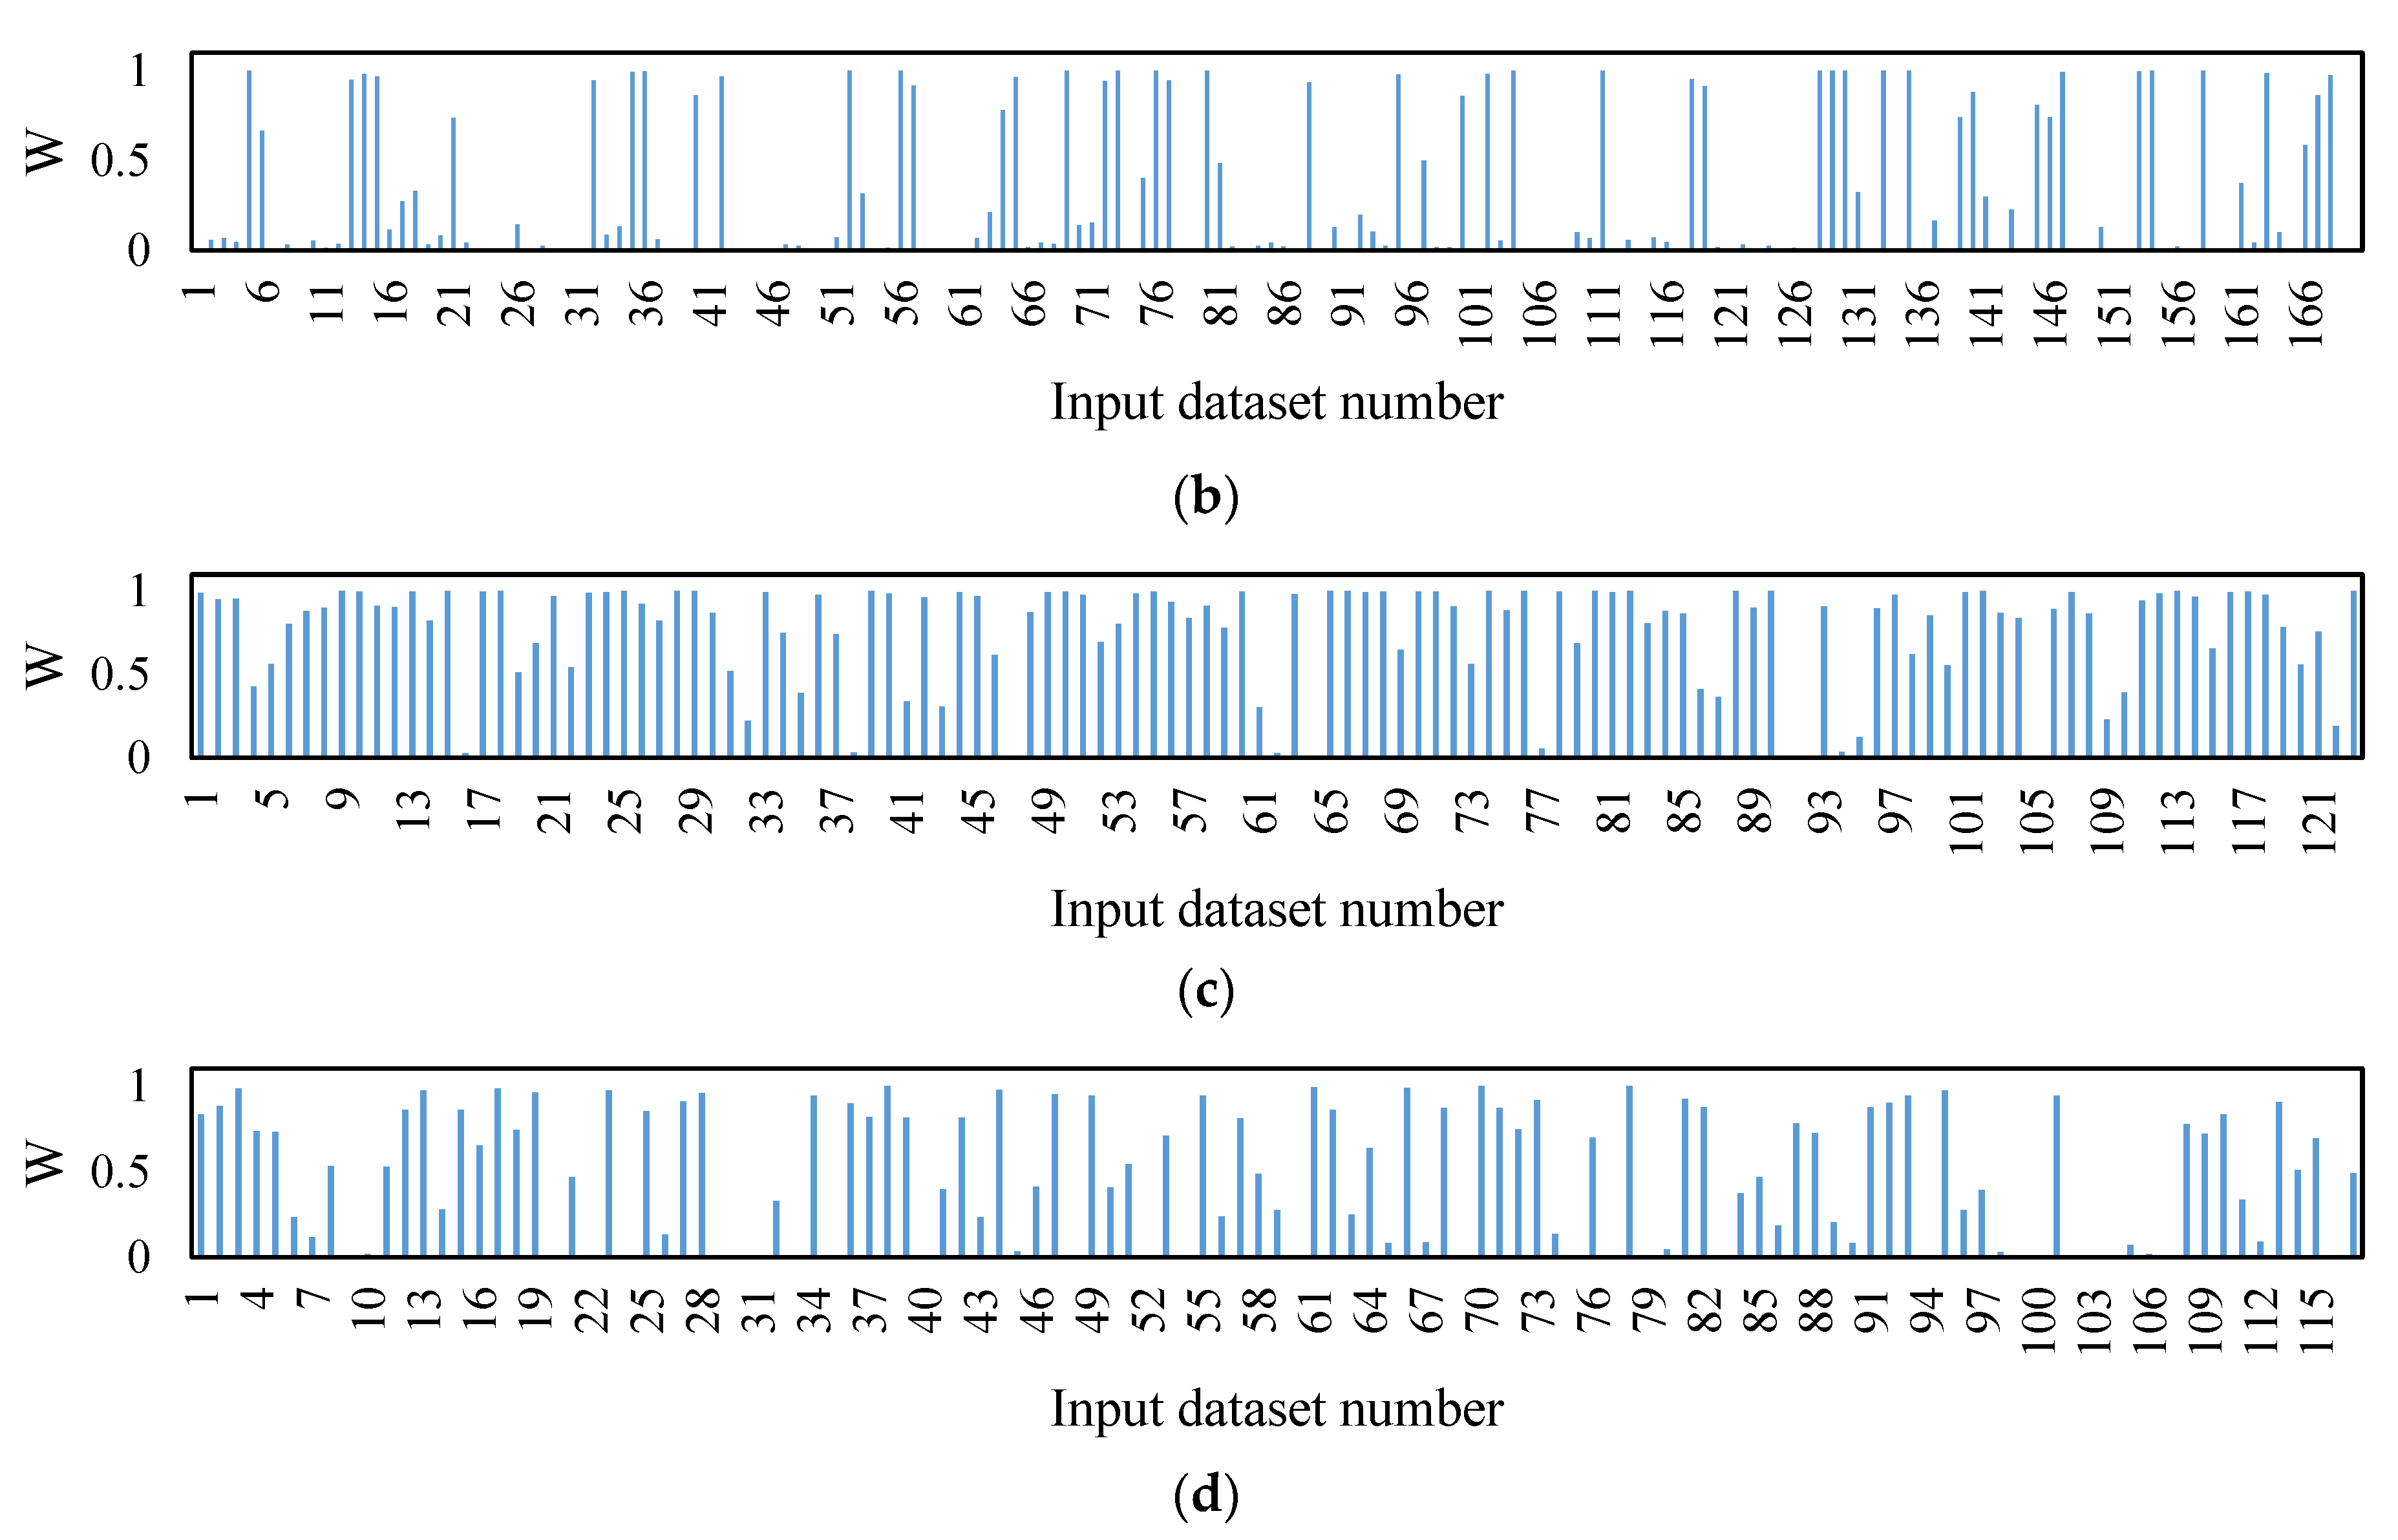
Figure 6 shows the weight of inputs (W) obtained by KNN–GTO. As seen, the importance of inputs is between 0 and 1, according to the base assumptions of KNN. The W in each scenario is different from that in another scenario, owing to the various amounts of input data in each scenario. Furthermore, the number of inputs in the first scenario is less than that in other scenarios. Therefore, it is expected that the accuracy of modeling rainfall–runoff will be lower in this scenario compared to other scenarios. Also, in the third, fourth, and fifth scenarios, the values of W are higher than in other scenarios, showing a greater correlation between these data and runoff data. The greater W value in the mentioned scenarios can lead to the high precision of KNN and KNN–GTO.
Table 4 compares the accuracy of machine learning algorithms for rainfall–runoff modeling for the training period. According to this table, all algorithms have weak performance in the first scenario. This issue indicates the importance of selecting appropriate inputs and dataset processing. However, in other scenarios, other algorithms, such as ANN, LSSVM, KNN, LSSVM–GTO, and KNN–GTO, are trained with comparable accuracy. The best performance is associated with ANN in the third scenario and KNN–GTO in the fourth and fifth scenarios. For ANN, the MAE, RMSE, and RRMSE are equal to 0.000, while R, NSE, and KGE are equal to 1.0000. In addition, the metrics for KNN–GTO are specified to be 0.0001, 0.0016, 0.0011, 1.0000, 1.0000, and 0.9998, respectively.
Table 5 compares the results of rainfall–runoff modeling by machine learning during the testing period. As seen in the first and second scenarios, machine learning algorithms produce low accuracy owing to poor training practices. Moreover, in the third scenario, the testing results are not as good as the training outcomes for ANN because of the overfitting problem of this algorithm. In contrast, KNN and KNN–GTO in the third, fourth, and fifth scenarios perform significantly better than the other algorithms. It can be noted that the best algorithm is KNN–GTO in the fourth scenario. The MAE, RMSE, RRMSE, R, NSE, and KGE for KNN–GTO are equal to 0.1640, 0.4741, 0.2978, 0.9607, 0.9108, and 0.7141, respectively. At the same time, MNLR in the first scenario is the worst algorithm, with MAE, RMSE, RRMSE, R, NSE, and KGE equal to 0.8219, 2.2490, 0.9840, 0.2186, 0.0257, and −0.2600, respectively. On the contrary, KNN–GTO minimizes MAE, RMSE, and RRMSE by 80%, 79%, and 72% and maximizes R, NSE, and KGE by 77%, 112%, and 136% compared to the other algorithms. Moreover, Friedman test results show that KNN–GTO in the fourth, fifth, and third scenarios and KNN in the fourth and third scenarios are placed in the first to fifth ranking. However, MNLR and LSSVM in the first scenario have the worst ranking. Hence, in the following paragraphs, the accuracy of KNN and KNN–GTO is investigated.
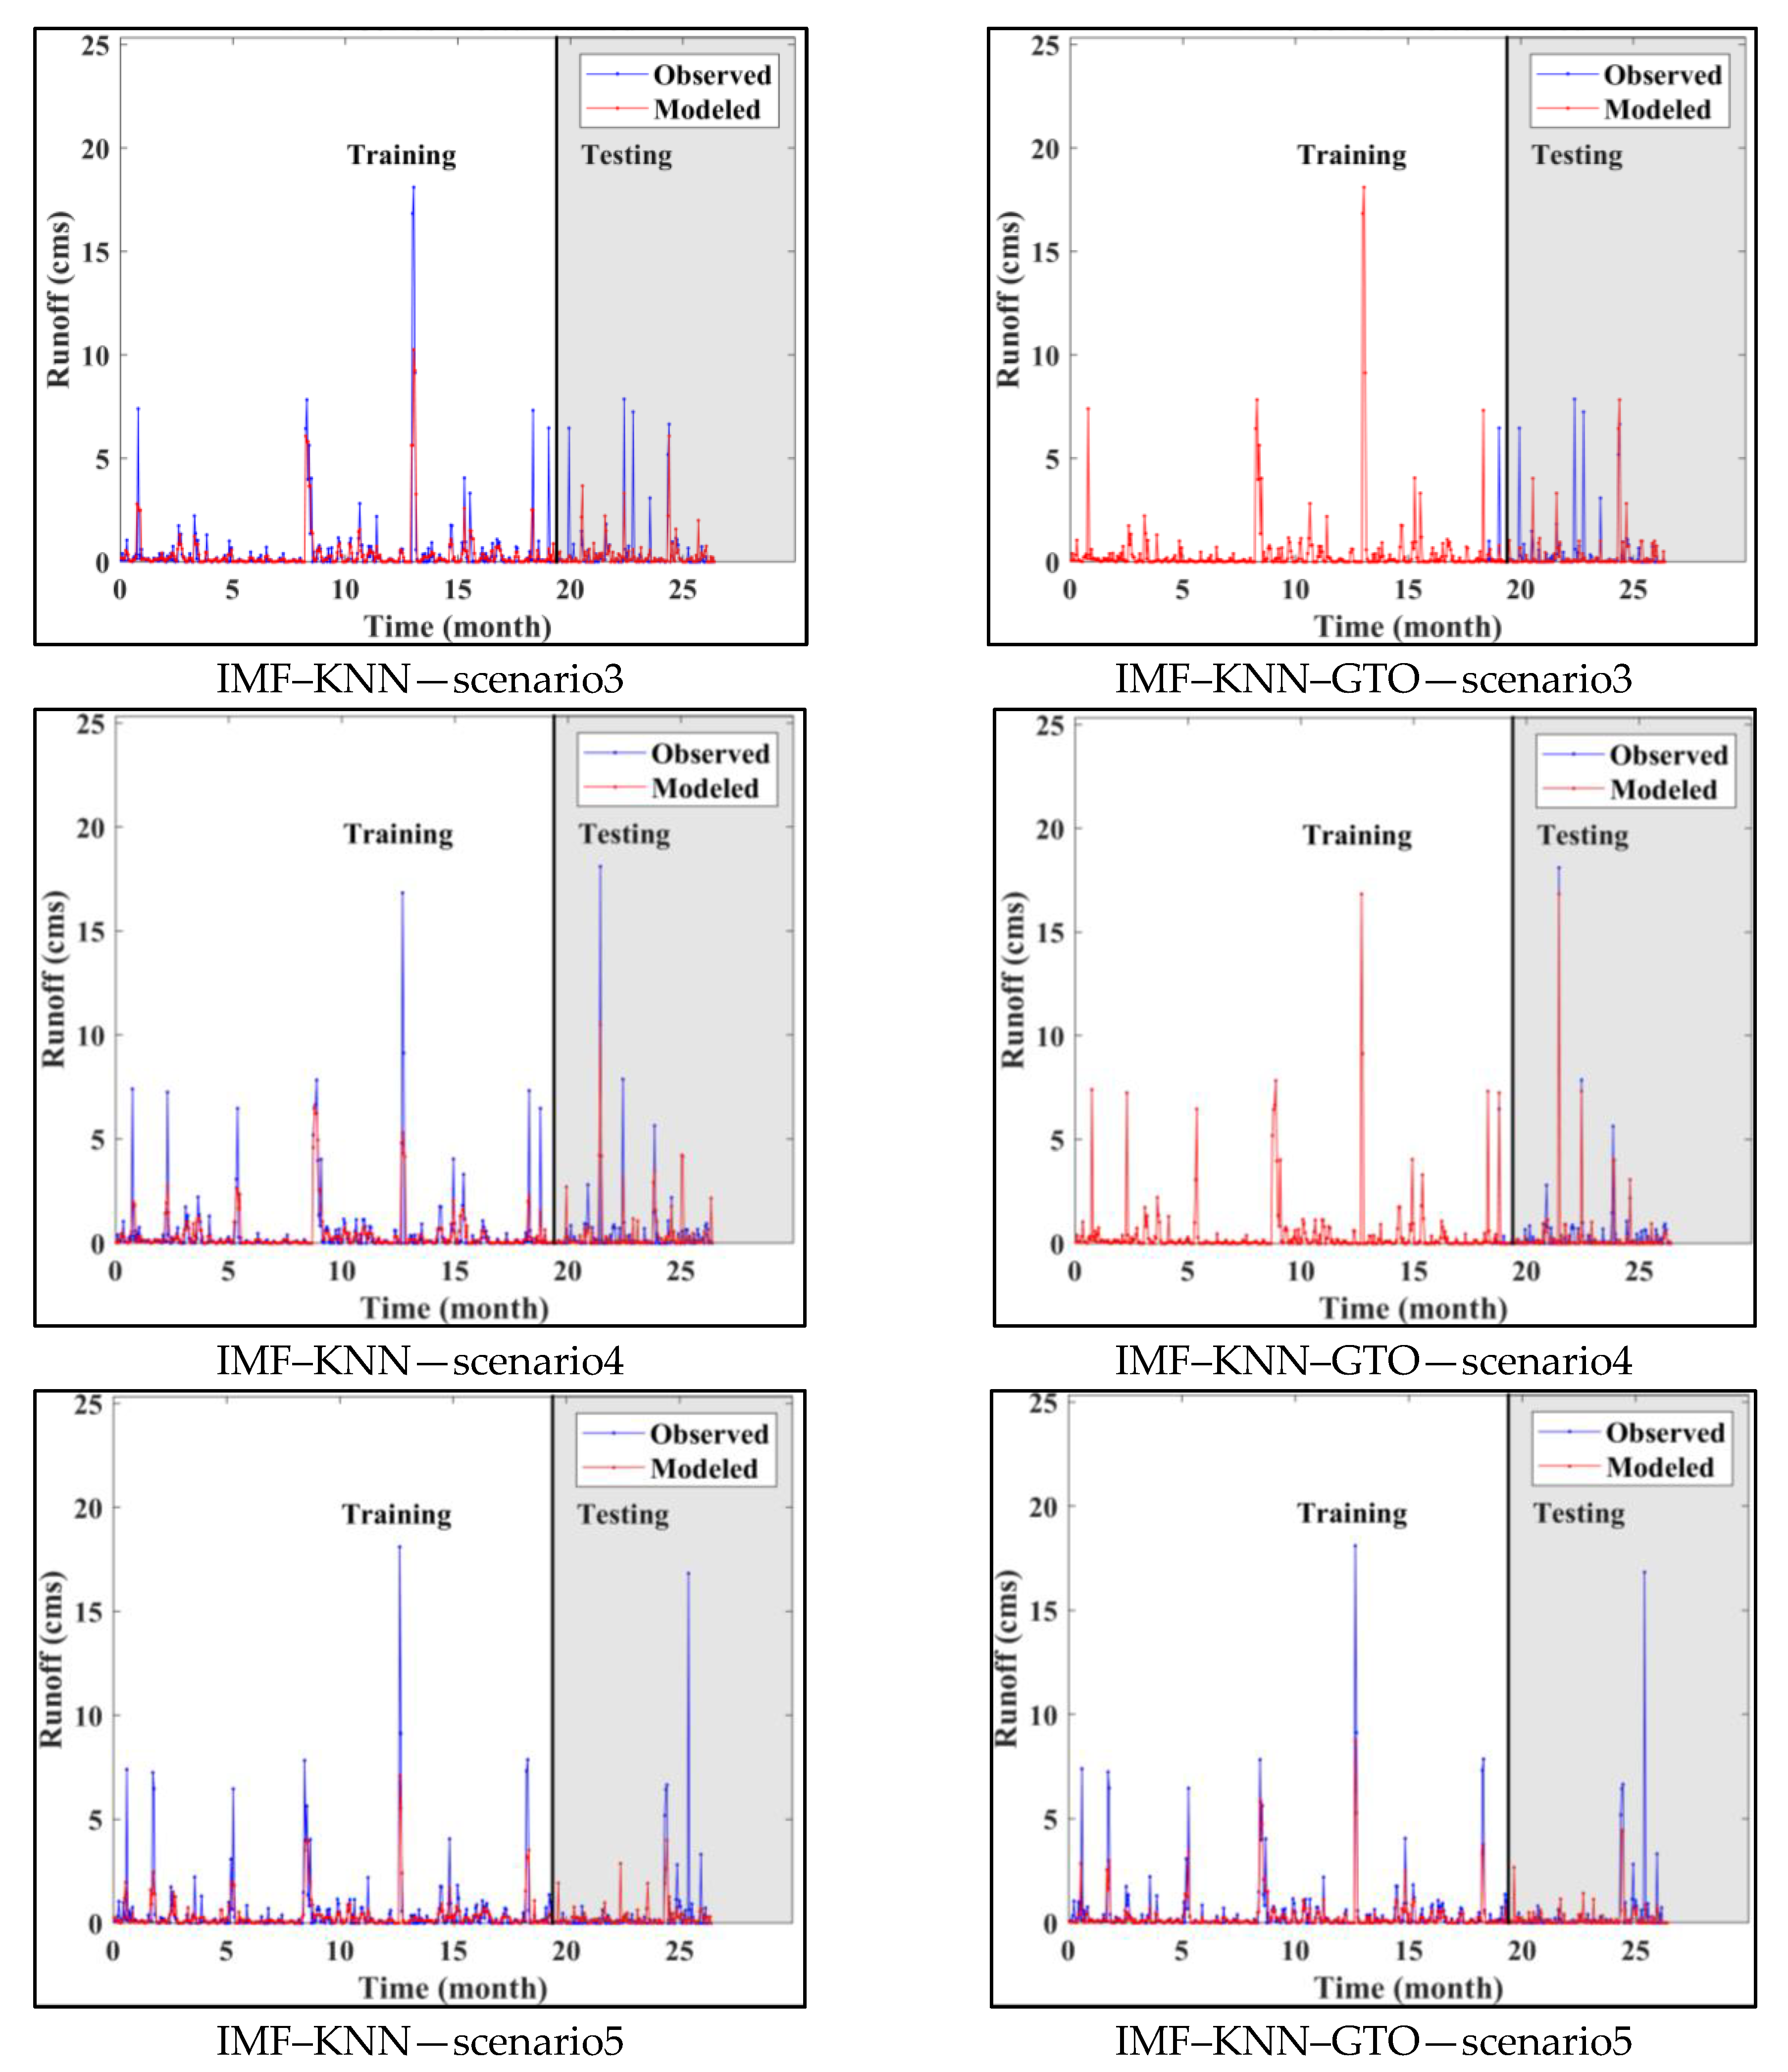
The time series of rainfall–runoff modeling by KNN and KNN–GTO in the third, fourth, and fifth scenarios are compared in Figure 7. In the third and fifth scenarios, KNN and KNN–GTO have weaknesses in estimating peak runoff data. However, in the fourth scenario, KNN performs reasonably, and KNN–GTO is significantly better than the others. Additionally, KNN–GTO has higher accuracy than KNN, proving the capability of GTO to optimize and improve the precision of KNN.
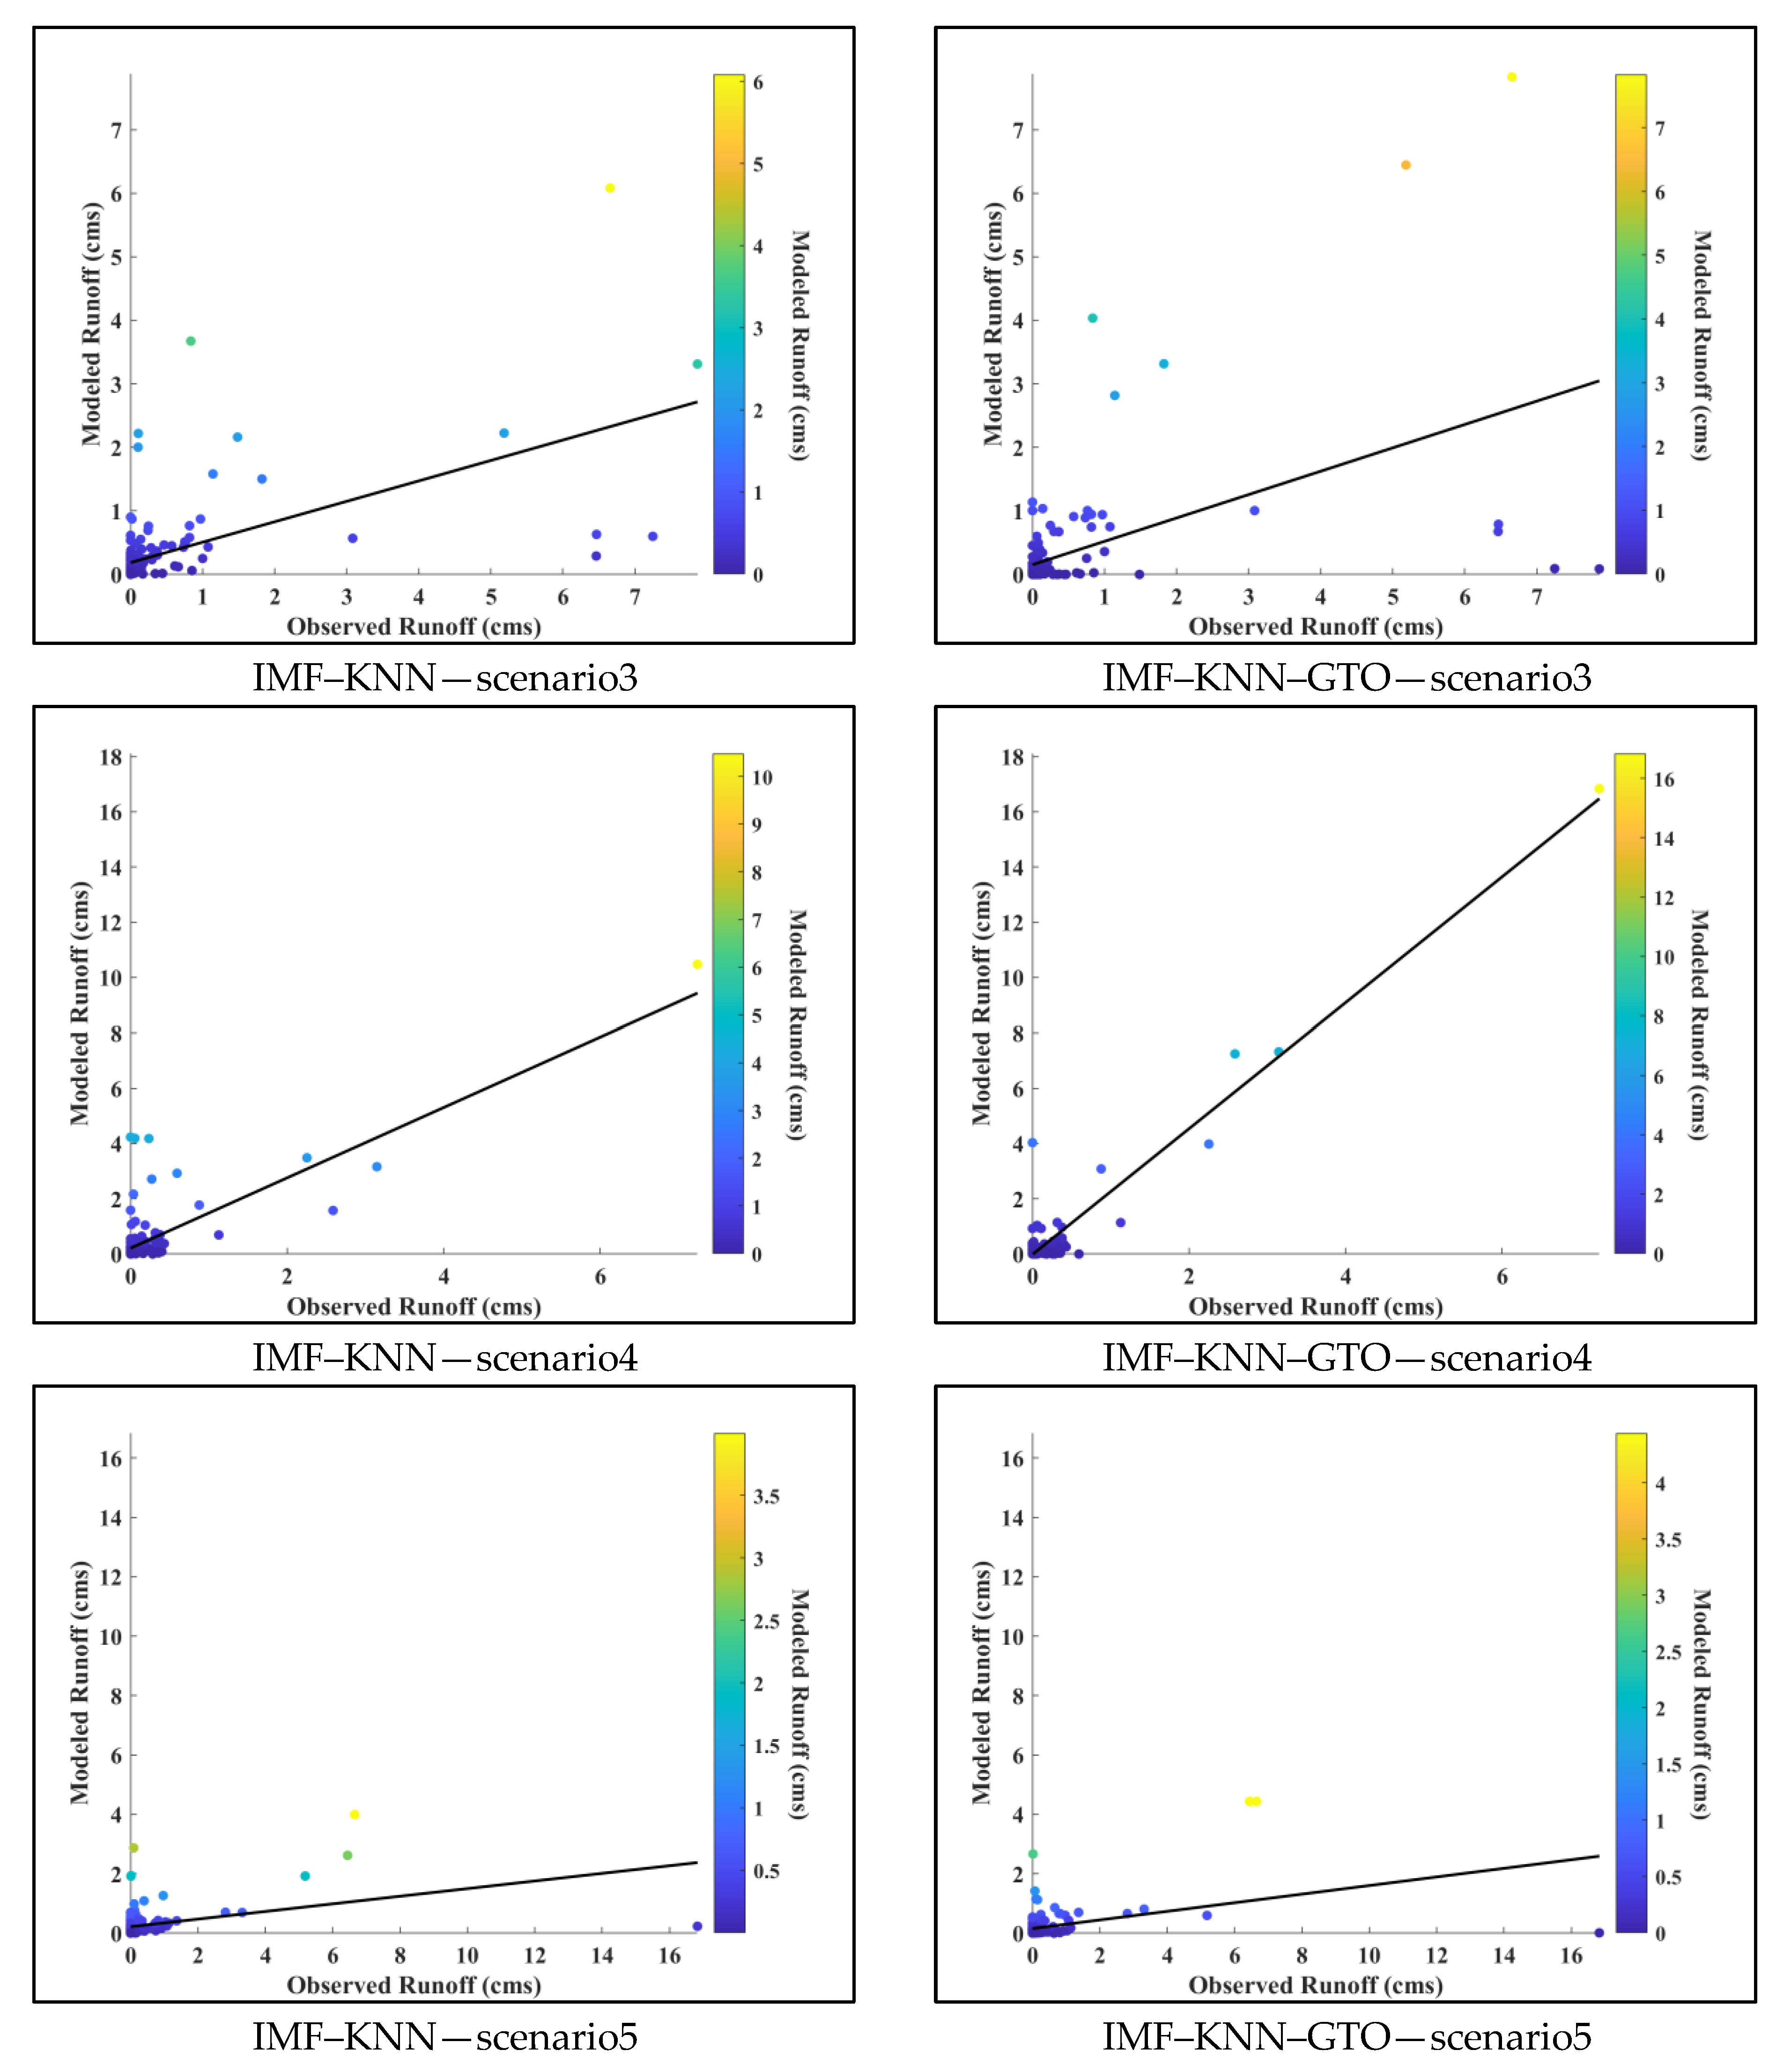
Figure 8 and Figure 9 show the scatter plot representing the observed and modeled runoff with the line of a perfect fit at 45° during the training and testing periods. The results closer to the 45° line indicate more accurate machine learning algorithms.
KNN and KNN–GTO in the third, fourth, and fifth scenarios have closed results to the perfect fit line. In the testing period, KNN and KNN–GTO underestimated the runoff. At the same time, the predicted outcomes by KNN–GTO in scenario 4 were close to the perfect line.
Model bias refers to the presence of systematic errors in a model that can cause it to consistently make incorrect predictions. Therefore, in this study, a PBias criterion is employed to analyze the bias of modeling in the best scenario, which means the fourth scenario. The estimated values for PBias are listed in Table 6. According to the results of this table, in the training period, M5, MARS, MNLR, and KNN_GTO had lower PBias. KNN and ANN have underestimated results. In contrast, LSSVM and LSSVM–GTO have overestimated results. During the testing period, the bias of all investigated algorithms increased. This is for using new data during the testing period. In this period, the less PBias is related to the MARS, and the maximum value of PBias is related to the RF. Considering all periods, MARS has fewer PBias, and LSSVM–GTO has more PBias. Moreover, KNN_GTO has reasonable PBias compared to other investigated algorithms. According to the study conducted by [33], the performance of the model for the PBias less than 10, between 10 and 15, and between 15 and 25 is very good, good, and fair, respectively. Hence, in terms of bias, according to all periods, it is very good.
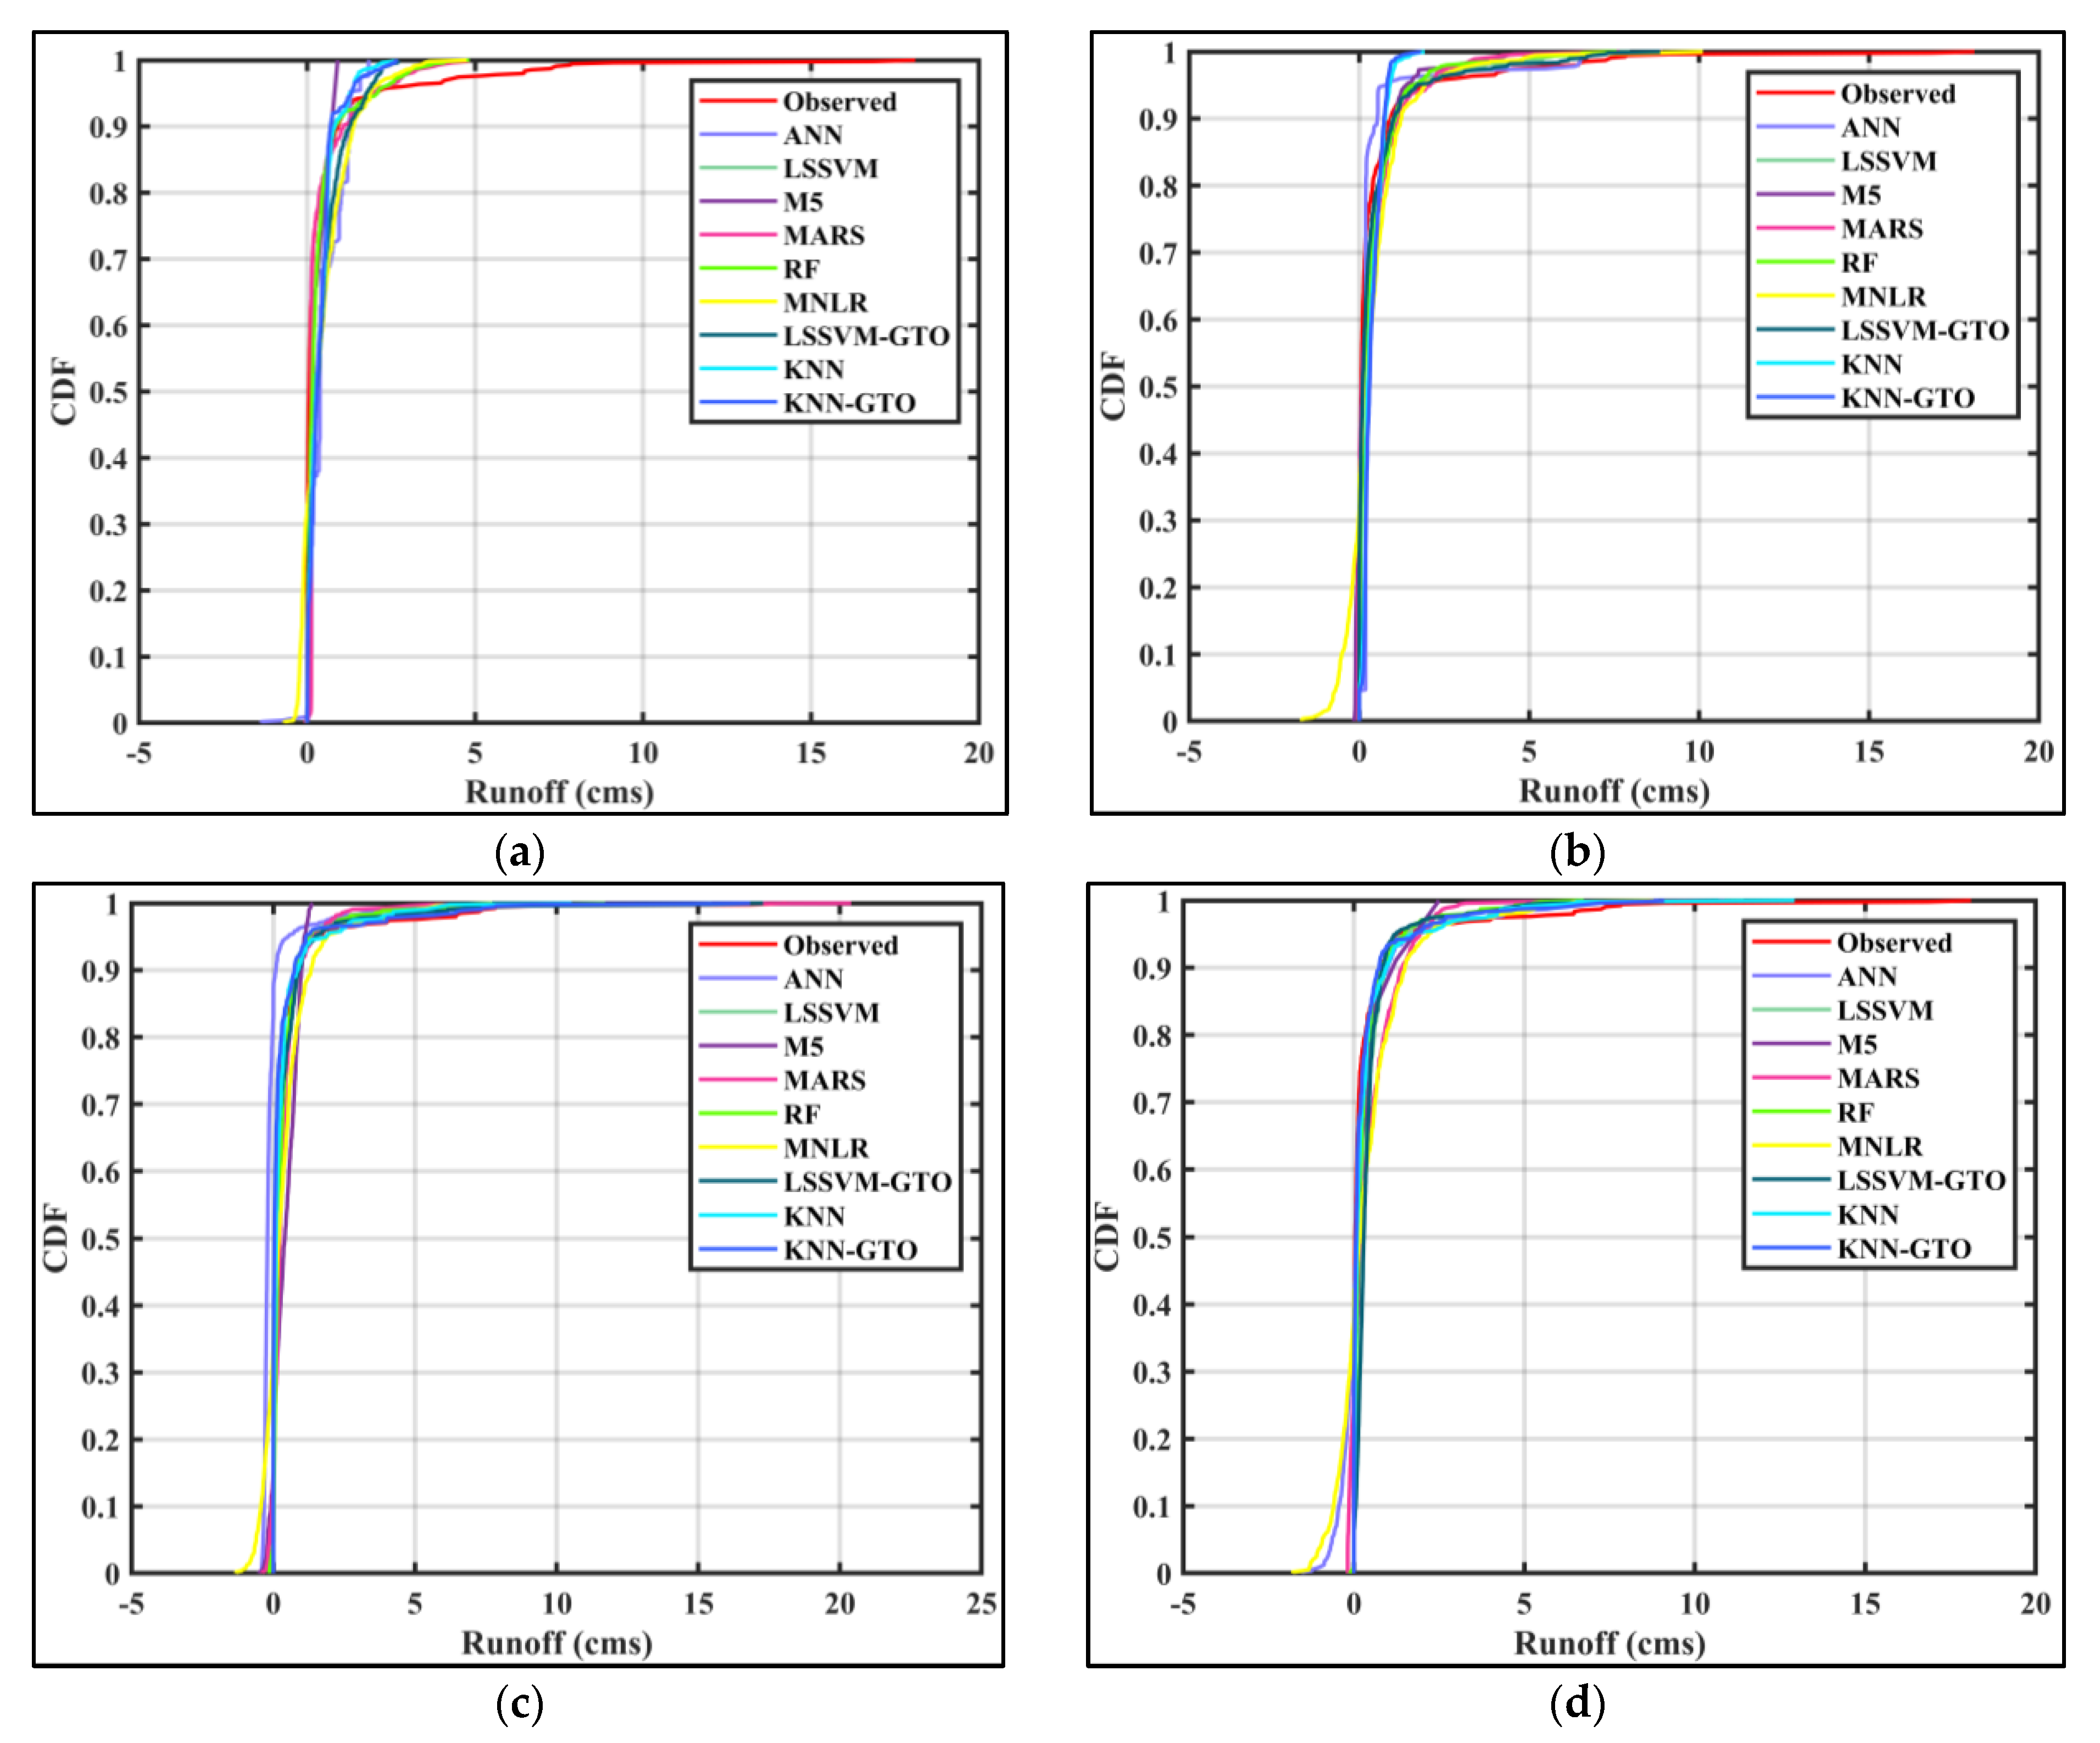
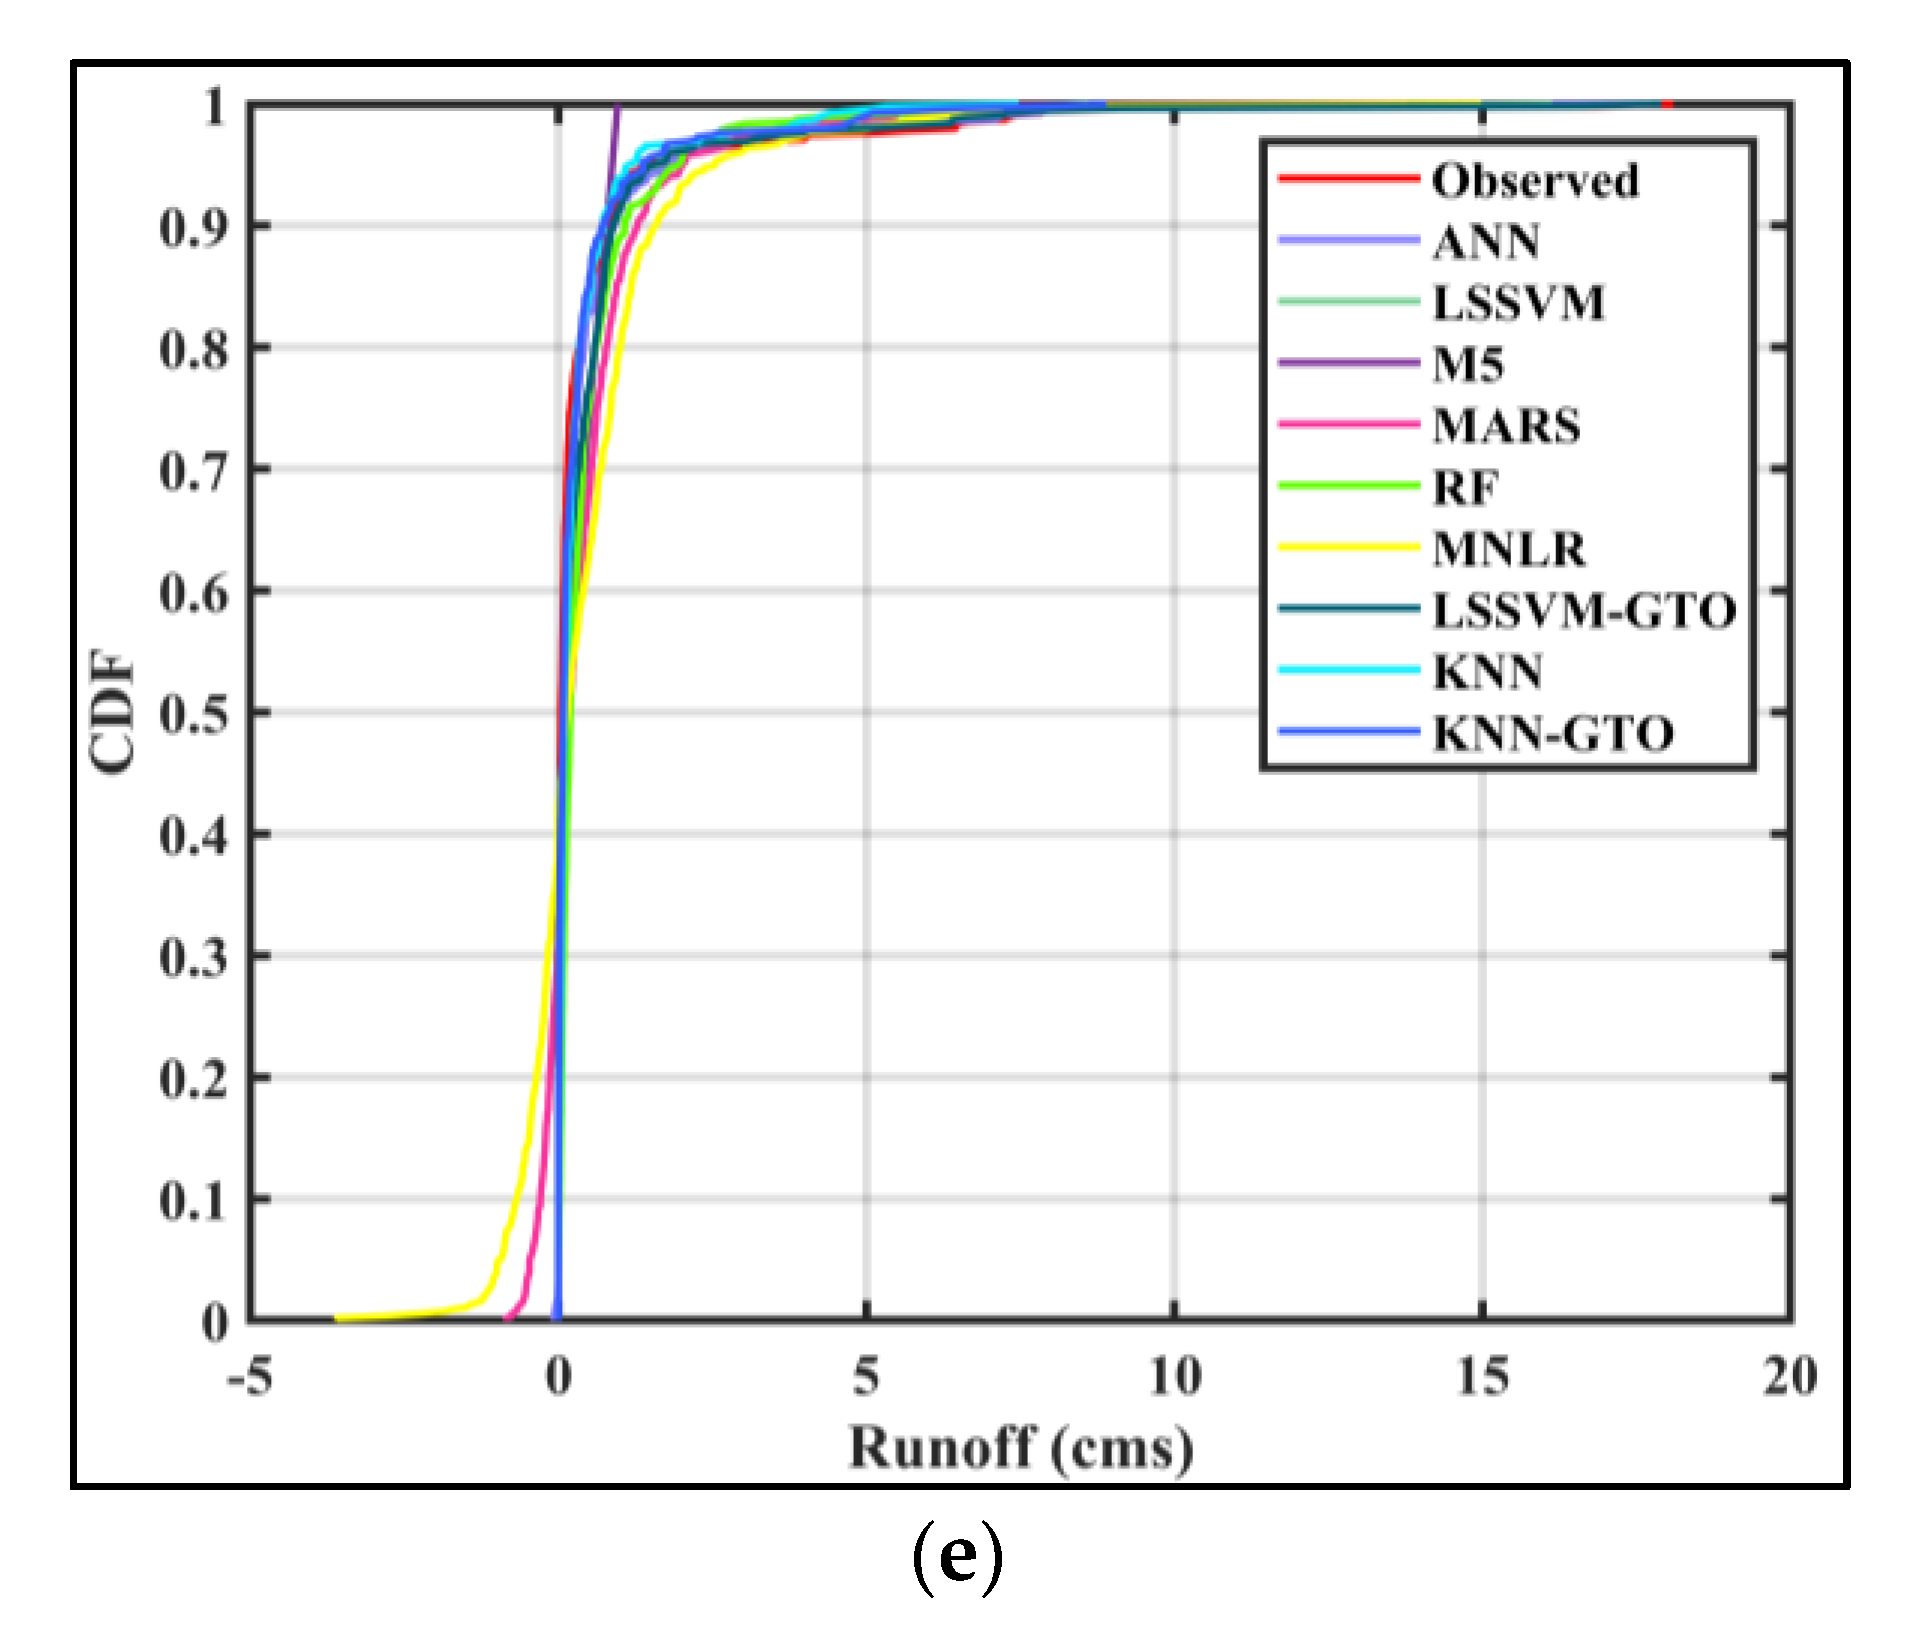
Figure 10 shows the cumulative distribution function (CDF) for observed and modeled runoff under different scenarios. In this figure, the smaller the difference between observed and modeled CDF, the greater the accuracy. As seen, the maximum runoff modeling accuracy is related to the scenario3. In addition, in the mentioned scenario, the higher the accuracy is for KNN–GTO.
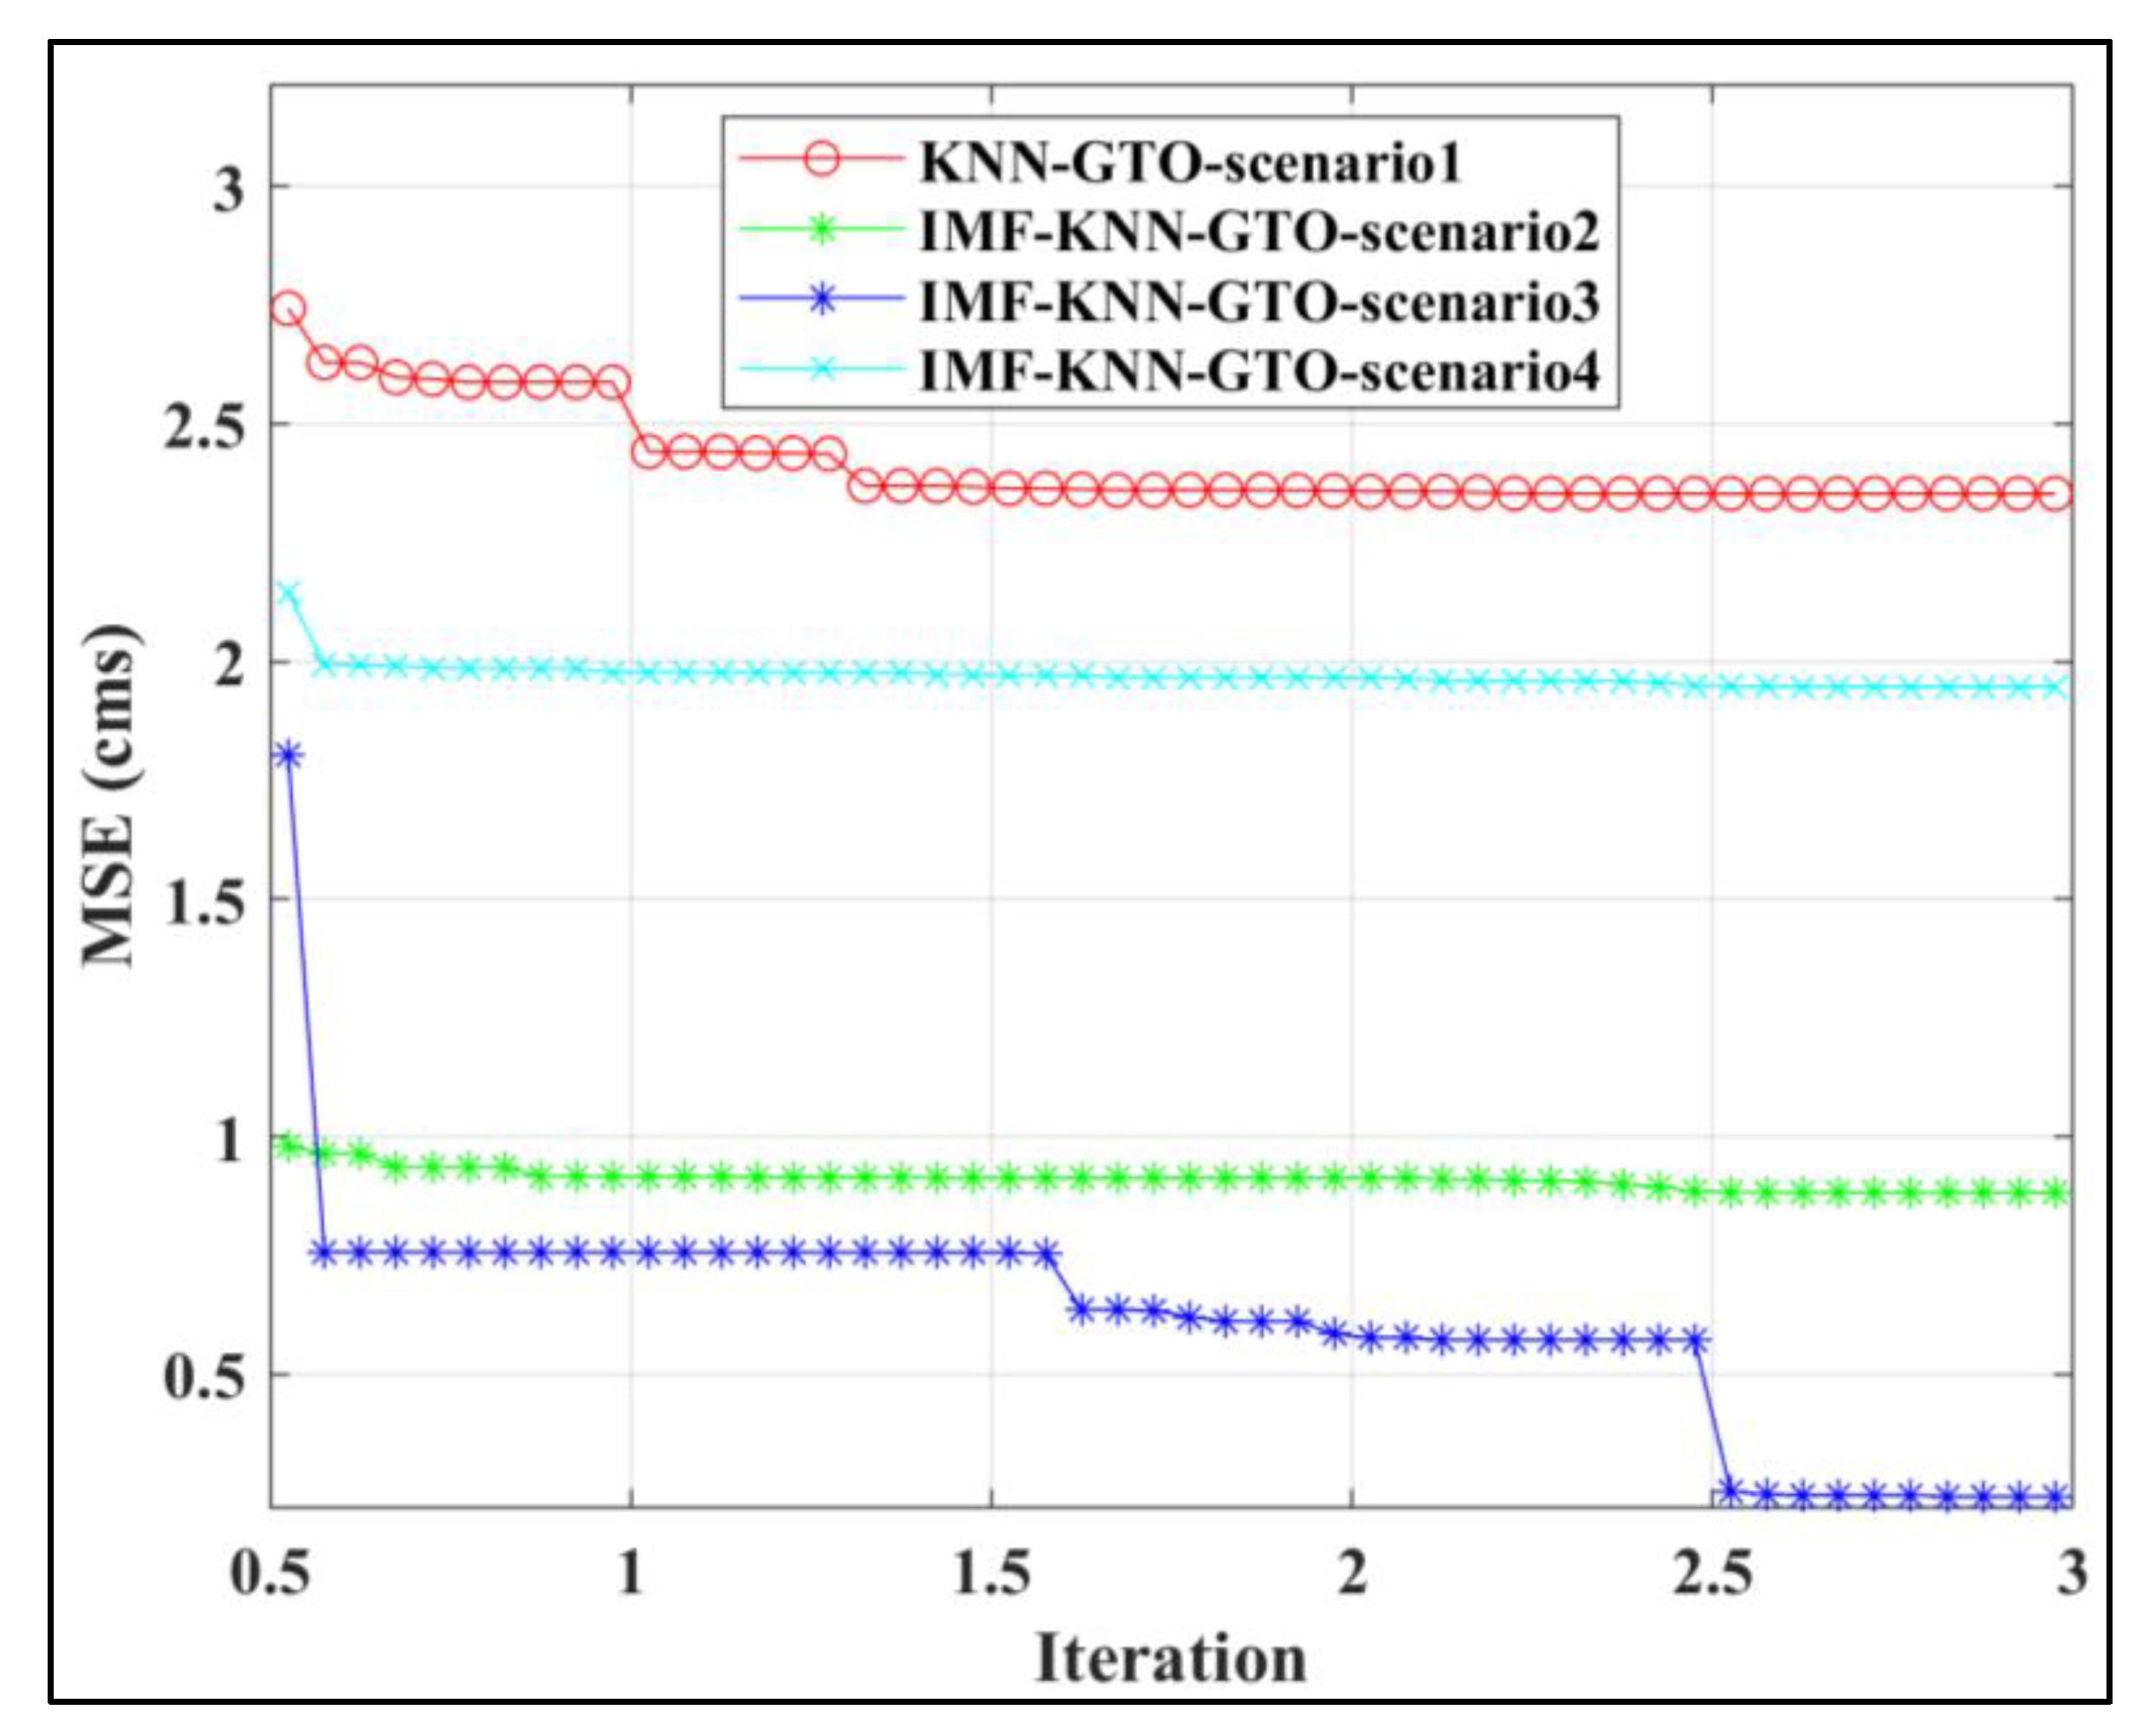
The convergence of GTO in optimizing KNN in the first to fourth scenarios is illustrated in Figure 11. In the fourth scenario, the minimum value of MSE is less than that in the other scenarios. The convergence speed in the fourth scenario is higher than that in the other scenarios. Therefore, using IMF improves the accuracy of rainfall–runoff modeling, and the optimal value of MaxNumIMF is equal to 4. The significant impact of using pre-processing and post-processing dataset methods and the use of time-lagged data show the effectiveness of input selection in modeling accuracy, which is accepted by the results of the third, fourth, and fifth scenarios in Table 4 and Table 5. The role of dataset pre-processing and post-processing methods has been confirmed in other studies [34,35,36].
Nevertheless, even in these scenarios, algorithms like LSSVM, M5, MARS, RF, and MNLR do not perform well, and ANN and LSSVM–GTO algorithms have moderate performance. The better accuracy of KNN and KNN–GTO algorithms is due to the kernel function, considering K nearest neighbor inputs. Also, the higher accuracy of KNN–GTO compared to KNN indicates the success of the GTO in finding the optimal parameters of the KNN algorithm.

6. Conclusions

In the present study, a new methodology was introduced for rainfall–runoff modeling. This methodology comprised dataset decomposition, feature selection, dataset reduction, and modeling by nine standalone and hybrid machine learning algorithms. The employed machine learning algorithms included neural network-based algorithms (ANNs), kernel-based algorithms (LSSVM and KNN), tree-based algorithms (M5 and RF), regression-based algorithms (MARS and MNLR), and hybrid algorithms (LSSVM–GTO and KNN–GTO). The reason for using this wide range of methods was the complex and nonlinear nature of runoff precipitation in Wadi Ouahrane, Algeria. Five scenarios were defined for selecting the input data. Results indicated that using EMD, feature selection, and PCA significantly improved the accuracy of rainfall–runoff modeling. KNN–GTO exhibited the best performance as it was associated with MAE, RMSE, RRMSE, R, NSE, and KGE of 0.1640, 0.4741, 0.2978, 0.9607, 0.9108, and 0.7141, respectively. It minimized MAE, RMSE, and RRMSE by 80%, 79%, and 72% and maximized R, NSE, and KGE by 77%, 112%, and 136% compared to the other algorithms. The worst algorithm was LSSVM without pre-processing data. A combination of data-processing methods and KNN–GTO performed accurately in estimating peak data. Comparing different scenarios showed that the machine learning algorithm had better performance when the maximum number of IMFs was equal to 4. Moreover, inputs with a correlation of greater than 0.1 were selected for rainfall–runoff modeling. In general, if high-quality data are available, there is no limitation to using the presented method (i.e., a combination of EMD, feature selection, PCA, and KNN–GTO) for predicting runoff and other hydrological parameters in other basins.

Author Contributions

M.V.A.: conceptualization, investigation, writing—original draft preparation, and writing—review and editing. I.E. and M.A.: supervision, conceptualization, investigation, writing—original draft preparation, and writing—review and editing. N.A.-A. and S.F.: conceptualization, investigation, writing—original draft preparation, and writing—review and editing. N.A.-A. and N.E.: supervision, conceptualization, investigation, and writing—review and editing. All authors have read and agreed to the published version of the manuscript.

Funding

The authors declare that no funds, grants, or other support were received during the preparation of this manuscript.

Data Availability Statement

The datasets generated during and analyzed during the current study are available from the corresponding author upon reasonable request.

Acknowledgments

The authors are thankful to the Deanship of Scientific Research at Najran University for funding this work under the Research Groups Funding program grant code (NU/RG/SERC/12/21). We thank the ANRH agency for the collected data and the General Directorate of Scientific Research and Technological Development of Algeria (DGRSDT).

Conflicts of Interest

The authors declare that they have no known competing financial interests or personal relationships that could have appeared to influence the work reported in this paper.

References

  1. Khan, M.T.; Shoaib, M.; Hammad, M.; Salahudin, H.; Ahmad, F.; Ahmad, S. Application of Machine Learning Techniques in Rainfall–Runoff Modelling of the Soan River Basin, Pakistan. Water 2021, 13, 3528. [Google Scholar] [CrossRef]
  2. Bhusal, A.; Parajuli, U.; Regmi, S.; Kalra, A. Application of Machine Learning and Process-Based Models for Rainfall-Runoff Simulation in Dupage River Basin, Illinois. Hydrology 2022, 9, 117. [Google Scholar] [CrossRef]
  3. Clark, M.P.; Kavetski, D.; Fenicia, F. Pursuing the Method of Multiple Working Hypotheses for Hydrological Modeling. Water Resour. Res. 2011, 47, W09301. [Google Scholar] [CrossRef]
  4. Niu, W.; Feng, Z.; Zeng, M.; Feng, B.; Min, Y.; Cheng, C.; Zhou, J. Forecasting Reservoir Monthly Runoff via Ensemble Empirical Mode Decomposition and Extreme Learning Machine Optimized by an Improved Gravitational Search Algorithm. Appl. Soft Comput. 2019, 82, 105589. [Google Scholar] [CrossRef]
  5. Li, H.; Zhang, Y.; Zhou, X. Predicting Surface Runoff from Catchment to Large Region. Adv. Meteorol. 2015, 2015, 1–13. [Google Scholar] [CrossRef]
  6. Song, X.; Kong, F.; Zhan, C.; Han, J. Hybrid Optimization Rainfall-Runoff Simulation Based on Xinanjiang Model and Artificial Neural Network. J. Hydrol. Eng. 2012, 17, 1033–1041. [Google Scholar] [CrossRef]
  7. Vafakhah, M.; Janizadeh, S. Application of Artificial Neural Network and Adaptive Neuro-Fuzzy Inference System in Streamflow Forecasting. In Advances in Streamflow Forecasting; Elsevier: Amsterdam, The Netherlands, 2021; pp. 171–191. [Google Scholar]
  8. Liu, Z.; Todini, E. Towards a Comprehensive Physically-Based Rainfall-Runoff Model. Hydrol. Earth Syst. Sci. 2002, 6, 859–881. [Google Scholar] [CrossRef]
  9. Xu, C.-Y.; Xiong, L.; Singh, V.P. Black-Box Hydrological Models. In Handbook of Hydrometeorological Ensemble Forecasting; Springer: Berlin/Heidelberg, Germany, 2017; pp. 1–48. [Google Scholar]
  10. Seo, Y.; Kim, S.; Singh, V.P. Machine Learning Models Coupled with Variational Mode Decomposition: A New Approach for Modeling Daily Rainfall-Runoff. Atmosphere 2018, 9, 251. [Google Scholar] [CrossRef]
  11. Mohammadi, B. A Review on the Applications of Machine Learning for Runoff Modeling. Sustain. Water Resour. Manag. 2021, 7, 98. [Google Scholar]
  12. Nourani, V.; Gökçekuş, H.; Gichamo, T. Ensemble Data-Driven Rainfall-Runoff Modeling Using Multi-Source Satellite and Gauge Rainfall Data Input Fusion. Earth Sci. Inform. 2021, 14, 1787–1808. [Google Scholar] [CrossRef]
  13. Sharafati, A.; Khazaei, M.R.; Nashwan, M.S.; Al-Ansari, N.; Yaseen, Z.M.; Shahid, S. Assessing the Uncertainty Associated with Flood Features Due to Variability of Rainfall and Hydrological Parameters. Adv. Civ. Eng. 2020, 2020, 1–9. [Google Scholar] [CrossRef]
  14. Mohammadi, B.; Guan, Y.; Moazenzadeh, R.; Safari, M.J.S. Implementation of Hybrid Particle Swarm Optimization-Differential Evolution Algorithms Coupled with Multi-Layer Perceptron for Suspended Sediment Load Estimation. CATENA 2021, 198, 105024. [Google Scholar] [CrossRef]
  15. Tikhamarine, Y.; Souag-Gamane, D.; Ahmed, A.N.; Sammen, S.S.; Kisi, O.; Huang, Y.F.; El-Shafie, A. Rainfall-Runoff Modelling Using Improved Machine Learning Methods: Harris Hawks Optimizer vs. Particle Swarm Optimization. J. Hydrol. 2020, 589, 125133. [Google Scholar] [CrossRef]
  16. Adnan, R.M.; Petroselli, A.; Heddam, S.; Santos, C.A.G.; Kisi, O. Short Term Rainfall-Runoff Modelling Using Several Machine Learning Methods and a Conceptual Event-Based Model. Stoch. Environ. Res. Risk Assess. 2021, 35, 597–616. [Google Scholar] [CrossRef]
  17. Okkan, U.; Ersoy, Z.B.; Kumanlioglu, A.A.; Fistikoglu, O. Embedding Machine Learning Techniques into a Conceptual Model to Improve Monthly Runoff Simulation: A Nested Hybrid Rainfall-Runoff Modeling. J. Hydrol. 2021, 598, 126433. [Google Scholar] [CrossRef]
  18. Roy, B.; Singh, M.P.; Kaloop, M.R.; Kumar, D.; Hu, J.-W.; Kumar, R.; Hwang, W.-S. Data-Driven Approach for Rainfall-Runoff Modelling Using Equilibrium Optimizer Coupled Extreme Learning Machine and Deep Neural Network. Appl. Sci. 2021, 11, 6238. [Google Scholar] [CrossRef]
  19. Waqas, M.; Saifullah, M.; Hashim, S.; Khan, M.; Muhammad, S. Evaluating the Performance of Different Artificial Intelligence Techniques for Forecasting: Rainfall and Runoff Prospective. In Weather Forecast; IntechOpen: London, UK, 2021; p. 23. [Google Scholar]
  20. Xiao, L.; Zhong, M.; Zha, D. Runoff Forecasting Using Machine-Learning Methods: Case Study in the Middle Reaches of Xijiang River. Front. Big Data 2022, 4, 752406. [Google Scholar] [CrossRef]
  21. Singh, A.K.; Kumar, P.; Ali, R.; Al-Ansari, N.; Vishwakarma, D.K.; Kushwaha, K.S.; Panda, K.C.; Sagar, A.; Mirzania, E.; Elbeltagi, A. Application of Machine Learning Technique for Rainfall-Runoff Modelling of Highly Dynamic Watersheds. arXiv 2022. [Google Scholar] [CrossRef]
  22. Yang, M.-C.; Wang, J.-Z.; Sun, T.-Y. EMD-Based Preprocessing with a Fuzzy Inference System and a Fuzzy Neural Network to Identify Kiln Coating Collapse for Predicting Refractory Failure in the Cement Process. Int. J. Fuzzy Syst. 2018, 20, 2640–2656. [Google Scholar] [CrossRef]
  23. Rouillard, V.; Sek, M.A. The Use of Intrinsic Mode Functions to Characterize Shock and Vibration in the Distribution Environment. Packag. Technol. Sci. 2005, 18, 39–51. [Google Scholar] [CrossRef]
  24. Khorsandi, M.; Ashofteh, P.-S.; Azadi, F.; Chu, X. Multi-Objective Firefly Integration with the K-Nearest Neighbor to Reduce Simulation Model Calls to Accelerate the Optimal Operation of Multi-Objective Reservoirs. Water Resour. Manag. 2022, 36, 3283–3304. [Google Scholar] [CrossRef]
  25. Guijo-Rubio, D.; Gutiérrez, P.A.; Casanova-Mateo, C.; Fernández, J.C.; Gómez-Orellana, A.M.; Salvador-González, P.; Salcedo-Sanz, S.; Hervás-Martínez, C. Prediction of Convective Clouds Formation Using Evolutionary Neural Computation Techniques. Neural Comput. Appl. 2020, 32, 13917–13929. [Google Scholar] [CrossRef]
  26. Mohaghegh, A.; Farzin, S.; Anaraki, M.V. A New Framework for Missing Data Estimation and Reconstruction Based on the Geographical Input Information, Data Mining, and Multi-Criteria Decision-Making; Theory and Application in Missing Groundwater Data of Damghan Plain, Iran. Groundw. Sustain. Dev. 2022, 17, 100767. [Google Scholar] [CrossRef]
  27. Chen, Y.; Chen, R.; Ma, C.; Tan, P. Short-Term Wind Speeds Prediction of SVM Based on Simulated Annealing Algorithm with Gauss Perturbation. IOP Conf. Ser. Earth Environ. Sci. 2019, 267, 042032. [Google Scholar] [CrossRef]
  28. Breiman, L. Random Forests. Mach. Learn 2001, 45, 5–32. [Google Scholar] [CrossRef]
  29. Ginidi, A.; Ghoneim, S.M.; Elsayed, A.; El-Sehiemy, R.; Shaheen, A.; El-Fergany, A. Gorilla Troops Optimizer for Electrically Based Single and Double-Diode Models of Solar Photovoltaic Systems. Sustainability 2021, 13, 9459. [Google Scholar] [CrossRef]
  30. Pachpore, S.; Jadhav, P.; Ghorpade, R. Process Parameter Optimization in Manufacturing of Root Canal Device Using Gorilla Troops Optimization Algorithm. In Computational Intelligence in Manufacturing; Elsevier: Amsterdam, The Netherlands, 2022; pp. 175–185. [Google Scholar]
  31. Daneshfaraz, R.; Aminvash, E.; Ghaderi, A.; Abraham, J.; Bagherzadeh, M. SVM Performance for Predicting the Effect of Horizontal Screen Diameters on the Hydraulic Parameters of a Vertical Drop. Appl. Sci. 2021, 11, 4238. [Google Scholar] [CrossRef]
  32. Morshed-Bozorgdel, A.; Kadkhodazadeh, M.; Valikhan Anaraki, M.; Farzin, S. A Novel Framework Based on the Stacking Ensemble Machine Learning (SEML) Method: Application in Wind Speed Modeling. Atmosphere 2022, 13, 758. [Google Scholar] [CrossRef]
  33. De Salis, H.H.C.; da Costa, A.M.; Vianna, J.H.M.; Schuler, M.A.; Künne, A.; Fernandes, L.F.S.; Pacheco, F.A.L. Hydrologic Modeling for Sustainable Water Resources Management in Urbanized Karst Areas. Int. J. Environ. Res. Public Health 2019, 16, 2542. [Google Scholar] [CrossRef]
  34. Anaraki, M.V.; Farzin, S.; Mousavi, S.-F.; Karami, H. Uncertainty Analysis of Climate Change Impacts on Flood Frequency by Using Hybrid Machine Learning Methods. Water Resour. Manag. 2021, 35, 199–223. [Google Scholar] [CrossRef]
  35. Jamei, M.; Ali, M.; Malik, A.; Prasad, R.; Abdulla, S.; Yaseen, Z.M. Forecasting Daily Flood Water Level Using Hybrid Advanced Machine Learning Based Time-Varying Filtered Empirical Mode Decomposition Approach. Water Resour. Manag. 2022, 36, 4637–4676. [Google Scholar] [CrossRef]
  36. Zhou, R.; Zhang, Y. Reconstruction of Missing Spring Discharge by Using Deep Learning Models with Ensemble Empirical Mode Decomposition of Precipitation. Environ. Sci. Pollut. Res. 2022, 29, 82451–82466. [Google Scholar] [CrossRef] [PubMed]
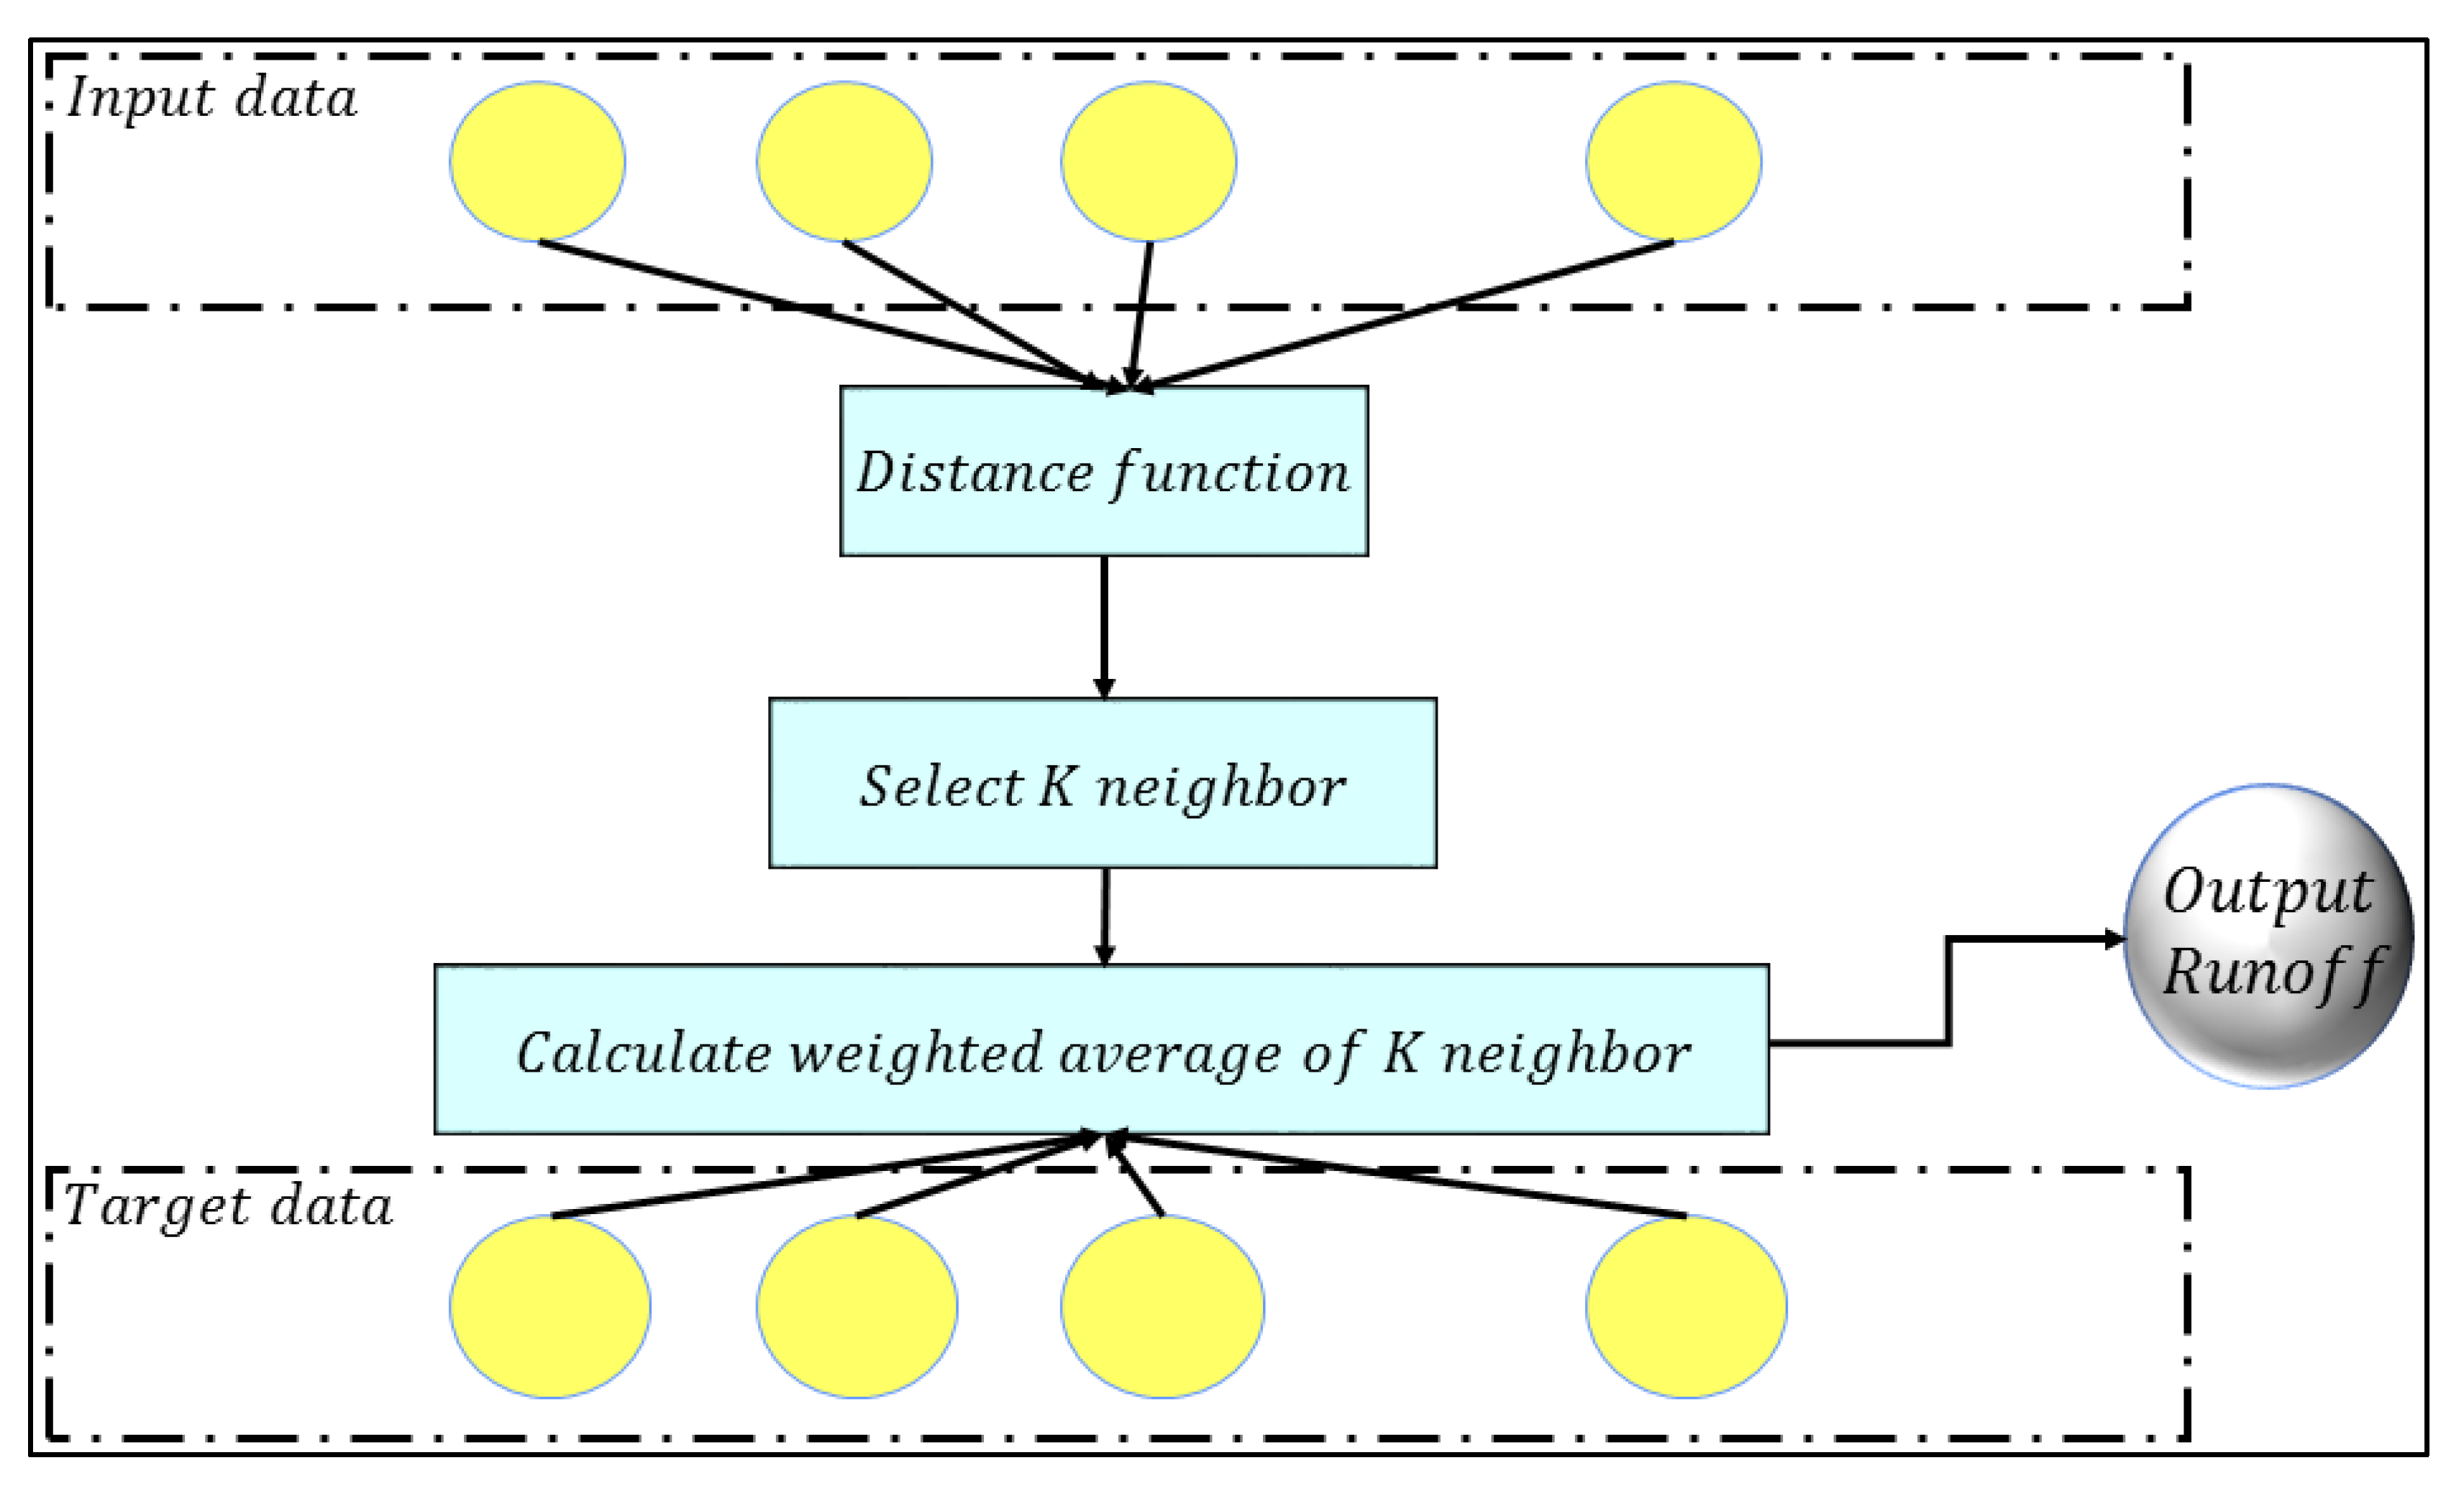
Figure 1. Structure of KNN.
Water 15 03576 g001
Figure 2. Scheme of the LSSVM structure.
Water 15 03576 g002
Figure 3. Map of the study area.
Water 15 03576 g003
Figure 4. Correlation plot for the input and target variables.
Water 15 03576 g004
Figure 5. Scheme of the presented framework.
Water 15 03576 g005
Figure 6. W values of input data for (a) scenario1, (b) scenario2, (c) scenario3, (d) scenario4.
Water 15 03576 g006aWater 15 03576 g006b
Figure 7. Time series plot of the best ML algorithms for modeling rainfall–runoff.
Water 15 03576 g007
Figure 8. Scatter plot of the best ML algorithms for modeling rainfall–runoff in the training period.
Water 15 03576 g008
Figure 9. Scatter plot of the best ML algorithms for modeling rainfall–runoff in the testing period.
Water 15 03576 g009
Figure 10. Cumulative distribution function (CDF) for observed and modeled runoff under (a) scenario1, (b) scenario2, (c) scenario3, (d) scenatio4, and (e) scenatio5.
Water 15 03576 g010aWater 15 03576 g010b
Figure 11. Convergence curve of KNN optimization.
Water 15 03576 g011
Table 1. Statistical criteria for runoff modeling.
StatisticsQ (m3/s)S1S2S3S4S5S6Tmin (°C)Tmean (°C)Tmax (°C)RHmean (%)WS (m/s)
Rainfall (mm/Month)
Mean0.4730.2940.5727.8132.4835.4433.9612.3425.828.0150.382.58
Standard deviation1.5432.1548.0130.334.238.4434.636.097.079.226.630.71
Minimum0000000−1.50000.6
Maximum18.1167.6336.4156.3175.05265.2172.324.751.8396.2782.54.9
Coefficient of variation0.310.940.850.920.950.920.982.032.692.81.893.63
Skewness coefficient6.821.281.811.421.291.721.230.170.360.92−1.09−0.12
Table 2. Characteristics of scenarios.
ScenariosInputsThreshold of RPre-ProcessingPost-Processing
1R_1, R_2, R_3, R_4, R_5, R_6, Tmin, Tmean, Tmax, Rh_mean, SW---
2R_1, R_2, R_3, R_4, R_5, R_6, Tmin, Tmean, Tmax, Rh_mean, SW
Lag = 0:24 month
0.05--
3R_1, R_2, R_3, R_4, R_5, R_6, Tmin, Tmean, Tmax, Rh_mean, SW
Lag = 0:24 month
0.1IMF (MaxNumIMF = 3)PCA
4R_1, R_2, R_3, R_4, R_5, R_6, Tmin, Tmean, Tmax, Rh_mean, SW
Lag = 0:24 month
0.1IMF (MaxNumIMF = 4)PCA
5R_1, R_2, R_3, R_4, R_5, R_6, Tmin, Tmean, Tmax, Rh_mean, SW
Lag = 0:24 month
0.1IMF (MaxNumIMF = 5)PCA
Table 3. Optimal parameters of the investigated algorithms.
ScenariosAlgorithmN1/N2γ/σminLSize/sThresholdmF/CNumTreeK
1ANN1/5-----
LSSVM-4.90/6.00----
M5--64/0.01---
MARS---5/4--
RF--4/0.05-100-
LSSVM–GTO-5.23/6.19----
KNN-----13
KNN–GTO-----4
2ANN15/4-----
LSSVM-10/5----
M5--64/0.01---
MARS---5/4--
RF--8/0.01-100-
LSSVM–GTO-100/8.16----
KNN-----2
KNN–GTO-----2
3ANN10/7-----
LSSVM-10/5----
M5--64/0.01---
MARS---5/4--
RF--32/0.1-100-
LSSVM–GTO-100/7.43----
KNN-----3
KNN–GTO-----1
4ANN12/4-----
LSSVM-10/5----
M5--64/0.1---
MARS---30/6--
RF--32/0.01-100-
LSSVM–GTO-1.38/2.33----
KNN-----4
KNN–GTO-----1
5ANN7/7-----
LSSVM-10/5----
M5--64/0.1---
MARS---30/4--
RF--8/0.01-100-
LSSVM–GTO-100/8.35----
KNN-----5
KNN–GTO-----4
Table 4. Results of rainfall–runoff modeling using machine learning algorithms for the training period.
ScenariosAlgorithmMAERMSERRMSERNSEKGE
1ANN0.45401.30570.90520.46080.1786−0.1042
LSSVM0.31750.77790.72400.71350.47450.3187
M50.53561.46450.88550.46250.21390.0477
MARS0.56791.44870.87590.48040.23080.0717
RF0.33141.02340.61880.83540.61610.4567
MNLR0.43040.89650.83430.54970.30220.1695
LSSVM–GTO0.31740.77760.72370.71380.47490.3192
KNN0.56671.61600.92380.41090.1444−0.1271
KNN–GTO0.53641.63650.93550.42770.1226−0.1896
2ANN0.02090.04460.03450.99960.99880.9749
LSSVM0.15820.43170.32660.98270.89310.7108
M50.41370.91600.75250.65740.43220.3368
MARS0.35450.82600.63800.76930.59180.5312
RF0.19680.70600.49560.90850.75370.6003
MNLR0.45260.69500.57090.82050.67310.6271
LSSVM–GTO0.07030.18590.14060.99720.98020.8773
KNN0.24980.81910.57500.82070.66850.5678
KNN–GTO0.00130.01270.00891.00000.99990.9969
3ANN0.00000.00000.00001.00001.00001.0000
LSSVM0.12680.32960.20150.99410.95930.8232
M50.18560.77730.47960.87710.76940.7387
MARS0.49221.00550.83940.54180.29350.1580
RF0.28380.86880.53120.92360.71710.5305
MNLR0.43430.65780.54910.83530.69770.6557
LSSVM–GTO0.05290.13040.07970.99890.99360.9344
KNN0.33530.97850.58650.82060.65510.5454
KNN–GTO0.28390.89230.53480.86310.71320.5837
4ANN0.02770.04400.03000.99960.99910.9892
LSSVM0.16880.42130.28110.98740.92080.7525
M50.32620.98960.65000.75920.57640.5127
MARS0.45410.70970.46620.88440.78210.7533
RF0.25470.86130.50680.90400.74240.5878
MNLR0.56170.93860.62620.77900.60680.5489
LSSVM–GTO0.06280.15250.10010.99810.98990.9184
KNN0.33890.99460.65330.75790.57210.4838
KNN–GTO0.00010.00160.00111.00001.00000.9998
5ANN0.04050.06930.04030.99940.99840.9498
LSSVM0.15230.36270.24990.99080.93740.7790
M50.07950.46700.32170.94670.89620.8833
MARS0.53381.11970.69830.71490.51110.4340
RF0.26940.80380.46730.96040.78100.5769
MNLR0.47700.78900.54360.83890.70370.6627
LSSVM–GTO0.05880.13020.08970.99860.99190.9252
KNN0.22790.83230.48190.88750.76710.6455
KNN–GTO0.00010.00210.00121.00001.00000.9998
Table 5. Results of rainfall–runoff modeling using machine learning algorithms for the testing period.
ScenariosAlgorithmMAERMSERRMSERNSEKGEFriedman Ranking
1ANN0.48271.59020.90170.46840.1820−0.106935.3333
LSSVM0.71112.19980.96250.29410.0679−0.247545.3333
M50.55161.19380.95690.40990.07870.076035.6667
MARS0.53331.17590.94260.41720.10610.111933.3333
RF0.52391.23070.98650.39740.02080.100736.6667
MNLR0.82192.24900.98400.21860.0257−0.260048.8333
LSSVM–GTO0.71112.19980.96250.29400.0679−0.247445.3333
KNN0.35450.78860.90720.44700.17200.074427.6667
KNN–GTO0.31560.75370.86710.50060.24350.050224.8333
2ANN0.60391.86060.92270.41930.14320.083839.3333
LSSVM0.55871.63120.82770.64870.31050.092329.6667
M50.46991.67690.78850.67870.37430.138823.3333
MARS0.46821.51090.74930.66250.43500.306917.8333
RF0.48931.58800.88340.47880.2147−0.006634.0000
MNLR0.78101.70830.80330.59440.35070.195931.0000
LSSVM–GTO0.54911.57160.79750.66900.35990.157024.3333
KNN0.49251.65480.92050.44600.1472−0.213737.5000
KNN–GTO0.38231.53400.85340.53650.26710.027329.6667
3ANN0.58851.19760.69460.74280.51440.541913.1667
LSSVM0.46610.98550.75430.69980.42740.238814.8333
M50.45721.28760.95470.35790.0827−0.165835.1667
MARS0.58751.66820.77690.64110.39250.357022.6667
RF0.52451.17450.89890.44890.1869−0.044133.0000
MNLR0.73341.66850.77710.63500.39220.233926.3333
LSSVM–GTO0.46750.94040.71970.71670.47870.291113.0000
KNN0.28970.72420.60310.80530.63400.52645.0000
KNN–GTO0.23540.65210.54310.87460.70320.53163.1667
4ANN0.42571.21390.70690.74140.49710.512910.5000
LSSVM0.45761.32810.80700.63230.34460.124723.0000
M50.52401.54080.96780.32410.0574−0.040140.1667
MARS0.55811.07670.67630.73560.53970.447112.5000
RF0.41240.86720.79510.64710.36380.114517.8333
MNLR0.69711.17390.71330.70040.48800.418816.0000
LSSVM–GTO0.50971.24470.78180.66460.38490.078622.5000
KNN0.30520.94750.59510.84690.64360.48636.1667
KNN–GTO0.16400.47410.29780.96070.91080.71411.3333
5ANN0.28950.72410.71240.71930.48920.32077.8333
LSSVM0.49991.45010.83130.59620.30460.099128.1667
M50.45821.40960.80800.59730.34290.131723.8333
MARS0.78921.46601.04910.2993−0.10770.040643.8333
RF0.41980.89540.88100.49040.2190−0.004027.3333
MNLR0.76951.46280.83850.56590.29240.263130.3333
LSSVM–GTO0.49791.41510.81120.60390.33780.152625.1667
KNN0.32120.79520.81140.59720.33740.303418.3333
KNN–GTO0.17280.40160.40980.91620.83100.71871.6667
Table 6. Bias analysis in rainfall–runoff modeling using machine learning algorithms over training, testing, and all periods.
ANNLSSVMM5MARSRFMNLRLSSVM–GTOKNNKNN–GTO
Training−0.492.260.000.000.030.001.25−4.680.02
Testing18.2322.2125.419.0036.54−11.2848.66−6.36−23.90
All4.977.205.942.108.12−2.7912.33−5.07−5.57
Disclaimer/Publisher’s Note: The statements, opinions and data contained in all publications are solely those of the individual author(s) and contributor(s) and not of MDPI and/or the editor(s). MDPI and/or the editor(s) disclaim responsibility for any injury to people or property resulting from any ideas, methods, instructions or products referred to in the content.