Article

Multi-Criteria Prioritization of Watersheds for Post-Fire Restoration Using GIS Tools and Google Earth Engine: A Case Study from the Department of Santa Cruz, Bolivia

1
Stockholm Environment Institute US, California Office, 501 Second Street, Davis, CA 95616, USA
2
Fundación para la Conservación del Bosque Chiquitano, Av. Ibérica Calle 6 Oeste 95, esq. Puerto Busch, Barrio Las Palmas, Santa Cruz de la Sierra, Bolivia
3
Centro de Investigación Para el Desarrollo Sostenible del Oriente Boliviano, Universidad Católica Boliviana San Pablo, Carretera al Norte Km. 9, Av. Milton Parra, Santa Cruz de la Sierra, Bolivia
*
Authors to whom correspondence should be addressed.
Water 2023, 15(20), 3545; https://doi.org/10.3390/w15203545
Submission received: 17 August 2023 / Revised: 24 September 2023 / Accepted: 26 September 2023 / Published: 11 October 2023

Abstract

:
The Santa Cruz department in Bolivia is characterized by a wide range of ecosystems and by its richness in water resources. In recent years, extended drought caused by climate change has led to extensive fire events. Combined with deforestation, this is resulting in the degradation of the region’s ecosystems and water resources. To address restoration needs from both a land- and water-management perspective, this study proposes to prioritize restoration areas by applying a multi-criteria analysis (MCA) based on two main principles: (1) using the watershed as the main study unit and (2) involving stakeholders in the definition of priority watersheds. Local stakeholders selected criteria representing water resources, biophysical characteristics, land management, productive areas, and fire disaster threats, and reclassified the spatial information based on perceived importance. Different prioritization scenarios were developed and compared in a Google Earth Engine (GEE) application. Priority restoration areas largely depend on the weighting scheme. Focusing solely on past fires leads to prioritizing the south-east basins, while the conservation of the western watersheds becomes more important when increasing the weight of the water resources criteria. This study represents the first step in developing a participatory MCA tool at the watershed scale in Santa Cruz. Highlighting the impact of different prioritization criteria can support collective decision-making around land and watershed restoration.

1. Introduction

Water in Latin America is both an environmental and an economic resource and its management is critical for sustainable development in the 21st century [1,2]. Though the region is rich in abundant water resources, the security of water quantity and quality is subject to population growth and urbanization, increasing demands for irrigated agriculture, combined with financial and institutional issues [3]. In addition, forest resources and ecosystems are also suffering from irreversible degradation caused by deforestation and wildfires of increasing frequency and magnitude [4].
Human-induced changes to land cover and forests are resulting in a loss of biodiversity [5] and likely further impacting the water resources [6]. For instance, forest cover affects the interception of rain and other components of the water balance and thus plays a key role for water resources [7]. The loss of forest cover could lead to increases in surface water runoff and decreased groundwater recharge [8]. In addition, water quality is impacted by changes resulting from soil erosion and increased nutrient and sediment loading in rivers following riparian wetland loss [9]. There is a link between the forest, water, and energy cycles, in the sense that forests are key to mitigating water scarcity and global warming [10]. Consequently, it is essential to focus on ecosystem restoration, as it will benefit both water resources and biodiversity.
In recent years, interests in ecological restoration have grown considerably in Latin America, with a large focus on Brazil, Mexico, Chile, and Argentina, leading to a great number of ecosystem prioritization studies that aim to select areas best suited for restoration [11]. From a technical point of view, site selection and decision-making for environmental restoration, ecosystem management, and nature conservation objectives may involve a large number of possible alternatives and evaluation criteria. For this reason, many studies have stressed the benefits of multi-criteria analysis (MCA) and Geographic Information Systems (GIS) for prioritizing areas for restoration due to the spatial aggregation and criteria combination possibilities [12,13,14]. Indeed, coupling MCA and GIS is an efficient approach when solving spatial and environmental problems, as it makes it possible to consider many choice criteria, diverse stakeholder values, and spatial datasets that characterize the studied landscape [15]. The main factors considered in the MCAs are typically species richness, ecosystem diversity, forest degradation, land use, and various socioeconomic factors [16]. Valente et al. [12] focused on water ecosystem services but noted that few other restoration prioritization studies in Brazil have included water resources.
From a social perspective, decision-making around biodiversity, land use change, and climate change is complex as it is influenced by individual values and perceptions of the problems [17]. Successful restoration efforts depend on the technical assessment of the landscape’s characteristics and the analytical decision-making framework, as well as on local perceptions of the restoration goals [18]. Stakeholder consultation can be combined with MCA approaches to integrate local knowledge with regional case studies and cross-sector management plans [19]. It is therefore useful to involve local experts in the process of identifying and prioritizing suitable restoration actions [20,21].
In terms of the spatial aggregation scale, watersheds are the basic unit for water management [22]. For example, in Europe, the river basin is the reference unit for major policy frameworks for water resources management, such as the Water Framework and the Floods Directives, which integrate both water resources protection and safety in the face of extreme events [23]. Though less common for land management, there are examples of spatial prioritization studies at the watershed scale based on soil erosion, groundwater recharge potential, water quality, and conservation purposes. Gumma et al. [24] prioritized watersheds for agricultural development and proper natural resources management in Mali. In India, Javed et al. [25] prioritized subwatersheds for natural resources conservation using morphometric characteristics and land cover and Kumar et al. [26] prioritized watersheds on the basis of soil erosion.
In Bolivia, river basin planning is still in its earlier stages of development and implementation [27]. Despite the fact that restoration is a national priority [28], the associated planning tools are insufficient. Watershed management is complex due to the large number of public entities involved with overlapping and conflicting roles and to tensions between the various governance levels [29].
Santa Cruz, the largest of the nine departments in Bolivia, is facing crucial socio-environmental sustainability issues. Both its Key Biodiversity Areas [30] and forest areas [28] have been significantly affected by wildfires in the last two decades. In response to the major forest fires of 2019, the Autonomous Departmental Government of Santa Cruz (Gobierno Autónomo Departamental de Santa Cruz—GADSC), in conjunction with the Bolivian National Government, developed the Plan for the Recovery of Areas Affected by Fires [31]. Although there are notable advances in the prioritization of burned areas in the department [32], there is still no study that allows for the prioritization of impacted ecosystems at the watershed level. Thus, there is potential to innovate by adopting a comprehensive view of land and water resources management and developing spatial-analytical tools that connect information that is useful across institutions.
This paper aims to identify relevant criteria for the prioritization of forest restoration areas and watershed management plans in the department of Santa Cruz, Bolivia. The study combines spatial analysis in ArcMap and Google Earth Engine (GEE) with MCA tools and the input from GIS experts, natural resources specialists, and regional authorities, collected during participatory workshops, to compare different restoration scenarios in Santa Cruz.

2. Materials and Methods
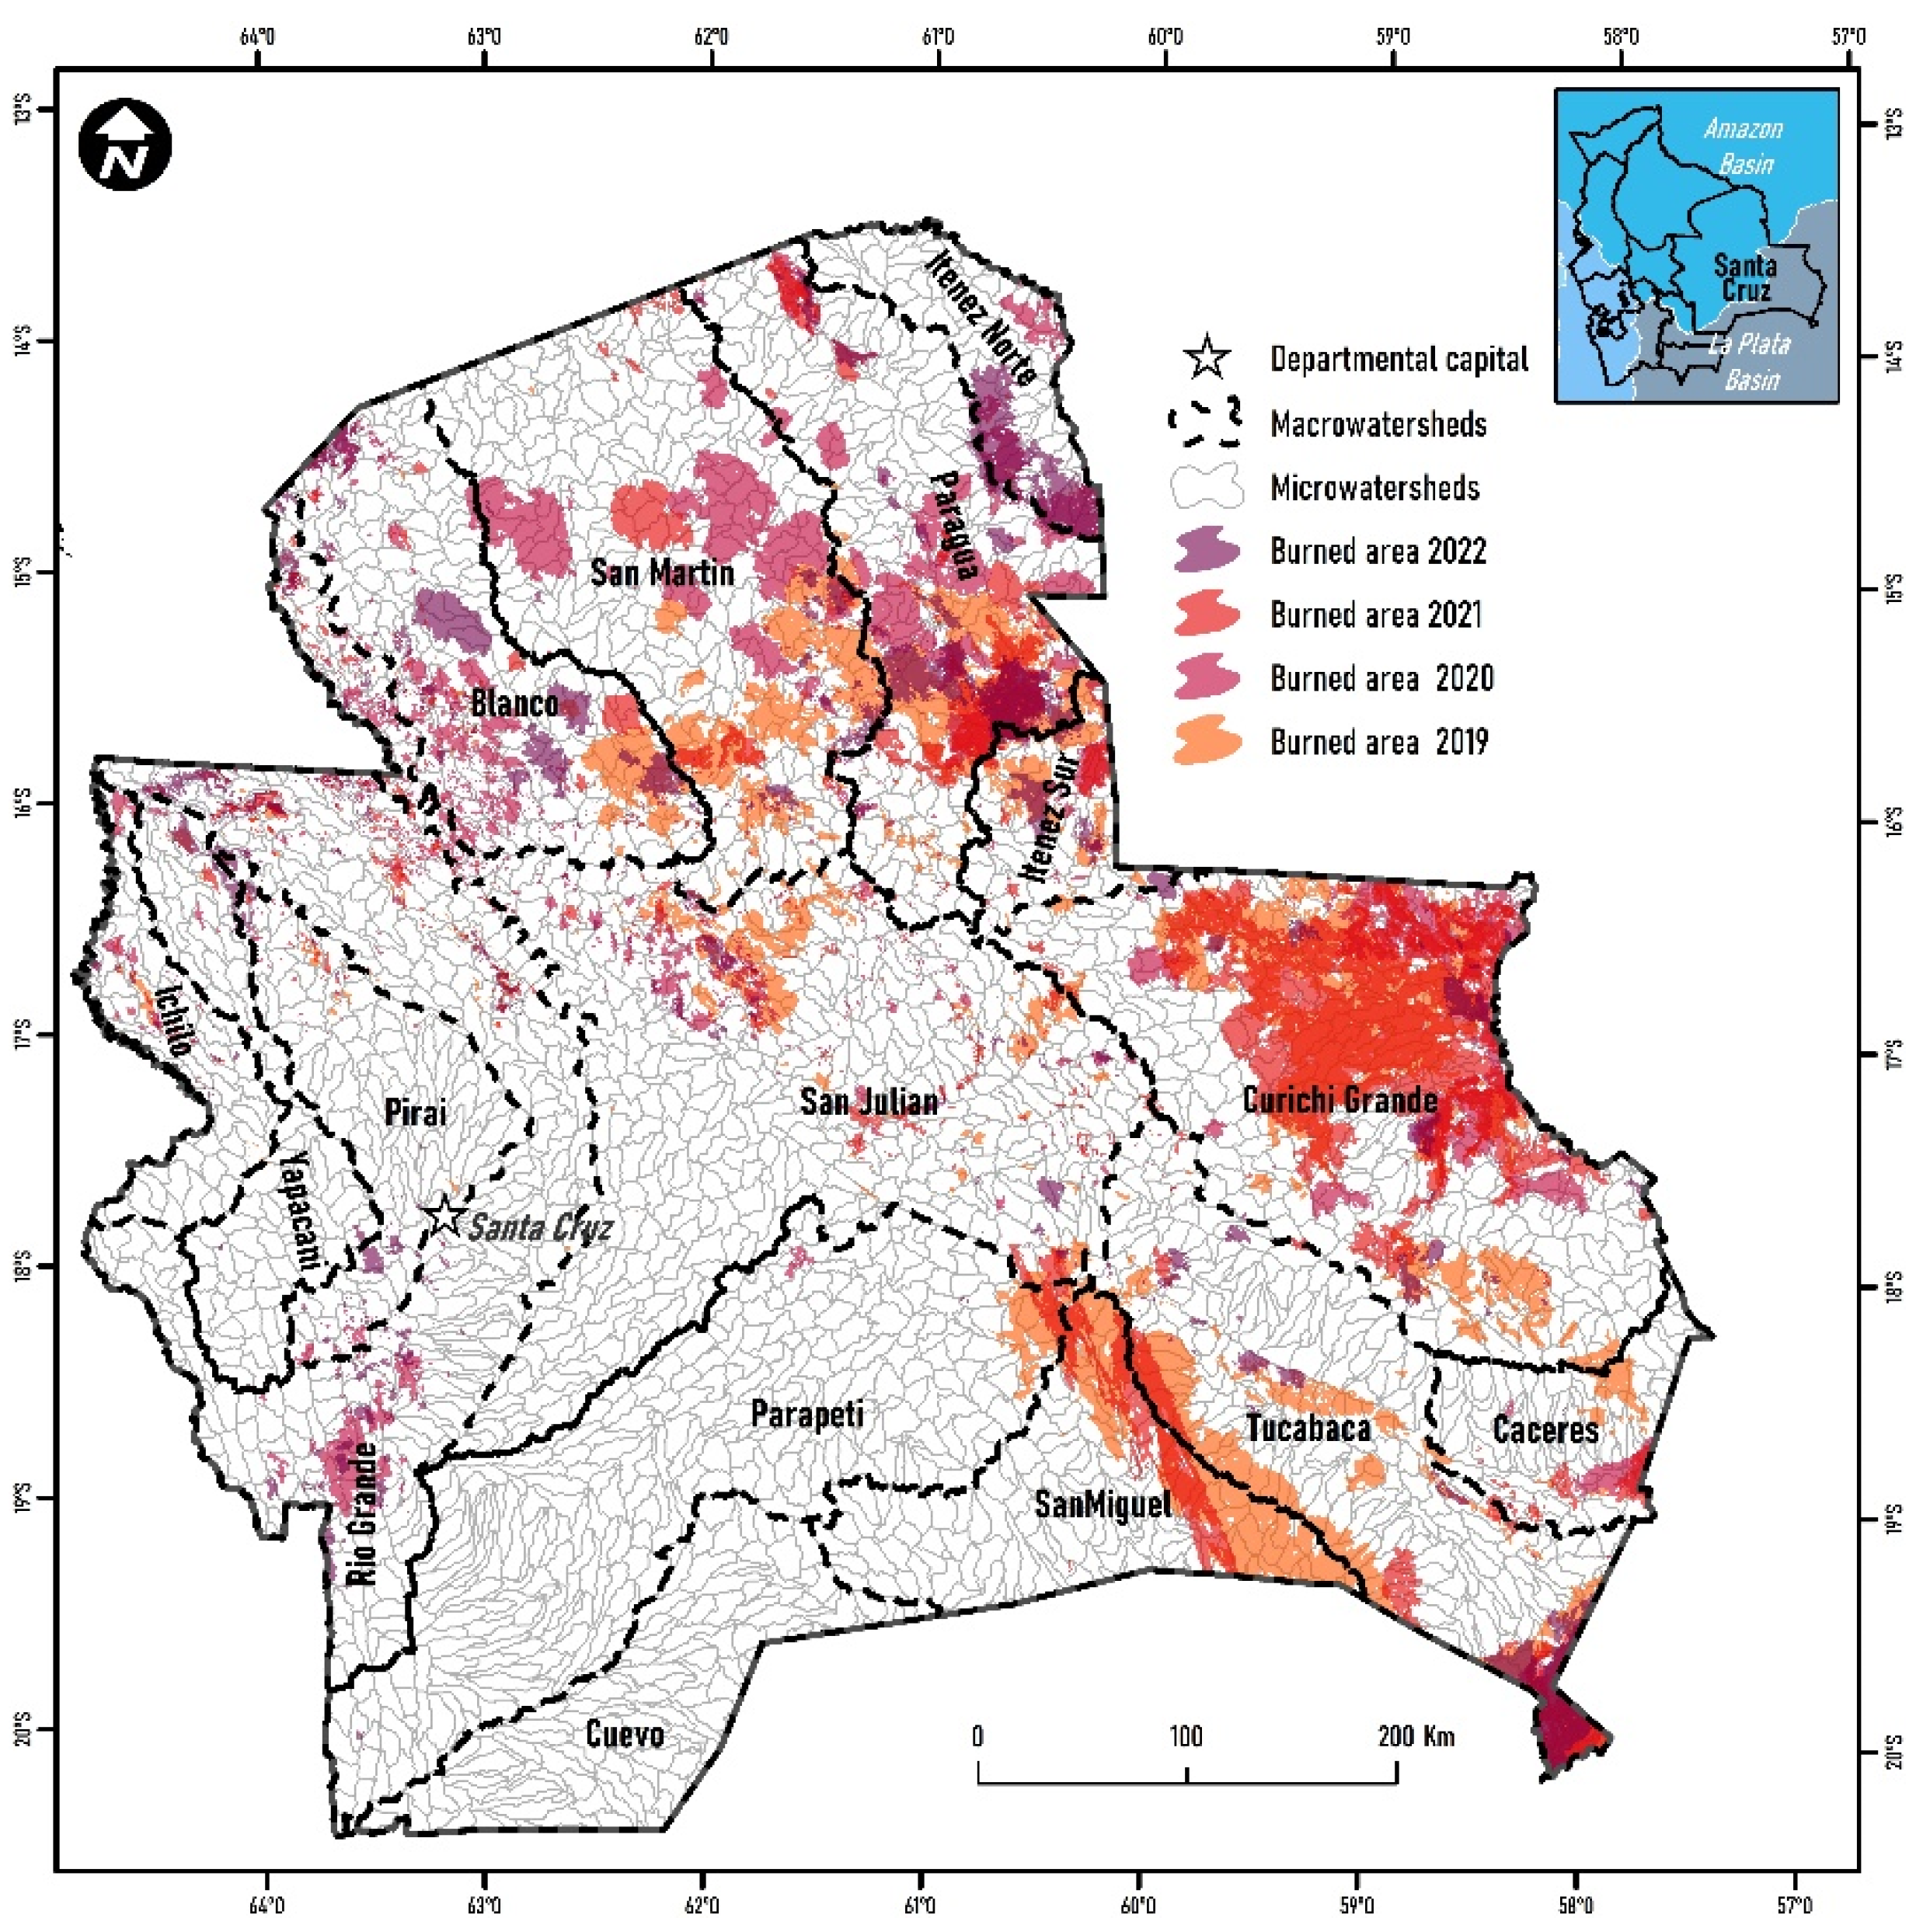
2.1. Study Area

The study area corresponds to the department of Santa Cruz in eastern Bolivia, at the border of Brazil and Paraguay. This department covers 370,621 km2, representing close to one third of the country’s territory. In terms of population, the department is home to almost 3.5 million people [33] with the majority located in the capital city of Santa Cruz de la Sierra. Santa Cruz is the driver for Bolivia’s economic development, contributing to 30% of the country’s gross domestic product thanks to its timber, oil and gas reserves, cattle farming, and recently, soy and sugar production [34].
The region sits between two major basins: the Amazon Basin in the north and the La Plata Basin in the south (Figure 1). It is divided into 16 macrowatersheds [35]. In the north, the main rivers are the Iténez River, which is the longest in the department, the Río Grande, the Piraí River, and the Itonomas River. In the southern basin, the primary rivers are the Paraguay River and its tributaries. The area is also home to several significant lakes, including Mandioré, Uberaba, La Gaiba, Marfil, Concepción, and San Jorge.
This region of Bolivia is characterized by a great variety of ecosystems, described by Ibisch and Mérida [36]. In the western part, there are temperate sub-Andean valleys, while to the north and south, there are two distinct lowland regions: the Beni and the Chaco regions. The flat areas to the north-east are known as the Chiquitania region, which is characterized by a low elevation and a few hills up to 1250 m high. In the far east, there are small portions of the enormous Pantanal wetland.
The forests and ecosystems in Santa Cruz are under threat from habitat conversion and fragmentation due to agricultural expansion and unplanned colonization [37], infrastructure development, and uncontrolled logging. In the last two decades, and in particular since 2019 (Figure 1), an increasing trend in the frequency, intensity and magnitude of wildfires has been observed [28], which can be linked to temperature increases, drought events, and fragmentation processes [38]. The resulting loss and degradation of primary forests is transforming the watersheds in Santa Cruz in ways that could potentially impact the quality and availability of the area’s water resources [39].

2.2. MCA Methodology and Datasets

MCA methods include a range of techniques designed to help structure decisions and evaluate alternative options through the definition and weighing of measurable criteria [15]. A broad categorization divides the methods into non-compensatory and compensatory approaches: the former imply fixed limits for including or excluding options, while the latter allow for trade-offs and compensation between the analysis criteria [40]. A preliminary screening of fire-affected watersheds was applied (Section 2.2.1) followed by a compensatory MCA (Section 2.2.2, Section 2.2.3, Section 2.2.4, Section 2.2.5 and Section 2.2.6) to select priority watersheds.

2.2.1. Selection and Analysis of the Santa Cruz Watersheds

The watershed prioritization uses two different scales of analysis: micro- and macrowatersheds. The prioritization area was narrowed down to a spatial selection of the watersheds in which fires occurred between 2019 and 2022. The watershed level 12 dataset from the HydroSHEDS product was used for the microwatersheds (Table 1). The macrowatersheds layer was generated by the GADSC with the watershed name attributes corresponding to the main Santa Cruz rivers [35]. The watershed layers were processed in ArcMap to identify the watersheds impacted by fires using the Fundación para la Conservación del Bosque Chiquitano’s (FCBC) fire scar maps from the years 2019 to 2022 (Table 1). This selection was used to create a mask for the spatial aggregation. The total burned area and area burned in each macrowatershed was calculated with ArcMap raster calculations and zonal statistic tools.

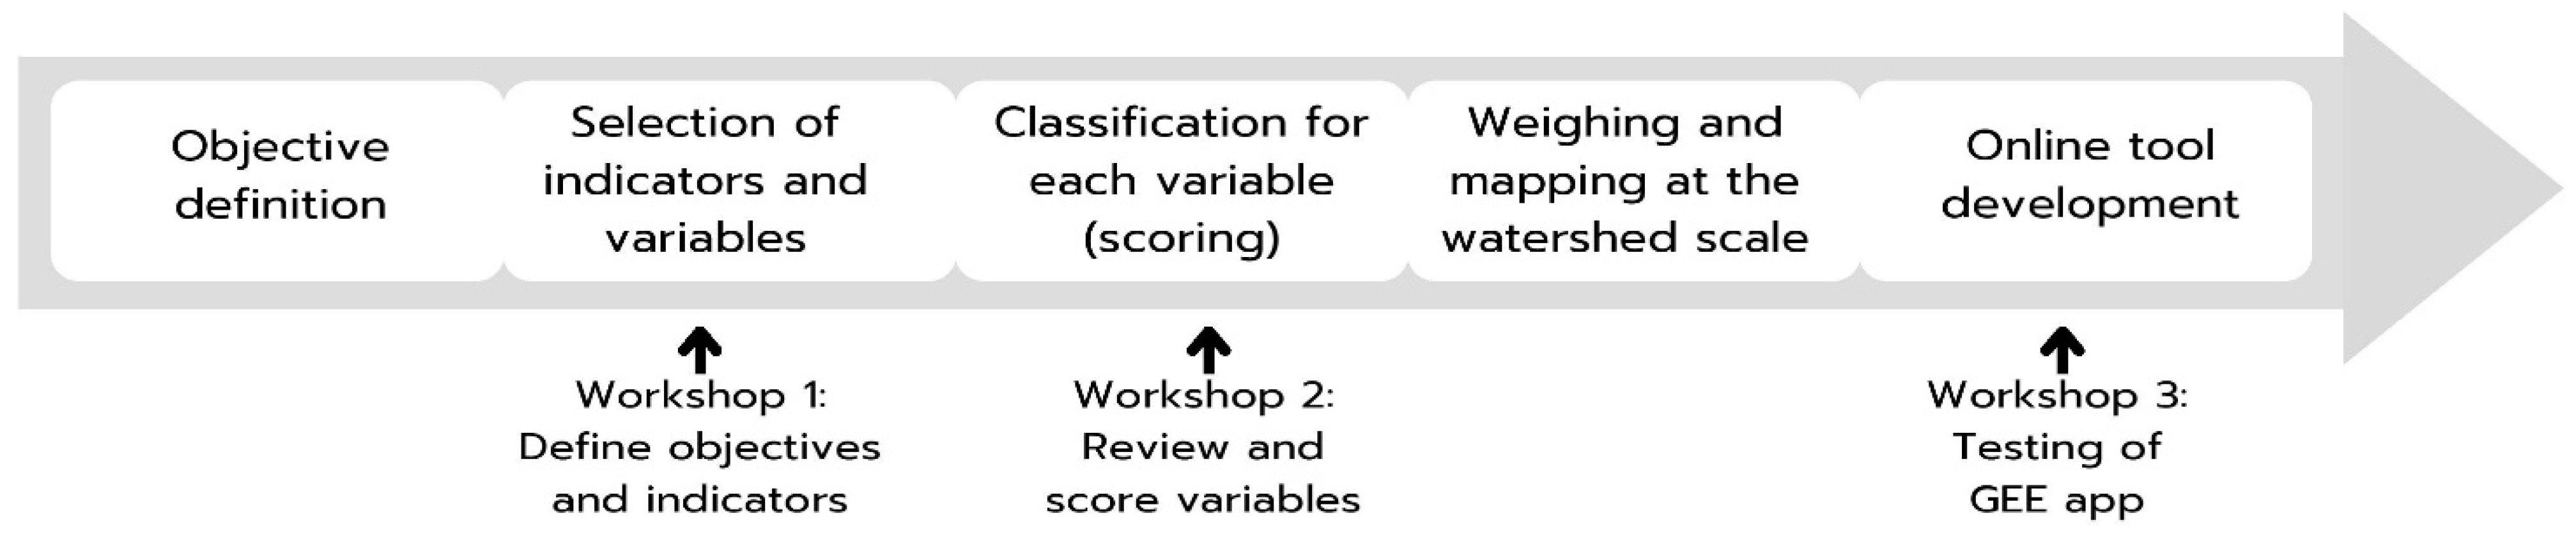
2.2.2. Analytical and Participatory Framework

The main technique applied in the prioritization methodology is a conventional compensatory MCA that entails defining objectives and selecting, ranking, and weighting the variables that support the objectives in order to evaluate different prioritization alternatives. For spatial problems, this process involves the translation of geographic data into priority assessments and preferences using GIS [41].
To reflect local expertise, stakeholders were involved in every step of the process, from design to tool testing (Figure 2). Collaborating with stakeholders and decision-makers in a participatory approach ensures that their values and preferences are accounted for in the MCA and decision-making process [14,20]. The consultation engaged representatives of civil society and non-profit organizations, experts in water and natural resources management, environmental planners, and representatives of the regional and municipal governments. This inclusive approach provided valuable insights into local expectations regarding forest and watershed management and ensured that the prioritization methodology was based on the unique context of the study area.

2.2.3. Prioritization Objectives

The initial step towards the development of the prioritization framework was to agree upon the objectives of the analysis. While some burned areas in Santa Cruz can be restored through natural regeneration processes, others call for assisted restoration [30]. The agreed scope of the prioritization was to select restoration areas for active interventions rather than passive and natural regeneration, which corresponds to the definition of ecological restoration used by Mansourian et al. [42]. The primary aim established with stakeholders was to identify watersheds that exhibit richness in biodiversity and water resources while also taking into account the threats posed by human activities and the risk of wildfires. In this way, the prioritization framework addresses the conservation of water resources and ecosystems and identifies the areas most in need of restoration based on existing environmental and human-made risks.

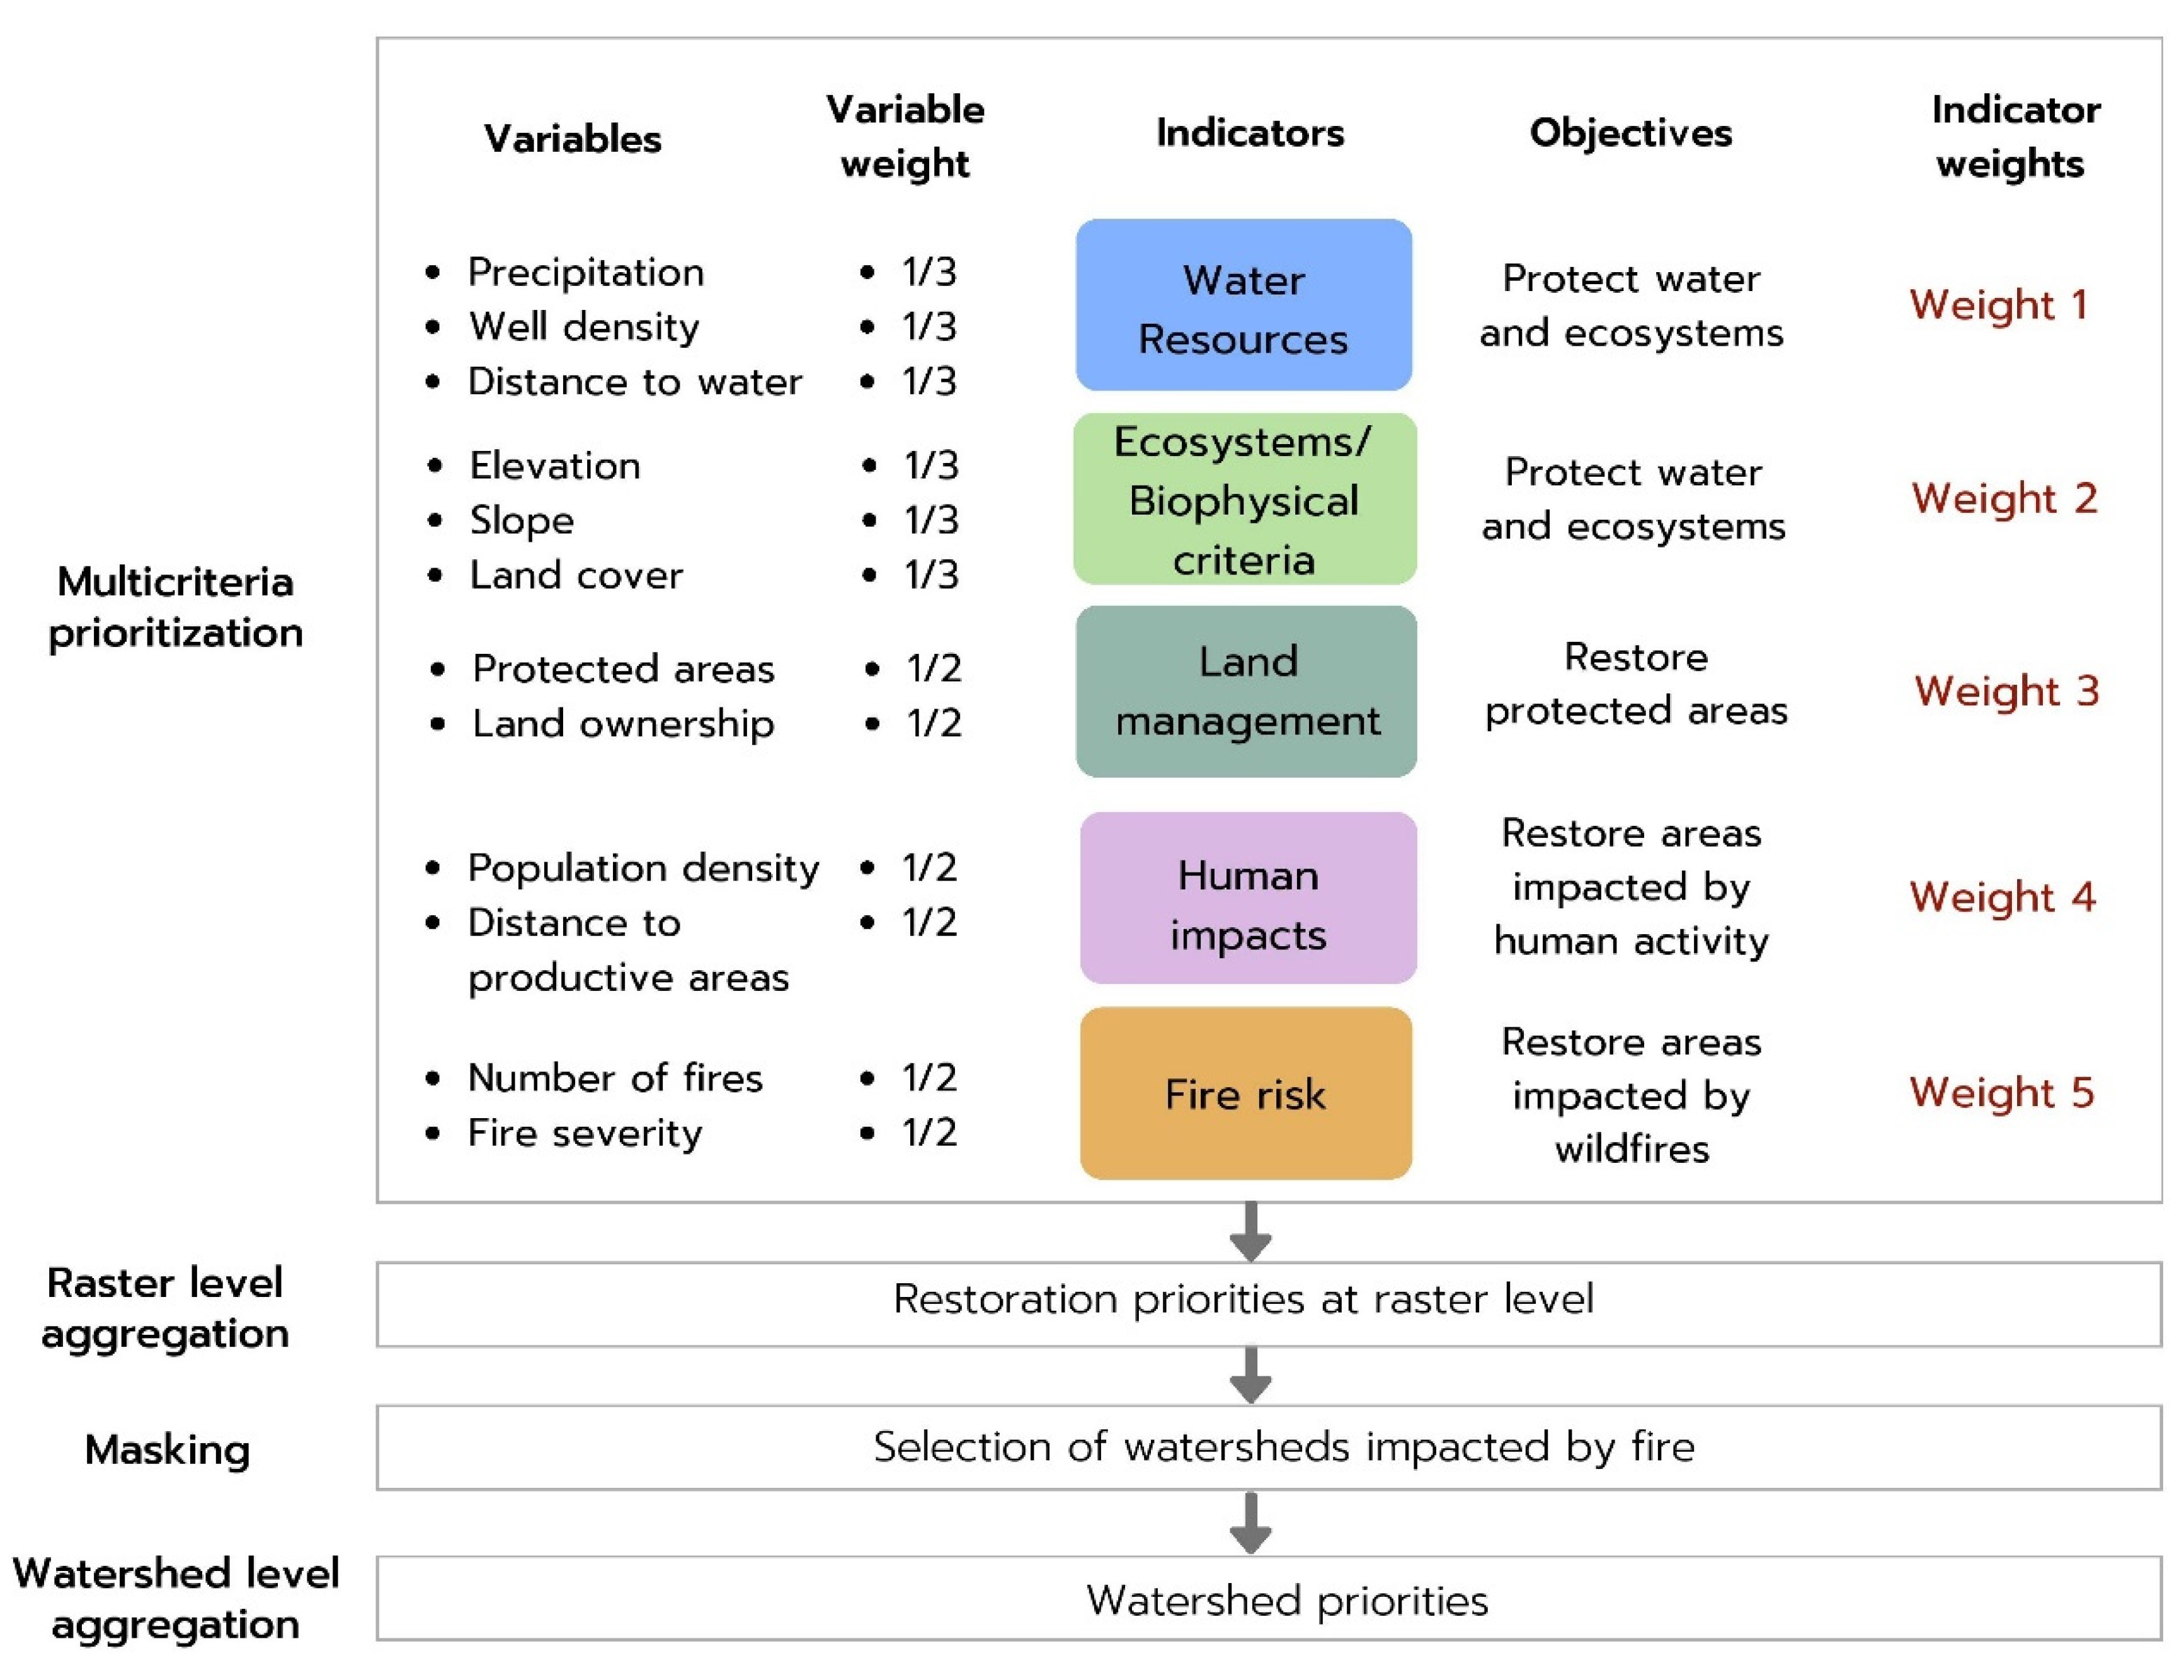
2.2.4. Variable Selection

The set of indicators or criteria for the prioritization was selected in line with the study objectives, the scientific literature, and in dialogue with local experts. The first facilitated workshops with conservation and GIS experts led to the grouping of variables into five indicator categories: water resources, biophysical characteristics, land ownership and management, vulnerability to human impacts, and exposure to natural hazards. For each indicator group, the contributing variables were chosen according to data availability at the scale of the department of Santa Cruz. In total, 12 variables (i.e., 12 raster layers) were used in the analysis. All the input datasets were processed with ArcMap tools (Table 1) and resampled to a spatial resolution of 30 m.
1.
Water Resources Conservation
Together with local experts and authorities, proximity to surface water and groundwater were identified as key factors in determining the value of an area for water resources. Restoration actions close to water bodies protect both ecosystems and water resources [43]. Due to the limited access to stream flow and groundwater data, proxy variables such as the proximity to streams and the density of wells were used. The surface water class was obtained from a Landsat-based vegetation cover and deforestation product developed by the FCBC for the year 2021 [38]. The proximity to streams was then calculated using Euclidean distance (in m). In addition, well data was provided by the GADSC and by technicians at water cooperatives and municipalities. The well density map was generated using the ArcMap Kernel Density tool (km2). Stakeholders also chose precipitation as an indicator of water availability, as described by Ianni and Geneletti [44]. The average precipitation data (mm) for 1970–2000 were downloaded from WorldClim version 2.1 and re-scaled to a 30 m pixel.
2.
Biophysical Characteristics
To represent the landscape’s biophysical characteristics, land cover data were included, as one aim of the prioritization was to restore forest and vegetation areas. The FCBC’s land cover map was reclassified into five classes: non-vegetated area, other non-forest natural formation, wetlands, forest, and flooded forest. In addition, the restoration of ecosystems that are located on a high slope and at higher elevation was prioritized, as steeper areas are more susceptible to erosion and to the impacts of human activities and natural hazards [45,46]. The elevation (m.a.s.l.) and slope (degrees) layers were obtained from Aster Global Digital Elevation Map (GDEM) version 2 sensor scenes.
3.
Managed and Protected Areas
Protected landscapes are key areas for biodiversity conservation and for the preservation of cultural and social values [47]. Protected areas were included in the analysis to prioritize areas with a high conservation value and to support the ecosystem services they provide. All governance levels (national, regional, municipal) were considered and obtained from mapping data provided by the GADSC. Moreover, a land-ownership dataset provided by National Institute of Agrarian Reform (INRA) was added to prioritize community and indigenous-owned land.
4.
Human Activity Threats
In terms of threats from human activities, the analysis considered population density and proximity to roads and built infrastructure. The Euclidean distance to roads and productive areas was calculated (in m) using FCBC’s maps of anthropogenic land use. Population density (per km2) was calculated using the 2012 population census from the National Statistics Institute [33] and the Kernel Density tool. Populated areas and productive areas were prioritized to reflect stakeholders’ preference to restore ecosystem services in the vicinity of urban centers and human activities. Generally, studies do not prioritize locations close to roads or urban areas [45,48] as these are considered a disturbance that reduces the restoration’s feasibility factor [13].
5.
Vulnerability to Wildfire Hazards
Fire occurrence and fire intensity were selected to prioritize the restoration of the most exposed watersheds. It was assumed that the intensity of fires and the number of recurring fires may determine whether the vegetation will be able to regenerate naturally or not and that active restoration should focus on the ecosystems most impacted by fire. Using the FCBC’s fire scar maps, a layer sum operation was applied to calculate the recurrence of fire events over the 2019–2022 period. The intensity of the fires was obtained using the Fire Radiative Power (FRP) (in MW) in the MODIS Collection 6.1 product (1 km resolution), from NASA’s Fire Information for Resource Management System (FIRMS). An interpolation of the FRP data was performed using the Inverse Distance Weighted (IDW) technique to obtain the intensities [30].

2.2.5. Variable Scores

During the second stakeholder workshop, the values of each variable were ranked from very low to very high importance for the prioritization. For both quantitative and qualitative variables, the values were distributed into five classes. This participatory ranking process captured the local preferences regarding each criterion and was also complemented with examples from the literature. The subsequent scoring step allowed for the comparison between the different variables by transforming the values of each spatial dataset into a common scale. Specifically, the ArcMap reclassification tool was used to assign variable scores ranging from 1 (least important for restoration) to 5 (most important) as shown in Table 2.

2.2.6. Aggregation to Microwatersheds and Macrowatersheds

To aggregate the classified and scored variables, a Weighted Linear Combination (WLC) method was applied. This method has been validated for forest restoration and conservation by a number of authors [43,49,50,51]. It consists of multiplying each standardized criterion’s spatial layer (i.e., pixels) by an assigned weight and then summing the weighted criteria to produce a final result layer. The WLC can be applied in one step or hierarchically to aggregate variables within a group before combining groups together [40]. Applying the latter approach, equal weights were assigned to the variables in each indicator group. Then, another set of indicator weights was assigned to each group of variables (Figure 3).
The overall priority P for each pixel is calculated following the algebraic operations (1) and (2), where j is a variable contributing to indicator i, Pj is the corresponding pixel value, n is the number of variables in a group, Pi is the pixel-level priority for indicator i and Wi is the weight assigned to indicator group i:
Indicator group priority Pi = ∑j = 1 to n Pj × 1/n
Overall priority P = ∑i = 1 to 5 (Wi × Pi)/∑Wi
In this case study, examples of the contribution of different indicator weights in the prioritization of watersheds are illustrated. A total of 12 scenarios were considered: the first five (A–E) focus on a single indicator group, while scenario F shows the result of equally valuing all five groups. The remaining scenarios (G–L) give equal priority to two or three indicator groups (Table 3). It must be noted that these are only illustrations of possible weight combinations and that different weight values and combinations of indicators could be considered.
When averaging all weighted indicators to obtain the restoration priority map, minimum to maximum stretching was applied to obtain results between 1 and 5. Therefore, the prioritization gives a relative priority associated with a set of weights rather than an absolute priority across all weighing schemes. Finally, the raster level results were averaged at the microwatershed and macrowatershed scale using zonal statistics, corresponding to the masking and aggregation steps in Figure 3.
All the MCA steps were implemented using GEE. The GEE platform offers interactive and user-friendly interfaces designed for conducting spatial analyses using either Earth Engine’s data catalog or uploaded datasets [52]. First, the spatial layers representing the ranked variables were imported into the GEE database. Then, a Javascript code was developed in the code editor to read-in the spatial data and perform the aggregation, weighting, and mapping of the prioritized watersheds. For the purpose of accessibility and the potential for local hosting, the code was used to create an online application (https://jeannefdz.users.earthengine.app/view/watershed-prioritizer-sc, updated on 7 August 2023). The tool was presented to local stakeholders during the testing workshop, and this provided an opportunity for potential users to review the prioritization framework and discuss future developments.

3. Results

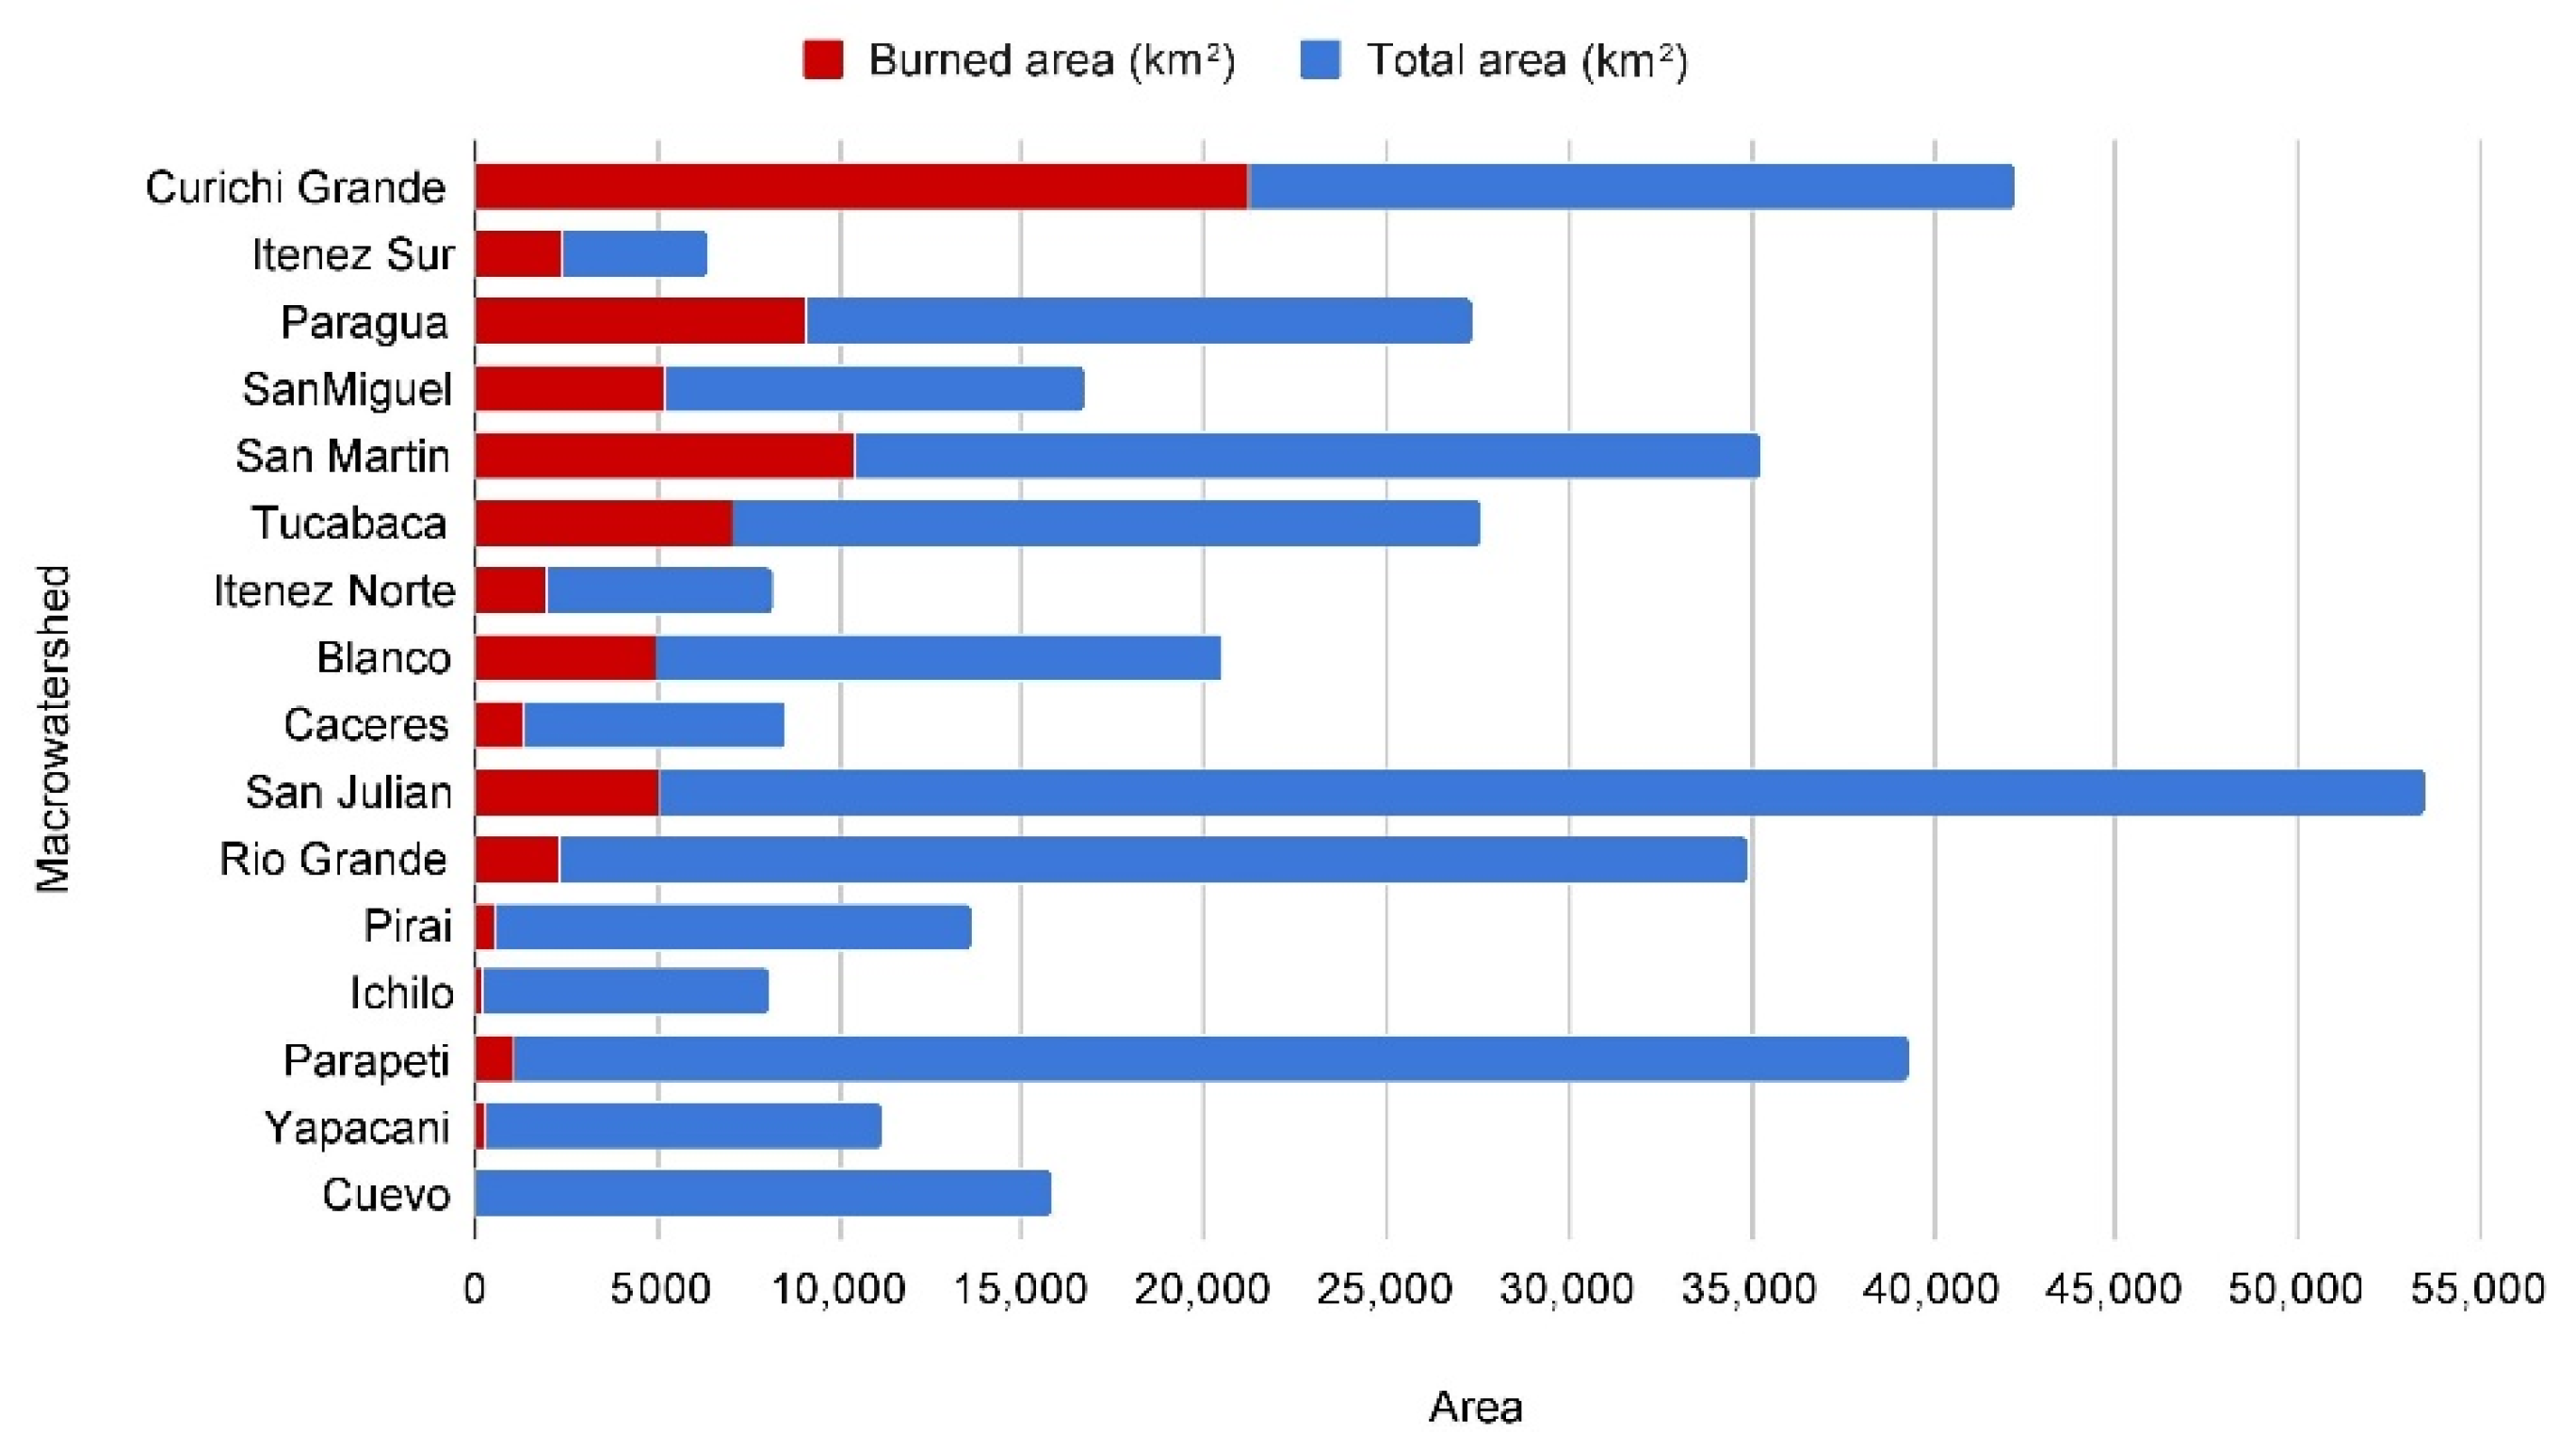
3.1. Watersheds Impacted by Wildfires

The results of the GIS analysis of recent fire scars in the department of Santa Cruz show that the area impacted by wildfires varies annually, but in the year 2019 an extreme series of fire events burned 42,005 km2. This was the largest burned area in the last four years (2019–2022). The absolute total area impacted by fires between 2019 and 2022 in Santa Cruz was 73,481 km2. Of this total, the macrowatershed of Curichi Grande represents 21,225 km2 (29%), San Martin accounts for 10,464 km2 (14%) and Paragua accounts for 9109 km2 (12%) (Figure 4). The watersheds in Figure 4 are sorted according to the fraction of the watershed area impacted by wildfires in 2019–2022. Based on this, over 25% of the surface area in Itenez Sur, Paragua, San Miguel, San Martin and Tucabaca was affected by fires, reaching 50% in Curichi Grande. If focusing primarily on burned areas, restoration activities would be centered around these watersheds. At the microwatershed scale, 1765 watersheds of the 3004 (59%) were affected by wildfires in at least one of the four years (2019–2022).

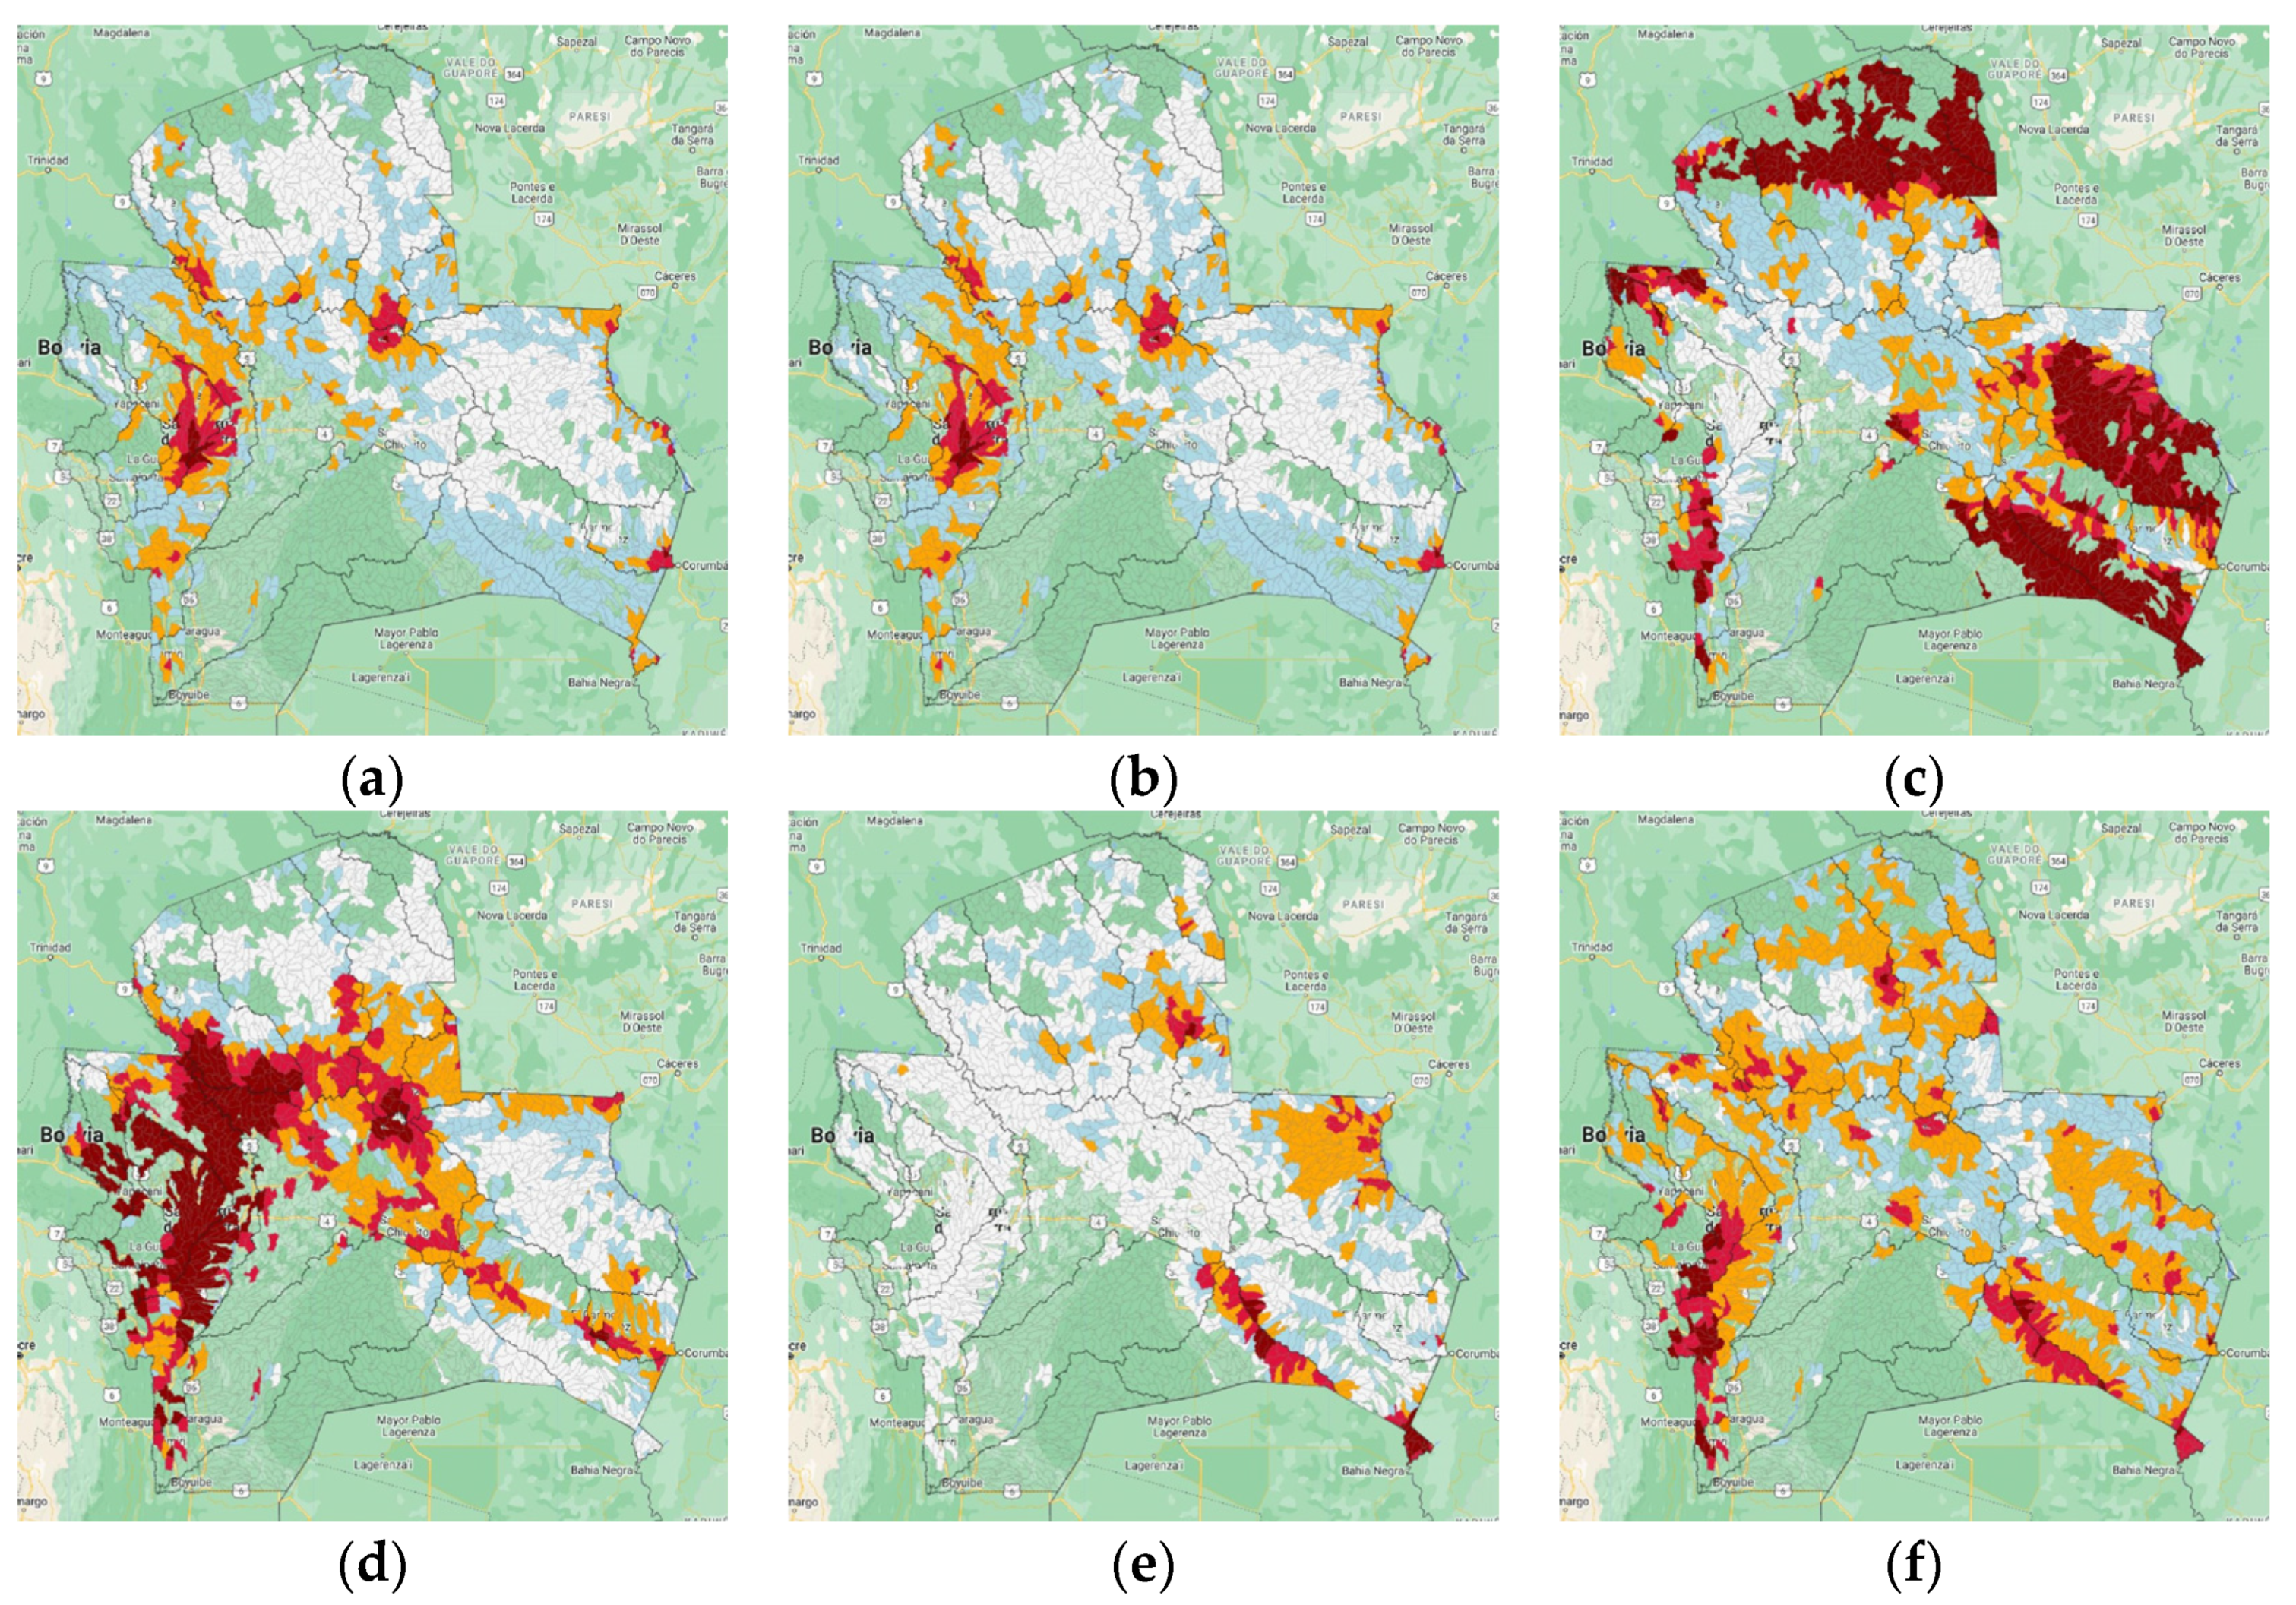
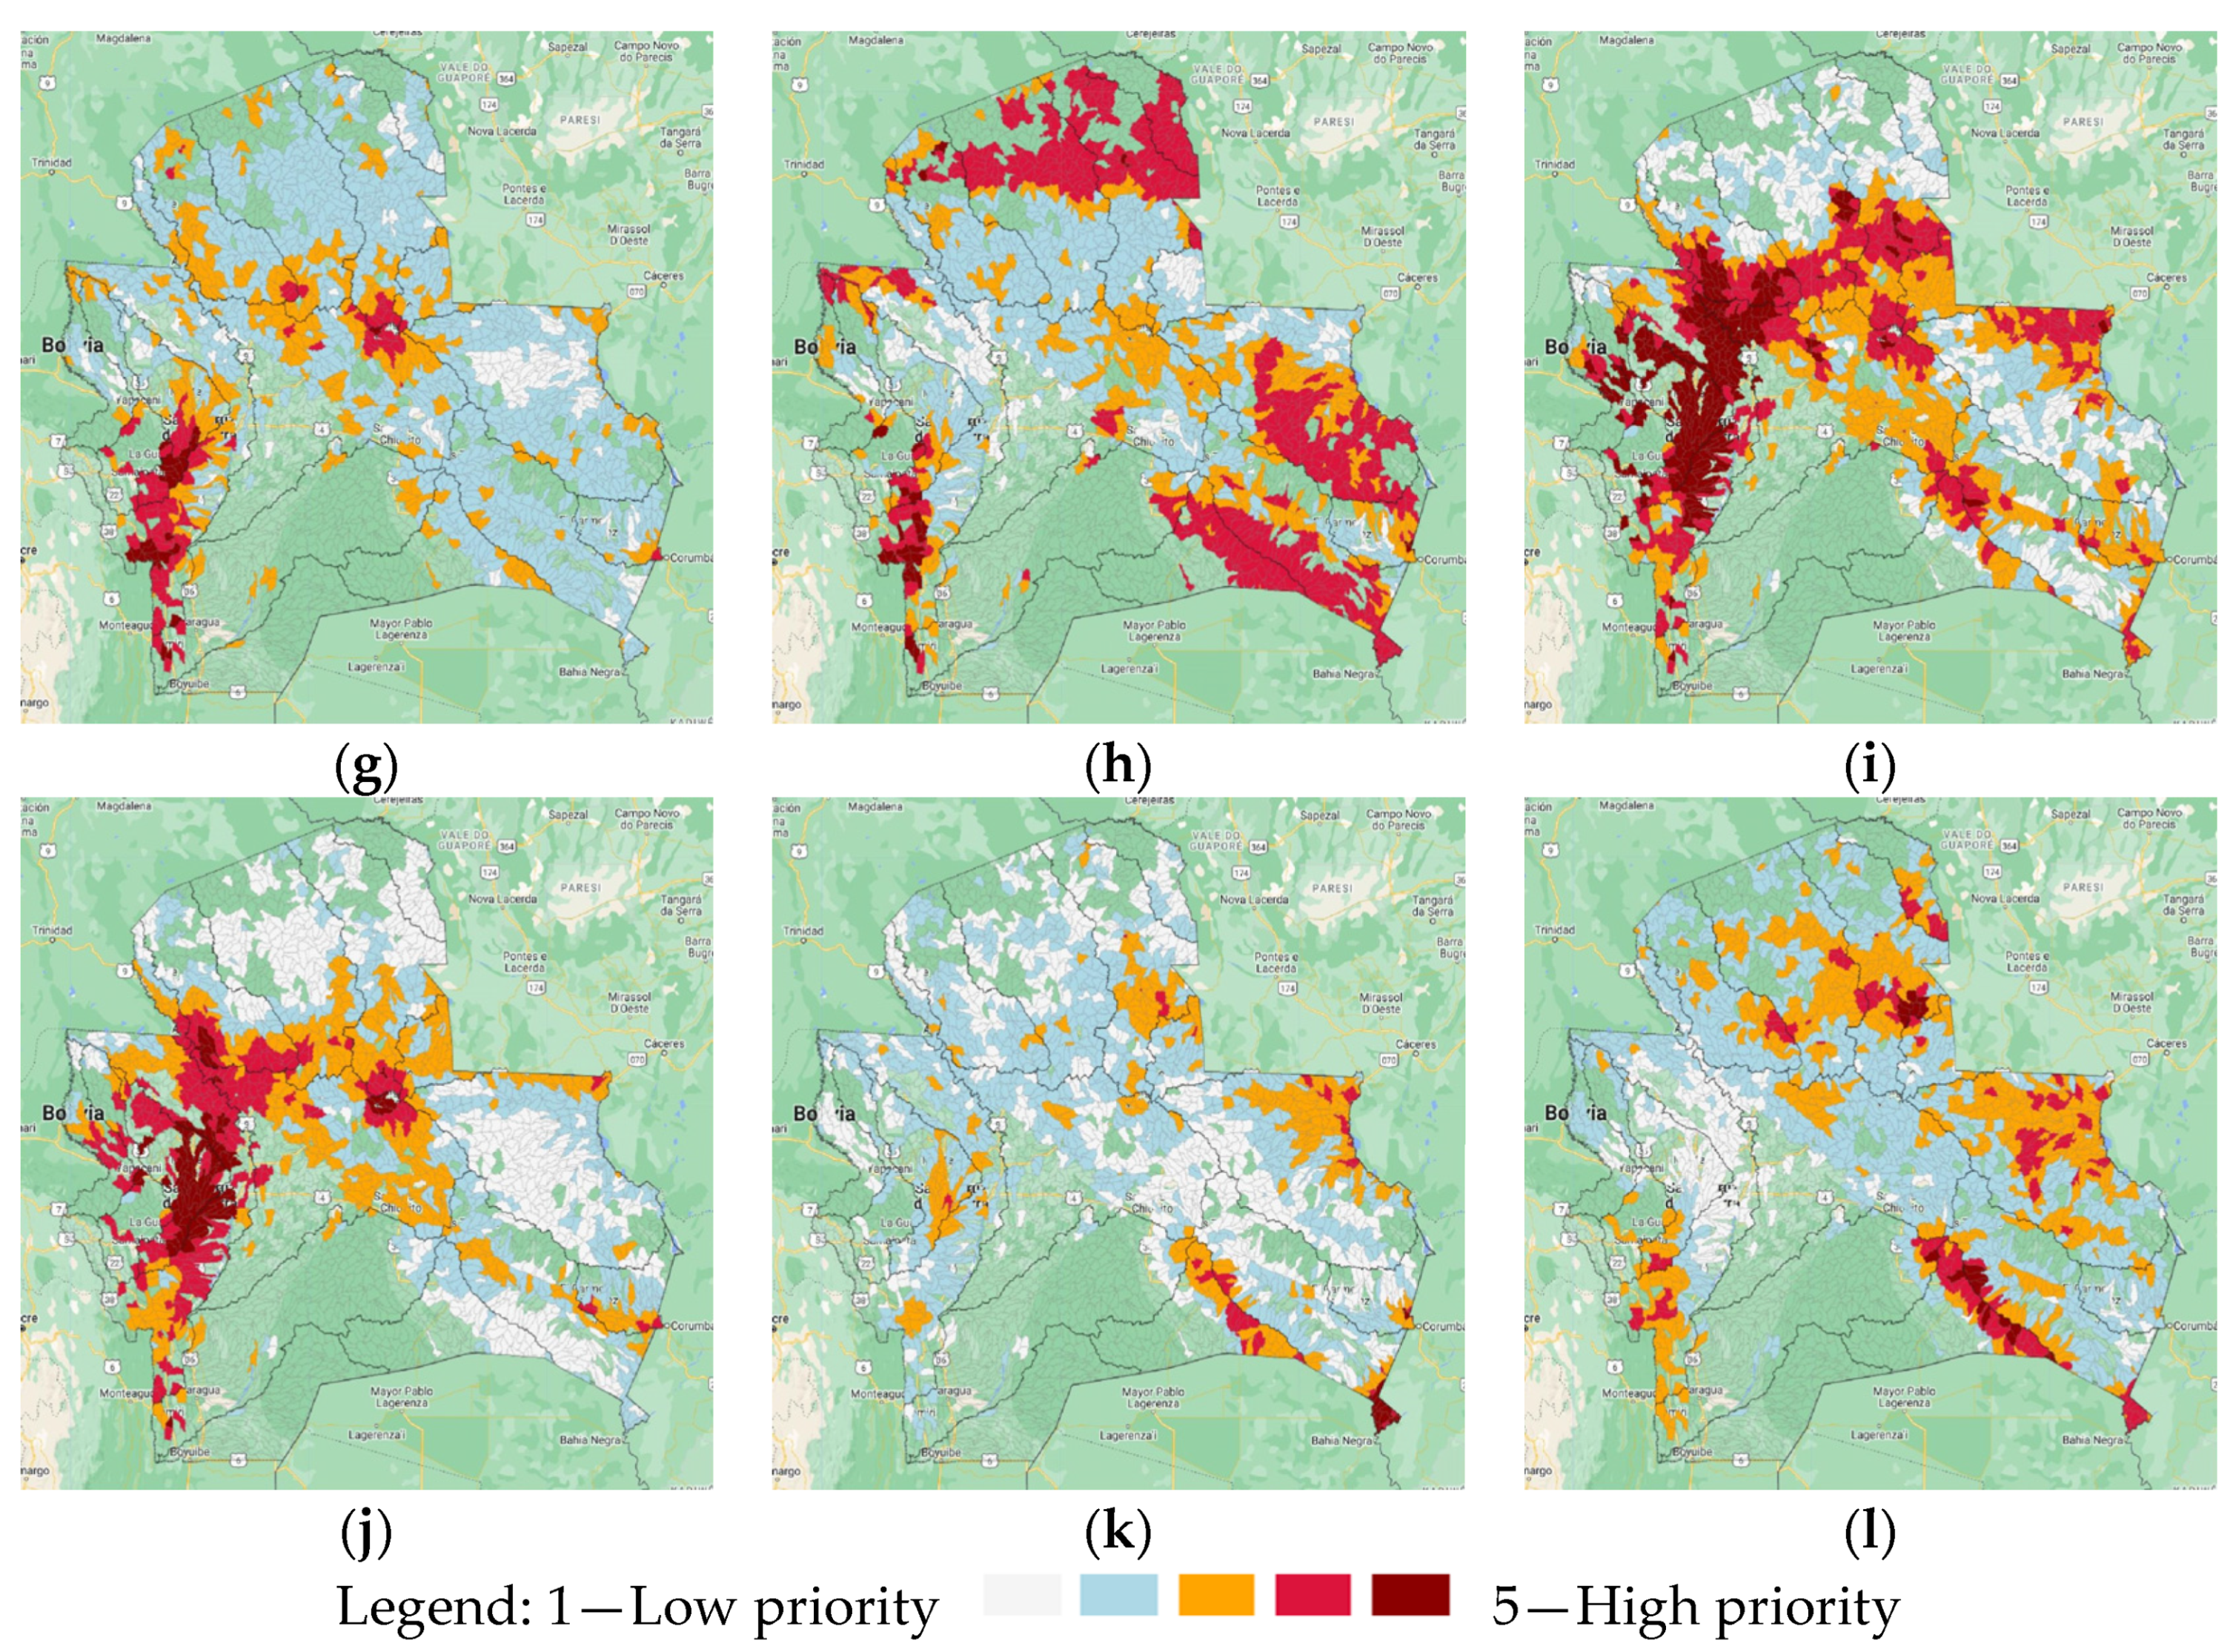
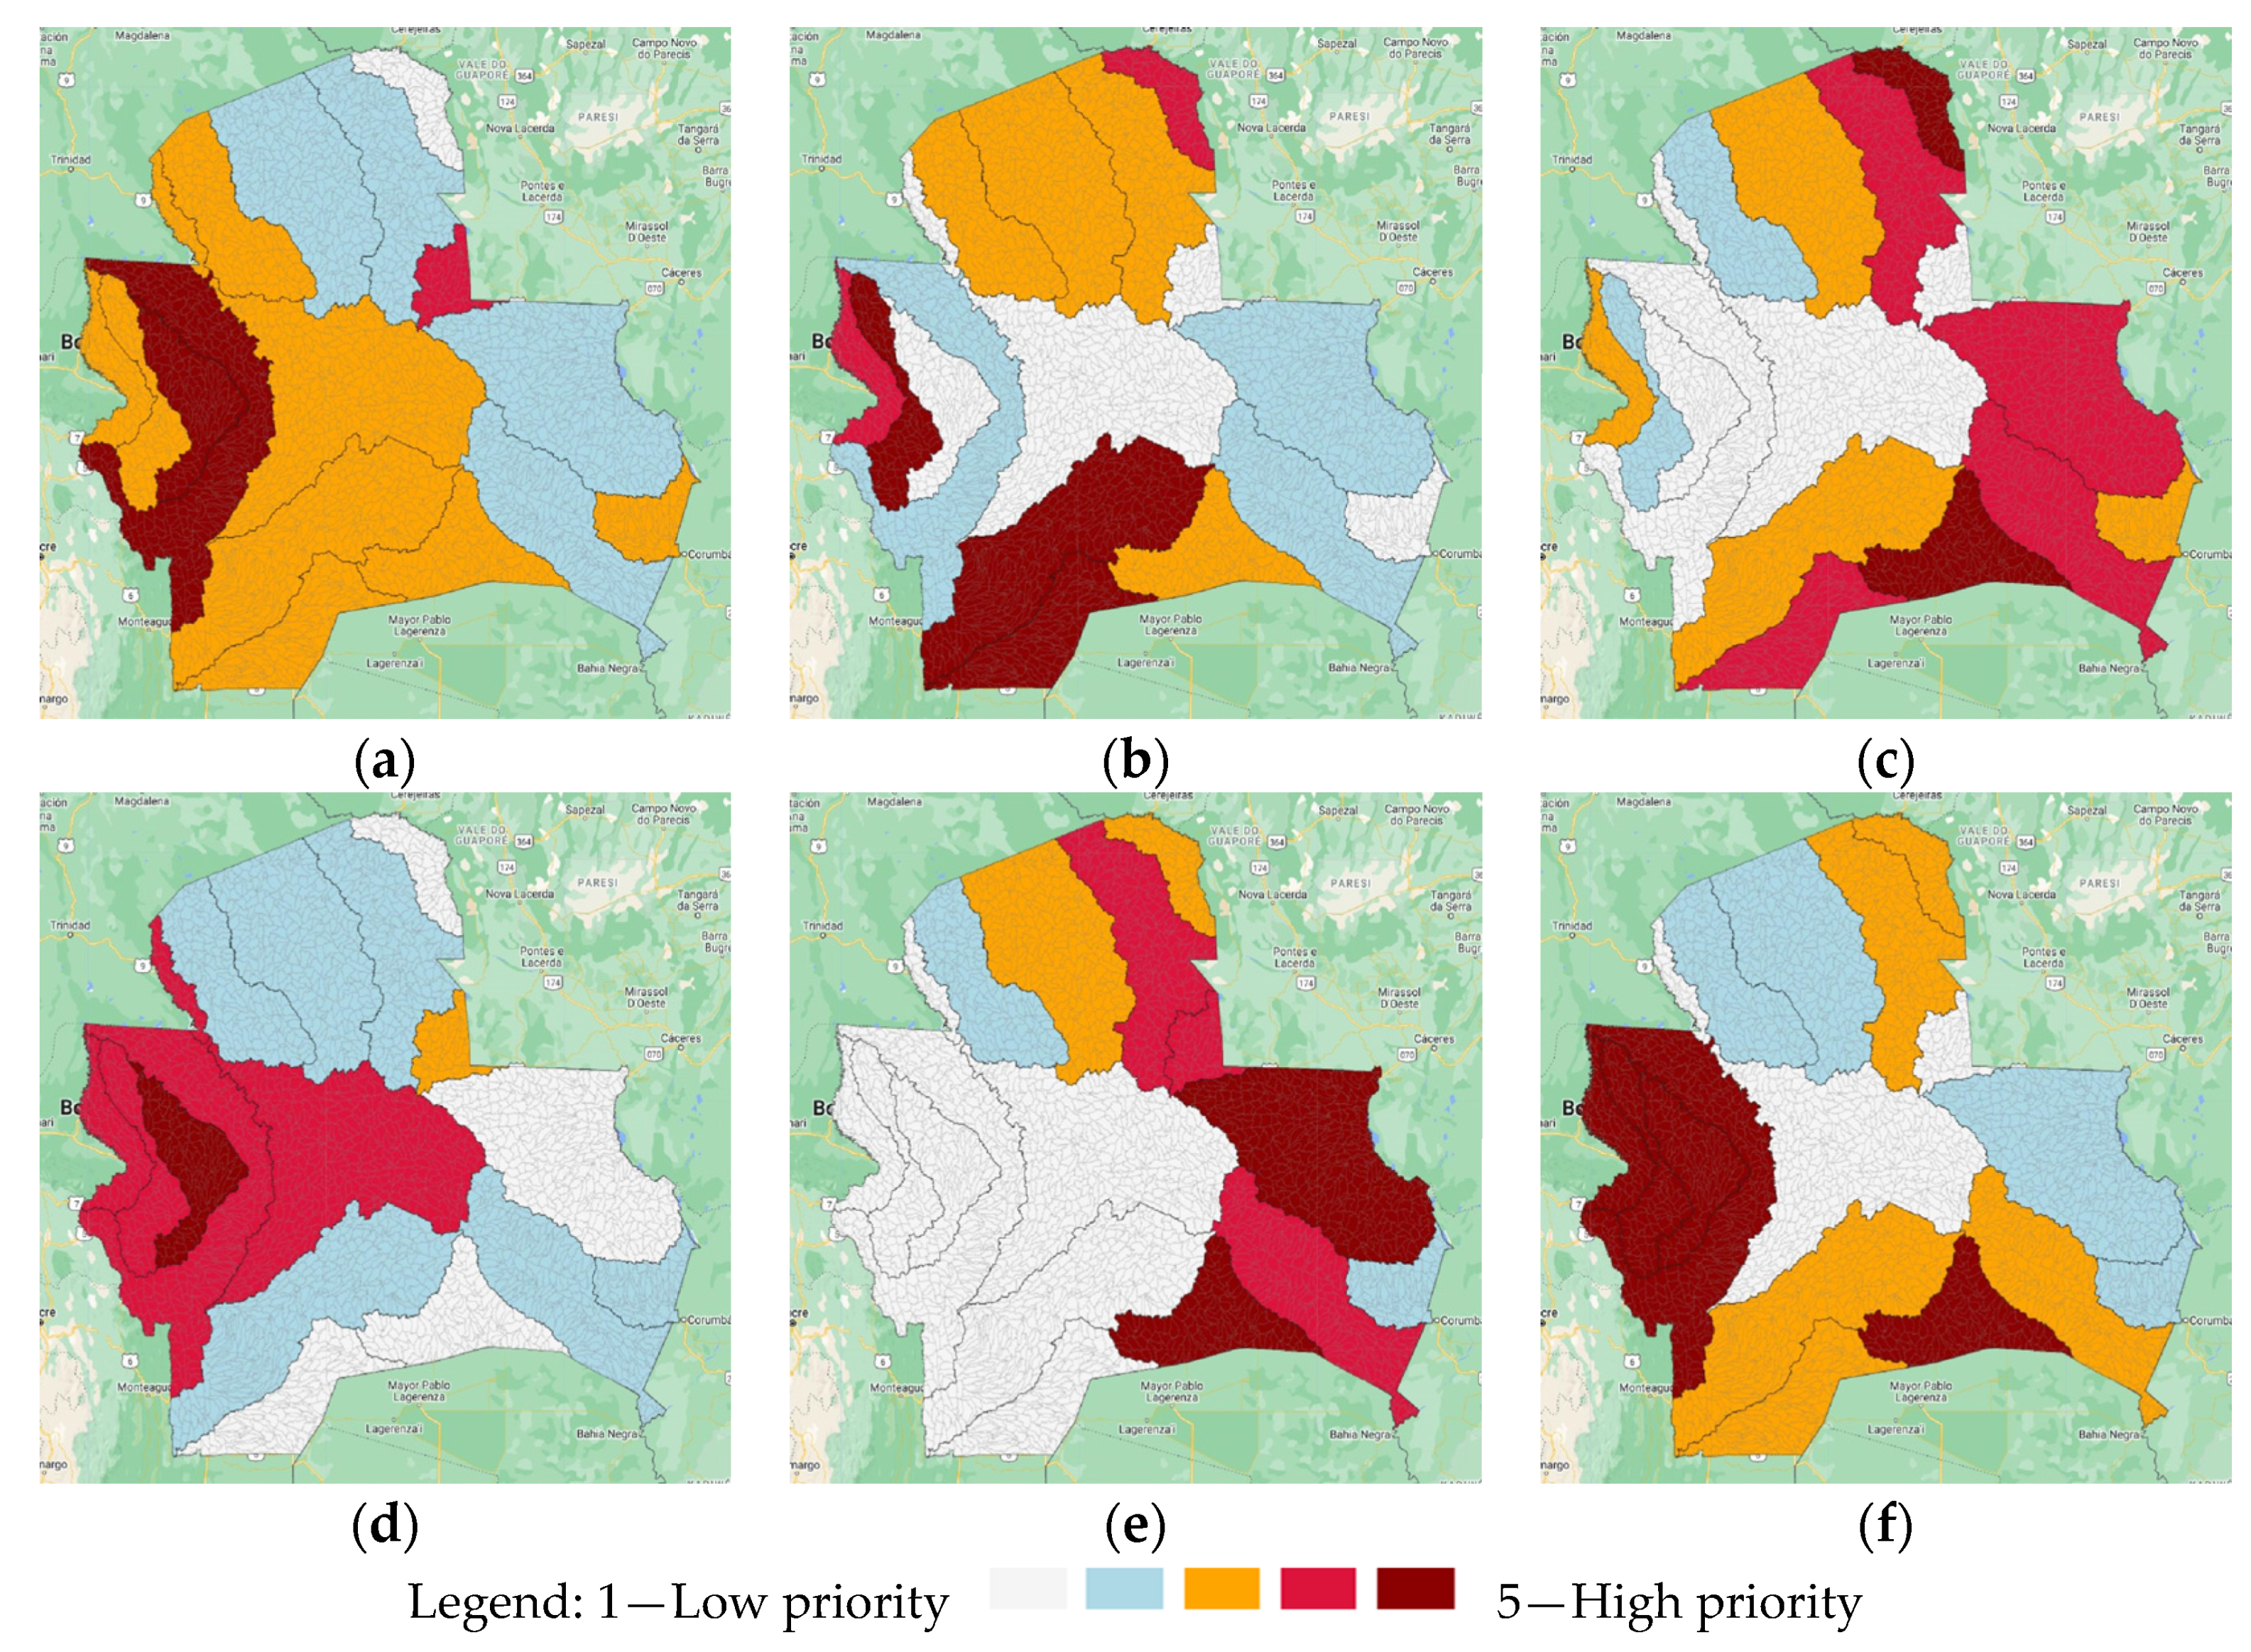
3.2. Priority Watersheds in Santa Cruz

The MCA results give an overview of the priority watersheds for each example scenario considered in this case study. The series of maps in Figure 5 and Figure 6 depict the priority levels of the Santa Cruz watersheds, ranging from very low priority (1—light gray) to very high priority (5—dark red). Figure 5 shows the 12 example scenarios at the microwatershed level and Figure 6 shows six examples at the macrowatershed level.
For scenarios A to F, summary data are provided in Table 4 and Table 5 with information on the number of medium–high-priority watersheds (weighted indicator average >3.4) and the total medium–high-priority area they cover.
Based on scenarios A–E, which correspond to a single indicator group prioritization, it appears that 80 out the 1765 fire-affected microwatersheds in Santa Cruz are important in terms of water resources alone, 156 are a high priority for ecosystems, and 457 are important under existing forms of land management. In terms of threats, 310 microwatersheds are in the vicinity of human activity, infrastructure, or populated centers and 99 were exposed to wildfires in the past four years (Table 4). The priority areas range between 16,061 km2 and 102,756 km2 depending on the prioritized indicator group (between 4% and 28% of the Santa Cruz Department). Compared to the results at the macrowatershed level, which vary between 54,911 km2 and 137,698 km2 (15% to 37% of the department), the area is much smaller, in accordance with the smaller analysis unit (Table 5).
In scenario C—management, the number of medium-high-priority watersheds can be explained by the high ranking given to protected areas by stakeholders in the variable classification process and by the large surface of the Santa Cruz department that is protected at either municipal, regional, or national level. In scenarios A and E, less than 100 microwatersheds have a medium–high importance which is again due to the classification step and the variables considered in the water and ecosystems indicator groups.
Scenario F—all combined shows fewer microwatersheds with a medium–high priority compared to all other scenarios except scenario A. When combining multiple indicator groups, the priority microwatersheds are rather scattered out across the department. This is due to the aggregation and equal weighing of all indicator groups, as well as to the limited spatial overlap between the analysis variables. This tends to give an average priority to all watersheds when combining all criteria equally.

3.3. Importance of Water Resources

The area that is important for water resources, based on scenario A, is primarily located in the western part of Santa Cruz, in particular in the macrowatersheds of Pirai and Rio Grande. These watersheds are also high priority in terms of human impacts due to the proximity with the city of Santa Cruz de la Sierra. In addition, the priority watersheds in scenario A which are located in the middle of the department correspond to areas with more wells and possibly groundwater resources, while in the south-west, the priority watersheds correspond to higher precipitation regions. In terms of overlap with ecosystems and biophysical characteristics, the middle of the map is characterized by the presence of the dry tropical Chiquitano forest and the landscape in the south-west, by a high slope and elevation. The protected areas prioritized in scenario C—management do not overlap with priority areas for water resources. Finally, the watersheds most affected by fires in 2019–2022 (scenario E) do not correspond to the priority watersheds in scenario A, defined by the proximity to surface water, the density of wells, and by the annual rainfall.

3.4. Impacts of the Analysis Unit

The results clearly show the impacts of scale when working with microwatersheds versus macrowatersheds. While at the microwathershed scale, the microwatersheds that were not impacted by fires were filtered out of the analysis, a similar filtering process could not be applied to macrowatersheds as there have been fires in all macrowatersheds, even in Cuevo (less than 1% of the area) (Figure 4). Thus, the entire Cuevo and Parapeti watersheds in the south-west, are ranked as important in prioritization scenario B—ecosystems when only a fraction of the microwatersheds, i.e., a much smaller surface, is included in Figure 5 for the same scenario.
In Scenario F—all combined, the macrowatershed level aggregation does not capture any priorities in the larger watersheds of Curichi Grande, San Julian, San Martin, and Blanco. This is because the macrowatershed’s total area influences the aggregation and the few high-priority microwatersheds no longer appear as important at this scale. The size of the microwatersheds ranges from 0.5 km2 to 3206 km2 (with an average of 230.1 km2 and a standard deviation of 241.8 km2) and the size of the macrowatersheds varies from 6409 km2 to 53,442 km2 (average: 23,048 km2 and standard deviation: 14,496 km2). Thus, the microwatershed unit is a finer scale with less dramatic variations in surface area. It can better capture landscape changes compared to larger management units (macrowatersheds or municipalities).

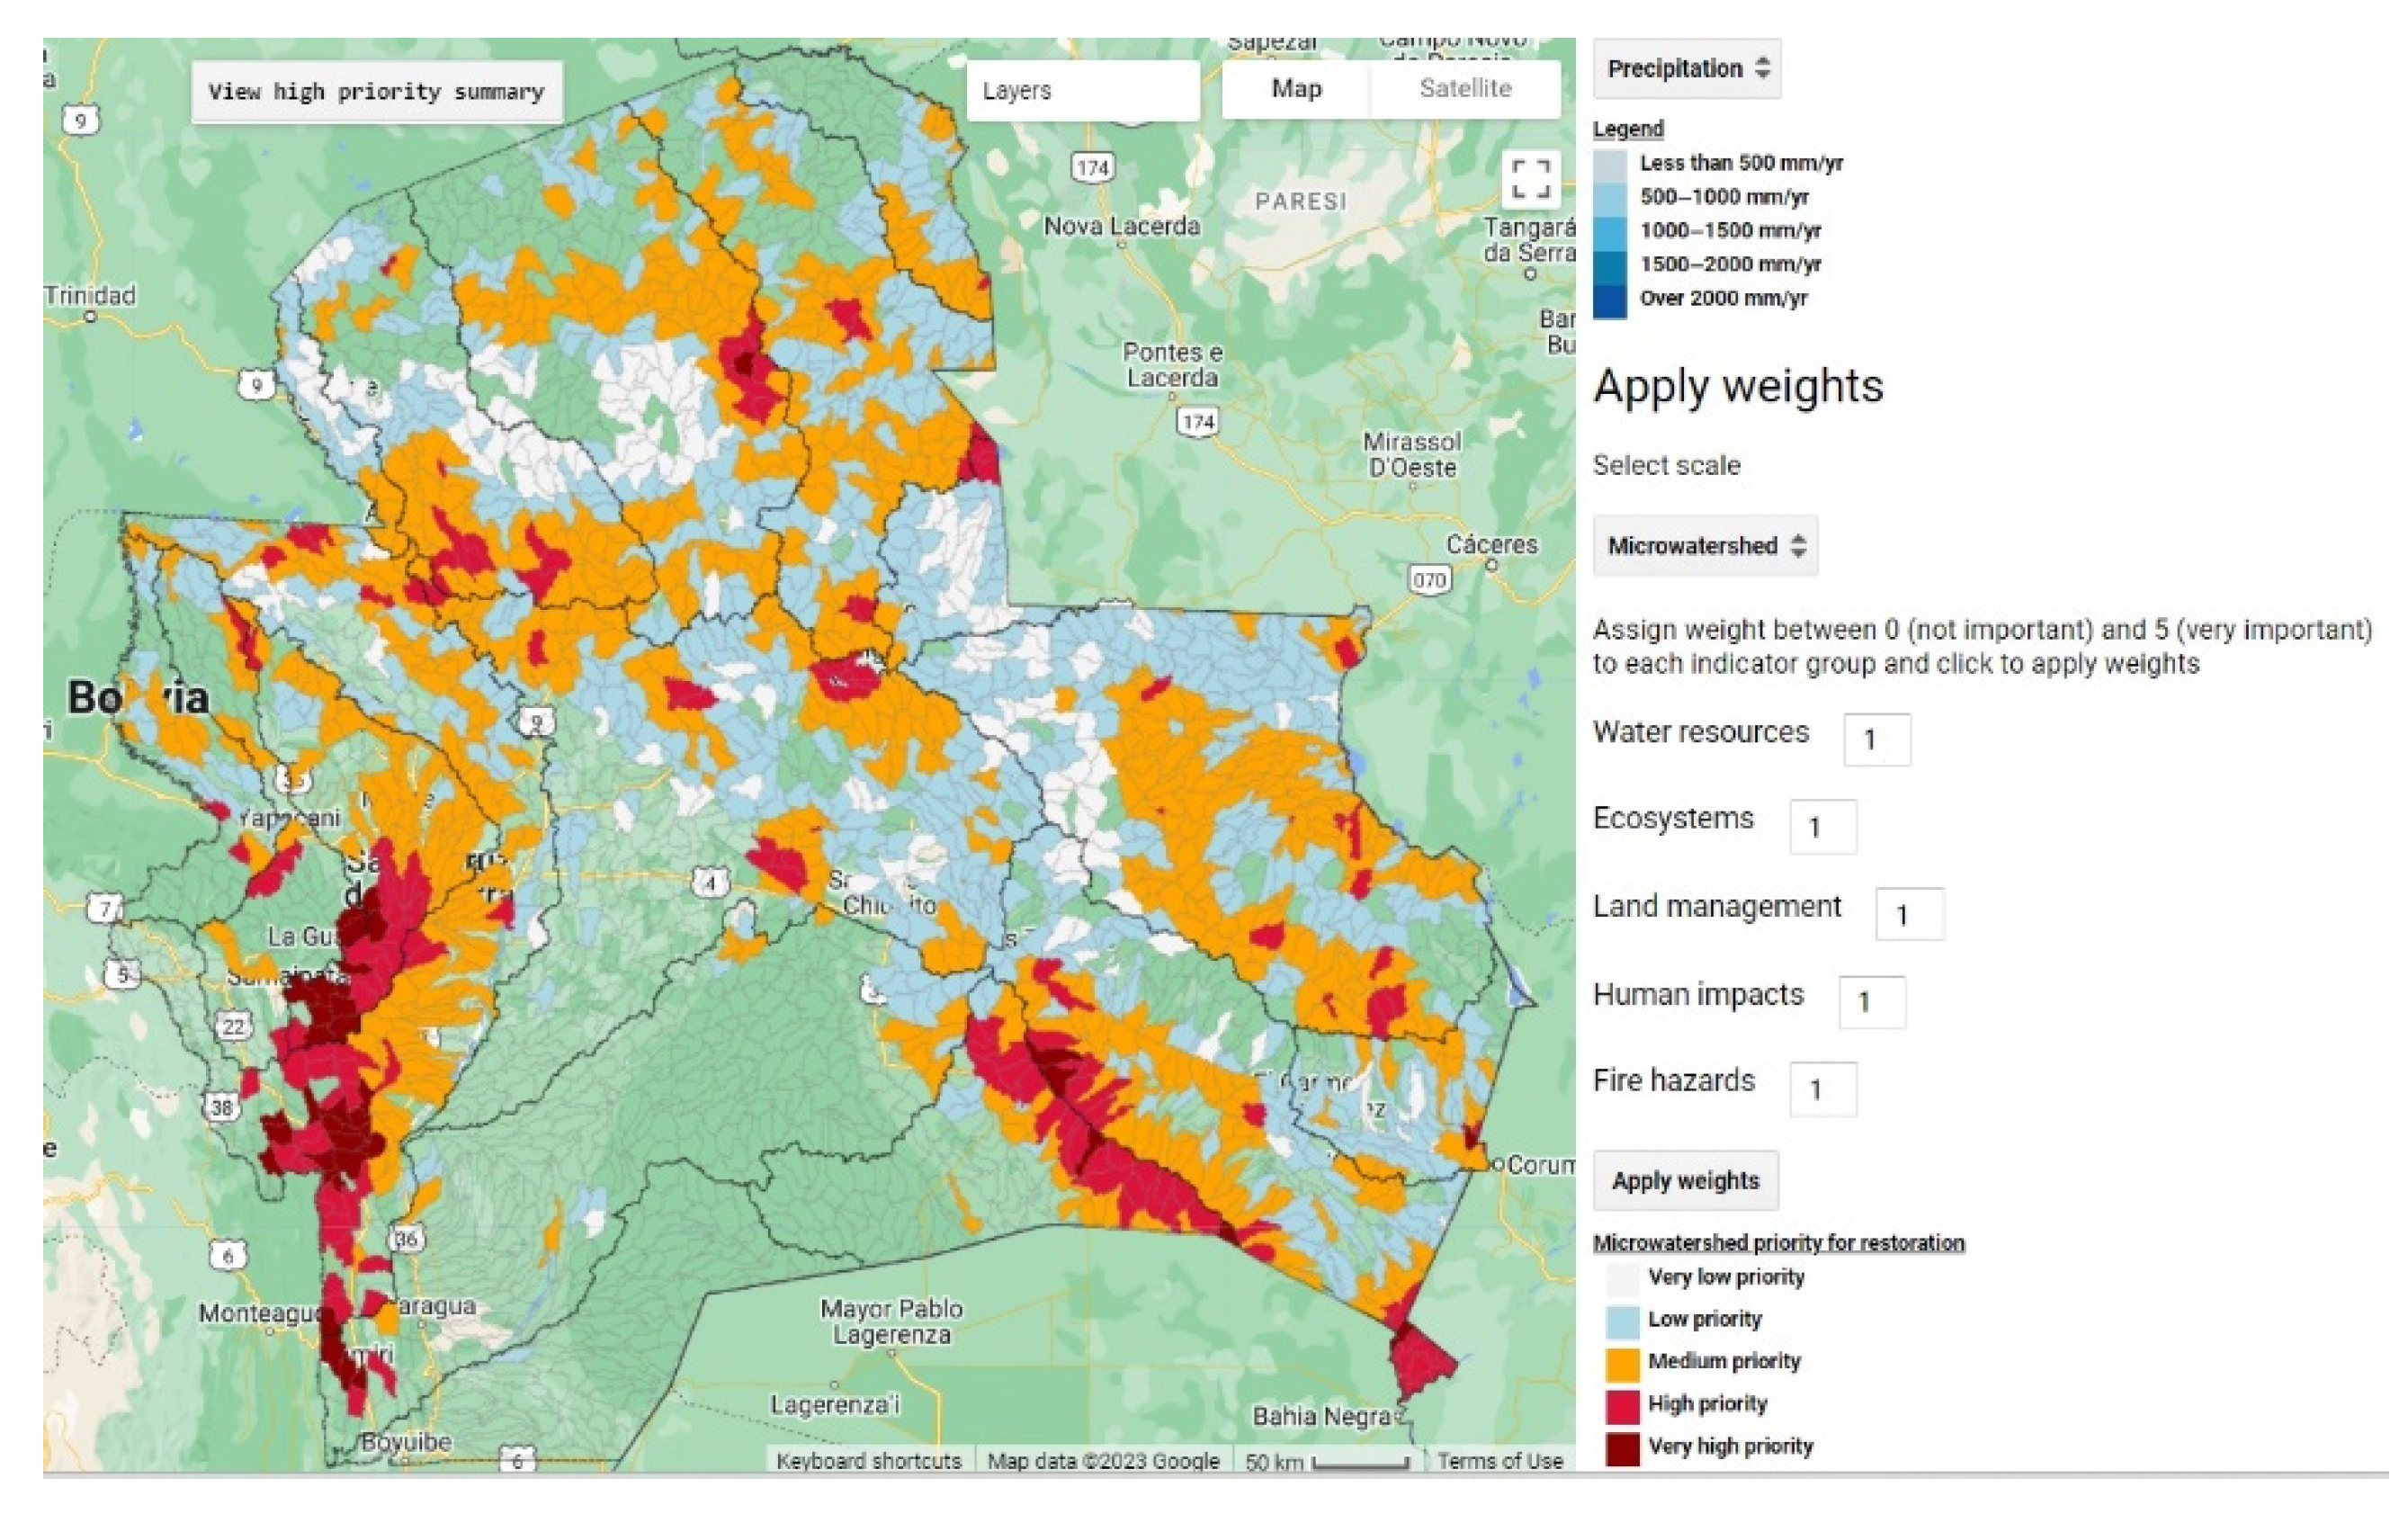
3.5. Online Application

The online GEE application incorporates the key indicators and objectives applied to the watershed prioritization in Santa Cruz. The application includes the set of spatial datasets that were collaboratively selected and that can be combined at the watershed level. As shown in Figure 7, the interface consists of a Google Maps layer, which is centered on the department of Santa Cruz. The user can select spatial datasets to be displayed by clicking on layer names located in the drop-down list, e.g., “Precipitation”. The map and legend are updated according to the chosen indicator.
The main weights can be assigned to the prioritization indicators so that different scenarios can be compared. To assign weights, the user may input values between 0 and 5 into the text boxes. Upon clicking on the “Apply weights’’ button, cloud-based spatial analyses are launched to create a microwatershed or macrowatershed ranking map utilizing the user-defined weights and the selected scale. The watershed ranking for the restoration ranges from low to high priority. When clicking on “View high priority summary’’, the number of medium-to high-priority watersheds and the area they cover are shown.
The running time to load the data layers or to apply weights on a regular computer with a stable internet connection is less than one minute. The application can be accessed online by individuals, both experts and non-experts, without a Google account.

4. Discussion

4.1. Addressing a Need for Integrative Restoration Methodologies

In Bolivia, the restoration of ecosystems impacted by fires is a high priority, in compliance with international commitments and agreements [53]. However, restoration actions and prioritization are usually based on the areas burned annually in each administrative unit and do not consider the multiple indicators that can impact the need for restoration. The current study offers a valuable foundation for prioritizing restoration efforts in the Santa Cruz department in Bolivia, by integrating water resources into restoration planning and aggregating a comprehensive set of indicators at a scale that is relevant to both ecological and hydrological processes [54]. The outcomes have significance for advancing the development of restoration frameworks in Bolivia that are both integrative and aligned with watershed plans.
We mapped areas of importance for water resources, land cover and biophysical parameters, existing land management, proximity to threats from human activities, and exposure to fire hazards. We found that the Curichi Grande, San Martin, Paragua, and Tucabaca macrowatersheds were the most impacted by fires in terms of the cumulative burned area between 2019 and 2022. These four watersheds were the ones most affected by the 2019 fires, according to the GADSC’s post-fire restoration report [31]. Although fires are more frequent in the eastern and south-eastern part of the department, towards the Brazil and Paraguay borders, this does not mean that these are the highest-priority areas for restoration. We found that the priority microwatersheds in terms of water and social factors are located mainly in the west, in the Pirai and Rio Grande watersheds. This confirms that the use of a single criterion to perform prioritization can be highly biased, in accordance with restoration strategies that emphasize the benefits of multiple criteria rather than single objectives [13].
Restoration actions can be ranked at multiple scales from the national to stream-reach level and the ranking can identify either areas for restoration or individual projects [55]. Based on the interest of the stakeholders, we focused on the entire Santa Cruz department. The results show that working at a finer analysis scale (microwatersheds rather than macrowatersheds) could allow for a better representation of the variation in the landscape characteristics. The average microwatershed size in Santa Cruz being over 200 km2, it is clear that this is still a relatively large unit that is not suited for individual projects. Indeed, Scenario F, combining multiple indicator groups, prioritizes 19,905 km2 which is a lot larger than the 575 km2 of land identified for assisted restoration in the GADSC’s pixel-scale analysis [31]. Therefore, our classification of areas for restoration is adequate for prioritizing watersheds at the regional level. It can be considered a preliminary assessment which can be built upon to refine the prioritization of measures within selected watersheds.

4.2. The Participatory MCA Methodology

The application of MCA and a simple WLC approach in GEE proved to be an efficient and flexible solution for the multi-indicator prioritization of watersheds. However, the method presents both advantages and limitations which depend on several factors: the quality of the input information, the scoring, weighting and aggregation processes, and the actors included [56].
First, accessing high-quality datasets representing MCA indicators can be a challenge [13,57]. One of the significant difficulties faced during the MCA was the limited availability of datasets to represent critical indicators such as access to water resources. This reduced our ability to extend existing research that integrates water into restoration prioritization. As in other studies, the proximity to the drainage network was considered [43,58,59]. However, a more systematic mapping of small springs and mountain slopes, which are the main water access points in the rural areas of Santa Cruz and currently are not registered by the National Meteorological and Hydrological Services (SENAMHI), could help refine the water resources indicator. If groundwater recharge maps were available, these could represent groundwater resources better than well density maps.
Researchers have also incorporated water balance and water-quality modeling results into MCA studies [60] and prioritization exercises [61]. In the future, if water cooperatives and communities agree to share the location of water supplies, with water quality and quantity data, and if well-calibrated water balance results are available for the Santa Cruz region, this could greatly improve the main water resources indicator. We expect this would lead to a higher prioritization of the Chiquitano forest, in the west of Santa Cruz, where many fragile water sources are exposed to drought and deforestation [62].
Regarding the WLC technique, its strength is that it is easy to apply and replicate and as such, it is the most common MCA method [63]. The weights in the WLC method represent the importance of an indicator relative to the others and control trade-offs between indicators. Instead of assigning fixed weights to the analysis as in other studies [12,43,45,48], we created scenarios by varying criteria weights to observe the trade-offs.
As described, scenario F combines all the main criteria, some of which have limited overlap in terms of the highly important areas. The resulting priority watersheds are rather scattered out across the department. This illustrates an inherent limitation of the WLC in achieving restoration objectives when there is some incompatibility between concurrent goals [64]. Also, the scenarios that include the management indicator (C and H) were largely controlled by the high ranking of 5 given to protected areas. This is due to the linear operations in the WLC that allow high values from one criterion to compensate for low values in another [65].
In this initial study, we chose simplicity over more complex calculations which are more difficult to communicate to a broad audience [55]. However, the WLC aggregation is often compared to Ordered Weighted Averaging (OWA) which introduces order weights on a location-by-location basis to govern the trade-offs between criteria [15,65,66,67]. Adding OWA operators has been found to bring nuance to the GIS-based restoration scenarios [59,68,69].
Finally, the MCA method presents a certain amount of subjectivity related to the selection and valuation of each criterion. The participatory process is key, but it is not simple, as individuals or institutions may have different motivations or interests [70]. In terms of the criteria identified with stakeholders, these generally corresponded to variables commonly listed in the literature (land cover, protected areas, distance to water bodies, etc.) [21]. During the workshops, stakeholders discussed and ranked variables based on their perceived importance. This means that the ranking process reflects the preferences of the participants and that revisiting the choice of indicators or the ranking of each variable could provide a new prioritization result.
The subjectivity of the MCA method is generally acknowledged and welcomed by scientists and decision-makers, as it enriches the analyses with otherwise overlooked knowledge from the public and from local communities [19,71,72]. Although the participatory approach was successful in collecting useful input from GIS experts and local authorities, the participation in the hybrid workshops was limited to actors who were able to attend either in person, in Santa Cruz de la Sierra, or remotely. Thus, a more robust stakeholder analysis and participation could give a more complete picture of the actors and their interests in ecosystem restoration [44].

4.3. GEE as an Effective Result-Viewing Platform

What does an online interactive tool bring to this spatial analysis? In this study, we used GEE to combine various layers of spatial information and assign main weights to each indicator group in order to obtain and compare different scenarios. The incorporation of adjustable weights helps highlight the complexity of the spatial prioritizing of restoration interventions. The tool was found to be effective in providing decision-makers with a quick and straightforward overview of the challenges associated with the prioritization of restoration efforts, serving as a useful starting point for regional planning discussions. This, as emphasized by Malczewski [63] is the goal of GIS-based decision-making: to generate a shared understanding rather than claim there is a single exact solution.
At this stage, the pre-processing of the datasets (for example, reclassification) was computed in ArcMap. But this step could be directly coded into GEE. The application could also include additional summaries by macrowatershed or by municipality depending on user preferences. Moreover, the grouping of variables into indicator categories limits the number of user-assigned weights to five and the impact of this on the prioritization could be further studied. But what is gained from adding features to restoration prioritization tools must be balanced with simplicity and ease of use considerations [55].
It is obvious that cloud computations require a stable internet network which may not be available to stakeholders in remote areas. Furthermore, the Earth Engine platform imposes a quota per project on the number of simultaneous interactive requests [52]. But overall, in remote working conditions, online applications and web-based solutions allow for interactivity and flexibility [73]. The future of such cloud-based approaches for GIS-based MCA and their incorporation as an element of participatory GIS is promising, especially when local knowledge is included [40].

4.4. Considerations for Future Restoration Studies

Forest restoration has become an effective conservation tool to restore ecological processes as well as to reduce the effects of climate change [74]. Depending on the state of degradation of an ecosystem, a number of management approaches have been proposed, ranging from restoration to natural regeneration, though interventions are subject to the available time frame as well as the financial investments [74]. This study considers restoration preferences, but the criteria were not translated into economic values. In practice, cost-effective restoration needs to balance the benefits (landscape connectivity, carbon storage, biodiversity, etc.) with the associated costs [75]. In the case of watersheds, successful restoration planning also depends on whether the conceptual framework takes into account the functional interactions, at all spatial levels, within the river landscape system, as well as nutrient exchange processes and effects on natural habitats and biota [76]. For this purpose, MCA may be combined with economic assessments and complementary tools such as Cost–Benefit Analysis (CBA) [77].
Though large-scale studies of restoration benefits provide arguments for increased investments [78], there are many unanswered questions about the economic impacts of dry forest restoration in Latin America [79], especially given that the cost-effectiveness of active restoration depends on how non-market benefits to communities and ecosystems are measured compared to productive activities [80]. To translate our study into concrete recommendations for the Santa Cruz department, it would be valuable to expand the input from local stakeholders and better account for ecosystem services and practical and economic feasibility [13,14,54].

5. Conclusions

The proposed prioritization methodology using multi-criteria analysis (MCA) can be regarded as an effective and easily reproducible approach to forest and ecosystem restoration. The prioritization results can support regional decision-makers in the Santa Cruz department, Bolivia, in planning protection and restoration actions in affected or at-risk watersheds. The web-based tool built in Google Earth Engine (GEE), a spatial analysis platform that provides spatial analytical capacity in the cloud, enables users to visualize various land and water resources datasets and to select the priority indicators and aggregation scale (microwatershed or macrowatershed). It then classifies watersheds based on the indicators and user-defined weights, which represent the importance of each indicator for the prioritization. Though still a prototype, the tool could be further developed with additional input from local stakeholders, with enhanced land cover and fire risk data, as well as with a more comprehensive modeling of water resources in the region. A limitation of this study is that it does not consider the economic impacts of restoration. Future research should consider the feasibility and cost–benefits of ecosystem restoration, which would allow for more advanced policy-planning. In conclusion, the use of collaborative methods to prioritize watersheds for restoration has the potential to support effective decision-making processes and to guide watershed restoration plans in Bolivia and in other fire-prone regions globally.

Author Contributions

Conceptualization, J.F.; methodology, J.F. and O.M.; GIS data collection and processing, O.M. and G.U.; GEE visualization, J.F.; workshop facilitation, O.M., G.U. and J.F.; writing—original draft preparation, J.F.; writing—review and editing, O.M. and M.G.-R.; project administration, M.E.; funding acquisition, M.E. All authors have read and agreed to the published version of the manuscript.

Funding

This study was funded by the Swedish International Development Cooperation Agency, under the Stockholm Environment Institute program ‘Wash thinking connected to Hydrology’ (WATCH) (SE-0-SE-6-11972A0102-BOL-14020). One of the workshops for local experts and stakeholders was conducted with funding from the Government of Canada under the Knowledge Bases for Restoration-III project (Restauracción). In addition, the Fundación para la Conservación del Bosque Chiquitano supported the production of this research article.

Data Availability Statement

The datasets used in the GEE application are publicly available through the GEE platform. The application script is available on demand.

Acknowledgments

We would like to thank the WATCH project team and collaborators, including Bart Wickel and Yesica Rodríguez, and especially Roberto Vides, Rosa Leny Cuellar, Marcio Flores, Gilka Michme, and Álvaro Chevalier. We would also like to thank the representatives of civil society and non-profit organizations, experts in water and natural resource management, environmental planning, and representatives of the GADSC and municipal governments, who participated in the consultations and discussions on the use of the prioritization tool.

Conflicts of Interest

The authors certify there is no conflict of interest.

References

  1. Aguilar Barajas, I.; Mahlknecht, J.; Kaledin, J.; Kjellén, M.; Mejía-Betancourt, A. (Eds.) Water and Cities in Latin America: Challenges for Sustainable Development; Earthscan studies in water resource management; Routledge, Taylor & Francis Group, Earthscan from Routledge: London, UK, 2015; ISBN 978-0-415-73097-6. [Google Scholar]
  2. Bezerra, M.O.; Vollmer, D.; Acero, N.; Marques, M.C.; Restrepo, D.; Mendoza, E.; Coutinho, B.; Encomenderos, I.; Zuluaga, L.; Rodríguez, O.; et al. Operationalizing Integrated Water Resource Management in Latin America: Insights from Application of the Freshwater Health Index. Environ. Manag. 2022, 69, 815–834. [Google Scholar] [CrossRef] [PubMed]
  3. San Martin, O. Water Resources in Latin America and the Caribbean: Issues and Options. In Proceedings of the Inter-American Development Bank’s Annual Meeting (Volume 7), Fortaleza, Brazil, 7 March 2002; Available online: https://citeseerx.ist.psu.edu/document?repid=rep1&type=pdf&doi=01e457d61c85e24865d258462fe0284a5376778b (accessed on 28 July 2023).
  4. Armenteras, D.; Dávalos, L.M.; Barreto, J.S.; Miranda, A.; Hernández-Moreno, A.; Zamorano-Elgueta, C.; González-Delgado, T.M.; Meza-Elizalde, M.C.; Retana, J. Fire-Induced Loss of the World’s Most Biodiverse Forests in Latin America. Sci. Adv. 2021, 7, eabd3357. [Google Scholar] [CrossRef] [PubMed]
  5. Newbold, T.; Hudson, L.N.; Hill, S.L.L.; Contu, S.; Lysenko, I.; Senior, R.A.; Börger, L.; Bennett, D.J.; Choimes, A.; Collen, B.; et al. Global Effects of Land Use on Local Terrestrial Biodiversity. Nature 2015, 520, 45–50. [Google Scholar] [CrossRef]
  6. Kaushal, S.; Gold, A.; Mayer, P. Land Use, Climate, and Water Resources—Global Stages of Interaction. Water 2017, 9, 815. [Google Scholar] [CrossRef]
  7. Návar, J. Modeling Rainfall Interception Loss Components of Forests. J. Hydrol. 2020, 584, 124449. [Google Scholar] [CrossRef]
  8. Kayitesi, N.M.; Guzha, A.C.; Mariethoz, G. Impacts of Land Use Land Cover Change and Climate Change on River Hydro-Morphology- a Review of Research Studies in Tropical Regions. J. Hydrol. 2022, 615, 128702. [Google Scholar] [CrossRef]
  9. Yang, W.; Liu, Y.; Ou, C.; Gabor, S. Examining Water Quality Effects of Riparian Wetland Loss and Restoration Scenarios in a Southern Ontario Watershed. J. Environ. Manag. 2016, 174, 26–34. [Google Scholar] [CrossRef] [PubMed]
  10. Ellison, D.; Morris, C.E.; Locatelli, B.; Sheil, D.; Cohen, J.; Murdiyarso, D.; Gutierrez, V.; Noordwijk, M.V.; Creed, I.F.; Pokorny, J.; et al. Trees, Forests and Water: Cool Insights for a Hot World. Glob. Environ. Change 2017, 43, 51–61. [Google Scholar] [CrossRef]
  11. Souza-Alonso, P.; Saiz, G.; García, R.A.; Pauchard, A.; Ferreira, A.; Merino, A. Post-Fire Ecological Restoration in Latin American Forest Ecosystems: Insights and Lessons from the Last Two Decades. For. Ecol. Manag. 2022, 509, 120083. [Google Scholar] [CrossRef]
  12. Valente, R.A.; de Mello, K.; Metedieri, J.F.; Américo, C. A Multicriteria Evaluation Approach to Set Forest Restoration Priorities Based on Water Ecosystem Services. J. Environ. Manag. 2021, 285, 112049. [Google Scholar] [CrossRef]
  13. Orsi, F.; Geneletti, D. Identifying Priority Areas for Forest Landscape Restoration in Chiapas (Mexico): An Operational Approach Combining Ecological and Socioeconomic Criteria. Landsc. Urban Plan. 2010, 94, 20–30. [Google Scholar] [CrossRef]
  14. Uribe, D.; Geneletti, D.; Del Castillo, R.; Orsi, F. Integrating Stakeholder Preferences and GIS-Based Multicriteria Analysis to Identify Forest Landscape Restoration Priorities. Sustainability 2014, 6, 935–951. [Google Scholar] [CrossRef]
  15. Malczewski, J.; Rinner, C. Multicriteria Decision Analysis in Geographic Information Science; Advances in Geographic Information Science; Springer: Berlin/Heidelberg, Germany, 2015; ISBN 978-3-540-74756-7. [Google Scholar]
  16. Newton, A.C.; Tejedor, N. Principles and Practice of Forest Landscape Restoration: Case Studies from the Drylands of Latin America; International Union for Conservation of Nature and Natural Resources: Gland, Switzerland, 2011; ISBN 978-2-8317-1340-3. [Google Scholar]
  17. Lackey, R.T. Values, Policy, and Ecosystem Health. BioScience 2001, 51, 437. [Google Scholar] [CrossRef]
  18. Santini, N.S.; Miquelajauregui, Y. The Restoration of Degraded Lands by Local Communities and Indigenous Peoples. Front. Conserv. Sci. 2022, 3, 873659. [Google Scholar] [CrossRef]
  19. Katirtzidou, M.; Skoulikaris, C.; Makris, C.; Baltikas, V.; Latinopoulos, D.; Krestenitis, Y. Modeling Stakeholders’ Perceptions in Participatory Multi-Risk Assessment on a Deltaic Environment Under Climate Change Conditions. Environ. Model. Assess. 2023, 28, 367–388. [Google Scholar] [CrossRef]
  20. Geneletti, D. Formalising Expert Opinion through Multi-Attribute Value Functions: An Application in Landscape Ecology. J. Environ. Manag. 2005, 76, 255–262. [Google Scholar] [CrossRef]
  21. Orsi, F.; Geneletti, D.; Newton, A.C. Towards a Common Set of Criteria and Indicators to Identify Forest Restoration Priorities: An Expert Panel-Based Approach. Ecol. Indic. 2011, 11, 337–347. [Google Scholar] [CrossRef]
  22. Moore, I.D.; Grayson, R.B.; Ladson, A.R. Digital Terrain Modelling: A Review of Hydrological, Geomorphological, and Biological Applications. Hydrol. Process. 1991, 5, 3–30. [Google Scholar] [CrossRef]
  23. Skoulikaris, C. Toponyms: A Neglected Asset within the Water Framework and Flood Directives Implementation Process; the Case Study of Greece. Acta Geophys. 2022, 71, 1801–1815. [Google Scholar] [CrossRef]
  24. Gumma, M.; Birhanu, B.; Mohammed, I.; Tabo, R.; Whitbread, A. Prioritization of Watersheds across Mali Using Remote Sensing Data and GIS Techniques for Agricultural Development Planning. Water 2016, 8, 260. [Google Scholar] [CrossRef]
  25. Javed, A.; Khanday, M.Y.; Ahmed, R. Prioritization of Sub-Watersheds Based on Morphometric and Land Use Analysis Using Remote Sensing and GIS Techniques. J. Indian Soc. Remote Sens. 2009, 37, 261–274. [Google Scholar] [CrossRef]
  26. Kumar, D.; Dhaloiya, A.; Nain, A.S.; Sharma, M.P.; Singh, A. Prioritization of Watershed Using Remote Sensing and Geographic Information System. Sustainability 2021, 13, 9456. [Google Scholar] [CrossRef]
  27. Lima-Quispe, N.; Coleoni, C.; Rincón, W.; Gutierrez, Z.; Zubieta, F.; Nuñez, S.; Iriarte, J.; Saldías, C.; Purkey, D.; Escobar, M.; et al. Delving into the Divisive Waters of River Basin Planning in Bolivia: A Case Study in the Cochabamba Valley. Water 2021, 13, 190. [Google Scholar] [CrossRef]
  28. Maillard, O. Post-Fire Natural Regeneration Trends in Bolivia: 2001–2021. Fire 2023, 6, 18. [Google Scholar] [CrossRef]
  29. Devisscher, T.; Vignola, R.; Coll Besa, M.; Cronenbold, R.; Pacheco, N.; Schillinger, R.; Canedi, V.; Sandoval, C.; Gonzalez, D.; Leclerc, G. Understanding the Socio-Institutional Context to Support Adaptation for Future Water Security in Forest Landscapes. Ecol. Soc. 2016, 21, art48. [Google Scholar] [CrossRef]
  30. Maillard, O.; Herzog, S.K.; Soria-Auza, R.W.; Vides-Almonacid, R. Impact of Fires on Key Biodiversity Areas (KBAs) and Priority Bird Species for Conservation in Bolivia. Fire 2022, 5, 4. [Google Scholar] [CrossRef]
  31. Gobierno Autónomo Departamental de Santa Cruz. Plan Estratégico Para La Implementación Del Plan de Recuperación de Las Áreas Afectadas Por Los Incendios En El Departamento de Santa Cruz; Gobierno Departamental de Santa Cruz-Secretaría de Desarrollo Sostenible y Medio Ambiente-FCBC-PNUD: Santa Cruz, Bolivia, 2020; p. 172. [Google Scholar]
  32. Uyuni, G.; Maillard, O.; Azurduy, H.; Flores-Valencia, M.; Michme, G.; Vides-Almonacid, R. Identificación de áreas prioritarias para la restauración asistida en bosques afectados por incendios forestales en el departamento de Santa Cruz, Bolivia. Ecol. En Boliv. 2023, 58, 64–77. [Google Scholar]
  33. INE. Censo de Poblacion y Vivienda. Available online: https://www.ine.gob.bo/ (accessed on 10 May 2023).
  34. Asquith, N.; Vargas, M.T. Fair Deals for Watershed Services in Bolivia; International Institute for Environment and Development: London, UK, 2007; ISBN 978-1-84369-647-6. [Google Scholar]
  35. Gobierno Autónomo Departamental de Santa Cruz. Delimitación y Codificación de las Unidades Hidrográficas del Departamento de Santa Cruz; Servicio de Cuencas-SEARPI: Santa Cruz, Bolivia, 2011. [Google Scholar]
  36. Ibisch, P.L.; Mérida Coimbra, G. (Eds.) Biodiversidad: La Riqueza de Bolivia: Estado de Conocimiento y Conservación, 1st ed.; FAN: Santa Cruz de la Sierra, Bolivia, 2003; ISBN 978-99905-66-25-3. [Google Scholar]
  37. Vides-Almonacid, R.; Reichle, S.; Padilla, F. Planificación Ecorregional Del Bosque Seco Chiquitano; FCBC-TNC: Santa Cruz, Bolivia, 2007. [Google Scholar]
  38. Maillard, O.; Vides-Almonacid, R.; Flores-Valencia, M.; Coronado, R.; Vogt, P.; Vicente-Serrano, S.M.; Azurduy, H.; Anívarro, R.; Cuellar, R.L. Relationship of Forest Cover Fragmentation and Drought with the Occurrence of Forest Fires in the Department of Santa Cruz, Bolivia. Forests 2020, 11, 910. [Google Scholar] [CrossRef]
  39. Anívarro, R.; Azurduy, H.; Maillard, O.; Markos, A. Diagnóstico por Teledetección de áreas Quemadas en la Chiquitania; Observatorio Bosque Seco Chiquitano, Fundación para la Conservación del Bosque Chiquitano: Santa Cruz, Bolivia, 2019; p. 70. [Google Scholar]
  40. Greene, R.; Devillers, R.; Luther, J.E.; Eddy, B.G. GIS-Based Multiple-Criteria Decision Analysis: GIS-Based MCDA. Geogr. Compass 2011, 5, 412–432. [Google Scholar] [CrossRef]
  41. Ryan, S.; Nimick, E. Multi-Criteria Decision Analysis and GIS. Available online: https://storymaps.arcgis.com/stories/b60b7399f6944bca86d1be6616c178cf (accessed on 7 June 2023).
  42. Mansourian, S. Overview of Forest Restoration Strategies and Terms. In Forest Restoration in Landscapes: Beyond Planting Trees; Mansourian, S., Vallauri, D., Dudley, N., Eds.; Springer: New York, NY, USA, 2005; pp. 8–13. ISBN 978-0-387-29112-3. [Google Scholar]
  43. Valente, R.A.; Petean, F.C.D.S.; Vettorazzi, C.A. Multicriteria Decision Analysis for Prioritizing Areas for Forest Restoration. Cerne 2017, 23, 53–60. [Google Scholar] [CrossRef]
  44. Ianni, E.; Geneletti, D. Applying the Ecosystem Approach to Select Priority Areas for Forest Landscape Restoration in the Yungas, Northwestern Argentina. Environ. Manag. 2010, 46, 748–760. [Google Scholar] [CrossRef] [PubMed]
  45. Salomão, C.D.S.C.; De Souza Paula, L.G.; Elmiro, M.A.T. Use of Multicriteria Analysis to Define Priority Areas for Reforestation in the Piranga River Basin, MG, Brazil. Sustain. Debate 2020, 11, 95–120. [Google Scholar] [CrossRef]
  46. Hartung, M.; Carreño-Rocabado, G.; Peña-Claros, M.; Van Der Sande, M.T. Tropical Dry Forest Resilience to Fire Depends on Fire Frequency and Climate. Front. For. Glob. Change 2021, 4, 755104. [Google Scholar] [CrossRef]
  47. Dudley, N.; Stolton, S. Protected Landscapes and Wild Biodiversity; IUCN: Gland, Switzerland, 2012; ISBN 978-2-8317-1470-7. [Google Scholar]
  48. Silva, T.C.M.; Vieira, I.C.G. Identification of Priority Areas for Ecological Restoration in Eastern Pará, Brazil. Floresta Ambiente 2020, 27, e20180144. [Google Scholar] [CrossRef]
  49. Schwaida, S.F.; Cicerelli, R.E.; De Almeida, T.; Sano, E.E.; Pires, C.H.; Ramos, A.P.M. Defining Priorities Areas for Biodiversity Conservation and Trading Forest Certificates in the Cerrado Biome in Brazil. Biodivers. Conserv. 2023, 32, 1807–1820. [Google Scholar] [CrossRef]
  50. Voogd, J.H. Multicriteria Evaluation for Urban and Regional Planning. Ph.D. Thesis, Eindhoven University of Technology, Eindhoven, The Netherlands, 1982. [Google Scholar]
  51. Phua, M.-H.; Minowa, M. A GIS-Based Multi-Criteria Decision Making Approach to Forest Conservation Planning at a Landscape Scale: A Case Study in the Kinabalu Area, Sabah, Malaysia. Landsc. Urban Plan. 2005, 71, 207–222. [Google Scholar] [CrossRef]
  52. Earth Engine Apps. Google Earth Engine. Available online: https://developers.google.com/earth-engine/guides (accessed on 7 June 2023).
  53. FAO; UNEP. The State of the World’s Forests 2020. Forests, Biodiversity and People; FAO and UNEP: Rome, Italy, 2020; ISBN 978-92-5-132419-6. [Google Scholar]
  54. Smith, K.; Kelsey, R.; Biswas, T.; McColl, C.; Wilson, K.; Cameron, D. Regional Prioritization of Forest Restoration across California’s Sierra Nevada; The Nature Conservancy: Sacramento, CA, USA, 2017; p. 16. [Google Scholar]
  55. Roni, P.; Beechie, T.; Schmutz, S.; Muhar, S. Prioritization of Watersheds and Restoration Projects. In Stream and Watershed Restoration: A Guide to Restoring Riverine Processes and Habitats; Roni, P., Beechie, T., Eds.; Wiley: Hoboken, NJ, USA, 2012; pp. 189–214. ISBN 978-1-4051-9955-1. [Google Scholar]
  56. Gamboa, G.; Otero, I.; Bueno, C.; Arilla, E.; Ballart, H.; Camprubí, L.; Canaleta, G.; Tolosa, G.; Castellnou, M. Participatory Multi-Criteria Evaluation of Landscape Values to Inform Wildfire Management. J. Environ. Manag. 2023, 327, 116762. [Google Scholar] [CrossRef] [PubMed]
  57. Derak, M.; Silva, E.; Climent-Gil, E.; Bonet, A.; López, G.; Cortina-Segarra, J. Multicriteria Analysis of Critical Areas for Restoration in a Semiarid Landscape: A Comparison between Stakeholder Groups. J. Environ. Manag. 2023, 336, 117545. [Google Scholar] [CrossRef]
  58. Valente, R.A.; Vettorazzi, C.A. Multicriteria Evaluation in the Definition of Priority Areas for Forest Restoration Aiming at the Sustainable Water Management. In Sustainable Water Management in the Tropics and Subtropics-and Case Studies in Brazil; Fundação Universidade Federal do Pampa, UNIKASSEL, PGCult-UFMA: Jaguarao, Brazil, 2011; ISBN 978-85-63337-20-7. [Google Scholar]
  59. Noth, T.; Rinner, C. Prioritization in Wildfire Restoration Using GIS-Based Ordered Weighted Averaging (OWA): A Case Study in Southern California. AIMS Environ. Sci. 2021, 8, 481–497. [Google Scholar] [CrossRef]
  60. Ahn, S.-R.; Kim, S.-J. Assessment of Watershed Health, Vulnerability and Resilience for Determining Protection and Restoration Priorities. Environ. Model. Softw. 2019, 122, 103926. [Google Scholar] [CrossRef]
  61. Comín, F.A.; Sorando, R.; Darwiche-Criado, N.; García, M.; Masip, A. A Protocol to Prioritize Wetland Restoration and Creation for Water Quality Improvement in Agricultural Watersheds. Ecol. Eng. 2014, 66, 10–18. [Google Scholar] [CrossRef]
  62. Maillard, O.; Salinas, J.C.; Angulo, S.; Vides-Almonacid, R. Riesgos ambientales en las unidades hidrográficas de las serranías chiquitanas, departamento de Santa Cruz, Bolivia. Ecol. Boliv. 2019, 54, 83–95. [Google Scholar]
  63. Malczewski, J. On the Use of Weighted Linear Combination Method in GIS: Common and Best Practice Approaches. Trans. GIS 2000, 4, 5–22. [Google Scholar] [CrossRef]
  64. Vogler, K.C.; Ager, A.A.; Day, M.A.; Jennings, M.; Bailey, J.D. Prioritization of Forest Restoration Projects: Tradeoffs between Wildfire Protection, Ecological Restoration and Economic Objectives. Forests 2015, 6, 4403–4420. [Google Scholar] [CrossRef]
  65. Jiang, H.; Eastman, J.R. Application of Fuzzy Measures in Multi-Criteria Evaluation in GIS. Int. J. Geogr. Inf. Sci. 2000, 14, 173–184. [Google Scholar] [CrossRef]
  66. Malczewski, J.; Chapman, T.; Flegel, C.; Walters, D.; Shrubsole, D.; Healy, M.A. GIS–Multicriteria Evaluation with Ordered Weighted Averaging (OWA): Case Study of Developing Watershed Management Strategies. Environ. Plan. Econ. Space 2003, 35, 1769–1784. [Google Scholar] [CrossRef]
  67. Yager, R.R. On Ordered Weighted Averaging Aggregation Operators in Multicriteria Decisionmaking. IEEE Trans. Syst. Man Cybern. 1988, 18, 183–190. [Google Scholar] [CrossRef]
  68. Lopes, T.R.; Moura, L.B.; Nascimento, J.G.; Fraga Junior, L.S.; Zolin, C.A.; Duarte, S.N.; Folegatti, M.V.; Santos, O.N.A. Priority Areas for Forest Restoration Aiming at the Maintenance of Water Resources in a Basin in the Cerrado/Amazon Ecotone, Brazil. J. S. Am. Earth Sci. 2020, 101, 102630. [Google Scholar] [CrossRef]
  69. Vettorazzi, C.A.; Valente, R.A. Priority Areas for Forest Restoration Aiming at the Conservation of Water Resources. Ecol. Eng. 2016, 94, 255–267. [Google Scholar] [CrossRef]
  70. Metzger, J.P.; Esler, K.; Krug, C.; Arias, M.; Tambosi, L.; Crouzeilles, R.; Acosta, A.L.; Brancalion, P.H.; D’Albertas, F.; Duarte, G.T.; et al. Best Practice for the Use of Scenarios for Restoration Planning. Curr. Opin. Environ. Sustain. 2017, 29, 14–25. [Google Scholar] [CrossRef]
  71. Powers, J.S. Opportunities for Integrating Social Science into Research on Dry Forest Restoration: A Mini-Review. Sustainability 2022, 14, 7351. [Google Scholar] [CrossRef]
  72. Gamper, C.D.; Turcanu, C. Can Public Participation Help Managing Risks from Natural Hazards? Saf. Sci. 2009, 47, 522–528. [Google Scholar] [CrossRef]
  73. Morales, N.S.; Fernández, I.C.; Durán, L.P.; Pérez-Martínez, W.A. RePlant Alfa: Integrating Google Earth Engine and R Coding to Support the Identification of Priority Areas for Ecological Restoration. Land 2023, 12, 303. [Google Scholar] [CrossRef]
  74. Chazdon, R.L. Beyond Deforestation: Restoring Forests and Ecosystem Services on Degraded Lands. Science 2008, 320, 1458–1460. [Google Scholar] [CrossRef] [PubMed]
  75. Molin, P.G.; Chazdon, R.; Frosini De Barros Ferraz, S.; Brancalion, P.H.S. A Landscape Approach for Cost-effective Large-scale Forest Restoration. J. Appl. Ecol. 2018, 55, 2767–2778. [Google Scholar] [CrossRef]
  76. Muhar, S.; Sendzimir, J.; Jungwirth, M.; Hohensinner, S. Restoration in Integrated River Basin Management. In Riverine Ecosystem Management; Schmutz, S., Sendzimir, J., Eds.; Springer International Publishing: Cham, Switzerland, 2018; pp. 273–299. ISBN 978-3-319-73249-7. [Google Scholar]
  77. Gamper, C.D.; Thöni, M.; Weck-Hannemann, H. A Conceptual Approach to the Use of Cost Benefit and Multi Criteria Analysis in Natural Hazard Management. Nat. Hazards Earth Syst. Sci. 2006, 6, 293–302. [Google Scholar] [CrossRef]
  78. Verdone, M.; Seidl, A. Time, Space, Place, and the Bonn Challenge Global Forest Restoration Target. Restor. Ecol. 2017, 25, 903–911. [Google Scholar] [CrossRef]
  79. Birch, J.C.; Newton, A.C.; Aquino, C.A.; Cantarello, E.; Echeverría, C.; Kitzberger, T.; Schiappacasse, I.; Garavito, N.T. Cost-Effectiveness of Dryland Forest Restoration Evaluated by Spatial Analysis of Ecosystem Services. Proc. Natl. Acad. Sci. USA 2010, 107, 21925–21930. [Google Scholar] [CrossRef] [PubMed]
  80. Newton, A.C.; Hodder, K.; Cantarello, E.; Perrella, L.; Birch, J.C.; Robins, J.; Douglas, S.; Moody, C.; Cordingley, J. Cost-Benefit Analysis of Ecological Networks Assessed through Spatial Analysis of Ecosystem Services: Cost-Benefit Analysis of Ecological Networks. J. Appl. Ecol. 2012, 49, 571–580. [Google Scholar] [CrossRef]
Figure 1. Watersheds of the department of Santa Cruz and burned area scars from fires between 2019 and 2022.
Water 15 03545 g001
Figure 2. Steps in the development of the prioritization framework and tool.
Water 15 03545 g002
Figure 3. Prioritization-tree developed with technical experts and government authorities during the workshops.
Water 15 03545 g003
Figure 4. Burned areas in the watersheds of the department of Santa Cruz and their relation to the total watershed area (km2).
Water 15 03545 g004
Figure 5. Microwatershed level priority maps for scenarios A-L. (a) Scenario A—water; (b) Scenario B—ecosystems; (c) Scenario C—management; (d) Scenario D—human activities; (e) Scenario E—natural hazards; (f) Scenario F—all combined; (g) Scenario G—water + ecosystems; (h) Scenario H—water + ecosystems + management; (i) Scenario I—human impacts + fire; (j) Scenario J—water + human impacts; (k) Scenario K—water + fire; (l) Scenario L—ecosystems + fire.
Water 15 03545 g005aWater 15 03545 g005b
Figure 6. Macrowatershed level priority maps for scenarios A-F. (a) Scenario A—water; (b) Scenario B—ecosystems; (c) Scenario C—management; (d) Scenario D—human activities; (e) Scenario E—natural hazards; (f) Scenario F—all combined.
Water 15 03545 g006
Figure 7. GGE application interface after applying weights.
Water 15 03545 g007
Table 1. Overview of datasets, sources, and pre-processing.
Layer Used in the MCAInput DatasetProcessing Tool in ArcMapInput SourceSource Link or Reference
MacrowatershedsGobierno Autónomo Departamental de Santa Cruz’s (GADSC) macrowatershedsSpatial selection and intersection with the Fire occurrence layerGADSC[35]
MicrowatershedsHydroSHEDS product, level 12Spatial selection and intersection with the Fire occurrence layerWorld Wide Fund (WWF)https://www.worldwildlife.org/pages/hydrosheds (accessed on 12 April 2022)
Proximity to surface water2021 Landsat-based vegetation cover and deforestation product.Extracting the water class, Euclidean distanceLandsat; Fundación para la Conservación del Bosque Chiquitano (FCBC)[38]
Well densityWell site coordinates (points)Kernel Density tool GADSC, local water cooperatives, municipalities
PrecipitationAverage precipitation for 1970–2000, WorldClim version 2.1Re-scaling to the department levelWorldClimhttps://www.worldclim.org (accessed on 10 April 2022)
Land coverLand cover mapReclassification into five land cover classes FCBC
ElevationAster Global Digital Elevation Map (GDEM) version 2 sensor scenesMosaic to New Raster toolNational Aeronautics and Space Administration (NASA)/Japan Space Systemshttps://ssl.jspacesystems.or.jp/ersdac/GDEM/E/4.html (accessed on 11 March 2023)
SlopeAster GDEM version 2 sensor scenesSlope toolNASA/Japan Space Systemshttps://ssl.jspacesystems.or.jp/ersdac/GDEM/E/4.html (accessed on 11 March 2023)
Protected areasMaps of national, regional and municipal protected areasRaster conversion and reclassificationGADSC
Land ownershipLandowner mappingRaster conversion and reclassificationNational Institute of Agrarian Reform (INRA)
Proximity to roads and infrastructureDigitized roadsEuclidean distance toolFCBC
Population density2012 population censusKernel Density toolNational Statistics Institute (INE)http://geo.gob.bo/portal (accessed on 23 March 2023)
Fire occurrence4 fire scar maps: 2019, 2020, 2021, 2022Cell statistics toolFCBC
Fire intensityFire Radiative Power, MODIS Collection 6.1 productInterpolation using the Inverse Distance Weighted (IDW) technique [30]NASA’s Fire Information for Resource Management System (FIRMS)https://firms.modaps.eosdis.nasa.gov (accessed on 12 April 2022)
Table 2. Ranking of prioritization variables.
CategoryVariables/Importance1-Very low2-Low3-Medium4-High5-Very high
Water resourcesDistance to rivers/water bodies (m)>10,0005000–100002000–50001000–2000<1000
Density of water wells (km2)<0.010.01–0.020.02–0.050.05–0.07>0.07
Precipitation (mm)<500500–10001000–15001500–2000>2000
Ecosystems and biophysical criteriaElevation (m a.s.l.)<100100–250250–500500–1000>1000
Slope (°)<3030–4040–5050–60>60
Land cover typeNon-vegetated areaOther non-forest natural formationWetlandForestFlooded forest
Land governanceProtected areas (national, regional or municipal)No protected areaN/AN/AN/AProtected
Land ownershipUrbanSmall to large private propertyCommunity-ownedIndigenous territoriesState-owned
Human activitiesDistance to productive areas, roads, population centers (m)>20001500–20001000–1500500–1000<500
Population density (inhabitants/km2)<1010–2020–4040–1000>1000
Fire threatRecurrence of fires between 2019–2022 (4 years)01234
Intensity of fire (MW)01–250250–500500–1000>1000
Table 3. Prioritization scenarios.
Scheme 1W1W2W3W4W5
A—water10000
B—ecosystems01000
C—management00100
D—human activities00010
E—natural hazards00001
F—all combined11111
G—water + ecosystems11000
H—water + ecosystems + management11100
I—human impacts + fire00011
J—water + human impacts10010
K—water + fire10001
L—ecosystems + fire01001
Table 4. Microwatershed level priority area summary for example scenarios A-F.
Scheme 2High-Priority Area (km2)Priority Watersheds (Count)
A—water16,06180
B—ecosystems34,322156
C—management102,756457
D—human activities82,145310
E—natural hazards16,14099
F—all combined19,90588
Table 5. Macrowatershed level priority area summary for example scenarios A–F.
ScenariosHigh-Priority Area (km2)Priority Watersheds (Count)Priority Macrowatersheds (Names)
A—water54,9113Pirai, Rio Grande, Itenez Sur
B—ecosystems82,3895Itenez Norte, Yapacani, Ichilo, Cuevo, Parapeti
C—management137,6986Itenez Norte, San Miguel, Paragua, Curichi Grande, Tucabaca, Cuevo
D—human activities121,1365Pirai, Yapacani, Rio Grande, San Julian, Ichilo
E—natural hazards120,1935Paragua, Itenez Sur, Curichi Grande, San Miguel, Tucabaca
F—all combined84,3665Rio Grande, San Miguel, Pirai, Yapacani, Ichilo
Disclaimer/Publisher’s Note: The statements, opinions and data contained in all publications are solely those of the individual author(s) and contributor(s) and not of MDPI and/or the editor(s). MDPI and/or the editor(s) disclaim responsibility for any injury to people or property resulting from any ideas, methods, instructions or products referred to in the content.

