Flood Hazard Evaluation Using a Flood Potential Index
Abstract
:1. Introduction
2. Materials and Methods
2.1. Study Area
2.2. Methodology
- 1.
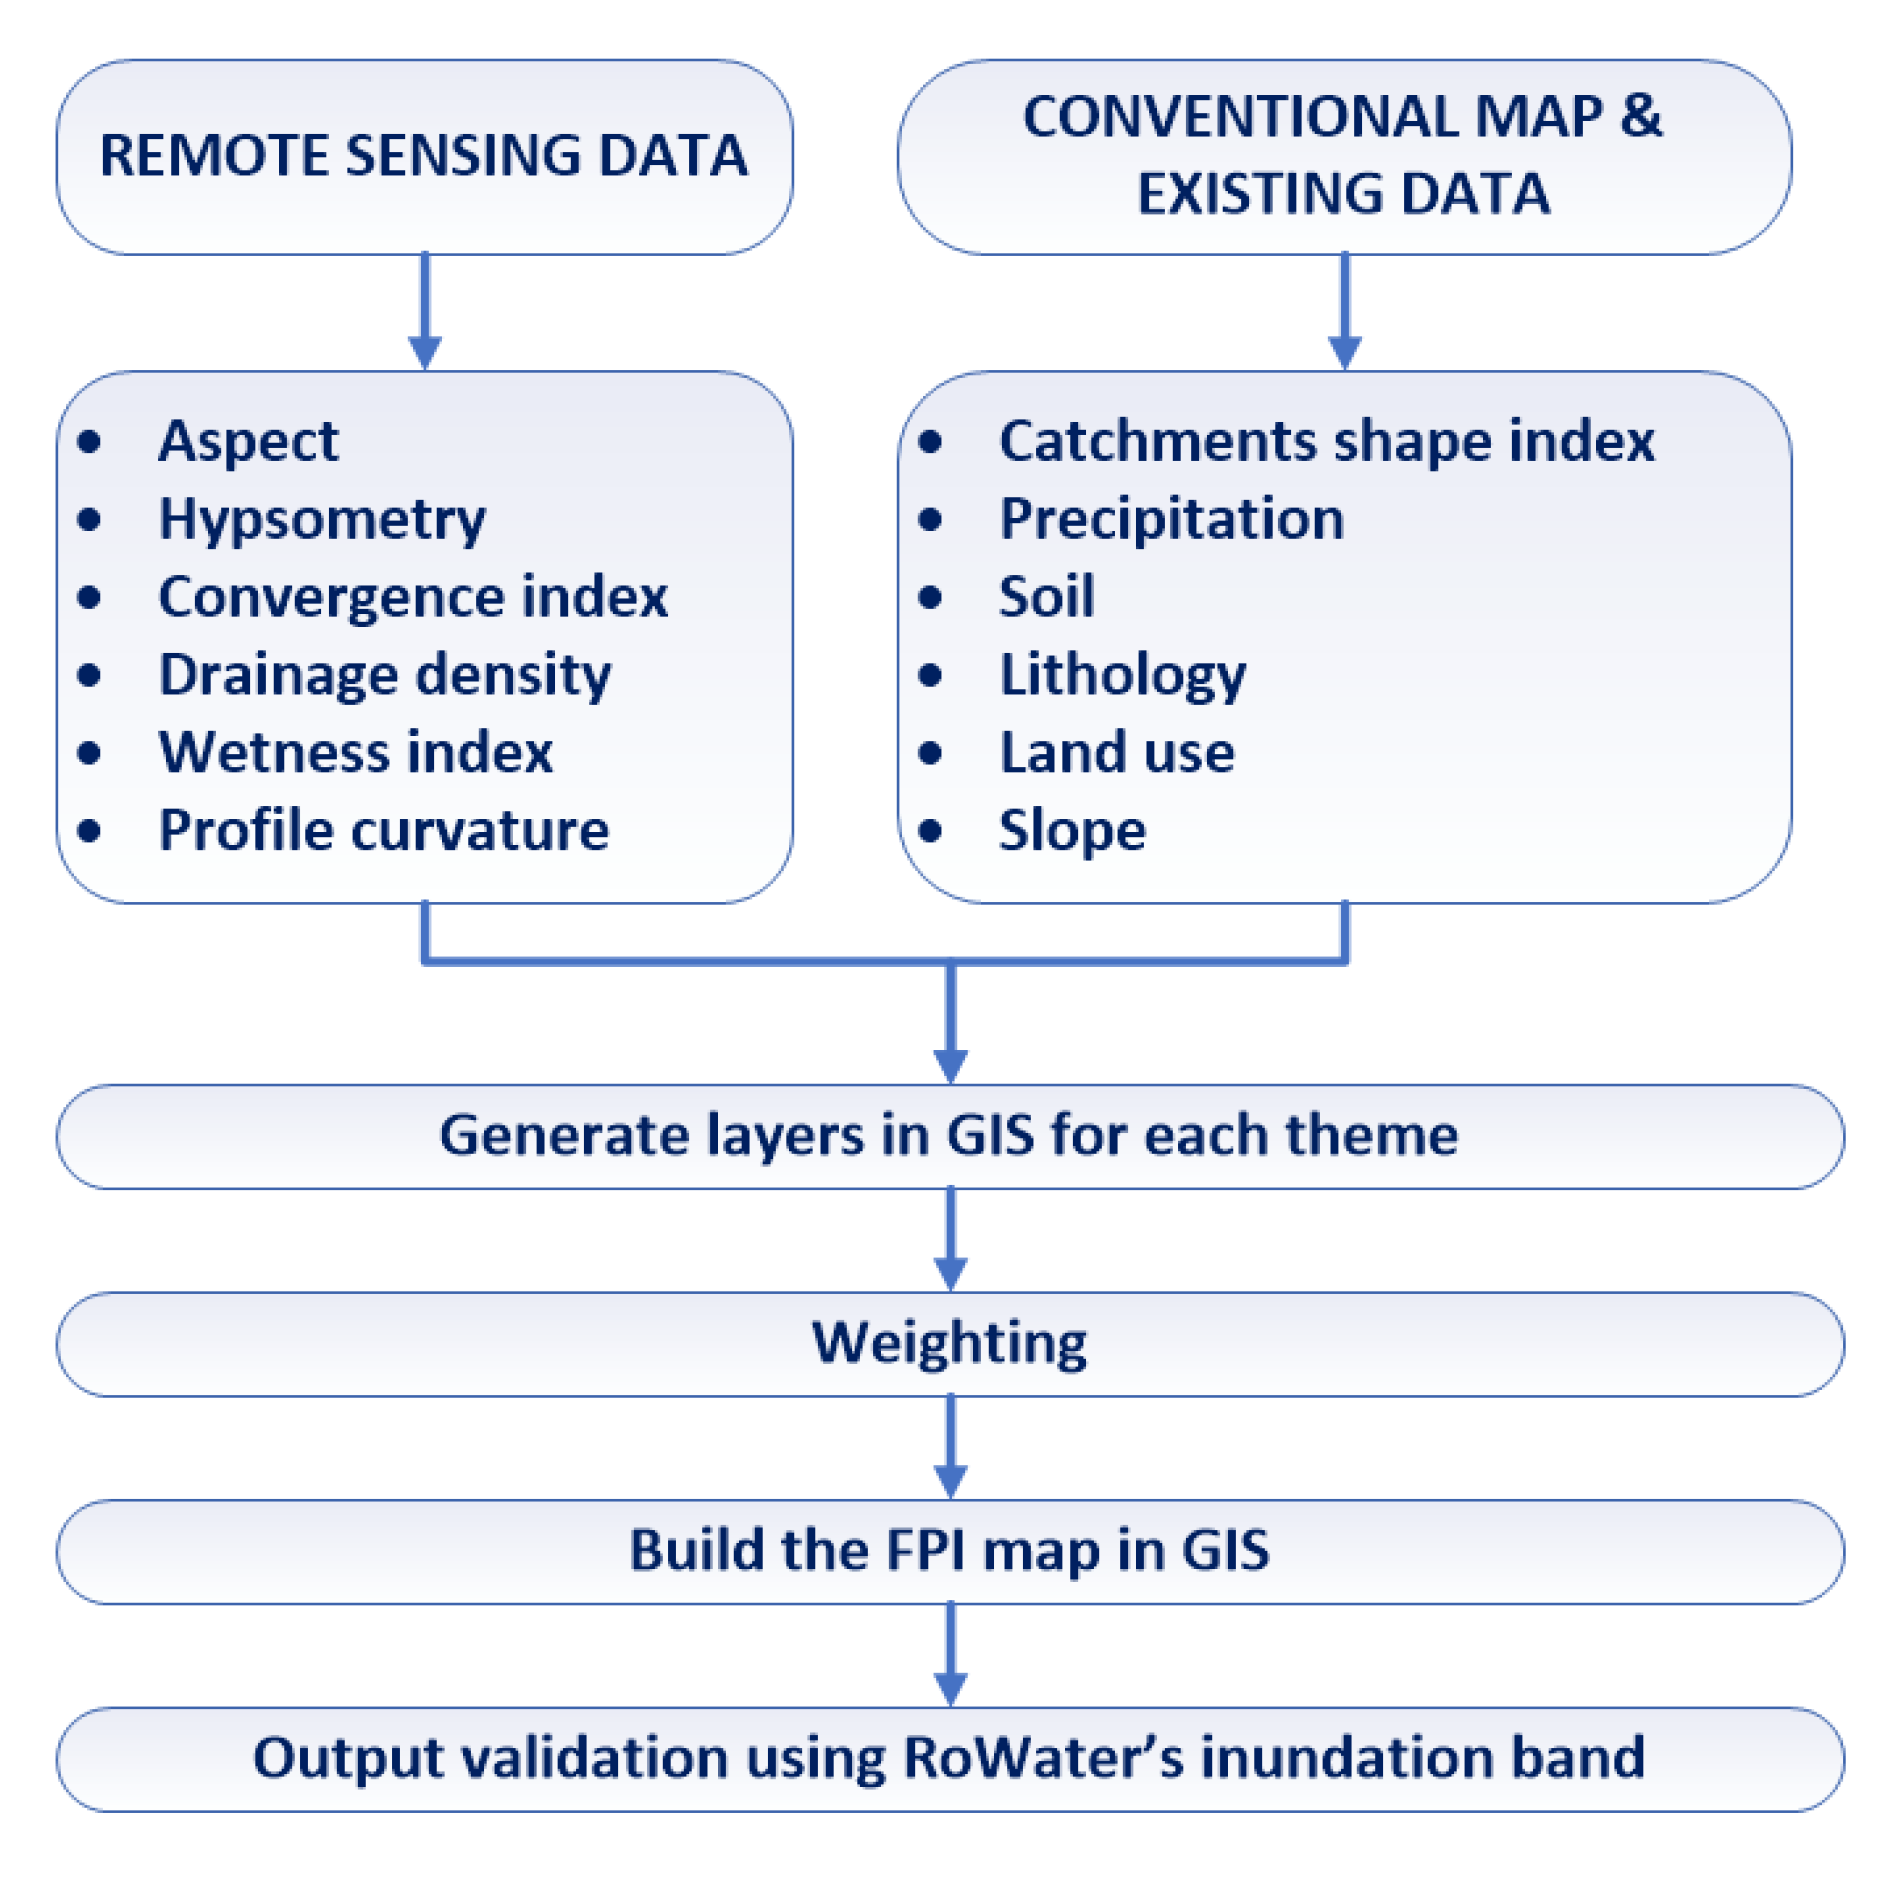
- Select the factors (themes) taken into account for building FPI slope (SL), aspect (A), hypsometry (HY), convergence index (CF), drainage density (DD), topographic wetness index (TWI), profile curvature (PC), catchment shape index (CS), precipitation (P), soil (S), lithology (LH), land use (LU), and classes for each (usually five).
- 2.
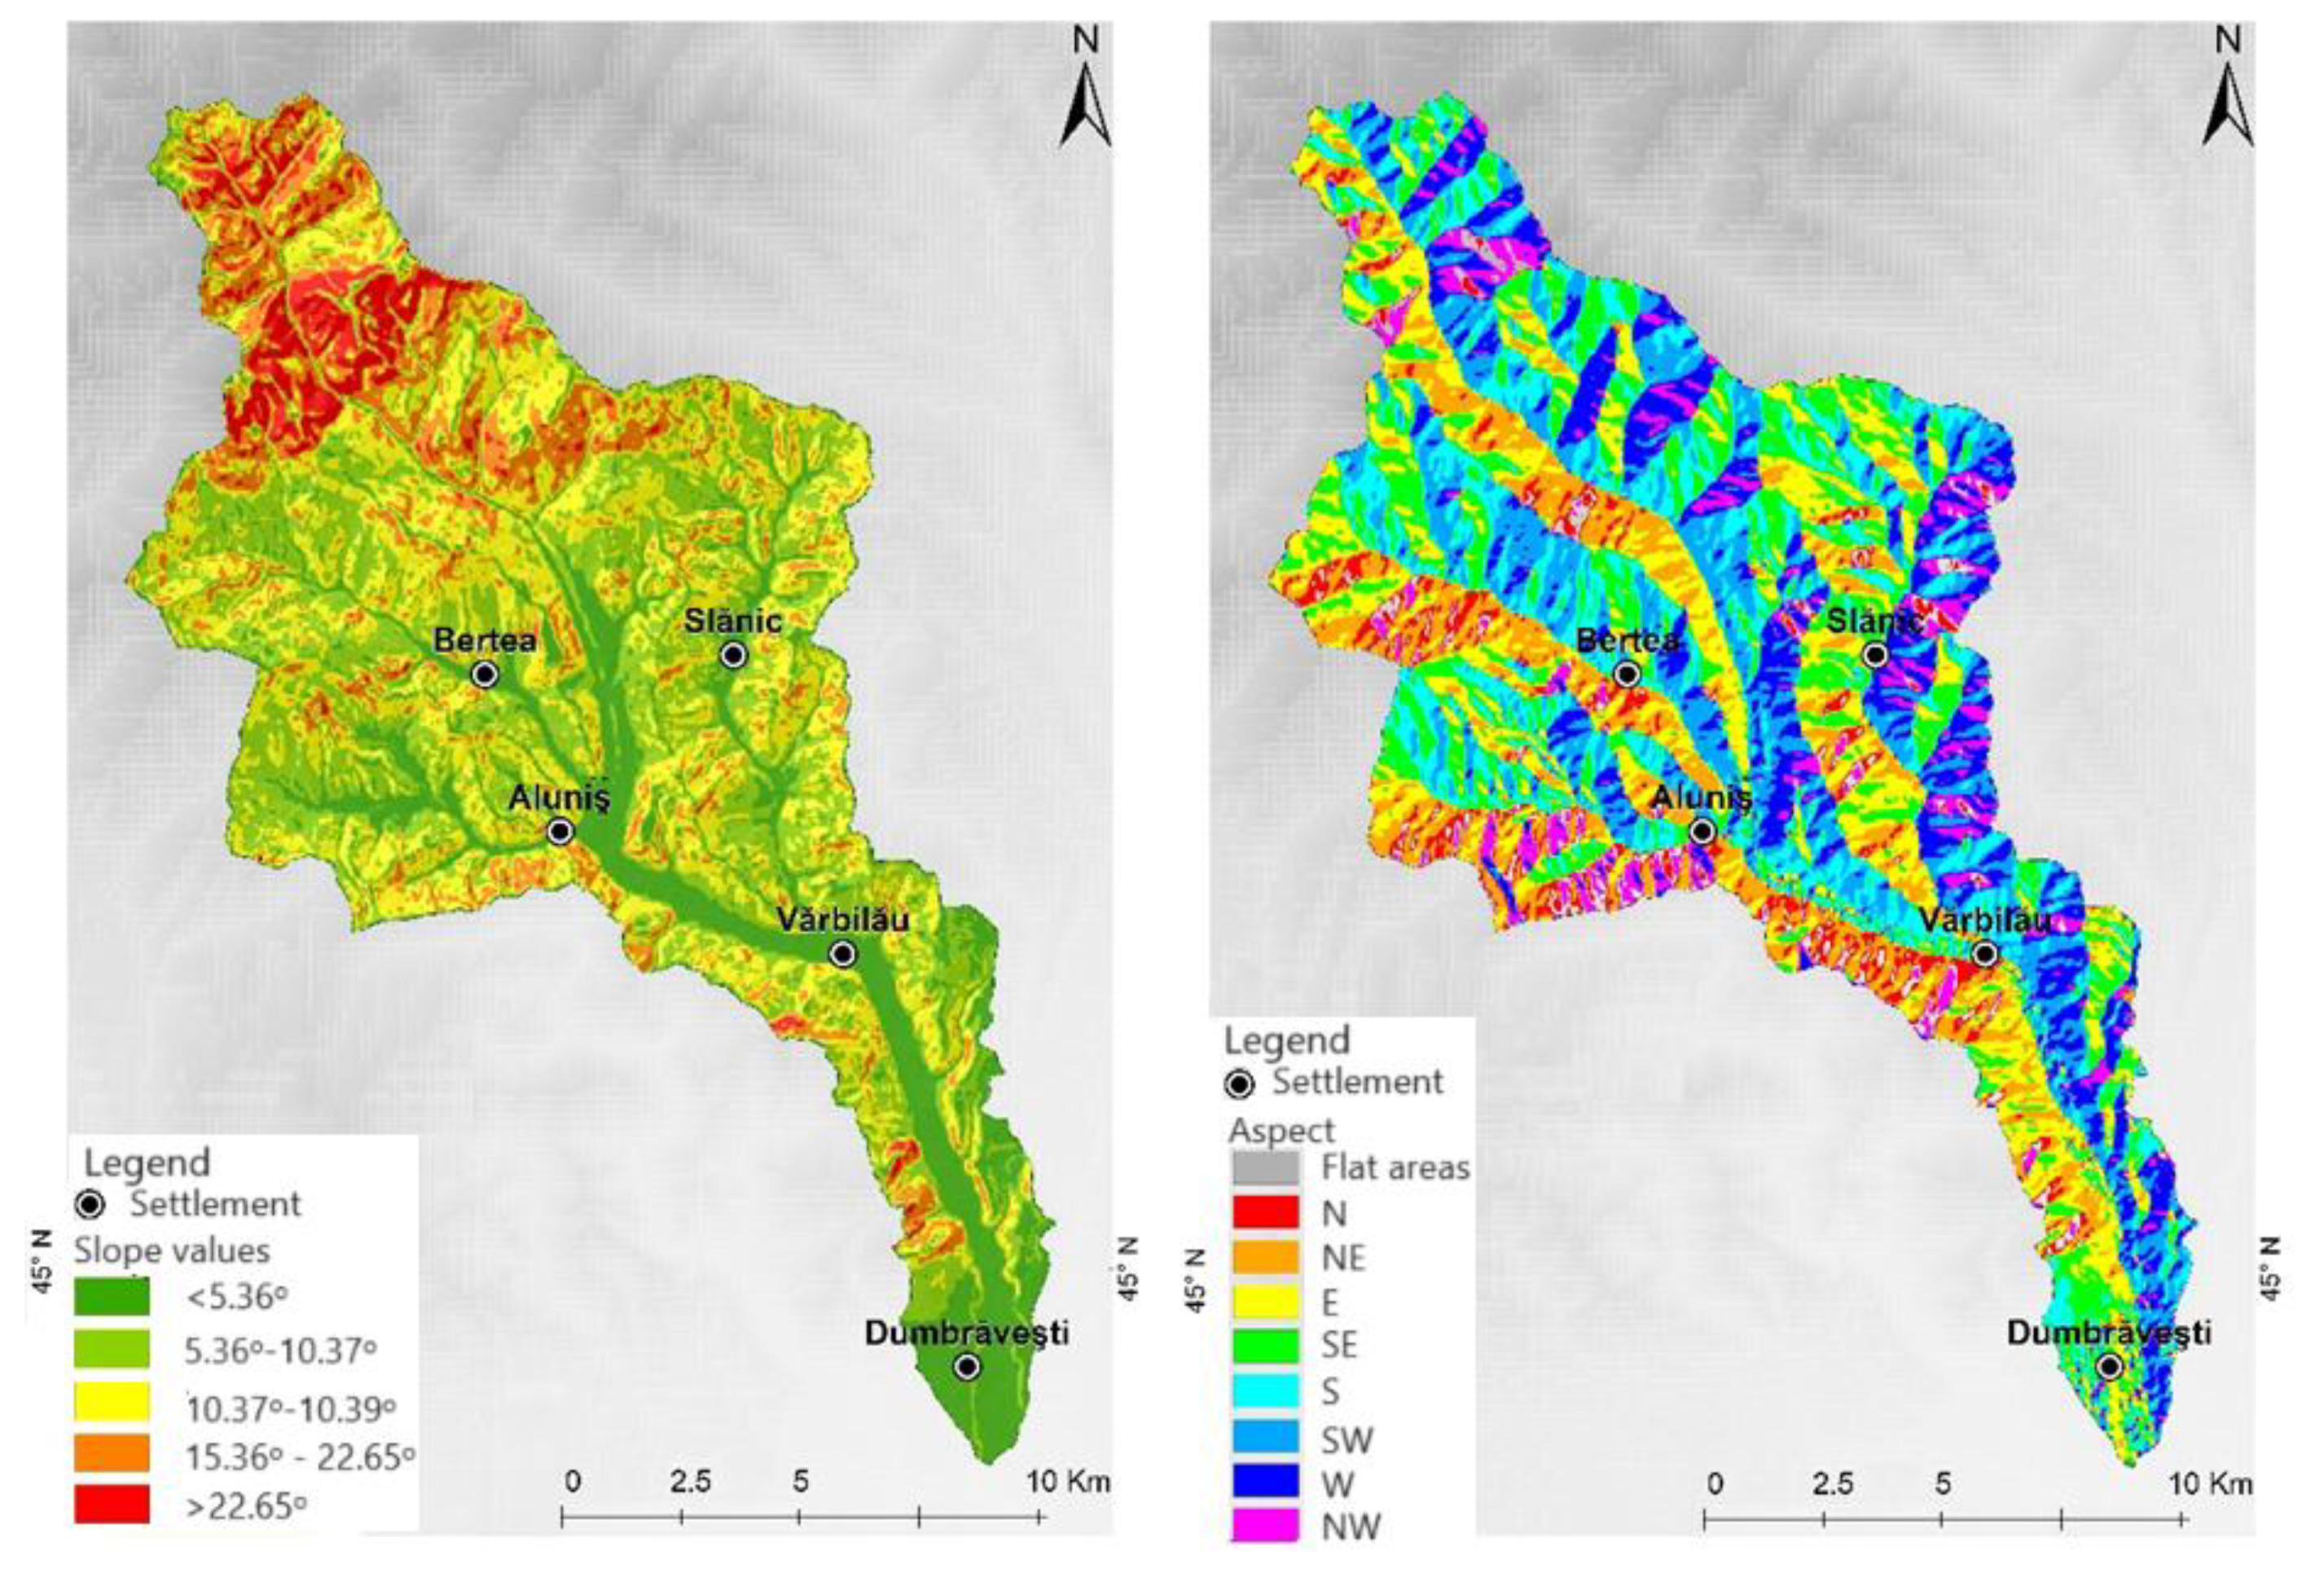
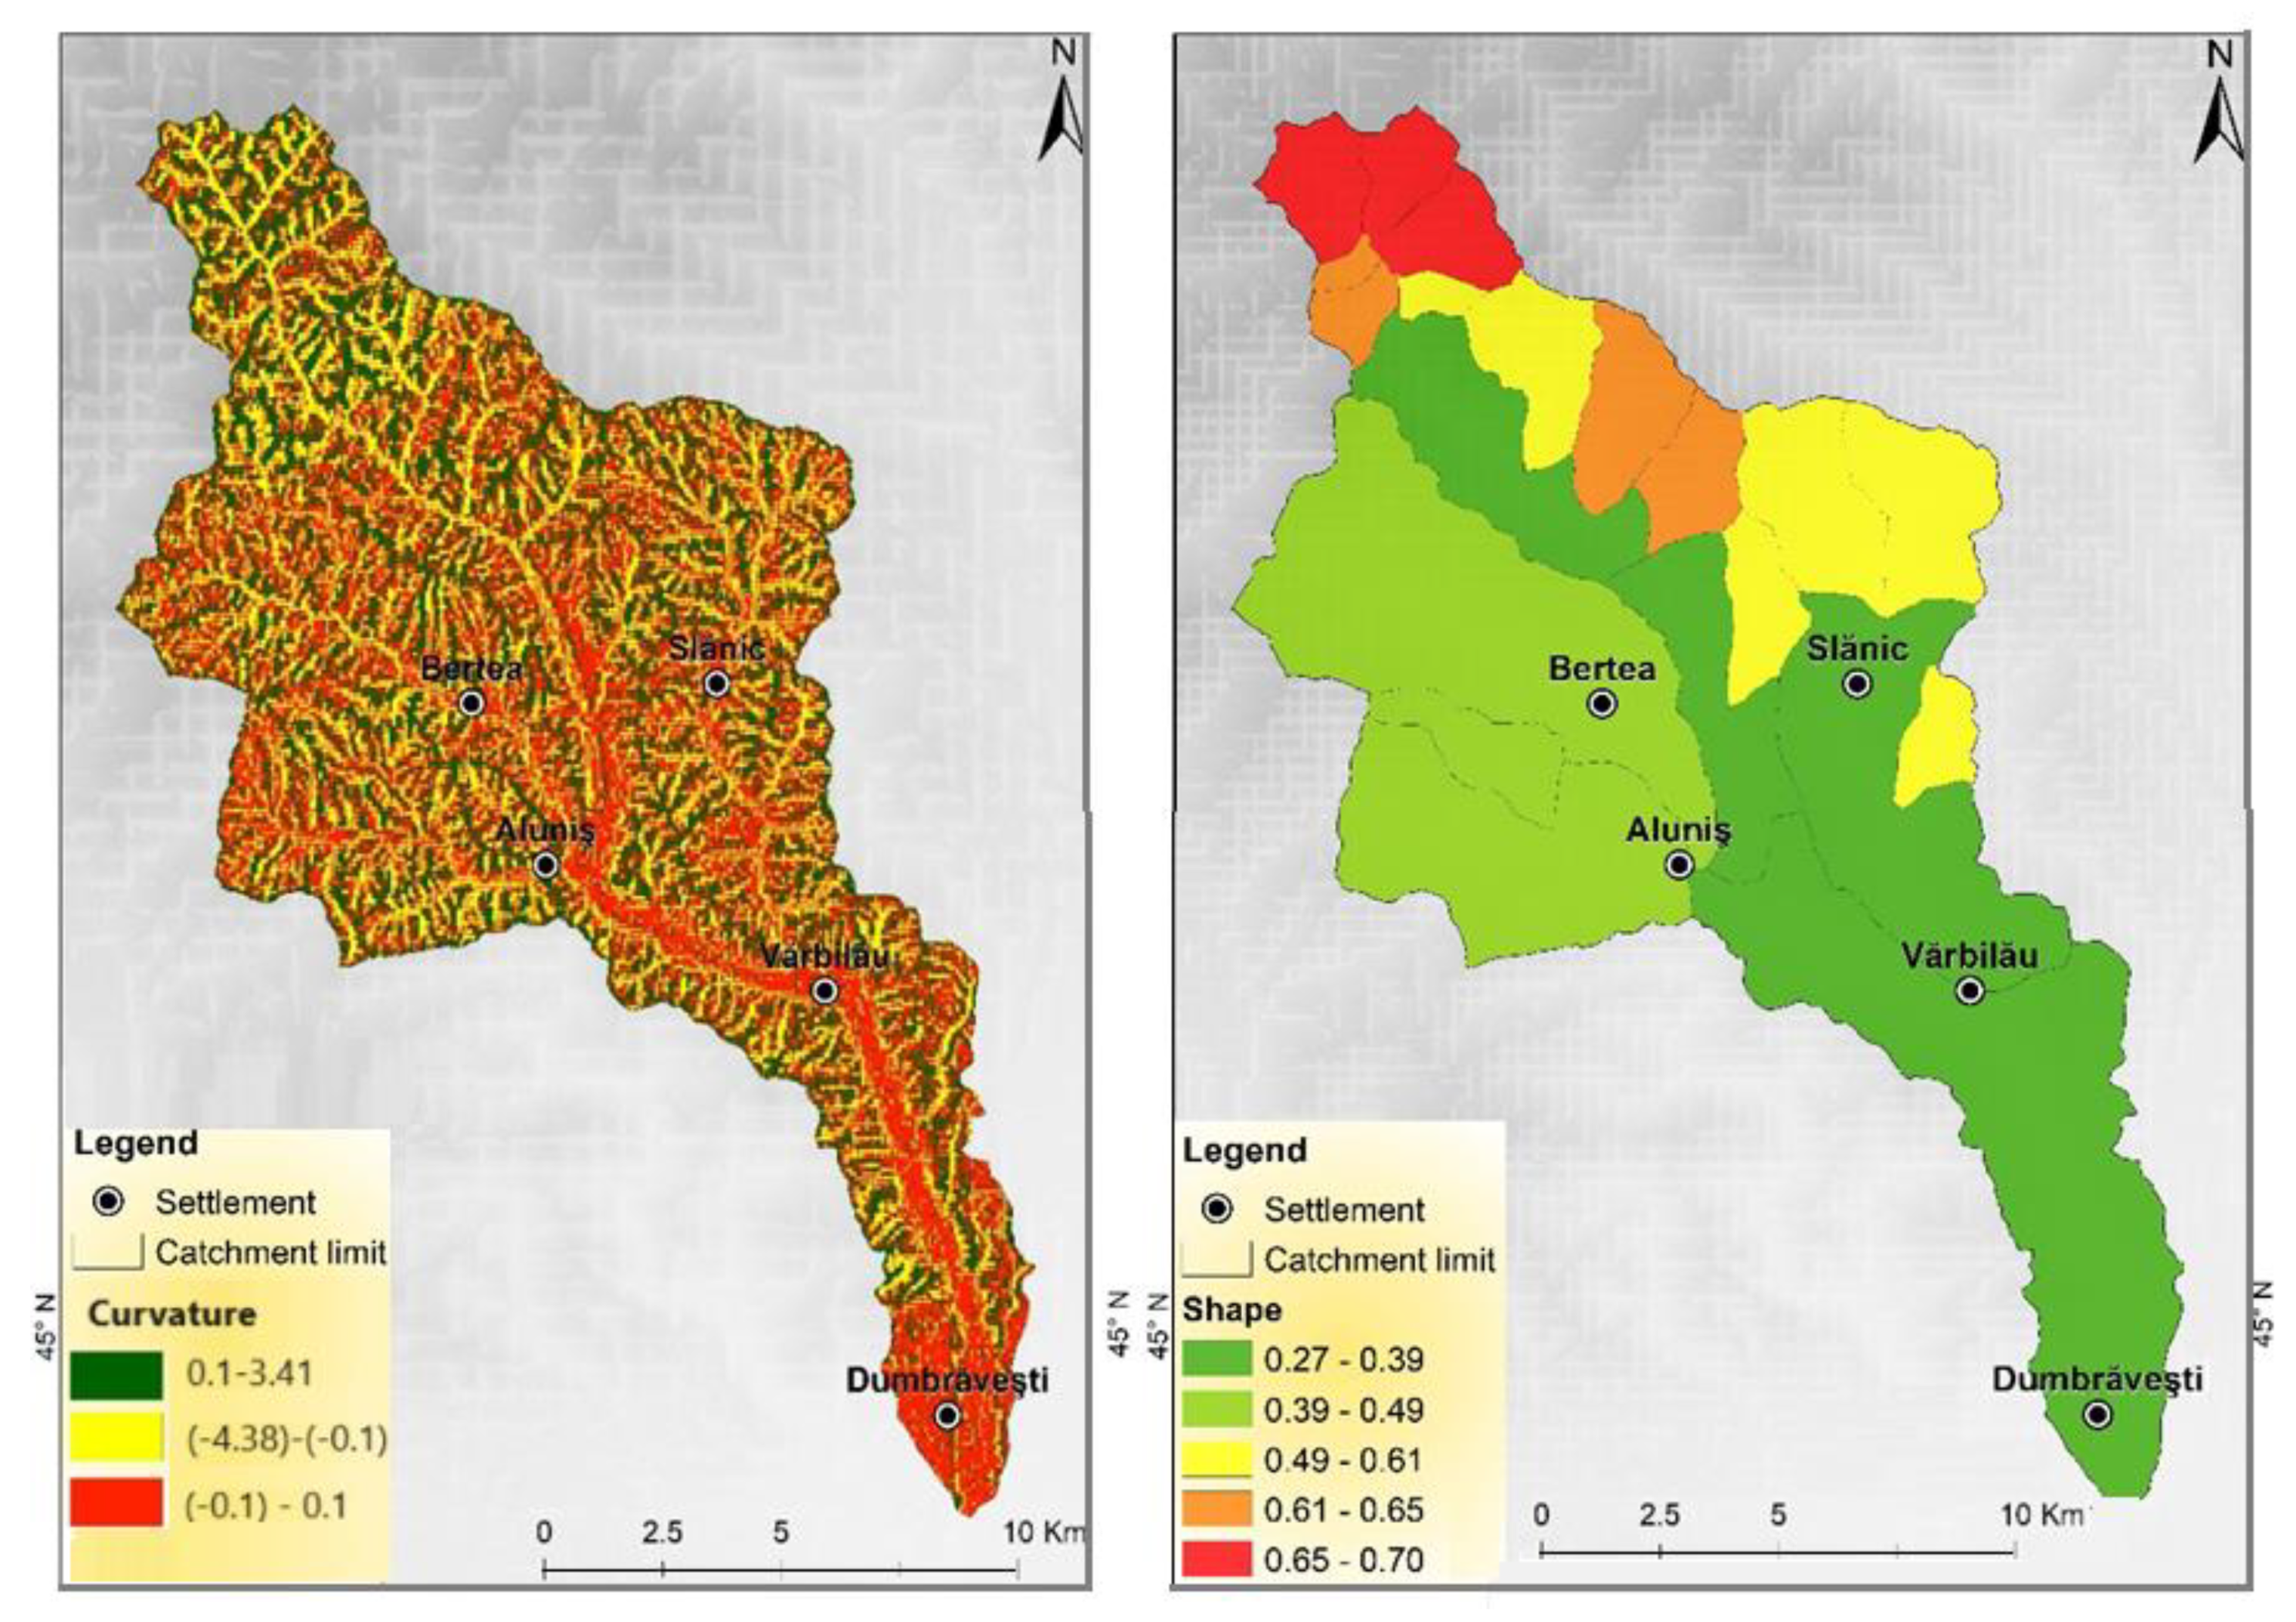
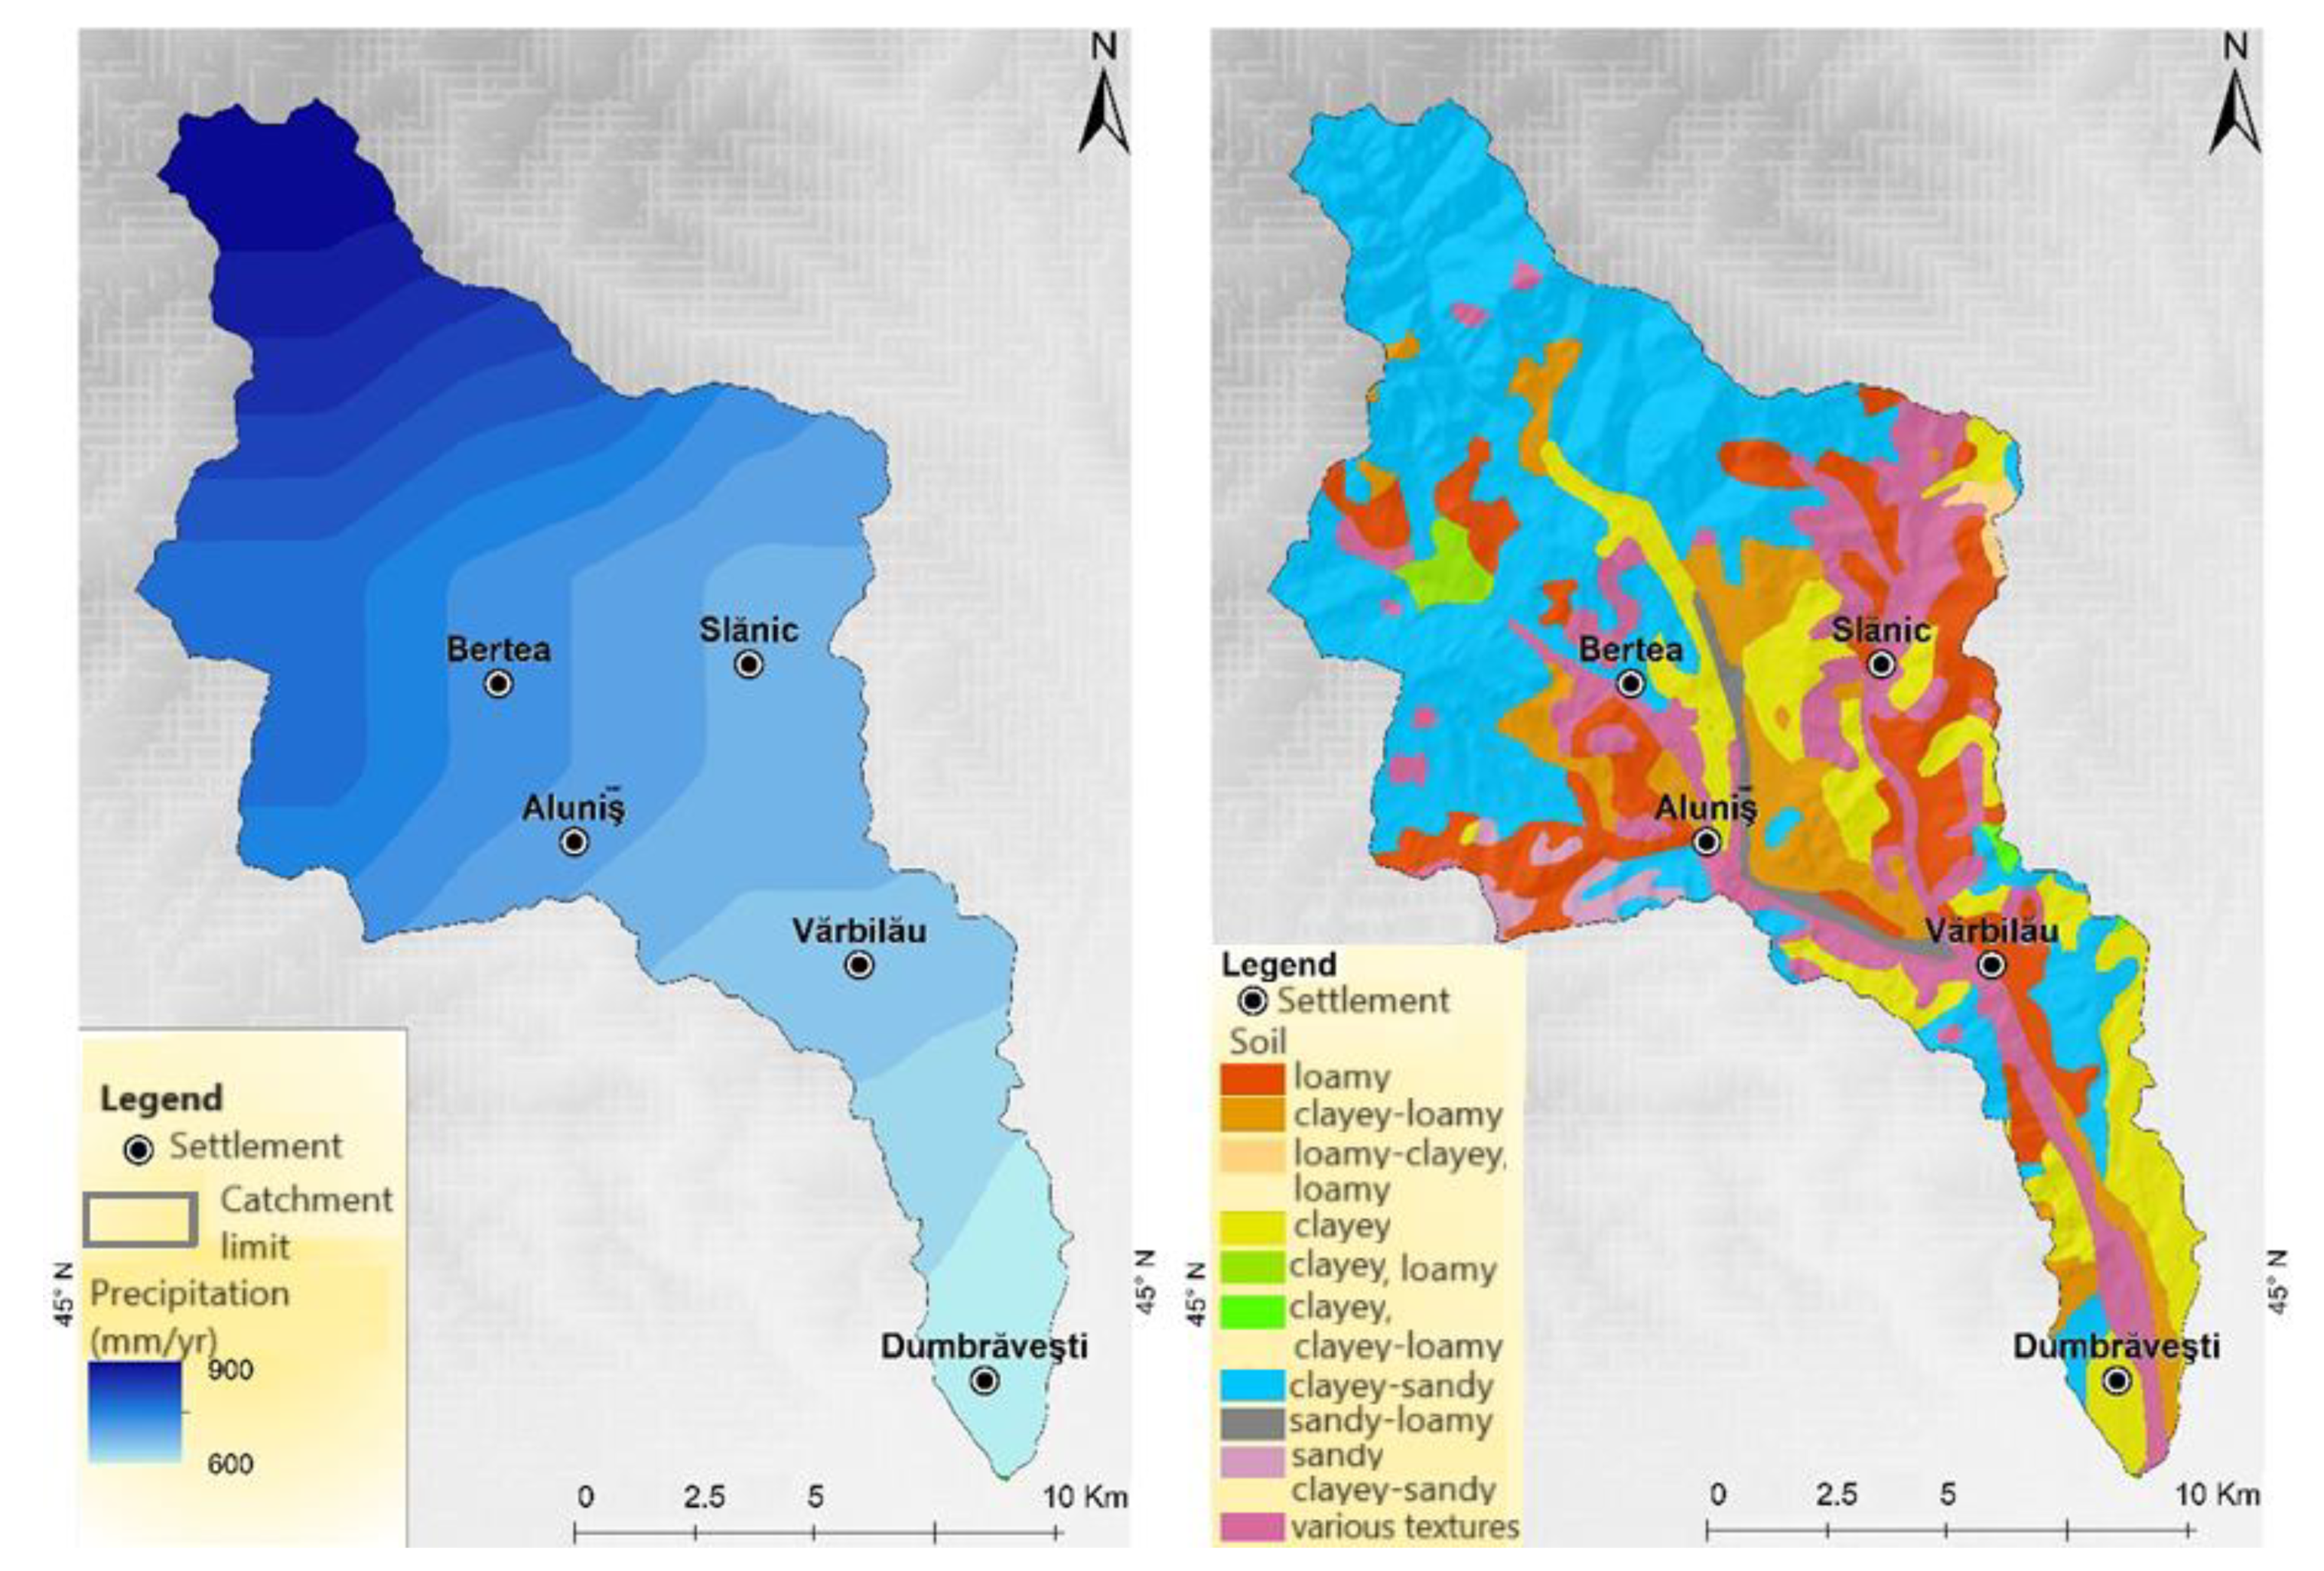
- Generate the layers for each theme based on the collected data. The software used for this purpose included the GIS applications ArcMap 10.2.2 (https://support.esri.com/en/products/desktop/arcgis-desktop/arcmap/10-2-2, accessed on 13 May 2023) and SagaGIS 8.5.1 (https://saga-gis.sourceforge.io/en/index. html, accessed on 15 May 2023). After processing, the databases utilized in shapefile and raster formats were exported in .jpg format. The precipitation database (raster format) was from Worldclim.com (https://worldclim.com/, accessed on 20 April 2023) for 12 months from 2010 to 2018. The land use data were from the Corine Land Cover database-ESRI FGDB (https://land.copernicus.eu/pan-european/corine-land-cover, accessed on 13 May 2023). The shapefile layers of the soils, lithology, limits of the hydrographic basin, and the main rivers and Digital Elevation Model (DEM) of the Vărbilău basin have also been used [34,35]. The convergence index was obtained from SAGA GIS 8.5.1. The slope and profile curvature were built from ASTER DEM. The DEM is part of the national numerical model of Romania at 30 cm which was individualized at the hydrographic basin level, in the case of the Vărbilău face. The resolution of the DEM per pixel is 30 m, which is sufficient for what we need in the development of the index in a hydrographic basin, this being already specified;
- 3.
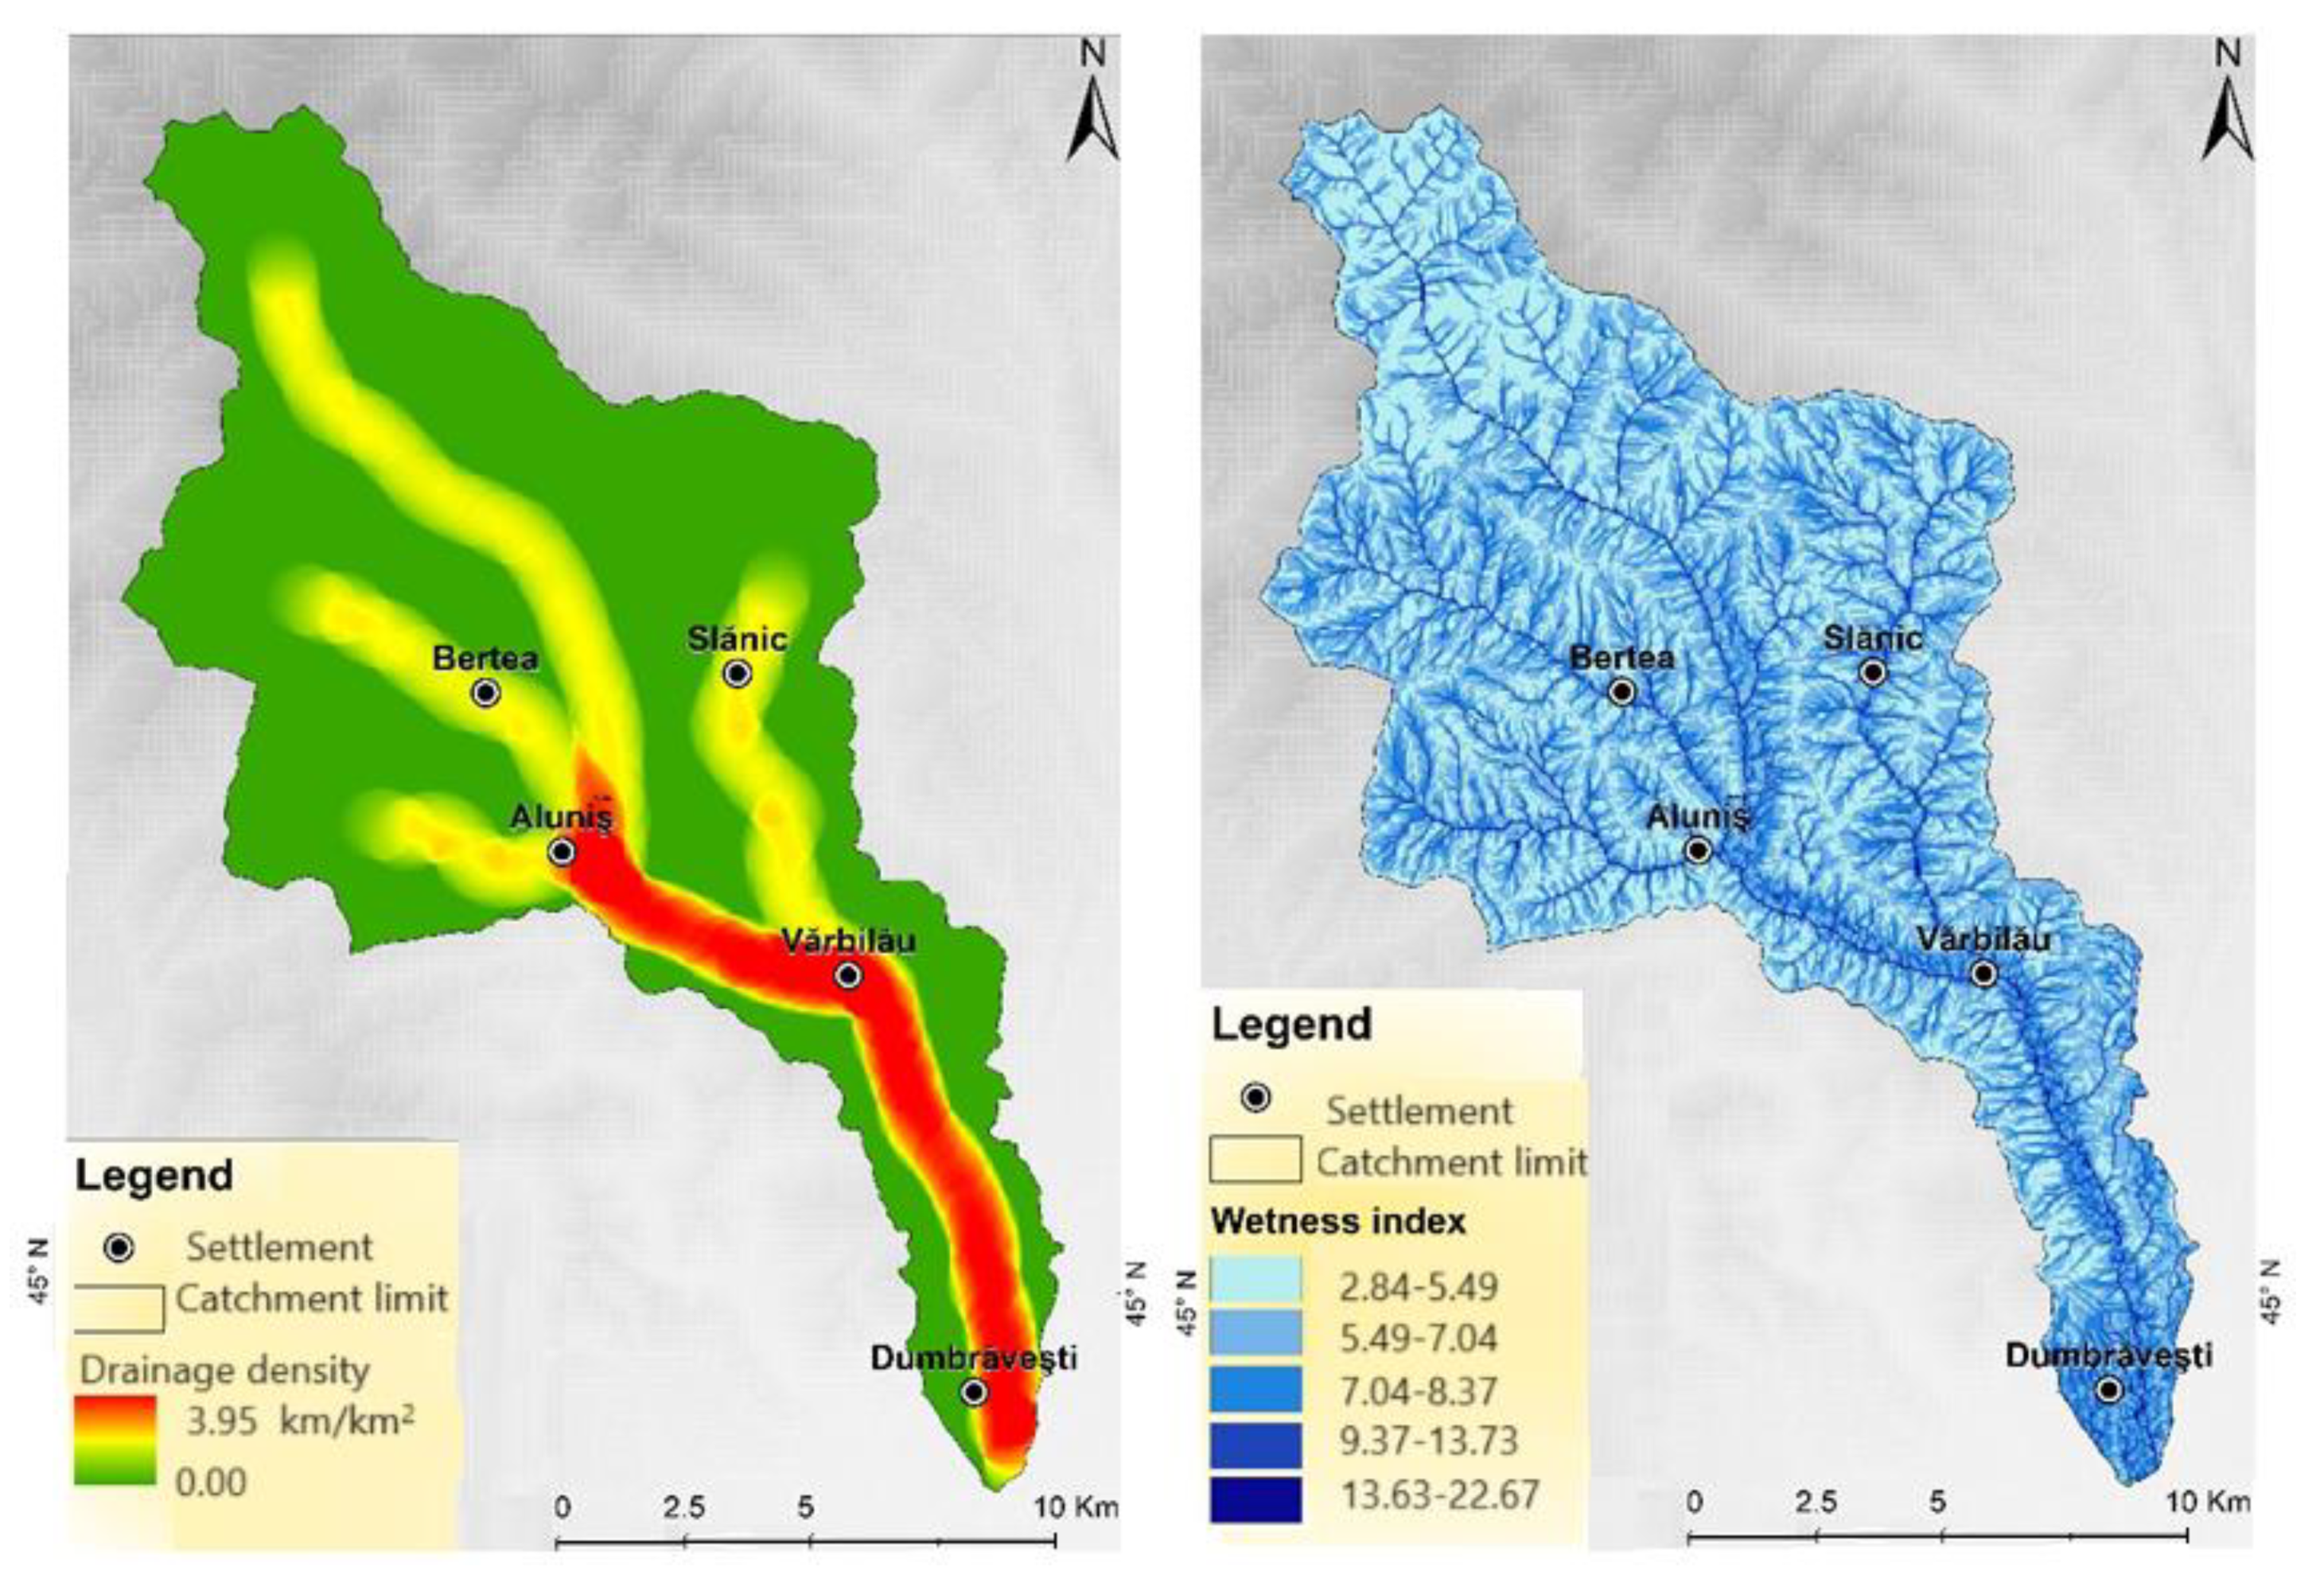
- Compute the drainage density layers in ArcGIS;
- 4.
- Assign the thematic layers’ weights using the multi-criteria decision-making (MCDM) introduced by Saaty [36], as follows:
- Build the comparison matrix of the pairs of themes and assign a score as a function of the relative importance of a theme with respect to another one;
- Normalize the scores by dividing each score through the corresponding column’s sum in the comparison matrix;
- Build the weights vector containing the averages of the rows’ normalized scores.
- 5.
- Validate the weighting choice by computing the following values:
- The maximum eigenvector of the comparison matrix, ;
- The consistency index as follows:
- c.
- The consistency ratio (CR) as follows:
- 6.
- Divide the values of each thematic layer into five classes (depending on the importance of its feature in the flood occurrence) and assign a score from 1 to 5 to each class;
- 7.
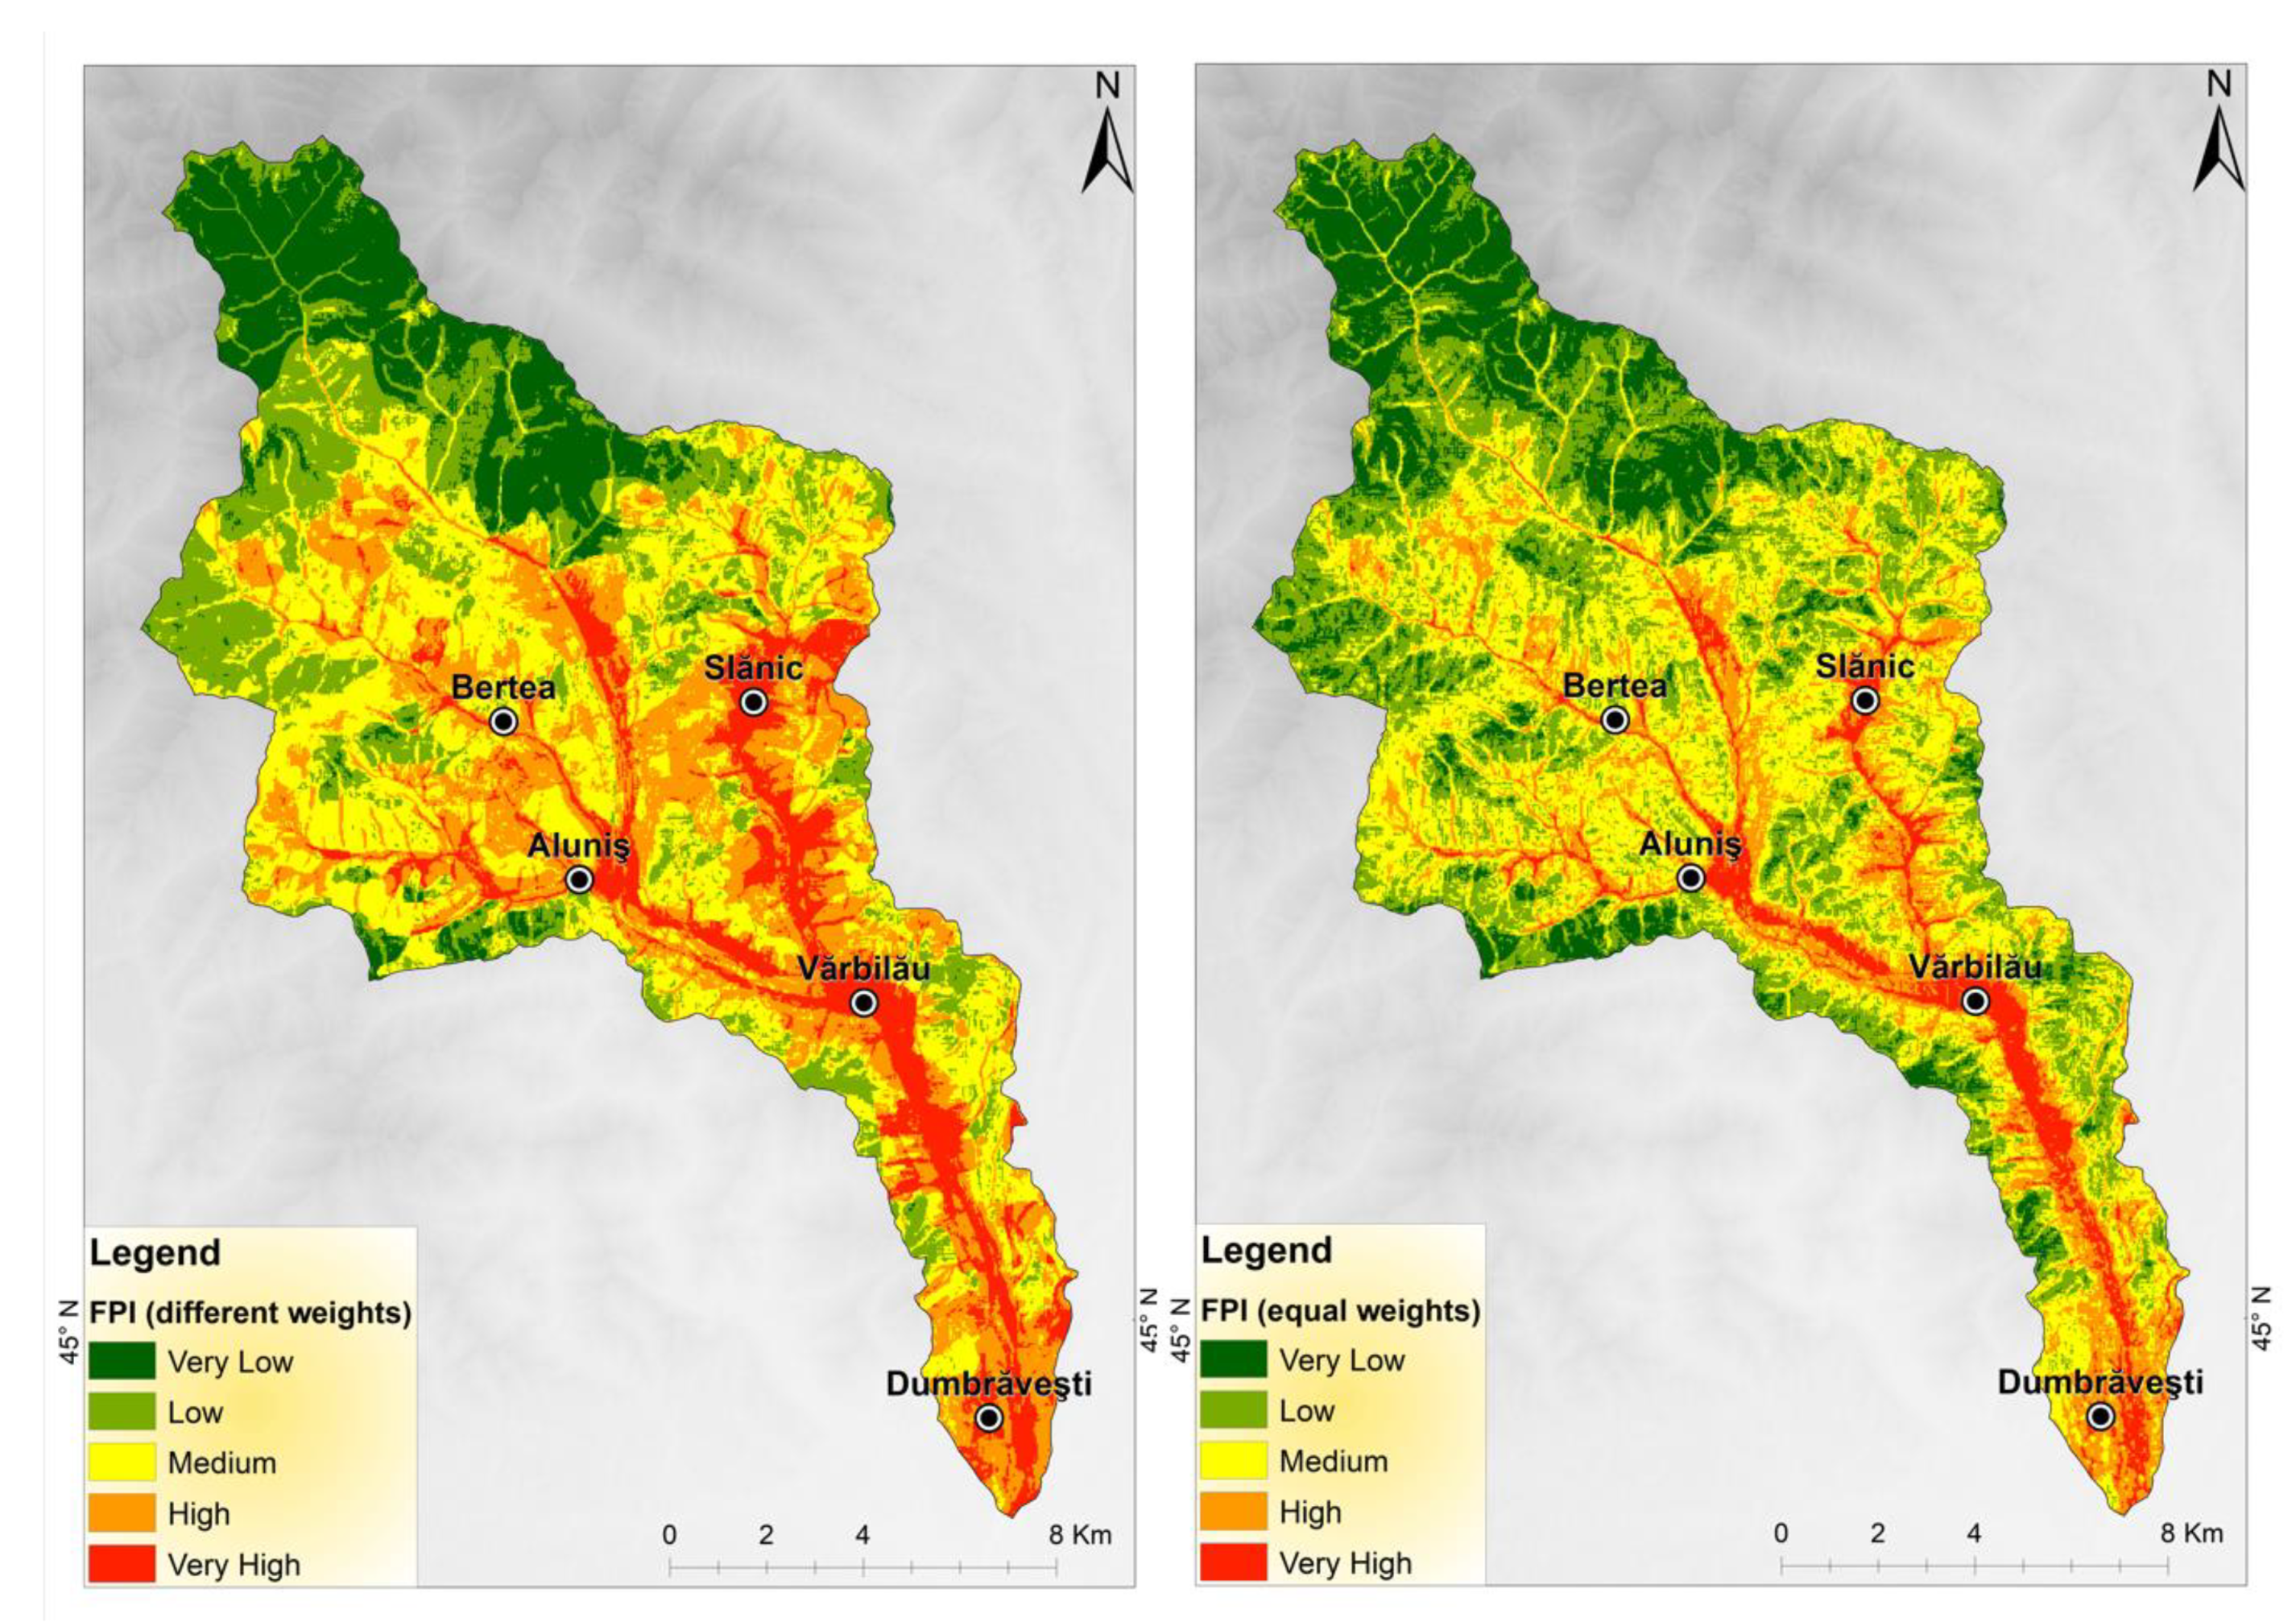
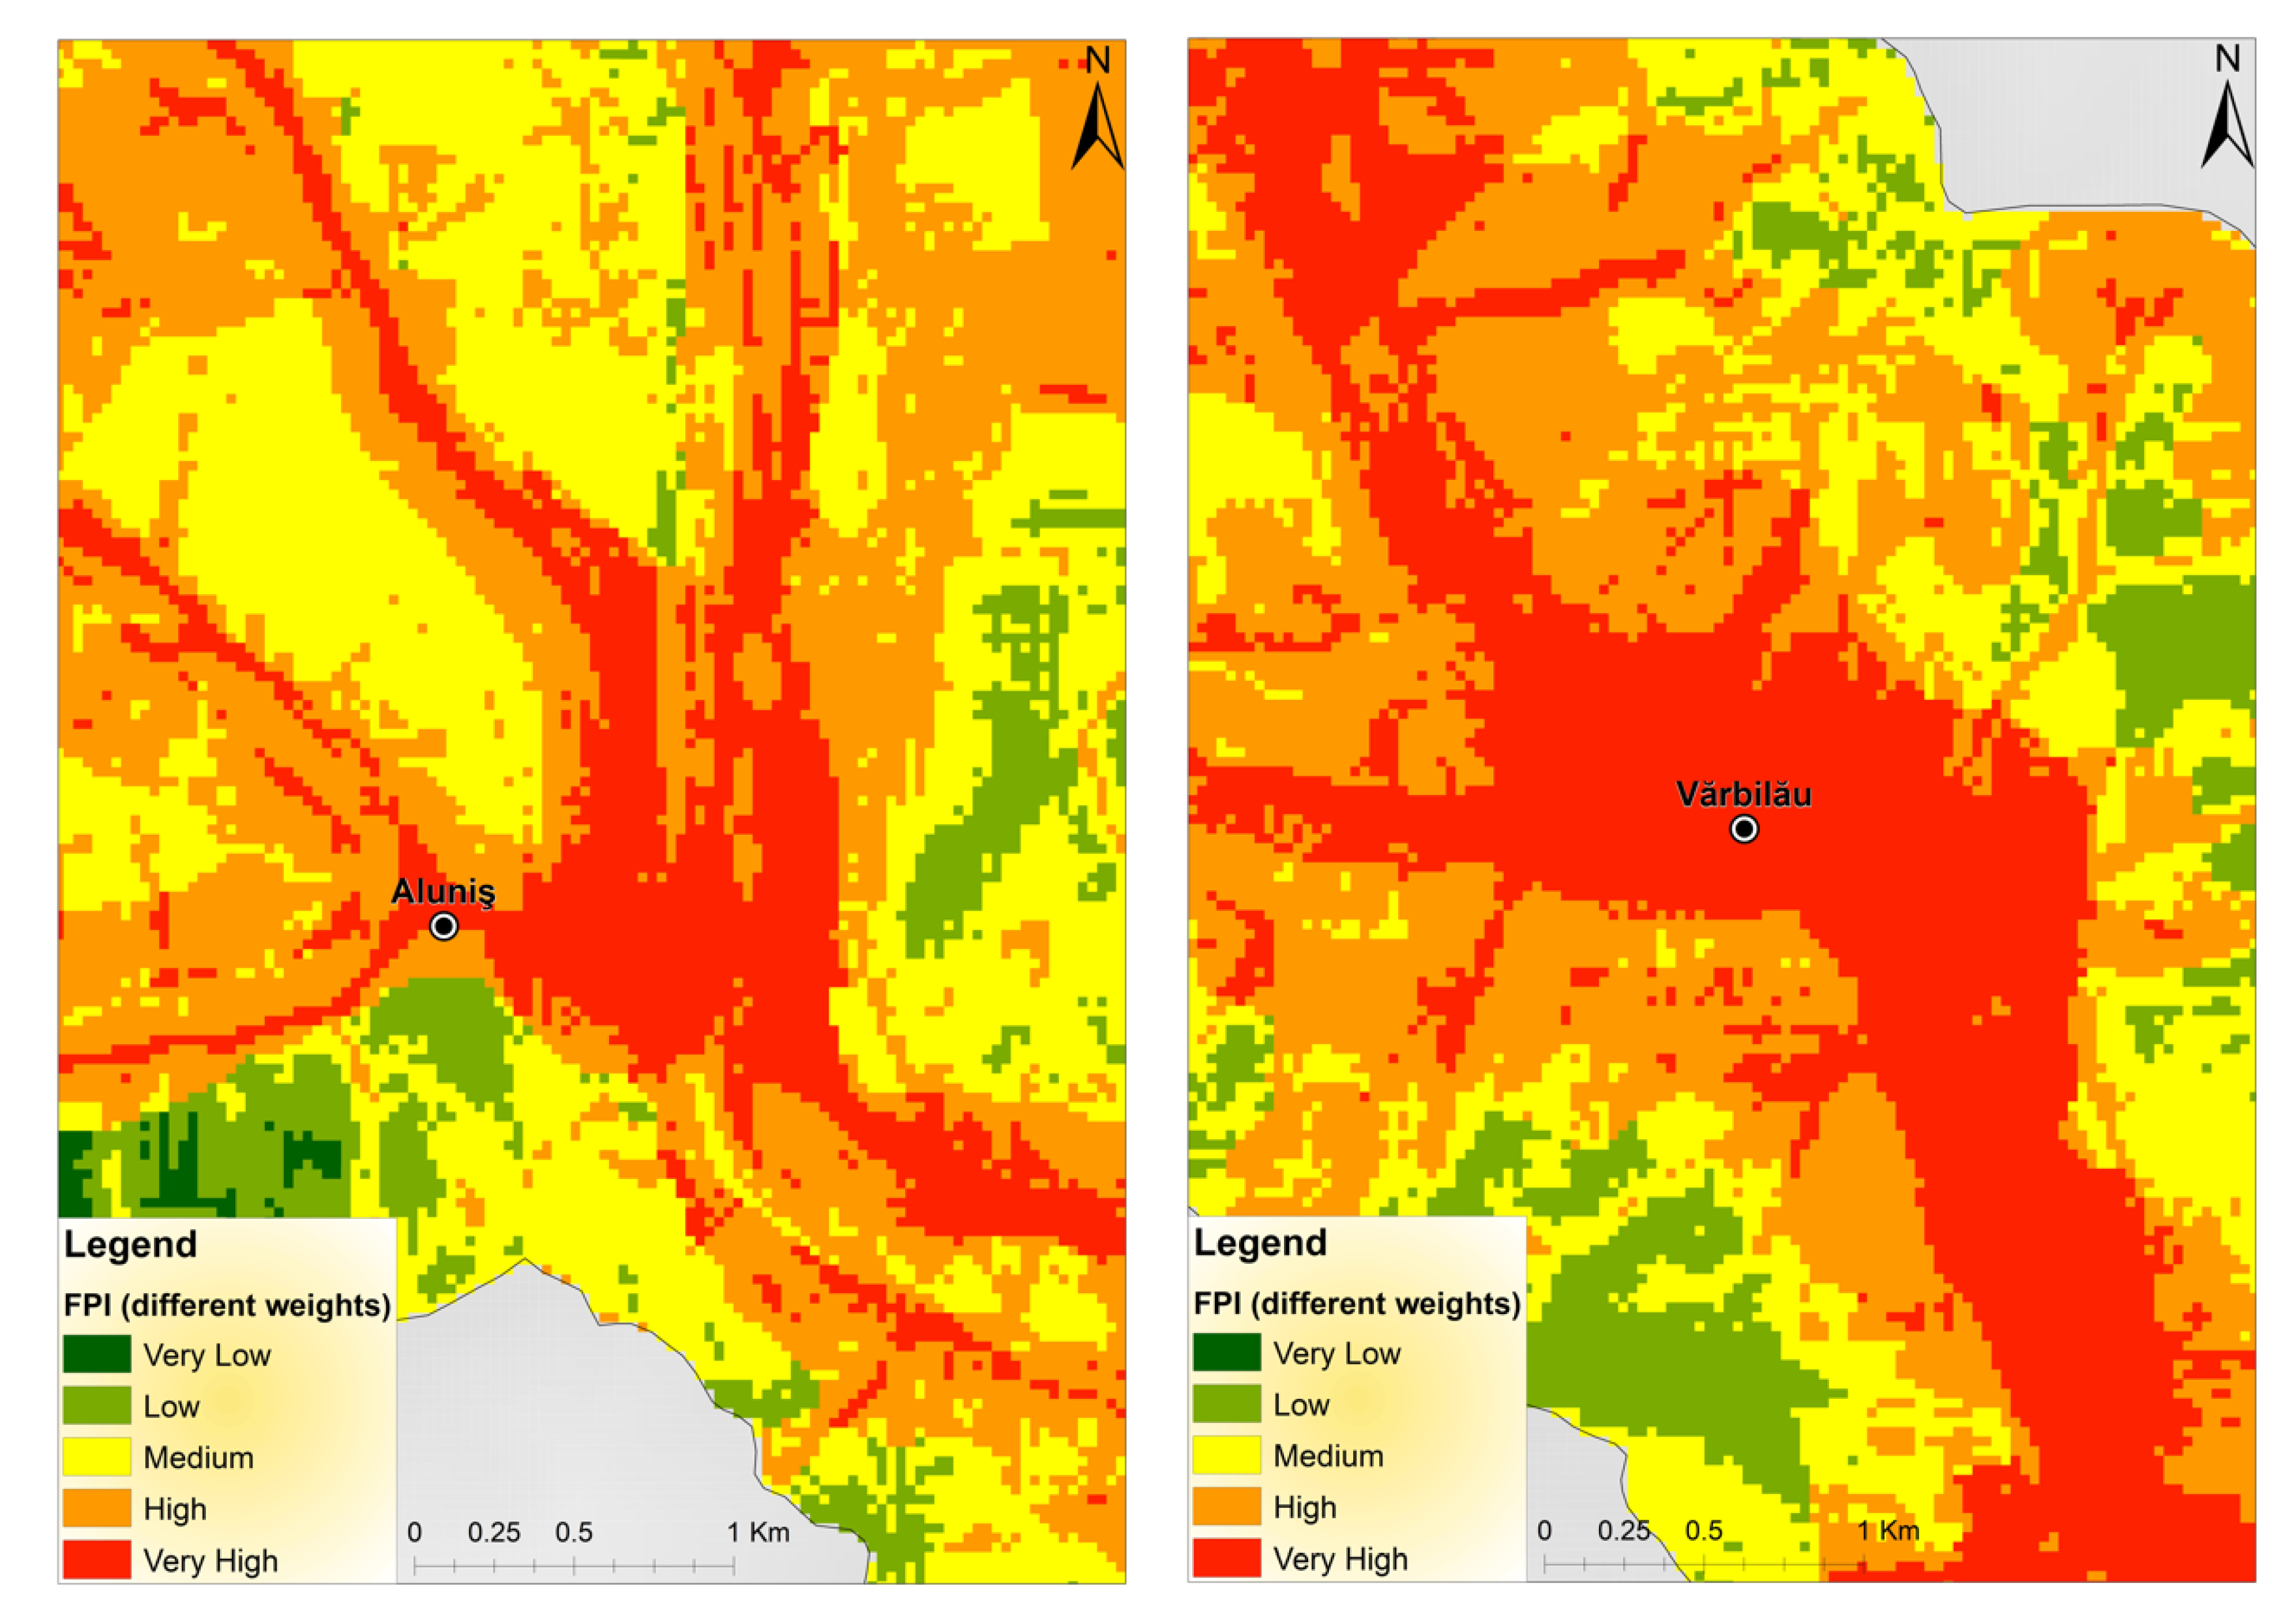
- Build the FPI map in GIS by integrating the elements from the second step with the weight from step 3;
- 8.
- Compare the results with those obtained when assigning equal weights (8.33%) to each layer;
- 9.
- Validate the model using the flooding simulation maps from RoWater [37], which were realized by experts in hydrology from technical universities in Romania and the Romanian Water Institute in the following stages: developing the digital terrain model (DEM); image processing for the DEMs included in the analysis; hydraulic modeling (including the model calibration) using an exceedance probability of 1%, emphasizing the flood band resulted after hydraulic modeling (to observe the flood impact on settlements and land); intersecting areas of interest with flood band based on road, rail, settlement, industrial, land use, forest, etc. database.
3. Results and Discussion
4. Conclusions
Author Contributions
Funding
Data Availability Statement
Conflicts of Interest
References
- McPhillips, L.E.; Chang, H.; Chester, M.V.; Depietri, Y. Defining Extreme Events: A Cross-Disciplinary Review. Earth’s Future 2018, 6, 441–455. [Google Scholar] [CrossRef]
- Chang, S.E.; Gregorian, M.; Pathman, K.; Yumagulova, L.; Tse, W. Urban growth and long-term changes in natural hazard risk. Environ. Plann. A 2012, 44, 989–1008. [Google Scholar] [CrossRef]
- United Nations Office for Disaster Risk Reduction. Global Assessment Report on Disaster Risk Reduction. 2013. Available online: https://www.undrr.org/publication/global-assessment-report-disaster-risk-reduction-2013 (accessed on 6 March 2023).
- Visser, H.; Petersen, A.C.; Ligtvoet, W. On the relation between weather-related disaster impacts, vulnerability and climate change. Clim. Change 2012, 125, 461–477. [Google Scholar] [CrossRef]
- Gill, J.C.; Malamud, B.D. Reviewing and visualizing the interactions of natural hazards. Rev. Geophys. 2014, 52, 680–722. [Google Scholar] [CrossRef]
- Thodsen, H.; Baattrup-Pedersen, A.; Andersen, H.E.; Brask Jensen, K.M.; Mejlhede Andersen, P.; Bolding, K.; Ovesen, N.B. Climate change effects on lowland stream flood regimes and riparian rich fen vegetation communities in Denmark. Hydrol. Sci. J. 2016, 91, 344–358. [Google Scholar] [CrossRef]
- Ciulache, S.; Ionac, N. Essential in Meteorology and Climatology; Editura Universitară: Bucharest, Romania, 2007. (In Romanian) [Google Scholar]
- Gaume, E.; Bain, V.; Bernardara, P.; Newinger, O.; Barbuc, M.; Bateman, A.; Blaškovičová, L.; Blöschl, G.; Borga, M.; Dumitrescu, A.; et al. A compilation of data on European flash floods. J. Hydrol. 2009, 367, 70–78. [Google Scholar] [CrossRef]
- Askar, S.; Zeraat Peyma, S.; Yousef, M.M.; Prodanova, N.A.; Muda, I.; Elsahabi, M.; Hatamiafkoueieh, J. Flood Susceptibility Mapping Using Remote Sensing and Integration of Decision Table Classifier and Metaheuristic Algorithms. Water 2022, 14, 3062. [Google Scholar] [CrossRef]
- Pandey, M.; Arora, A.; Arabameri, A.; Costache, R.; Kumar, N.; Mishra, V.N.; Nguyen, H.; Mishra, J.; Siddiqui, M.A.; Ray, Y.; et al. Flood Susceptibility Modeling in a Subtropical Humid Low-Relief Alluvial Plain Environment: Application of Novel Ensemble Machine Learning Approach. Front. Earth Sci. 2021, 9, 659296. [Google Scholar] [CrossRef]
- Samanta, S.; Pal, D.K.; Palsamanta, B. Flood susceptibility analysis through remote sensing, GIS and frequency ratio model. Appl. Water Sci. 2018, 8, 66. [Google Scholar] [CrossRef]
- Dottori, F.; Martina, M.L.V.; Figueiredo, R. A methodology for flood susceptibility and vulnerability analysis in complex flood scenarios. J. Flood Risk Manag. 2016, 11, S632–S645. [Google Scholar] [CrossRef]
- Rincón, D.; Khan, U.T.; Armenakis, C. Flood Risk Mapping Using GIS and Multi-Criteria Analysis: A Greater Toronto Area Case Study. Geoscience 2018, 8, 275. [Google Scholar] [CrossRef]
- Sitterson, J.; Knightes, C.; Parmar, R.; Wolfe, K.; Muche, M.; Avant, B. An Overview of Rainfall-Runoff Types. U.S. Environmental Protection Agency, Office of Research and Development. EPA/600/R-14/152, 217. Available online: https://cfpub.epa.gov/si/si_public_record_report.cfm?dirEntryId=339328&Lab=NERL (accessed on 7 October 2023).
- England, J.F.; Cohn, T.A.; Faber, B.A.; Stedinger, J.R.; Thomas, W.O.; Veilleux, A.G.; Kiang, J.E.; Mason, R.R. Guidelines for Determining Flood Flow Frequency. Bull. 17C. U.S. Department of Interior, U.S. Geological Survey, Techniques and Methods 4-B5. 2018. Available online: https://pubs.usgs.gov/tm/04/b05/tm4b5.pdf (accessed on 7 October 2023).
- Yochum, S.E.; Scott, J.A.; Levinson, D.H. Methods for Assessing Expected Flood Potential and Variability: Southern Rocky Mountains Region. Water Resour. Resear. 2019, 55, 6392–6416. [Google Scholar] [CrossRef]
- Bellos, V. Ways for flood hazard mapping in urbanised environments: A short literature review. Water Util. J. 2012, 4, 25–31. [Google Scholar]
- Di Baldassarre, G.; Montanari, A.; Lins, H.; Koutsoyiannis, D.; Brandimarte, L.; Blöschl, G. Flood fatalities in Africa: From diagnosis to mitigation. Geophys. Res. Lett. 2010, 37, L22402. [Google Scholar] [CrossRef]
- Pham, B.T.; Avand, M.; Janizadeh, S.; Van Phong, T.; Al-Ansari, N.; Ho, L.S.; Das, S.; Van Le, H.; Amini, A.; Bozchaloei, S.K. GIS based hybrid computational approaches for flash flood susceptibility assessment. Water 2020, 12, 683. [Google Scholar] [CrossRef]
- Al-Juaidi, A.E.; Nassar, A.M.; Al-Juaidi, O.E. Evaluation of flood susceptibility mapping using logistic regression and GIS conditioning factors. Arab. J. Geosci. 2018, 11, 765. [Google Scholar] [CrossRef]
- Hong, Y.; Abdelkareem, M. Integration of remote sensing and a GIS-based method for revealing prone areas to flood hazards and predicting optimum areas of groundwater resources. Arab. J. Geosci 2022, 15, 114. [Google Scholar] [CrossRef]
- Alarifi, S.S.; Abdelkareem, M.; Abdalla, F.; Alotaibi, M. Flash Flood Hazard Mapping Using Remote Sensing and GIS Techniques in Southwestern Saudi Arabia. Sustainability 2022, 14, 14145. [Google Scholar] [CrossRef]
- Abrams, M.; Yamaguchi, Y.; Crippen, R. Aster Global Dem (GDEM) Version 3. Int. Arch. Photogramm. Remote Sens. Spatial Inf. Sci. 2022, XLIII-B4-2022, 593–598. [Google Scholar] [CrossRef]
- Albano, R.; Mancusi, L.; Sole, A.; Adamowski, J. FloodRisk, A collaborative free and open-source software for flood risk analysis. Geomat. Nat. Hazards Risk 2017, 8, 1812–1832. [Google Scholar] [CrossRef]
- Smith, G. Flash Flood Potential: Determining the Hydrologic Response of ffmp Basins to Heavy Rain by Analyzing Their Physiographic Characteristics. 2003. Available online: https://www.cbrfc.noaa.gov/papers/ffpwpap.pdf (accessed on 27 January 2023).
- Costache, R.; Zaharia, L. Flash-flood potential assessment and mapping by integrating the weights-of-evidence and frequency ratio statistical methods in GIS environment—Case study: Bâsca Chiojdului River catchment (Romania). J. Earth Syst. Sci. 2017, 126, 59. [Google Scholar] [CrossRef]
- Usman Kaoje, I.; Abdul Rahman, M.Z.; Idris, N.H.; Razak, K.A.; Wan Mohd Rani, W.N.M.; Tam, T.H.; Mohd Salleh, M.R. Physical Flood Vulnerability Assessment using Geospatial Indicator-Based Approach and Participatory Analytical Hierarchy Process: A Case Study in Kota Bharu, Malaysia. Water 2021, 13, 1786. [Google Scholar] [CrossRef]
- Ţîncu, R.; Zêzere, J.L.; Lazar, G. Identification of elements exposed to flood hazard in a section of Trotus River, Romania. Geomat. Nat. Hazards Risk 2018, 9, 950–969. [Google Scholar] [CrossRef]
- Popa, M.C.; Peptenatu, D.; Drăghici, C.C.; Diaconu, D.C. Flood Hazard Mapping Using the Flood and Flash-Flood Potential Index in the Buzău River Catchment, Romania. Water 2019, 11, 2116. [Google Scholar] [CrossRef]
- Ielenicz, M. Physical Geography of Romania, Volume II—Climate, Waters, Vegetation, Soils, Environment; Editura Universitară: Bucharest, Romania, 2007. (In Romanian) [Google Scholar]
- Velcea, V.; Savu, A. Geography of the Romanian Carpathians and Subcarpathians; Editura Didactică şi Pedagogică: Bucharest, Romania, 1982. (In Romanian) [Google Scholar]
- Ghinea, D. Geographical Encyclopaedia of Romania; Editura Enciclopedică: Bucharest, Romania, 2000. (In Romanian) [Google Scholar]
- Rejith, R.G.; Anirudhan, S.; Sundararajan, M. Delineation of Groundwater Potential Zones in Hard Rock Terrain Using Integrated Remote Sensing, GIS, and MCDM Techniques: A Case Study from Vamanapuram River Basin, Kerala, India. In GIS and Geostatistical Techniques for Groundwater Science; Venkatramanan, S., Prasanna, M.V., Chung, S.Y., Eds.; Elsevier: Amsterdam, The Netherlands, 2009. [Google Scholar] [CrossRef]
- Prăvălie, R.; Costache, R. The analysis of the susceptibility of the flash-floods genesis in the area of the hydrographical basin of Basca Chiojdului river. Forum Geogr. 2014, XIII, 39–49. [Google Scholar] [CrossRef]
- Zaharia, L.; Minea, G.; Toroimac, I.; Barbu, R.; Sârbu, I. Estimation of the Areas with Accelerated Surface Runoff in the Upper Prahova Watershed (Romanian Carpathians); BALWOIS: Ohrid, North Macedonia, 2012; Available online: https://www.academia.edu/3280129/Estimation_of_the_Areas_with_Accelerated_Surface_Runoff_in_the_Upper_Prahova_Watershed_Romanian_Carpathians (accessed on 23 January 2023).
- Saaty, T.L. The Analytic Hierarchy Process: Planning, Priority Setting, Resource Allocation; McGraw-Hill: New York, NY, USA, 1980. [Google Scholar]
- Hazard and Flood Risk Map (1st Cycle). Available online: https://inundatii.ro/portal-harti/ (accessed on 12 January 2023). (In Romanian).
- Jade, S.; Sarkar, S. Statistical model for slope instability classification. Eng. Geol. 1993, 36, 71–98. [Google Scholar] [CrossRef]
- Kiss, R. Determination of Drainage Network in Digital Elevation Models, Utilities and Limitations. J. Hung. Geomath. 2004, 2, 16–29. [Google Scholar]
- ***. Available online: https://grass.osgeo.org/grass82/manuals/addons/r.convergence.html (accessed on 12 January 2023).
- Ramesh, V.; Iqbal, S.S. Urban flood susceptibility zonation mapping using evidential belief function, frequency ratio, and fuzzy gamma operator models in GIS: A case study of Greater Mumbai, Maharashtra, India. Geocarto Int. 2022, 37, 581–606. [Google Scholar] [CrossRef]
- Sørensen, R.; Zinko, U.; Seibert, J. On the calculation of the topographic wetness index: Evaluation of different methods based on field observations. Hydrol. Earth Syst. Sci. 2006, 10, 101–112. [Google Scholar] [CrossRef]
- Kopecky, M.; Macek, M.; Wild, J. Topographic Wetness Index calculation guidelines based on measured soil moisture and plant species composition. Sci. Total Environ. 2021, 757, 143785. [Google Scholar] [CrossRef]
- Patel, K.F.; Fansler, S.J.; Campbell, T.P.; Bond-Lamberty, B.; Peyton-Smith, A.; Chowdhury, T.R.; McCue, L.A.; Varga, T.; Bailey, V.L. Soil texture and environmental conditions influence the biogeochemical responses of soils to drought and flooding. Commun. Earth Environ. 2021, 2, 127. [Google Scholar] [CrossRef]
- Sugianto, S.; Deli, A.; Miswar, E.; Rusdi, M.; Irham, M. The Effect of Land Use and Land Cover Changes on Flood Occurrence in Teunom Watershed, Aceh Jaya. Land 2022, 11, 1271. [Google Scholar] [CrossRef]
- Zhang, G.; Feng, G.; Li, X.; Xie, C.; Pi, X. Flood Effect on Groundwater Recharge on a Typical Silt Loam Soil. Water 2017, 9, 523. [Google Scholar] [CrossRef]
- Costache, R.; Prăvălie, R.; Mitof, I.; Popescu, C. Flood vulnerability assessment in the low sector of Sărăţel catchment. Case study: Joseni village. Carpath. J. Earth Environ. Sci. 2015, 10, 161–169. [Google Scholar]
- Data Classification Methods. Available online: https://pro.arcgis.com/en/pro-app/latest/help/mapping/layer-properties/data-classification-methods.htm (accessed on 20 January 2023).
- Jacinto, R.; Grosso, N.; Reis, E.; Dias, L.; Santos, F.D.; Garrett, P. Continental Portuguese Territory Flood Susceptibility Index—Contribution to a vulnerability index. Nat. Hazards Earth Syst. Sci. 2015, 15, 1907–1919. [Google Scholar] [CrossRef]
- Tehrany, M.S.; Pradhan, B.; Jebur, M.N. Flood susceptibility mapping using a novel ensemble weights-of-evidence and support vector machine models in GIS. J. Hydrol. 2014, 512, 332–343. [Google Scholar] [CrossRef]






| Factors | Type/Values | ||||
|---|---|---|---|---|---|
| Slope (degrees) | 22.65–44.1 | 15.39–22.65 | 10.37–15.39 | 5.36–10.37 | 0–5.36 |
| Aspect | N, NW, NE | W, E | Flat, S, SW, SE | ||
| Hypsometry (m) | 1079–1481 | 818–1079 | 606–818 | 430–606 | 229–430 |
| Convergence index | >(−3.2) | (−9.6)–(−3.2) | <−9.6 | ||
| Drainage density (km/km2) | 0–0.79 | 0.79–1.58 | 1.58–2.37 | 2.37–3.16 | 3.16–3.95 |
| TWI | 2.84–5.49 | 5.49–7.04 | 7.04–9.37 | 9.37–13.73 | 13.73–22.67 |
| Profile curvature (radians/m) | 0.1–3.41 | (−4.38)–(−0.1) | (−0.1)–0.1 | ||
| Catchment shape index | 0.65–0.70 | 0.61–0.65 | 0.49–0.61 | 0.39–0.49 | 0.27–0.39 |
| Precipitation (mm/year) | 600–700 | 700–800 | 800–900 | ||
| Soil | sandy−loamy, loamy−sandy | sandy and loamy | varied textures, clayey, clayey−loamy | loamy−clayey, loamy | loamy |
| Lithology | Gravels, sands and loess−like deposits | Marly limestones, marls, and limy sandstones Marls−clays, limy sandstones Sands, marls, clays | Marls, clays, sandstones, Marls, gray clays, gypsum and salts Beds of Krosno−Pucioasa type; clays, gray marls with insertions of sandstones Red marls with Globotruncana | Clayey schists, breccia, buried salt diaper. Schists, gypsum, glauconitic sandstones (beds of Cornu) Quartzitic conglomerates, orthoquartzites, shales Convolute sandstones, marls, massive sandstones (series of Convolute Flysch) | Conglomerates and sandy flysch (conglomerates of Hacigosu, Stanisoara, and Ceahlau) Convolute micaceous sandstones (series of Macla−Zagon) |
| Land use | Broad-leaved forest Coniferous forest Mixed forest | Fruit trees and berry plantations Transitional woodland/shrub Beaches, dunes, sands | Complex cultivation patterns Land with agriculture and natural vegetation Non-irrigated arable land | Pastures Natural grassland Mineral extraction sites | Settlements Water bodies Industrial or commercial units |
| Given score | 1 | 2 | 3 | 4 | 5 |
| FPI | 2.06−2.65 (very low) | 2.65−3.02 (low) | 3.02−3.34 (medium) | 3.34−3.68 (high) | 3.68−4.50 (very high) |
| Factor | SL | A | HY | CF | DD | TWI | PC | CS | P | S | LH | LU | Weights |
|---|---|---|---|---|---|---|---|---|---|---|---|---|---|
| SL | 1.00 | 2.00 | 0.50 | 0.50 | 3.00 | 1.00 | 1.00 | 0.25 | 1.00 | 0.33 | 0.33 | 0.50 | 0.055 |
| A | 0.50 | 1.00 | 0.33 | 0.25 | 1.00 | 0.50 | 0.50 | 0.25 | 0.50 | 0.33 | 0.33 | 0.25 | 0.031 |
| HY | 2.00 | 3.00 | 1.00 | 1.00 | 2.00 | 2.00 | 3.00 | 0.50 | 2.00 | 0.50 | 1.00 | 1.00 | 0.098 |
| CF | 2.00 | 4.00 | 1.00 | 1.00 | 3.00 | 3.00 | 2.00 | 0.50 | 2.00 | 1.00 | 0.50 | 0.50 | 0.1 |
| DD | 0.33 | 1.00 | 0.50 | 0.33 | 1.00 | 1.00 | 2.00 | 0.50 | 1.00 | 0.33 | 0.33 | 0.50 | 0.048 |
| TWI | 1.00 | 2.00 | 0.50 | 0.33 | 1.00 | 1.00 | 1.00 | 0.25 | 0.50 | 0.33 | 0.50 | 0.33 | 0.043 |
| Pc | 1.00 | 2.00 | 0.33 | 0.50 | 0.50 | 1.00 | 1.00 | 0.33 | 1.00 | 0.33 | 0.50 | 0.33 | 0.045 |
| CS | 4.00 | 4.00 | 2.00 | 2.00 | 2.00 | 4.00 | 3.00 | 1.00 | 2.00 | 2.00 | 2.00 | 1.00 | 0.16 |
| P | 1.00 | 2.00 | 0.50 | 0.50 | 1.00 | 2.00 | 1.00 | 0.50 | 1.00 | 0.50 | 1.00 | 1.00 | 0.067 |
| S | 3.00 | 3.00 | 2.00 | 1.00 | 3.00 | 3.00 | 3.00 | 0.50 | 2.00 | 1.00 | 1.00 | 1.00 | 0.122 |
| LH | 3.00 | 3.00 | 1.00 | 2.00 | 3.00 | 2.00 | 2.00 | 0.50 | 1.00 | 1.00 | 1.00 | 0.50 | 0.103 |
| LU | 2.00 | 4.00 | 1.00 | 2.00 | 2.00 | 3.00 | 3.00 | 1.00 | 1.00 | 1.00 | 2.00 | 1.00 | 0.126 |
| Sum | 20.83 | 31.00 | 10.66 | 11.41 | 22.50 | 23.50 | 22.50 | 6.08 | 15.00 | 8.65 | 10.49 | 7.91 | 1.00 |
Disclaimer/Publisher’s Note: The statements, opinions and data contained in all publications are solely those of the individual author(s) and contributor(s) and not of MDPI and/or the editor(s). MDPI and/or the editor(s) disclaim responsibility for any injury to people or property resulting from any ideas, methods, instructions or products referred to in the content. |
© 2023 by the authors. Licensee MDPI, Basel, Switzerland. This article is an open access article distributed under the terms and conditions of the Creative Commons Attribution (CC BY) license (https://creativecommons.org/licenses/by/4.0/).
Share and Cite
Popescu, N.-C.; Bărbulescu, A. Flood Hazard Evaluation Using a Flood Potential Index. Water 2023, 15, 3533. https://doi.org/10.3390/w15203533
Popescu N-C, Bărbulescu A. Flood Hazard Evaluation Using a Flood Potential Index. Water. 2023; 15(20):3533. https://doi.org/10.3390/w15203533
Chicago/Turabian StylePopescu, Nicolae-Cristian, and Alina Bărbulescu. 2023. "Flood Hazard Evaluation Using a Flood Potential Index" Water 15, no. 20: 3533. https://doi.org/10.3390/w15203533
APA StylePopescu, N.-C., & Bărbulescu, A. (2023). Flood Hazard Evaluation Using a Flood Potential Index. Water, 15(20), 3533. https://doi.org/10.3390/w15203533


