Article

Hydrogeochemical Characteristics, Water Quality, and Human Health Risks of Groundwater in Wulian, North China

1
College of Energy and Mining Engineering, Shandong University of Science and Technology, Qingdao 266590, China
2
Shandong Eighth Geological and Mineral Exploration Institute, Rizhao 276800, China
*
Author to whom correspondence should be addressed.
Water 2023, 15(2), 359; https://doi.org/10.3390/w15020359
Submission received: 3 December 2022 / Revised: 30 December 2022 / Accepted: 31 December 2022 / Published: 15 January 2023
(This article belongs to the Topic Human Impact on Groundwater Environment)

Abstract

:
Groundwater shortage and pollution are critical issues of global concern. In Wulian County, a typical hilly area, groundwater is the main source of water supply. This study investigates the current situation of groundwater pollution in Wulian City through the analysis of groundwater water chemistry characteristics, water quality evaluation, and health risk evaluation. After the analysis of the controlling factors of chemical components in groundwater and the analysis of ion sources, the main ion sources in groundwater were determined. The results showed that the major cations in groundwater were Ca2+ and Na+ and the major anions were HCO3 and SO42−. Nevertheless, NO3 exceeded the standard to different degrees in pore water (PW), fissure pore water (FPW), and fissure water (FW). The minimum NO3 concentration exceeded the standard in FW. Under the influence of rock weathering and salt rock dissolution, the main hydrochemical types of groundwater were the HCO3-Ca, HCO3-Ca·Mg, and SO4·Cl-Ca·Mg types. According to the water quality evaluation and health risk assessment, the FW area in the south had the highest water quality, where Class I water appeared and potable water was more widely distributed. The PW and FPW areas in the north had lower water quality, with higher health risks. Category V water gradually appeared in the FPW area, which is not suitable as a water supply source. Factor analysis and ion ratio analysis showed that the study area is strongly affected by anthropogenic factors. These research methods have important reference value to the research of groundwater pollution status.

1. Introduction

Suitable groundwater characteristics, such as wide distribution and good quality, are of great significance to water supply, which is crucial for economic, industrial, and agricultural development [1,2,3]. However, in many cities, economic development is achieved at the cost of the over-exploitation of groundwater and excessive use of chemical fertilizers and pesticides [4,5,6], resulting in groundwater shortage and pollution and even affecting human health [3,7,8,9,10]. In recent years, the issue of groundwater pollution has become increasingly serious with the progress of social development [11,12,13,14,15,16]. Under the influence of anthropogenic factors and climate change, many cities around the world are facing serious groundwater pollution [17,18]. Therefore, water quality and water security have become issues of global concern.
The chemical composition of groundwater is attributable to the long-term interaction between groundwater and its surrounding environment, and the type and concentration of substances in groundwater are significantly affected by geological, climatic, and human factors [19,20]. Groundwater chemical characteristics and their controlling factors can be analyzed using many widely used and effective methods, including mathematical analyses, Piper diagrams [21], correlation analyses, Gibbs diagrams [22], and ion ratios [23]. Among various common methods for water quality evaluation, the entropy-weighted water quality index (EWQI) is an objective method that converts a large number of measured water quality data into a simple water quality index and determines the index weight according to the variation degree of each index value. This method can avoid deviations caused by human factors [24,25]. The risk of groundwater to human health can be quantitatively described, and the risk level of nitrate ions to human health can be classified through health risk assessments [26,27]. Factor analysis (FA) is a suitable tool for determining key control factors through multivariate dimension reduction, analyzing the relationship between principal components, and preliminarily determining the source of nitrate ions in groundwater.
Located in the south of the Shandong Peninsula, China, Wulian is a hilly area with groundwater as the primary source of water. With the rapid agricultural development, the use of chemical fertilizers and pesticides has also increased, which has led to serious pollution of the water environment. In order to understand the current situation of groundwater pollution and the sustainable utilization of groundwater resources, it is necessary to study the chemical characteristics of the groundwater environment in the area [28,29]. Previous studies have investigated water pollution in the south of the Shandong Peninsula. For example, Song et al. [30] studied the pollution status, distribution, and source of heavy metals in groundwater in the south of the Shandong Peninsula. He et al. [31] analyzed the hydrochemical characteristics of groundwater in the southern Shandong Peninsula. However, these studies paid little attention to groundwater pollution in the Wulian area.
In this study, the quality of different types of groundwater and their risks to human health are investigated using hydrochemical analysis, the entropy weight method, health risk assessments, and other methods. FA is also conducted to identify the source of nitrate ions in groundwater. The main objectives of this study are to (1) analyze the chemical characteristics and controlling factors of different types of groundwater in the study area; (2) analyze the water quality of different types of groundwater; (3) evaluate the health risks of different types of groundwater; and (4) identify the source of nitrate ions in groundwater. This study provides a theoretical basis for the prevention and control of groundwater pollution and the establishment of a high-quality groundwater source.

2. Materials and Methods

2.1. Study Area

The study area (Figure 1) is located in Hongning Town and Gaoze Town of Wulian County in the south of the Shandong Peninsula (119°12′–119°20′ E, 35°39′–35°51′ N). The region has a warm and semi-humid continental monsoon climate with four distinct seasons. The temperature of this area has a wide annual range, with a monthly average temperature from −4.6 to 26.8 ℃ over many years. The annual average precipitation is 784.1 mm, decreasing from 825 mm/a in the south to 725 mm/a in the north. The annual precipitation shows obvious seasonal changes, with an average of one rainstorm a year, mostly concentrated in the period from June to September. During this period, precipitation can reach 210 mm, often causing flood events. However, the precipitation from November to April is only 10–40 mm.
Rivers in the study area are vertically and horizontally distributed, most of which belong to seasonal, intermittent rivers and are mainly fed by rainfall–runoff. The county has a large basin area comprising the Shu River system, the Wei River system, the Futuna River system, and the Chaobai River system. The rivers originate from the mountains in the central part of the county, and the tributaries radiate outward. According to the regional geological survey report of Wulian at the 1:50,000 scale, Wulian is located in the low hilly area of southeast Shandong Province on the coast of the Yellow Sea. The overall terrain is high in the middle and low in the north and south. The hilly area with low mountains covers 86% of Wulian, and the plain area is smaller, covering only 14% of the area. The topography of the area fluctuates widely, with developed gullies and foundation stones at the bottom of exposed gullies. Wulian County has a complex geological structure with folds and faults. Metamorphic rocks are multi-stage intrusive rocks with large distribution, complex strata, large changes in lithology and lithofacies, and uneven quaternary sedimentary distribution.
Based on the type of void ratio, stratigraphic combinations, groundwater conditions, and hydrodynamic characteristics, the groundwater in Wulian County is divided into three types: pore water (PW), fissure pore water (FPW), and fissure water (FW). PW aquifers have a limited distribution area, with a maximum burial depth of 3 m, annual variation of 0.2–1.2 m, and thickness of more than 3 m. The water inflow in a single well is generally less than 1000 m3/d. FPW aquifers are characterized by developed fractures and pores, and most of them are distributed in high terrain, with a thickness of more than 100 m, maximum burial depth of 3 m, and poor water yield. The water inflow in a single well is generally less than 100 m3/d or even zero. FW aquifers comprise pure marble, metamorphic rocks, and intrusive rocks, with a maximum burial depth of 4 m. The marble aquifers have relatively developed karst fissures, high water abundance, and a developed water-blocking water-storage structure, which is suitable for water supply. The metamorphic and intrusive water-bearing formations, including various stages of magmatic rocks such as diorite and granite, are dense, hard, and resistant to weathering, with undeveloped fractures. These rocks have poor water abundance, and the water inflow in a single well is less than 100 m3/d. In this area, groundwater is mainly replenished by precipitation recharge, near-shore recharge, and lateral recharge from downstream to upstream.

2.2. Sample Collection and Measurements

In this study, 40 groundwater samples were collected from representative wells. Employing uniform sampling, groundwater samples were collected according to the DZ/T0133-94 standard of the “Procedures for Dynamic Monitoring of Groundwater”. PW is mainly distributed in the western part of the study area, and samples were collected at depths ranging from 5 to 10 m. FPW is mainly distributed in the northern part of densely populated residential areas, and the sampling points were mostly civil wells, with sampling depths ranging from 5 to 20 m. FW is distributed in the southern area, where farmlands are concentrated, and the sampling points were mostly mechanical wells, with sampling depths ranging from 50 to 100 m. According to the principle of uniform sampling, 9 PW, 9 FPW, and 22 FW samples were collected. Bottles were rinsed with the sample water 2–3 times before sampling. In this manner, the purity of the samples was ensured. The sampling bottle was then filled with flowing water to avoid the interference of external conditions such as air. For unstable components of water, a stabilizer such as HgCl2 was added to the samples to maintain their relative stability during transportation. After extraction, the samples were sealed and labeled, and their details were recorded. Anti-shock and anti-freezing measures were implemented while avoiding direct sunlight. The samples were immediately sent to a specialized laboratory for composition analysis. pH and total dissolved solids (TDSs) were measured directly on-site using a portable instrument (HQ40D, HACH). Groundwater samples were analyzed in the laboratory for cations by inductively coupled plasma-optical emission spectrometry (ICP-OSE) (Optima 7000 DV, USA) and for anions through ion chromatography (Thermo Fisher ICS600, Waltham, MA, USA) and chemical oxygen demand (COD); total hardness (TH) was determined by titration [32]. All the water samples were divided into four parts, one of which was temporarily used as a backup water sample and the other three for triplicate measurements. The mean value of the three measurements was taken as the final result. The error calculated using the charge balance method was within ±5%, and the measurement method showed a small deviation and high precision [20]. The formula for calculating the error is shown in Equation (1).
CBE = cation anions cation + anions × 100

2.3. Analysis Methods

2.3.1. Analysis of Hydrochemical Composition

Firstly, the basic properties of the chemical components of groundwater were analyzed using mathematical statistics [33]. Secondly, a Piper diagram [21] was used to classify the hydrochemical types of groundwater. Thirdly, water quality assessment [18,24] and health risk assessment [27] were conducted to understand the status of groundwater quality. Fourthly, correlation maps were used to analyze the correlation among chemical components, and a Gibbs diagram [22] and the ion ratio [34] were combined to analyze the controlling factors of the ion components. Finally, FA [35] was performed to identify the sources of nitrate ions in groundwater.

2.3.2. Water Quality Analysis

In this study, the EWQI method was used to evaluate the general status of groundwater quality. This method can be used to generally classify groundwater quality and assess the suitability of groundwater for drinking water and irrigation water [36]. The basic principle is to integrate a large amount of water quality data and convert them into an easily understandable indicator of groundwater quality that can be qualitatively expressed [37]. To apply this method, relevant formulas were adopted [25,34], and the specific steps are as follows:
(1) Establish an initial water quality matrix [25,34].
In the initial data matrix X , n represents the number of groundwater samples, m is the number of evaluation indexes, and x i j represents the initial value of the j th evaluation index of the i th water sample point.
X = x 11 x 12 x 1 m x 21 x 22 x 2 m x n 1 x n 2 x n m
(2) Data standardization
In the original water quality data, the matching of different evaluation indicators and water sample points is quite different, and large errors will be generated during the calculation. Therefore, it is necessary to standardize the original data [25,34].
y i j = x i j ( x i j ) m i n ( x i j ) m a x ( x i j ) m i n
where ( x i j ) m i n and ( x i j ) m a x represent the minimum and maximum values of the evaluation index in the initial matrix, respectively [25,34]. The normalized matrix is shown in Equation (4):
Y = y 11 y 12 y 1 m y 21 y 22 y 2 m y n 1 y n 2 y n m
(3) Calculation and determination of entropy weight [25,34]
In this study, the entropy weight method is used to determine the weight of different indicators.
P i j = y i j i = 1 n y i j
e j = 1 ln n i = 1 n P i j ln P i j
where in P i j represents the entropy value in the evaluation index; e j represents the information entropy in the evaluation index. Then, the entropy weight ( w i ) can be calculated, as shown in Equation (7):
w i = 1 e j j = 1 m 1 e j
(4) Calculation of quality ( q i ) [25,34]
q i = C i S j × 100
q p H = C p H 7 8.5 7 × 100   C p H > 7   7 C p H 8.5 7 × 100   C p H < 7
where C i and C p H are the measured concentration and the pH of the ith water sample point, respectively; S j is the groundwater quality standard.
(5) Solution of water quality index [25,34]
WQI = j = 1 n w j q i
(6) Water quality classification [25,38]
According to the calculation results, water quality was divided into five categories: Class I to Class V, representing groundwater of excellent (WQI < 25), good (WQI = 25–50), medium (WQI = 50–100), poor (WQI = 100–150), and very poor (WQI > 150) quality.

2.3.3. Health Risk Assessment

In this study, the health risk assessment model recommended by the United States Environmental Protection Agency (USEPA) was used to evaluate and analyze the hazard of nitrate ions in groundwater. The health risk assessment method is a typical “four-step method” [39], including hazard identification, dose–response relationship, exposure assessment, and risk characterization [40].
H Q = I O r a l D R f
In Equation (11), H Q is the non-carcinogenic risk index, I O r a l is the dose of non-carcinogens in drinking water mg/(kg·days), D R f is the reference dose of non-carcinogens in water mg/(kg·days), and the reference dose of nitrate in drinking water is 1.6 mg/(kg·days) [41]. According to the USEPA [42,43], when H Q < 1, the non-carcinogenic pollution in groundwater is in the acceptable range of health risk, while H Q > 1 is in the unacceptable range.
The dose for non-carcinogens (nitrates) entering the body via drinking water is calculated as follows [44]:
I O r a l = C × I R × E F × E D B W × A T  
In Equation (12), C is the laboratory-measured concentration of nitrate in groundwater (mg/L). I R is the daily water intake (L/d), which is taken as 0.78 and 2.5 L/d for children and adults, respectively [11,45]. E F is exposure frequency (d/a), for which the standard is 365 d/a for both adults and children, and E D is exposure duration (a), for which the standard is 45 and 12 a for adults and children, respectively. B W is the mean body weight, for which the standard is 65 and 18.7 kg for adults and children, respectively. A T is the average time, calculated as E D × 365 days, for which the standard is 16,425 and 4380 d for adults and children, respectively [46].

2.3.4. Source Identification of Nitrate

FA is an effective method for the dimensionality reduction of variables. This method can be used to restore and analyze the multivariate data of groundwater, reflect most of the original information of many indicators, and reduce the loss of key information. FA is helpful for the extraction and classification of potential factors in the original data, such that a more intuitive understanding of the groundwater system can be achieved. In this study, 11 indicators of the three groundwater types were standardized and their dimensions were reduced. Principal component analysis was used to analyze the variance of common factors and the interpretation of total variance. Variance with a characteristic value greater than 1 was extracted. The absolute value of factor loadings of 0.30–0.50, 0.50–0.75, and ≥0.75, respectively, represent weak, medium, and strong grades. Factor scores were calculated by regression methods, which are convenient and easy to apply [33] and can also reflect the degree of influence. A positive factor score indicates that the area is most affected by the process represented by the factor, a negative factor score indicates that it is not affected by the representative factor, and a score close to zero indicates that the area is affected on an average scale. FA can be used to extract and analyze pollution factors in groundwater. Combined with the chemical analysis of groundwater, this method can be used to preliminarily assess the nitrate source to provide a theoretical basis for establishing a high-quality water supply area and to carry out pollution prevention and water quality treatment in later development activities and the utilization of groundwater.

3. Results and Discussion

3.1. Groundwater Chemical Characteristics

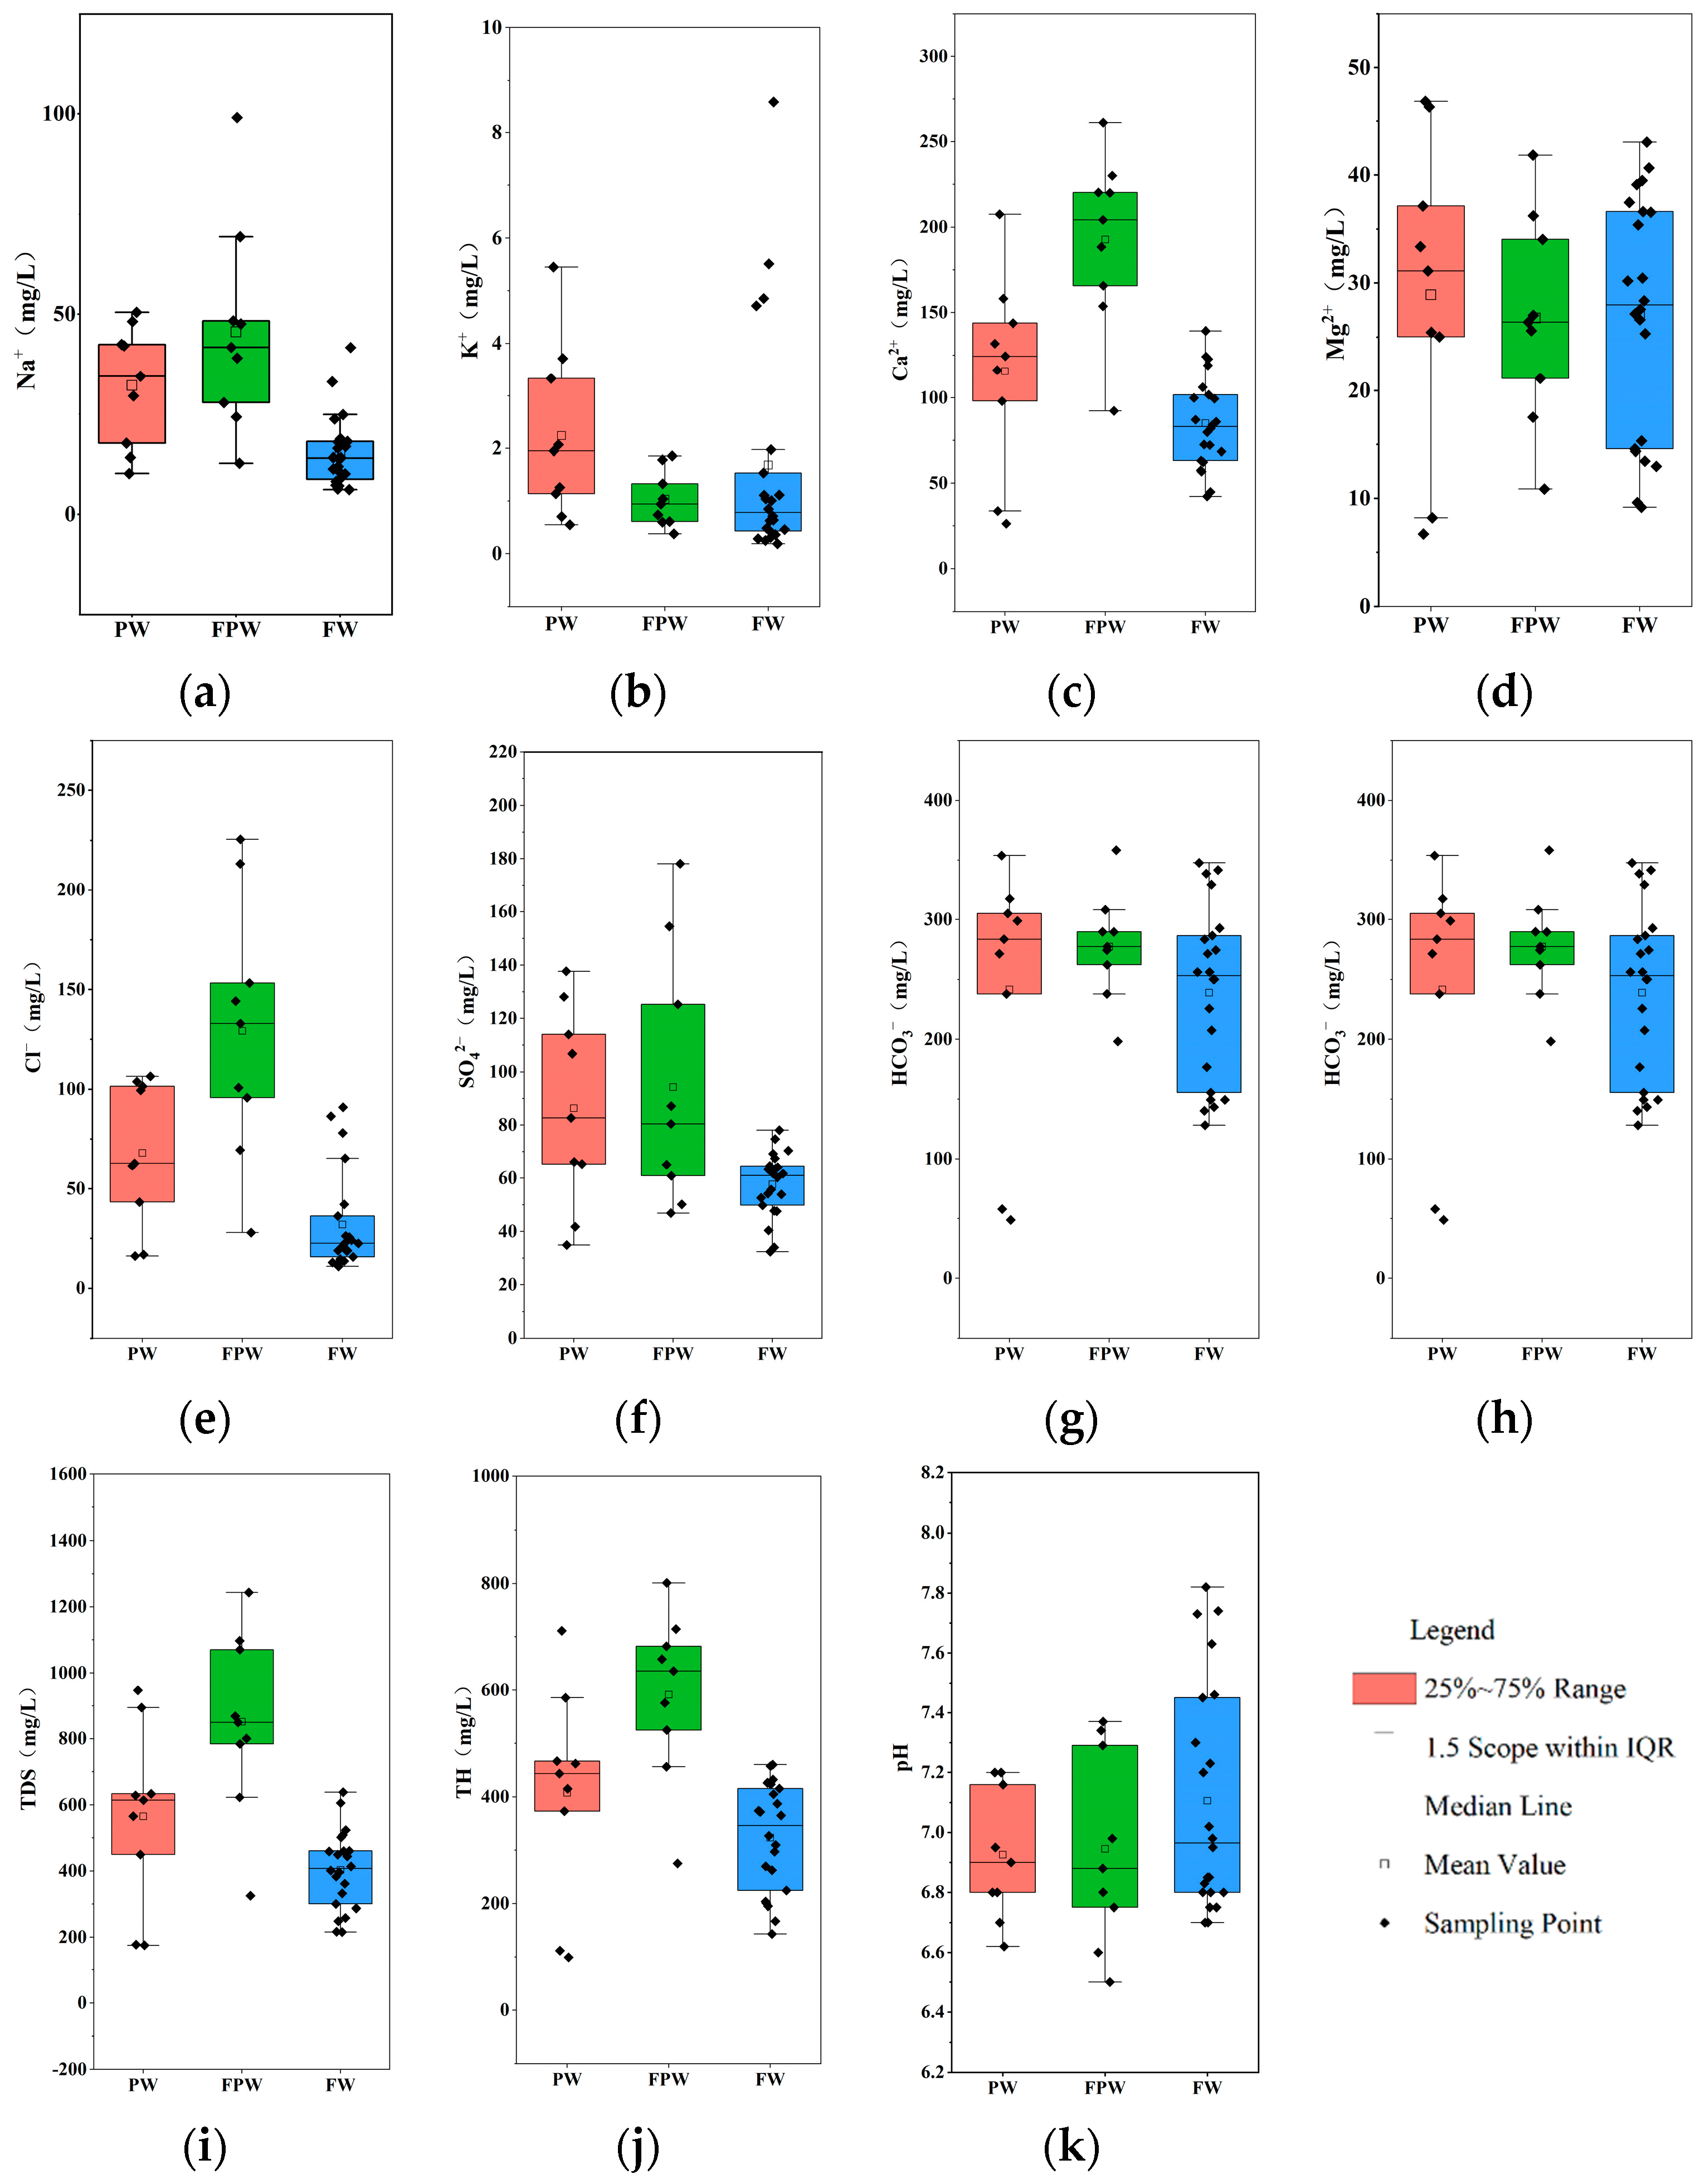
The mathematical and statistical analysis of groundwater chemical compositions of different groundwater samples in the study area was carried out, and boxplots of different chemical compositions are shown in Figure 2.
According to the box plots, the minimum pH values of PW and FPW were 6.62 and 6.5, respectively, with mean values of 6.93 and 6.95, showing an overall weak acidity. The maximum pH of FW was 7.82, with a mean value corresponding to weakly alkaline water. Total dissolved solids (TDSs) and total hardness (TH) are not only the main indexes of groundwater chemical analysis but also the main indexes of groundwater quality. TDS and TH showed wide variation among different types of groundwater in the study area. TDS showed the strongest dispersion in PW, with a maximum value of 946.88 mg/L, a minimum value of 175.47 mg/L, and a mean value of 565.27 mg/L. TDS generally ranged from 25% to 75%, but there was one concentration outlier. FPW showed the highest TDS, with a peak value of 1243.51 mg/L, an outlier value of only 325.29 mg/L, and a mean value of 851.37 mg/L. The overall TDS was at a high level, and the level of water pollution was relatively serious. TDS was relatively concentrated in FW, ranging from 215.42 to 638.55 mg/L, with a mean value of 403.08 mg/L. TH showed a similar degree of dispersion to TDS, with PW and FPW generally corresponding to brackish hard water, which is closely related to the dissolution of soluble salts and minerals. Nevertheless, FW showed better water quality, generally corresponding to soft freshwater. This situation is speculated to be more related to human activities [47].
The main cations in different types of groundwater were found to be Ca2+ and Na+. Groundwater with high contents of Ca2+ and Mg2+ is known to affect human health [48]. According to the box chart, the Ca2+ + Mg2+ concentrations in the three types of groundwater were 254.45, 302.95, and 182.36 mg/L, respectively. This may be related to water–rock interactions within the permissible concentration range for drinking water [38,48]. The concentrations of HCO3 were 48.82–353.92, 198.32–358.32, and 128.14–347.81 mg/L in PW, FPW, and FW, respectively, with the highest concentration among the anions. The concentration of SO42− showed little variation among the three types of groundwater, and the maximum concentration was 178.11 mg/L in FPW, which meets the drinking water standard. The concentration of Cl widely varied, with mean values of 67.98, 129.20, and 32 mg/L in PW, FPW, and FE, respectively, and the overall concentration was relatively low. NO3 can be used as a reflection of the impact of human activities on groundwater, and it was detected in all water samples, with concentration ranges of 19.96–262.04, 12.5–344.79, and 0.15–188.62 mg/L in the three water samples. NO3 was the most dispersed in FW, with three nitrate ion outliers, including two extreme outliers, indicating the poor stability and large spatial variability of NO3 in groundwater. The maximum concentrations of NO3 in FPW and PW were higher than that in FW. In the statistical analysis, the standard exceedance rates of FPW, PW, and FW were 88.9%, 44.4%, and 18.2%, respectively, which are all at a high level and indicate serious nitrate pollution. According to Figure 1, settlements near FW are relatively scattered, with small distribution density and many farmlands, while areas near FPW have more concentrated settlements, with shallow groundwater depth and dense population. Therefore, the NO3 variability in groundwater was initially attributed to human production and living activities.

3.2. Hydrochemical Types

The Piper diagram [21] is a generally used and effective method for the classification of groundwater hydrochemical types [7]. In this study, AqQA software was used to arrange and project the water sample points to the corresponding positions of the Piper diagram according to the groundwater types. As shown in Figure 3, the three groundwater samples were all located in Zones I and II of the rhombus area and were distributed in strips, representing the HCO3-Ca·Mg and SO4·Cl-Ca·Mg types, respectively. The A, B, and E zones in the triangle represent the calcium type, no dominant type, and the bicarbonate type, respectively. Accordingly, the groundwater of the study area mainly corresponds to the HCO3-Ca type, the HCO3-Ca·Mg type, and the SO4·Cl-Ca·Mg type. Ca2+ and Mg2+ in the water samples account for the vast majority of total ions in the groundwater. However, the percentage distribution of the anion content is relatively dispersed, and HCO3 + CO32− range from 75% to 25%. According to the distribution areas of different types of groundwater, FW is distributed in the lower left corner of the strip area, and the distribution is concentrated, indicating that this type of groundwater occurs in an environment with strong hydrodynamic conditions. Gradually to the upper right of the strip area, FPW and PW appear in turn. In addition, the distribution of FPW is scattered, and the projection points appear in the middle and upper right of the strip, indicating that the hydrodynamic conditions of this type of groundwater are widely varied across different regions.

3.3. Groundwater Quality Assessment

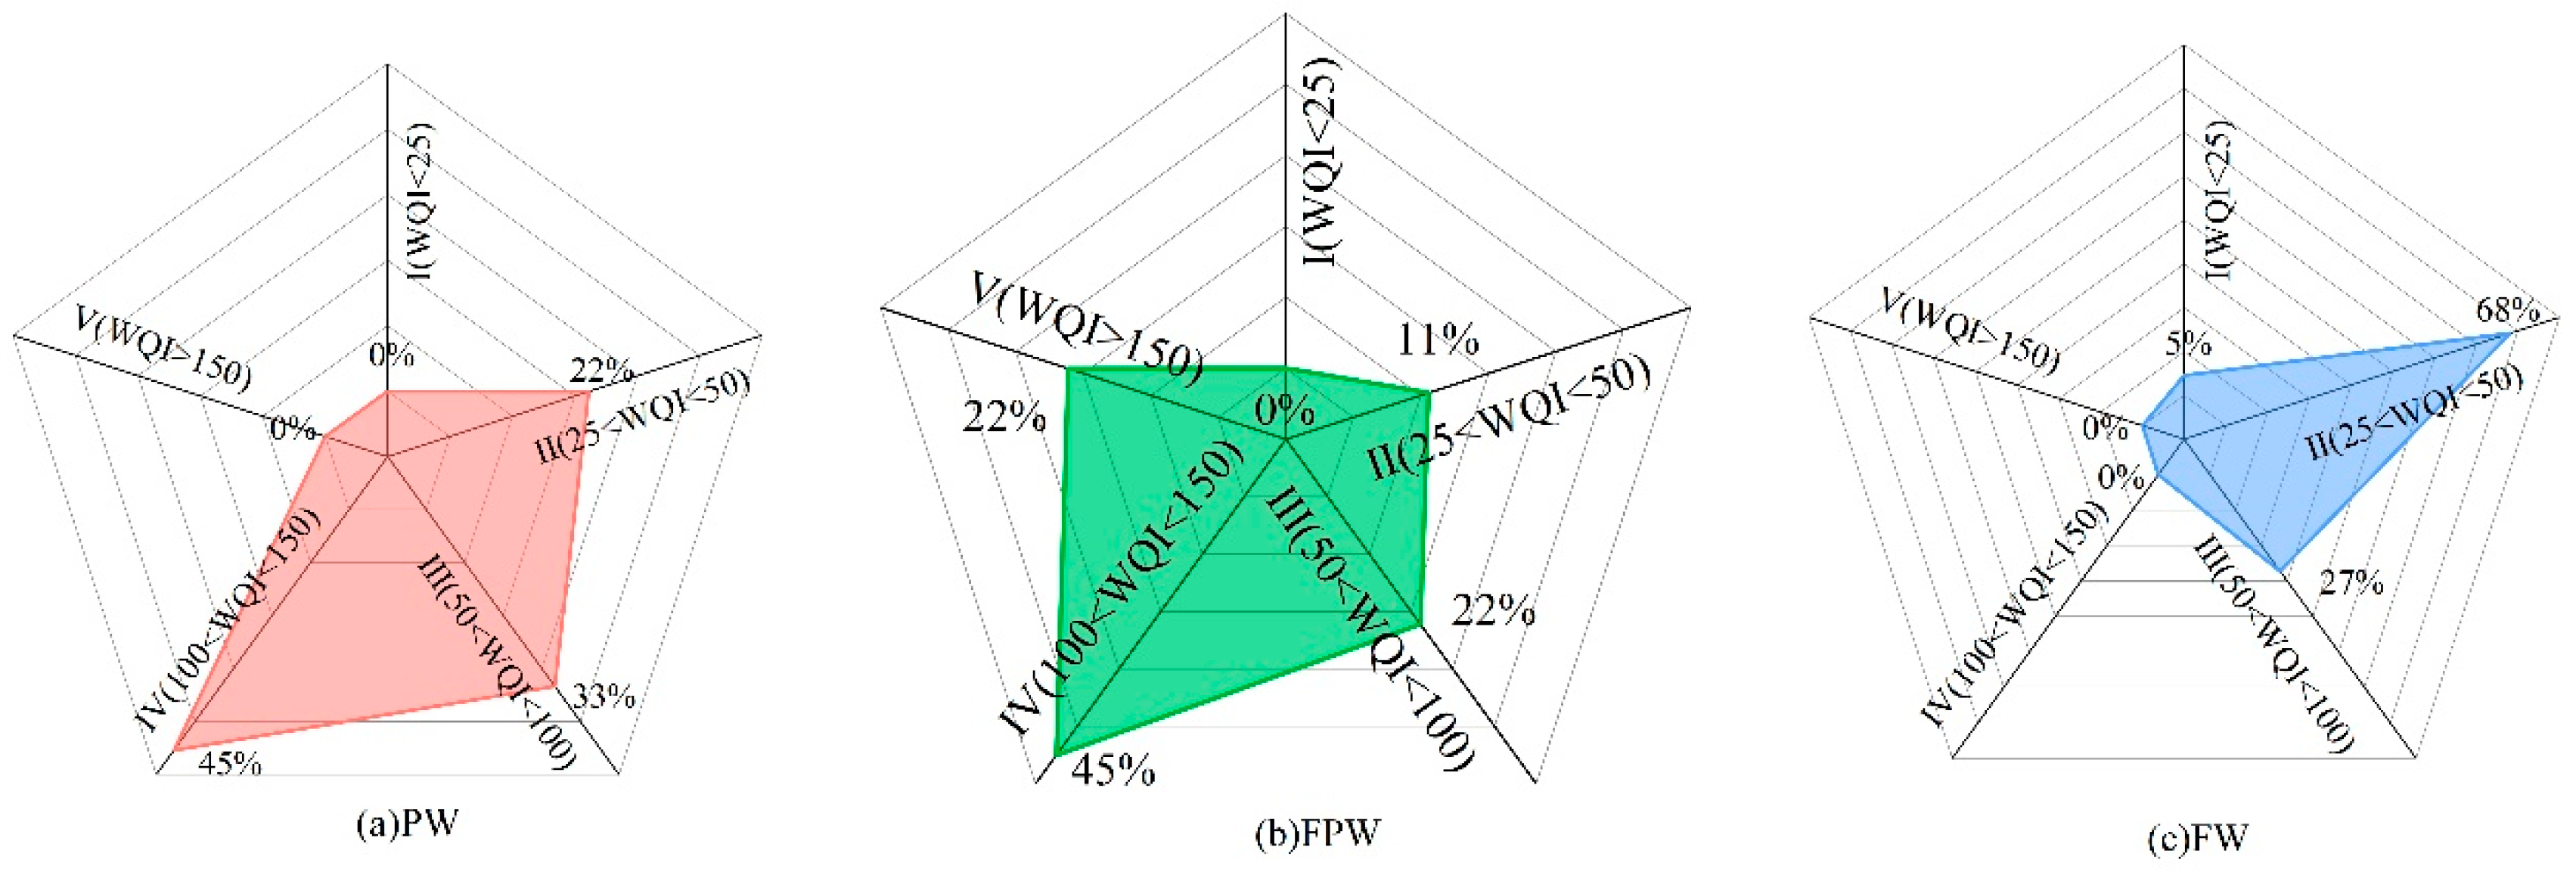
The water quality of the 40 samples of the three groundwater types in the study area was calculated and evaluated through the entropy weight formula, and their water quality conditions were found to vary widely. Among the nine samples of PW, two, three, and four samples corresponded to Classes II, III, and IV, accounting for 22%, 33%, and 45%, respectively, as shown in Figure 4a. Overall, the quality of PW was poor. According to the water quality standard (GB 5749-2006), only Class II water in the water sample can be used as central drinking water, and the rest is generally used as industrial and agricultural water (GB/T 14848-2017). Regarding the nine samples of FPW, 11%, 22%, 45%, and 22% of samples were of Classes II, III, IV, and V, respectively, as shown in Figure 4b. The Class V standard was identified only in FPW, and the concentration of nitrate ion was the highest in this class, reaching 345 mg/L, which is more than six times the WHO limit [48]. Most FPW samples were collected near villages, and the impact of domestic sewage on underground water quality was thus fully considered. Regarding the 22 samples of FW, 5%, 68%, and 27% corresponded to Classes I, II, and III, respectively, as shown in Figure 4c. Accordingly, FW exhibited the highest water quality among the three types. Class I water was identified only in FW, and the nitrate ion concentration was generally low. Considering the quality assessment results of FPW, groundwater quality is closely related to nitrate ion concentration. According to the GB 5749-2006 standard, Class I and II water can be used as drinking water. Therefore, the FW distribution area features a large amount of drinkable Class I and II water. On the whole, water quality deteriorates from the FW distribution area in the south and northeast of the study area to the PW and FPW distribution areas in the northwest. The FPW distribution area has poor water quality, mainly of Class IV.

3.4. Health Risk Assessment

Many countries pay close attention to the risks of NO3 to the human body [48]. After NO3 enters the human body through drinking water, nitrate ions will decompose into nitrite, resulting in methemoglobinemia [49], which poses a great risk to the human body. In this study, the health risk of nitrate ions in groundwater to adults and children was evaluated using the model recommended by USEPA. The magnitude of risk in different types of groundwater varies for adults and children.
The calculated results (Table 1) showed that the range of HQ in PW was 0.54–6.86 for adults and 0.52–6.83 for children, with mean values of 2.37 and 2.27, respectively. The proportion of water samples exceeding the risk limit of HQ (HQ = 1) was relatively high, being 44%. Regarding FPW, the range of HQ for adults and children was 0.34–9.37 and 0.33–8.99, with mean values of 5.41 and 5.19, respectively. The proportion of samples exceeding the risk limit of HQ (HQ = 1) reached 89%. This type of groundwater poses the biggest threat to human health. In contrast, FW posed the smallest risk, ranging from 0.004 to 5.31 for adults and 0.004 to 4.92 for children, with mean values of 1.19 and 1.14, respectively. The HQ value was mostly located near the risk limit value, and the proportion of water samples exceeding the HQ limit (HQ = 1) was 45% and 41%. The low risk of nitrate ions in FW is consistent with the water quality evaluation results, which are closely related to the distribution of villages and farmland near different types of groundwater.
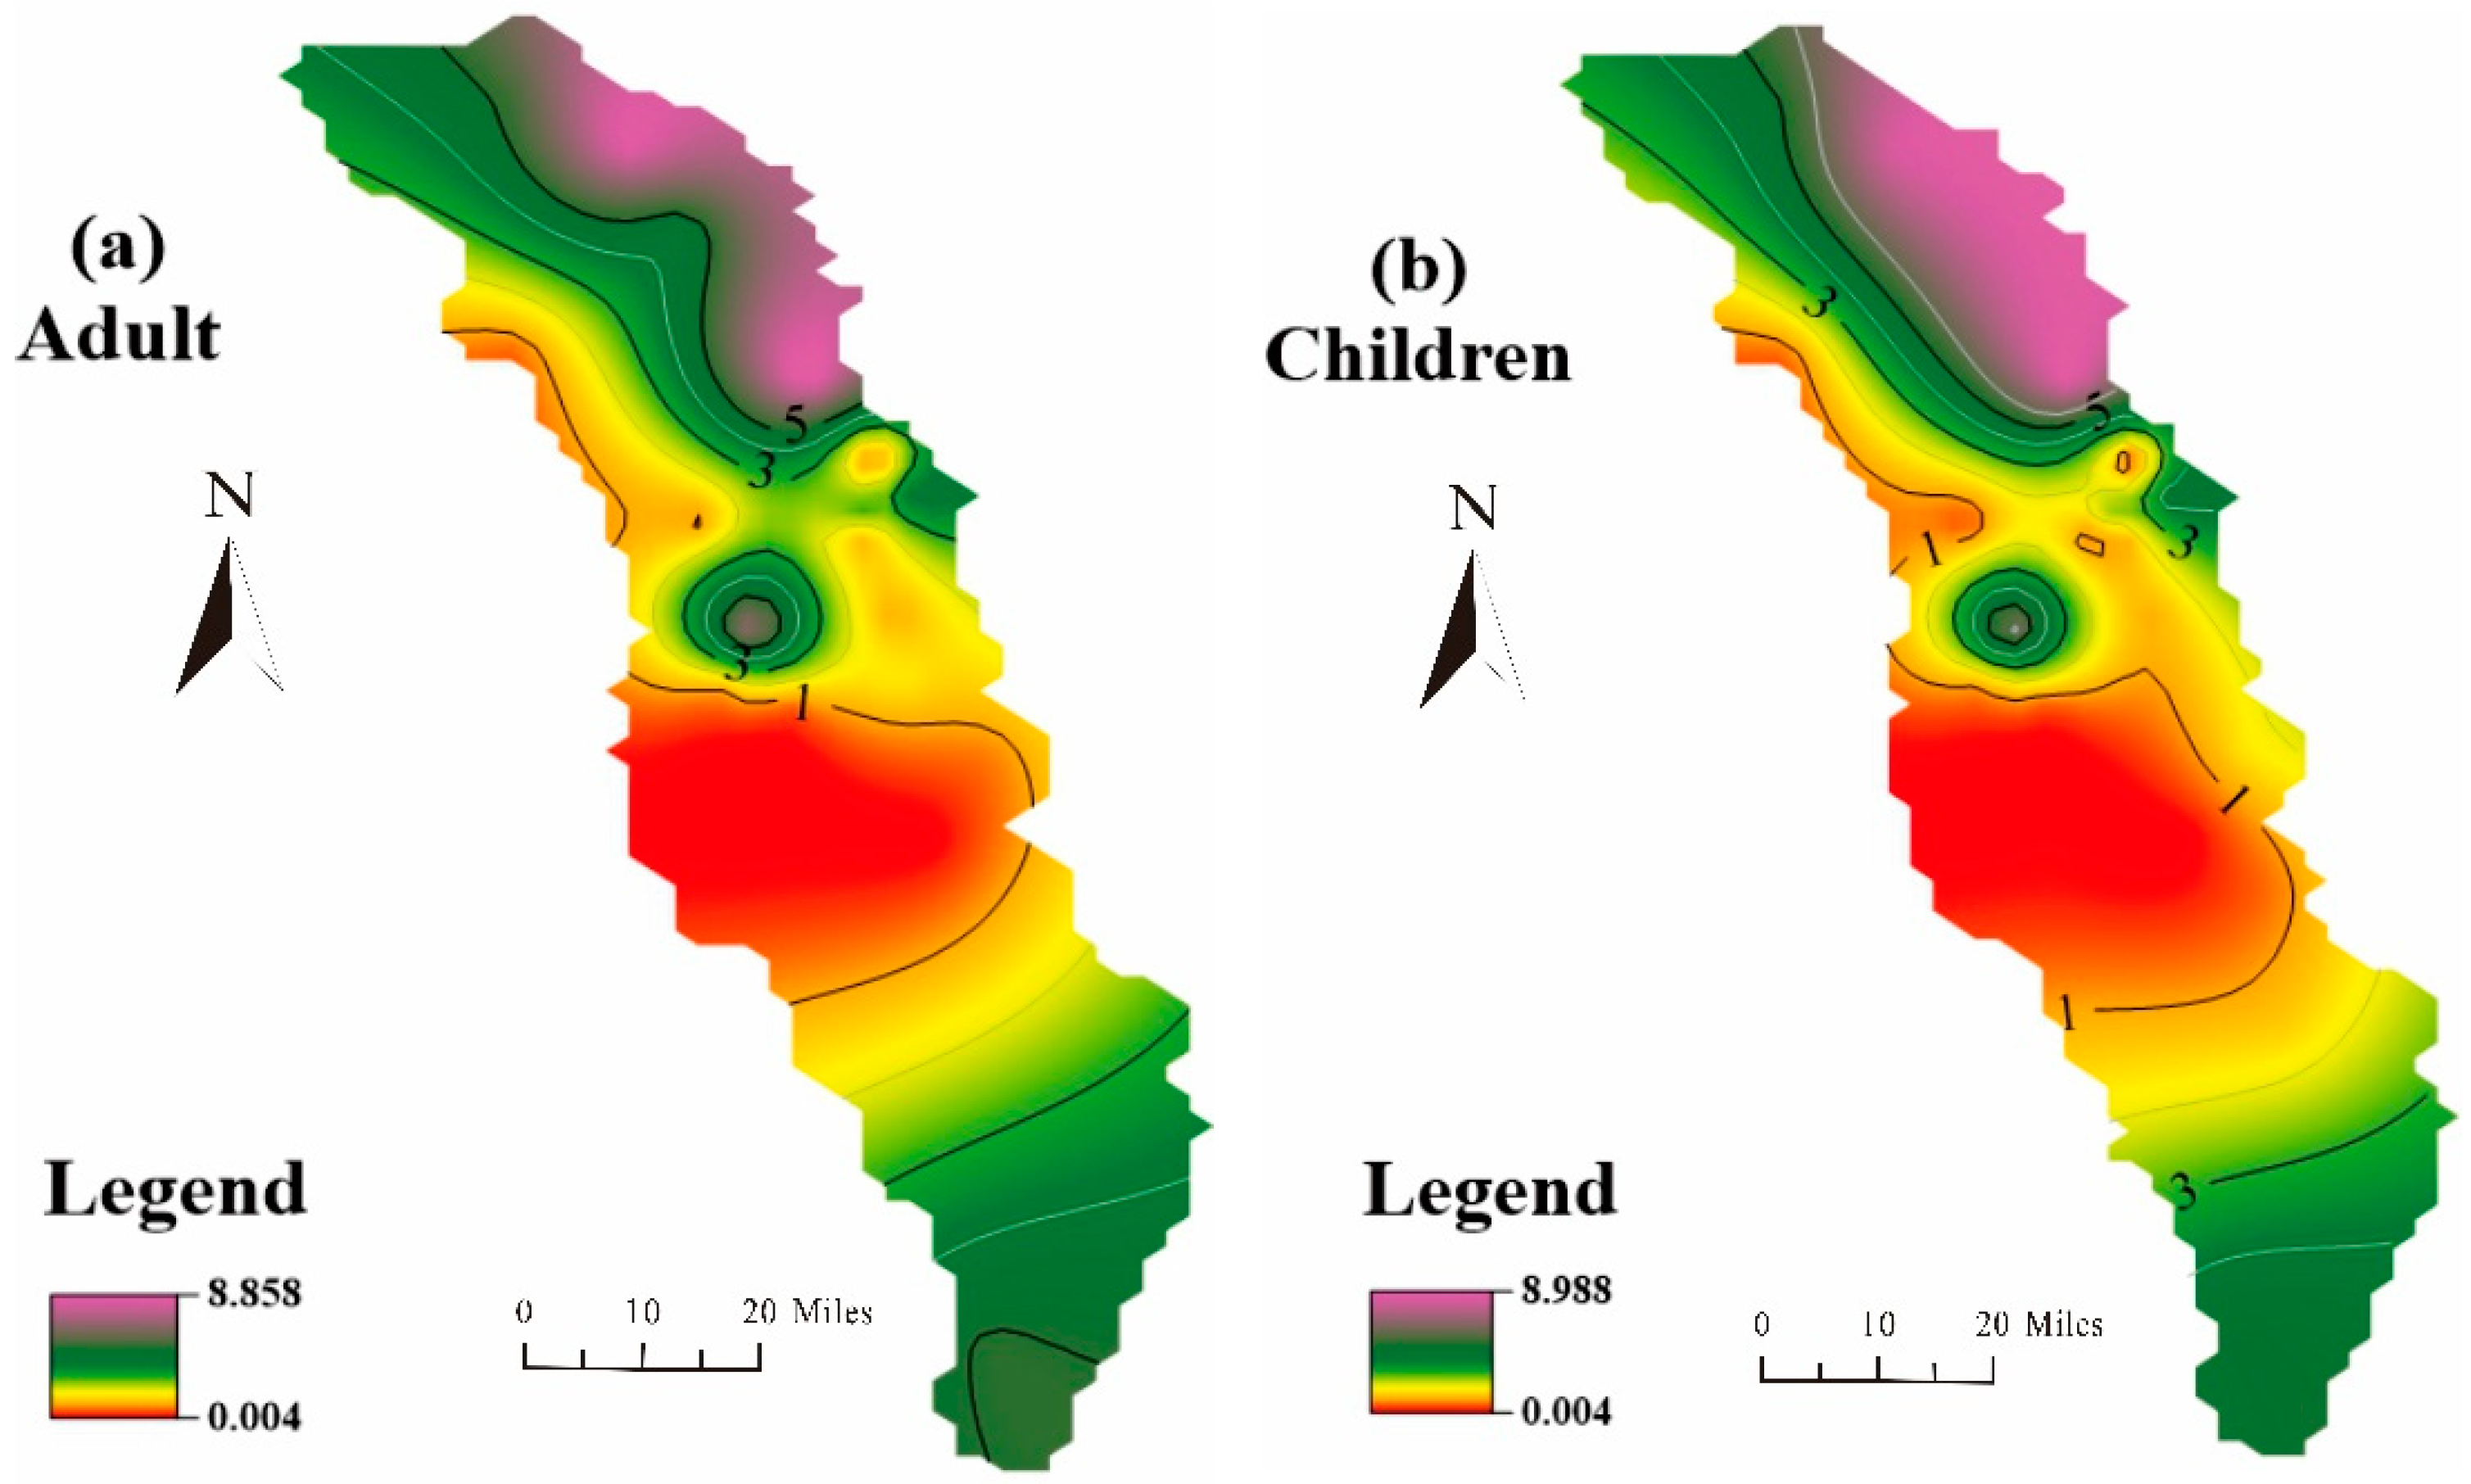
According to the spatial distribution map (Figure 5) of the health risk index, high-risk areas were mainly located in the south and northeast, with higher risk for both adults and children, reaching up to 8.988 at the extreme risk level. The health risk index in the central area was relatively small, with a minimum of 0.04 for adults and children, representing a risk-free area. However, the health risk of groundwater is relatively higher in the areas with a higher density of village distribution. FPW presented the largest risk, without any risk-free area in its area of distribution, and most of the risk indices were at HQ = 3 and above. On the whole, groundwater in the study area presented a high risk. Therefore, groundwater pollution prevention and control are needed in the study area.

3.5. Correlation Analysis

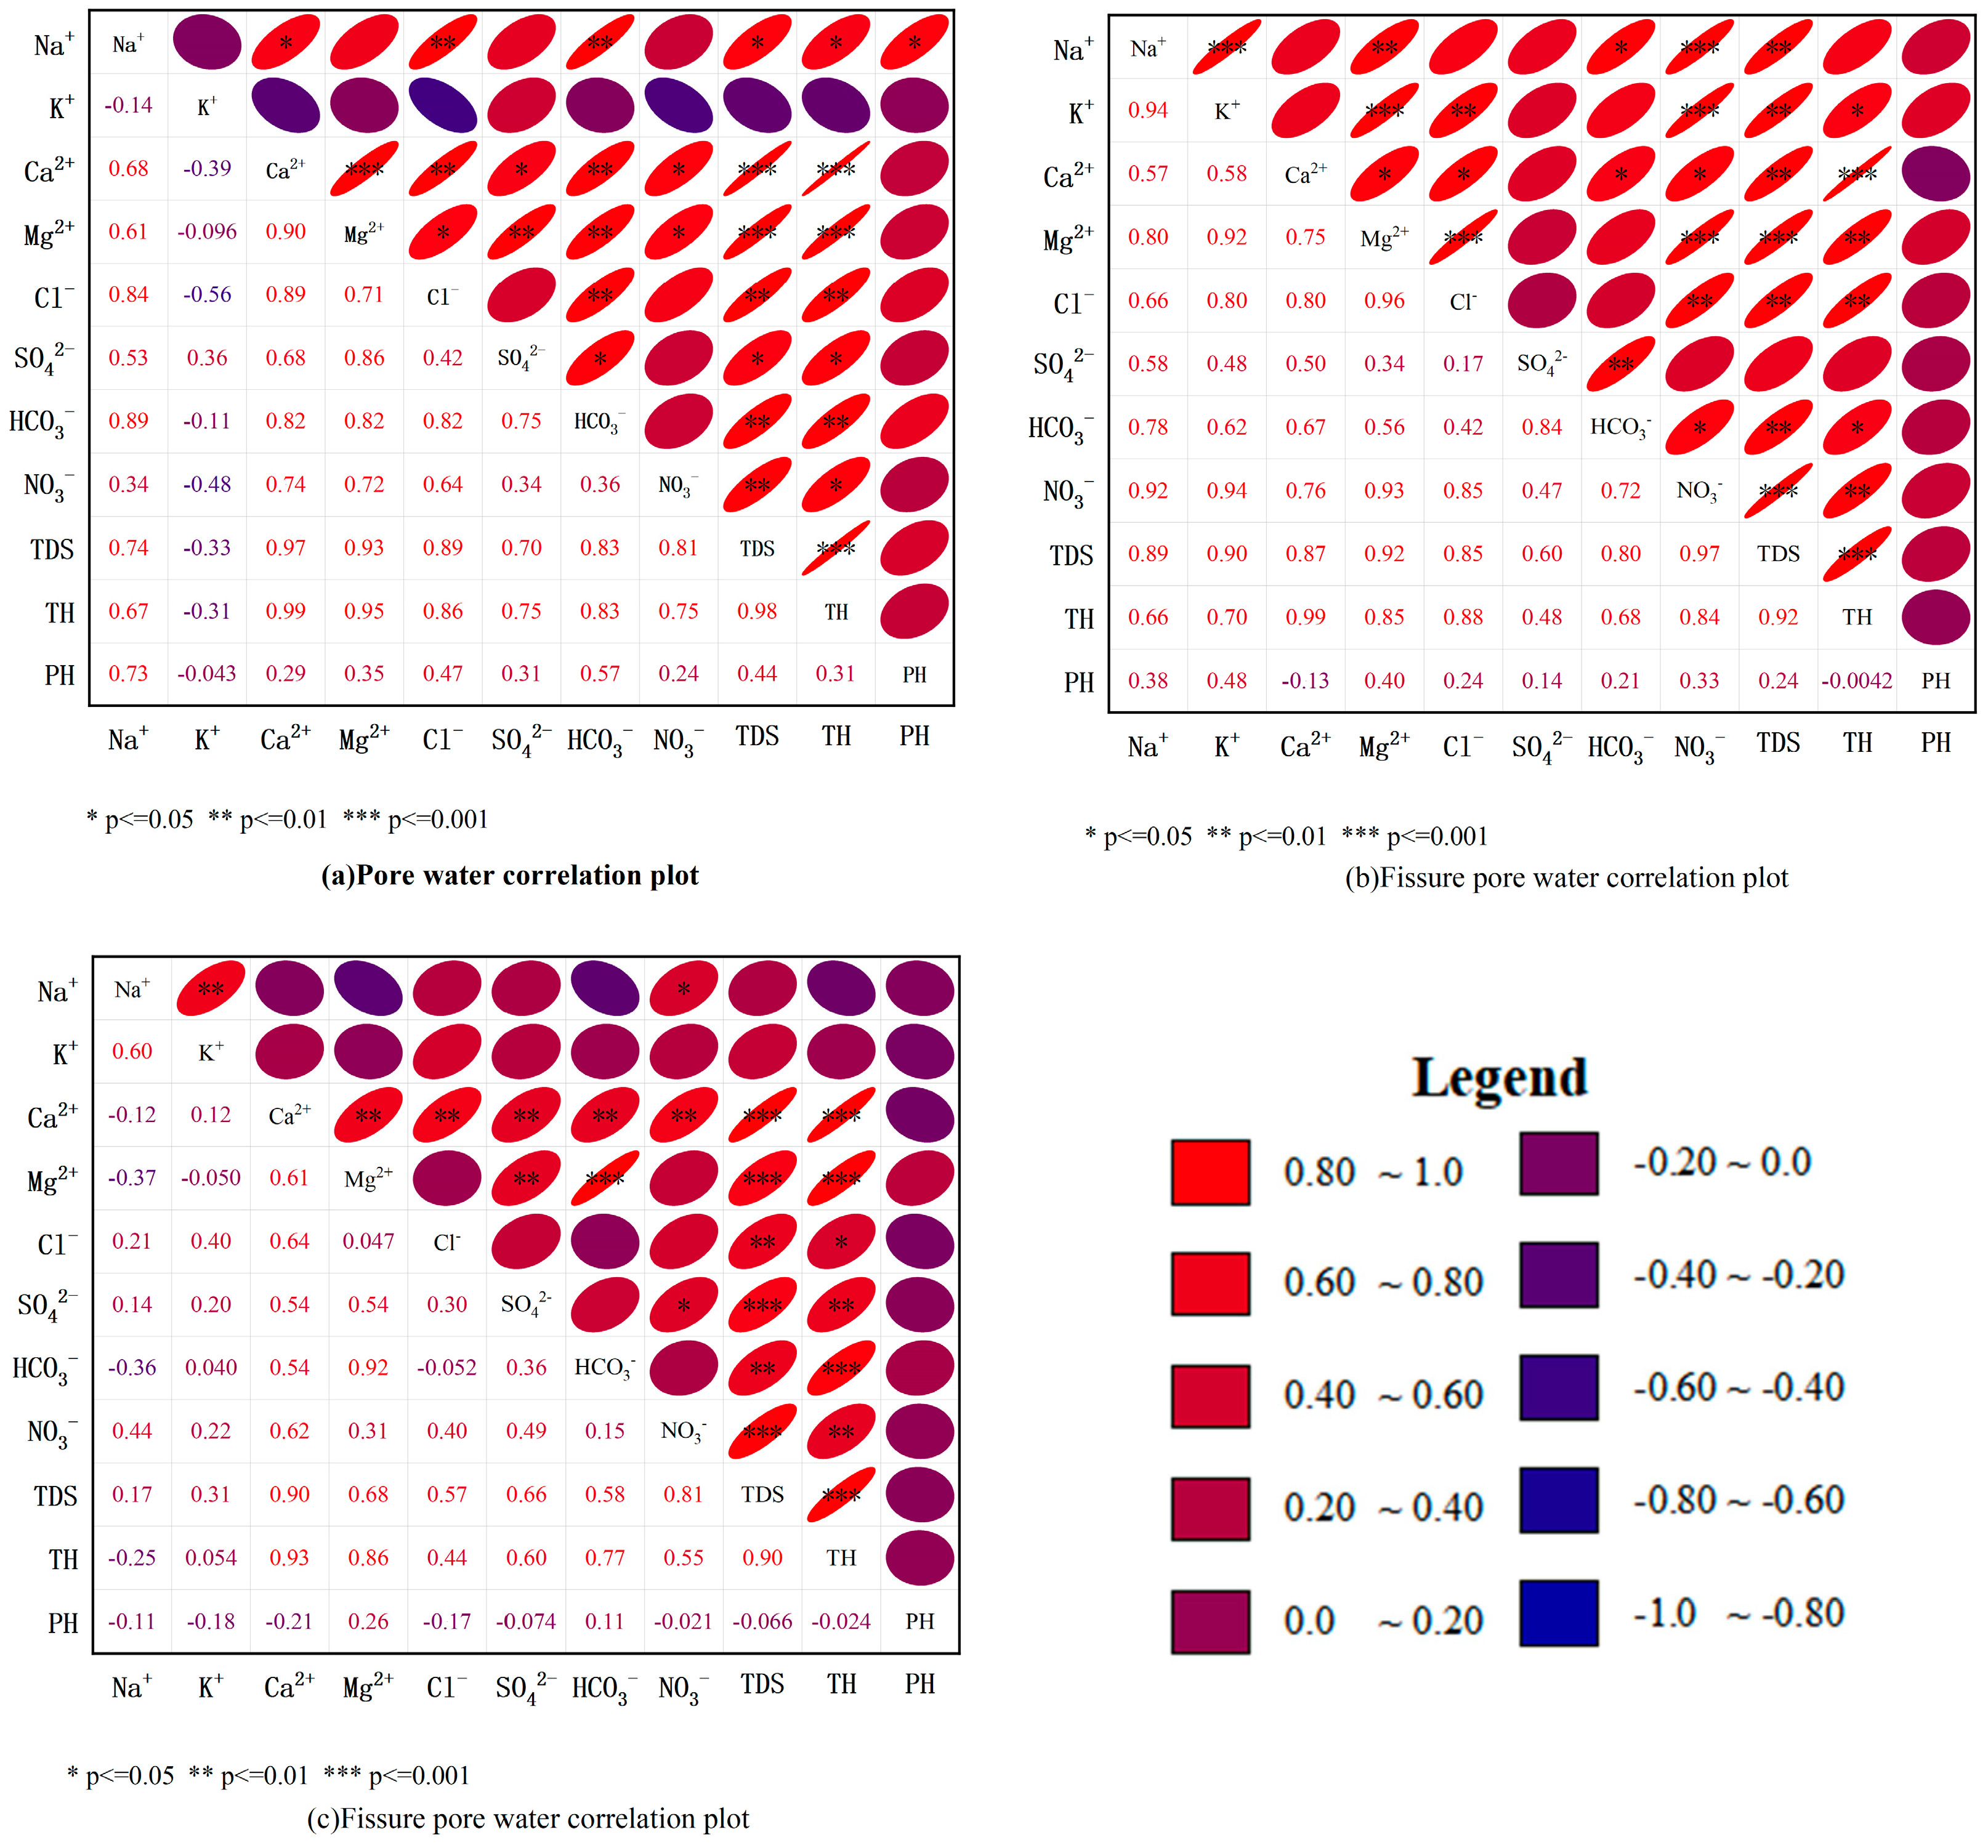
The composition and hydrochemical types of ions in groundwater are subject to many factors. Changes in solutes are caused by complex chemical reactions in groundwater, which are eventually expressed in the form of ion content and parameters. Therefore, the change of ion content in groundwater is closely related to the chemical reaction of groundwater and the mutual conversion of ions. In the correlation analysis of groundwater parameters, strong and weak correlations between parameters are compared after the standardized treatment of groundwater parameter data, and a quantitative representation is finally obtained. Through correlation analysis, the internal relationship among parameters can be analyzed to further study the causes of hydrochemistry. Correlation plots (Figure 6) can directly and clearly show the degree of correlation among various ions in groundwater. Origin software was used to analyze the hydrochemical parameters and ions in the water samples, through which the ion sources in the study area could be inferred. The correlation factors are distributed diagonally, with red and blue ellipses indicating positive and negative correlations, respectively, and slimmer ellipses and darker colors indicating stronger correlations (Figure 6).
All ions in PW were strongly correlated. Among the three basic indicators, pH was negatively correlated with K+ and positively correlated with other indicators, but the correlation was weak and was speculated to be related to the dissolution of carbonate rocks. TDS was significantly correlated with other parameters except for K+, which is consistent with the distribution of evaporation in the study area. TH showed a positive correlation with Ca2+ and Mg2+ (correlation coefficient of up to 0.9), with Cl and HCO3 (correlation coefficient above 0.8), and with SO42− and NO3 (correlation coefficient around 0.7), indicating that the total hardness of the groundwater is affected by both carbonate and non-carbonate solutes. The ionic correlation was more specific for K+, which showed a low level of negative correlation with all parameters, which may be attributable to the low content of K+ and its susceptibility to perturbation by the groundwater dynamic field.
Ions in FPW also showed a strong correlation with other parameters. pH was negatively correlated with Ca2+ but positively correlated with other indicators, with a correlation coefficient of less than 0.5. TDS was significantly correlated with other parameters, except SO42−, which is consistent with the distribution of evaporation. The positive correlation between TH and Ca2+, Mg2+, and Cl, with correlation coefficients around 0.9, indicates that the variation of total hardness in this groundwater type is influenced by non-carbonate solutes.
Ions in FW showed a weak correlation with other parameters. Except for a positive correlation with Mg2+ and HCO3, pH showed a negative correlation with all other ions. This type of groundwater contradicts the dissolution effect of carbonate rocks, and its origin requires further investigation. TDS showed a strong positive correlation with Ca2+ and NO3, which was presumed to be related to the distribution of evaporation. The positive correlations of TH with Ca2+ and Mg2+ (correlation coefficient around 0.9) and with HCO3 (correlation coefficient around 0.7) indicate that the variation of total hardness in this groundwater type is influenced by carbonate solutes.

3.6. Gibbs Analysis of Controlling Factors of Hydrochemical Characteristics of Groundwater

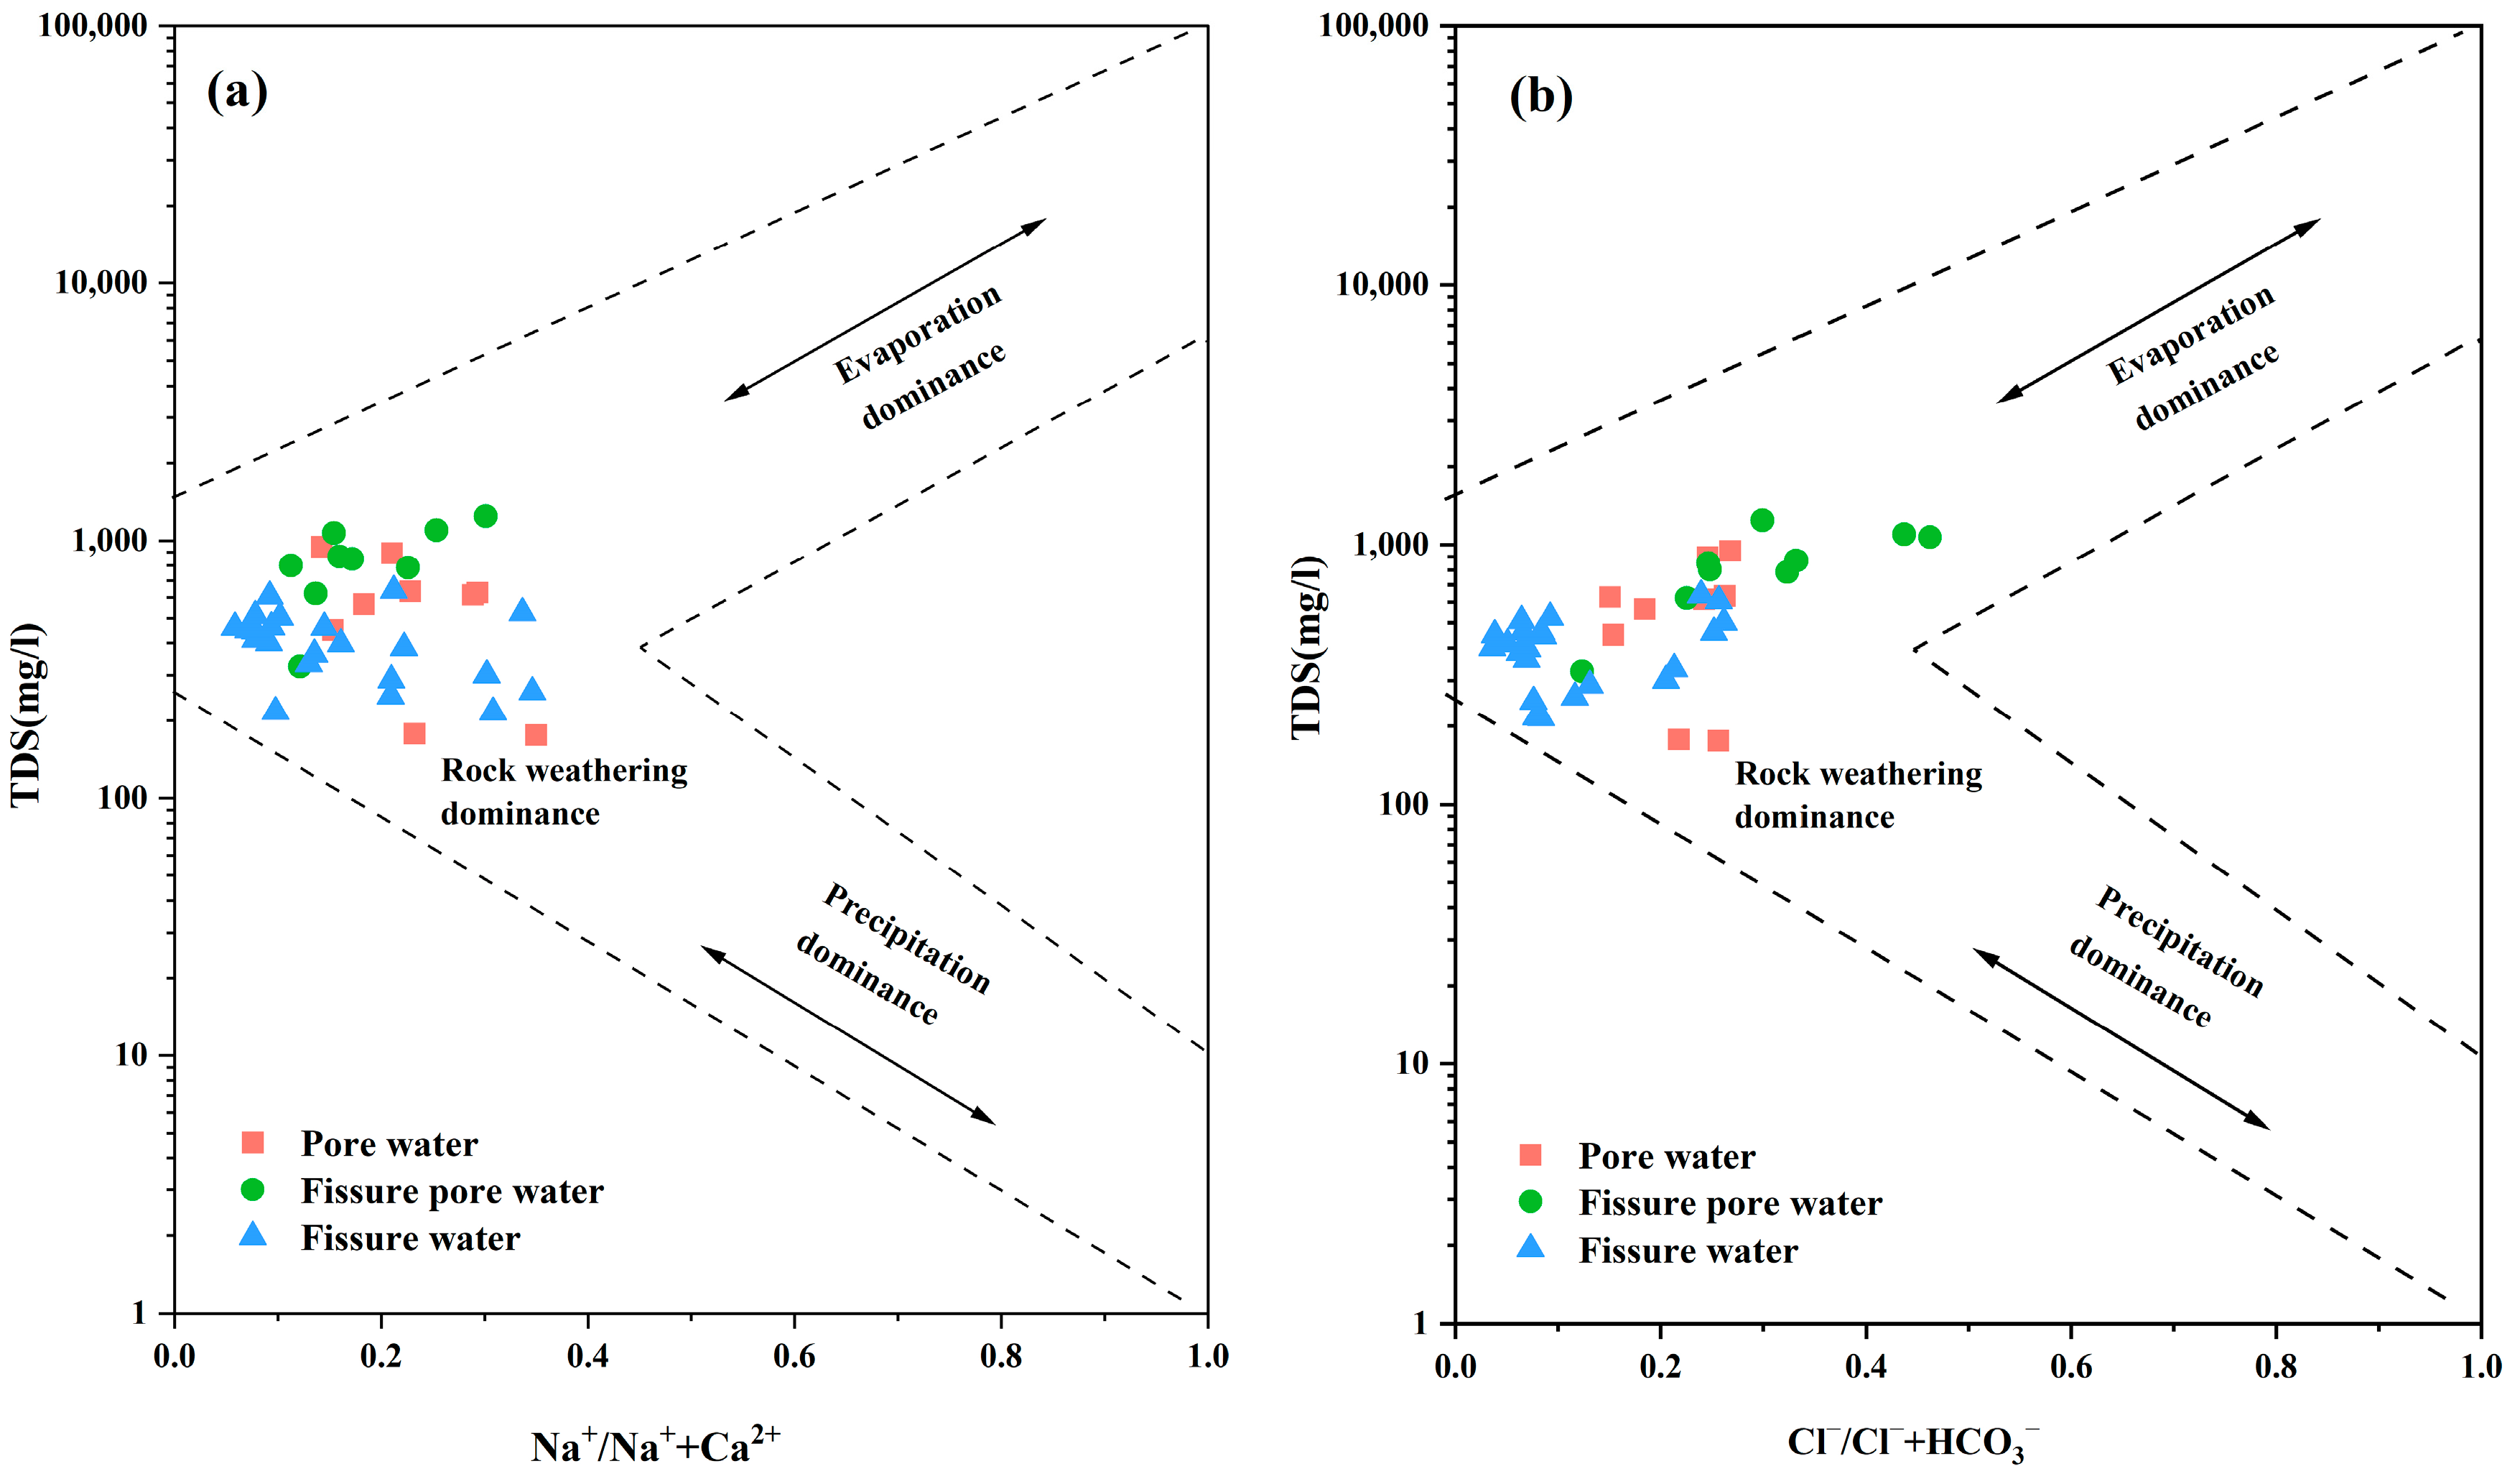
The main natural controlling factors of groundwater hydrochemical characteristics are rock weathering, precipitation, and evaporative crystallization [37]. Gibbs [22] established a semi-logarithmic coordinate model for analyzing the influence of the three controlling factors, in which TDS (unit: mg/L) is taken as the ordinate and Na+/(Na+ + Ca2+) or Cl/(Cl + HCO3) is taken as the abscissa. As shown in Figure 7, the ratios of Na+/(Na+ + Ca2+) and Cl/(Cl + HCO3) of all the water samples were lower than 0.4, and all the water samples fell into the rock weathering zone, indicating that the influencing factor of groundwater chemical characteristics in the study area was rock weathering. Moreover, the main groundwater hydrochemical types in this area were HCO3-Ca and HCO3-Ca·Mg, indicating the relatively strong weathering of carbonate rocks. As the Gibbs diagram cannot determine the influence of human activities on the chemical characteristics of groundwater, the controlling factors should be further analyzed in combination with ion ratios and other methods.

3.7. Ion Ratio Analysis

The dissolution of soluble minerals is an important part of the ionic composition of groundwater. The composition and amount of dissolved minerals can be inferred from the law of charge conservation and ion concentration in groundwater. Salt rock (NaCl) is the most common dissolved mineral, and it can be used to assess the source of ions in groundwater according to the Cl/Na+ ratio. If the ratio is equal to 1, all Na+ and Cl in groundwater are from the dissolution of salt rocks [37,50]. As shown in Figure 8a, the ratio of Cl/Na+ widely varied among the different groundwater types. Most FW sample points were located below the y = x line, indicating that Na+ in this type of groundwater had other important sources. As the study area is located far from the ocean, the source is speculated to be related to the dissolution or chemical reaction of other minerals. The PW water samples were located above the ratio line, and the concentration of Cl was the highest among the three groundwater types, indicating a strong anthropogenic influence. FPW water samples were close to the ratio line, and the main source of this groundwater type was the dissolution of salt rock. As shown in Figure 8b, almost all water samples were in the sulfate weathering region, which indicated that the Ca2+ and Mg2+ sources were closely related to weathering. The FW samples were mostly distributed in that dissolution range of carbonate rocks, and the sources of Ca2+ and Mg2+ in this groundwater type were inferred to be closely related to ion exchange [51].
The ion ratio in Figure 8c was used to determine the direction and intensity of cation exchange in groundwater, with Zone II and Zone IV representing the direction of cation exchange and the distance from the intersection of the zones representing the intensity of cation exchange. The PW samples were distributed in Zone II and far from the intersection, which indicates that cation exchange occurred in the positive direction with low intensity. In contrast, the FW and FPW samples were mostly distributed uniformly in Zone II, and they were close to the intersection, which indicates that cation exchange in groundwater mostly occurred in the positive direction with high intensity. The difference in Cl concentration is generally related to the influence of domestic sewage and septic tanks or sea sources. Considering the distance of the study area from the ocean, Cl can be used as an indicator of the impact of domestic sewage as well as septic tanks [52]. The ratio of NO3/Cl to Cl can indicate the effect of human activities on nitrate pollution [53]. The high NO3/Cl and low Cl concentrations in FW, shown in Figure 8d, indicate that nitrate ions were mainly affected by atmospheric precipitation and fertilizers. In contrast, the low NO3/Cl and high Cl concentrations in FW indicate that the nitrate ion content in groundwater was mainly affected by domestic sewage and human and animal feces, which is consistent with the distribution of villages and farmlands in the study area.

3.8. Source Identification of Nitrate Ion

FA can be used to analyze potential sources of nitrate ions in groundwater and was used to extract principal factors based on eigenvalues larger than 1. The results showed that the three principal factors in PW explain 93.3% of the total variance (Table 2a). The NO3 parameter was 0.72 in this analysis model, which indicated that the absolute loading of this model was in the middle level and can be used to indicate the source of nitrate ions in groundwater, with less information loss and more reliable significance. Therefore, the original component matrix can be used to analyze the three extracted principal factors. Specifically, Factor 1 explained 67.25% of the total variance and had significant contributions to the variables except for K+ and pH. Combined with the ion ratio, Factor 1 can be regarded as a dual factor corresponding to rock weathering and human influence. Factor 2 accounted for 15.01% of the total variance and contributed significantly to K+, followed by SO42−. Therefore, Factor 2 can be regarded as the effect of cation exchange in groundwater and domestic sewage discharge. Factor 3 accounted for 11.04% of the total variance and had a significant contribution to pH. Therefore, Factor 3 can be regarded as an acid-base balance factor. It can be inferred that most of the ions in PW groundwater originate from natural weathering and anthropogenic factors.
The three principal factors in FPW explained 94.9% of the total variance (Table 2b). In this analytical model, the NO3 parameter was 0.97, which indicated that the absolute loading of the model was at a strong level and had high significance. Factor 1 explained 70.96% of that total variance and had a significant contribution to all variables except SO42− and pH. Therefore, Factor 1 can be considered a dual factor from atmospheric precipitation and anthropogenic influence. Factor 2 accounted for 12.54% of the total variance, which contributed significantly to the pH value. Therefore, Factor 2 could be regarded as a factor of acid-base balance. Factor 3 accounted for 11.44% of the total variance and had a significant contribution to SO42−. Therefore, Factor 3 can be regarded as the influence of atmospheric precipitation. FPW and PW showed similar results, with most nitrate ions in groundwater originating from anthropogenic influences, including industrial sewage and domestic sewage discharge, septic tanks, and other factors.
The three principal factors in FW explained 79.0% of the total variance (Table 2c). In this analysis model, the NO3 parameter was 0.69, which indicated that the absolute loading of the model was at the medium level; it could be used to indicate the source of nitrate ions in groundwater, and the significance was reliable. Factor 1 explained 46.78% of the total variance and had a significant influence on TDS, Mg2+, TH, and Ca2+, followed by HCO3 and SO42−. The contribution of this factor to most variables was significant, and it could be regarded as a combination of natural and anthropogenic factors, including natural weathering and domestic sewage. Factor 2 accounted for 22.41% of the total variance and contributed significantly to Na+, followed by K+. Therefore, Factor 2 can be regarded as the effect of cation exchange in groundwater. Factor 3 accounted for 11.04% of the total variance and contributed significantly to the pH value. Therefore, Factor 3 can be considered an acid-base balance factor. In the three types of groundwater, nitrate originates from anthropogenic factors, but nitrate pollution was low in FW because of the weak influence of human activities in this area. The development of water supply sources should therefore be carried out in the southern part of the study area.
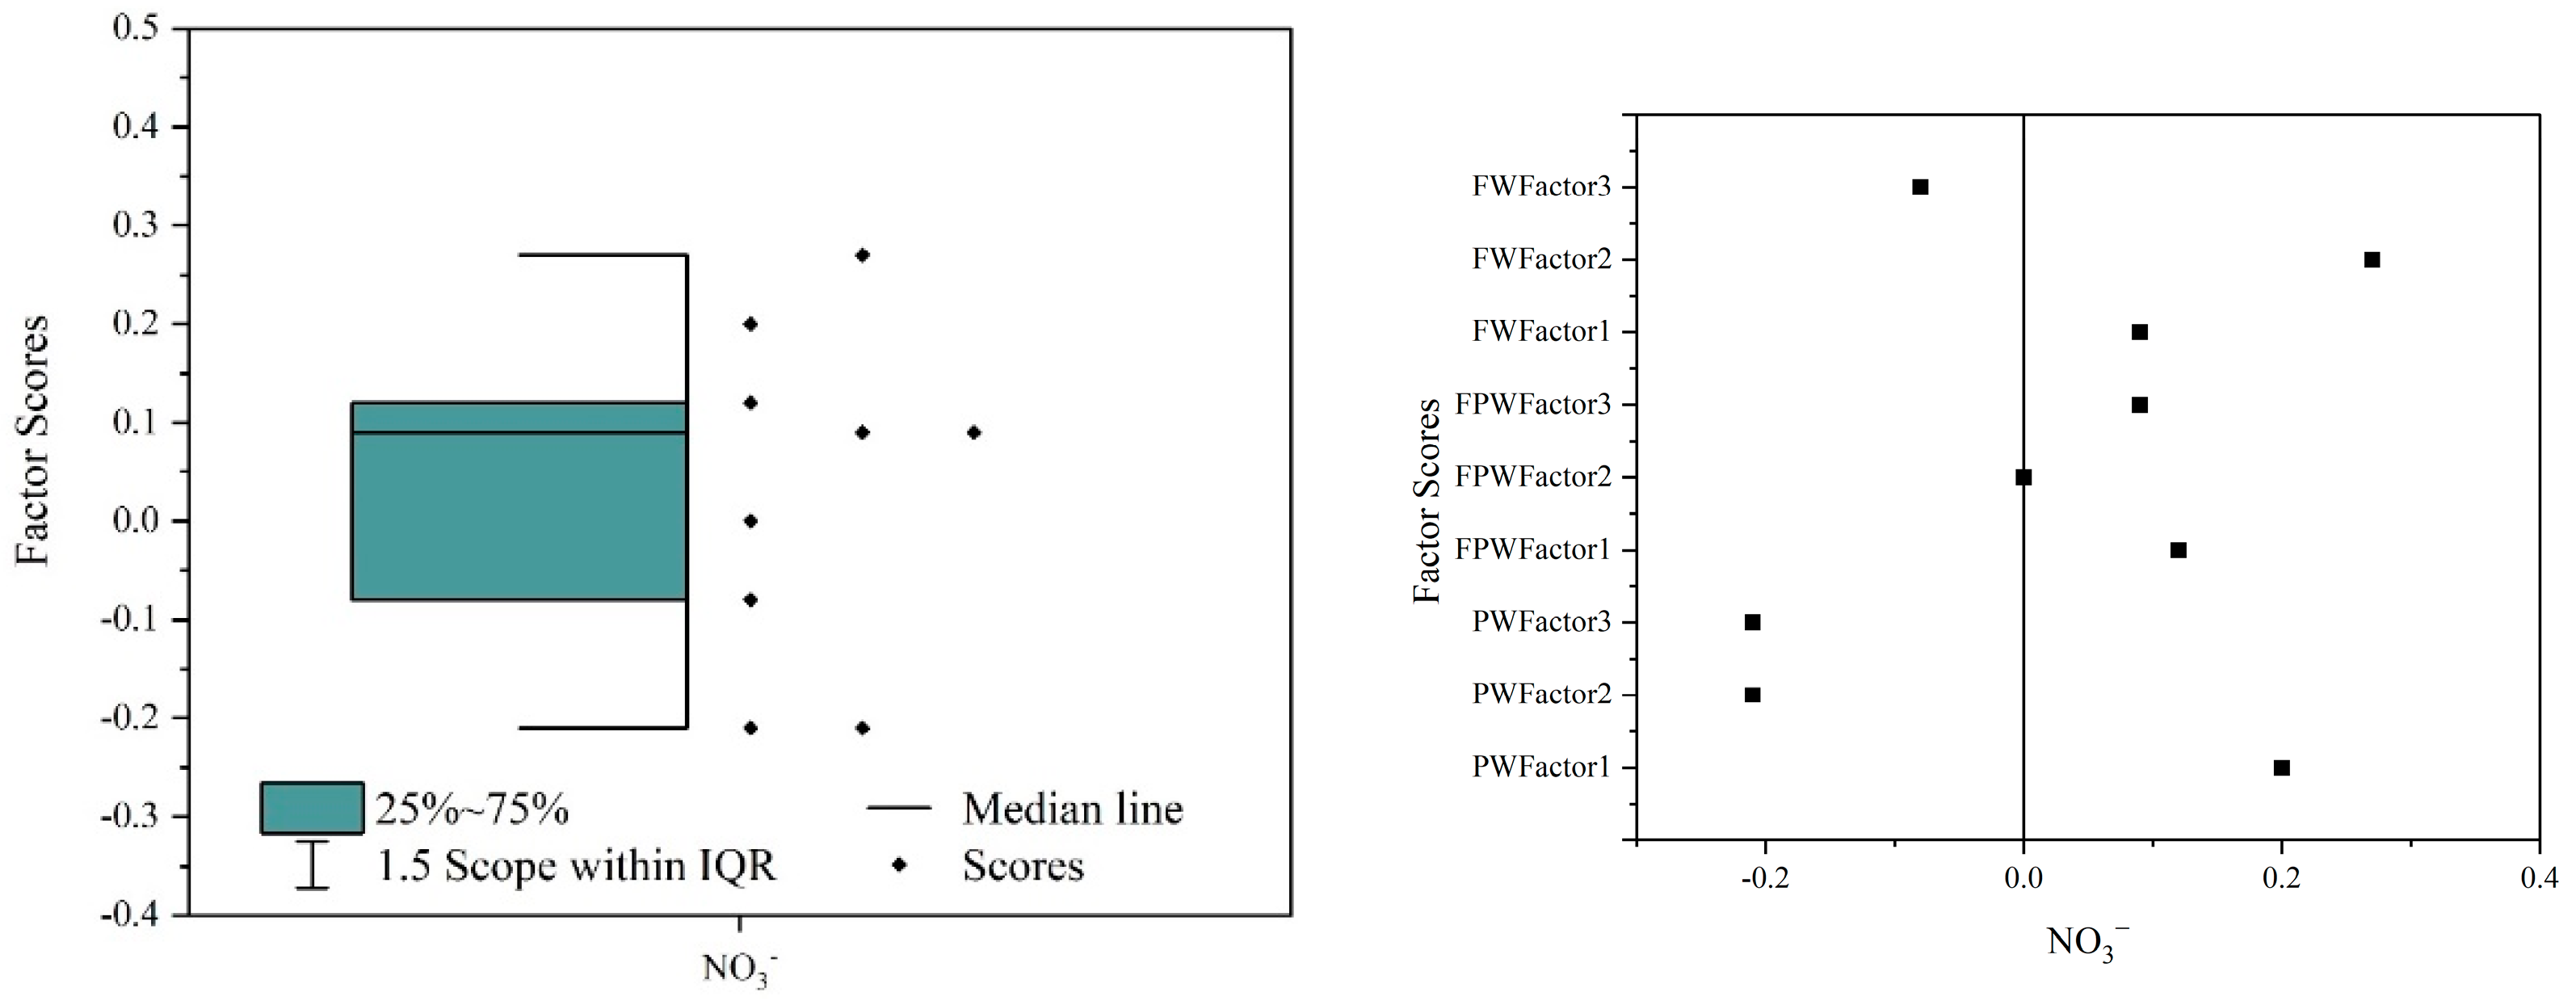
The FA results (Figure 9) showed that Factor 1 in PW was strongly affected by nitrate ions, suggesting that NO3 was strongly affected by anthropogenic factors. Moreover, Factor 1 and Factor 3 in FPW were also affected by nitrate ions. As residential areas are densely distributed and the groundwater is shallow in the FPW distribution area, FPW is highly susceptible to anthropogenic factors. According to the FA results, NO3 in this area was most seriously affected by anthropogenic factors. Factor 1 and Factor 2 in FW were affected by nitrate ions, which indicated that NO3 in this type of groundwater is also controlled by anthropogenic factors. The FW distribution area primarily comprises farmlands, and the pollution is mainly attributable to the use of nitrogenous fertilizers. Therefore, to establish a high-quality water source, relevant systems should be modified to reduce pollution caused by anthropogenic factors and prevent and control pollution from the root. According to the multivariate analysis, the groundwater environment deteriorates from the FW distribution area in the south to the PW and FPW distribution area in the north. As a high-quality groundwater source area, the FW distribution area in the south, with sparse settlements, should be selected.

3.9. Suggestions on Groundwater Development and Pollution Control in the Study Area

Through the analysis of the hydrochemical characteristics and controlling factors of groundwater, the physical and chemical properties of groundwater were preliminarily investigated in this study. Water quality assessments and health risk assessments of nitrate were carried out to further determine the status of groundwater pollution. The source control of groundwater pollution can be realized by analyzing the source of nitrate ions in groundwater. This study provides data support and a theoretical basis for the pollution control, development, and utilization of groundwater resources in the Wulian area. However, the scope of this study is relatively small. In order to establish a large water supply source, a large number of samples should be collected and the status of heavy metal pollution should be analyzed. In this manner, our understanding of groundwater pollution and pollution sources can be improved and a more comprehensive theoretical basis for groundwater pollution prevention, development, and utilization can be obtained.

4. Conclusions

This study has investigated the status and sources of pollution in three different types of groundwater in Wulian through the comprehensive analysis of groundwater chemical characteristics, controlling factors, and health risks. The main cations in groundwater are Ca2+ and Na+, and the anions are HCO3 and SO42−. However, NO3 was detected in all three types of groundwater, with standard exceedance rates following the order FPW > PW > FW. The main groundwater hydrochemical types are HCO3-Ca, HCO3-Ca·Mg, and SO4·Cl-Ca·Mg. The results show that rock weathering, salt rock dissolution, and human factors are the main factors controlling the chemical differences of groundwater in this area.
The EWQI and health risk assessment results show that the groundwater quality in the study area is closely related to the distribution of nitrate, and the water quality followed the order FW > PW > FPW. In addition, nitrate pollution was more serious in densely populated areas. Factor analysis results show that the main source of nitrate is anthropogenic input. Therefore, to establish a high-quality water source, relevant systems should be modified to reduce the pollution caused by anthropogenic factors and prevent and control pollution from the root. This study can provide data support and a theoretical basis for the pollution control, development, and utilization of groundwater resources in the Wulian area.

Author Contributions

Conceptualization, M.W., W.Z., J.F. and Z.G.; Methodology, M.W., W.Z. and J.F.; Software, P.Y., R.Z., H.J., X.S. and X.G.; Validation, M.W., W.Z., J.F. and Z.G.; Formal Analysis, M.W., W.Z., J.F. and Z.G.; Investigation, P.Y., R.Z., H.J., X.S. and X.G.; Resources, P.Y., R.Z., H.J., X.S. and X.G.; Data Management, P.Y., R.Z., H.J., X.S. and X.G.; Writing—Manuscript Preparation, M.W., W.Z. and J.F.; Writing—Review and Editing, M.W., W.Z., J.F. and Z.G.; Visualization, M.W., W.Z. and J.F.; Supervision, P.Y., R.Z., H.J., X.S. and X.G.; Project Management, J.F.; Funding Acquisition, Z.G. All authors have read and agreed to the published version of the manuscript.

Funding

This study was supported by the National Natural Science Foundation of China (No. 41772257; 41472216).

Data Availability Statement

Not applicable.

Acknowledgments

This study was financially supported by the National Natural Science Foundation of China (No. 41772257; 41472216). We thank the reviewers and editors for their pertinent comments and Jutan Liu and Zongjun Gao for their guidance.

Conflicts of Interest

The authors declare no conflict of interest.

References

  1. Wang, D.; Wu, J.H.; Wang, Y.H.; Ji, Y.J. Finding High-Quality Groundwater Resources to Reduce the Hydatidosis Incidence in the Shiqu County of Sichuan Province, China: Analysis, Assessment, and Management. Expo. Health 2020, 12, 307–322. [Google Scholar] [CrossRef]
  2. Elsayed, S.; Gad, M.; Masoud, M.; Osta, M.; Alqarawy, A. Groundwater Suitability for Drinking and Irrigation Using Water Quality Indices and Multivariate Modeling in Makkah Al-Mukarramah Province, Saudi Arabia. Water 2022, 14, 483. [Google Scholar] [CrossRef]
  3. Zhou, Y.H.; Li, P.Y.; Chen, M.J.; Dong, Z.H.; Lu, C.Y. Groundwater quality for potable and irrigation uses and associated health risk in southern part of Gu’an County, North China Plain. Environ. Geochem. Health 2021, 43, 813–835. [Google Scholar] [CrossRef]
  4. Gad, M.; Saleh, A.; Hussein, H.; Farouk, M.; Elsayed, S. Appraisal of Surface Water Quality of Nile River Using Water Quality Indices, Spectral Signature and Multivariate Modeling. Water 2022, 14, 1131. [Google Scholar] [CrossRef]
  5. Yu, F.; Zhou, D.; Li, Z.; Li, X. Hydrochemical Characteristics and Hydrogeochemical Simulation Research of Groundwater in the Guohe River Basin (Henan Section). Water 2022, 14, 1461. [Google Scholar] [CrossRef]
  6. Li, P.Y.; Wu, J.H. Sustainable living with risks: Meeting the challenges. Hum. Ecol. Risk Assess. 2019, 25, 1–10. [Google Scholar] [CrossRef]
  7. Liu, J.T.; Gao, Z.J.; Wang, M.; Li, Y.Z.; Yu, C.; Shi, M.J.; Zhang, H.Y.; Ma, Y.Y. Hydrochemical and isotopic characteristics of surface water in the Lhasa River basin. Arab. J. Geosci. 2019, 12, 520. [Google Scholar] [CrossRef]
  8. Hua, K.; Jun, X.; Li, S.J.; Li, Z. Analysis of hydrochemical characteristics and their controlling factors in the Fen River of China. Sustain. Cities Soc. 2019, 52, 101827. [Google Scholar] [CrossRef]
  9. Yousefi, M.; Ghoochani, M.; Mahvi, A. Health risk assessment to fluoride in drinking water of rural residents living in the Poldasht city, Northwest of Iran. Ecotoxicol. Environ. Saf. 2017, 148, 426–430. [Google Scholar] [CrossRef]
  10. He, S.; Wu, J.H. Hydrogeochemical Characteristics, Groundwater Quality, and Health Risks from Hexavalent Chromium and Nitrate in Groundwater of Huanhe Formation in Wuqi County, Northwest China. Expo. Health 2019, 11, 125–137. [Google Scholar] [CrossRef]
  11. Narsimha, A.; Qian, H. Groundwater quality evaluation using water quality index (WQI) for drinking purposes and human health risk (HHR) assessment in an agricultural region of Nanganur, south India. Ecotoxicol. Environ. Saf. 2019, 176, 153–161. [Google Scholar] [CrossRef]
  12. Ahmed, I.; Tariq, N.; Muhery, A. Hydrochemical characterization of groundwater to align with sustainable development goals in the Emirate of Dubai, UAE. Environ. Earth Sci. 2019, 78, 44. [Google Scholar] [CrossRef]
  13. Eslami, F.; Yaghmaeian, K.; Mohammadi, A.; Salari, M.; Faraji, M. An integrated evaluation of groundwater quality using drinking water quality indices and hydrochemical characteristics: A case study in Jiroft, Iran. Environ. Earth Sci. 2019, 78, 314. [Google Scholar] [CrossRef]
  14. Li, P.Y.; Tian, R.; Xue, C.Y.; Wu, J.H. Progress, opportunities, and key fields for groundwater quality research under the impacts of human activities in China with a special focus on western China. Environ. Sci. Pollut. Res. 2017, 24, 13224–13234. [Google Scholar] [CrossRef]
  15. Liu, J.T.; Gao, Z.J.; Wang, M.; Li, Y.Z.; Ma, Y.Y.; Shi, M.J.; Zhang, H.Y. Study on the dynamic characteristics of groundwater in the valley plain of Lhasa City. Environ. Earth Sci. 2018, 77, 646. [Google Scholar] [CrossRef]
  16. Yuan, Y.Y.; Liu, Y.L.; Luo, K.L.; Shahid, M.Z. Hydrochemical characteristics and a health risk assessment of the use of river water and groundwater as drinking sources in a rural area in Jiangjin District, China. Environ. Earth Sci. 2020, 79, 160. [Google Scholar] [CrossRef]
  17. Qian, H.; Chen, J.; Howard, K. Assessing groundwater pollution and potential remediation processes in a multi-layer aquifer system. Environ. Pollut. 2020, 263, 114669. [Google Scholar] [CrossRef] [PubMed]
  18. Gharbi, A.; Ibn Ali, Z.; Zairi, M. Groundwater suitability for drinking and agriculture purposes using irrigation water quality index and multivariate analysis: Case of Sidi Bouzid aquifer, central Tunisia. Environ. Earth Sci. 2019, 78, 692. [Google Scholar] [CrossRef]
  19. Everest, T.; Özcan, H. Applying multivariate statistics for identification of groundwater resources and qualities in NW Turkey. Environ. Monit. Assess. 2019, 191, 47. [Google Scholar] [CrossRef]
  20. Sajil Kumar, P.J.; James, E.J. Geostatistical and geochemical model-assisted hydrogeochemical pattern recognition along the groundwater flow paths in Coimbatore district, South India. Environ. Dev. Sustain. 2019, 21, 369–384. [Google Scholar] [CrossRef]
  21. Piper, A.M. A graphic procedure in the geochemical interpretation of water-analyses. EOS Trans. Am. Geophys. Union 1944, 25, 914–928. [Google Scholar] [CrossRef]
  22. Gibbs, R. Mechanisms Controlling World Water Chemistry. Science 1971, 170, 1088–1090. [Google Scholar] [CrossRef]
  23. Zhai, Y.Z.; Zheng, F.X.; Zhao, X.B.; Teng, Y.G. Identification of hydrochemical genesis and screening of typical groundwater pollutants impacting human health: A case study in Northeast China. Environ. Pollut. 2019, 252, 1202–1215. [Google Scholar] [CrossRef] [PubMed]
  24. Abbasnia, A.; Yousefi, N.; Mahvi, A.; Nabizadeh, R.; Radfarad, M.; Yousefi, M.; Alimohammadi, M. Evaluation of groundwater quality using water quality index and its suitability for assessing water for drinking and irrigation purposes: Case study of Sistan and Baluchistan province (Iran). Hum. Ecol. Risk Assess. 2018, 25, 73–82. [Google Scholar] [CrossRef]
  25. Liu, J.T.; Peng, Y.M.; Li, C.S.; Gao, Z.J.; Chen, S.J. An investigation into the hydrochemistry, quality and risk to human health of groundwater in the central region of Shandong Province, North China. J. Clean. Prod. 2021, 282, 125416. [Google Scholar] [CrossRef]
  26. Su, H.; Kang, W.D.; Xu, Y.J.; Wang, J.D. Assessing Groundwater Quality and Health Risks of Nitrogen Pollution in the Shenfu Mining Area of Shaanxi Province, Northwest China. Expo. Health 2018, 10, 77–97. [Google Scholar] [CrossRef]
  27. Zhang, Q.Y.; Xu, P.P.; Qian, H. Assessment of Groundwater Quality and Human Health Risk (HHR) Evaluation of Nitrate in the Central-Western Guanzhong Basin, China. Int. J. Environ. Res. Public Health 2019, 16, 4246. [Google Scholar] [CrossRef] [Green Version]
  28. Zhang, M.N.; Han, S.B.; Wang, Y.S.; Wang, Z.; Li, H.X.; Wang, X.Y.; Liu, J.T.; Li, C.S.; Gao, Z.J. Characteristics and Controlling Factors of Groundwater Hydrochemistry in Dongzhi Tableland Area of the Loess Plateau of Eastern Gansu—A Case Study of Ning County Area, North China. Water 2022, 14, 3601. [Google Scholar] [CrossRef]
  29. Duraisamy, S.; Govindhaswamy, V.; Duraisamy, K.; Krishnaraj, S.; Balasubramanian, A.; Subramani, T. Hydrogeochemical characterization and evaluation of groundwater quality in Kangayam taluk, Tirupur district, Tamil Nadu, India, using GIS techniques. Environ. Geochem. Health 2019, 41, 851–873. [Google Scholar] [CrossRef]
  30. Song, H.Y.; Liu, J.Q.; Yin, P.; Zhang, Y. Distribution, enrichment and source of heavy metals in Rizhao offshore area, southeast Shandong Province. Mar. Pollut. Bull. 2017, 119, 175–180. [Google Scholar] [CrossRef]
  31. He, Z.K.; Ma, C.M.; Zhou, A.G.; Qi, H.H.; Liu, C.F.; Cai, H.S.; Zhu, H.C. Using hydrochemical and stable isotopic (δ2H, δ18O, δ11B, and δ37Cl) data to understand groundwater evolution in an unconsolidated aquifer system in the southern coastal area of Laizhou Bay, China. Appl. Geochem. 2018, 90, 129–141. [Google Scholar] [CrossRef]
  32. WHO. Guidelines for Drinking-Water Quality, 4th ed.; World Health Organization: Geneva, Switzerland, 2017. [Google Scholar]
  33. Hardle, W.; Simar, L. Applied Multivariate Statistical Analysis; Springer: Berlin/Heidelberg, Germany, 2007. [Google Scholar]
  34. Liu, J.T.; Peng, Y.M.; Li, C.S.; Gao, Z.J.; Chen, S.J. Characterization of the hydrochemistry of water resources of the Weibei Plain, Northern China, as well as an assessment of the risk of high groundwater nitrate levels to human health. Environ. Pollut. 2020, 268, 115947. [Google Scholar] [CrossRef] [PubMed]
  35. Cao, Y.J.; Tang, C.Y.; Song, X.F.; Liu, C.M.; Zhang, Y.H. Identifying the hydrochemical characteristics of rivers and groundwater by multivariate statistical analysis in the Sanjiang Plain, China. Appl. Water Sci. 2016, 6, 169–178. [Google Scholar] [CrossRef] [Green Version]
  36. Cude, C.G. Oregon water quality index a tool for evaluating water quality management effectiveness. J. Am. Water Resour. Assoc. 2001, 37, 125–137. [Google Scholar] [CrossRef]
  37. Wu, C.; Wu, X.; Qian, C.; Zhu, G. Hydrogeochemistry and groundwater quality assessment of high fluoride levels in the Yanchi endorheic region, northwest China. Appl. Geochem. 2018, 98, 404–417. [Google Scholar] [CrossRef]
  38. WHO (World Health Organization). Guidelines for Drinking Water Quality, 4th ed.; World Health Organization: Geneva, Switzerland, 2011; Volume 38, pp. 104–108. [Google Scholar]
  39. Yousefi, M.; Ghalehaskar, S.; Asghari, F.; Ghaderpoury, A.; Dehghani, M.H.; Ghaderpoori, M.; Mohammadi, A. Distribution of fluoride contamination in drinking water resources and health risk assessment using geographic information system, northwest Iran. Regul. Toxicol. Pharmacol. 2019, 107, 104408. [Google Scholar] [CrossRef]
  40. Chen, J.; Wu, H.; Qian, H. Groundwater Nitrate Contamination and Associated Health Risk for the Rural Communities in an Agricultural Area of Ningxia, Northwest China. Expo. Health 2016, 8, 349–359. [Google Scholar] [CrossRef]
  41. Li, P.Y.; Qian, H.; Wu, J.H. Conjunctive use of groundwater and surface water to reduce soil salinization in the Yinchuan Plain, North-West China. Int. J. Water Resour. D 2018, 34, 337–353. [Google Scholar] [CrossRef]
  42. USEPA (US Environmental Protection Agency). Baseline Human Health Risk Assessment Vasquez Boulevard and I-70 Superfund Site; USEPA (US Environmental Protection Agency): Denver, CO, USA, 2001. Available online: https://nepis.epa.gov/Exe/ZyNET.exe/P1006STM.TXT?ZyActionD=ZyDocument&Client=EPA&Index=2000+Thru+2005&Docs=&Query=&Time=&EndTime=&SearchMethod=1&TocRestrict=n&Toc=&TocEntry=&QField=&QFieldYear=&QFieldMonth=&QFieldDay=&IntQFieldOp=0&ExtQFieldOp=0&XmlQuery=&File=D%3A%5Czyfiles%5CIndex%20Data%5C00thru05%5CTxt%5C00000023%5CP1006STM.txt&User=ANONYMOUS&Password=anonymous&SortMethod=h%7C-&MaximumDocuments=1&FuzzyDegree=0&ImageQuality=r75g8/r75g8/x150y150g16/i425&Display=hpfr&DefSeekPage=x&SearchBack=ZyActionL&Back=ZyActionS&BackDesc=Results%20page&MaximumPages=1&ZyEntry=1&SeekPage=x&ZyPURL (accessed on 20 January 2011).
  43. USEPA. 2004. Available online: http://www.epa.gov/oswer/riskassessment/ragse/pdf/introduction (accessed on 1 July 2004).
  44. Bempah, C.; Ewusi, A. Heavy metals contamination and human health risk assessment around Obuasi gold mine in Ghana. Environ. Monit. Assess. 2016, 188, 261. [Google Scholar] [CrossRef]
  45. Narsimha, A.; Rajitha, S. Spatial distribution and seasonal variation in fluoride enrichment in groundwater and its associated human health risk assessment in Telangana State, South India. Hum. Ecol. Risk Assess. 2018, 24, 2119–2132. [Google Scholar] [CrossRef]
  46. Zhang, Y.T.; Wu, J.H.; Xu, B. Human health risk assessment of groundwater nitrogen pollution in Jinghui canal irrigation area of the loess region, northwest China. Environ. Earth Sci. 2018, 77, 273. [Google Scholar] [CrossRef]
  47. Bouzourra, H.; Bouhlila, R.; Lakshmanan, E.; Slama, F.; Ouslati, N. Characterizaton of mechanisms and processes of groundwater salinization in irrigated coastal area using statistics, GIS, and hydrogeochemical investigations. Environ. Sci. Pollut. Res. 2015, 22, 2643–2660. [Google Scholar] [CrossRef] [PubMed]
  48. Li, P.Y.; Wu, J.H.; Tian, R.; He, S.; He, X.D.; Xue, C.Y.; Zhang, K. Geochemistry, Hydraulic Connectivity and Quality Appraisal of Multilayered Groundwater in the Hongdunzi Coal Mine, Northwest China. Mine Water Environ. 2018, 37, 222–237. [Google Scholar] [CrossRef]
  49. Narsimha, A. Controlling factors and mechanism of groundwater quality variation in semiarid region of South India: An approach of water quality index (WQI) and health risk assessment (HRA). Environ. Geochem. Health 2020, 42, 1725–1752. [Google Scholar] [CrossRef]
  50. Narsimha, A. Spatial distribution, exposure, and potential health risk assessment from nitrate in drinking water from semi-arid region of South India. Hum. Ecol. Risk Assess. 2018, 26, 310–334. [Google Scholar] [CrossRef]
  51. Keesari, T.; Saha, D. Groundwater salinization processes: Pitfalls of inferences from Na+/Cl versus Cl correlation plots. Environ. Geochem. Health 2021, 43, 949–969. [Google Scholar] [CrossRef]
  52. Liu, X.; Wang, X.L.; Zhang, L.; Fan, W.Y.; Yang, C.; Li, E.H.; Wang, Z. Impact of land use on shallow groundwater quality characteristics associated with human health risks in a typical agricultural area in Central China. Environ. Sci. Pollut. Res. 2021, 28, 1712–1724. [Google Scholar] [CrossRef]
  53. Jin, Z.F.; Zheng, Q.; Zhu, C.Y.; Wang, Y.; Cen, J.R.; Li, F.L. Contribution of nitrate sources in surface water in multiple land use areas by combining isotopes and a Bayesian isotope mixing model. Appl. Geochem. 2018, 93, 10–19. [Google Scholar] [CrossRef]
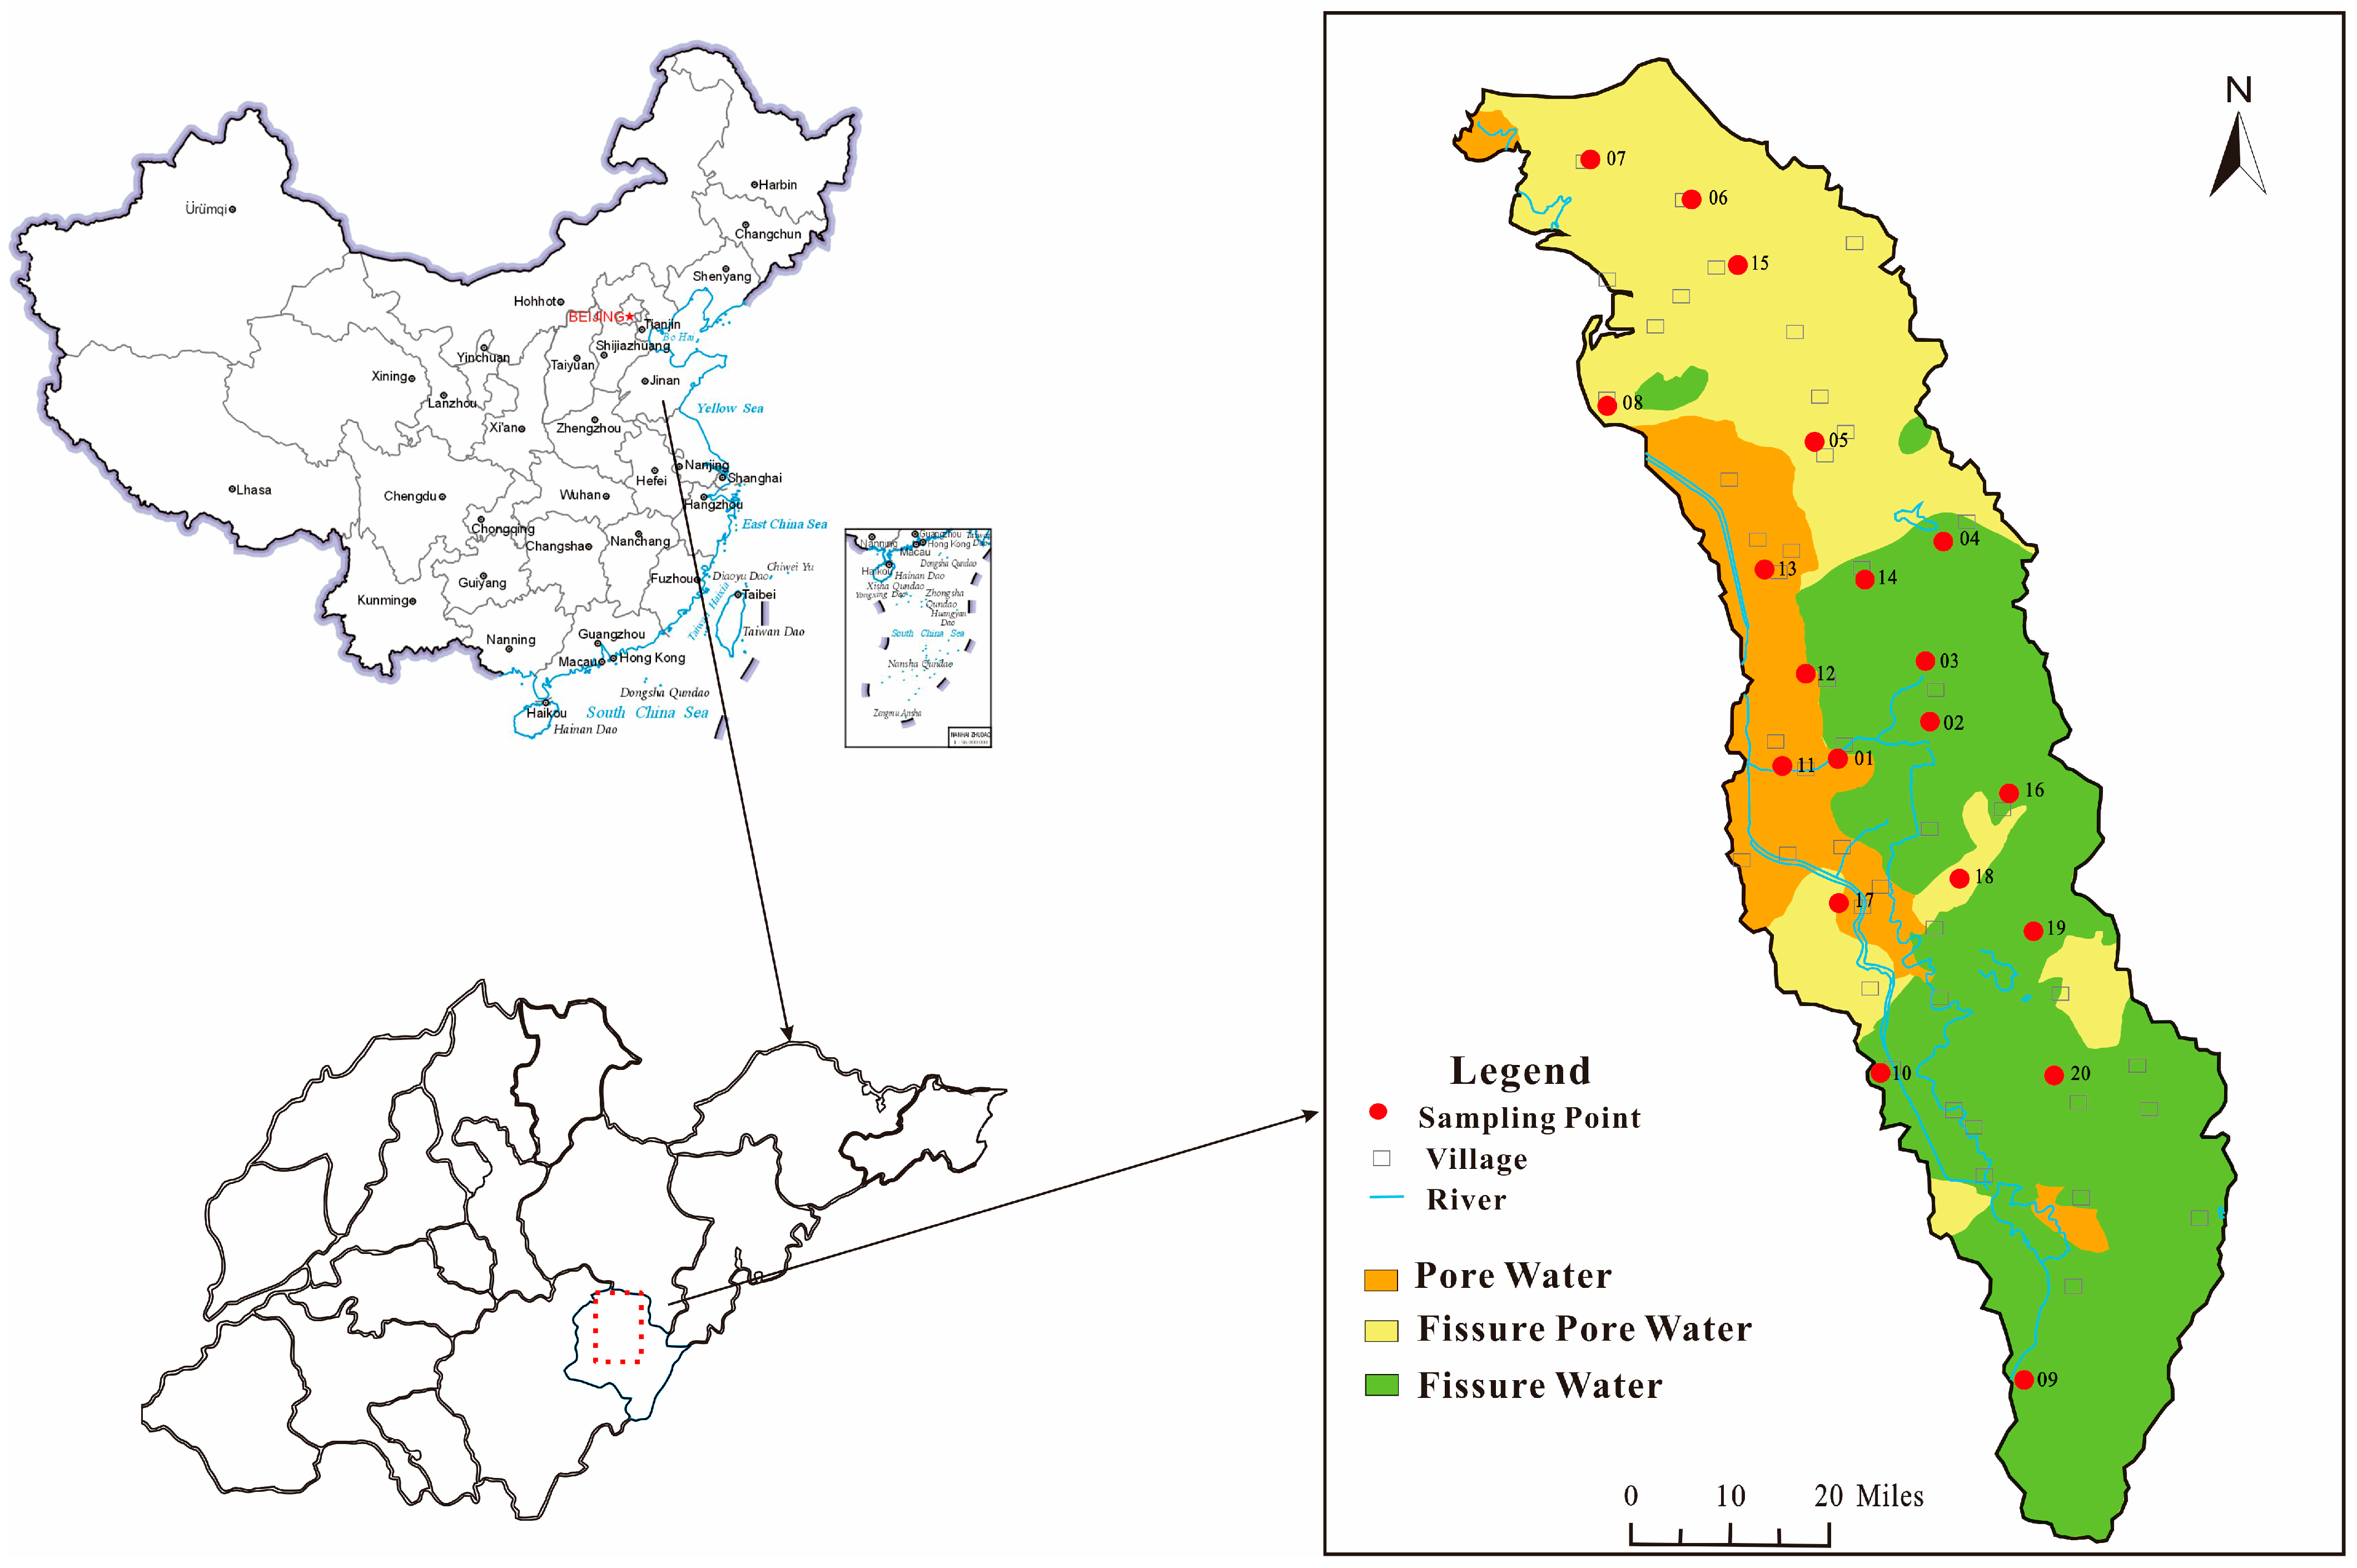
Figure 1. Geographical locations of the study area and sampling sites for three different types of groundwater.
Water 15 00359 g001
Figure 2. Box plots of the chemical contents of different groundwater types. (a) Na+ box plot; (b) K+ box plot; (c) Ca2+ box plot; (d) Mg2+ box plot; (e) CI box plot; (f) SO42− box plot; (g) HCO3 box plot; (h) NO3 box plot; (i) TDS box plot; (j) TH box plot; (k) pH box plot.
Water 15 00359 g002
Figure 3. Piper diagram showing the hydrochemical characteristics of groundwater in the Wulian area.
Water 15 00359 g003
Figure 4. Radar maps of water quality of different groundwater types. (a) PW, (b) FPW, (c) FW.
Water 15 00359 g004
Figure 5. Health risk index distribution maps for adults and children.
Water 15 00359 g005
Figure 6. Correlation plots between ionic components of three groundwater types.
Water 15 00359 g006
Figure 7. Gibbs plots of factors influencing the chemical characterization of groundwater in the Wulian. (TDS vs. Na+/(Na+ + Ca2+) (a) TDS vs. Cl/(Cl + HCO3) (b)).
Water 15 00359 g007
Figure 8. Analysis of the ion ratio in groundwater. (a) Cl vs. Na+; (b) Mg2+ vs. Ca2+; (c) Ca2+ + Mg2+ − SO42− − HCO3 vs. Na+ + K + -Cl; (d) NO3/Cl vs. Cl.
Water 15 00359 g008
Figure 9. Factor scores of the three groundwater types. (The square indicates that the factor score value is between 25% and 75%).
Water 15 00359 g009
Table 1. Health risk indicators of different groundwater types.
HQ (Min)HQ (Max)HQ (Mean)Proportion of HQ > 1
AdultPW0.546.862.3744%
FPW0.349.375.4189%
FW0.0045.131.1945%
ChildrenPW0.526.832.2744%
FPW0.338.995.1989%
FW0.0044.921.1441%
Table 2. Factorial load (absolute strong load (≥0.75) in bold) and the corresponding communality (top half of the table). Cumulative percentage of factor eigenvalues, percentages, and variances (bottom half of the table).
Factor 1Factor 2Factor 3Communalities
TDS0.99 0.10.99
NO30.72−0.440.270.78
Mg2+0.930.140.30.97
K+−0.30.90.220.95
TH0.97 0.220.99
Na+0.820.21−0.490.95
Cl0.91−0.26−0.230.95
Ca2+0.96−0.140.170.97
HCO30.90.27−0.180.92
pH0.510.27−0.690.81
SO42−0.730.580.340.98
Eigenvalues7.41.651.22(a) PW
Percentage of variance (%)67.2515.0111.04
Cumulative percentage of variance (%)67.2582.2693.3
Factor 1Factor 2Factor 3Communalities
TDS1 1
NO30.97 0.96
Mg2+0.940.15−0.290.99
K+0.920.32 0.94
TH0.91−0.36−0.170.98
Na+0.90.220.180.89
Cl0.86 −0.490.98
Ca2+0.84−0.5−0.120.97
HCO30.79−0.120.540.94
pH0.30.88 0.88
SO42−0.59−0.160.660.93
Eigenvalues7.41.651.22(b) FPW
Percentage of variance (%)67.2515.0111.04
Cumulative percentage of variance (%)67.2582.2693.3
Factor 1Factor 2Factor 3Communalities
TDS0.970.18 0.98
NO30.690.420.220.69
Mg2+0.79−0.530.210.96
K+0.230.670.210.55
TH0.97−0.22−0.110.99
Na+ 0.850.410.9
Cl0.520.52−0.320.64
Ca2+0.92 −0.310.95
HCO30.7−0.540.120.79
pH −0.370.750.71
SO42−0.710.120.140.54
Eigenvalues5.152.441.11(c) FW
Percentage of variance (%)46.7822.1410.12
Cumulative percentage of variance (%)46.7868.9279.04
Disclaimer/Publisher’s Note: The statements, opinions and data contained in all publications are solely those of the individual author(s) and contributor(s) and not of MDPI and/or the editor(s). MDPI and/or the editor(s) disclaim responsibility for any injury to people or property resulting from any ideas, methods, instructions or products referred to in the content.