Abstract
Flow resistance in gravel-bed channels is not only affected by the shape and size of the roughness elements, but also by their arrangement on the channel bed surface (position to flow streamlines, spacing between elements, and their protrusion from the channel bed). Many investigations proved that open channel flow resistance can be obtained by integrating the power velocity profile. For a macro-scale roughness condition, this study aims to investigate the effect of different boulder arrangements on flow resistance. First, for each arrangement, the equation relating Γ function of the power velocity profile, the Froude number, and the channel slope was calibrated using available measurements performed in a flume covered by pebbles with “Random”, “Transversal stripe”, and “Longitudinal stripe” arrangements. For each arrangement, the experimental datasets were divided to consider the effects of boulder concentration Ch. Moreover, the relationship obtained for the “Random” arrangement and element concentration lower than 48% was tested using literature measurements performed in a flume covered by coarse elements randomly arranged. Finally, the effects of the different boulder arrangements on the flow resistance law were investigated by imposing a concentration threshold. The results demonstrated that (i) the Darcy–Weisbach friction factor can be accurately estimated by the proposed flow resistance equation, (ii) the flow resistance increases with Ch for low values (<48%) of concentration, while it does not depend on Ch for high concentrations (≥48%), and (iii) the effect of the boulder arrangement on flow resistance law is more evident for low element concentrations.
1. Introduction
Although many studies regarding the determination of flow velocity in gravel-bed rivers are available, some scientific and technical aspects still need to be clarified. For channels having gravel beds, the macro-scale roughness condition [,,] occurs when the mean flow depth h is comparable with the bed roughness size, which is generally assumed equal to the median bed particle diameter d50. According to some studies [,,,], if the hydraulic condition is defined by the ratio between h and the bed particle diameter d84 (i.e., diameter for which 84% of the particles are finer), a macro-scale occurs for h/d84 ≤ 4. Macro-scale roughness condition is characterized by different dissipative mechanisms as compared to micro-scale one. Mendicino and Colosimo [] stated that, for values higher than 100 of the depth/sediment ratio (i.e., the ratio between the hydraulic radius R or h and the particle diameter representing the characteristic roughness height), skin friction is due to drag effects related to the shape of each bed particle and viscous friction on its surfaces, and is also influenced by macro-scale bed-forms.
For low values of the relative submergence (i.e., h/d84 ≤ 10, and in particular for h/d84 ~ 1), the resistance effects due to form drag and turbulent wakes caused by large roughness elements are high. When some elements protrude above the water surface, and the flow is locally supercritical, additional energy losses occur [,,]. According to Bathurst [], a channel can be defined with a “cobble and boulder bed” when d50 > 64 mm, the flow resistance due to vegetation is negligible, and the occurring roughness condition is “transition” or “macro-scale”.
Since most of the studies available in the literature investigated the flow resistance of uniform open channel flows for micro-scale roughness conditions, there is a scientific need to widen the knowledge on the macro-scale condition.
The open-channel flow resistance equation was theoretically obtained [] for some known cross-section shapes (i.e., circular, and very wide rectangular) and established boundary conditions for which the velocity distribution is known. Integrating the flow-velocity profile, a semi-theoretical flow resistance equation [,,,,], which is a major tool required in studying open-channel flow hydraulics, can be obtained.
For micro and macro-scale roughness, Ferro and Pecoraro [], using measured distributions having the measured maximum velocity located at the free surface, deduced a power velocity profile using the incomplete self-similarity theory.
For macro-scale roughness condition (h/d84 ≤ 4), some authors [,] demonstrated that the velocity profile is S-shaped, with near-surface velocities higher than near-bed ones, and the logarithmic or power distribution can be assumed only for a bottom distance greater than the roughness size.
Ferro [] carried out flume experiments for transition and macro-scale roughness conditions using boulders, with concentrations varying from 0 to 83%, arranged on a quarry rubble bed. Ferro [] concluded that a skimming flow regime [] occurs for boulder concentrations higher than 50%. For this regime, the proximity of the roughness elements determines the confinement of the eddies, and the flow motion occurs on a surface placed at the top level of the elements.
To estimate the flow velocity, having the cross-section shape and sizes, depth, and bed slope, is still one of the most relevant topics in hydraulics []. The Chezy, Manning, and Darcy–Weisbach uniform flow resistance formulas are the most applied [,]:
where V is the cross-section average velocity, C is the Chezy coefficient (m1/2 s−1), n is the Manning coefficient (m−1/3 s), s is the channel slope, g is the gravitational acceleration, f is the Darcy–Weisbach friction factor, R is the hydraulic radius, and , which is the shear velocity.
For a uniform turbulent open-channel flow, the vertical velocity profile distribution can be represented by the following equation []:
in which v is the local velocity, y is the distance from the bottom, νk is the kinematic viscosity, Γ is a function estimated by experimental velocity measurements, and δ is an exponent calculated by the following relationship []:
in which Re = V h/νk is the flow Reynolds number.
Integrating Equation (2), the following expression of the Darcy–Weisbach friction factor f [] is obtained:
Hypothesizing that y = α h (i.e., the distance from the bottom where the local velocity is equal to the cross-section average velocity V), Equation (2) gives the following estimate Γv of the function Γ []:
where α < 1 is a coefficient which implies two conditions: (i) the average flow velocity V occurs below the water surface and (ii) a single velocity profile is used to express the velocity distribution for the whole cross-section. Ferro [] theoretically deduced the following equation for calculating α:
Ferro [] tested Equations (4) and (5) using field measurements of flow velocity, water depth, river width, and bed slope of some Canadian mountain streams []. Moreover, this author [] empirically deduced the following relationship for the estimation of Γ function:
in which F = V/(gh)1/2 is the flow Froude number and a, b, and c are coefficients to be estimated experimentally.
Equation (7) was calibrated by Ferro and Porto [] using 104 experimental measurements collected in Calabrian gravel-bed rivers with high boulder concentrations, and 101 literature data on gravel-bed reaches [,,,,,].
Ferro [] tested the applicability of Equation (7) by using gravel-bed flume measurements [,,,], and demonstrated that this theoretical approach can be applied to measurements carried out in gravel-bed rivers [] upscaling the equation calibrated by flume data by a scale factor equal to 0.7611.
Carollo and Ferro [] also positively tested Equation (7) using experimental data obtained for flume covered by hemispheric elements in different hydraulic conditions (i.e., partially submerged and completely submerged). These authors [] placed the elements with a square arrangement and a concentration, Ch, in the range 4–64%. The results obtained by Carollo and Ferro [] showed that the two investigated hydraulic conditions gave the same exponents b and c of Equation (7), but a different scale factor a. The results also highlighted that, for these hydraulic conditions, the scale factor has a different trend with the concentration. The variability of a with Ch was explained because of the variability with Ch of the reference plane for the h measurement.
For macro-scale roughness conditions, the shape and size of the roughness elements and their arrangement (position to flow streamlines, spacing between elements, and protrusion of the elements from the channel bed) influence flow resistance [,,,,,].
O’Laughlin and MacDonald [] performed flume experiments to evaluate the flow resistance for two bed roughnesses (cube and sand) characterized by different concentrations. The results highlighted that for high element concentrations (0.7), the regularity of the surface determines the development of skimming flow.
Lawrence [], using the data available in the literature for a wide range of h/d, studied the overland flow resistance. Lawrence [] found a non-monotonic dependence between friction factor and h/d and presented three flow regimes distinguished by the submergence ratio. The results also suggested that h/d should be considered as the main dimensionless group affecting the hydraulics of overland flow on rough surfaces.
Lawrence [] conducted experimental runs on overland flow in a flume with the bed covered by hemispheric elements (0.2 ≤ h/d ≤ 7.5, and Ch = 10, 18, and 39%). For Re > 500, Lawrence [] found a relationship between f and h/d, especially for values of the ratio higher than 1. This author found that flow resistance increases for increasing Ch.
For low values of Ch, the distance among the roughness elements determines the dissipation of the wake generated by each element before approaching the next element along the flow direction (semi-smooth isolated roughness turbulent flow) []. Instead, for high values of it, the vicinity of the elements determines that the wake cannot dissipate before approaching the next one (wake interference flow). As a consequence, the effect of roughness element concentration becomes predominant as compared to that determined by the arrangement of the elements.
To the best of our knowledge, there is a lack of investigations on the effects of the boulder arrangement on flow resistance for low values of Ch in which this effect should be dominant. For this reason, this paper aims to investigate the effect of different boulder arrangements (i.e., “Random”, “Transversal stripe”, and “Longitudinal stripe”), with different concentrations, on flow resistance for macro-scale roughness conditions. In particular, the measurements available in the literature by Canovaro et al. [] and Ferro and Giordano [] allowed for (i) calibrating and testing the relationship between the velocity profile parameter Γ, the bed slope, and the flow Froude number, (ii) investigating the influence of the boulder concentration on flow resistance, and (iii) assessing the influence of the boulder arrangements on flow resistance for both low and high element concentration values.
2. Materials and Methods
2.1. Experimental Data by CANOVARO et al. []
Canovaro et al. [] performed experimental runs in a recirculating tilting flume (10 m long, 0.365 m wide, and 0.50 m deep) with glass walls. The measuring reach, composed of a thick layer (1 cm) of a uniform granular material (diameter = 7 mm), was 4 m long and was located about 5 m from the flume inlet section. Before the beginning of the measuring reach, a reach of quarry rubbles (1.5 m long) was positioned to avoid large-scale disturbance. Macro-roughness was generated by river pebbles placed above the granular layer with the short axis perpendicular to the granular layer and the long axis parallel to the channel axis. Three different types of pebbles (one for each experimental run) were used, characterized by different values of median axis dimension. For the experiments, flow discharge, flume slope, and pebble size were varied. Moreover, the pebble concentration Ch was varied from 0 to 100%, and three different planimetric arrangements (“Random”, “Transversal stripe”, and “Longitudinal stripe”, Figure 1) were tested. In particular, the “Random” arrangement was obtained by completely filling the flume bed along the measuring reach with pebbles (Ch = 100%), and then randomly removing a fixed number of pebbles for each experimental run, until no macro-roughness elements were present (Ch = 0%). The “Transversal stripe” arrangement was obtained by a sequence of transversal pebble stripes placed along the channel, which is representative of a step-pool morphology. For this arrangement, the spatial density was varied changing the distance between the stripes from a minimum value, with the stripes in contact, to a maximum value corresponding to a low spatial density. Finally, the “Longitudinal stripe” arrangement was obtained by two pebble rows parallel to the flow direction, and symmetrical to the channel axis. The spatial density was varied changing the distance between two consecutive pebbles. A total of 189, 160, and 34 runs were carried out for the “Random”, “Transversal stripe”, and “Longitudinal stripe” arrangements, respectively.
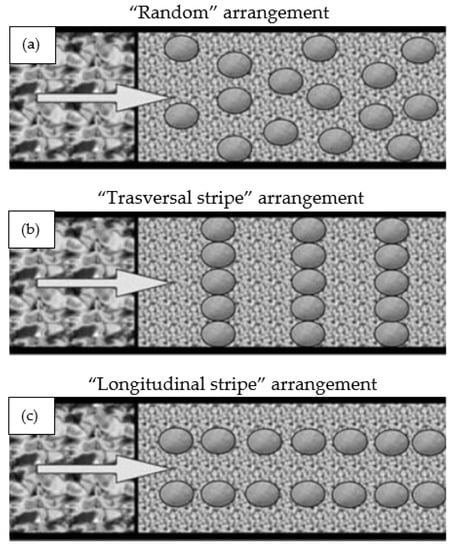
Figure 1.
Planimetric view of “Random” (a), “Transversal stripe” (b), and “Longitudinal stripe” (c) arrangements investigated by Canovaro et al. [].
The flow discharge was regulated by a valve and measured by an electromagnetic flowmeter. For all the investigated runs fixed-bed, average uniform and stationary conditions occurred. The water depths were measured twice (15 min time interval) by 19 piezometers located under the granular layer, for a total of 38 water depth values along the whole measuring reach, using the mean level of the granular layer surface as a reference. For each experimental run, the measured values were averaged in space and time to obtain a single mean water depth value. The flow velocity was measured, symmetrically to the channel axis, by a micro-propeller current meter (diameter ≈ 15 mm) in 27 measurement points along the measuring reach at 9 cross-sections placed 50 cm apart. Flow velocity was measured in the proximity of the water surface at about 80% of the depth from the bed, and only one measurement was taken along each vertical since the velocity profile is very flat over the macro-roughness.
Table 1 reports, for each investigated arrangement, the ranges of slope s, flow Reynolds number Re, Froude number F, and submergence ratio h/d.

Table 1.
Characteristic data of the investigated experimental runs.
2.2. Experimental Data by Ferro and Giordano []
Ferro and Giordano [] performed 416 experimental runs in a flume (4.7 m long, 0.3 m wide, 0.3 m deep) with slope values in the range 0.69–9.4%. The flume was made by a quarry rubble bed covered with coarse elements in different concentrations. In particular, the flume was divided into reference areas (0.3 m × 0.3 m), and in each area, a fixed number (0, 5, 10, 20, 30, and 60) of coarse elements was arranged obtaining boulder concentrations varying from 0 to 44%. A Venturi meter, installed in the water-supply pipe, was used to measure the flow discharge, while piezometers were used to measure eight water depth values, which were averaged to obtain the mean water depth. The investigated flows are turbulent (2052 ≤ Re ≤ 18159) and subcritical (0.19 ≤ F ≤ 0.97) (Table 1).
3. Results
Considering that Ferro [] suggested that a skimming flow regime occurs for boulder concentrations higher than 50%, the 189 measurements carried out for the “Random” arrangement by Canovaro et al. [] were divided into two datasets distinguishing them by the boulder concentration threshold equal to 48% (84 data for Ch < 48% and 105 data for Ch ≥ 48%). These two datasets were used to calibrate Equation (7), obtaining the following result:
for Ch < 48% and
for Ch ≥ 48%. These equations are both characterized by a coefficient of determination of 0.999. Figure 2a shows the comparison between the Γv values obtained by Equations (5) and (6), with those calculated by Equations (8a) and (8b).
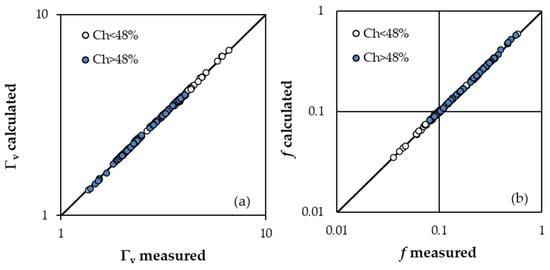
Figure 2.
Comparison between the Γv values obtained by Equations (5) and (6), with those calculated by Equations (8a) and (8b) (a), and between the measured fm values and those calculated fc by Equations (9a) and (9b) (b) for the “Random” arrangement.
Coupling Equations (8a) and (8b) and Equation (4), the following equations to estimate the Darcy–Weisbach friction factor are obtained:
Figure 2b shows the comparison between the measured fm values and those calculated fc by Equations (9a) and (9b) and remarks that an accurate estimate of the Darcy–Weisbach friction factor can be obtained by the proposed approach. The friction factor values calculated by Equations (9) are characterized by errors in estimate E = (fc − fm)/fm which are less than or equal to ±5% for 98.9% of cases and less than or equal to ±2.5% for 87.8% of cases.
Equation (9a) was tested using the 416 experimental data by Ferro and Giordano [], since these data were obtained for an overlapped range of element concentrations (0 ≤ Ch ≤ 44%). Figure 3 shows the comparison between the measured f values and those calculated applying Equation (9a), obtained for the “Random” arrangement by Canovaro et al. [], to the dataset by Ferro and Giordano []. For the dataset by Ferro and Giordano [], this figure shows that, on average, the Darcy–Weisbach friction factor values calculated by Equation (9a) are approximately equal to 0.97 fm. In other words, Equation (9a) systematically underestimates (−3%) the f values measured by Ferro and Giordano [].
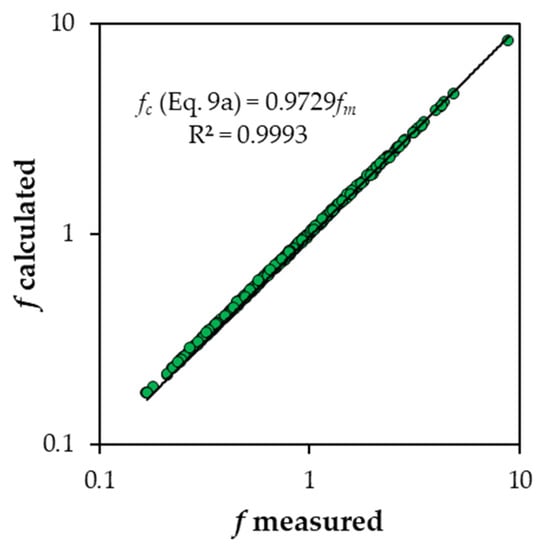
Figure 3.
Comparison between the f values and those calculated applying Equation (9a), obtained for the “Random” arrangement by Canovaro et al. [], to the dataset by Ferro and Giordano [].
The friction factor values calculated applying Equation (9a) to this dataset are characterized by errors in estimate E, which are distributed according to the normal law (Figure 4), less than or equal to ±5% for 98.8% of cases and less than or equal to ±2.5% for 82.4% of cases.
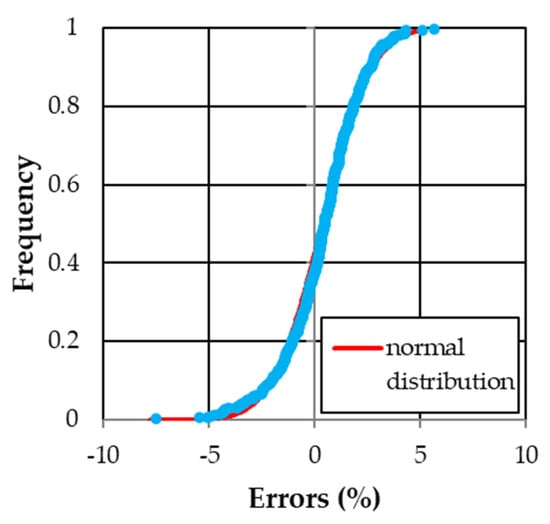
Figure 4.
Frequency distribution of the errors E in the estimate of f applying Equation (9a) to the data by Ferro and Giordano [].
Then, Equation (7) was also calibrated using the 160 measurements carried out for the “Trasversal stripe” arrangement by Canovaro et al. []. The equation was calibrated for both Ch ≤ 35% (140 data, Equation (10a)) and Ch = 100% (20 data, Equation (10b)) and the following results were obtained:
Characterized by a coefficient of determination of 0.999. Coupling Equations (10a) and (10b) and Equation (4), the following equations to estimate the Darcy–Weisbach friction factor are obtained:
Figure 5 shows the comparison between the f measured values and those calculated by Equations (11a) and (11b). The friction factor values calculated by these equations are characterized by errors in estimate E which are less than or equal to ±5% for 97.5% of cases and less than or equal to ±2.5% for 85% of cases.
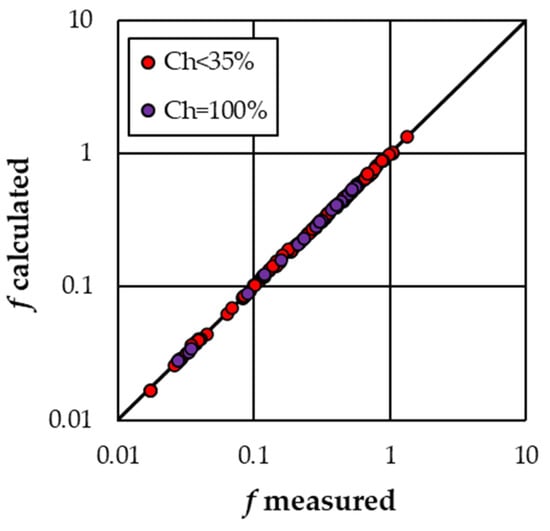
Figure 5.
Comparison between the measured fm values and those calculated fc by Equations (11) for the “Transversal stripe” arrangement.
Finally, Equation (7) was also calibrated using the 30 measurements carried out for the “Longitudinal stripe” arrangement and Ch ≤ 35.8% by Canovaro et al. [], and the following result was obtained:
Characterized by a coefficient of determination of 0.999. Coupling Equation (12) and Equation (4), the following equation to estimate the Darcy–Weisbach friction factor is obtained:
Figure 6 shows the comparison between the f measured values and those calculated by Equation (13). The friction factor values calculated by Equation (13) are characterized by errors in estimate E which are always less than or equal to ±5% and ±2.5%.
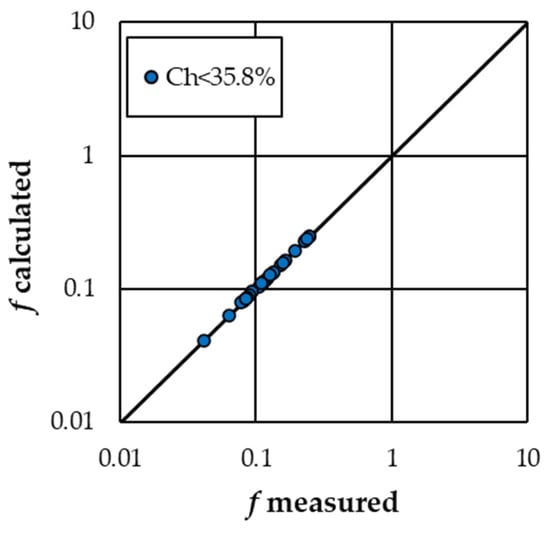
Figure 6.
Comparison between the measured f values and those calculated by Equation (13) for the “Longitudinal stripe” arrangement.
To investigate the effect of the boulder concentration on flow resistance, the trend of the Darcy–Weisbach friction factor values with Ch was examined for both low (<48%) and high (≥48%) values of roughness concentrations. Figure 7a,b show, as an example for the “Random” arrangement, the trend of f for three selected values of concentration for low (Ch = 0, 18, and 42%) and high (Ch = 48, 71, and 89%) values of roughness concentration, respectively.
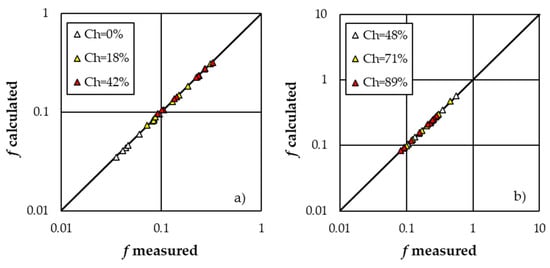
Figure 7.
Trend of the Darcy–Weisbach friction factor for three selected values of concentration for low (Ch = 0, 18, and 42%) (a) and high (Ch = 48, 71, and 89%) (b) values of roughness concentration.
For Ch < 48%, since Equations (8a), (10a), and (12) presented similar values of the b and c coefficients, their mean values (b = 1.078 and c = 0.58) can be used to attribute to the a coefficient the effect of the arrangements on flow resistance. For each arrangement, the behavior of the pairs (F1.078s−0.58, Γ) was investigated and a value of the a coefficient, equal to the slope coefficient of the best-fit straight line passing through the origin of the axes, was obtained. In particular, the a coefficient resulted equal to 0.3354 for the “Random” arrangement, 0.3372 for the “Transversal stripe” arrangement, and 0.335 for the “Longitudinal stripe” arrangement (Table 2). Figure 8 shows the comparison between the f measured values and those calculated coupling Equations (4) and (7) with b = 1.078, c = 0.58, and a varying with the arrangement. In this case, the errors E in the estimate of the Darcy–Weisbach friction factor are less than or equal to ±5% for 96.8% of cases and less than or equal to ±2.5% for 88.2% of cases.

Table 2.
Values of a, b, and c coefficients obtained for the different analyses.
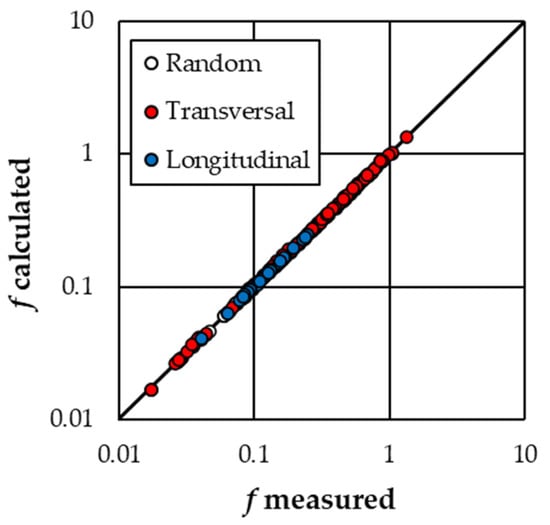
Figure 8.
Comparison between the measured f values and those calculated coupling Equations (4) and (7) with b = 1.078, c = 0.58 and a varying with the arrangement.
The same procedure was applied for the data with Ch ≥ 48%, and the mean values of b (1.1175) and c (0.587) coefficients were used obtaining a coefficient equal to 0.3356 for the “Random” arrangement, and 0.3366 for the “Transversal stripe” arrangement (Table 2). Figure 9 shows the comparison between the f measured values and those calculated coupling Equations (4) and (7) with b = 1.1175, c = 0.587 and a varying with the arrangement. In this case, the errors E in the estimate of the Darcy–Weisbach friction factor are always less than or equal to ±5% and less than or equal to ±2.5% for 86.4% of cases.
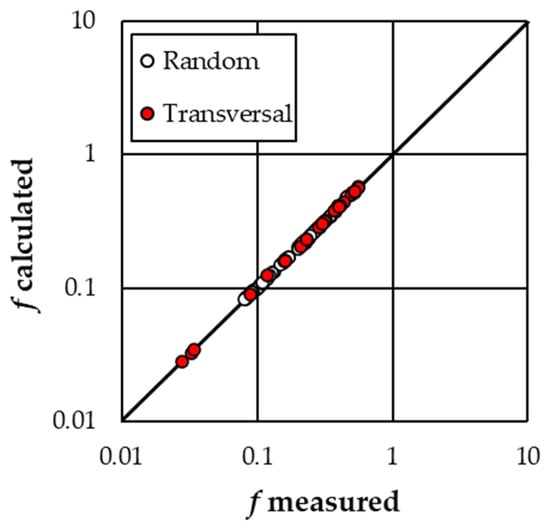
Figure 9.
Comparison between the measured f values and those calculated coupling Equations (4) and (7) with b = 1.1175, c = 0.587 and a varying with the arrangement.
4. Discussion
Figure 2b, Figure 5, and Figure 6 demonstrate that the presented theoretical approach guarantees a good estimate of the Darcy–Weisbach friction factor for both low (<48%) and high (≥48%) values of boulder concentration for all the three investigated arrangements. The reliability of the proposed approach is also confirmed by the fact that the equation (Equation (9a)), obtained for the “Random” arrangement by Canovaro et al. [] and Ch < 48%, gave a good estimate of f (Figure 3 and Figure 4) when applied to the dataset by Ferro and Giordano [], which falls into the same Ch range (0–44%) and is characterized by the same arrangement. The systematic low underestimation (Figure 3) can be justified considering that Canovaro et al. [] used smooth river pebbles as macro-roughness elements while Ferro and Giordano [] used rough quarry rubble boulders.
Figure 7 shows, as an example for the “Random” arrangement, that the Darcy–Weisbach friction factor values increase for increasing values of Ch for concentrations lower than 48% (Figure 7a), while no trend between f and Ch is detectable for boulder concentrations higher than or equal to 48% (Figure 7b). These results can be justified by the circumstance that, according to the findings by Lawrence [], for low values of Ch, the distance among the roughness elements determines the dissipation of the wake generated by each element before approaching the next element along the flow direction (semi-smooth isolated roughness turbulent flow) [], but for increasing concentrations the flow is increasingly disturbed as this distance diminishes determining an increase of flow resistance (wake interference flow). Instead, for high values of Ch, the vicinity of the elements determines that a quasi-skimming flow occurs, and the flow resistance loses its dependence on boulder concentration. This result agrees with the findings by Carollo and Ferro [] who found that, for a square arrangement, the skimming flow occurs for element concentrations ≥50%, which is close to the threshold value of 48% used in this investigation.
Finally, the values (0.3354 for the “Random”, 0.3372 for the “Transversal stripe”, and 0.335 for the “Longitudinal stripe” arrangement) of the coefficient a obtained fixing b and c coefficients suggest that, for Ch < 48%, the “Random” and the “Longitudinal stripe” arrangements are characterized by similar values of f for fixed hydraulic conditions, while the “Transversal stripe” arrangement generates less flow resistance. For low values of concentration, the boulder arrangement influences the flow resistance. In fact, the position to flow streamlines change with the arrangement and determine a different behavior of the flow. The “Transversal stripe” arrangement is characterized by a position of the elements which allows the flow for dissipating the wake. In other words, the investigated transversal strips are so distant that energy loss due to each strip is independent from the previous and the next ones.
Instead, for Ch ≥ 48% the obtained a values (0.3356 for the “Random”, and 0.3366 for the “Transversal stripe” arrangement) fixing b and c coefficients, suggest that the arrangement slightly influences the flow resistance. This result seems to not agree with that obtained by Lawrence [], who suggested that, for high Ch values, the effect of roughness element concentration becomes predominant as compared to that determined by the arrangement of the elements. This result can be justified considering that the analysis developed in the present study is influenced by the low number of available measurements for the “Transversal stripe” arrangement, and the circumstance that the runs for this arrangement were only performed for Ch equal to 100%.
In any case, also the second applied procedure (i.e., fixing the b and c coefficients varying a) guaranteed a reliable estimate of the Darcy–Weisbach friction factor for both low (Figure 8) and high (Figure 9) values of the boulder concentration.
The obtained results about the knowledge of the flow behavior for some known conditions can guide the decisions, for instance, in river management. The main limitations of this investigation are related to the concentration values used for the experimental runs of the “Transversal” and “Longitudinal” arrangements. Consequently, future studies can overcome the need for increasing the number of runs regarding these experimental conditions.
5. Conclusions
This paper aimed to investigate the effect of different boulder arrangements, with different concentrations, on flow resistance for macro-scale roughness conditions. For each arrangement, a flow resistance law was obtained using measurements available in the literature, performed in a flume covered by smooth pebbles with “Random”, “Transversal stripe”, and “Longitudinal stripe” arrangements, dividing the data to consider the effects of boulder concentration. The relationship obtained for the “Random” arrangement and low boulder concentration was tested using the literature measurements performed in a flume covered by coarse elements randomly arranged falling in the same range of element concentration. Notwithstanding, Equations (8), (10) and (12) are theoretically based, and were calibrated by the available flume measurements; further verifications could be carried out to assess their applicability in field conditions.
Moreover, the effects of the different boulder arrangements on the flow resistance law were investigated. The results demonstrated that (i) the Darcy–Weisbach friction factor can be accurately estimated by the proposed flow resistance equation, (ii) the flow resistance increases with Ch for low values of concentration, while it does not depend on Ch for high concentrations, and (iii) the effect of the boulder arrangement on flow resistance law is more evident for low element concentrations.
Author Contributions
Conceptualization, A.N., F.G.C. and V.F.; formal analysis, A.N., F.G.C. and V.F.; investigation, A.N., F.G.C. and V.F.; methodology, A.N., F.G.C. and V.F.; project administration, V.F.; software, A.N., F.G.C. and V.F.; supervision, V.F.; writing—original draft, A.N., F.G.C. and V.F.; writing—review and editing, A.N., F.G.C. and V.F. All authors have read and agreed to the published version of the manuscript.
Funding
This research received no external funding.
Institutional Review Board Statement
Not applicable.
Informed Consent Statement
Not applicable.
Data Availability Statement
Data are available in the paper by Canovaro et al. [].
Conflicts of Interest
The authors declare no conflict of interest.
References
- Bathurst, J.C. Flow resistance of large-scale roughness. J. Hydraul. Eng. 1978, 104, 1587–1603. [Google Scholar] [CrossRef]
- Bray, D.I. Estimating average velocity in gravel bed rivers. Proc. J. Hydraul. Eng. 1979, 105, 1103–1122. [Google Scholar] [CrossRef]
- Lawrence, D.S.L. Macroscale surface roughness and frictional resistance in overland flow. Earth Surf. Proc. Land. 1997, 22, 365–382. [Google Scholar] [CrossRef]
- Bathurst, J.C.; Li, R.H.; Simons, D.B. Resistance equations for largescale roughness. J. Hydraul. Eng. 1981, 107, 1593–1613. [Google Scholar]
- Colosimo, C.; Copertino, V.A.; Veltri, M. Friction factor evaluation on gravel bed rivers. J. Hydraul. Eng. 1988, 114, 861–869. [Google Scholar] [CrossRef]
- Reid, D.E.; Hickin, E.J. Flow resistance in steep mountain streams. Earth Surf. Proc. Land. 2008, 33, 2211–2240. [Google Scholar] [CrossRef]
- Mendicino, G.; Colosimo, F. Analysis of flow resistance equations in gravel-bed rivers with intermittent regimes: Calabrian fiumare Data Set. Water Resour. Res. 2019, 55, 7294–7319. [Google Scholar] [CrossRef]
- Ferguson, R. Flow resistance equations for gravel and boulder bed streams. Water Resour. Res. 2007, 43, W05427. [Google Scholar] [CrossRef]
- Nitsche, M.; Rickenmann, D.; Kirchner, J.W.; Turowski, J.M.; Badoux, A. Macroroughness and variations in reach-averaged flow resistance in steep mountain streams. Water Resour. Res. 2012, 48, W12518. [Google Scholar] [CrossRef]
- Rickenmann, D.; Recking, A. Evaluation of flow resistance in gravel-bed rivers through a large field data set. Water Resour. Res. 2011, 47, W07538. [Google Scholar] [CrossRef]
- Bathurst, J.C. Flow resistance in boulder-bed streams. In Gravel-Bed Rivers; Hey, R.D., Bathurst, J.C., Thorne, C.R., Eds.; Wiley: Chichester, UK, 1982; pp. 443–462. [Google Scholar]
- Powell, D.M. Flow resistance in gravel-bed rivers: Progress in research. Earth Sci. Rev. 2014, 136, 301–338. [Google Scholar] [CrossRef]
- Ferro, V. ADV measurements of velocity distributions in a gravel-bed flume. Earth Surf. Proc. Land. 2003, 28, 707–722. [Google Scholar] [CrossRef]
- Ferro, V. Flow resistance in gravel-bed channels with large-scale roughness. Earth Surf. Proc. Land. 2003, 28, 1325–1339. [Google Scholar] [CrossRef]
- Ferro, V.; Porto, P. Applying hypothesis of self-similarity for flow resistance law in Calabrian gravel-bed rivers. J. Hydraul. Eng. 2018, 144, 1–11. [Google Scholar] [CrossRef]
- Ferro, V.; Porto, P. Assessing theoretical flow velocity profile and resistance in gravel bed rivers by field measurements. J. Agric. Eng. 2018, 810, 220–227. [Google Scholar] [CrossRef]
- Ferro, V.; Pecoraro, R. Incomplete self-similarity and flow velocity in gravel bed channels. Water Resour. Res. 2000, 36, 2761–2769. [Google Scholar] [CrossRef]
- Marchand, J.P.; Jarrett, R.D.; Jones, L.L. Velocity Profile, Water Surface Slope, and Bed Material Size for Selected Streams in Colorado; Open-File Report; US Geological Survey: Lakewood, CO, USA, 1984; pp. 84–773. [Google Scholar]
- Bathurst, J.C. Velocity profile in high-gradient, boulder-bed channels. In Proceedings of the International Conference on Fluvial Hydraulics, IAHR, Budapest, Hungary, 30 May–3 June 1988; pp. 29–34. [Google Scholar]
- Ferro, V. Friction factor for gravel-bed channel with high boulder concentration. J. Hydraul. Eng. 1999, 125, 771–778. [Google Scholar] [CrossRef]
- Morris, H.M. Design methods for flow in rough conduits. J. Hydraul. Eng. 1959, 87, 43–62. [Google Scholar] [CrossRef]
- Bray, D.I. Flow resistance in gravel-bed rivers. In Gravel-Bed Rivers; Hey, R.D., Bathurst, J.C., Thorne, C.R., Eds.; Wiley: Toronto, ON, Canada, 1982; pp. 109–132. [Google Scholar]
- Barenblatt, G.I. Scaling laws for fully developed turbulent shear flows, part 1, Basic hypothesis and analysis. J. Fluid Mech. 1993, 248, 513–520. [Google Scholar] [CrossRef]
- Castaing, B.; Gagne, Y.; Hopfinger, E.J. Velocity probability density functions of high Reynolds number turbulence. Phys. D 1990, 46, 177–200. [Google Scholar] [CrossRef]
- Ferro, V. New flow resistance law for steep mountain streams based on velocity profile. J. Irrig. Drain. Eng. 2017, 143, 04017024. [Google Scholar] [CrossRef]
- Bathurst, J.C. Flow resistance estimation in mountain rivers. J. Hydraul. Eng. 1985, 111, 625–643. [Google Scholar] [CrossRef]
- Griffiths, G.A. Flow resistance in coarse gravel-bed rivers. J. Hydraul. Div. 1981, 107, 899–916. [Google Scholar] [CrossRef]
- Kellerhals, R. Stable channels with gravel-paved bed. J. Waterw. Harb. Div. 1967, 93, 63–84. [Google Scholar] [CrossRef]
- Thompson, S.M.; Campbell, P.L. Hydraulics of a large channel paved with boulders. J. Hydraul. Res. 1979, 17, 341–354. [Google Scholar] [CrossRef]
- Ferro, V. Assessing flow resistance in gravel bed channels by dimensional analysis and self-similarity. Catena 2018, 169, 119–127. [Google Scholar] [CrossRef]
- Ferro, V.; Giordano, G. Experimental study of flow resistance in gravel bed rivers. J. Hydraul. Eng. 1991, 117, 1239–1246. [Google Scholar] [CrossRef]
- Ferro, V.; Baiamonte, G. Flow velocity profiles in gravel bed rivers. J. Hydraul. Eng. 1994, 120, 60–80. [Google Scholar] [CrossRef]
- Baiamonte, G.; Ferro, V.; Giordano, G. Advances on velocity profile and flow resistance law in gravel bed rivers. Excerpta 1995, 9, 41–89. [Google Scholar]
- Carollo, F.G.; Ferro, V. Experimental study of boulder concentration effect on flow resistance in gravel bed channels. Catena 2021, 205, 105458. [Google Scholar] [CrossRef]
- O’Laughlin, E.M.; MacDonald, E.G. Some roughness-concentration effects on boundary resistance. Houille Blanche 1964, 7, 773–782. [Google Scholar] [CrossRef]
- Pyle, R.; Novak, P. Coefficient of friction in conduits with large roughness. J. Hydraul. Res. 1981, 19, 119–140. [Google Scholar] [CrossRef]
- Lawrence, D.S.L. Hydraulic resistance in overland flow during partial and marginal surface inundation: Experimental observation and modelling. Water Resour. Res. 2000, 36, 2381–2393. [Google Scholar] [CrossRef]
- Canovaro, F.; Paris, E.; Solari, L. Effects of macro-scale bed roughness geometry on flow resistance. Water Resour. Res. 2007, 43, W10414. [Google Scholar] [CrossRef]
Disclaimer/Publisher’s Note: The statements, opinions and data contained in all publications are solely those of the individual author(s) and contributor(s) and not of MDPI and/or the editor(s). MDPI and/or the editor(s) disclaim responsibility for any injury to people or property resulting from any ideas, methods, instructions or products referred to in the content. |
© 2023 by the authors. Licensee MDPI, Basel, Switzerland. This article is an open access article distributed under the terms and conditions of the Creative Commons Attribution (CC BY) license (https://creativecommons.org/licenses/by/4.0/).