Spatial Mapping of Groundwater Potentiality Applying Geometric Average and Fractal Models: A Sustainable Approach
Abstract
:1. Introduction
- (1)
- Data-Driven-Model, which concerns statistical, probabilistic, and data mining techniques and the quality and quantity of data are the significant characteristics impacting the predictive precision. Various types of the first model have been employed for editing groundwater potential area maps, such as Dempster-Shafer theory [24,25], evidential belief function [26,27], frequency ratio [28,29], logistic regression [30,31], statistical index [25], certainty factor [32,33], the weight-of-evidence method [34] and index of entropy [35];
- (2)
- (3)
- Machine learning techniques (MLTs) have provided better accuracy in many situations due to their ability to handle, in a robust manner, data characterized by a non-linear format, representing different scales, and deriving from different sources [39,40]. The MLT includes several models such as aquifer sustainability factor [41], classification and regression tree [42], random forest [22,43], boosted regression tree [44], maximum entropy [22], artificial neural network model [45], and generalized additive model [46].
2. Study Area
3. Materials and Methods
- (1)
- (2)
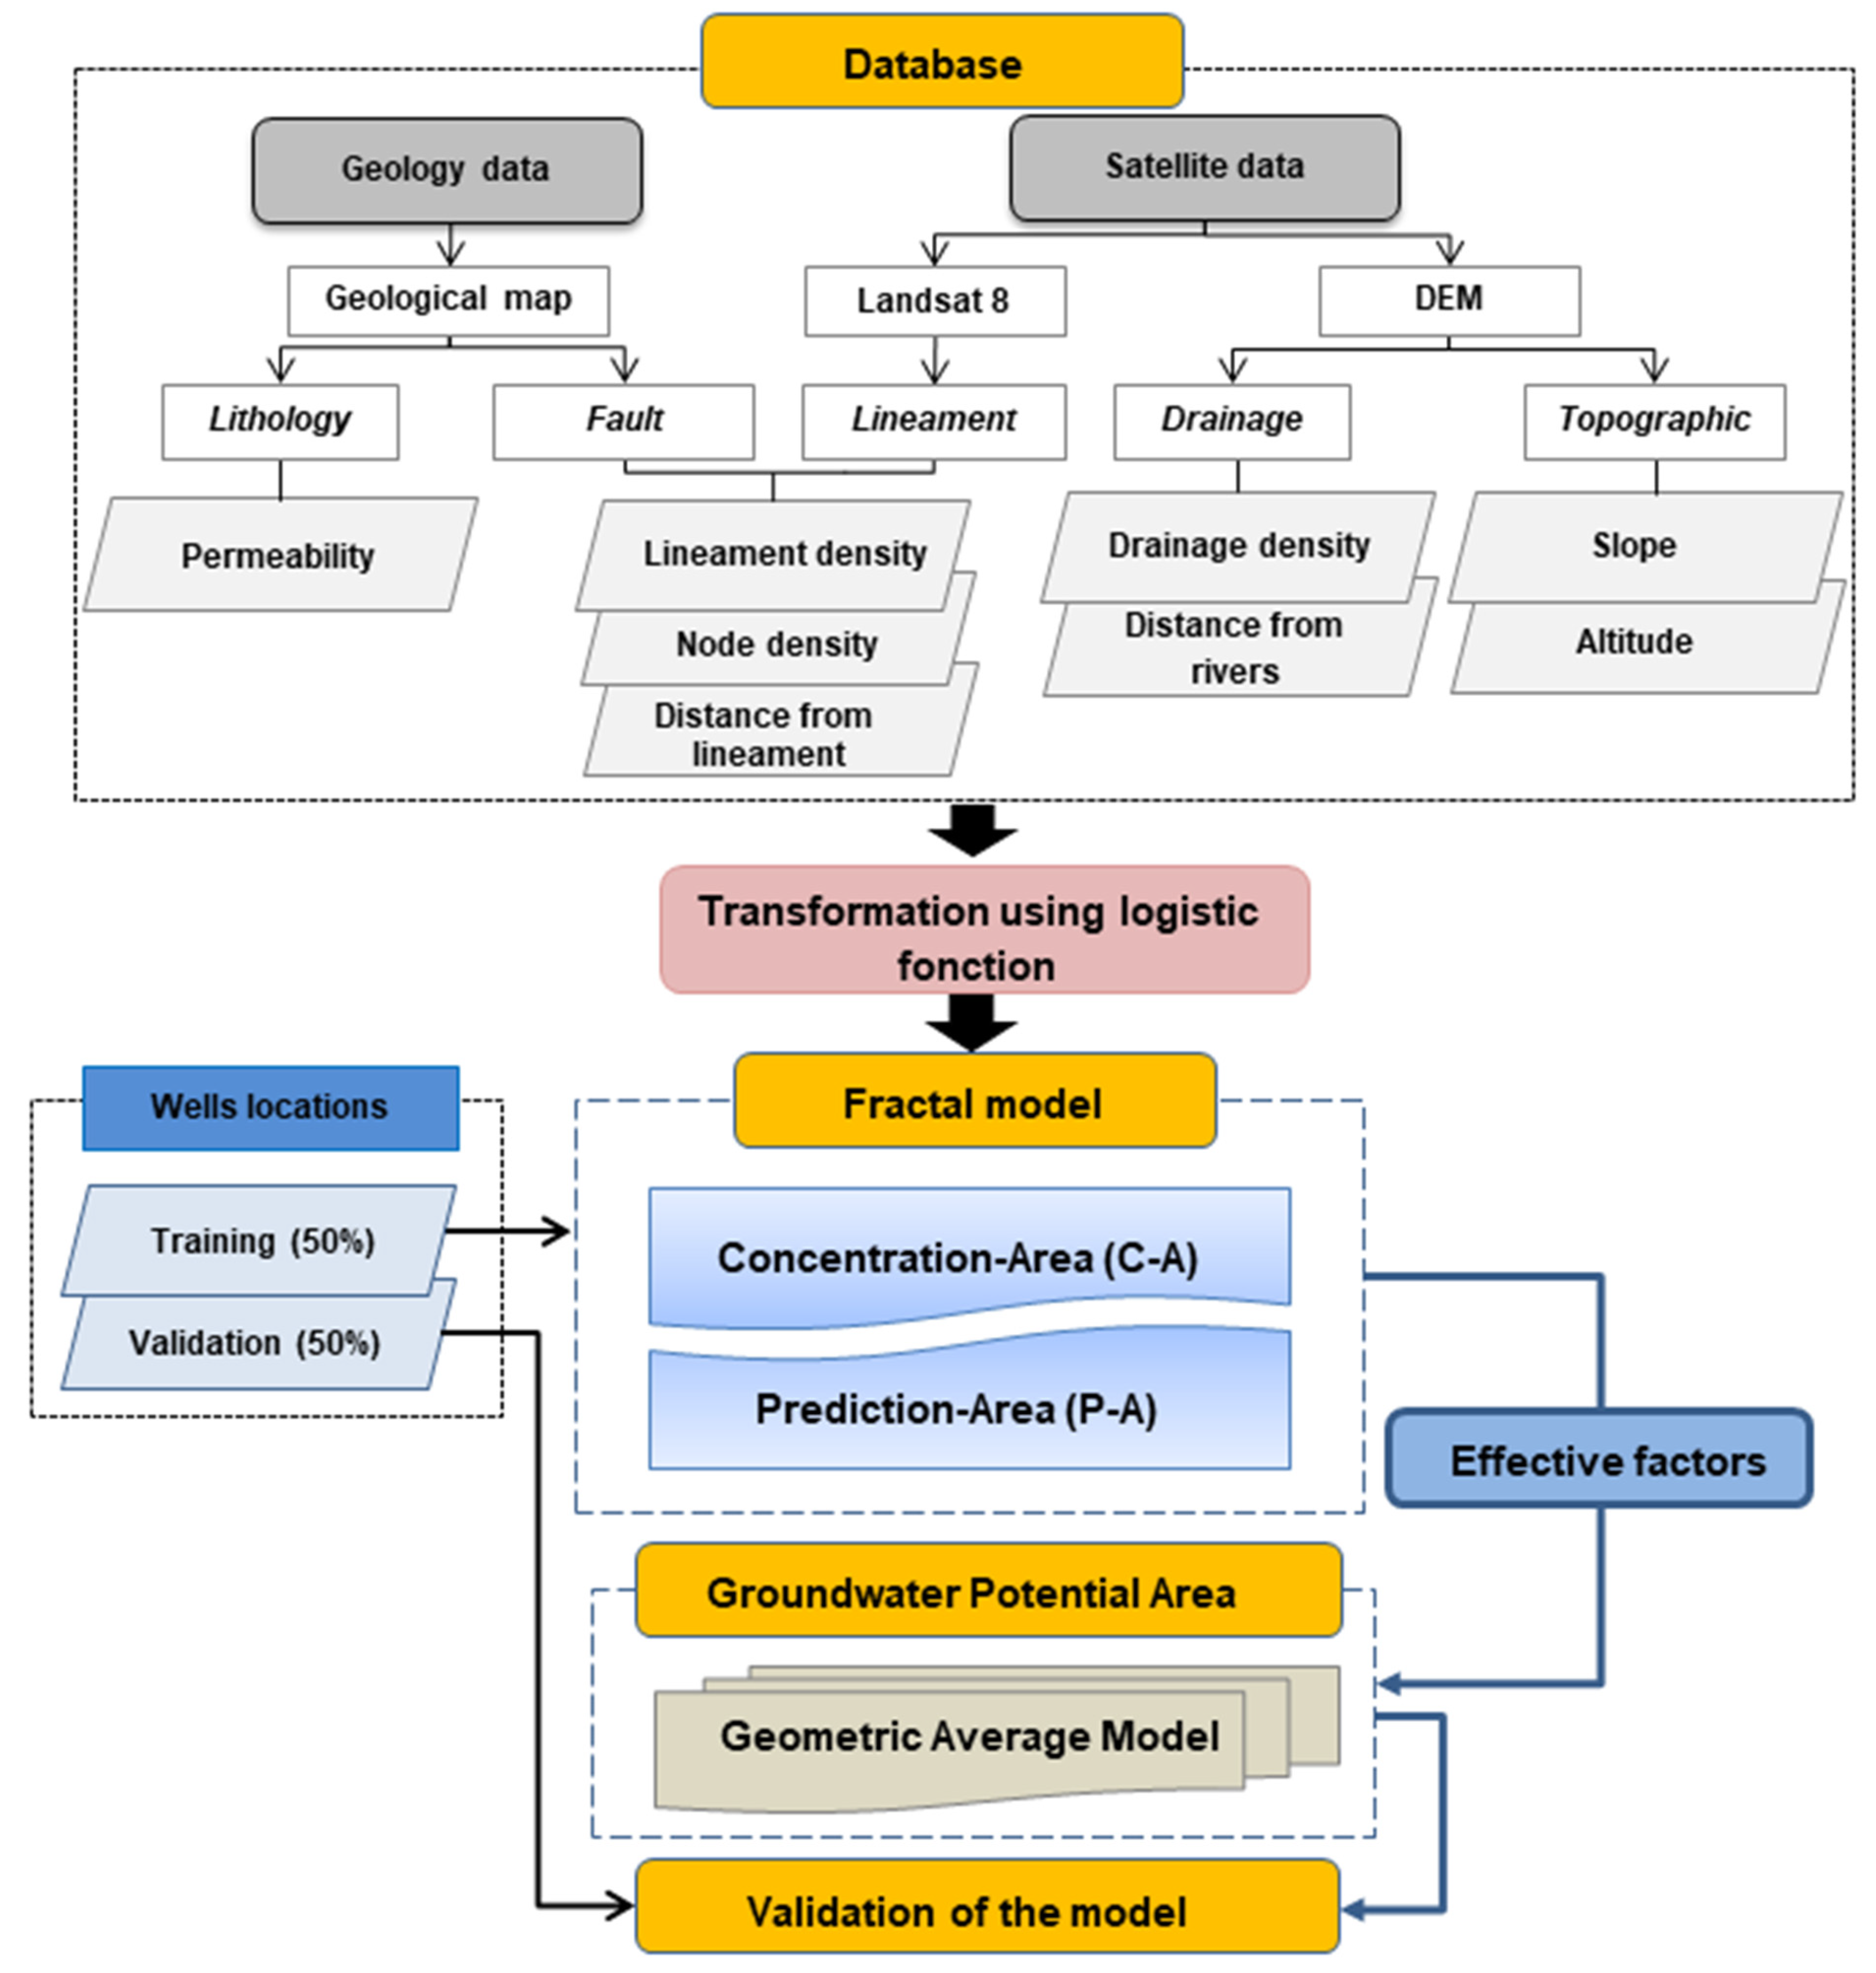
- Collect a geospatial database that influences groundwater availability from different sources and generate different map factors.
- (3)
- Assign a score to the classes of each factor according to their relative importance using the logistic function.
- (4)
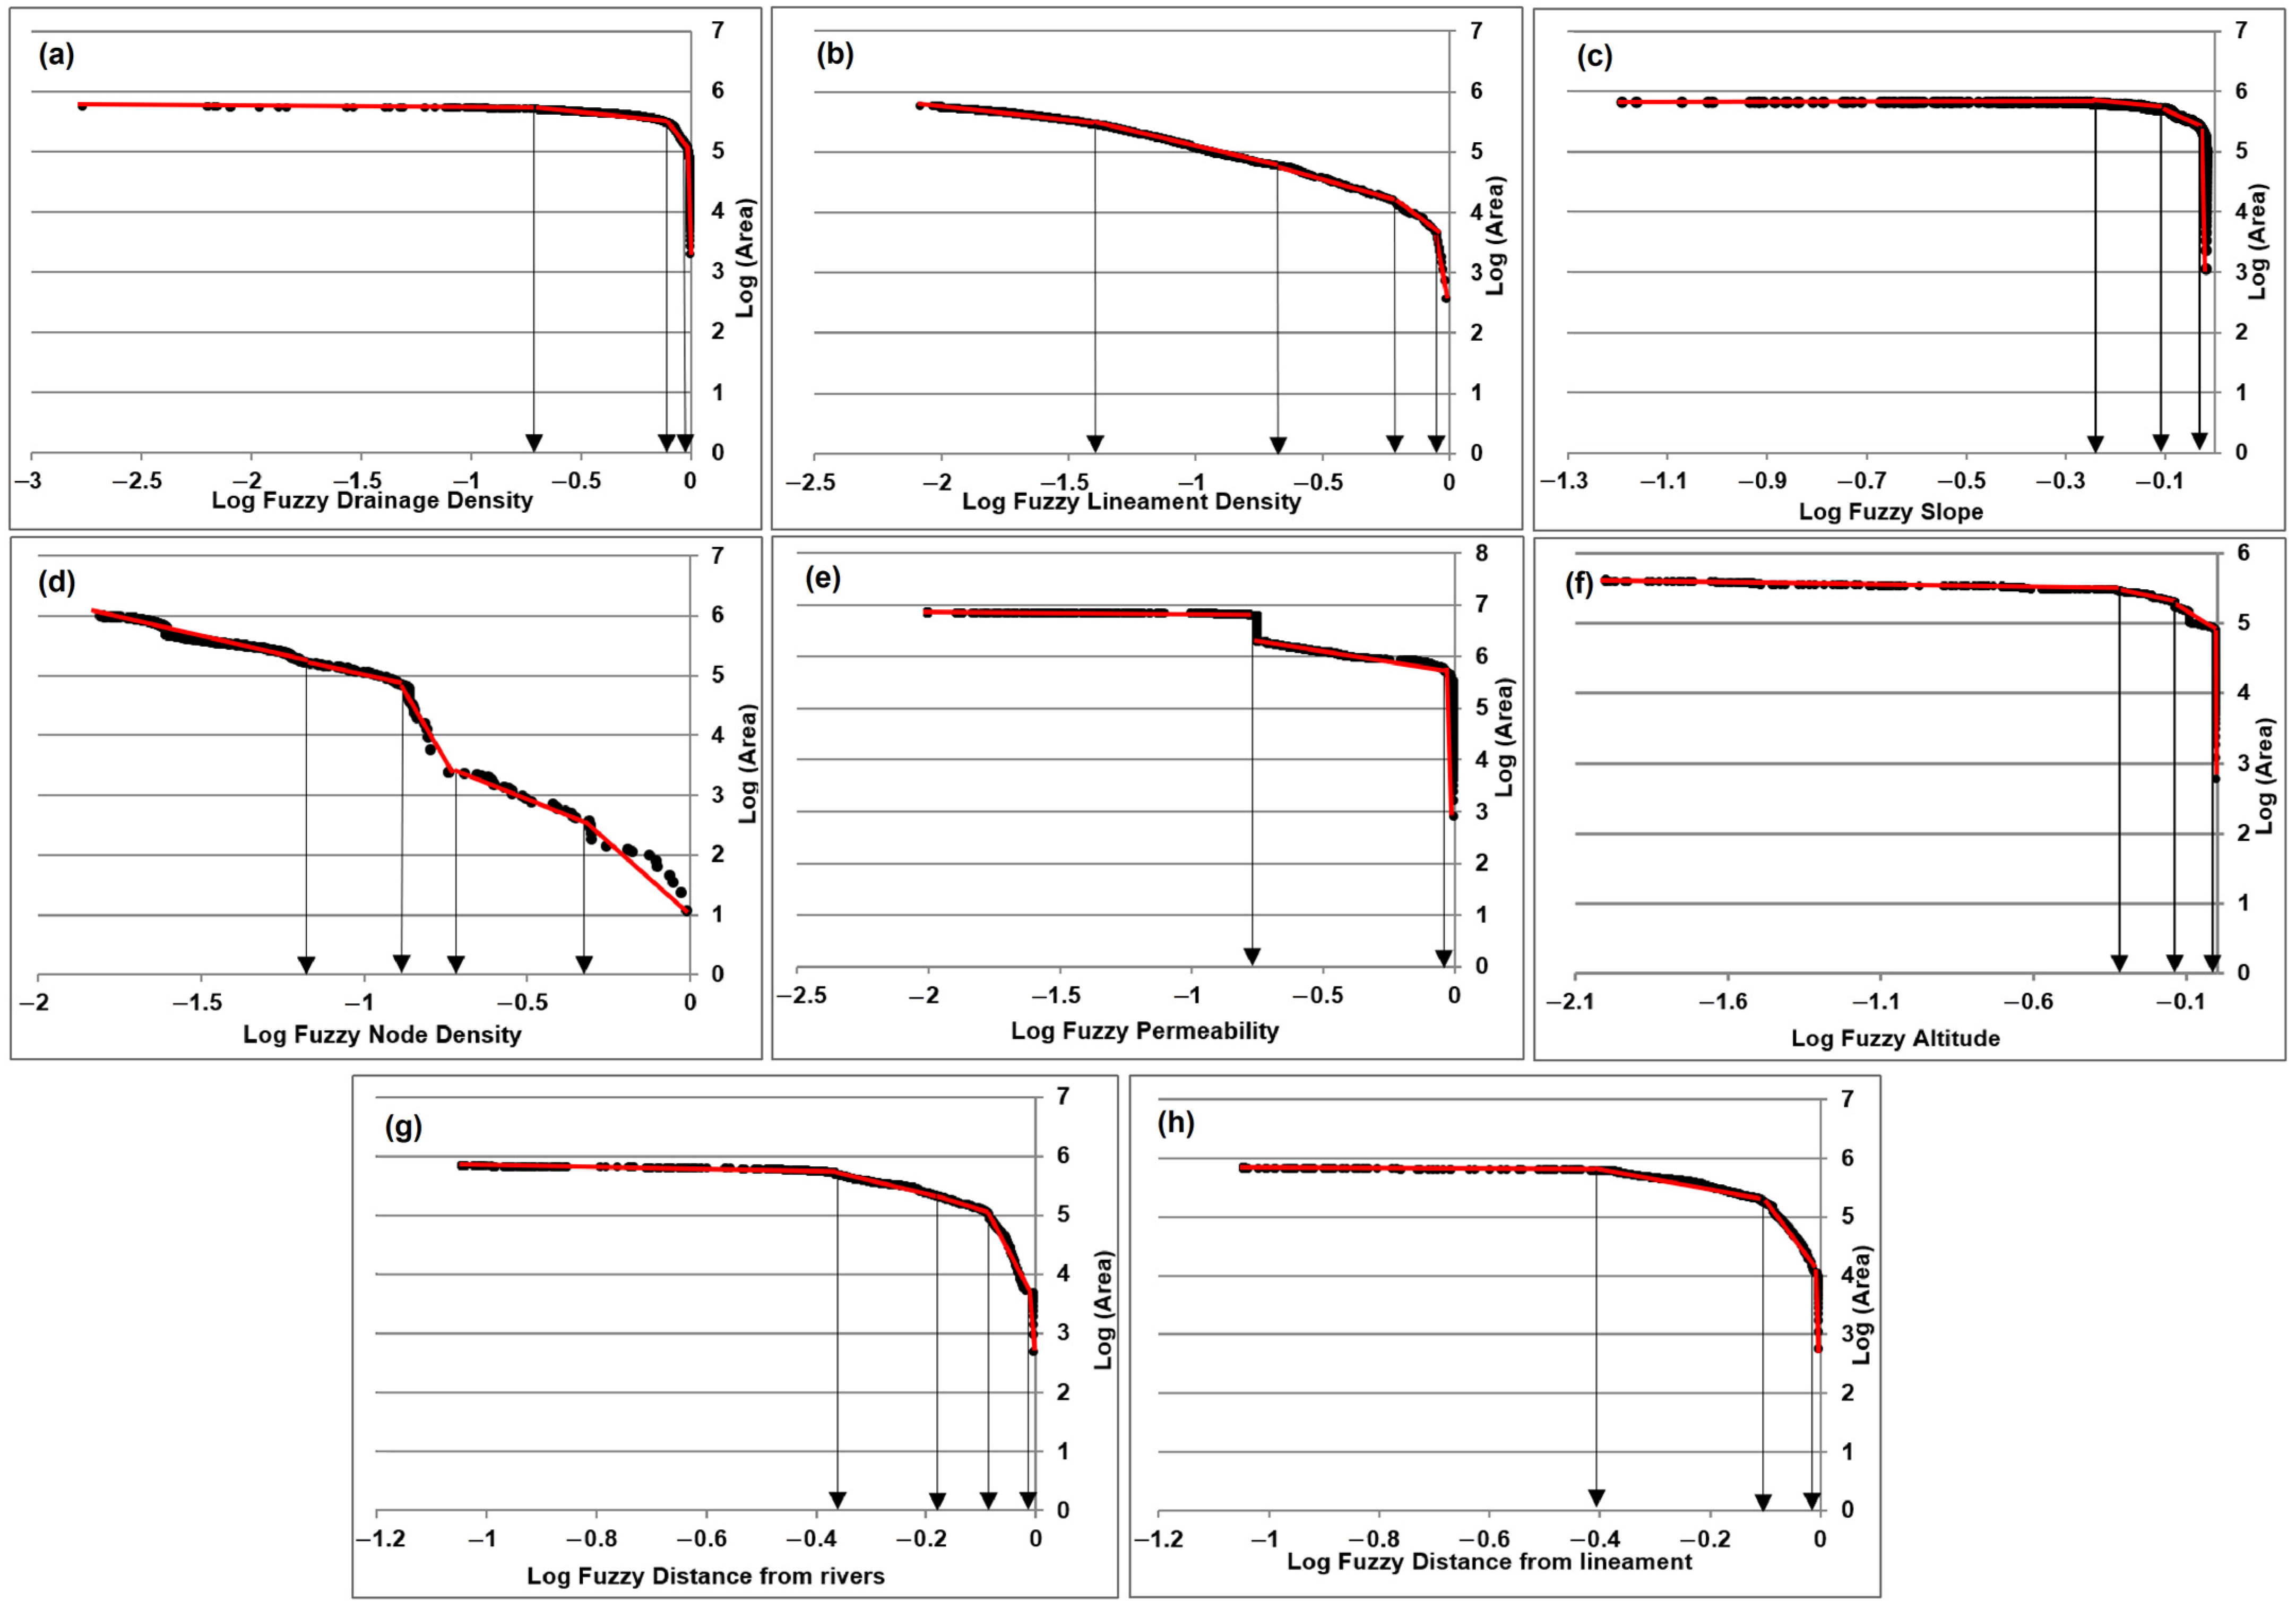
- Select effective and ineffective factors by assigning weights using Concentration-Area (C-A) and Prediction-Area (P-A).
- (5)
- Generate the groundwater potential map by applying the Geometric Average Model (GAM).
- (6)
- Validate the efficiency and predictive ability of the model using 50% of the well locations.
3.1. Datasetsproduction
3.2. Methods Used
3.2.1. Generation of Decision Factors with Logistic Transformation
3.2.2. Identify the Best-Performing Factor
3.2.3. Integration of Transformed Factors
3.2.4. Model Validation
4. Results
4.1. Identification of Decision Factors
4.1.1. Drainage Density
4.1.2. Lineament Density
4.1.3. Slope
4.1.4. Node Density
4.1.5. Permeability
4.1.6. Altitude
4.1.7. Distance from Lineament
4.1.8. Distance from Rivers
4.2. Selecting Factors Influencing GWPA
4.3. Elaboration of Geometric Average Model
4.4. Evaluation of Geometric Average Model
4.5. Validation of the Geometric Average Model
5. Discussion
6. Conclusions
Author Contributions
Funding
Data Availability Statement
Conflicts of Interest
References
- Margat, J.; van der Gun, J. Groundwater around the World; CRC Press/Balkema: Leiden, Netherlands, 2013. [Google Scholar]
- Smith, M.; Cross, K.; Paden, M.; Laban, P. Spring—Managing Groundwater Sustainability; IUCN: Gland, Switzerland, 2016. [Google Scholar]
- Kostyuchenko, Y.; Artemenko, I.; Abioui, M.; Benssaou, M. Global and Regional Climatic Modeling. In Encyclopedia of Mathematical Geosciences; Sagar, B.D., Cheng, Q., McKinley, J., Agterberg, F., Eds.; Springer: Cham, Switzerland, 2022; pp. 1–5. [Google Scholar] [CrossRef]
- Todd, D.K.; Mays, L.W. Groundwater Hydrology; Wiley: New York, NY, USA, 2005. [Google Scholar]
- Rekha, V.B.; Thomas, A.P. Integrated Remote Sensing and GIS for Groundwater Potentially Mapping in Koduvan Àr-Sub-Watershed of Meenachil River Basin, Kottayam District; School of Environmental Sciences, Mahatma Gandhi University: Kerala, India, 2007. [Google Scholar]
- Ozdemir, A. GIS-based groundwater spring potential mapping in the Sultan Mountains (Konya, Turkey) using frequency ratio, weights of evidence and logistic regression methods and their comparison. J. Hydrol. 2011, 411, 290–308. [Google Scholar] [CrossRef]
- Fankhauser, K.; Macharia, D.; Coyle, J.; Kathuni, S.; McNally, A.; Slinski, K.; Thomas, E. Estimating groundwater use and demand in arid Kenya through assimilation of satellite data and in-situ sensors with machine learning toward drought early action. Sci. Total. Environ. 2022, 831, 154453. [Google Scholar] [CrossRef]
- Aissa, R.B.; Boutoutaou, D. Characterization of groundwater in arid zones (case of Ouargla basin). Energy Procedia 2017, 119, 556–564. [Google Scholar] [CrossRef]
- Hssaisoune, M.; Bouchaou, L.; Sifeddine, A.; Bouimetarhan, I.; Chehbouni, A. Moroccan Groundwater Resources and Evolution with Global Climate Changes. Geosciences 2020, 10, 81. [Google Scholar] [CrossRef] [Green Version]
- Golkarian, A.; Rahmati, O. Use of a maximum entropy model to identify the key factors that influence groundwater availability on the Gonabad Plain, Iran. Environ. Earth Sci. 2018, 77, 369. [Google Scholar] [CrossRef]
- Naghibi, S.A.; Ahmadi, K.; Daneshi, A. Application of Support Vector Machine, Random Forest, and Genetic Algorithm Optimized Random Forest Models in Groundwater Potential Mapping. Water Resour. Manag. 2017, 31, 2761–2775. [Google Scholar] [CrossRef]
- Naghibi, S.A.; Pourghasemi, H.R.; Pourtaghi, Z.S.; Rezaei, A. Groundwater qanat potential mapping using frequency ratio and Shannon’s entropy models in the Moghan watershed, Iran. Earth Sci. Inform. 2015, 8, 171–186. [Google Scholar] [CrossRef]
- Rahmati, O.; Naghibi, S.A.; Shahabi, H.; Bui, D.T.; Pradhan, B.; Azareh, A.; Rafiei-Sardooi, E.; Samani, A.N.; Melesse, A.M. Groundwater spring potential modelling: Comprising the capability and robustness of three different modeling approaches. J. Hydrol. 2018, 565, 248–261. [Google Scholar] [CrossRef]
- Aouragh, M.H.; Essahlaoui, A.; El Ouali, A.; El Hmaidi, A.; Kamel, S. Groundwater potential of Middle Atlas plateaus, Morocco, using fuzzy logic approach, GIS and remote sensing. Geomat. Nat. Hazards Risk 2017, 8, 194–206. [Google Scholar] [CrossRef]
- Hamdani, N.; Baali, A. Characterization of groundwater potential zones using analytic hierarchy process and integrated geomatic techniques in Central Middle Atlas (Morocco). Appl. Geomat. 2020, 12, 323–335. [Google Scholar] [CrossRef]
- Echogdali, F.Z.; Boutaleb, S.; Bendarma, A.; Saidi, M.E.; Aadraoui, M.; Abioui, M.; Ouchchen, M.; Abdelrahman, K.; Fnais, M.S.; Sajinkumar, K.S. Application of Analytical Hierarchy Process and Geophysical Method for Groundwater Potential Mapping in the Tata Basin, Morocco. Water 2022, 14, 2393. [Google Scholar] [CrossRef]
- Echogdali, F.Z.; Boutaleb, S.; Kpan, R.B.; Ouchchen, M.; Bendarma, A.; El Ayady, H.; Abdelrahman, K.; Fnais, M.S.; Sajinkumar, K.S.; Abioui, M. Application of Fuzzy Logic and Fractal Modeling Approach for Groundwater Potential Mapping in Semi-Arid Akka Basin, Southeast Morocco. Sustainability 2022, 14, 10205. [Google Scholar] [CrossRef]
- Souissi, D.; Msaddek, M.H.; Zouhri, L.; Chenini, I.; El May, M.; Dlala, M. Mapping groundwater recharge potential zones in arid region using GIS and Landsat approaches, southeast Tunisia. Hydrol. Sci. J. 2018, 63, 251–268. [Google Scholar] [CrossRef]
- Mallick, J.; Khan, R.A.; Ahmed, M.; Alqadhi, S.D.; Alsubih, M.; Falqi, I.; Hasan, M.A. Modeling Groundwater Potential Zone in a Semi-Arid Region of Aseer Using Fuzzy-AHP and Geoinformation Techniques. Water 2019, 11, 2656. [Google Scholar] [CrossRef] [Green Version]
- Machiwal, D.; Jha, M.K.; Mal, B.C. Assessment of Groundwater Potential in a Semi-Arid Region of India Using Remote Sensing, GIS and MCDM Techniques. Water Resour. Manag. 2010, 25, 1359–1386. [Google Scholar] [CrossRef]
- Castillo, J.L.U.; Cruz, D.A.M.; Leal, J.A.R.; Vargas, J.T.; Tapia, S.A.R.; Celestino, A.E.M. Delineation of Groundwater Potential Zones (GWPZs) in a Semi-Arid Basin through Remote Sensing, GIS, and AHP Approaches. Water 2022, 14, 2138. [Google Scholar] [CrossRef]
- Rahmati, O.; Pourghasemi, H.R.; Melesse, A.M. Application of GIS-based data driven random forest and maximum entropy models for groundwater potential mapping: A case study at Mehran Region, Iran. Catena 2016, 137, 360–372. [Google Scholar] [CrossRef]
- Naghibi, S.A.; Vafakhah, M.; Hashemi, H.; Pradhan, B.; Alavi, S.J. Groundwater Augmentation through the Site Selection of Floodwater Spreading Using a Data Mining Approach (Case study: Mashhad Plain, Iran). Water 2018, 10, 1405. [Google Scholar] [CrossRef] [Green Version]
- Rahmati, O.; Melesse, A.M. Application of Dempster–Shafer theory, spatial analysis and remote sensing for groundwater potentiality and nitrate pollution analysis in the semi-arid region of Khuzestan, Iran. Sci. Total. Environ. 2016, 568, 1110–1123. [Google Scholar] [CrossRef]
- Haghizadeh, A.; Moghaddam, D.D.; Pourghasemi, H.R. GIS-based bivariate statistical techniques for groundwater potential analysis (an example of Iran). J. Earth Syst. Sci. 2017, 126, 109. [Google Scholar] [CrossRef] [Green Version]
- Kordestani, M.D.; Naghibi, S.A.; Hashemi, H.; Ahmadi, K.; Kalantar, B.; Pradhan, B. Groundwater potential mapping using a novel data-mining ensemble model. Hydrogeol. J. 2019, 27, 211–224. [Google Scholar] [CrossRef] [Green Version]
- Pourghasemi, H.R.; Beheshtirad, M. Assessment of a data-driven evidential belief function model and GIS for groundwater potential mapping in the Koohrang Watershed, Iran. Geocarto Int. 2014, 30, 662–685. [Google Scholar] [CrossRef]
- Oh, H.-J.; Kim, Y.-S.; Choi, J.-K.; Park, E.; Lee, S. GIS mapping of regional probabilistic groundwater potential in the area of Pohang City, Korea. J. Hydrol. 2011, 399, 158–172. [Google Scholar] [CrossRef]
- Moghaddam, D.D.; Rezaei, M.; Pourghasemi, H.R.; Pourtaghie, Z.S.; Pradhan, B. Groundwater spring potential mapping using bivariate statistical model and GIS in the Taleghan Watershed, Iran. Arab. J. Geosci. 2015, 8, 913–929. [Google Scholar] [CrossRef]
- Ozdemir, A. Using a binary logistic regression method and GIS for evaluating and mapping the groundwater spring potential in the Sultan Mountains (Aksehir, Turkey). J. Hydrol. 2011, 405, 123–136. [Google Scholar] [CrossRef]
- Chen, W.; Li, H.; Hou, E.; Wang, S.; Wang, G.; Panahi, M.; Li, T.; Peng, T.; Guo, C.; Niu, C.; et al. GIS-based groundwater potential analysis using novel ensemble weights-of-evidence with logistic regression and functional tree models. Sci. Total. Environ. 2018, 634, 853–867. [Google Scholar] [CrossRef] [PubMed] [Green Version]
- Razandi, Y.; Pourghasemi, H.R.; Neisani, N.S.; Rahmati, O. Application of analytical hierarchy process, frequency ratio, and certainty factor models for groundwater potential mapping using GIS. Earth Sci. Inform. 2015, 8, 867–883. [Google Scholar] [CrossRef]
- Hou, E.; Wang, J.; Chen, W. A comparative study on groundwater spring potential analysis based on statistical index, index of entropy and certainty factors models. Geocarto Int. 2018, 33, 754–769. [Google Scholar] [CrossRef]
- Corsini, A.; Cervi, F.; Ronchetti, F. Weight of evidence and artificial neural networks for potential groundwater spring mapping: An application to the Mt. Modino area (Northern Apennines, Italy). Geomorphology 2009, 111, 79–87. [Google Scholar] [CrossRef]
- Al Abadi, A.M.A.; Shahid, S. A comparison between index of entropy and catastrophe theory methods for mapping groundwater potential in an arid region. Environ. Monit. Assess. 2015, 187, 1–21. [Google Scholar] [CrossRef] [Green Version]
- Rahmati, O.; Samani, A.N.; Mahdavi, M.; Pourghasemi, H.R.; Zeinivand, H. Groundwater potential mapping at Kurdistan region of Iran using analytic hierarchy process and GIS. Arab. J. Geosci. 2014, 8, 7059–7071. [Google Scholar] [CrossRef]
- Yin, H.; Shi, Y.; Niu, H.; Xie, D.; Wei, J.; Lefticariu, L.; Xu, S. A GIS-based model of potential groundwater yield zonation for a sandstone aquifer in the Juye Coalfield, Shangdong, China. J. Hydrol. 2017, 557, 434–447. [Google Scholar] [CrossRef]
- Moghaddam, D.D.; Rahmati, O.; Haghizadeh, A.; Kalantari, Z. A Modeling Comparison of Groundwater Potential Mapping in a Mountain Bedrock Aquifer: QUEST, GARP, and RF Models. Water 2020, 12, 679. [Google Scholar] [CrossRef] [Green Version]
- Pham, B.T.; Son, L.H.; Hoang, T.-A.; Nguyen, D.-M.; Bui, D.T. Prediction of shear strength of soft soil using machine learning methods. Catena 2018, 166, 181–191. [Google Scholar] [CrossRef]
- Tien Bui, D.; Shahabi, H.; Shirzadi, A.; Chapi, K.; Hoang, N.-D.; Pham, B.T.; Bui, Q.-T.; Tran, C.-T.; Panahi, M.; Bin Ahmad, B.; et al. A Novel Integrated Approach of Relevance Vector Machine Optimized by Imperialist Competitive Algorithm for Spatial Modeling of Shallow Landslides. Remote Sens. 2018, 10, 1538. [Google Scholar] [CrossRef] [Green Version]
- Smith, A.J.; Walker, G.; Turner, J. Aquifer sustainability factor: A review of previous estimates. In International Association of Hydrogeologists (AIH) and the Geological Society of Australia (GSA); CSIRO: Canberra, Australia, 2010; p. EP104589. [Google Scholar]
- Naghibi, S.A.; Pourghasemi, H.R. A Comparative Assessment Between Three Machine Learning Models and Their Performance Comparison by Bivariate and Multivariate Statistical Methods in Groundwater Potential Mapping. Water Resour. Manag. 2015, 29, 5217–5236. [Google Scholar] [CrossRef]
- Zabihi, M.; Pourghasemi, H.R.; Pourtaghi, Z.S.; Behzadfar, M. GIS-based multivariate adaptive regression spline and random forest models for groundwater potential mapping in Iran. Environ. Earth Sci. 2016, 75, 1–19. [Google Scholar] [CrossRef]
- Chen, W.; Zhao, X.; Tsangaratos, P.; Shahabi, H.; Ilia, I.; Xue, W.; Wang, X.; Bin Ahmad, B. Evaluating the usage of tree-based ensemble methods in groundwater spring potential mapping. J. Hydrol. 2020, 583, 124602. [Google Scholar] [CrossRef]
- Lee, S.; Hong, S.-M.; Jung, H.-S. GIS-based groundwater potential mapping using artificial neural network and support vector machine models: The case of Boryeong city in Korea. Geocarto Int. 2018, 33, 847–861. [Google Scholar] [CrossRef]
- Naghibi, S.A.; Moghaddam, D.D.; Kalantar, B.; Pradhan, B.; Kisi, O. A comparative assessment of GIS-based data mining models and a novel ensemble model in groundwater well potential mapping. J. Hydrol. 2017, 548, 471–483. [Google Scholar] [CrossRef]
- Yousefi, M.; Carranza, E.J.M. Geometric average of spatial evidence data layers: A GIS-based multi-criteria decision-making approach to mineral prospectivity mapping. Comput. Geosci. 2015, 83, 72–79. [Google Scholar] [CrossRef]
- Yousefi, M.; Nykänen, V. Data-driven logistic-based weighting of geochemical and geological evidence layers in mineral prospectivity mapping. J. Geochem. Explor. 2016, 164, 94–106. [Google Scholar] [CrossRef]
- Echogdali, F.Z.; Boutaleb, S.; Abia, E.H.; Ouchchen, M.; Dadi, B.; Id-Belqas, M.; Abioui, M.; Pham, L.T.; Abu-Alam, T.; Mickus, K.L. Mineral prospectivity mapping: A potential technique for sustainable mineral exploration and mining activities—A case study using the copper deposits of the Tagmout basin, Morocco. Geocarto Int. 2021, 1–22. [Google Scholar] [CrossRef]
- Afzal, P.; Mirzaei, M.; Yousefi, M.; Adib, A.; Khalajmasoumi, M.; Zarifi, A.Z.; Foster, P.; Yasrebi, A.B. Delineation of geochemical anomalies based on stream sediment data utilizing fractal modeling and staged factor analysis. J. Afr. Earth Sci. 2016, 119, 139–149. [Google Scholar] [CrossRef]
- Choubert, G. Histoire géologique du précambrien de l’Anti–Atlas. Notes Mem. Serv. Geol. Maroc. 1963, 162, 352. [Google Scholar]
- Soulaimani, A.; Burkhard, M. The Anti-Atlas chain (Morocco): The southern margin of the Variscan belt along the edge of the West African craton. Geol. Soc. Lond. Spec. Publ. 2008, 297, 433–452. [Google Scholar] [CrossRef]
- Benssaou, M.; Hamoumi, N. The western Anti-Atlas of Morocco: Sedimentological and palæogeographical formation studies in the Early Cambrian. J. Afr. Earth Sci. 2001, 32, 351–372. [Google Scholar] [CrossRef]
- Benssaou, M.; Hamoumi, N. Le graben de l’Anti-Atlas occidental (Maroc): Contrôle tectonique de la paléogéographie et des séquences au Cambrien inférieur. C. R. Geosci. 2003, 335, 297–305. [Google Scholar] [CrossRef]
- Echogdali, F.Z.; Boutaleb, S.; Jauregui, J.; Elmouden, A. Cartography of Flooding Hazard in Semi-Arid Climate: The Case of Tata Valley (South-East of Morocco). J. Geogr. Nat. Disasters 2018, 8, 1–11. [Google Scholar] [CrossRef]
- Ouchchen, M.; Boutaleb, S.; Abia, E.H.; El Azzab, D.; Abioui, M.; Mickus, K.L.; Miftah, A.; Echogdali, F.Z.; Dadi, B. Structural interpretation of the Igherm region (Western Anti Atlas, Morocco) from an aeromagnetic analysis: Implications for copper exploration. J. Afr. Earth Sci. 2021, 176, 104140. [Google Scholar] [CrossRef]
- Echogdali, F.Z.; Boutaleb, S.; Taia, S.; Ouchchen, M.; Id-Belqas, M.; Kpan, R.B.; Abioui, M.; Aswathi, J.; Sajinkumar, K.S. Assessment of soil erosion risk in a semi-arid climate watershed using SWAT model: Case of Tata basin, South-East of Morocco. Appl. Water Sci. 2022, 12, 1–15. [Google Scholar] [CrossRef]
- Choubert, G. L’accident majeur de l’Anti–Atlas. C. R. Acad. Sci. Paris 1947, 224, 1172–1173. [Google Scholar]
- Thomas, R.; Chevallier, L.; Gresse, P.; Harmer, R.; Eglington, B.; Armstrong, R.; de Beer, C.; Martini, J.; de Kock, G.; Macey, P.; et al. Precambrian evolution of the Sirwa Window, Anti-Atlas Orogen, Morocco. Precambrian Res. 2002, 118, 1–57. [Google Scholar] [CrossRef]
- Pham, B.T.; Jaafari, A.; Prakash, I.; Singh, S.K.; Quoc, N.K.; Bui, D.T. Hybrid computational intelligence models for groundwater potential mapping. Catena 2019, 182, 104101. [Google Scholar] [CrossRef]
- Benjmel, K.; Amraoui, F.; Boutaleb, S.; Ouchchen, M.; Tahiri, A.; Touab, A. Mapping of Groundwater Potential Zones in Crystalline Terrain Using Remote Sensing, GIS Techniques, and Multicriteria Data Analysis (Case of the Ighrem Region, Western Anti-Atlas, Morocco). Water 2020, 12, 471. [Google Scholar] [CrossRef] [Green Version]
- Bhattacharya, S.; Das, S.; Das, S.; Kalashetty, M.; Warghat, S.R. An integrated approach for mapping groundwater potential applying geospatial and MIF techniques in the semiarid region. Environ. Dev. Sustain. 2020, 23, 495–510. [Google Scholar] [CrossRef]
- Micheli-Tzanakou, E. Supervised and Unsupervised Pattern Recognition; CRC Press: Boca Raton, FL, USA, 1999. [Google Scholar]
- Berthold, M.; Hand, D.J. Intelligent Data Analysis: An Introduction; Springer: Berlin, Germany, 2003. [Google Scholar]
- Bishop, C.M. Pattern Recognition and Machine Learning; Weller: New York, NY, USA, 2006. [Google Scholar]
- Yousefi, M.; Kamkar-Rouhani, A.; Carranza, E.J.M. Application of staged factor analysis and logistic function to create a fuzzy stream sediment geochemical evidence layer for mineral prospectivity mapping. Geochem. Explor. Environ. Anal. 2014, 14, 45–58. [Google Scholar] [CrossRef]
- Yousefi, M.; Carranza, E.J.M. Prediction–area (P–A) plot and C–A fractal analysis to classify and evaluate evidential maps for mineral prospectivity modeling. Comput. Geosci. 2015, 79, 69–81. [Google Scholar] [CrossRef]
- Porwal, A.; Carranza, E.J.M.; Hale, M. A Hybrid Neuro-Fuzzy Model for Mineral Potential Mapping. J. Int. Assoc. Math. Geol. 2004, 36, 803–826. [Google Scholar] [CrossRef]
- Porwal, A.; Carranza, E.J.M.; Hale, M. A Hybrid Fuzzy Weights-of-Evidence Model for Mineral Potential Mapping. Nat. Resour. Res. 2006, 15, 1–14. [Google Scholar] [CrossRef]
- Mihalasky, M.J.; Bonham-Carter, G.F. Lithodiversity and Its Spatial Association with Metallic Mineral Sites, Great Basin of Nevada. Nat. Resour. Res. 2001, 10, 209–226. [Google Scholar] [CrossRef]
- Daya, A.A. Comparative study of C–A, C–P, and N–S fractal methods for separating geochemical anomalies from background: A case study of Kamoshgaran region, northwest of Iran. J. Geochem. Explor. 2015, 150, 52–63. [Google Scholar] [CrossRef]
- Heidari, S.M.; Afzal, P.; Ghaderi, M.; Sadeghi, B. Detection of mineralization stages using zonality and multifractal modeling based on geological and geochemical data in the Au-(Cu) intrusion-related Gouzal-Bolagh deposit, NW Iran. Ore Geol. Rev. 2021, 139, 104561. [Google Scholar] [CrossRef]
- Afzal, P.; Alghalandis, Y.F.; Khakzad, A.; Moarefvand, P.; Omran, N.R. Delineation of mineralization zones in porphyry Cu deposits by fractal concentration–volume modeling. J. Geochem. Explor. 2011, 108, 220–232. [Google Scholar] [CrossRef]
- Mandelbrot, B.B. The Fractal Geometry of Nature; Freeman: San Francisco, CA, USA, 1983. [Google Scholar]
- Zissimos, A.M.; Cohen, D.R.; Christoforou, I.C.; Sadeghi, B.; Rutherford, N.F. Controls on soil geochemistry fractal characteristics in Lemesos (Limassol), Cyprus. J. Geochem. Explor. 2021, 220, 106682. [Google Scholar] [CrossRef]
- Li, C.; Ma, T.; Shi, J. Application of a fractal method relating concentrations and distances for separation of geochemical anomalies from background. J. Geochem. Explor. 2003, 77, 167–175. [Google Scholar] [CrossRef]
- Zuo, R.; Cheng, Q. Mapping singularities—A technique to identify potential Cu mineral deposits using sediment geochemical data, an example for Tibet, west China. Miner. Mag. 2008, 72, 531–534. [Google Scholar] [CrossRef]
- Zuo, R. Decomposing of mixed pattern of arsenic using fractal model in Gangdese belt, Tibet, China. Appl. Geochem. 2011, 26, S271–S273. [Google Scholar] [CrossRef]
- Cheng, Q.; Agterberg, F.; Ballantyne, S. The separation of geochemical anomalies from background by fractal methods. J. Geochem. Explor. 1994, 51, 109–130. [Google Scholar] [CrossRef]
- Asl, R.A.; Afzal, P.; Adib, A.; Yasrebi, A.B. Application of multifractal modeling for the identification of alteration zones and major faults based on ETM+ multispectral data. Arab. J. Geosci. 2015, 8, 2997–3006. [Google Scholar] [CrossRef]
- A Gonçalves, M.; Mateus, A.; Oliveira, V. Geochemical anomaly separation by multifractal modelling. J. Geochem. Explor. 2001, 72, 91–114. [Google Scholar] [CrossRef]
- Cheng, Q.; Li, Q. A fractal concentration–area method for assigning a color palette for image representation. Comput. Geosci. 2002, 28, 567–575. [Google Scholar] [CrossRef]
- Yousefi, M.; Carranza, E.J.M. Fuzzification of continuous-value spatial evidence for mineral prospectivity mapping. Comput. Geosci. 2015, 74, 97–109. [Google Scholar] [CrossRef]
- Zuo, R.; Wang, J. Arc Fractal: An ArcGIS Add-In for Processing Geoscience Data Using Fractal/Multifractal Models. Nat. Resour. Res. 2020, 29, 3–12. [Google Scholar] [CrossRef]
- Nazarpour, A.; Omran, N.R.; Paydar, G.R.; Sadeghi, B.; Matroud, F.; Nejad, A.M. Application of classical statistics, log ratio transformation and multifractal approaches to delineate geochemical anomalies in the Zarshuran gold district, NW Iran. Geochemistry 2015, 75, 117–132. [Google Scholar] [CrossRef]
- Ouchchen, M.; Boutaleb, S.; Abia, E.; El Azzab, D.; Miftah, A.; Dadi, B.; Echogdali, F.; Mamouch, Y.; Pradhan, B.; Santosh, M.; et al. Exploration targeting of copper deposits using staged factor analysis, geochemical mineralization prospectivity index, and fractal model (Western Anti-Atlas, Morocco). Ore Geol. Rev. 2022, 143, 104762. [Google Scholar] [CrossRef]
- Wang, Y.M.; Chin, K.-S.; Yang, J.B. Measuring the performances of decision-making units using geometric average efficiency. J. Oper. Res. Soc. 2007, 58, 929–937. [Google Scholar] [CrossRef]
- Wei, G. Some Arithmetic Aggregation Operators with Intuitionistic Trapezoidal Fuzzy Numbers and Their Application to Group Decision Making. J. Comput. 2010, 5, 345–351. [Google Scholar] [CrossRef]
- Tothill, P. Limitations of the use of the geometric mean to obtain depth independence in scanning and whole body counting. Phys. Med. Biol. 1974, 19, 382–385. [Google Scholar] [CrossRef]
- Chung, C.-J.F.; Fabbri, A.G. Validation of Spatial Prediction Models for Landslide Hazard Mapping. Nat. Hazards 2003, 30, 451–472. [Google Scholar] [CrossRef]
- Magesh, N.S.; Chandrasekar, N.; Soundranayagam, J.P. Delineation of groundwater potential zones in Theni district, Tamil Nadu, using remote sensing, GIS and MIF techniques. Geosci. Front. 2012, 3, 189–196. [Google Scholar] [CrossRef]
- Arnous, M.O.; Sultan, Y.M. Geospatial technology and structural analysis for geological mapping and tectonic evolution of Feiran–Solaf metamorphic complex, South Sinai, Egypt. Arab. J. Geosci. 2014, 7, 3023–3049. [Google Scholar] [CrossRef]
- Arnous, M.O. Groundwater potentiality mapping of hard-rock terrain in arid regions using geospatial modelling: Example from Wadi Feiran basin, South Sinai, Egypt. Hydrogeol. J. 2016, 24, 1375–1392. [Google Scholar] [CrossRef]
- Jasrotia, A.S.; Bhagat, B.D.; Kumar, A.; Kumar, R. Remote Sensing and GIS Approach for Delineation of Groundwater Potential and Groundwater Quality Zones of Western Doon Valley, Uttarakhand, India. J. Indian Soc. Remote. Sens. 2013, 41, 365–377. [Google Scholar] [CrossRef]
- Haris, K.; Efstratiadis, S.; Maglaveras, N.; Katsaggelos, A. Hybrid image segmentation using watersheds and fast region merging. IEEE Trans. Image Process. 1998, 7, 1684–1699. [Google Scholar] [CrossRef] [Green Version]
- Boutaleb, S.; Boualoul, M.; Oudra, M.; Bouchaou, L.; Dindane, K. Apports du traitement d’image et de la géophysique à l’étude des ressources en eau en milieu fissuré: Cas de l’Anti–Atlas marocain. Afr. Geosci. Rev. 2008, 15, 129–141. [Google Scholar]
- Boutaleb, S.; Boualoul, M.; Bouchaou, L.; Oudra, M. Application of remote-sensing and surface geophysics for groundwater prospecting in a hard rock terrain, Morocco. In Applied Groundwater Studies in Africa; CRC Press: London, UK, 2008; pp. 215–230. [Google Scholar] [CrossRef]
- Boutaleb, S.; El Hammichi, F.; Tabyaoui, H.; Bouchaou, L.; Dindane, K. Détermination des écoulements préférentiels en zone karstique (Tafrata, Maroc), Apport des données satellitaires SAR ERS-1 et Landsat ETM+ et de la prospection géophysique. Rev. Sci. Eau 2009, 22, 407–419. [Google Scholar] [CrossRef] [Green Version]
- Hssaisoune, M.; Boutaleb, S.; Bouchaou, L.; Benssaou, M.; Tagma, T. Use of remote sensing and electrical resistivity tomography to determine Tidsi spring recharge and underground drainage. Eur. Water 2017, 57, 429–434. [Google Scholar]
- Rahman, M.A.; Rusteberg, B.; Gogu, R.; Ferreira, J.L.; Sauter, M. A new spatial multi-criteria decision support tool for site selection for implementation of managed aquifer recharge. J. Environ. Manag. 2012, 99, 61–75. [Google Scholar] [CrossRef]
- Naghibi, S.A.; Pourghasemi, H.R.; Dixon, B. GIS-based groundwater potential mapping using boosted regression tree, classification and regression tree, and random forest machine learning models in Iran. Environ. Monit. Assess. 2016, 188, 1–27. [Google Scholar] [CrossRef]
- Acharya, T. Study of Groundwater Prospects of the Crystalline Rocks in Purulia District, West Bengal, India Using Remote Sensing Data. Earth Resour. 2013, 1, 54. [Google Scholar] [CrossRef]
- Saranya, T.; Saravanan, S. Groundwater potential zone mapping using analytical hierarchy process (AHP) and GIS for Kancheepuram District, Tamilnadu, India. Model. Earth Syst. Environ. 2020, 6, 1105–1122. [Google Scholar] [CrossRef]
- Patra, S.; Mishra, P.; Mahapatra, S.C. Delineation of groundwater potential zone for sustainable development: A case study from Ganga Alluvial Plain covering Hooghly district of India using remote sensing, geographic information system and analytic hierarchy process. J. Clean. Prod. 2018, 172, 2485–2502. [Google Scholar] [CrossRef]
- Ganapuram, S.; Kumar, G.V.; Krishna, I.M.; Kahya, E.; Demirel, M.C. Mapping of groundwater potential zones in the Musi basin using remote sensing data and GIS. Adv. Eng. Softw. 2009, 40, 506–518. [Google Scholar] [CrossRef]
- Solomon, S.; Quiel, F. Groundwater study using remote sensing and geographic information systems (GIS) in the central highlands of Eritrea. Hydrogeol. J. 2006, 14, 1029–1041. [Google Scholar] [CrossRef] [Green Version]
- Aswathi, J.; Sajinkumar, K.S.; Rajaneesh, A.; Oommen, T.; Bouali, E.H.; Kumar, R.B.B.; Rani, V.R.; Thomas, J.; Thrivikramji, K.P.; Ajin, R.S.; et al. Furthering the precision of RUSLE soil erosion with PSInSAR data: An innovative model. Geocarto Int. 2022, 1–24. [Google Scholar] [CrossRef]
- Caine, J.S.; Evans, J.P.; Craig, B.F. Fault zone architecture and permeability structure. Geology 1996, 24, 1025–1028. [Google Scholar] [CrossRef]
- Faulkner, D.; Jackson, C.; Lunn, R.; Schlische, R.; Shipton, Z.; Wibberley, C.; Withjack, M. A review of recent developments concerning the structure, mechanics and fluid flow properties of fault zones. J. Struct. Geol. 2010, 32, 1557–1575. [Google Scholar] [CrossRef]
- Goldscheider, N.; Neukum, C. Fold and fault control on the drainage pattern of a double-karst-aquifer system, Winterstaude, Austrian Alps. Acta Carsologica 2010, 39, 173–186. [Google Scholar] [CrossRef]
- Evans, J.P.; Forster, C.B.; Goddard, J.V. Permeability of fault-related rocks, and implications for hydraulic structure of fault zones. J. Struct. Geol. 1997, 19, 1393–1404. [Google Scholar] [CrossRef]
- Medici, G.; Smeraglia, L.; Torabi, A.; Botter, C. Review of Modeling Approaches to Groundwater Flow in Deformed Carbonate Aquifers. Groundwater 2020, 59, 334–351. [Google Scholar] [CrossRef] [PubMed]
- Jothibasu, A.; Anbazhagan, S. Modeling groundwater probability index in Ponnaiyar River basin of South India using analytic hierarchy process. Model. Earth Syst. Environ. 2016, 2, 1–14. [Google Scholar] [CrossRef]
- Kumar, V.A.; Mondal, N.C.; Ahmed, S. Identification of Groundwater Potential Zones Using RS, GIS and AHP Techniques: A Case Study in a Part of Deccan Volcanic Province (DVP), Maharashtra, India. J. Indian Soc. Remote. Sens. 2020, 48, 497–511. [Google Scholar] [CrossRef]
- Mohammadzadeh, A.; Zoej, M.J.V.; Tavakoli, A. Automatic main road extraction from high resolution satellite imageries by means of particle swarm optimization applied to a fuzzy-based mean calculation approach. J. Indian Soc. Remote. Sens. 2009, 37, 173–184. [Google Scholar] [CrossRef]
- Benjmel, K.; Amraoui, F.; Aydda, A.; Tahiri, A.; Yousif, M.; Pradhan, B.; Abdelrahman, K.; Fnais, M.S.; Abioui, M. A Multidisciplinary Approach for Groundwater Potential Mapping in a Fractured Semi-Arid Terrain (Kerdous Inlier, Western Anti-Atlas, Morocco). Water 2022, 14, 1553. [Google Scholar] [CrossRef]

| Category | Factor | Data Type | Scale | Source |
|---|---|---|---|---|
| Topographical | Slope | Raster | 30 m × 30 m | DEM (http://earthexplorer.usgs.gov/ (accessed on 23 September 2014)) |
| Altitude | Raster | 30 m × 30 m | DEM (http://earthexplorer.usgs.gov/ (accessed on 23 September 2014)) | |
| Hydrological | Distance from rivers | Raster | 30 m× 30 m | DEM (http://earthexplorer.usgs.gov/ (accessed on 23 September 2014)) |
| Drainage density | Raster | 30 m× 30 m | DEM (http://earthexplorer.usgs.gov/ (accessed on 23 September 2014)) | |
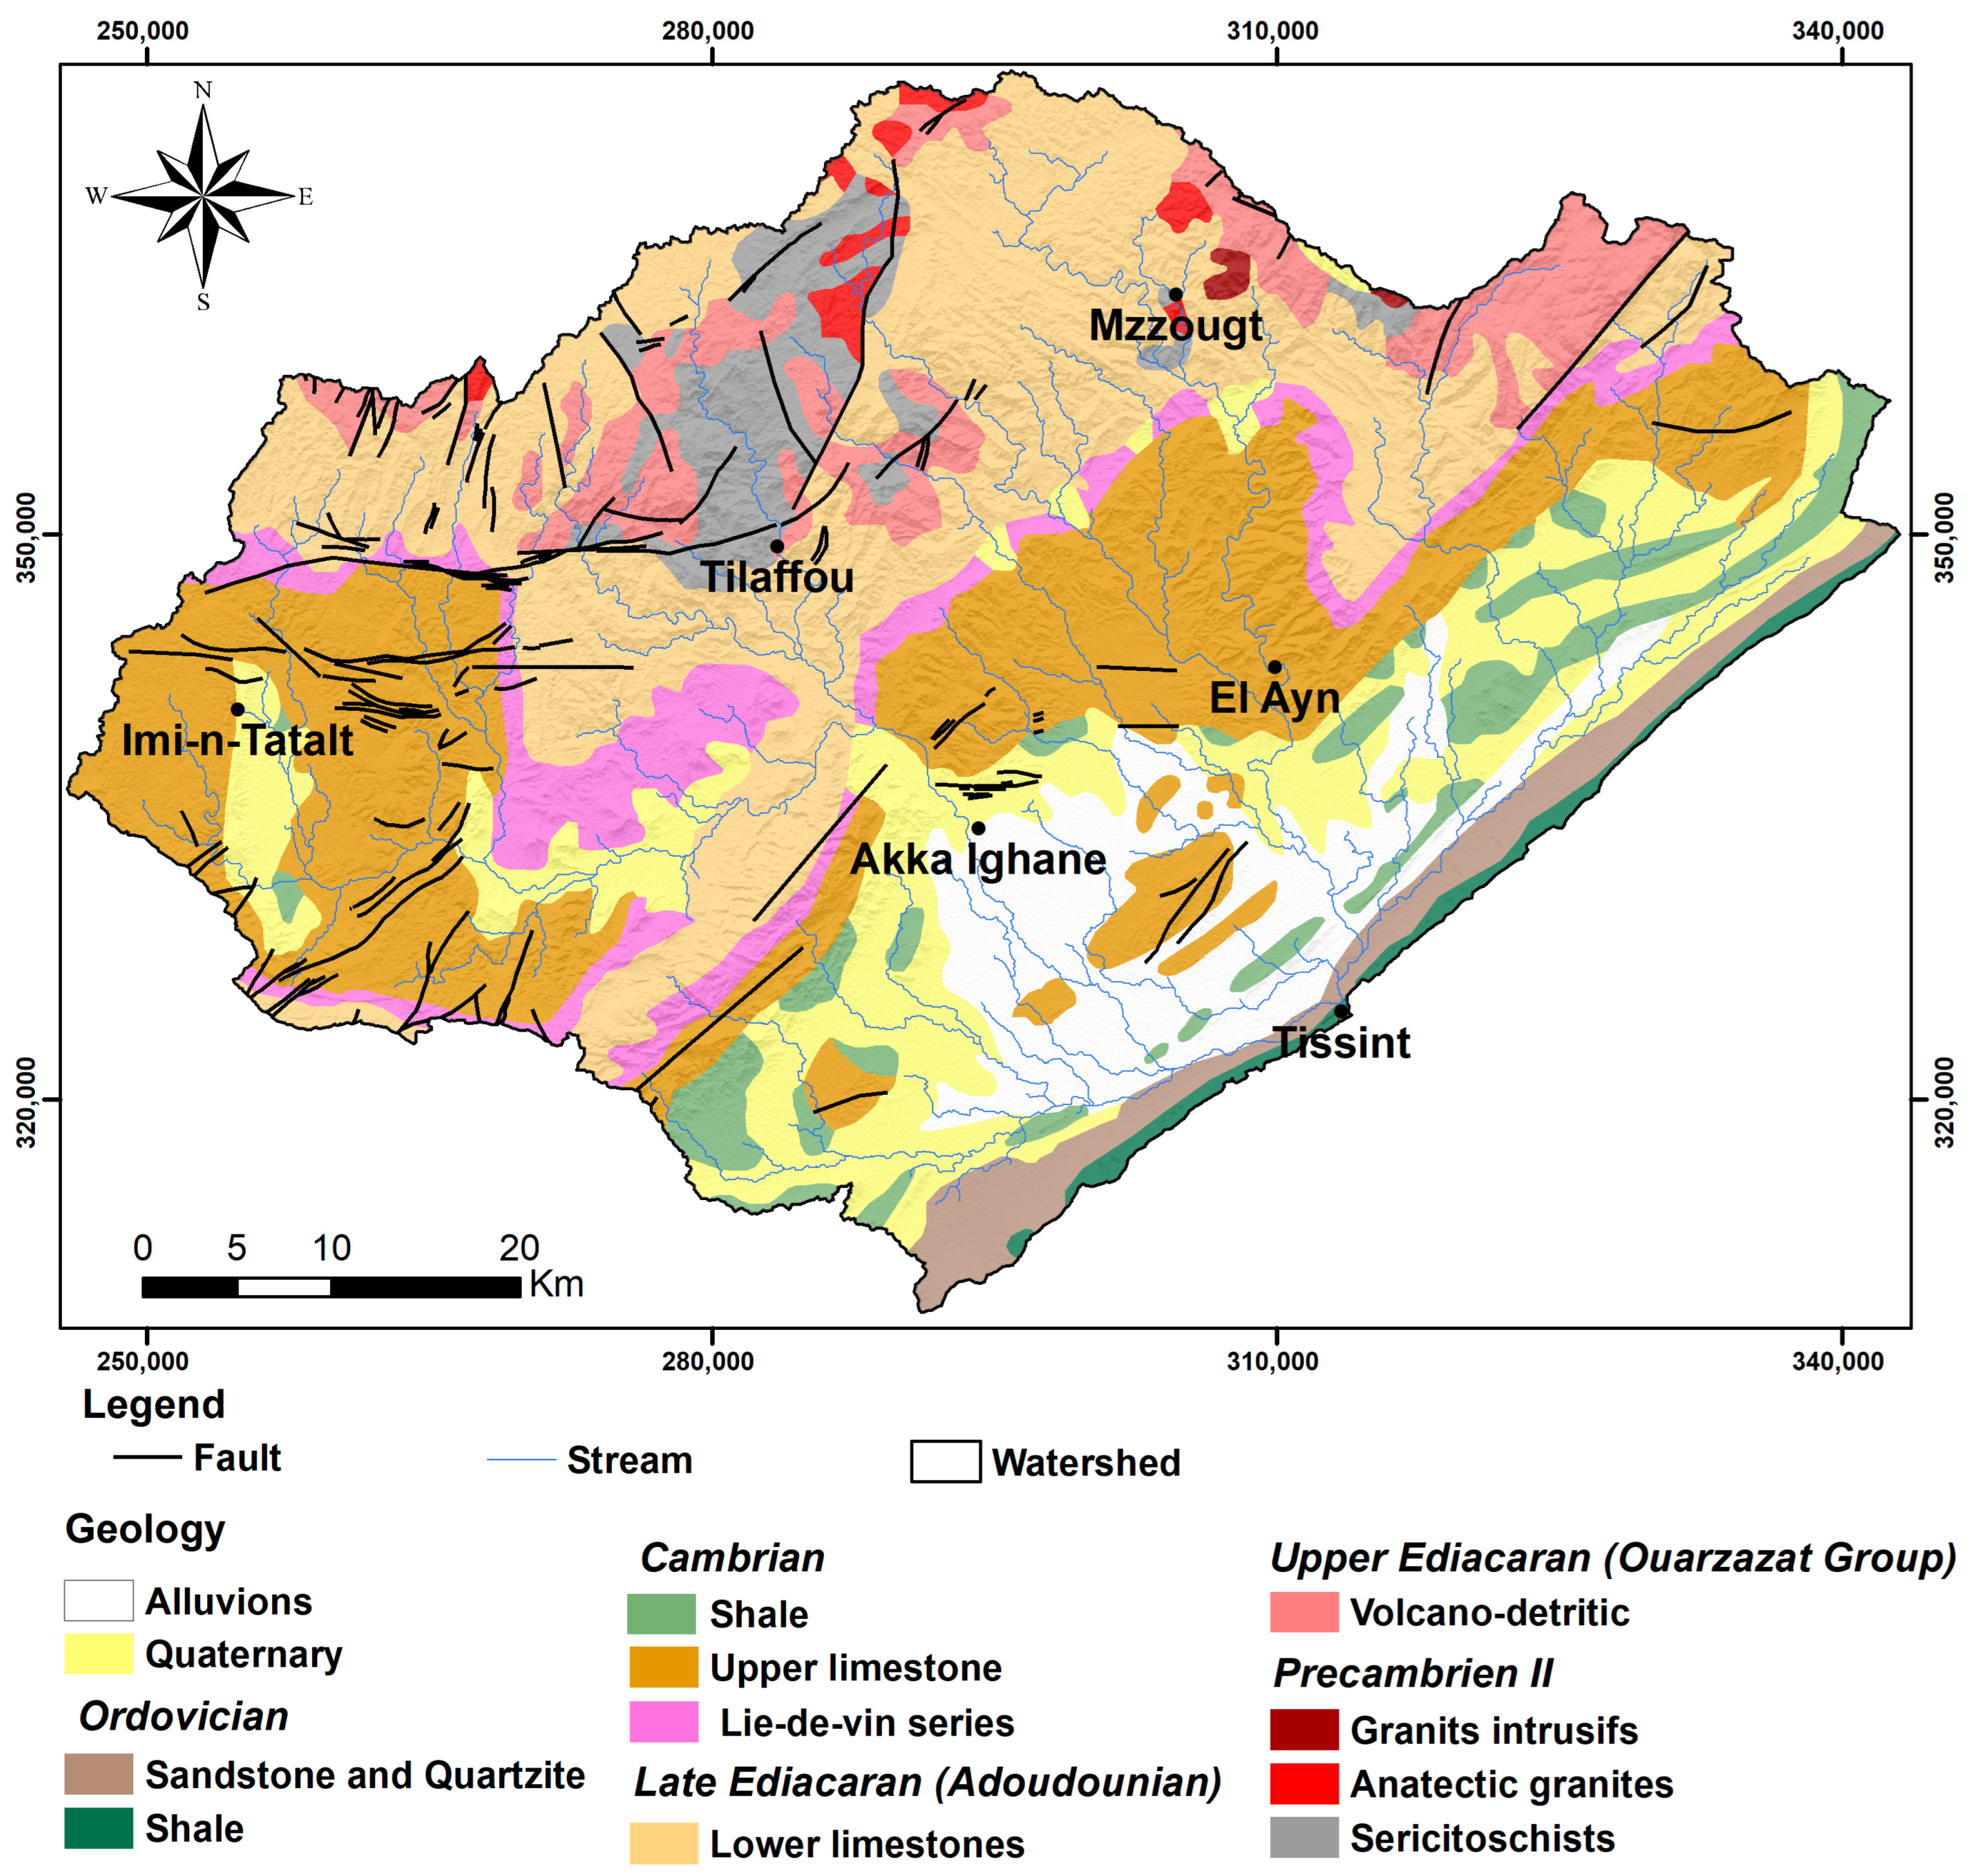
| Geological | Permeability | Raster | 1:1,000,000 | Geological map of Morocco (Ministry of Energy and Mines of Morocco) |
| Lineament density | Raster | 30 m× 30 m | Landsat 8 OLI (http://earthexplorer.usgs.gov/ (accessed on 30 December 2021)) | |
| Node density | Raster | 30 m× 30 m | Landsat 8 OLI (http://earthexplorer.usgs.gov/ (accessed on 30 December 2021)) | |
| Distance from lineament | Raster | 30 m× 30 m | Landsat 8 OLI (http://earthexplorer.usgs.gov/ (accessed on 30 December 2021)) | |
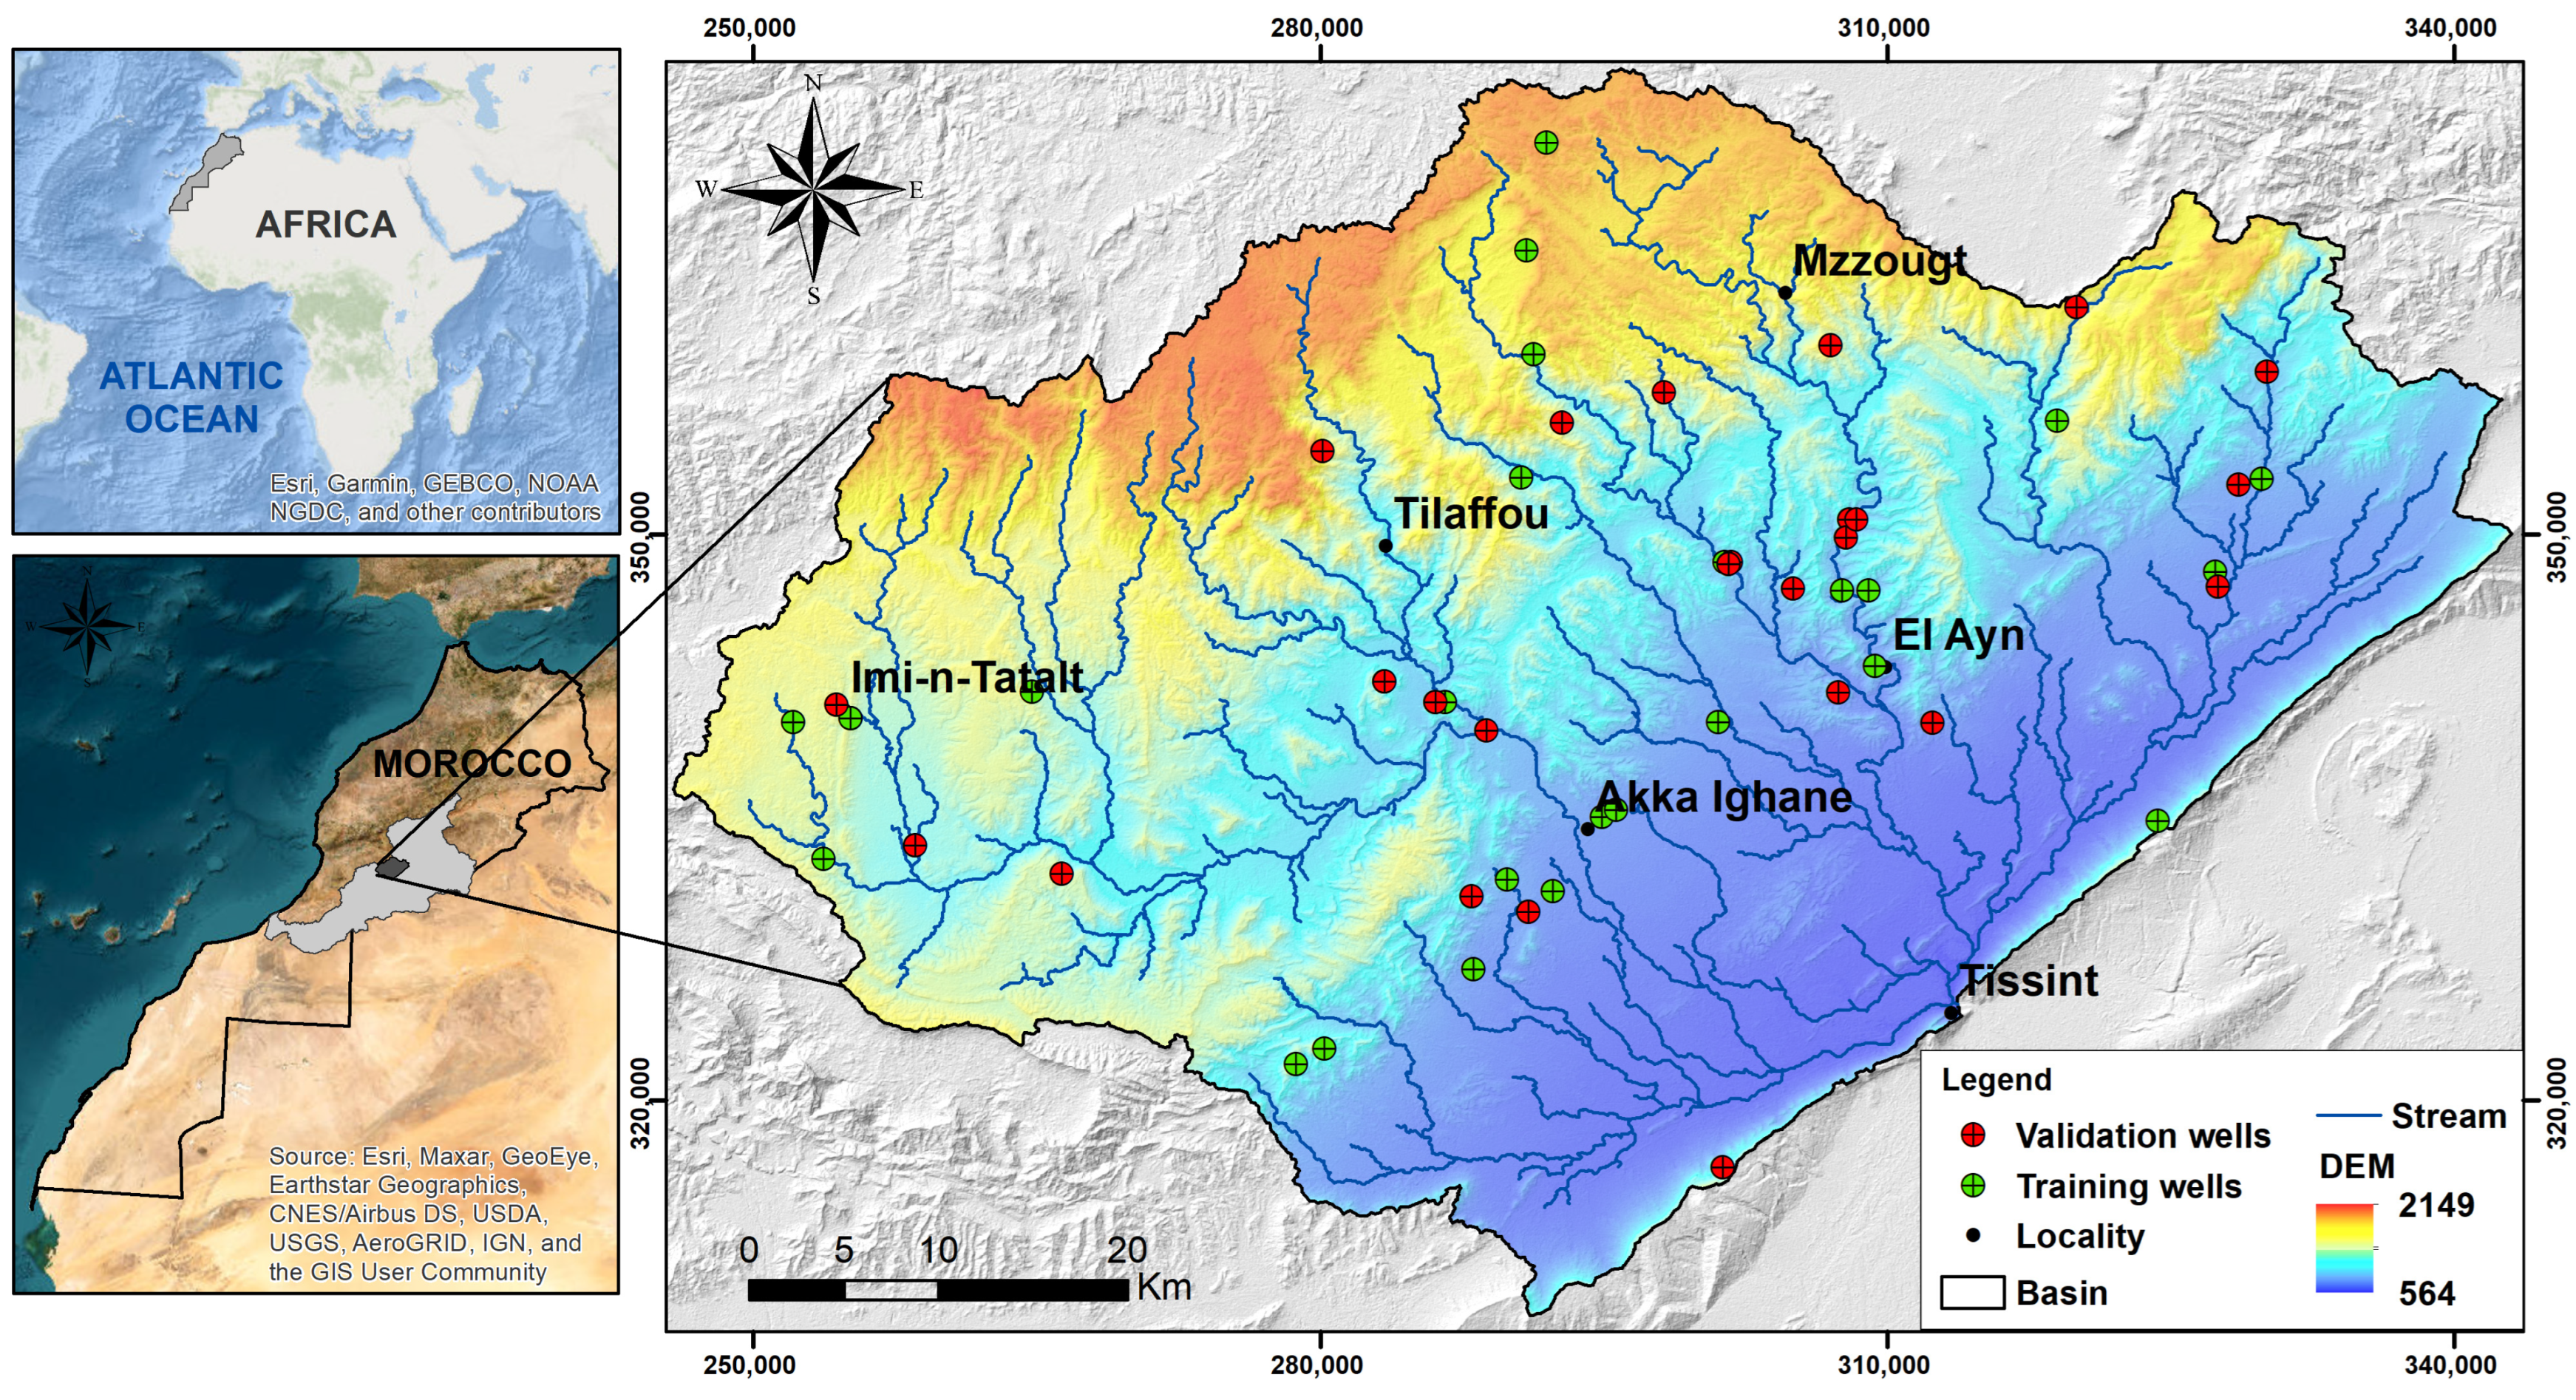
| Groundwater Point | Well | Vector | - | The Souss Massa Hydraulic Basin Agency (Agadir, Morocco) |
| Evidential Map | Prediction Rate (Pr) (%) | Occupied Area (Oa) (%) | Normalized Density (Nd) | Weight (We) |
|---|---|---|---|---|
| Permeability | 59 | 41 | 1.44 | 0.36 |
| Altitude | 59 | 41 | 1.44 | 0.36 |
| Slope | 57 | 43 | 1.33 | 0.28 |
| Distance from lineament | 56 | 44 | 1.27 | 0.24 |
| Distance from rivers | 54 | 46 | 1.17 | 0.16 |
| Lineament density | 52 | 48 | 1.08 | 0.08 |
| Node density | 51 | 49 | 1.04 | 0.04 |
| Drainage density | 45 | 55 | 0.82 | −0.20 |
| Class | Geometric Average Model (GA GWPA) | |||
|---|---|---|---|---|
| Area (km2) | Area % | Number of Wells | Wells % | |
| Very high | 172.76 | 4.82 | 1 | 3.85 |
| High | 395.07 | 10.99 | 6 | 23.08 |
| Moderate | 767.77 | 21.36 | 5 | 19.23 |
| Low | 521.12 | 14.49 | 5 | 19.23 |
| Very low | 1737.56 | 48.34 | 9 | 34.61 |
Disclaimer/Publisher’s Note: The statements, opinions and data contained in all publications are solely those of the individual author(s) and contributor(s) and not of MDPI and/or the editor(s). MDPI and/or the editor(s) disclaim responsibility for any injury to people or property resulting from any ideas, methods, instructions or products referred to in the content. |
© 2023 by the authors. Licensee MDPI, Basel, Switzerland. This article is an open access article distributed under the terms and conditions of the Creative Commons Attribution (CC BY) license (https://creativecommons.org/licenses/by/4.0/).
Share and Cite
Echogdali, F.Z.; Boutaleb, S.; Abioui, M.; Aadraoui, M.; Bendarma, A.; Kpan, R.B.; Ikirri, M.; El Mekkaoui, M.; Essoussi, S.; El Ayady, H.; et al. Spatial Mapping of Groundwater Potentiality Applying Geometric Average and Fractal Models: A Sustainable Approach. Water 2023, 15, 336. https://doi.org/10.3390/w15020336
Echogdali FZ, Boutaleb S, Abioui M, Aadraoui M, Bendarma A, Kpan RB, Ikirri M, El Mekkaoui M, Essoussi S, El Ayady H, et al. Spatial Mapping of Groundwater Potentiality Applying Geometric Average and Fractal Models: A Sustainable Approach. Water. 2023; 15(2):336. https://doi.org/10.3390/w15020336
Chicago/Turabian StyleEchogdali, Fatima Zahra, Said Boutaleb, Mohamed Abioui, Mohamed Aadraoui, Amine Bendarma, Rosine Basseu Kpan, Mustapha Ikirri, Manal El Mekkaoui, Sara Essoussi, Hasna El Ayady, and et al. 2023. "Spatial Mapping of Groundwater Potentiality Applying Geometric Average and Fractal Models: A Sustainable Approach" Water 15, no. 2: 336. https://doi.org/10.3390/w15020336
APA StyleEchogdali, F. Z., Boutaleb, S., Abioui, M., Aadraoui, M., Bendarma, A., Kpan, R. B., Ikirri, M., El Mekkaoui, M., Essoussi, S., El Ayady, H., Abdelrahman, K., & Fnais, M. S. (2023). Spatial Mapping of Groundwater Potentiality Applying Geometric Average and Fractal Models: A Sustainable Approach. Water, 15(2), 336. https://doi.org/10.3390/w15020336


