

Comparison of Rainfall Partitioning and Estimation of the Utilisation of Available Water in a Monoculture Beech Forest and a Mixed Beech-Oak-Linden Forest
 , , and
Abstract
:1. Introduction
2. Materials and Methods
2.1. Site Description
- Monoculture—no undergrowth, 48–61 years old, 0.255 ha in size;
- Mixed—no undergrowth, 72 years old, 0.83 ha in size.
- A Pronamic Pro professional rain gauge (PRONAMIC®, Skjern, Denmark) in conjunction with a Minikin ERi event recorder (EMS Brno Ltd., Brno, Czech Republic) with a resolution of 0.2 mm for measuring the precipitation;
- A Minikin RTHi sensor (EMS Brno Ltd., Brno, Czech Republic) for measuring the intensity of falling global radiation (GR), air temperature (T) and relative air humidity (RH);
- An Atmos 22 ultrasonic anemometer (METER Group, Pullman, WA, USA) with a MicroLog SDI-MP datalogger (EMS Brno Ltd., Brno, Czech Republic) for windspeed measurement.
2.2. Measurement of Throughfall
- From 1st March until 30th November, using a rectangular plastic trough with a retaining area of 0.4 m2, and sent through a small pipe to a small plastic barrel. Each barrel was marked with a number and weighed empty, and this weight was recorded.
- From 31st October until 1st April, using a round plastic bucket with a retaining area of 0.07 m2. Each bucket was marked with a number and weighed empty, and this weight was recorded.
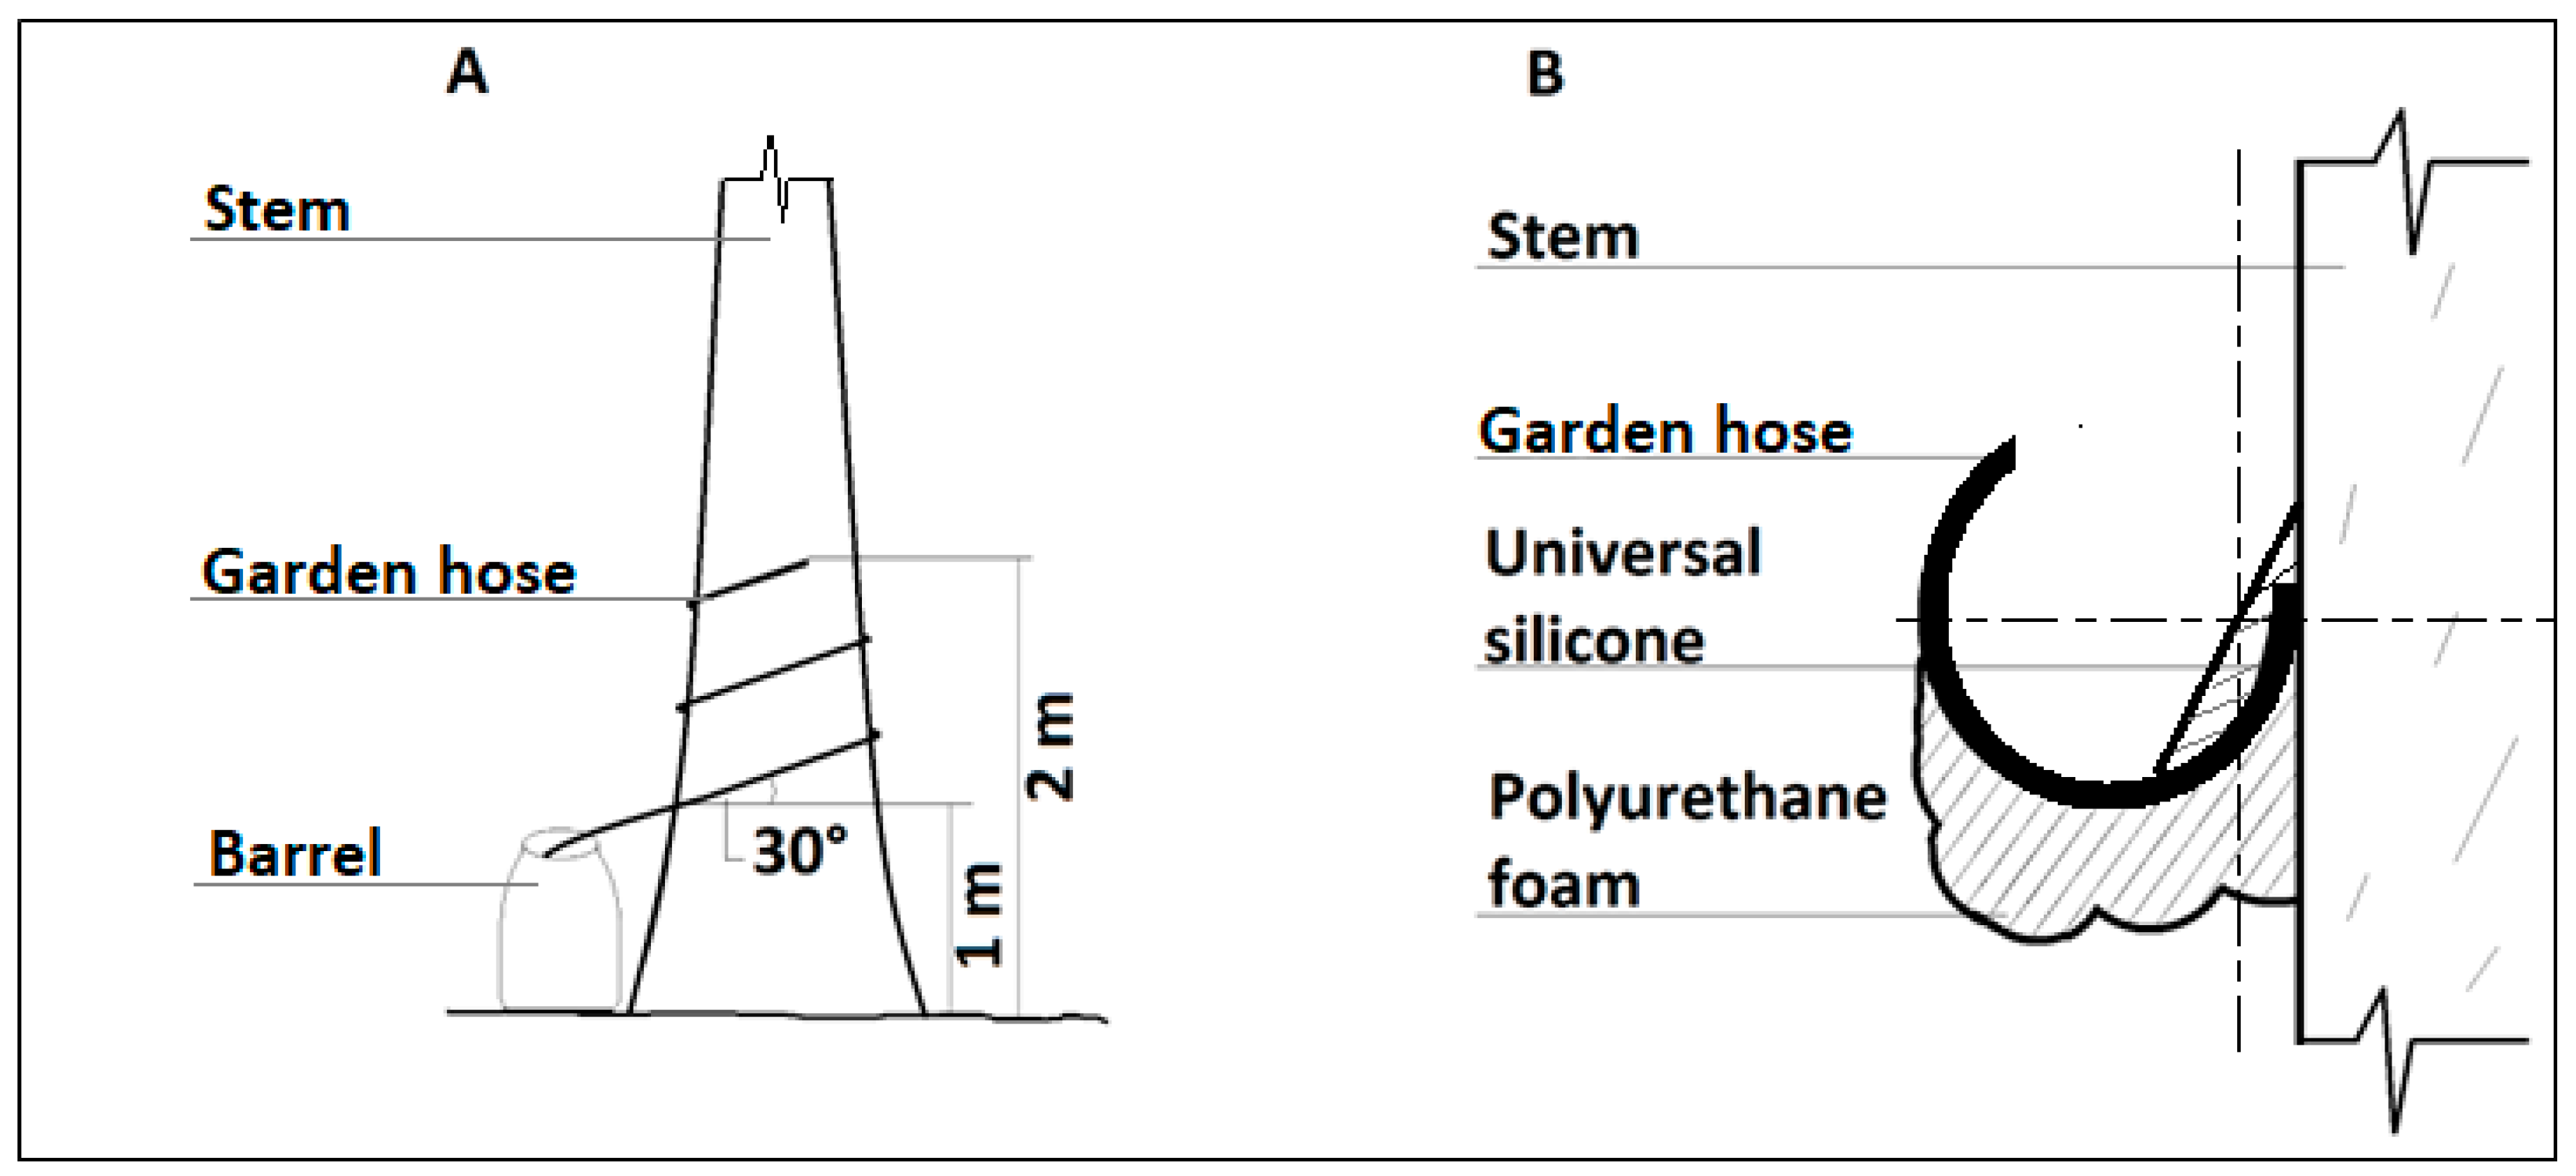
2.3. Measurement of Stemflow
2.4. Measurement of Sap Flow
2.5. Statistical Analysis
3. Results
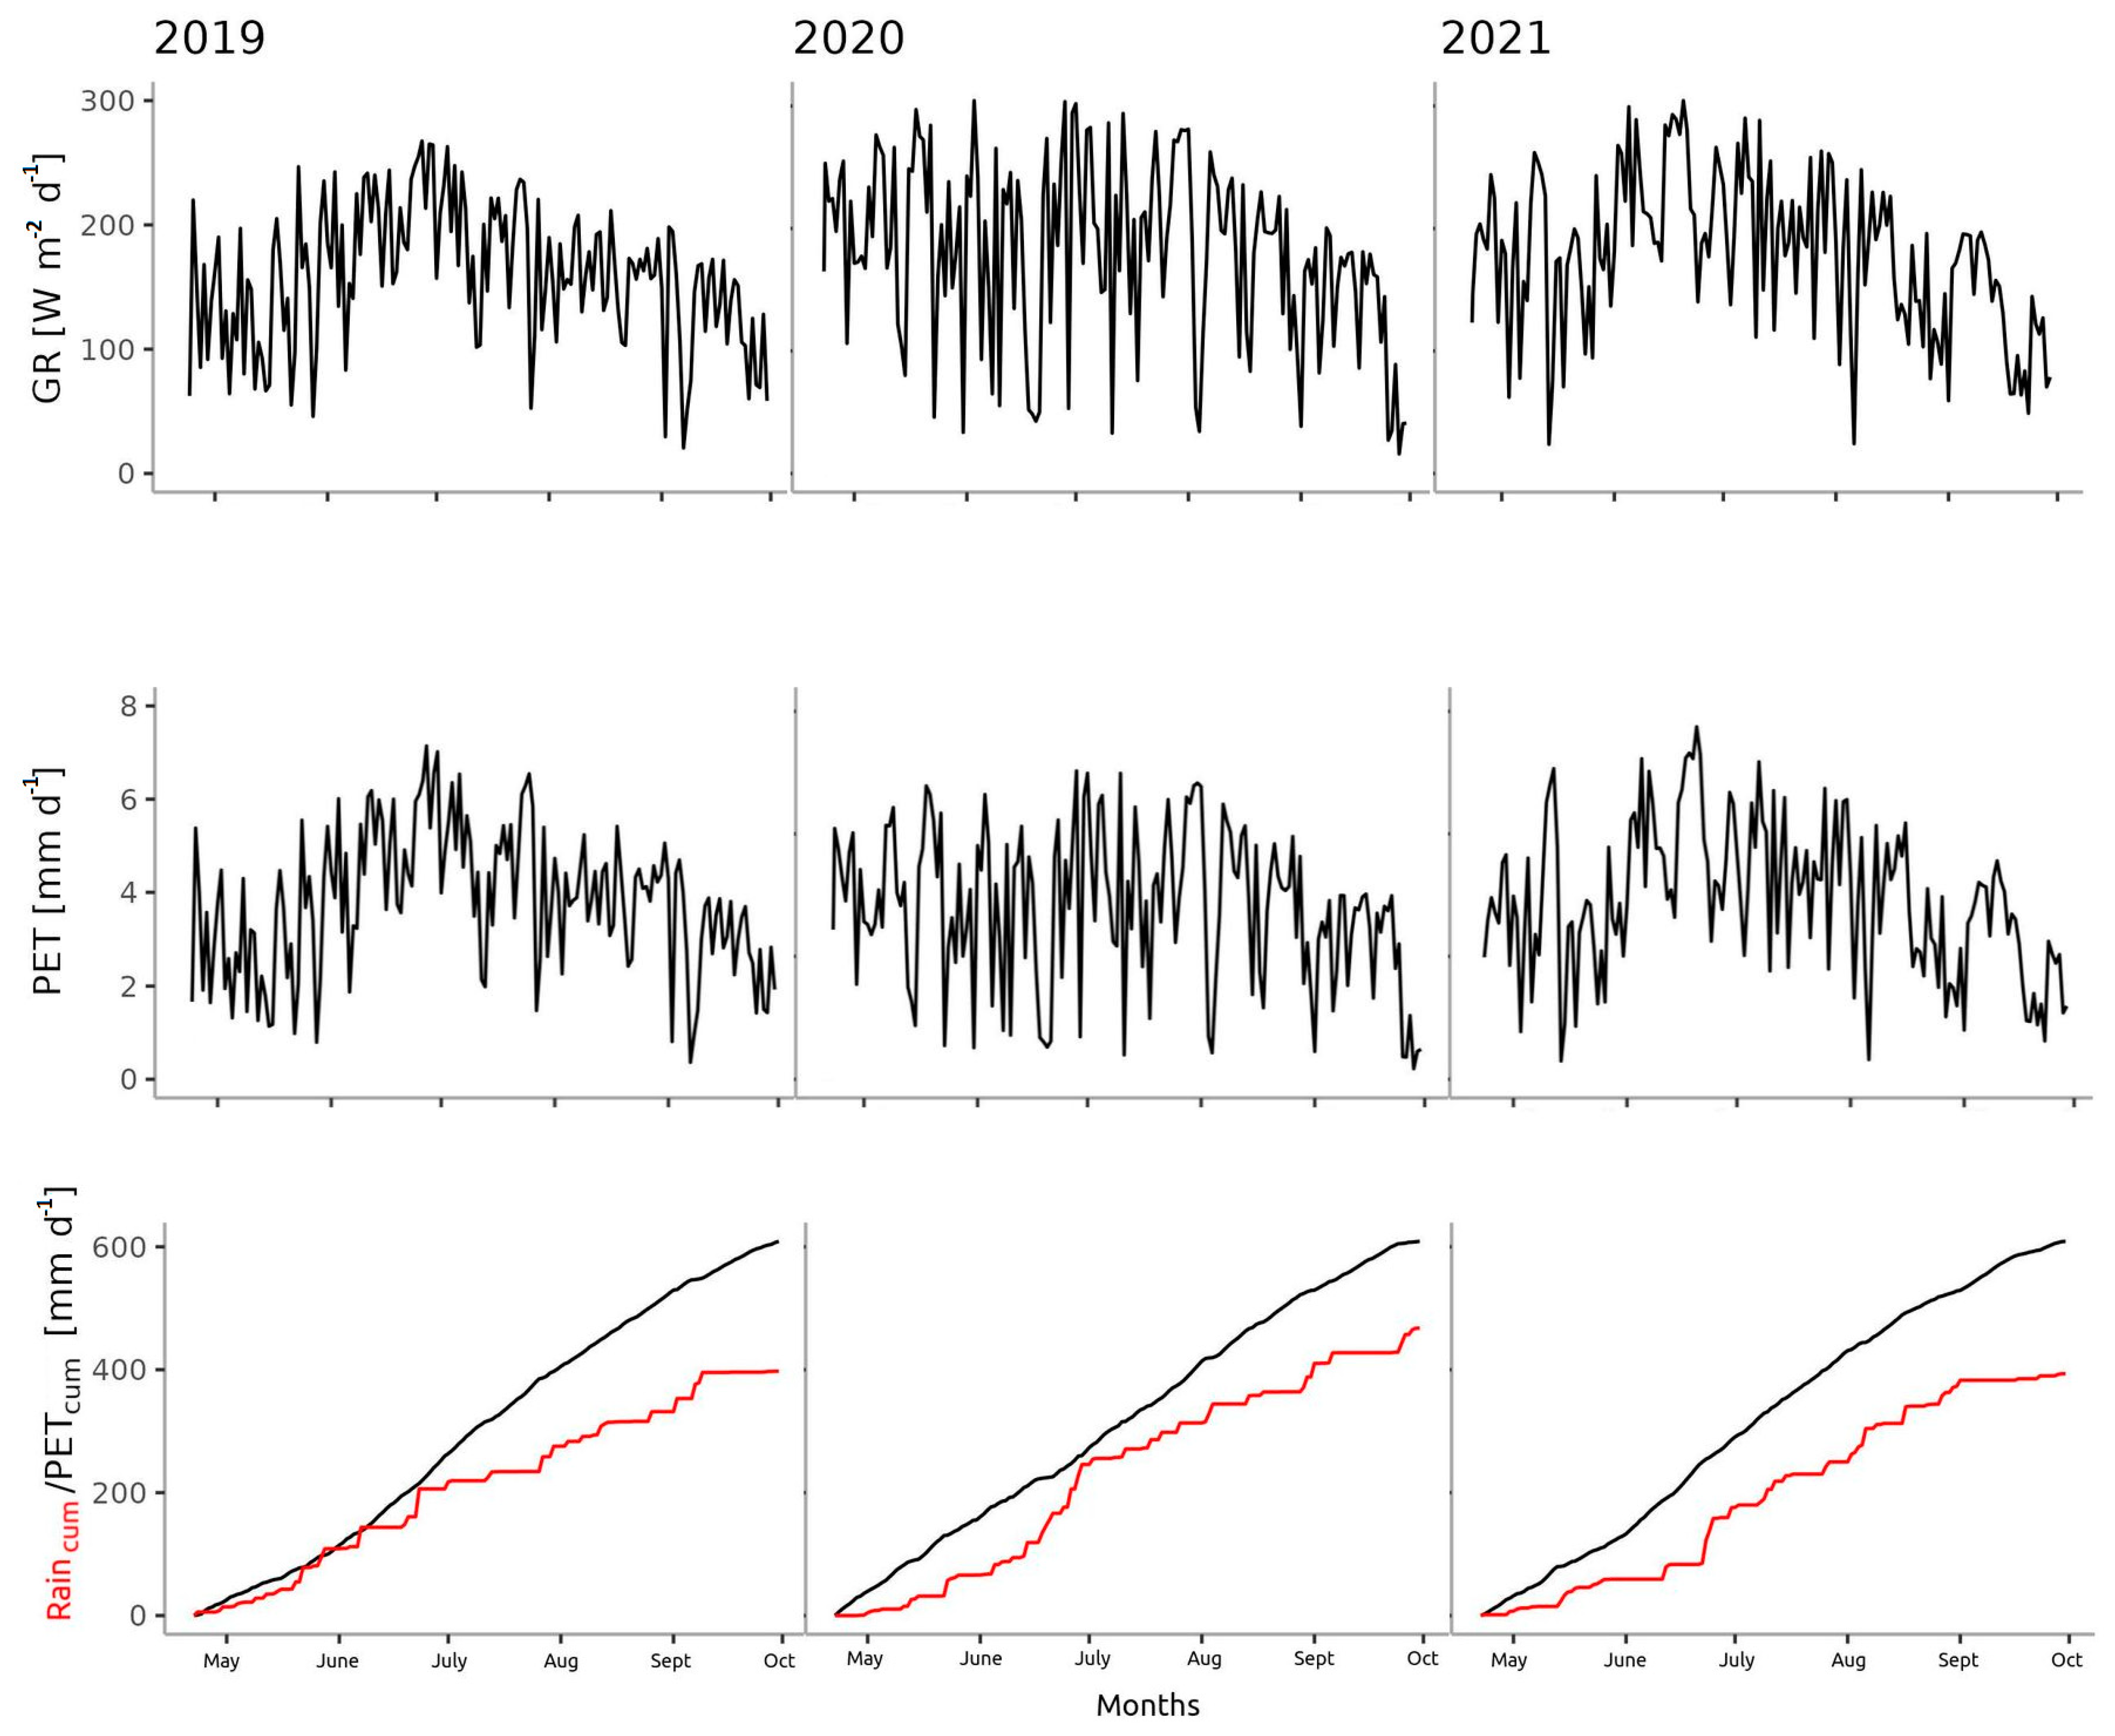
3.1. Microclimate
- The year 2020 was colder from April to October (with less precipitation from March to May and more precipitation from June to October) than Normal;
- The year 2021 was colder (with less precipitation from March to June and September to October) than Normal.
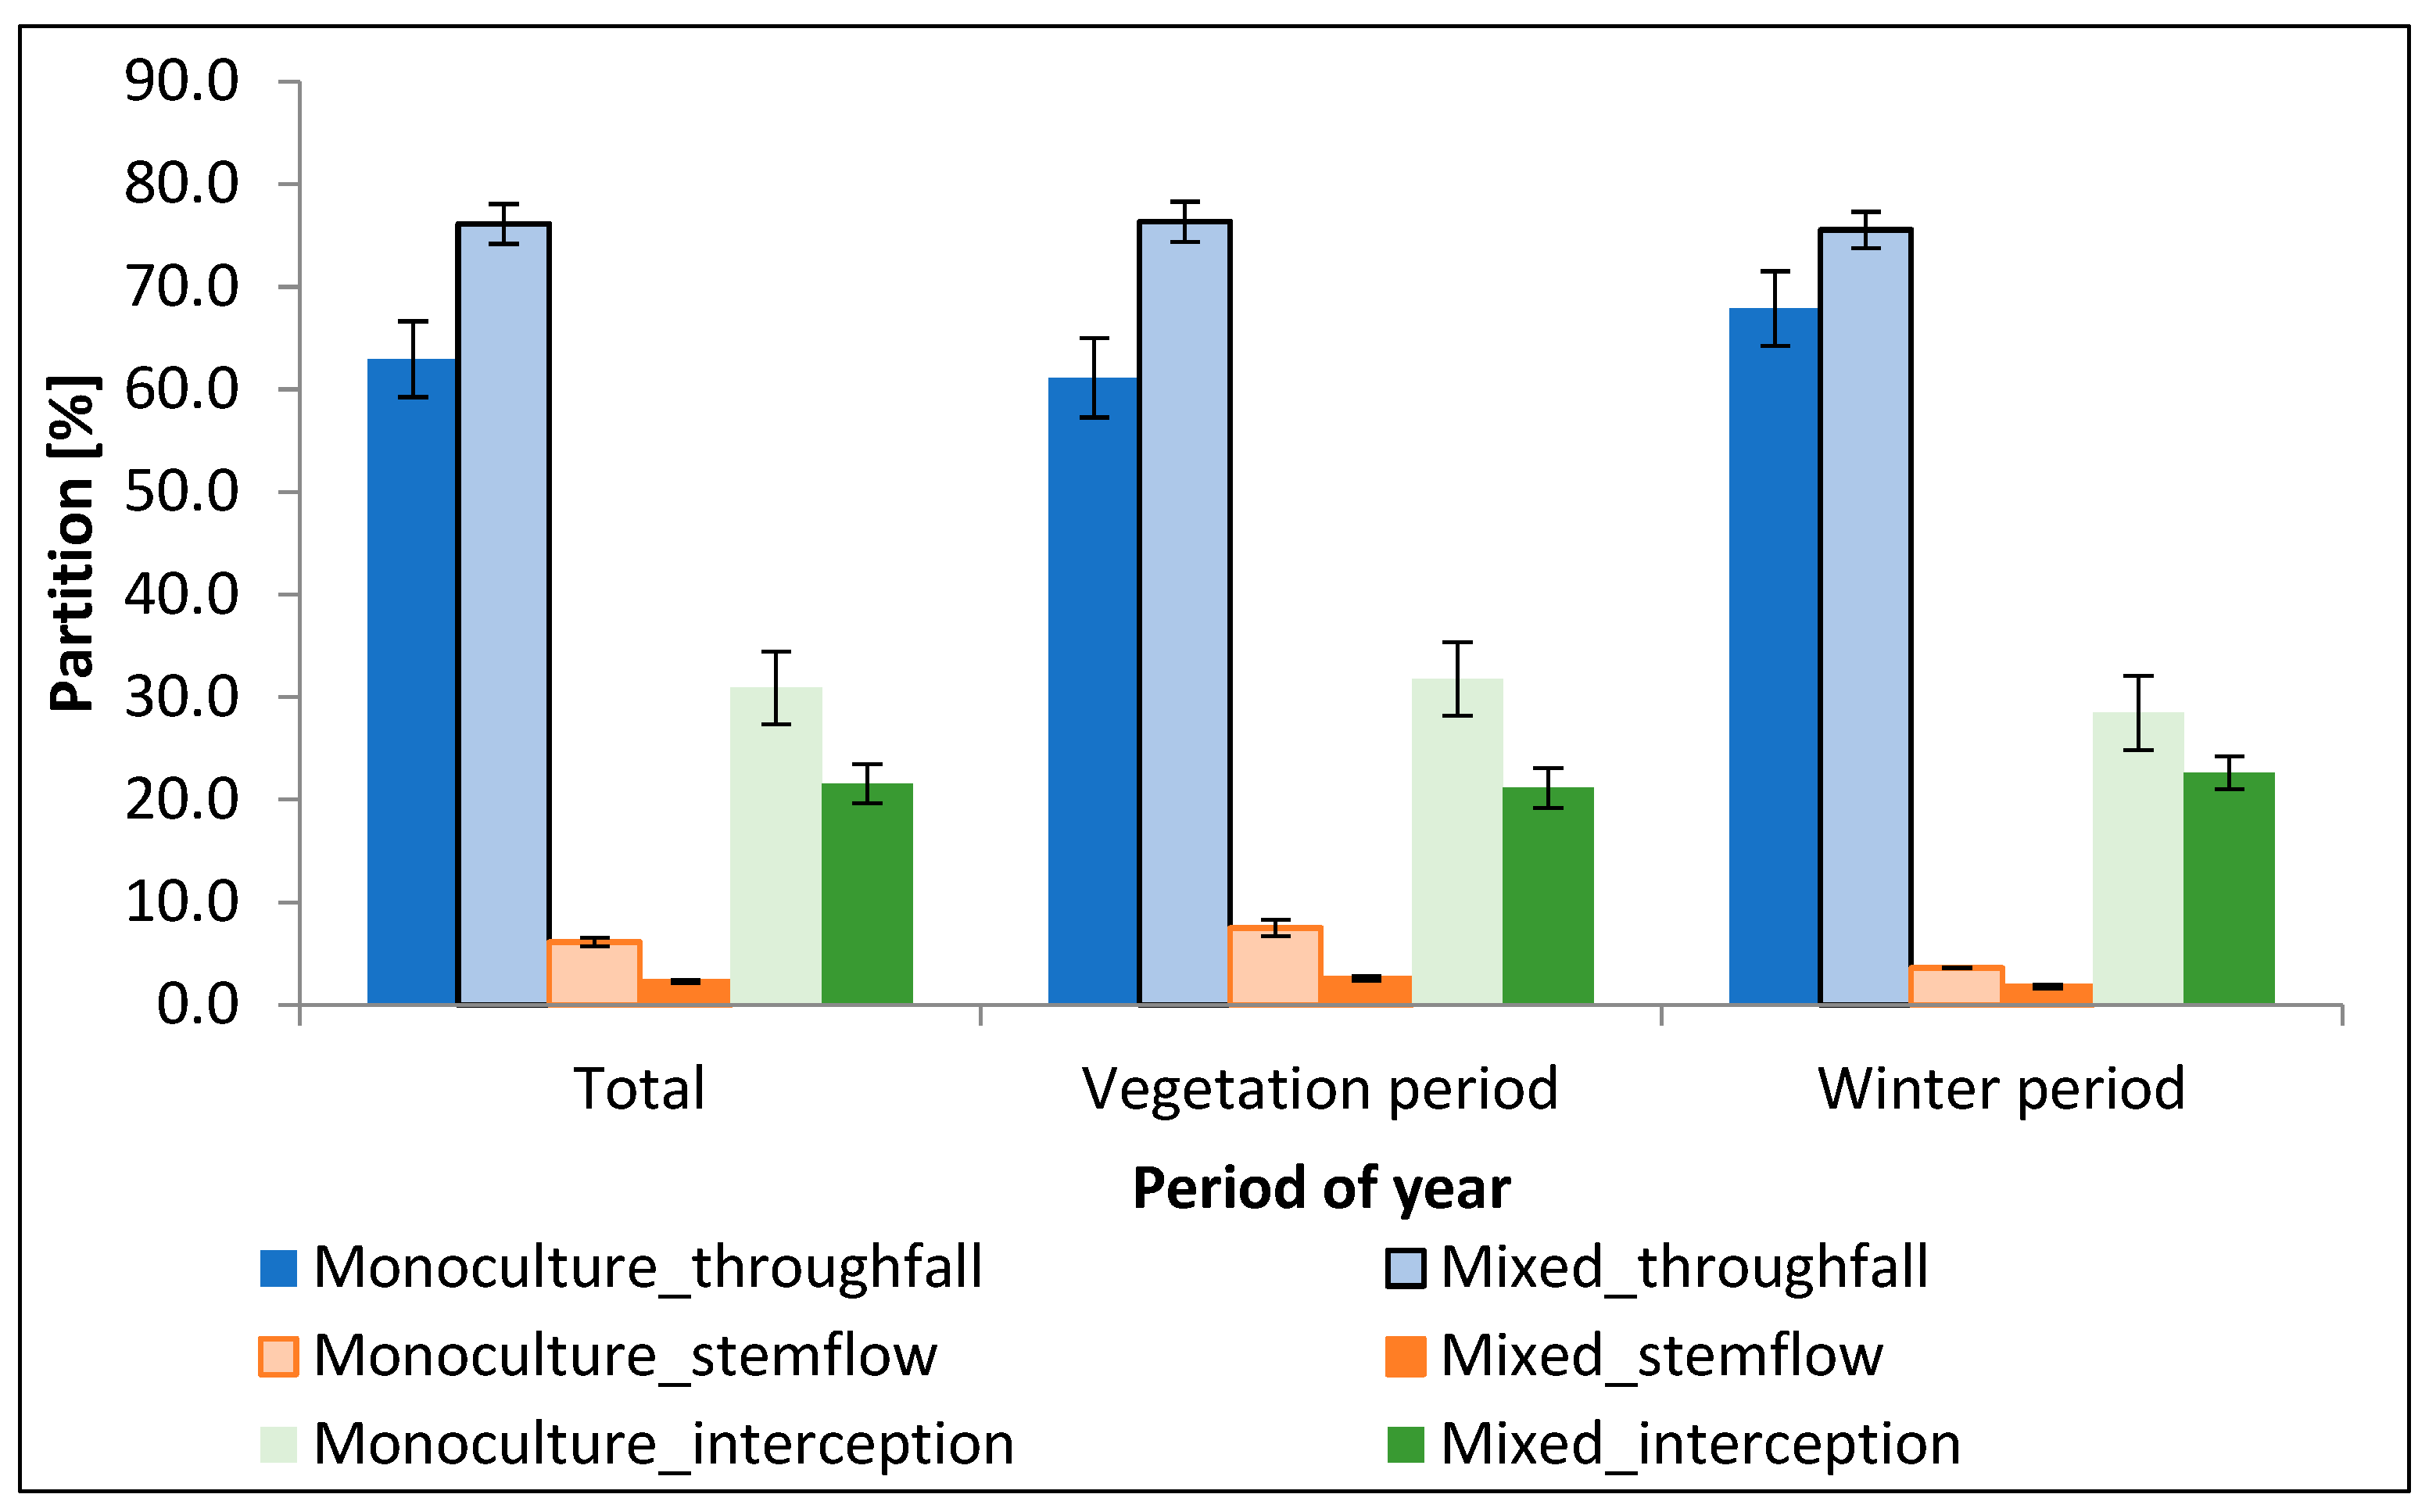
3.2. Distribution of Precipitation
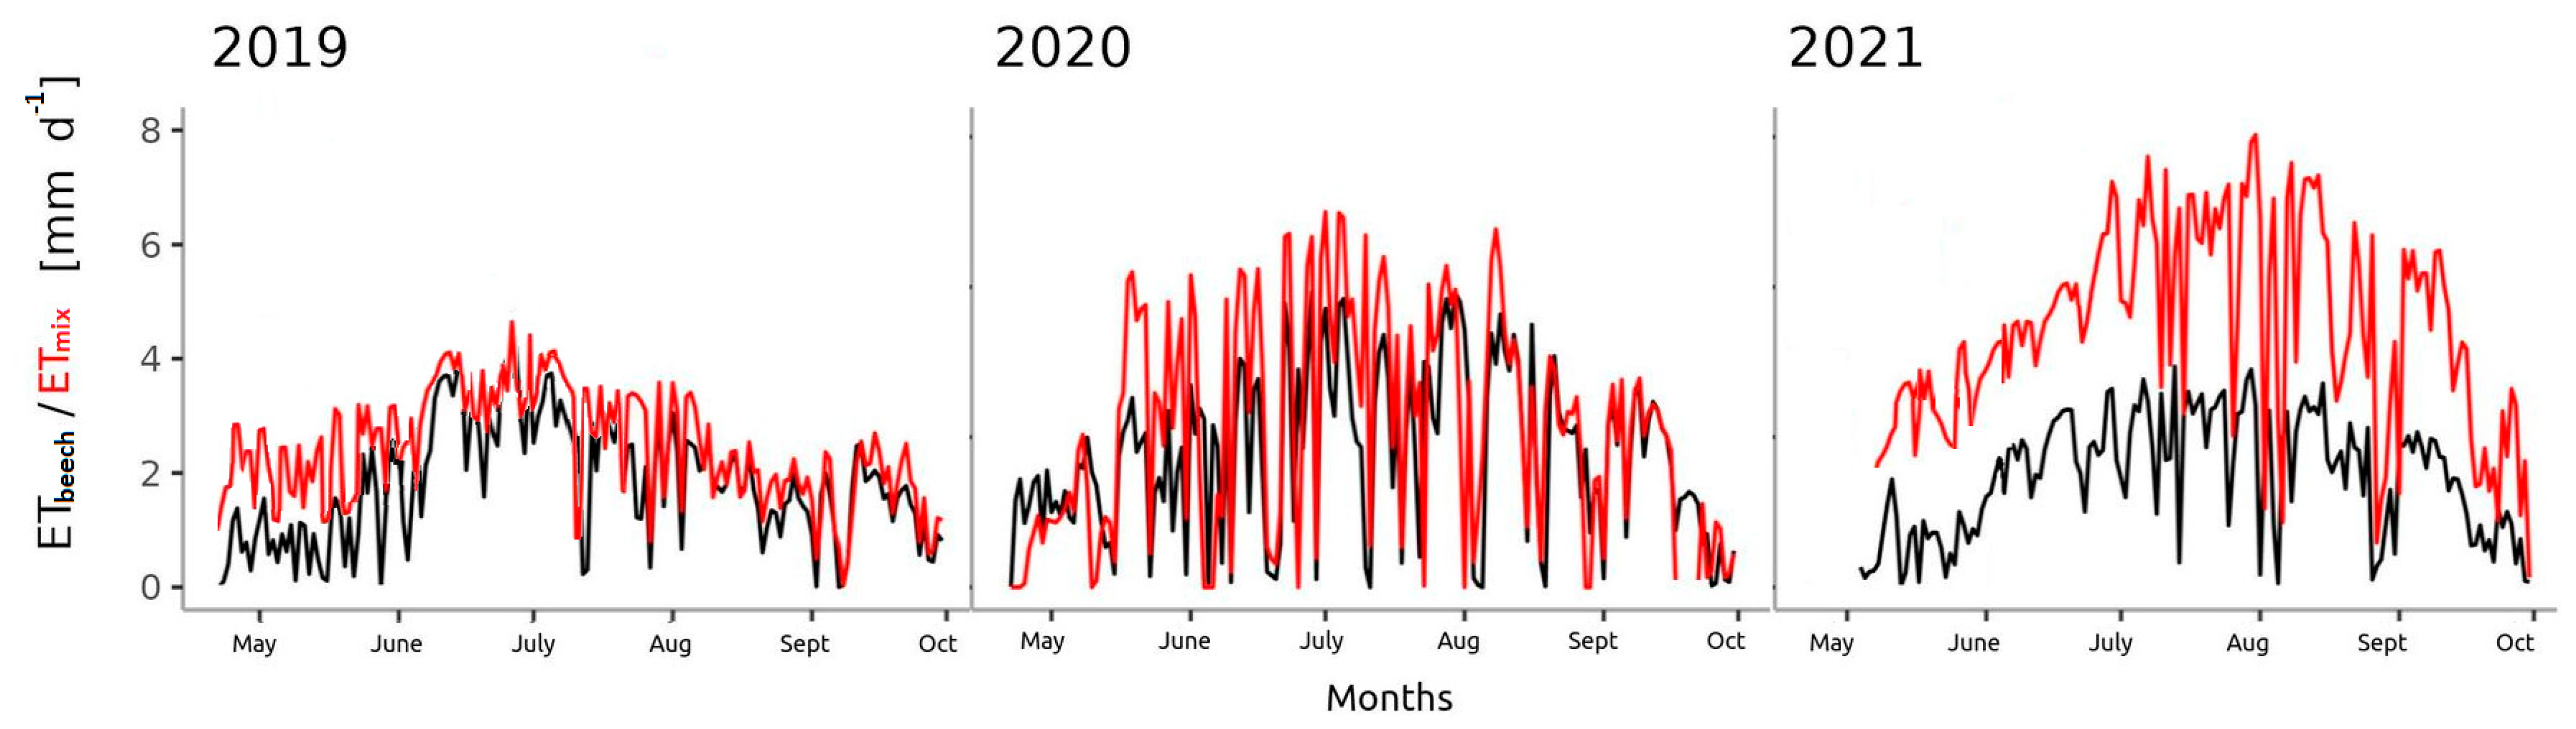
3.3. Transpiration
4. Discussion
5. Conclusions
Author Contributions
Funding
Data Availability Statement
Acknowledgments
Conflicts of Interest
Abbreviations
| C | co-dominant trees |
| CP | cumulative precipitation |
| CPA | crown projected area |
| CPET | cumulative potential evapotranspiration |
| CR | Czech Republic |
| CWD | cumulative water deficit |
| D | dominant trees |
| DBH | diameter at breast height |
| ET | transpiration |
| ETbeech | transpiration within monoculture forest |
| ETmix | transpiration within mixed forest |
| GR | global radiation |
| H | height |
| LAI | leaf area index |
| Normal | long-term 1981–2010 normal |
| P | precipitation |
| PAI | plant area index |
| PET | potential evapotranspiration |
| PETcum | cumulative potential evapotranspiration |
| Q | specific sap flow |
| Qstand | stand-level sap flow |
| Qtree | sap flow of entire tree |
| Raincum | cumulative precipitation |
| Researched Period | period 2019–2021 |
| RH | relative humidity |
| S | suppressed trees |
| SD | standard deviation |
| T | air temperature |
| THB | trunk heat balance |
| TR | transpiration |
| VP | vegetation period |
| VPD | vapour pressure deficit |
| WAI | woody area index |
References
- IPCC. Climate Change 2013: The Physical Science Basis. Contribution of Working Group I to the Fifth Assessment Report of the Intergovernmental Panel on Climate Change, 1st ed.; Stocker, T.F., Qin, D., Plattner, G.-K., Tignor, M., Allen, S.K., Boschung, J., Nauels, A., Xia, Y., Bex, V., Midgley, P.M., Eds.; Cambridge: New York, NY, USA, 2013. [Google Scholar]
- Młyński, D.; Wałęga, A.; Kuriqi, A. Influence of meteorological drought on environmental flows in mountain catchments. Ecol. Indic. 2021, 133, 108460. [Google Scholar] [CrossRef]
- Lindner, M.; Maroschek, M.; Netherer, S.; Kremer, A.; Barbati, A.; Garcia-Gonzualo, J.; Seidl, R.; Delzon, S.; Corona, P.; Kolström, M.; et al. Climate change impacts, adaptive capacity, and vulnerability of European forest ecosystems. For. Ecol. Manag. 2010, 259, 698–709. [Google Scholar] [CrossRef]
- Seppälä, R.; Buck, A.; Katila, P. Adaptation of Forests and People to Climate Change: A Global Assessment Report, 1st ed.; IUFRO: Helsinki, Finland, 2009; p. 224. [Google Scholar]
- Allen, C.D.; Macalady, A.K.; Chenchouni, H.; Bachelet, D.; McDowell, N.; Vennetier, M.; Kitzberger, T.; Rigling, A.; Breshears, D.D.; Hogg, E.H.; et al. A global overview of drought and heta-induced tree mortality revers emerging climate change risks for forests. For. Ecol. Manag. 2010, 259, 660–684. [Google Scholar] [CrossRef] [Green Version]
- Bolte, A.; Ammer, C.; Löf, M.; Madsen, P.; Nabuurs, G.-J.; Schall, P.; Spathelf, P.; Rock, J. Adaptive forest management in central Europe: Climate change impacts, strategies and intergrative concept. Scand. J. For. Res. 2009, 24, 473–482. [Google Scholar] [CrossRef]
- Kramer, K.; Degen, B.; Buschbom, J.; Hickler, T.; Thuiller, W.; Sykes, M.T.; de Winter, W. Modelling exploration of the future of European beech (Fagus sylvatica L.) under climate change—Range, abundance, genetic diversity and adaptive response. For. Ecol. Manag. 2010, 259, 2213–2222. [Google Scholar] [CrossRef]
- Scharnweber, T.; Manthey, M.; Criegee, C.; Bauwe, A.; Schröder, C.; Wilmking, M. Drought matters—Declining precipitation influences growth of Fagus sylvatica L. and Quercus robur L. in north-eastern Germany. For. Ecol. Manag. 2011, 262, 947–961. [Google Scholar] [CrossRef]
- Lebourgeois, F.; Breda, N.; Ulrich, E.; Granier, A. Climate-tree-growth relationships of European beech (Fagus sylvatica L.) in the French Permanent Plot Network (RENECOFOR). Trees 2005, 19, 385–401. [Google Scholar] [CrossRef]
- Theurillat, J.-P.; Guisan, A. Potential Impact of Climate Change on Vegetation in the European Alps: A Review. Clim. Chang. 2001, 50, 77–109. [Google Scholar] [CrossRef]
- Matoušková, M.; Urban, J.; Volařík, D.; Hájíčková, M.; Matula, R. Coppicing modulates physiological responses of sessile oak (Quercus petraea Matt. Lieb.) to drought. For. Ecol. Manag. 2022, 517, 120253. [Google Scholar] [CrossRef]
- Bittner, S.; Talkner, U.; Krämer, I.; Beese, F.; Hölscher, D.; Priesack, E. Modeling stand water budgets of mixed temperate broad-leaved forest stands by considering variations in species specific drought response. Agric. For. Meteorol. 2010, 150, 1347–1357. [Google Scholar] [CrossRef]
- Peck, A.K. Hydrometeorologische und Mikroklimatische. Kennzeichen von Buchenwäldern. Ph.D. Thesis, University of Freiburg, Freiburg, Germany, 2004. (In German). [Google Scholar]
- Hanchi, A.; Rapp, M. Stemflow determination in forest stands. For. Ecol. Manag. 1997, 97, 231–235. [Google Scholar] [CrossRef]
- Nordén, U. Acid deposition and throughfall fluxes of elements as related to tree species in deciduous forests of South Sweden. Water Air Soil Pollut. 1991, 60, 209–230. [Google Scholar] [CrossRef]
- van Stan, J.T.; Gordon, D.A. Mini-Review: Stem flow as a Resource Limitation to Near-Stem Soil. Front. Plant Sci. 2018, 9, 248. [Google Scholar] [CrossRef] [PubMed] [Green Version]
- Parker, G.G. Throughfall and stemflow in the forest nutrient cycle. Adv. Ecol.Res. 1983, 13, 57–133. [Google Scholar]
- Gebauer, T.; Horna, V.; Leuschner, C. Canopy transpiration of pure and mixed forest stands with variable abundance of European beech. J. Hydrol. 2012, 442, 2–14. [Google Scholar] [CrossRef]
- Forrester, D.I. Transpiration and water-use efficiency in mixed-species forests versus monocultures: Effects of tree size, stand density and season. Tree Physiol. 2015, 35, 289–304. [Google Scholar] [CrossRef] [Green Version]
- Urban, J.; Rubtsov, A.V.; Urban, A.V.; Shashkin, A.V.; Benkova, V.E. Canopy transpiration of a Larix sibirica and Pinus sylvestris forest in Central Siberia. Agric. For. Meteorol. 2019, 271, 64–72. [Google Scholar] [CrossRef]
- De Cáceres, M.; Mencuccini, M.; Martin-StPaul, N.; Limousin, J.-M.; Coll, L.; Poyatos, R.; Cabon, A.; Granda, V.; Forner, A.; Valladares, F.; et al. Unravelling the effect of species mixing on water use and drought stress in Mediterranean forests: A modelling approach. Agric. For. Meteorol. 2021, 296, 108233. [Google Scholar] [CrossRef]
- Švihla, V.; Černohous, V.; Šach, V.; Kantor, P. Metodické Postupy Optimalizace Vodního Režimu Uspořádáním Kultur v Krajině. Certifikovaná Metodika; VÚHLM: Prague, Czech Republic, 2014. (In Czech) [Google Scholar]
- Střelcová, K.; Kučera, J. Stanovenie Evapotransirácie Smrekového Porastu Metodou s Dendrometrickým Prístupom. In Evaporace a Evapotranspirace: Sborník z Mezinárodního Vědeckého Semináře; Rožnovský, J., Litschmann, T., Eds.; ČHMÚ: Brno, Czech Republic, 2005; pp. 71–75. (in Czech) [Google Scholar]
- Švec, M. Určení Vlivu Evapotranspirace Pro Zpřesnění Srážko-odtokových Modelů. In Sborník—Symposium GIS Ostrava 2011; Růžička, J., Pešková, K., Eds.; VŠB-Technická Univerzita: Ostrava, Czech Republic, 2010. [Google Scholar]
- Arnell, N. Hydrology and Global Environmental Change; Pearson Education: Harlow, UK, 2002; p. 346. [Google Scholar]
- Dingman, S. Physical Hydrology; Prentice Hall: Upper Saddle River, NJ, USA, 2002; p. 646. [Google Scholar]
- Klaassen, W.; Bosveld, F.; de Water, E. Water storage and evaporation as constituents of rainfall interception. J. Hydrol. 1998, 212, 36–50. [Google Scholar] [CrossRef] [Green Version]
- Safeeq, M.; Fares, A. Interception losses in three non-native Hawaiian forest stands. Hydrol. Process. 2012, 28, 237–254. [Google Scholar] [CrossRef]
- Jasechko, S.; Sharp, Z.D.; Gibson, J.J.; Birks, S.J.; Yi, Y.; Fawcett, P.J. Terrestrial water fluxes dominated by transpiration. Nature 2013, 496, 347–350. [Google Scholar] [CrossRef] [PubMed]
- Nalevanková, P.; Sitková, Z.; Kučera, J.; Střelcová, K. Impact of Water Deficit on Seasonal and Diurnal Dynamics of European Beech Transpiration and Time-Lag Effect between Stand Transpiration and Environmental Drivers. Water 2020, 12, 3437. [Google Scholar] [CrossRef]
- Breda, N.; Granier, A. Intra and interannual variations of transpiration, leaf area index and radial growth of sessile oak stand (Quercus petraea). Ann. Sci. For. 1996, 53, 521–536. [Google Scholar] [CrossRef] [Green Version]
- Fabiani, G.; Schoppach, R.; Penna, D.; Klaus, J. Transpiration patterns and water use strategies of beech and oak trees along a hillslope. Ecohydrology 2022, 15, e2382. [Google Scholar] [CrossRef]
- IUSS Working Group WRB. World Reference Base for Soil Resources 2014, Update 2015. International Soil Classification System for Naming Soils and Creating Legends for Soil Maps. World Soil Resources Reports No. 106; FAO: Rome, Italy, 2015. [Google Scholar]
- Köppen, W. Handbuch der Klimatologie. Das Geographische System der Klimate [Handbook of Climatology. The Geographic System of Climates]; Verlag von Gebrüder Borntraeger: Berlin, Germany, 1936; p. 44. (In Germain) [Google Scholar]
- Chmi. Měsíční a Roční Data Dle Zákona 123/1998 Sb. [Month and Annual Data According To Act No. 123/1998]. Available online: https://www.chmi.cz/historicka-data/pocasi/uzemni-teploty# (accessed on 8 August 2022). (In Czech).
- Allen, R.G.; Pereira, L.S.; Raes, D.; Smith, M.; Ab, W. Crop Evapotranspiration—Guidelines for Computing Crop Water Requirements—FAO Irrigation and Drainage Paper 56; FAO: Rome, Italy, 1998. [Google Scholar]
- Čermák, J.; Prax, A. Transpiration and soil water supply in floodplain forests. Ekologia 2009, 28, 248–254. [Google Scholar] [CrossRef]
- Yan, M.-J.; Zhang, J.-G.; He, Q.-Y.; Shi, W.-Y.; Otsuki, K.; Yamanaka, N.; Du, S. Sapflow-Based Stand Transpiration in a Semidarid Natural Oak Forest on China´s Loess Plateau. Forests 2016, 7, 227. [Google Scholar] [CrossRef] [Green Version]
- Zapater, M.; Hossann, C.; Bréda, N.; Bréchet, C.; Bonal, D.; Granier, A. Evidence of hydraulic lift in a young beech and oak mixed forest using 18O soil water labelling. Trees 2011, 25, 885–894. [Google Scholar] [CrossRef]
- Domec, J.; Warren, J.; Meinzer, F.; Brooks, J.; Coulombe, R. Native root xylem embolism and stomatal closure in stands of douglas-fir and ponderosa pine: Mitigation by hydraulic redistribution. Oecologia 2004, 141, 7–16. [Google Scholar] [CrossRef]
- Bauerle, T.; Richards, J.; Smartt, D.; Eissenstat, D. Importance of internal hydraulic redistribution for prolonging the lifespan of roots in dry soil. Plant Cell Environ. 2008, 31, 177–186. [Google Scholar] [CrossRef]
- Warren, J.; Meinzer, F.; Brooks, J.; Domec, J. Vertical stratification of soil water storage and release dynamics in Pacific Northwest coniferous forests. Agric. For. Meteorol. 2005, 130, 39–58. [Google Scholar] [CrossRef]
- Meinzer, F.; Warren, J.; Brooks, J. Species-specific partitioning of soil water resources in an old-growth Douglas-fir-western hemlock forest. Tree Physiol. 2007, 27, 871–880. [Google Scholar] [CrossRef] [PubMed]
- Čermák, J.; Kučera, J.; Nadezhdina, N. Sap flow measurements with some thermodynamic methods, flow integration within trees and scaling up from sample trees to entire forest stands. Trees Struct. Funct. 2004, 18, 529–546. [Google Scholar] [CrossRef]
- Kučera, J. Sap Flow System EMS 81. Available online: http://www.emsbrno.cz/r.axd/pdf_v_EMS81__usermanual_u_pdf.jpg?ver= (accessed on 8 August 2022).
- Obojes, N.; Meurer, A.; Newesely, C.; Tasser, E.; Oberhuber, W.; Mayr, S.; Tappeiner, U. Water stress limits transpiration and growth of European larch up to the lower subalpine belt in an inner-alpine dry valley. New Phytol. 2018, 220, 460–475. [Google Scholar] [CrossRef] [PubMed] [Green Version]
- Levia, D.F.; Frost, E.E. A review and evaluation of stemflow literature in the hydrologic and biogeochemical cycles of forested and agricultural ecosystems. J. Hydrol. 2003, 274, 1–29. [Google Scholar] [CrossRef]
- Mattaji, A.; Akef, M.; Sasan, B.-K.; Hemmati, V. Throughfall, stemflow and canopy interception loss by central beech trees (Fagus orientalis Lipsky) in North Forests of Iran. J. Food Agric. Environ. 2012, 10, 1183–1187. [Google Scholar]
- Mitscherlich, G. Wald, Wachstum und Umwelt. 2. Band: Wald Klima und Wasserhaushalt [Forest, Growth and Environment. Volume 2: Forest Climate and Water Balance]; Sauerländer’s Verlag: Frankfurt am Main, Germany, 1981. [Google Scholar]
- Crockford, R.H.; Richardson, D.P. Partitioning of rainfall into throughfall, stemflow and interception: Effect of forest type, groundcover and climate. Hydrol. Process. 2000, 14, 2903–2920. [Google Scholar] [CrossRef]
- Barbier, S.; Balandier, P.; Gosselin, F. Influence of several tree traits on rainfall partitioning in temperate and boreal forests: A review. Ann. For. Sci. 2009, 66, 1–11. [Google Scholar] [CrossRef] [Green Version]
- Leuschner, C.; Voß, S.; Foetzki, A.; Clases, Y. Variation in leaf area index and stand leaf mass of European beech across gradients of soil acidity and precipitation. Plant Ecol. 2006, 182, 247–258. [Google Scholar] [CrossRef]
- Klamerus-Iwan, A.; Błońska, E. Seasonal variability of interception and water wettability of common oak leaves. Ann. For. Res. 2016, 60, 63–73. [Google Scholar] [CrossRef] [Green Version]
- Forgeard, F.; Gloaguen, J.C.; Touffet, J. Interception des précipitations et apport au sol d’éléments minéraux par les eaux de pluie etles pluviolessivats dans une hêtraie atlantique et dans quelquespeuplements résineaux en Bretagne. Ann. Des Sci. For. 1980, 37, 53–71. [Google Scholar]
- Augusto, L.; Ranger, J.; Binkley, D.; Rothe, A. Impact of several common tree species of European temperate forests on soil fertility. Ann. For. Sci. 2002, 59, 233–253. [Google Scholar] [CrossRef] [Green Version]
- Ganatsios, H.P.; Tsioras, P.A.; Pavlidis, T. Water yield changes as a reset of silvicultural treatments in an oak ecosystem. For. Ecol. Manag. 2010, 260, 1367–1374. [Google Scholar] [CrossRef]
- Rahmani, R.; Sadoddin, A.; Ghorbani, S. Measuring and modelling precipitation components in an Oriental beech stand of the Hyrcanian region, Iran. J. Hydrol. 2011, 404, 294–303. [Google Scholar] [CrossRef]
- Leuzinger, S.; Zotz, G.; Asshoff, R.; Körner, C. Response of deciduous forest trees to severe drought in Central Europe. Tree Physiol. 2005, 25, 641–650. [Google Scholar] [CrossRef] [Green Version]
- Miller, D.E.; Gardner, W.H. Water Infiltration into stratified Soil. Soil Sci. Soc. Am. J. 1962, 26, 115–119. [Google Scholar] [CrossRef]
- Martín-Gómez, P.; Serrano, L.; Ferrio, J.P. Short-term dynamics of evaporative enrichment of xylem water in woody stems: Implications for ecohydrology. Tree Physiol. 2017, 37, 511–522. [Google Scholar] [CrossRef] [Green Version]
- Fan, Y.; Miguez-Macho, G.; Jobbágy, E.G.; Jackson, R.B.; Otero-Casal, C. Hydrologic regulation of plant rooting depth. Proc. Natl. Acad. Sci. USA 2017, 114, 10572–10577. [Google Scholar] [CrossRef] [Green Version]
- Lanning, M.; Wang, L.; Benson, M.; Zhang, Q.; Novick, K.A. Canopy isotopic investigation reveals different water uptake dynamics of maples and oaks. Phytochemistry 2020, 175, 112389. [Google Scholar] [CrossRef]
- Richards, J.M.; Caldwell, M.M. Hydraulic lift: Substantial nocturnal water transport between soil layers by Artemisia tridentata roots. Oecologia 1987, 73, 486–489. [Google Scholar] [CrossRef]
- Jackson, R.B.; Sperry, J.S.; Dawson, T.E. Root water uptake and transport: Using physiological processes in global predictions. Trends Plant Sci. 2000, 5, 482–488. [Google Scholar] [CrossRef]


| Stand | Species | Species Composition [%] | Mean DBH ± SD [cm] | Mean Height ± SD [m] | PAI ± SD | LAI ± SD | WAI ± SD |
|---|---|---|---|---|---|---|---|
| Monoculture forest | Fagus sylvatica | 100 | 19.1 ± 6.4 | 18.6 ± 3.0 | 6.9 ± 0.1 | 5.1 ± 0.1 | 1.7 ± 0.1 |
| Mixed forest | Fagus sylvatica | 50 | 17.8 ± 9.0 | 18.5 ± 9.4 | 4.0 ± 0.2 | 2.9 ± 0.2 | 1.1 ± 0.1 |
| Quercus petraea | 40 | 21.8 ± 5.5 | 22.6 ± 10.4 | ||||
| Tilia cordata | 10 | 15.9 ± 8.8 | 15.9 ± 6.4 |
| Precipitation [mm] | ||||||||||||||
|---|---|---|---|---|---|---|---|---|---|---|---|---|---|---|
| Month/Year | I | II | III | IV | V | VI | VII | VIII | IX | X | XI | XII | Σ Year | Σ VP |
| 2019 | 24 | 34 | 35 | 19 | 95 | 97 | 70 | 56 | 66 | 46 | 52 | 41 | 635 | 449 |
| 2020 | 16 | 41 | 31 | 7 | 68 | 182 | 66 | 73 | 77 | 108 | 29 | 49 | 747 | 581 |
| 2021 | 42 | 23 | 14 | 20 | 53 | 118 | 75 | 134 | 11 | 13 | 51 | 41 | 595 | 424 |
| Mean | 27 ± 13 | 32 ± 9 | 27 ± 11 | 15 ± 7 | 72 ± 21 | 132 ± 44 | 70 ± 5 | 88 ± 41 | 51 ± 35 | 56 ± 48 | 41 ± 16 | 45 ± 6 | 659 ± 122 | 485 ± 85 |
| 1981–2010 | 33 ± 16 | 33 ± 18 | 39 ± 22 | 39 ± 23 | 69 ± 30 | 77 ± 29 | 80 ± 41 | 68 ± 42 | 57 ± 35 | 38 ± 25 | 44 ± 18 | 44 ± 17 | 613 ± 95 | 427 ± 36 |
| Temperature [°C] | ||||||||||||||
| Month/Year | I | II | III | IV | V | VI | VII | VIII | IX | X | XI | XII | Φ Year | Φ VP |
| 2019 | −1.9 | 2.1 | 6.3 | 10.7 | 11.3 | 21.1 | 19.3 | 20.1 | 14.2 | 9.8 | 6.1 | 1.9 | 10.1 | 15.2 |
| 2020 | −1.2 | 3.1 | 5.0 | 8.5 | 10.3 | 15.7 | 16.7 | 18.0 | 13.5 | 8.3 | 3.1 | 0.9 | 8.5 | 13.0 |
| 2021 | −1.4 | −1.5 | 1.9 | 5.1 | 10.4 | 18.0 | 18.6 | 15.5 | 13.4 | 7.7 | 3.4 | 1.0 | 7.7 | 12.7 |
| Mean | −1.5 ± 0.4 | 1.2 ± 2.4 | 4.4 ± 2.3 | 8.1 ± 2.8 | 10.7 ± 0.6 | 18.3 ± 2.7 | 18.2 ± 1.3 | 17.9 ± 2.3 | 13.7 ± 0.4 | 8.6 ± 1.1 | 4.2 ± 1.7 | 1.3 ± 0.6 | 8.8 ± 1.2 | 13.6 ± 1.4 |
| 1981–2010 | −1.5 ± 2.9 | 0.1 ± 2.9 | 4.3 ± 2.0 | 9.9 ± 1.6 | 14.9 ± 1.4 | 17.7 ± 1.4 | 19.9 ± 1.6 | 19.5 ± 1.6 | 14.7 ± 1.6 | 9.4 ± 1.4 | 3.9 ± 2.0 | −0.4 ± 1.8 | 9.4 ± 0.8 | 15.1 ± 4.2 |
Disclaimer/Publisher’s Note: The statements, opinions and data contained in all publications are solely those of the individual author(s) and contributor(s) and not of MDPI and/or the editor(s). MDPI and/or the editor(s) disclaim responsibility for any injury to people or property resulting from any ideas, methods, instructions or products referred to in the content. |
© 2023 by the authors. Licensee MDPI, Basel, Switzerland. This article is an open access article distributed under the terms and conditions of the Creative Commons Attribution (CC BY) license (https://creativecommons.org/licenses/by/4.0/).
Share and Cite
Novosadová, K.; Kadlec, J.; Řehořková, Š.; Matoušková, M.; Urban, J.; Pokorný, R. Comparison of Rainfall Partitioning and Estimation of the Utilisation of Available Water in a Monoculture Beech Forest and a Mixed Beech-Oak-Linden Forest. Water 2023, 15, 285. https://doi.org/10.3390/w15020285
Novosadová K, Kadlec J, Řehořková Š, Matoušková M, Urban J, Pokorný R. Comparison of Rainfall Partitioning and Estimation of the Utilisation of Available Water in a Monoculture Beech Forest and a Mixed Beech-Oak-Linden Forest. Water. 2023; 15(2):285. https://doi.org/10.3390/w15020285
Chicago/Turabian StyleNovosadová, Kateřina, Jiří Kadlec, Štěpánka Řehořková, Marie Matoušková, Josef Urban, and Radek Pokorný. 2023. "Comparison of Rainfall Partitioning and Estimation of the Utilisation of Available Water in a Monoculture Beech Forest and a Mixed Beech-Oak-Linden Forest" Water 15, no. 2: 285. https://doi.org/10.3390/w15020285