
Analysis of Water Resource Carrying Capacity and Obstacle Factors Based on GRA-TOPSIS Evaluation Method in Manas River Basin

 ,
,  ,
,  , and
, and 
Abstract
1. Introduction
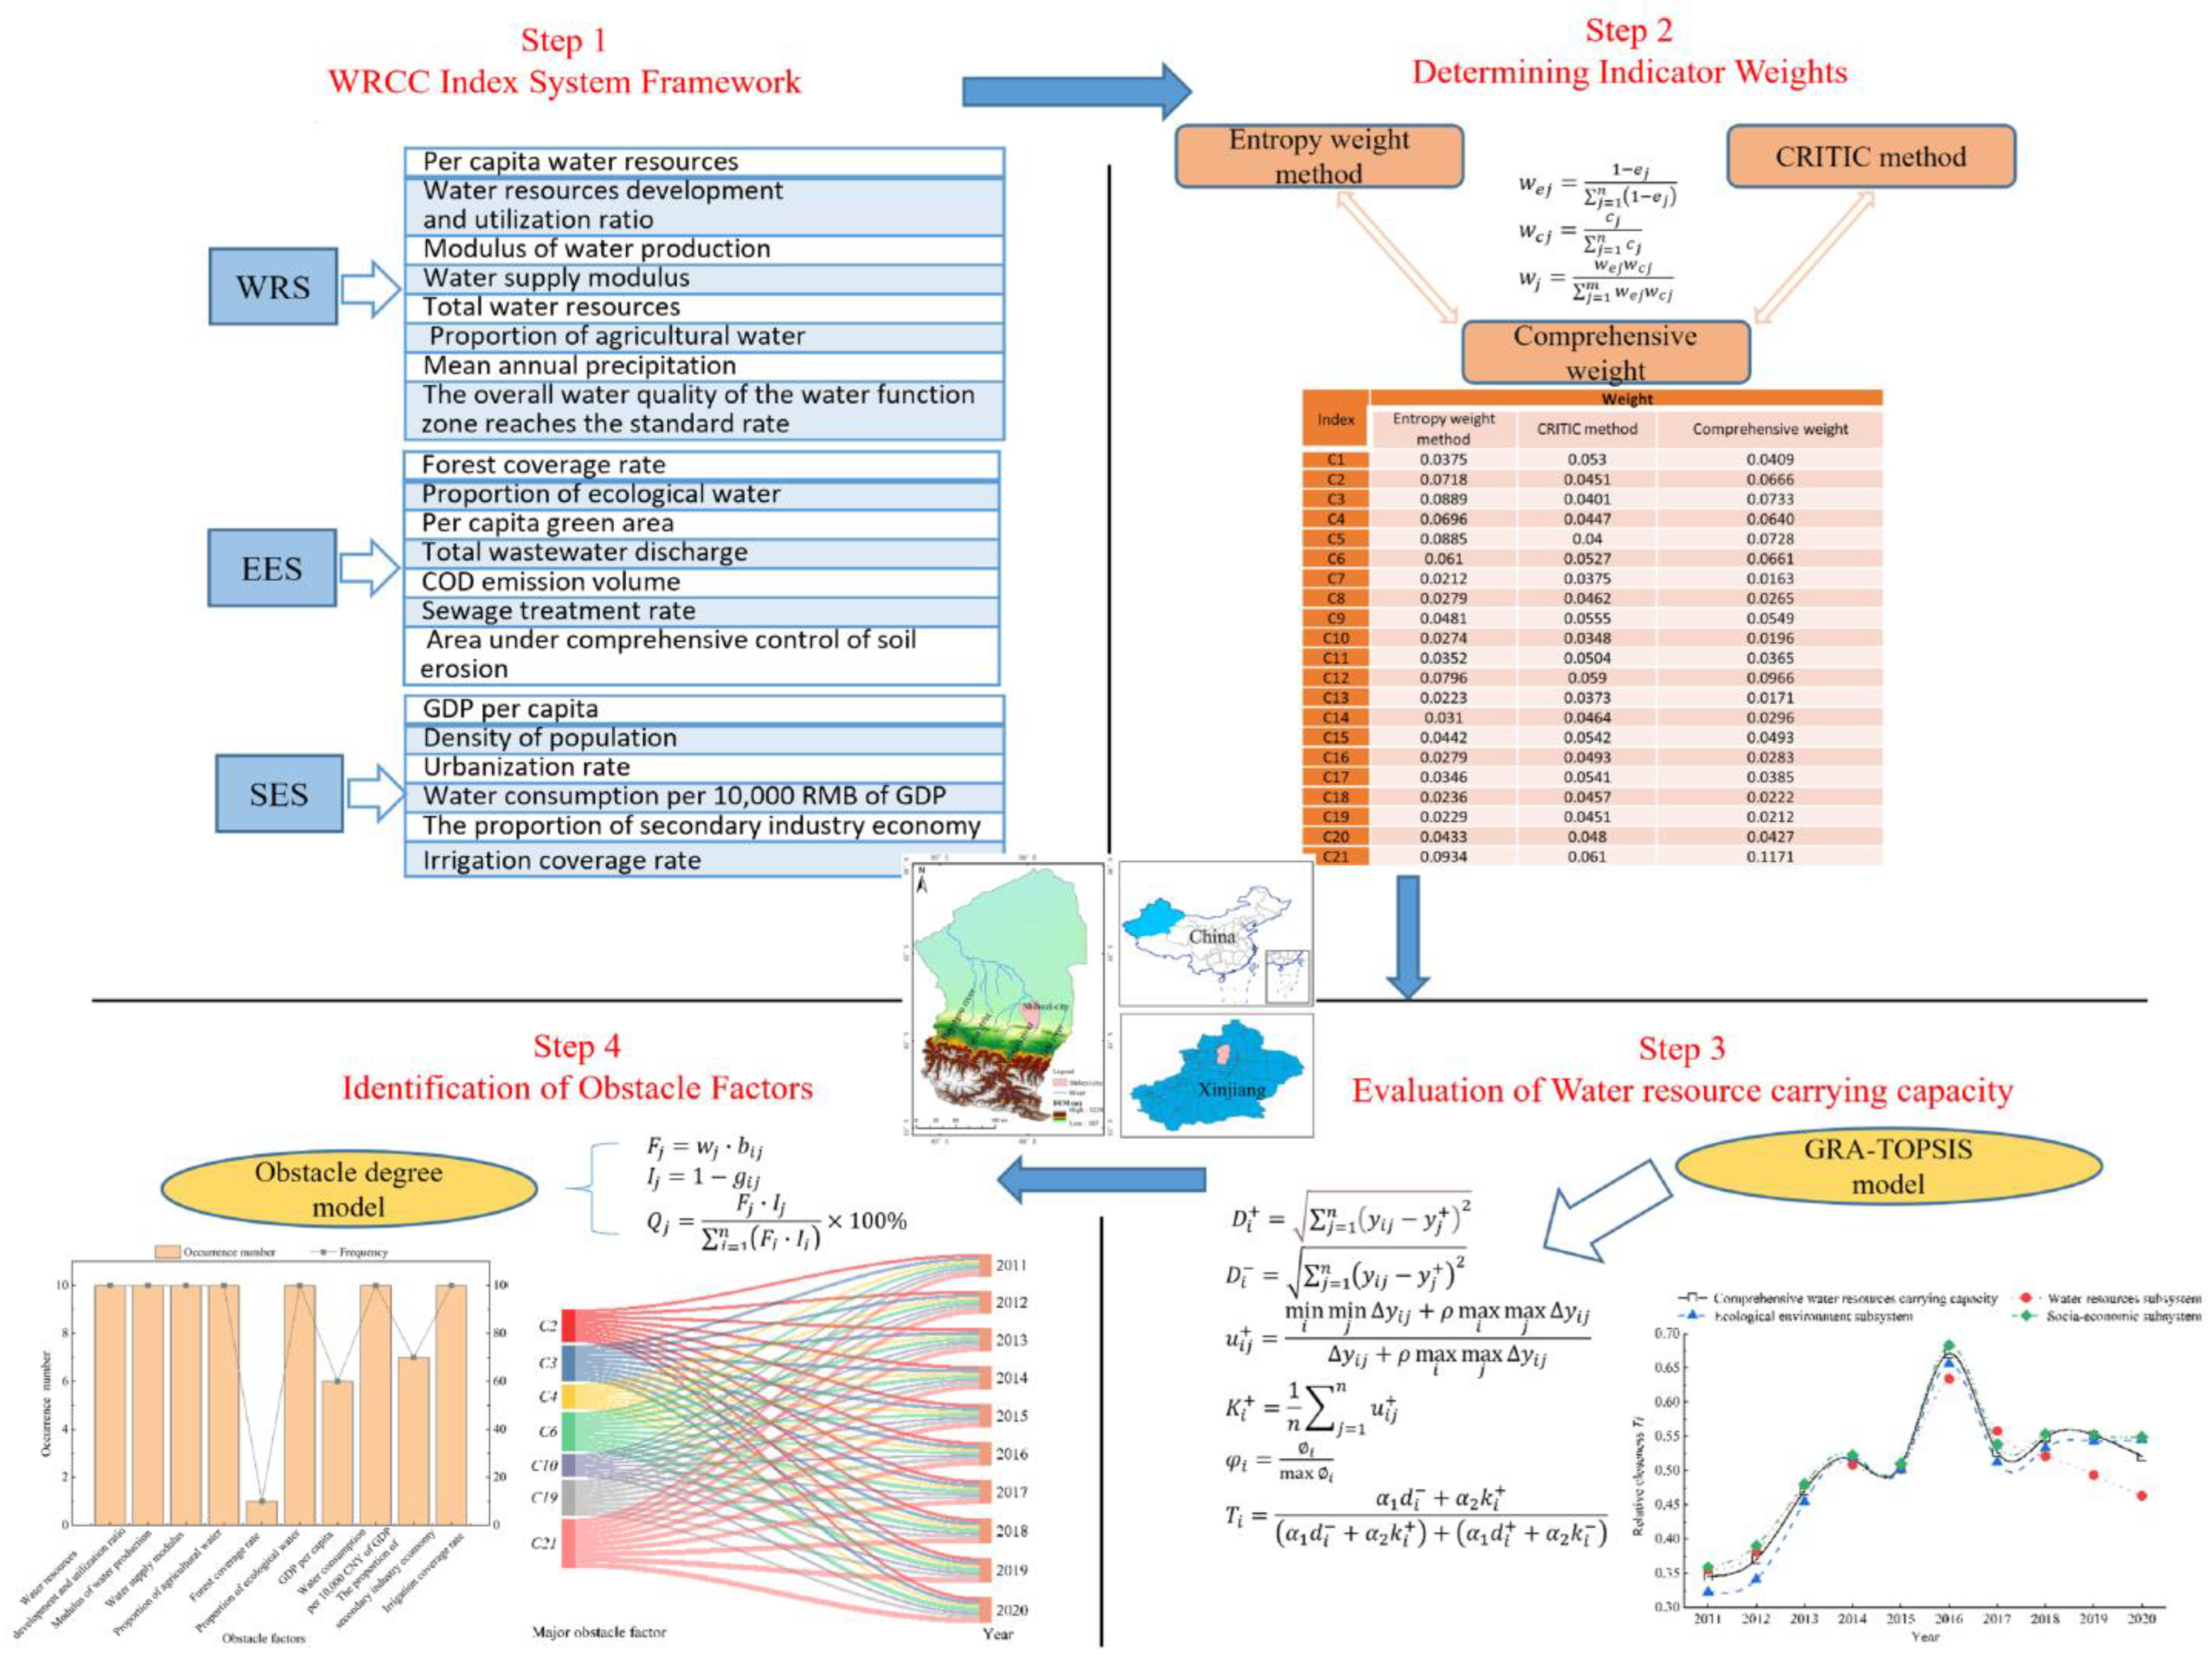
2. Methods
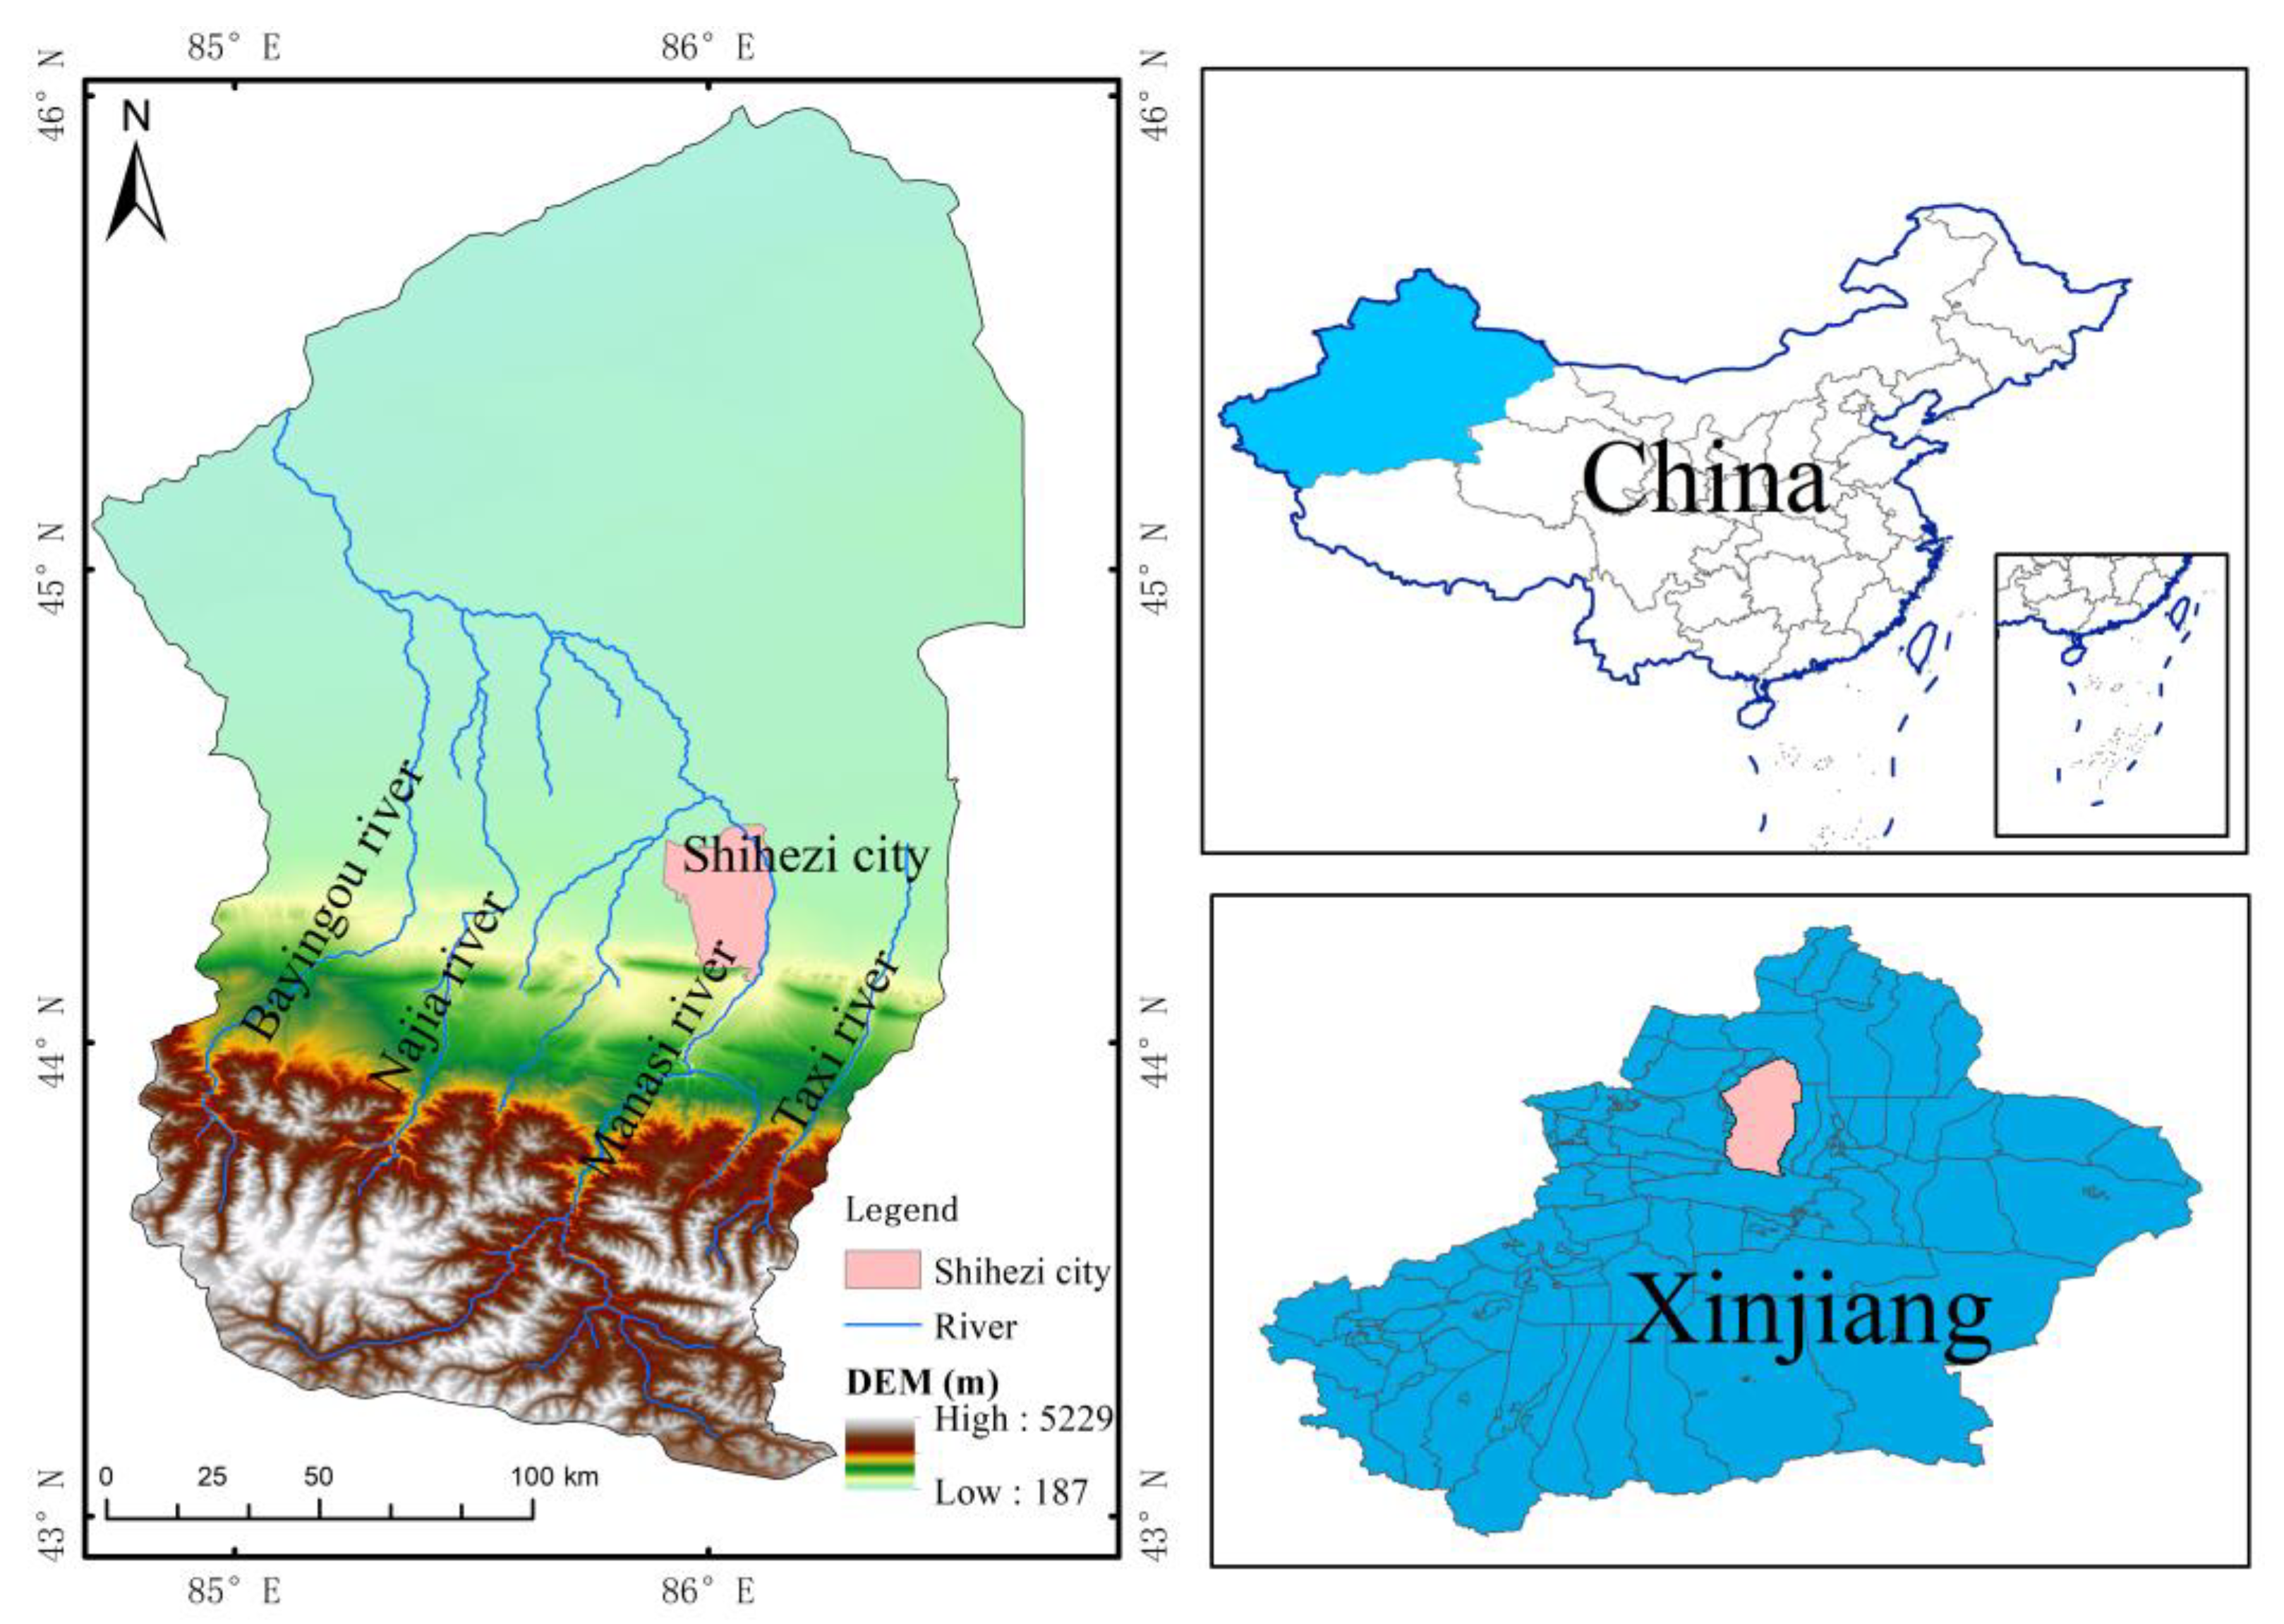
2.1. Overview of the Study Area
2.2. Data Sources
2.3. Research Methods
2.3.1. Index Standardization
2.3.2. Determination of Indicator Weights
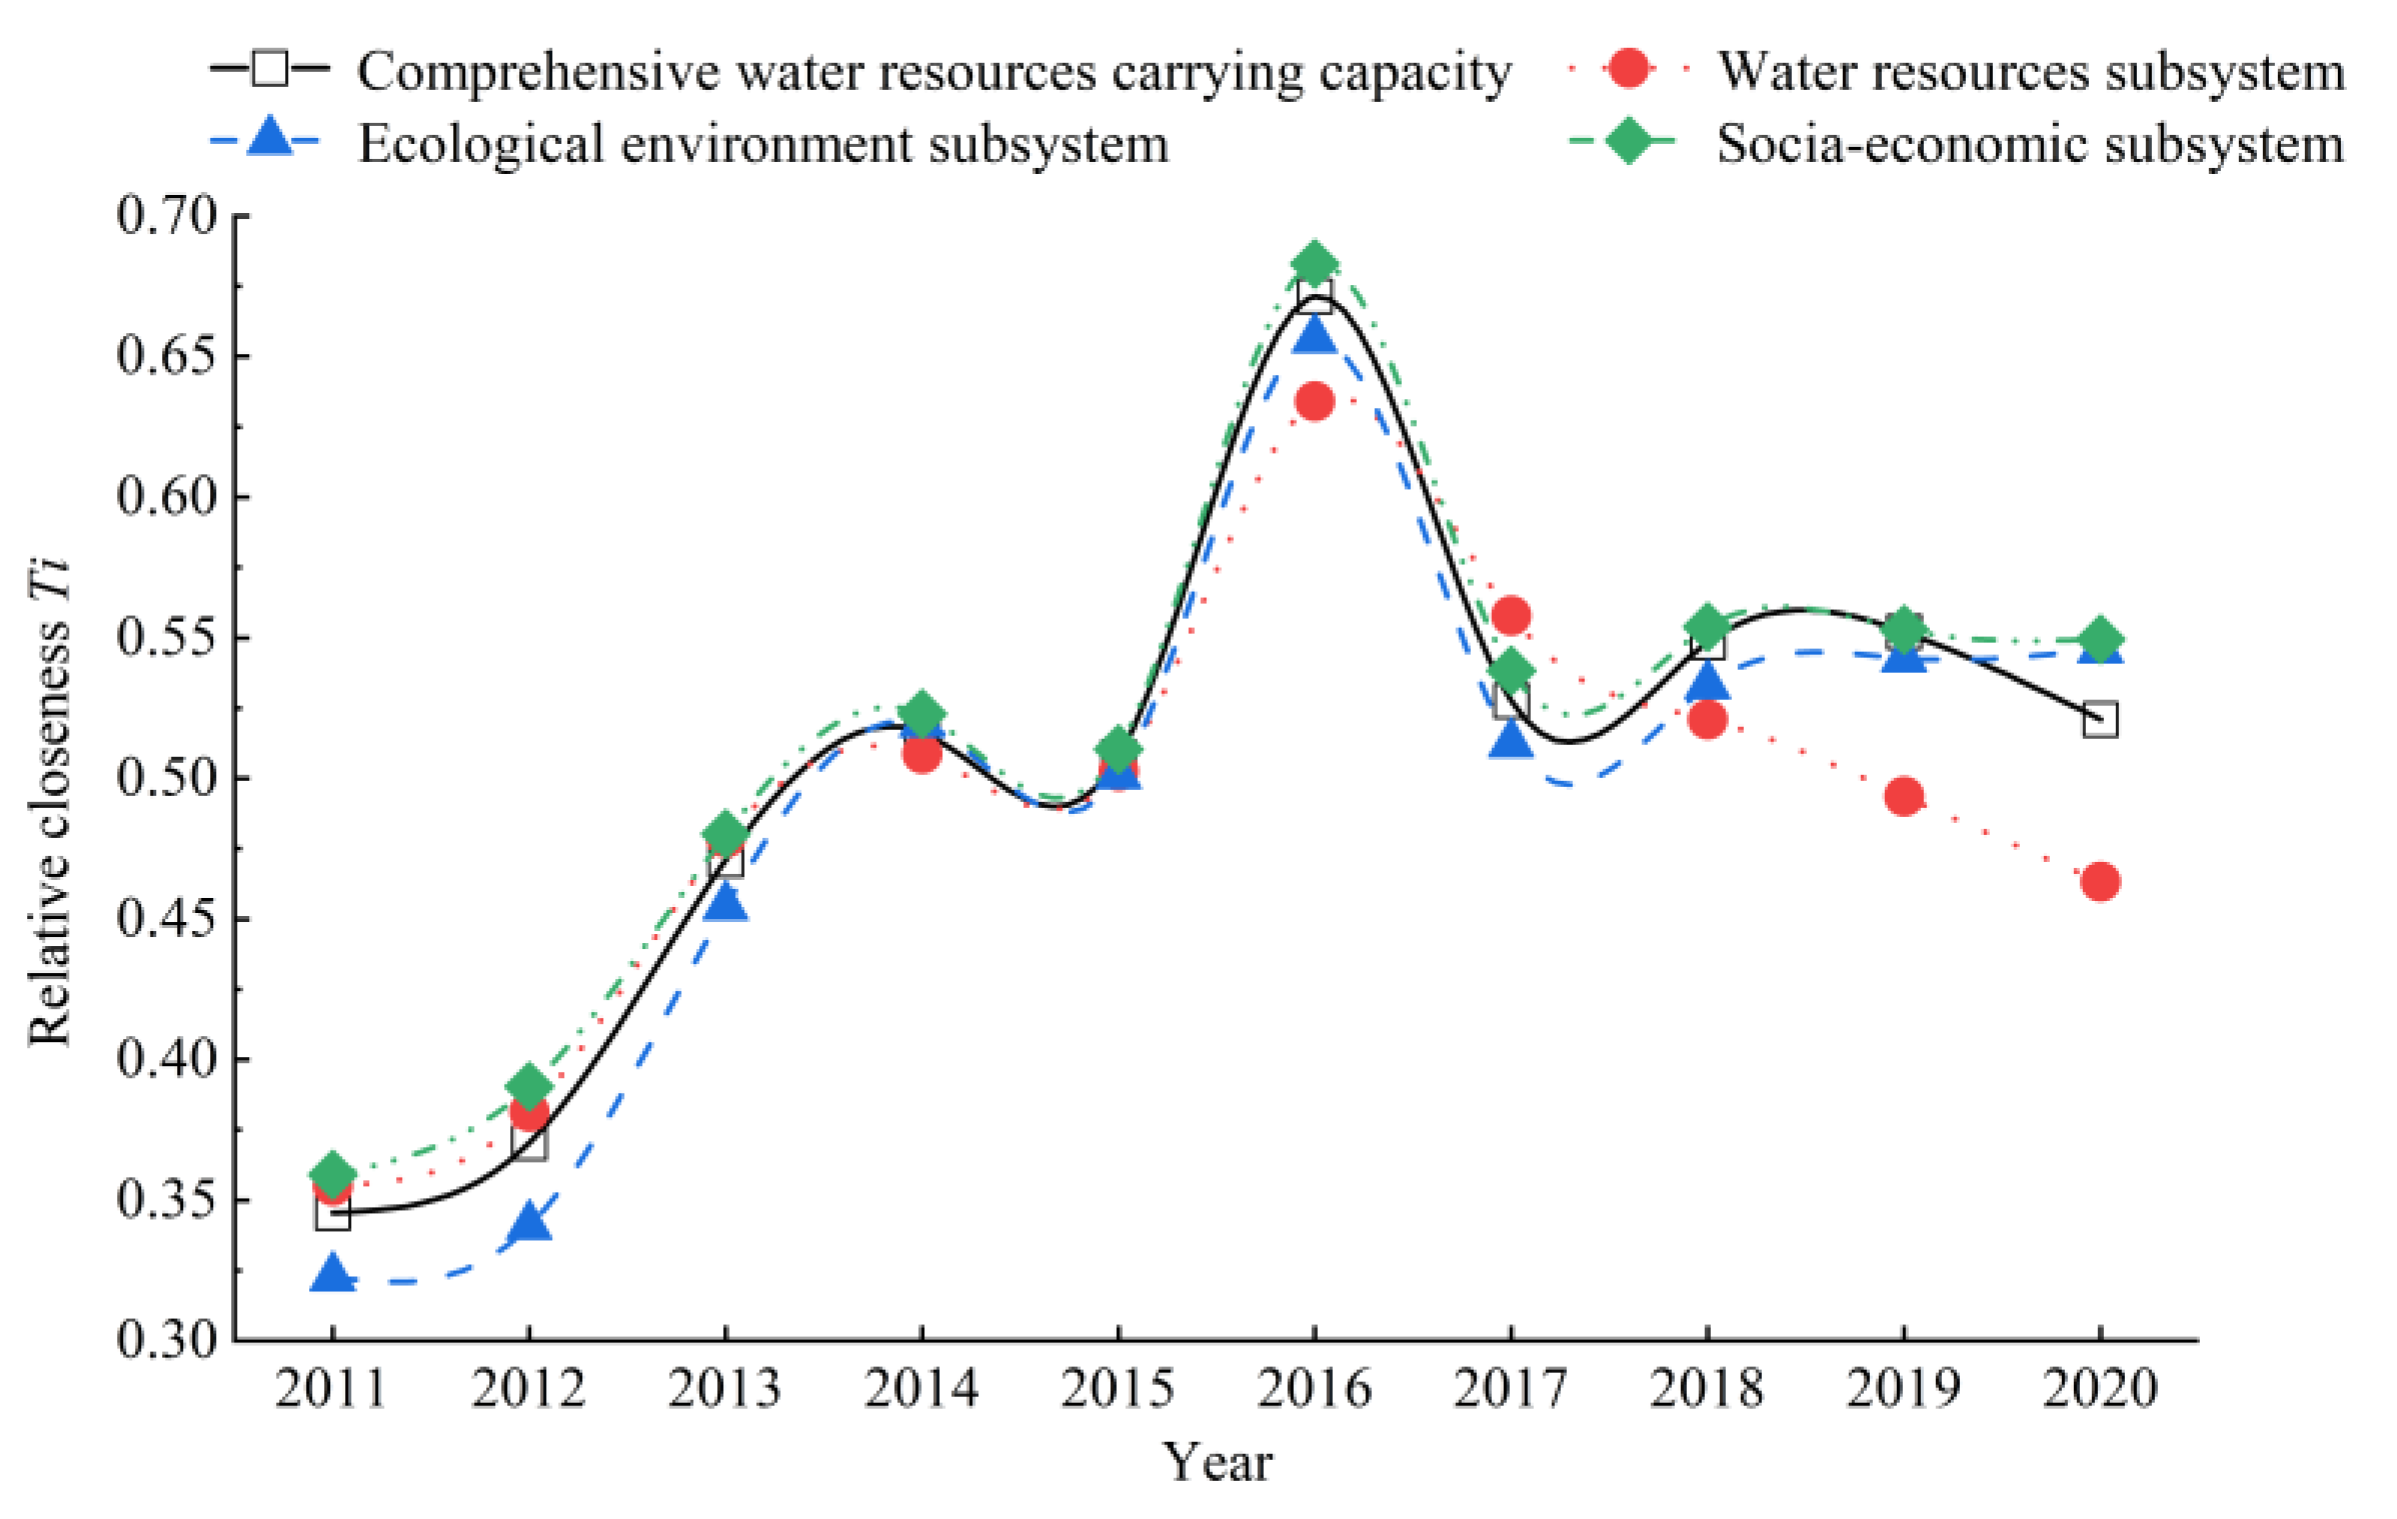
2.3.3. GRA-TOPSIS Model
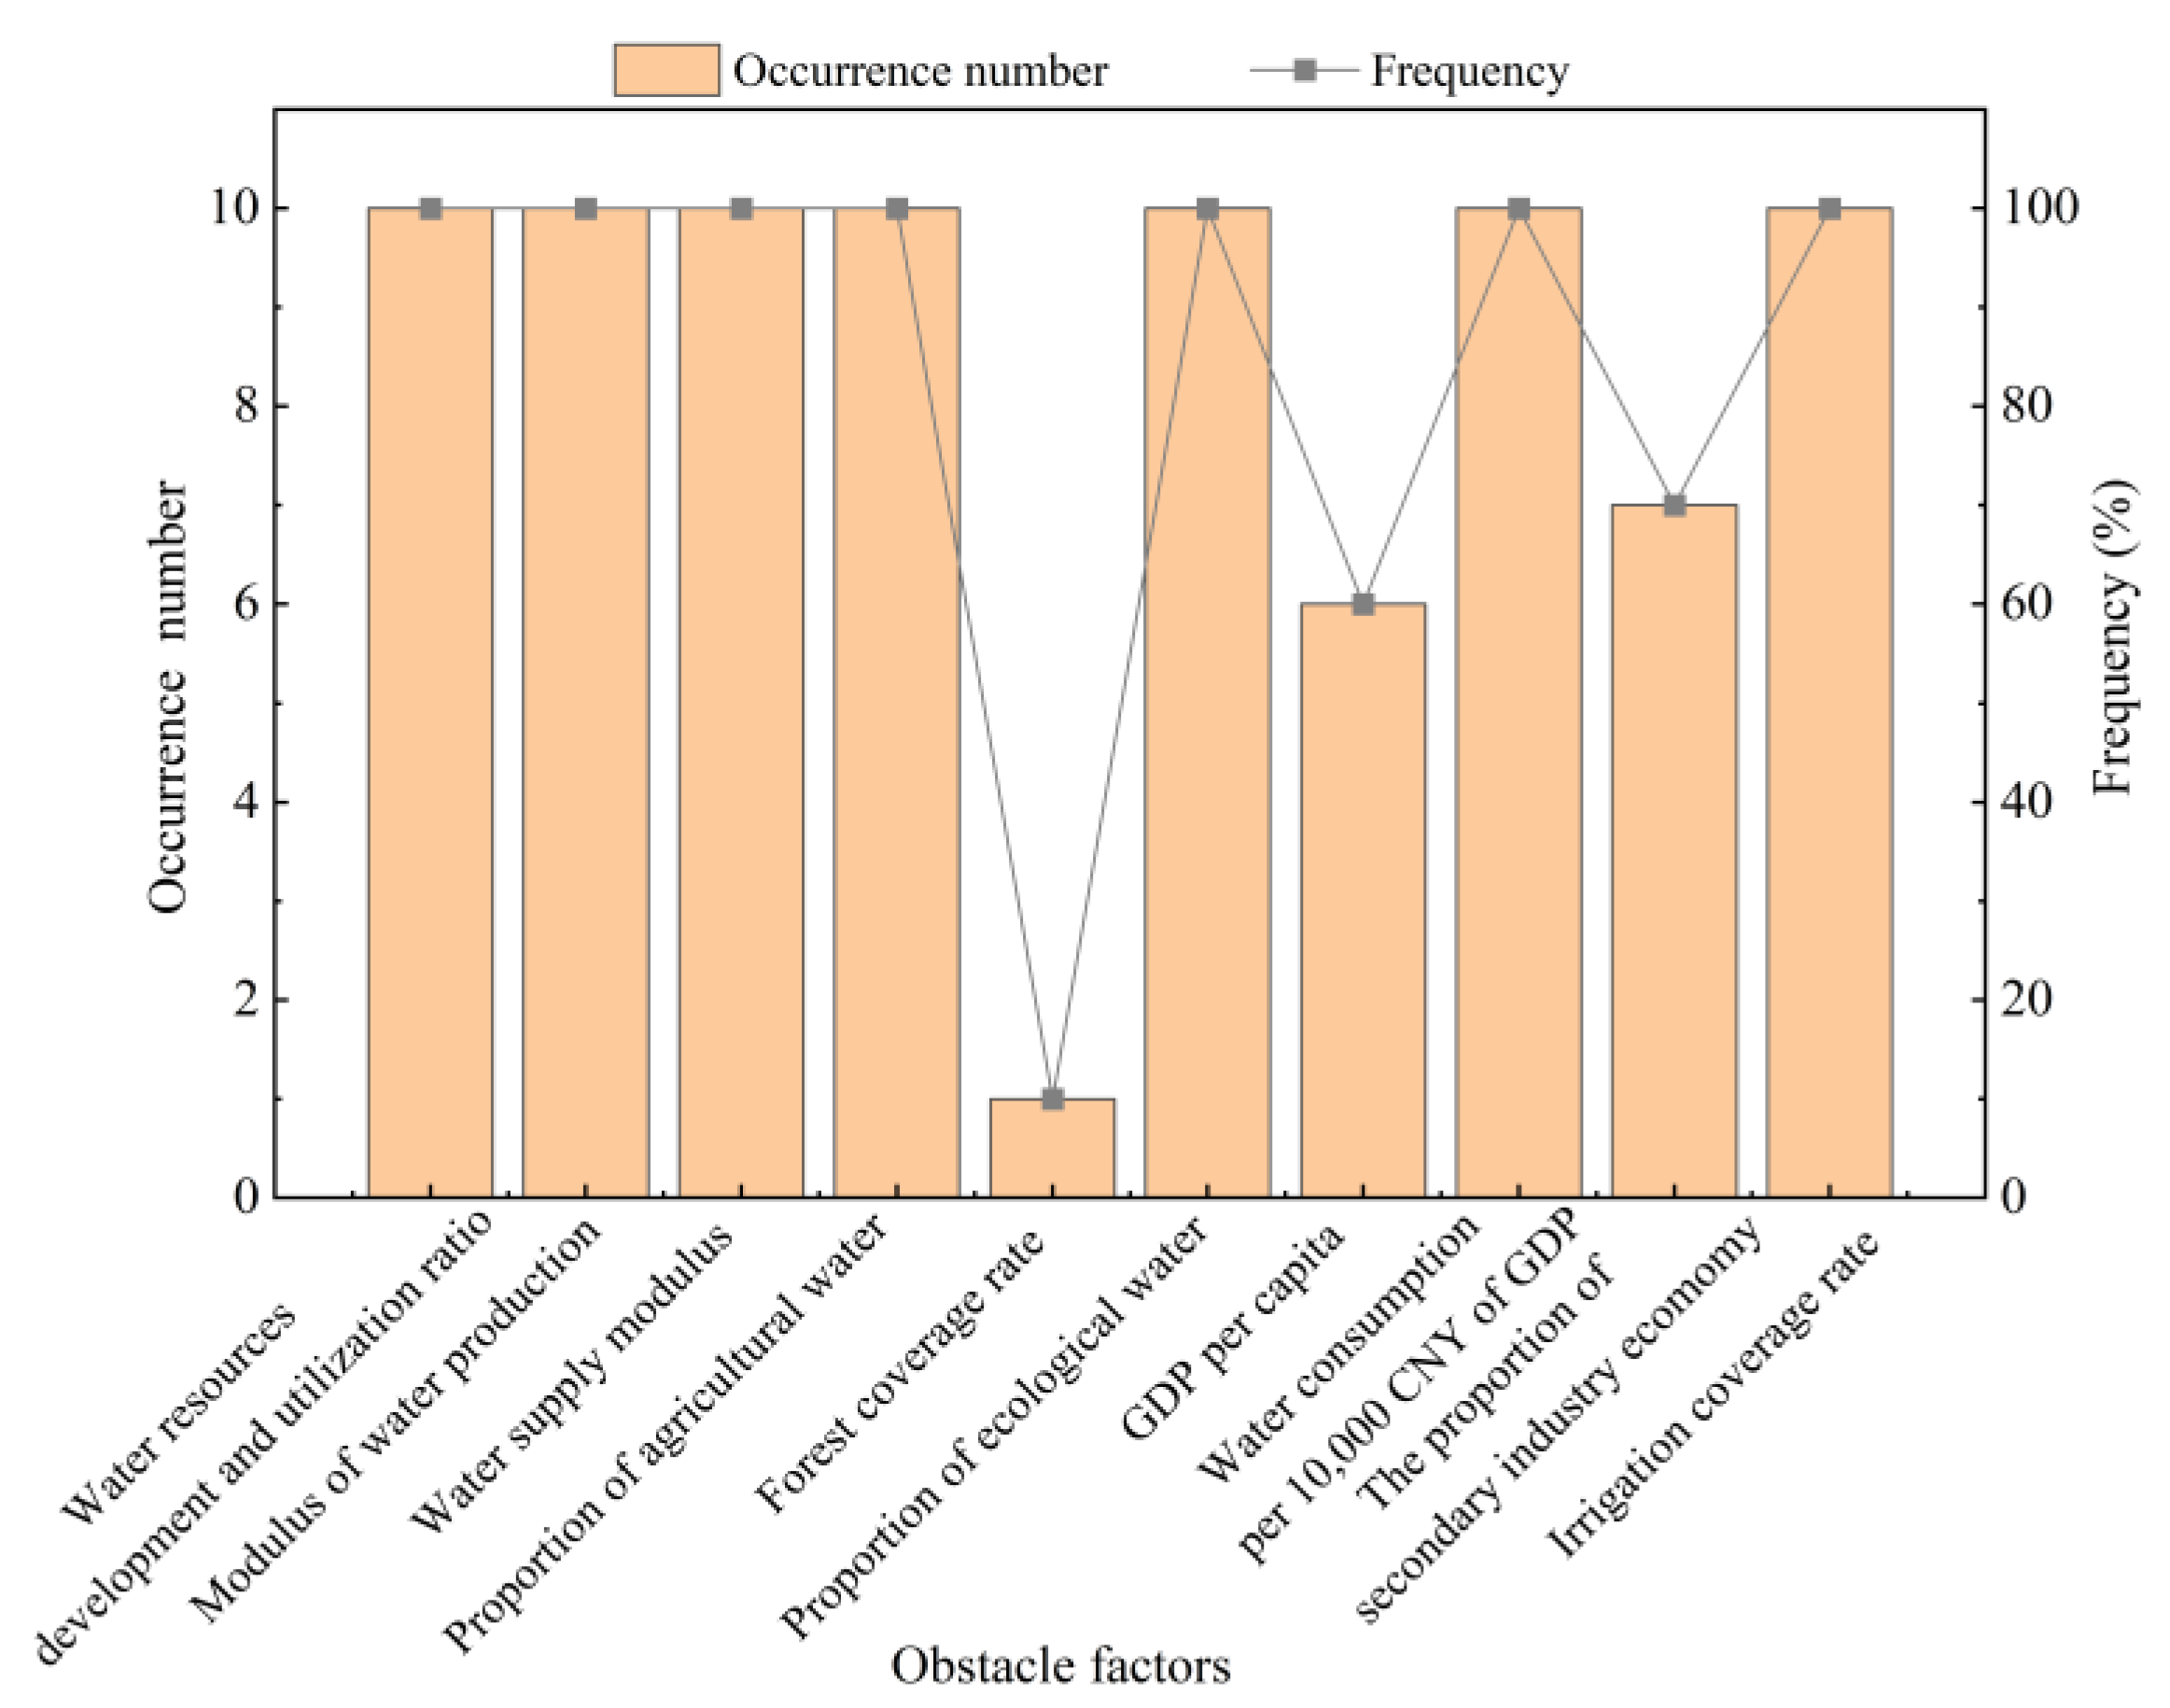
2.3.4. Obstacle Degree Model
3. Results and Analysis
3.1. Evaluation Index System
3.2. Evaluation of WRCC of Oasis Cities in MRB
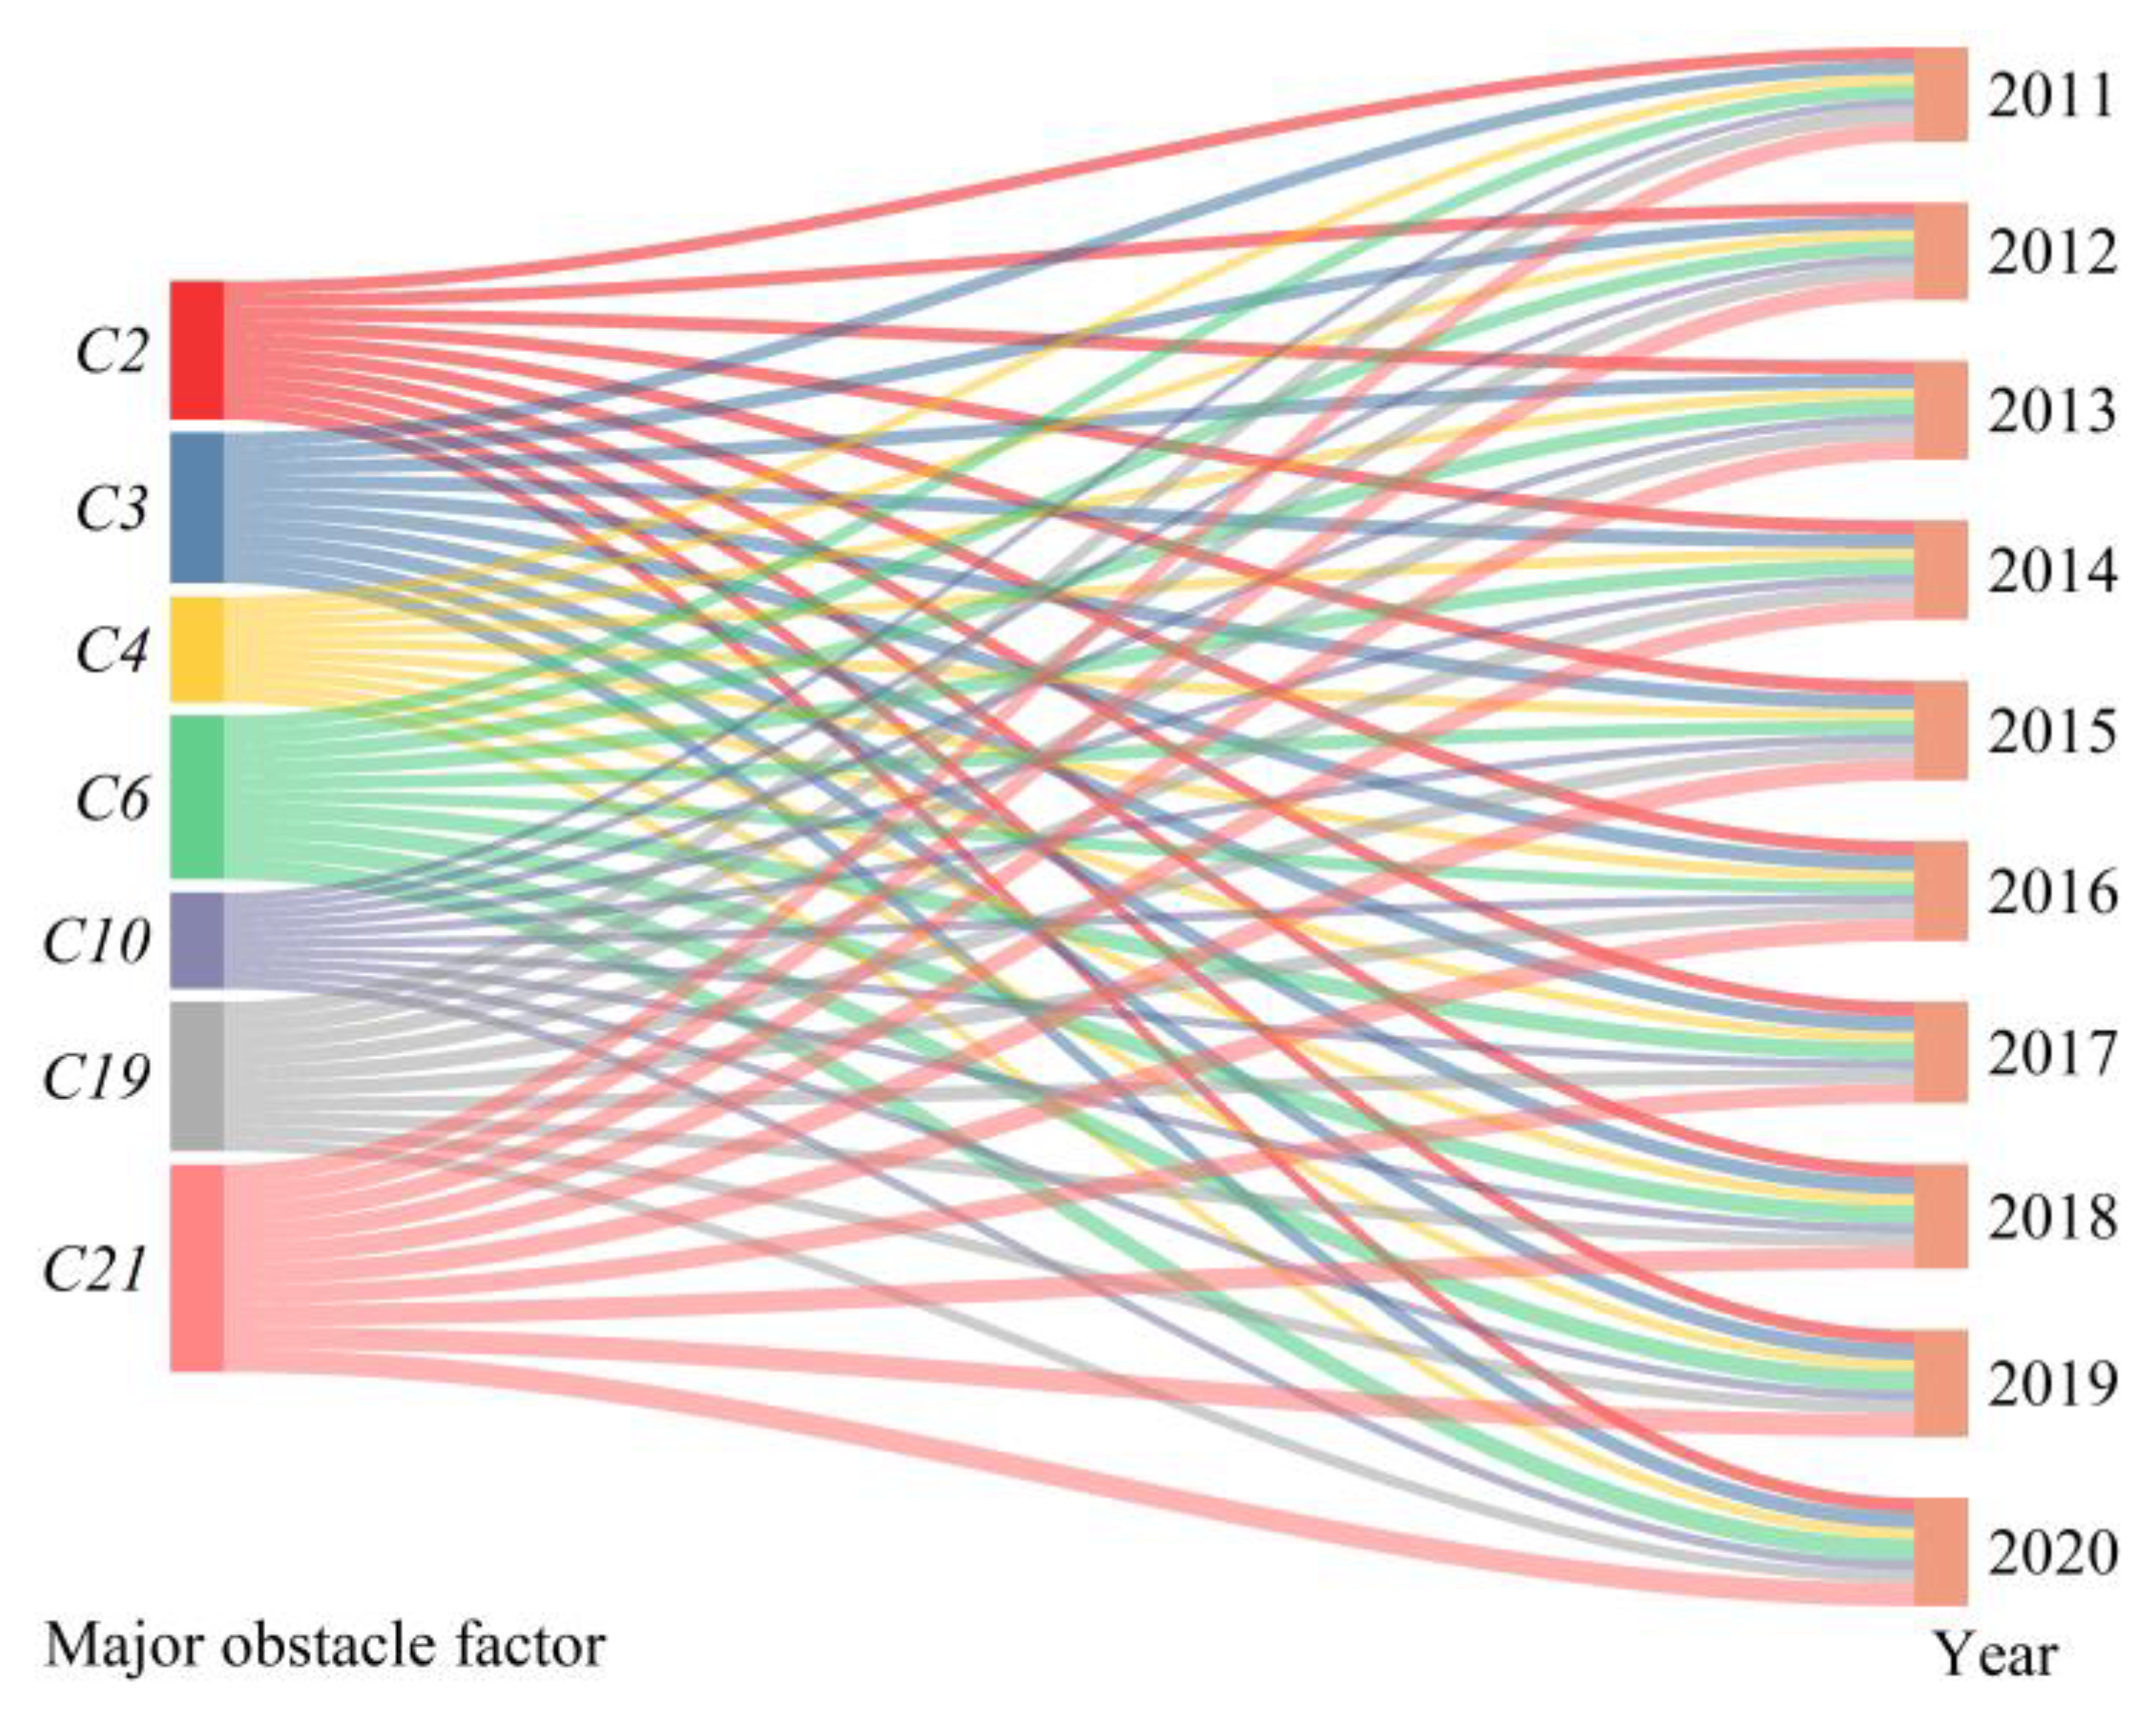
3.3. Obstacle Factor Analysis of WRCC of Oasis Cities in MRB
4. Discussion
5. Conclusions
Author Contributions
Funding
Data Availability Statement
Acknowledgments
Conflicts of Interest
References
- Zuo, Q.; Guo, J.; Ma, J.; Cui, G.; Yang, R.; Yu, L. Assessment of regional-scale water resources carrying capacity based on fuzzy multiple attribute decision-making and scenario simulation. Ecol. Indic. 2021, 130, 108034. [Google Scholar] [CrossRef]
- Wu, X.L.; Hu, F. Analysis of ecological carrying capacity using a fuzzy comprehensive evaluation method. Ecol. Indic. 2020, 113, 106243. [Google Scholar] [CrossRef]
- Wu, Y.; Ma, Z.Y.; Li, X.; Sun, L.; Sun, S.H.; Jia, R.B. Assessment of water resources carrying capacity based on fuzzy comprehensive evaluation—Case study of Jinan, China. Water Supply 2021, 21, 513–524. [Google Scholar] [CrossRef]
- Lv, A.; Han, Y.; Zhu, W.B.; Zhang, S.F.; Zhao, W.H. Risk Assessment of Water Resources Carrying Capacity in China. J. Am. Water Resour. Assoc. 2021, 57, 539–551. [Google Scholar] [CrossRef]
- Engelman, R.; Leroy, P.J.W.D. population and the future of renewable water supplies. Sustain. Water 1993, 23, 296. [Google Scholar]
- Rijsberman, M.A.; Van de Ven, F.H. Different approaches to assessment of design and management of sustainable urban water systems. Environ. Impact Assess. Rev. 2000, 20, 333–345. [Google Scholar] [CrossRef]
- Koop, S.; Leeuwen, C.J. Assessment of the Sustainability of Water Resources Management: A Critical Review of the City Blueprint Approach. Water Resour. Manag. 2015, 29, 5649–5670. [Google Scholar] [CrossRef]
- Liu, B.; Qin, X.; Zhang, F. System-dynamics-based scenario simulation and prediction of water carrying capacity for China. Sustain. Cities Soc. 2022, 82. [Google Scholar] [CrossRef]
- Yue, Q.M.; Wen, Q.; He, Y.; Wang, Q.Y. Influence of water ecological civilization city construction on urban water ecological carrying capacity: A case study of Wuhan City. Acta Ecol. Sin. 2021, 41, 5586–5597. (In Chinese) [Google Scholar]
- Yang, Y.; Hou, K.X.; Yue, W.F.; Ye, W. Water resource carrying capacity as judged by interaction of composite system. J. Beijing Norm. Univ. (Nat. Sci.) 2019, 55, 669–676. (In Chinese) [Google Scholar] [CrossRef]
- Zeng, X.; Li, T.; Chen, C.; Si, Z.; Huang, G.; Guo, P.; Zhuang, X. A hybrid land-water-environment model for identification of ecological effect and risk under uncertain meteorological precipitation in an agroforestry ecosystem. Sci. Total Environ. 2018, 633, 1613–1628. [Google Scholar] [CrossRef] [PubMed]
- Ma, J.M.; Tuo, Y.F.; Wang, Q.; Wang, F. Evaluation of water resources carrying capacity in Yuannan Province based on GRA-TOPSIS and diagnosis of its obstacle factors. J. Water Resour. Water Eng. 2022, 33, 11–17. (In Chinese) [Google Scholar] [CrossRef]
- Zeng, X.; Chen, C.; Liu, A.; Wei, H.; Zhang, H.; Huang, G.; Wu, Y.J.J.o.C.P. Planning a sustainable regional irrigated production and forest protection under land and water stresses with multiple uncertainties. J. Clean. Prod. 2018, 188, 751–762. [Google Scholar] [CrossRef]
- Yang, H.Y.; Fu, K.; Sun, X.B.; Tan, Y.N. Comprehensive Evaluation and Obstacle Factor Diagnosis of Water Resources Carrying Capacity in Yantai City Based on CRITIC-GR-TOPSIS Method. Bull. Soil Water Conserv. 2021, 41, 215–221, 305. (In Chinese) [Google Scholar]
- Yang, Y.H.; Liu, Y.; Cao, S.L.; Cheng, Y.F. A Method of Evaluating Water Resource Assets and Liabilities: A Case Study of Jinan City, Shandong Province. Water 2017, 9, 575. [Google Scholar] [CrossRef]
- Kong, X.; Zeng, X.; Chen, C.; Fan, Y.; Huang, G.; Li, Y.; Wang, C. Development of a Maximum Entropy-Archimedean Copula-Based Bayesian Network Method for Streamflow Frequency Analysis—A Case Study of the Kaidu River Basin, China. Water 2018, 11, 42. [Google Scholar] [CrossRef]
- Liu, R.; Dong, X.; Wang, X.-c.; Zhang, P.; Liu, M.; Zhang, Y. Study on the relationship among the urbanization process, ecosystem services and human well-being in an arid region in the context of carbon flow: Taking the Manas river basin as an example. Ecol. Indic. 2021, 132, 108248. [Google Scholar] [CrossRef]
- Jang, Y.C.; Li, Y.X. Analysis and Countermeasures of the Current Situation of the Development and Utilization of Water Resources in Shihezi City of the Eighth Division. Shaanxi Water Resour. 2020, 53–57. (In Chinese) [Google Scholar] [CrossRef]
- Yang, G.; Tian, L.; Li, X.; He, X.; Gao, Y.; Li, F.; Xue, L.; Li, P. Numerical assessment of the effect of water-saving irrigation on the water cycle at the Manas River Basin oasis, China. Sci Total Env. 2020, 707, 135587. [Google Scholar] [CrossRef]
- Abdel-Basset, M.; Mohamed, R. A novel plithogenic TOPSIS- CRITIC model for sustainable supply chain risk management. J. Clean. Prod. 2020, 247, 119586. [Google Scholar] [CrossRef]
- Li, M.; Sun, H.; Singh, V.P.; Zhou, Y.; Ma, M. Agricultural Water Resources Management Using Maximum Entropy and Entropy-Weight-Based TOPSIS Methods. Entropy 2019, 21, 364. [Google Scholar] [CrossRef] [PubMed]
- Krishnan, A.R.; Kasim, M.M.; Hamid, R.; Ghazali, M.F. A Modified CRITIC Method to Estimate the Objective Weights of Decision Criteria. Symmetry 2021, 13, 973. [Google Scholar] [CrossRef]
- Zhong, X.F.; Li, L.H.; Xu, H. A research on measure of regional agricultural economic development level based on Entropy-CRITIC method and K-Means. Acad. J. Bus. Manag. 2022, 4. [Google Scholar] [CrossRef]
- Wang, T.; Chen, J.S.; Li, L. Entropy analysis of stable isotopes in precipitation: Tracing the monsoon systems in China. Sci. Rep. 2016, 6, 30389. [Google Scholar] [CrossRef] [PubMed][Green Version]
- Li, X. TOPSIS model with entropy weight for eco geological environmental carrying capacity assessment. Microprocess. Microsyst. 2021, 82, 103805. [Google Scholar] [CrossRef]
- Ebrahimi, M.; Rahmani, D. A five-dimensional approach to sustainability for prioritizing energy production systems using a revised GRA method: A case study. Renew. Energy 2019, 135, 345–354. [Google Scholar] [CrossRef]
- Quan, H.; Li, S.; Wei, H.; Hu, J. Personalized Product Evaluation Based on GRA-TOPSIS and Kansei Engineering. Symmetry 2019, 11, 867. [Google Scholar] [CrossRef]
- Zhong, S.; Yang, K.; Wang, Y.; Song, G. A Novel Evaluation Method of Hydrogen Production from Coal Based on AHP and GRA-TOPSIS. Adv. Civ. Eng. 2021, 2021, 1–9. [Google Scholar] [CrossRef]
- Wang, D.; Li, Y.; Yang, X.; Zhang, Z.; Gao, S.; Zhou, Q.; Zhuo, Y.; Wen, X.; Guo, Z. Evaluating urban ecological civilization and its obstacle factors based on integrated model of PSR-EVW-TOPSIS: A case study of 13 cities in Jiangsu Province, China. Ecol. Indic. 2021, 133, 108431. [Google Scholar] [CrossRef]
- Qian, X.Y.; Liang, Q.M. Sustainability evaluation of the provincial water-energy-food nexus in China: Evolutions, obstacles, and response strategies. Sustain. Cities Soc. 2021, 75, 103332. [Google Scholar] [CrossRef]
- Liu, P.; Lü, S.; Han, Y.; Wang, F.; Tang, L. Comprehensive evaluation on water resources carrying capacity based on water-economy-ecology concept framework and EFAST-cloud model: A case study of Henan Province, China. Ecol. Indic. 2022, 143, 109392. [Google Scholar] [CrossRef]
- Cheng, G.B.; Zheng, W.F. Empirical Analysis of the Water Resources Carrying Capacity of the Urban Agglomerations in the Northwest China. J. Shihezi Univ. Philos. Soc. Sci. 2017, 31, 73–82. (In Chinese) [Google Scholar] [CrossRef]


| Target Layer | Standard Layer | Index Layer | Unit | Weight | ||
|---|---|---|---|---|---|---|
| Entropy Weight Method | CRITIC Method | Comprehensive Weight | ||||
| WRCC | Water Resource Subsystem B1 | Per capita water resources C1 | m3/person | 0.0375 | 0.053 | 0.0409 |
| Water resource development and utilization ratio C2 | % | 0.0718 | 0.0451 | 0.0666 | ||
| Modulus of water production C3 | 104 m3/km2 | 0.0889 | 0.0401 | 0.0733 | ||
| Water supply modulus C4 | 104 m3/km2 | 0.0696 | 0.0447 | 0.0640 | ||
| Total water resources C5 | 108 m3 | 0.0885 | 0.04 | 0.0728 | ||
| Proportion of agricultural water C6 | % | 0.061 | 0.0527 | 0.0661 | ||
| Mean annual precipitation C7 | mm | 0.0212 | 0.0375 | 0.0163 | ||
| The overall water quality of the water function zone reaches the standard rate C8 | % | 0.0279 | 0.0462 | 0.0265 | ||
| Ecological environment Subsystem B2 | Forest coverage rate C9 | % | 0.0481 | 0.0555 | 0.0549 | |
| Proportion of ecological water C10 | % | 0.0274 | 0.0348 | 0.0196 | ||
| Per capita green area C11 | m2 | 0.0352 | 0.0504 | 0.0365 | ||
| Total wastewater discharge C12 | 104 t | 0.0796 | 0.059 | 0.0966 | ||
| COD emission volume C13 | 104 t | 0.0223 | 0.0373 | 0.0171 | ||
| Sewage treatment rate C14 | % | 0.031 | 0.0464 | 0.0296 | ||
| Area under comprehensive control of soil erosion C15 | 103 hm2 | 0.0442 | 0.0542 | 0.0493 | ||
| Socio- economic subsystem B3 | GDP per capita C16 | yuan | 0.0279 | 0.0493 | 0.0283 | |
| Density of population C17 | person/km2 | 0.0346 | 0.0541 | 0.0385 | ||
| Urbanization rate C18 | % | 0.0236 | 0.0457 | 0.0222 | ||
| Water consumption per 10,000 CNY of GDP C19 | m3 | 0.0229 | 0.0451 | 0.0212 | ||
| The proportion of secondary industry economy C20 | % | 0.0433 | 0.048 | 0.0427 | ||
| Irrigation coverage rate C21 | % | 0.0934 | 0.061 | 0.1171 | ||
Disclaimer/Publisher’s Note: The statements, opinions and data contained in all publications are solely those of the individual author(s) and contributor(s) and not of MDPI and/or the editor(s). MDPI and/or the editor(s) disclaim responsibility for any injury to people or property resulting from any ideas, methods, instructions or products referred to in the content. |
© 2023 by the authors. Licensee MDPI, Basel, Switzerland. This article is an open access article distributed under the terms and conditions of the Creative Commons Attribution (CC BY) license (https://creativecommons.org/licenses/by/4.0/).
Share and Cite
Gulishengmu, A.; Yang, G.; Tian, L.; Pan, Y.; Huang, Z.; Xu, X.; Gao, Y.; Li, Y. Analysis of Water Resource Carrying Capacity and Obstacle Factors Based on GRA-TOPSIS Evaluation Method in Manas River Basin. Water 2023, 15, 236. https://doi.org/10.3390/w15020236
Gulishengmu A, Yang G, Tian L, Pan Y, Huang Z, Xu X, Gao Y, Li Y. Analysis of Water Resource Carrying Capacity and Obstacle Factors Based on GRA-TOPSIS Evaluation Method in Manas River Basin. Water. 2023; 15(2):236. https://doi.org/10.3390/w15020236
Chicago/Turabian StyleGulishengmu, Anfuding, Guang Yang, Lijun Tian, Yue Pan, Zhou Huang, Xingang Xu, Yongli Gao, and Yi Li. 2023. "Analysis of Water Resource Carrying Capacity and Obstacle Factors Based on GRA-TOPSIS Evaluation Method in Manas River Basin" Water 15, no. 2: 236. https://doi.org/10.3390/w15020236
APA StyleGulishengmu, A., Yang, G., Tian, L., Pan, Y., Huang, Z., Xu, X., Gao, Y., & Li, Y. (2023). Analysis of Water Resource Carrying Capacity and Obstacle Factors Based on GRA-TOPSIS Evaluation Method in Manas River Basin. Water, 15(2), 236. https://doi.org/10.3390/w15020236