Article

Analysis of the Influence of Water Level Change on the Seepage Field and Stability of a Slope Based on a Numerical Simulation Method

1
College of Water Resources & Civil Engineering, China Agricultural University, Beijing 100083, China
2
Hebei Provincial Communications Planning, Design and Research Institute Co., Ltd., Shijiazhuang 050011, China
3
Land and Resources Exploration Center, Hebei Bureau of Geology and Mineral Resources Exploration, Shijiazhuang 050081, China
4
School of Engineering and Technology, China University of Geosciences, Beijing 100083, China
5
Key Laboratory of Shale Gas and Geoengineering, Institute of Geology and Geophysics, Chinese Academy of Sciences, Beijing 100029, China
*
Author to whom correspondence should be addressed.
Water 2023, 15(2), 216; https://doi.org/10.3390/w15020216
Submission received: 27 October 2022 / Revised: 30 December 2022 / Accepted: 31 December 2022 / Published: 4 January 2023
(This article belongs to the Section Water Erosion and Sediment Transport)

Abstract

:
River floods, dammed lake flood discharge, reservoir discharge, seawater recession, etc. all cause the water level in front of a slope to drop, which changes the original steady-state seepage field in the soil, leading to harmful slope instability. To study this phenomenon, a numerical model was established through theoretical analysis combined with the coupling of the Seep/W and Slope/W modules of the GeoStudio finite element software, and the numerical model was verified by the model test results of indoor medium sand and silt. This paper focuses on the effects when the water level in front of a slope drops at different speeds, different drop ratios, different initial water levels, different filling materials, and matrix suction on the seepage field and slope stability. The conclusions are as follows: (1) the greater the speed at which the water level in front of a slope falls, the greater the downward seepage force formed by the seepage field of the slope to the slope body; (2) the change curve of the safety factor at a higher speed is steeper when the water level falls at different speeds, and the safety factor value when the water level in front of the slope is constant is smaller; (3) the safety factor of the slope decreases with an increase in the drop ratio; when the drop ratio is the same, the loss of stability is worse if the initial water level is lower; (4) when there is a drawdown of water levels in front of the slope, the non-cohesive medium sand slope is more prone to instability failure than the cohesive silt slope; and (5) when this modeling method is applied to matrix suction, the effect of matrix suction increases the safety factor of the slope.

1. Introduction

Landslides are one of the most common geological disasters. In addition to causing heavy economic losses, landslides threaten the lives and safety of the people in the area. Unstable soil slopes cause a large number of landslide accidents [1,2], and 90% of slopes are unstable due to a change in their seepage fields [3]. River flooding [4], dammed lake flood discharge [5], and reservoir discharge [6] can cause the water level to drop in front of a slope. As a result, a large pore water pressure difference is formed between the inside and outside of the slope, which affects slope stability [7,8]. Slopes near rivers and reservoirs are prone to landslides, and there are serious consequences, such as long-distance landslides and flow slip [9,10] because flooding and falling water levels cause unstable seepage fields, and changes in water content within the slope cause the adjustment of matrix suction and slope stress fields [11]. With the construction of a large number of water conservancy projects, slope instability caused by fluctuating water levels has aroused widespread concerns in academic circles [12,13,14,15,16]. There are many methods for analyzing slope stability, including the limit equilibrium method and the finite element method. Many authors [12,17,18,19,20,21,22] have used the traditional limit equilibrium method to analyze the influence of a water level drop on the slope infiltration field and the finite element method to study the influence of a water level drop on stability. Many authors have used the limit equilibrium method to analyze slope stability under different working conditions when the water level falls and studied the unsaturated shear strength model [23,24,25] and the effects of the speed [26,27,28,29] at which the water level drops, the drop height [30,31], and the permeability coefficient [32,33,34] on slope stability. Other authors [34,35] have used the limit equilibrium method to calculate and analyze slope stability based on the two different unsaturated soil shear strength principles of Bishop and Fredlund and compared the results obtained by applying the two different principles. Pakmanesh et al. [36,37,38,39] used the Seep/W module to analyze the seepage field of the slope when the water level drops and verified that the unsaturated model is better at simulating the change in the water level of a dam. A large number of studies [40,41,42,43,44,45,46] calculated the change rule of the slope safety factor when the water level drops using numerical simulation software including Plaxis and FLAC3D and compared the safety factor obtained by transient seepage analysis with that obtained by assuming that the seepage line is a straight line.
Upon analyzing the related research on slope instability caused by falling water levels, it was found that there is little comprehensive research with respect to the influence of different working conditions on the slope seepage field and stability. Therefore, in this study, a numerical model is established through theoretical analysis combined with the coupling of the Seep/W and Slope/W modules in GeoStudio finite element software, and the numerical model is verified by the model test results of indoor medium sand and silt. This paper focuses on the effects when the water level drops at different speeds, different drop ratios, different initial water levels, different filling materials, and matrix suction on the seepage field and slope stability. It provides a reasonable set of reference data to better understand the slope instability caused by a drop in the water level in front of a slope and take more appropriate engineering measures.

2. Unsaturated–Unstable Seepage and Slope Stability Analysis Theory

The drop in the free water level in front of a slope can be divided into three modes [47]: slow drop, sudden drop, and intermediate cases. The pore water pressure in the slope is not able to dissipate quickly when there is a sudden drop or a slow drop–a sudden drop in the water level in front of the slope. As a result, the water level on the slope is higher than that in front of the slope. The penetration force from the inside of the slope to the outside of the slope caused by the pressure difference between the inside and outside of the slope damages the slope, and a landslide accident can occur easily.
The natural flow of water in porous or fractured media such as soil and rock is collectively referred to as seepage. When the soil is saturated, the seepage is stable, and when the soil is unsaturated, the seepage is unstable. Saturated and unsaturated seepage flow is divided into saturated areas and unsaturated areas on the basis of the zero-pressure water headline, that is, the wetting line. Above the wetting line is the unsaturated area, and the pore water pressure shows a negative value, that is, matrix suction. Below the wetting line is the saturated zone, and the pore water pressure is positive. There is a water flow exchange between the saturated zone and the unsaturated zone. Steady seepage means that the basic parameters of seepage at any point in the seepage field do not change with time, and the net flow or the net mass of seepage at any point, that is, the difference between the inflow and the outflow, is equal to zero. Unsteady seepage means that the basic parameters of seepage (water head, velocity, etc.) at any point in the seepage field change with time. The flow rate of seepage through any point is equal to the rate of change of the volume or mass of the fluid flowing into and out of that point over a period of time.
To approximate the falling mode of the water level in front of the slope (from “Seepage Computation Analysis & Control” [47]):
  • When k/μv < 1/10, the wetting surface in the dam still remains about 90% of the total initial water head after the reservoir water level drops.
  • When k/μv > 60, the wetting surface in the dam remains below 10% of the total water head, and the wetting line in the slope is approximately a straight line, which is more consistent with the shape of the wetting line in slow-down mode, and the water level drop is regarded as a slow drop.
  • When the ratio is in the range of 1/10 < k/μv < 60, the mode is the intermediate slow drop–sudden drop category.
In the above, k refers to the slope ratio of the slope, μ is the water supply, and v refers to the speed at which the free water level is falling.
The subsequent research in this paper is based on the water level in the slope lagging behind the head value outside the slope proposed in Ref. [40] to approximately determine the landing mode of the water level in front of the slope.
Free-water level fall will change the original stable seepage field in the slope into an unstable seepage field, and the original saturated area in the slope will also transition into an unsaturated area with time, thus affecting slope stability. At present, the most widely used slope stability analysis method is the limit equilibrium method, which adopts the idea of the slice method: assume several potential slip surfaces, determine the safety factor relative to these slip surfaces, and compare the minimum safety factor corresponding to the most dangerous slip surface. In this paper, the limit equilibrium method is mainly used to analyze slope stability. To analyze slope stability when the water level in front of the slope is falling, first, analyze the unsaturated and unstable seepage field in the slope to determine the position of the infiltration line. Then, taking the infiltration line as the boundary, consider the influence of the change in water content on the matrix suction and weight of the soil.
The natural weight γ of the soil in the calculation can be calculated using the porosity n and the soil weight γ s :
γ = ( 1 n ) γ s + n s w γ w
In the formula, s w is the saturation; γ w is saturated gravity.
When the sliding surface of the slope is above the wetting line, it is in the unsaturated zone. Considering the influence of the unsaturated zone in the process of the water level falling, the safety factor of the slope F s can be calculated by the following formula [48]:
F s = c i l i + n 1 tan φ i b i γ h 1 i + γ s a t h 2 i cos θ i p w i l i + n 2 tan φ i b i γ h cos θ i p w i l i n 1 b i γ h 1 i + γ s a t h 2 i sin θ i + n 2 b i γ h i sin θ i
In the formula, n 1 represents the number of soil strips on the slip surface below the wetting line; n 2 represents the number of soil strips on the slip surface above the wetting line; θ is the inclination angle of the bottom surface of the soil strip; h1i is the average height of the first soil strip; h2i is the average height of the second soil strip; bi is the width of the soil strip; p w i is the pore water pressure; li is the arc length of the i-th soil strip; γ is the natural weight of the soil; and γ s a t is the saturated weight of the soil. The symbols in the formula are shown in the calculation diagram of the safety factor in Figure 1.

3. Design and Verification of Model Tests and Numerical Simulations

3.1. Slope Model Test

In a model test, the research object is converted into a similar small-scale model and the results obtained from the model test help to indirectly infer the corresponding changes that may occur in the simulated prototype.
In our study, the model test was carried out in a box 2.5 m in length, 1.0 m in width, and 1.2 m in height. The front end of the box was evenly opened with four water outlet holes 2 cm in diameter, and the front end was connected with a rotor water meter with a flow rate of 5 L/h to control the speed at which the water level fell (Figure 2). In this test, we used a micro earth pressure sensor with a diameter of 30 mm, a thickness of 7 mm, and a range of 0.1 MPa and a micro-osmometer with a diameter of 30 mm, a thickness of 6 mm, and a range of 0.05 MPa. In addition, we used a high-definition digital camera to observe the displacement of the marker points when landslide failure occurred. In the model test, medium sand and silt were selected as the materials for simulation (Figure 3).
Its basic physical property distribution was obtained through indoor geotechnical tests, see Table 1.
The medium sand slope and the silt slope were layered by the unified control density method. Part of the working conditions involved in the model test in this paper is shown in Table 2.
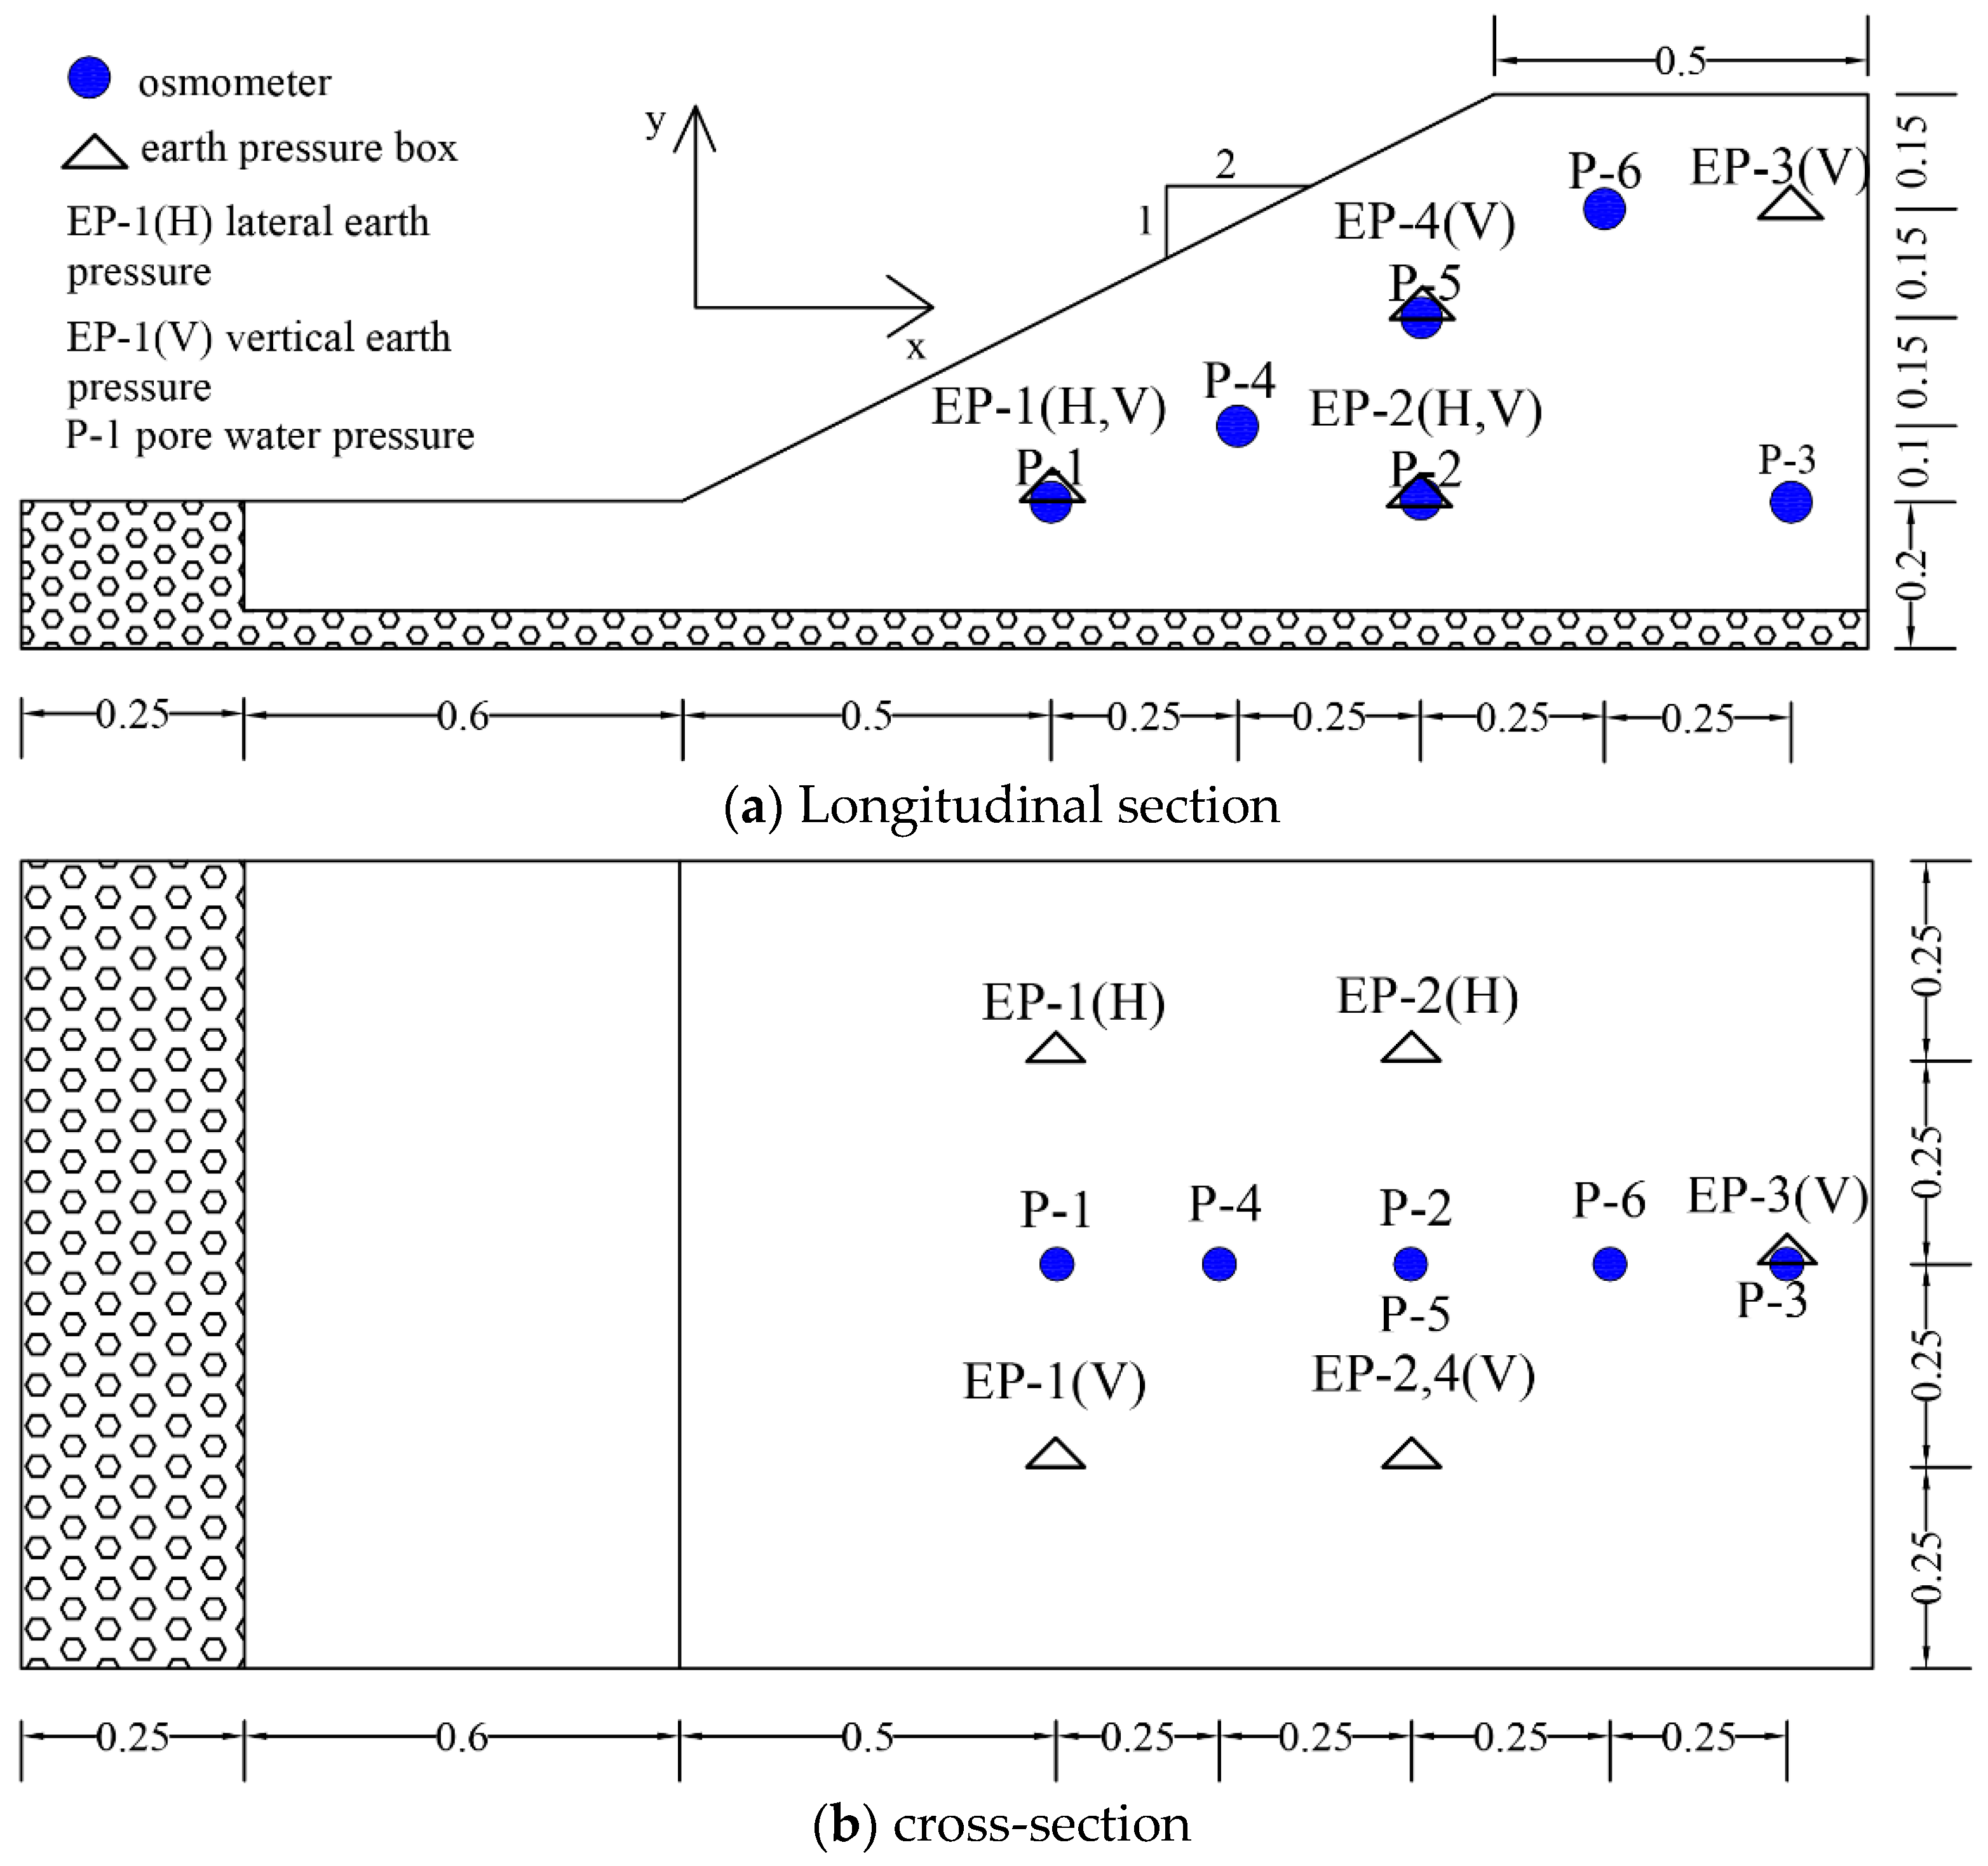
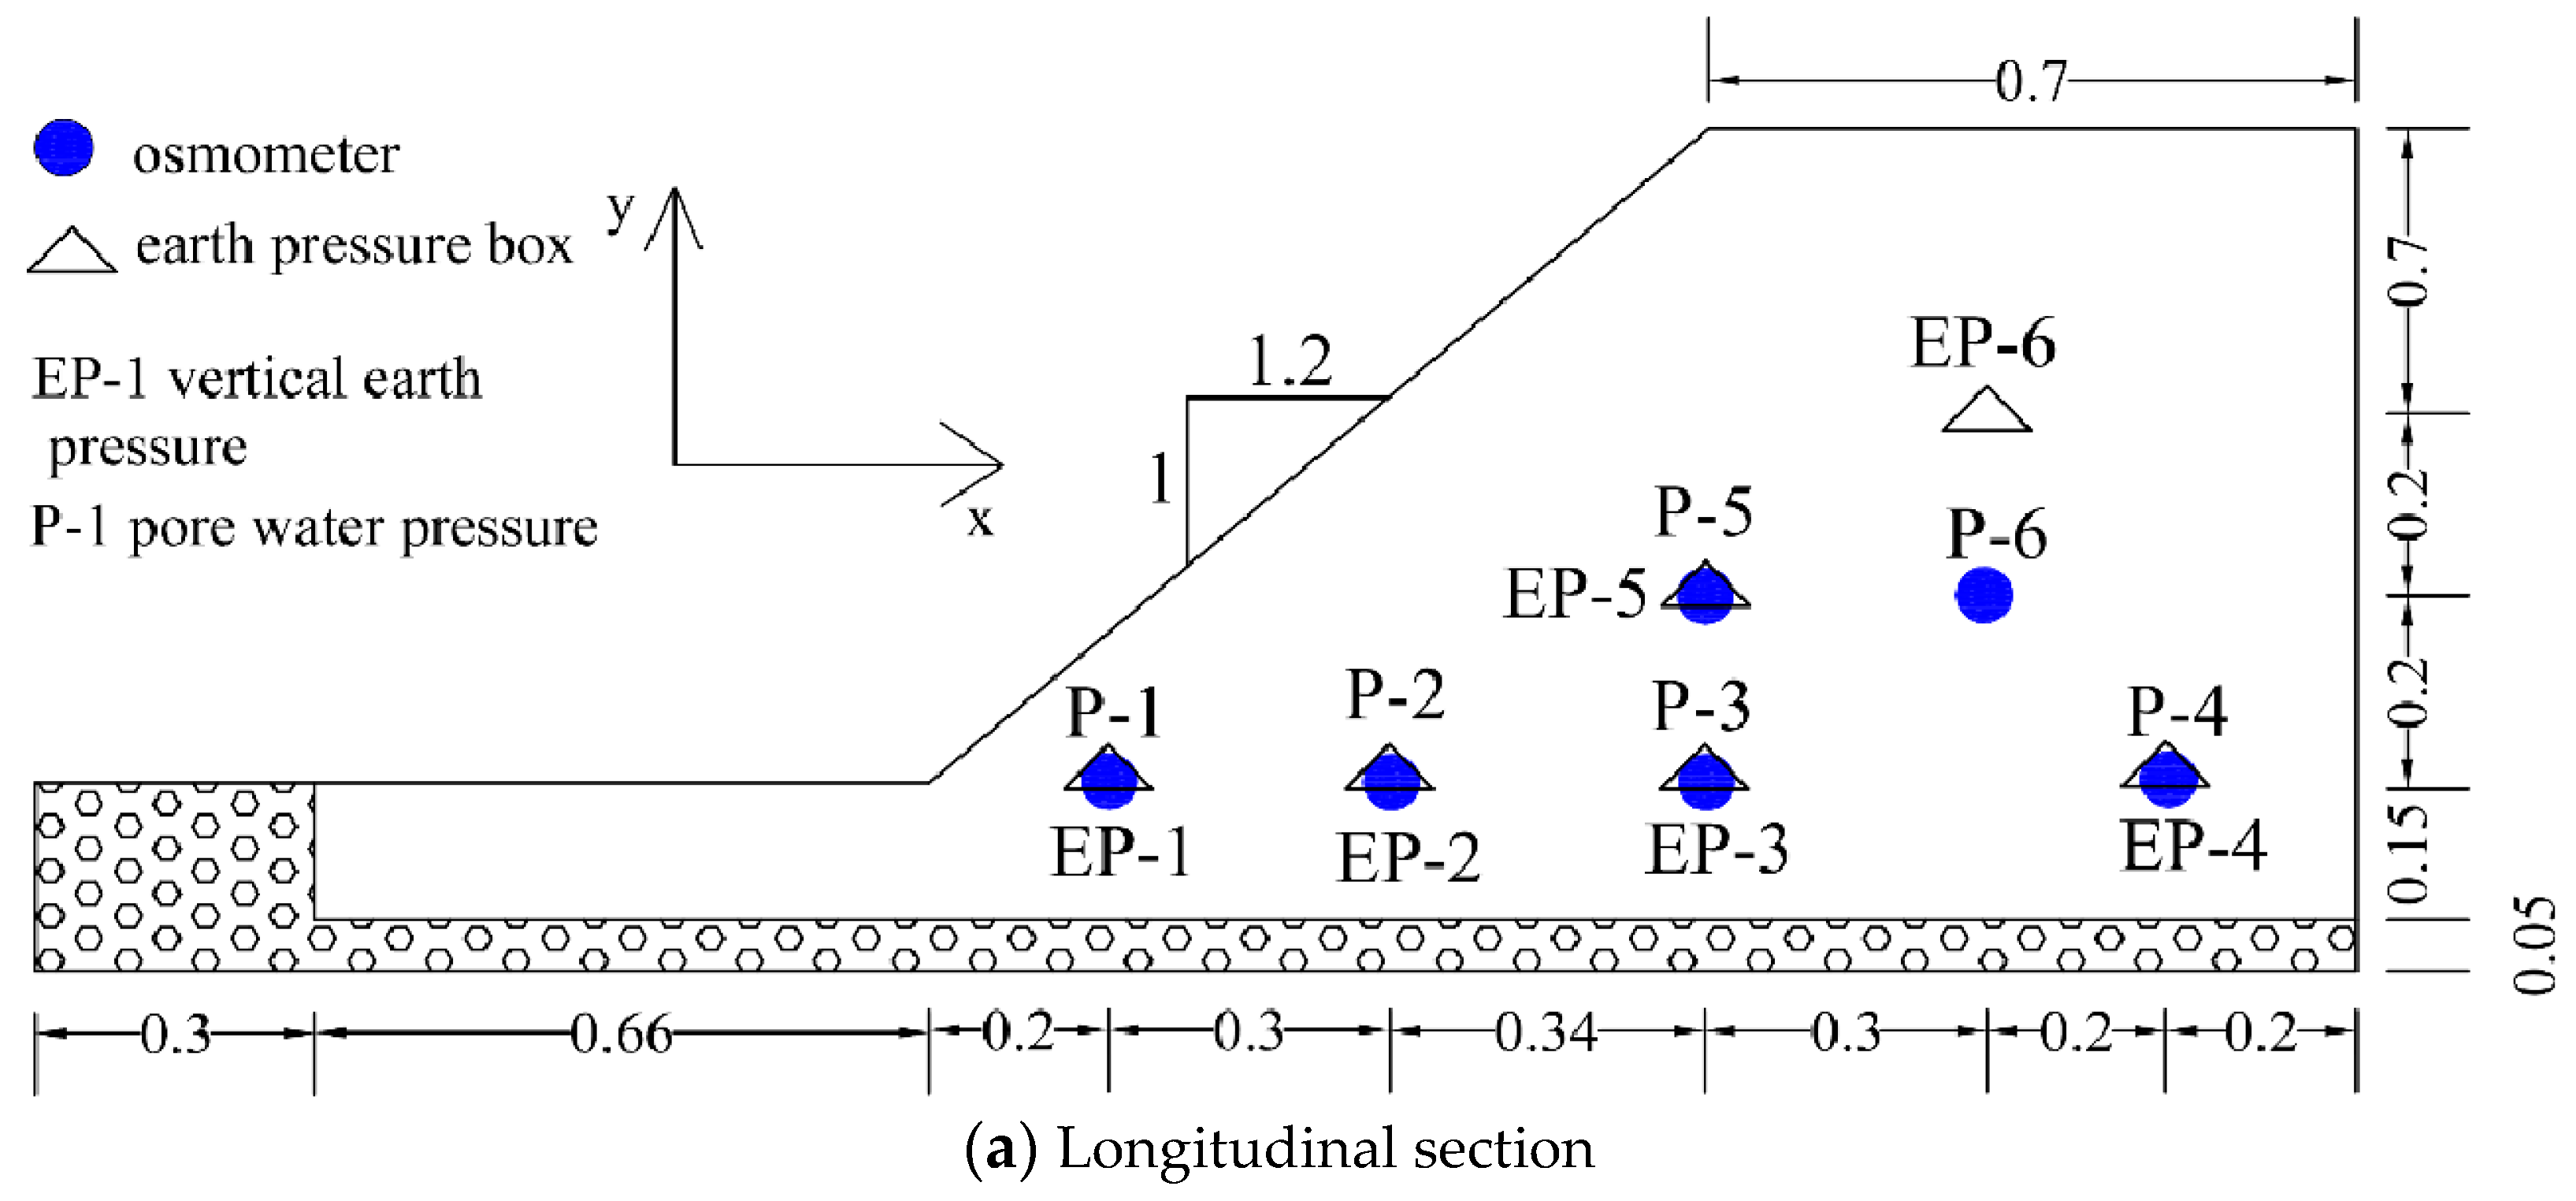
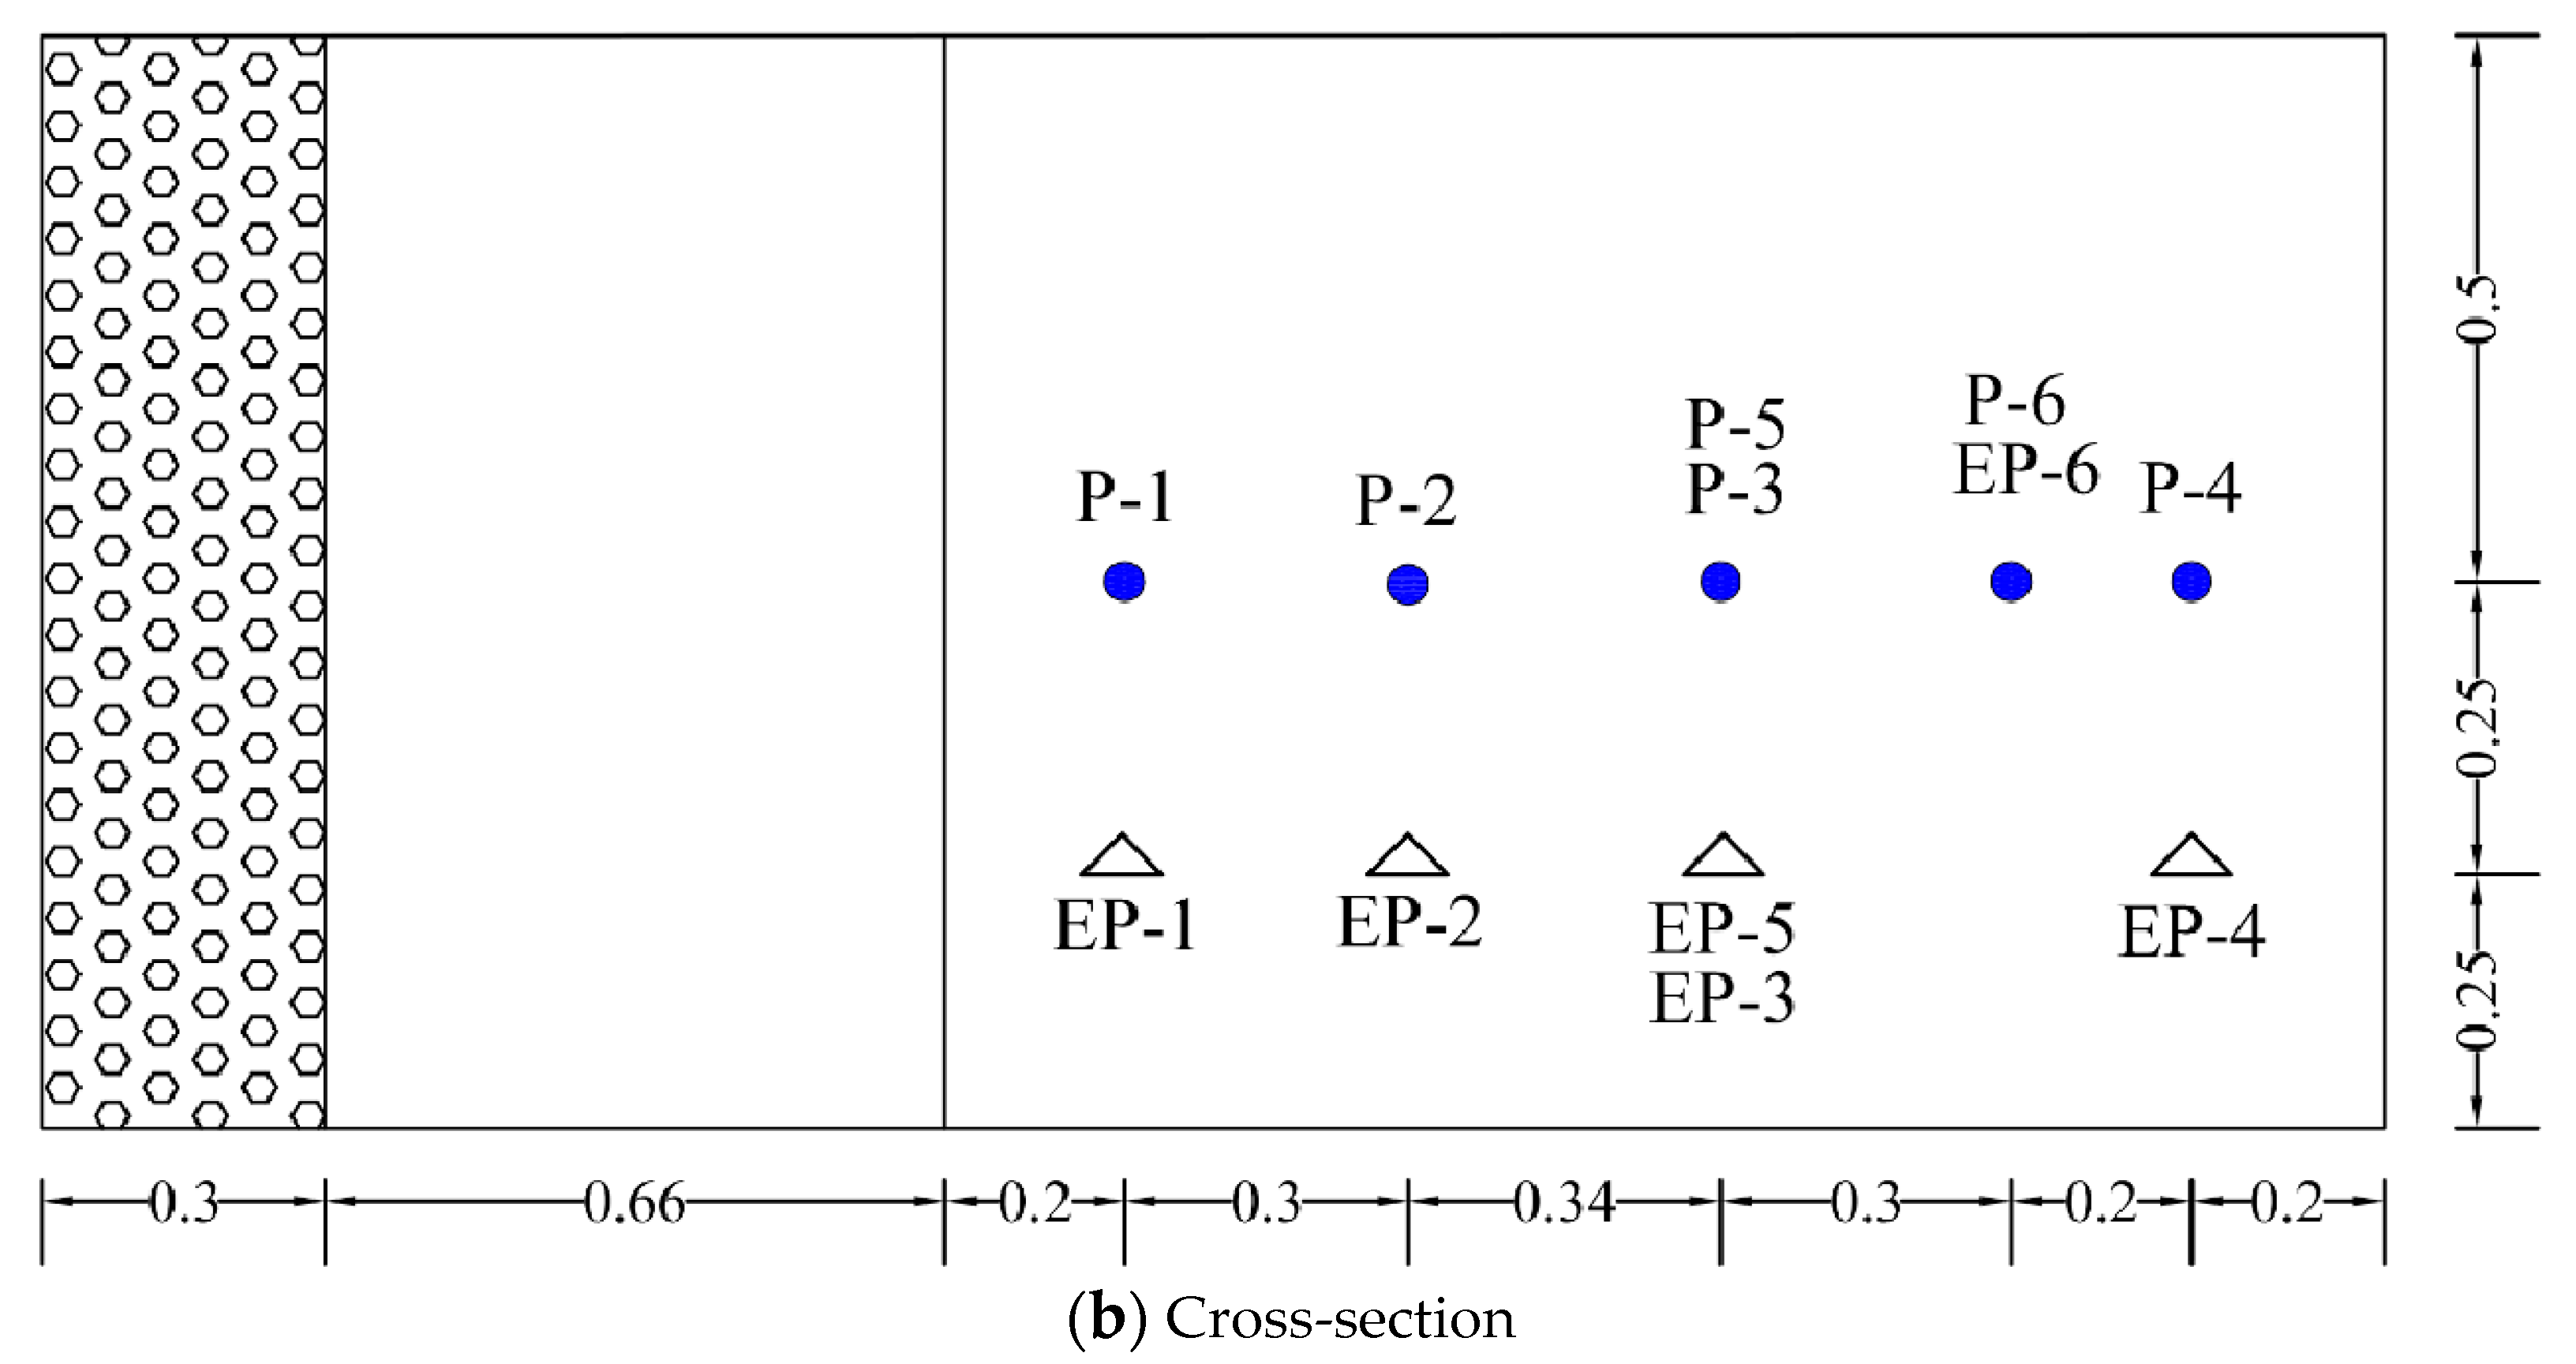
The earth pressure box and the osmometer were buried in the layered filling slope through a PVC pipe, and the slope was cut with a scraper to obtain the required slope shape. A camera was used to monitor the change in the slope surface. To minimize the influence of the sensor buried in the soil on the slope behavior, the instrument layout was layered and buried in different positions. Six groups of earth pressure cells and six groups of micro-piezometers were arranged on the slope. Figure 4 presents the sensor layout for medium sand slopes, and Figure 5 displays the layout of the silt slope sensors.

3.2. GeoStudio Numerical Simulation

Due to the limitations of test conditions, the indoor model test cannot completely and accurately collect the dynamic changes in each point on the slope under the condition of free-water level fall.
In this paper, we coupled the Seep/W and Slope/W modules in the GeoStudio finite element analysis software using the Seep/W module to calculate the seepage field of the soil slope when the water level in front of the slope dropped and the variation law of the internal wetting line of the slope and then coupled the calculation results of the Seep/W module with those of the Slope/W module to calculate the safety factor of the slope model when the water level dropped before the slope. Therefore, we were able to simulate the slope seepage field and slope stability when the water level dropped before the slope [49]. Figure S1 (in Supplementary Materials) displays the size of the model and the division of the finite element calculation grid. We coupled the Seep/W and Slope/W modules to study the effects when the water level fell at different speeds, different drop ratios, different initial water levels, different permeability coefficients, and matrix suction on the seepage field and stability of the slope.
In the numerical simulation analysis, the bottom boundary and the boundary on the right were set as impervious boundaries, the top of the model was a free boundary, and the left side of the model was the water level change boundary, and the change in its water level was the same as the change in the water level of the actual design. In the process of drawdown of the water level before the slope, a key issue is the treatment of the unknown seepage surface boundary and the setting of slope boundary conditions. To solve the problem, the Seep/W module “corrects” boundary nodes. The basic idea is as follows: Consider the simplest case that the boundary flow along the seepage surface is 0. In this case, the boundary conditions along the entire potential seepage surface are set to Q = 0 (flow type), indicating that there will be no additional flow into or out of these nodes, and the sum will be checked for this given condition. At the end of the first iterative step after calculating the head along all nodes on the potential seepage surface, Seep/W checks to see whether there are nodes with positive pressure (H > node’s elevation). Because the pressure at the nodes is not allowed to exceed 0, the presence of positive pressure on the surface indicates ponding, which cannot happen on a sloping boundary where water will flow away rather than the pond. However, the given boundary condition of Q = 0 physically means that the water is going to flow out of the system and thus is incorrect. For the water to flow out, Seep/W converts the boundary condition of the node where there is positive pressure to the H = y coordinate (zero water pressure) of the head type and calculates the new result.
Darcy’s law derived from the steady seepage field is also applicable to the unsaturated seepage field caused by the falling water level in front of the slope. The difference is that the permeability coefficient of saturated soil is constant and that of unsaturated soil is a variable value. In addition, due to the existence of the unsaturated zone and the existence of gas in the pores, negative pore–water pressure, that is, matrix suction, appears on the slope. As the volumetric water content of the soil in the unsaturated zone decreases, the amount of gas in the pores increases gradually, the suction of the matrix increases, the cross-section of water passing through gradually decreases, and the permeability of the soil gradually decreases. At the same time, due to the existence of matrix suction, according to theoretical analysis, the shear strength of the slope will be improved. Therefore, considering the characteristics of the unsaturated zone, in the process of numerical analysis, the change in the permeability coefficient with time and the influence of matrix suction on slope stability were considered.
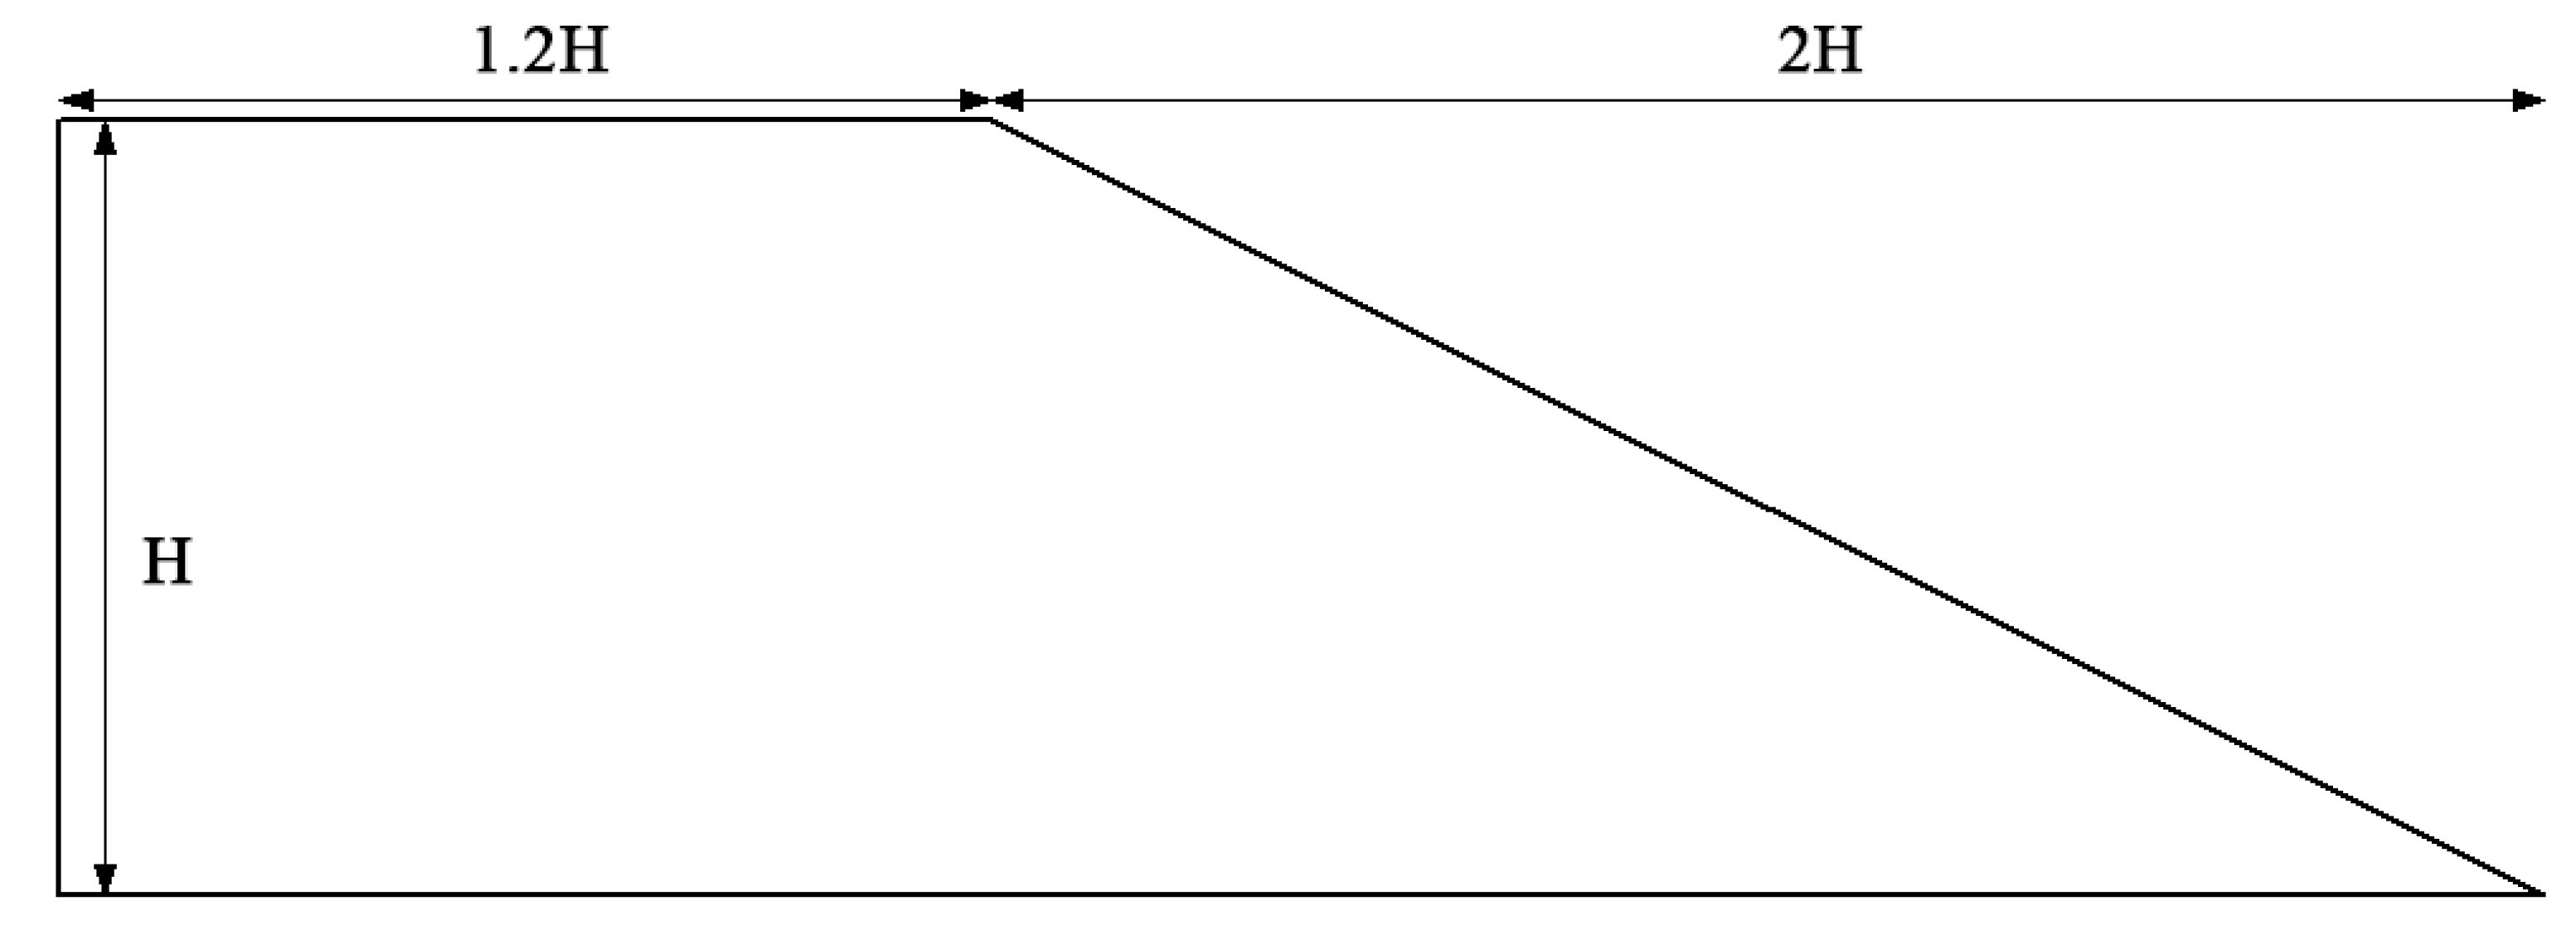
To verify the validity of the established model with respect to slope stability assessment, a classic example given in [50] was analyzed. Figure 6 shows a soil slope; the calculation parameters of the slope geometry and soil are c′/γH = 0.05, φ = 20°, and the slope ratio is 1:2. The bottom boundary is the impermeable boundary. The slope stability was analyzed under the conditions of different drop ratios of the free water level (d/H, where d is the drop height of the water level before the slope, and H is the slope height). This example does not consider the effect of matrix suction on the shear strength of the soil, and the drawdown of the water level pattern remains consistent with the literature, that is, it is assumed that the infiltration line is straight and falls synchronously with the reservoir water level. In this paper, the safety factor when d/H = 0.7 is 1.309, and the safety factor when d/H = 1 is 1.401. According to [50], the safety factor at d/H = 0.7 is 1.309 and the safety factor at d/H = 1 is 1.4. The analysis results obtained in this paper are in good agreement with the results, which proves the effectiveness of the modeling method used in this paper.
The above example assumes that the wetting line is a straight line (slow drawdown). The example does not consider the hysteresis of pore pressure in the slope caused by the drop in the free water level. Jia [49] assumed that the water head of the boundary on the left was fixed and analyzed the seepage field and stability of the slope in the case of a sudden drop in the water level of the boundary on the right. To further verify the validity of the established model in transient analysis, the same model was analyzed and studied.
The change in the stability of the slope from the top of the slope to the bottom of the slope was analyzed. The moment the water level before the slope drops to the bottom of the slope, the safety factor of the slope, is 0.788 because the water pressure inside the slope has no time to dissipate. However, the pore pressure in the slope dissipates continuously, the infiltration line in the slope changes constantly, and finally, the safety factor when the seepage flow is stable, and its value is 0.989. These results are in good agreement with the results in the literature [49] (safety factor = 0.80 at the initial time of the slope, and landslide and safety factor = 0.992 when the seepage is stable).

3.3. Comparison and Verification of Model Test and Numerical Simulation Results

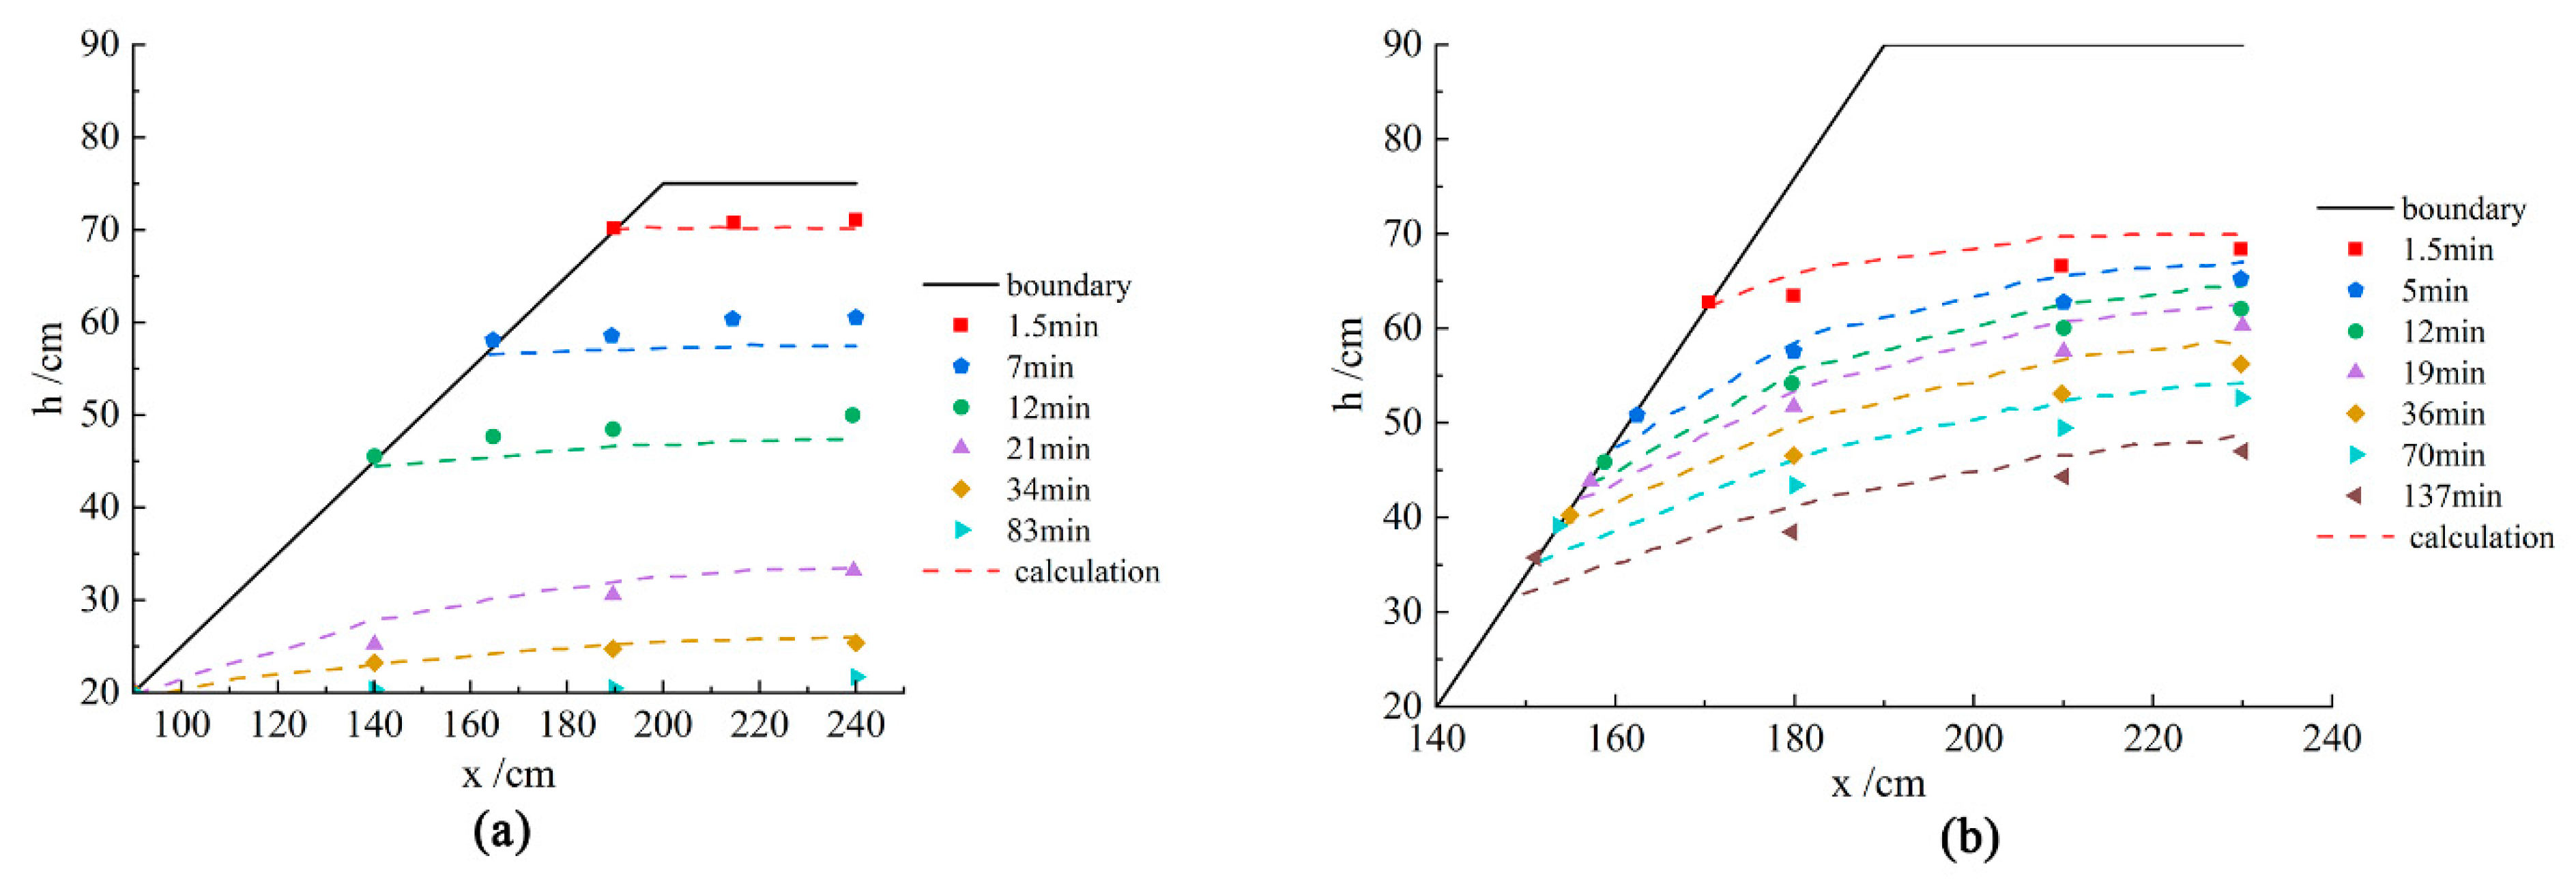
From the model test, the data obtained from the medium sand model test with a slope ratio of 1:2 and the silt model test with a slope ratio of 1:0.7 were selected for analysis. It can be seen from Table 2 that the speed at which the water level drops v = 0.043 cm/s before the slope of the medium sand model test. The model test results of these two different filling materials were compared with the numerical simulation results, as shown in Figure 7. The dotted line in the figure is the numerical simulation calculation value. From Figure 7, it can be concluded that the variation law of the seepage field of the slope measured by the test is in good agreement with the results obtained by the numerical analysis using the Seep/W module during the drop in the water level in front of the slope.

4. Analysis of Influence of Water Level Fall on Slope Stability

The drop in the water level in front of the slope will inevitably cause a continuous change in the seepage field of the slope, and the stable seepage field in the original slope will become an unsaturated and unstable seepage field, that is, there will be a redistribution of pore water in the slope with the change in the water level in front of the slope. The stability of the slope will change with the dissipating hydrostatic pressure outside the slope and the dissipating speed of the pore water pressure inside the slope. Comparison and verification of the model test and numerical simulation results in Section 3.3 and the calculation results of the relevant examples in Section 3.2 prove that the numerical model established can better reflect the variation law of the seepage field and stability in the slope during the drawdown of the water level in front of the slope.
The stability of a slope with a given geometry is influenced by the change in the drawdown of the water level speed outside the slope, the drawdown of the water level ratio, and the mechanical parameters of its soil. To highlight the influence of variables on slope stability, this numerical simulation method uses the same slope size model as the model test (Figure S1). The law of change in the seepage field of the slope and the stability of the slope when there is a change in single variables, such as the water level drop rate before the slope, the water level drop ratio, and the permeability coefficient, is discussed.

4.1. Analysis of Influence of Water Level Falling Speed on Slope Stability

4.1.1. Influence of Falling Speed on Seepage Field

In the model calculation in this section, the physical and mechanical parameters of the silt in the model test were used for analysis. The influence of five free-water level falling velocities (0.001 cm/s, 0.01 cm/s, 0.05 cm/s, 0.1 cm/s, and 0.5 cm/s) on the seepage field of the slope and the stability of the slope was analyzed. Figure S2 shows the contour maps of pore pressure in the slope corresponding to the initial state and different positions after the water level in front of the slope is stabilized. Under the condition of low-speed drop, the pore water pressure near the slope dissipates faster with the drop in the water level in front of the slope. When the deceleration is 0.5 cm/s, the pore pressure at the trailing edge of the slope remains basically unchanged. When the water level before the slope drops to the bottom of the slope, the pore pressure in the slope has not had time to dissipate, and the lag value of the trailing edge water head reaches 94.3%, i.e., a dissipation of only 5.7%. According to the criteria for judging a sudden drop as described in Section 2 [47], it belongs to the sudden drop category. Compared with the assumption that the wetting line in the slope remains unchanged for the sudden drop condition in engineering practice, the pore pressure near the slope surface is lower than the pore pressure at the trailing edge of the slope in the actual simulation. The infiltration line in the slope does not keep the original straight line unchanged, and the pore pressure near the slope is dissipated to a certain extent. When the drop speed is 0.001 cm/s, the lag value of the trailing edge head is about 14%, which is close to the slow drop described in Section 2.
Figure S3 shows the change in the slope infiltration line when the water level drops by 5 cm as the water level falls from the front of the slope to the bottom of the slope. When the water level in front of the slope is close to a slow drop, the infiltration line in the slope is similar to a straight horizontal line. Therefore, when analyzing the working condition of the water level in front of the slope falling slowly, it is assumed that the infiltration line in the slope is a straight line, the error between the obtained result and the real situation is small, and it has a good reference. Water level fall speeds of 0.1 cm/s, 0.05 cm/s, and 0.01 cm/s are in the transitional range from a slow drop to a sudden drop. The infiltration line in the slope is relatively flat at the initial moment of the water level drop. With the continuous decline in the water level in front of the slope, the seepage gradient of the seepage field of the slope gradually increases and the change is more obvious with the increase in the falling speed.
The water pressure difference in the slope caused by the drop in the water level in front of the slope leads to seepage in the slope from the inside of the slope toward the outside, which threatens slope stability. From the vector diagram of the velocity in the slope in Figure S4, it can be seen that the seepage is from the inside of the slope toward the outside. According to “Seepage Computation Analysis & Control” (Ref. [47]), the seepage force per unit volume of soil along the streamlined direction is proportional to the seepage gradient value. It can be seen that the greater the drop speed of the water level in front of the slope, the greater the downward seepage force formed by the seepage field of the slope to the slope body. At the same deceleration, this mentioned penetration force is greater closer to the slope.
To compare the influence of different drop speeds on the lag value of the water head on the slope, Figure 8 shows a comparison of water levels inside and outside the slope at different positions (x = 100 cm, x = 165 cm, and x = 230 cm) on the slope with different drop speeds. A comparison of the inner and outer water levels of different deceleration slopes from Figure 8 shows that as the deceleration increases, the lag of the water level inside the slope relative to the water level outside the slope is more obvious. A comparison of the water levels inside and outside the slope at different positions on the slope shows that the point close to the slope surface has little effect on the hysteresis phenomenon; the closer the area is to the slope, the more obvious the effect of falling speed on the lag difference of water levels inside and outside the slope.

4.1.2. Influence of Water Level Falling Speed on Slope Safety Factor

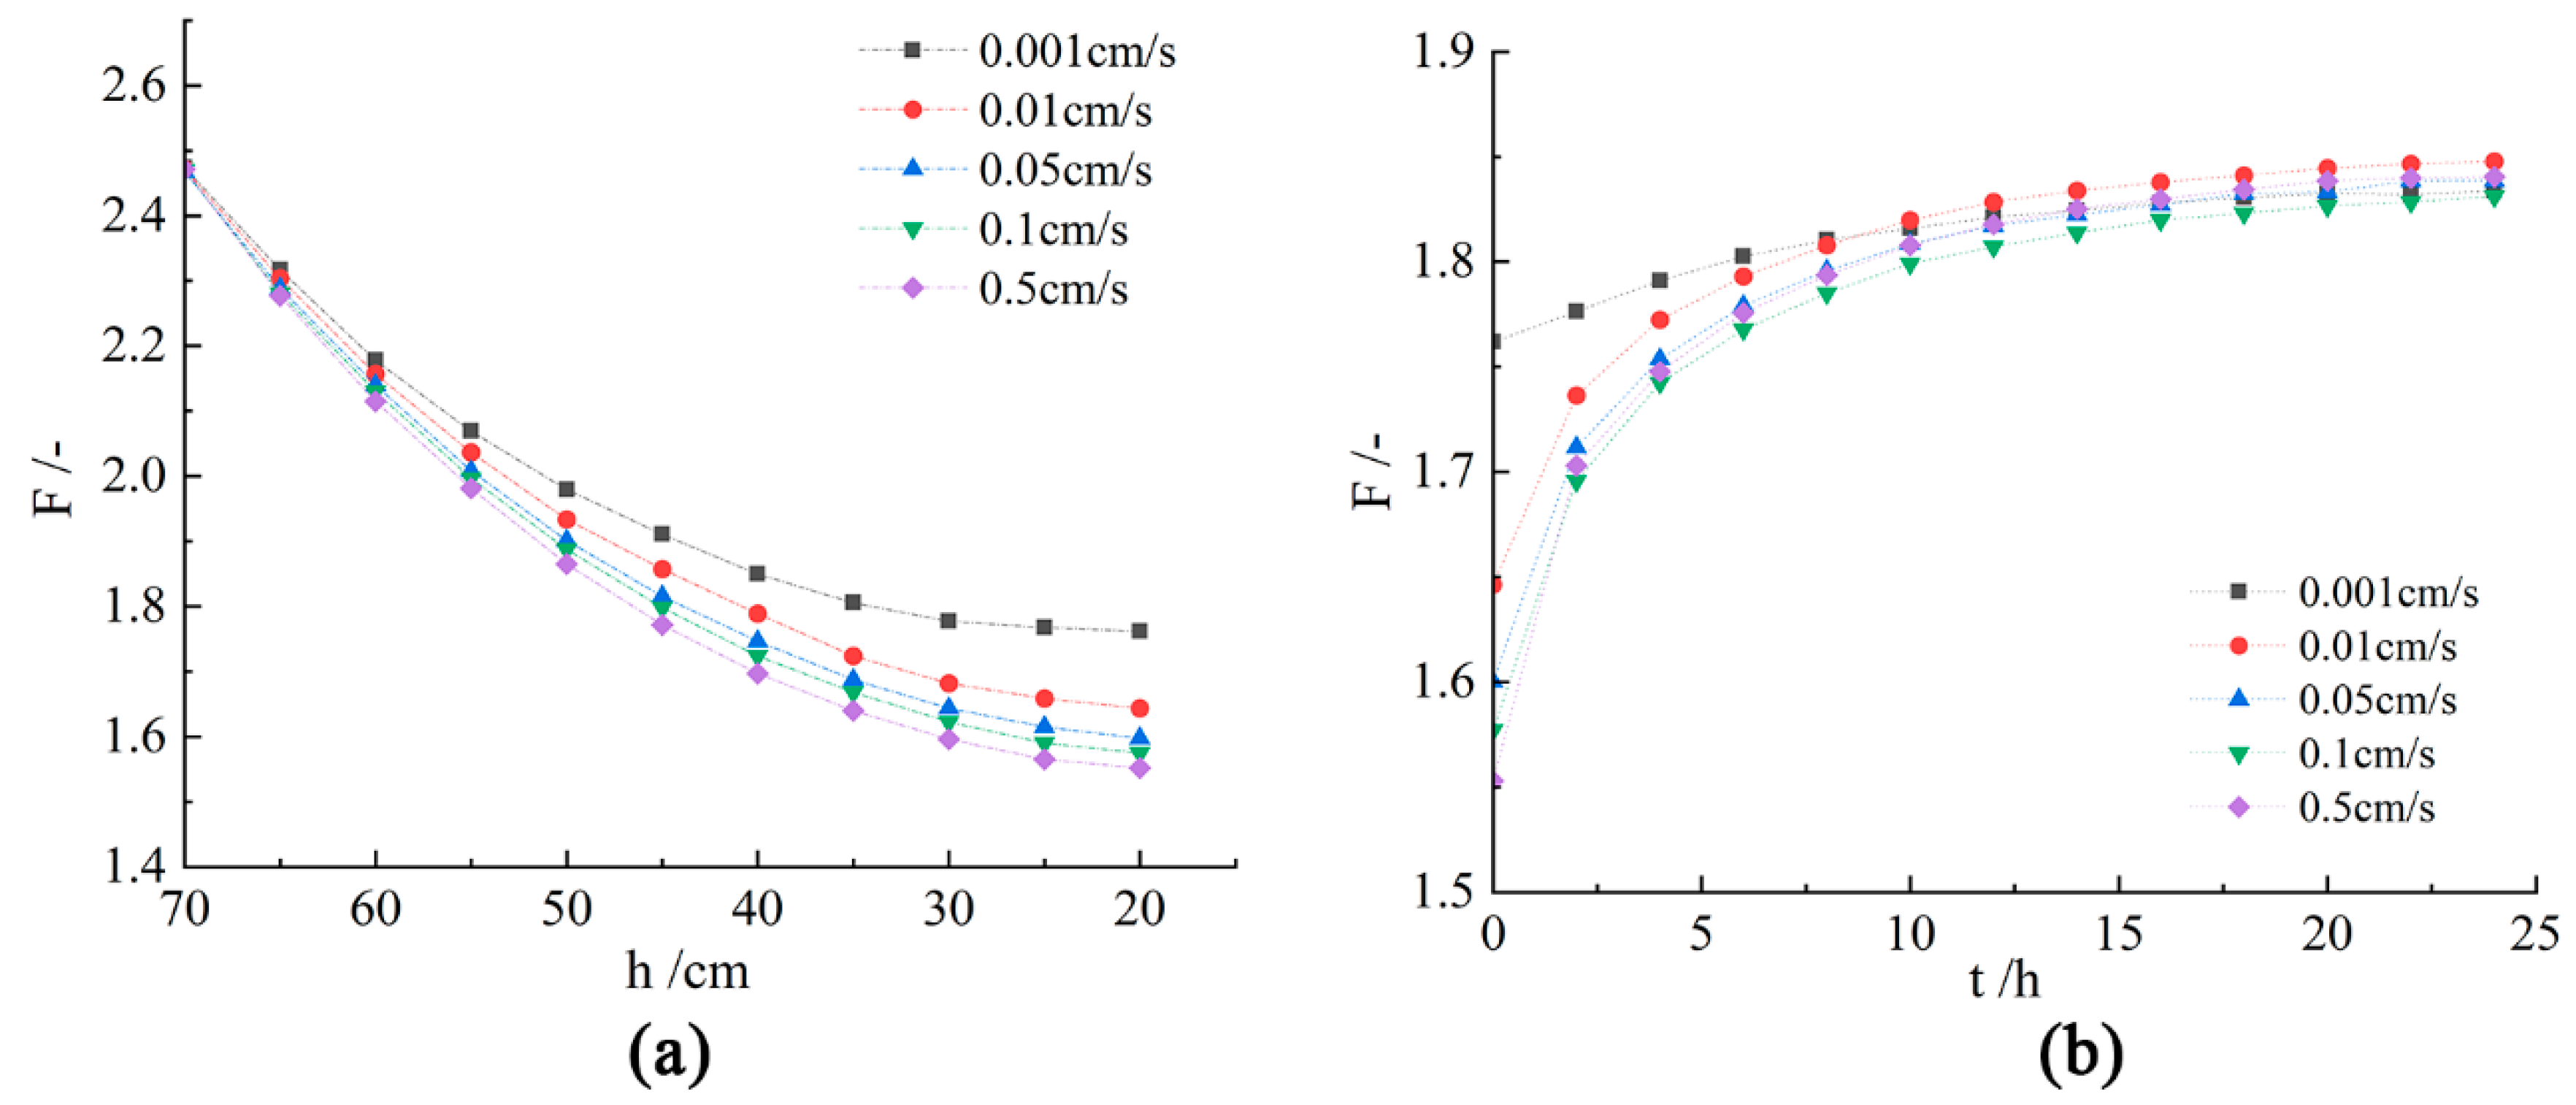
Figure 9 shows the curve of the slope safety factor changing with the water level in front of the slope when the water level in front of the slope falls. Due to the unloading of the water pressure in front of the slope and the pore pressure difference formed in the slope, the safety factor of the slope generally decreases with a decrease in the water level. It shows that the front part has a large change rate and a steep curve, and the rear part has a small change rate and a slower curve. A comparison of the curves of the safety factor of different decelerations with the water levels in front of the slope shows that the safety factor of the slope decreases with an increase in the falling rate of the water level in front of the slope. The change curve of the safety factor with a larger drop rate is steeper, and the safety factor of the slope falls faster. Among them, under the condition of deceleration of 0.5 cm/s, the maximum drop in the safety factor during the change in the water level is 37%.
For practical engineering, the variations in the safety factor after the water level before the slope is stabilized are also important. Figure 9 shows the variation in the safety factor of the slope with time after the water level in front of the slope is stabilized under different deceleration conditions. Upon combining Figure 9, it can be concluded that when the water level in front of the slope falls, due to the influence of the unloading of the water pressure in front of the slope and inner slope pressure difference, a seepage force appears from the inside of the slope to the outside of the slope, because of which, the safety factor of the slope decreases rapidly. With the continuous decline in the water level of the slope and the continuous expansion of the unsaturated zone with time, the favorable contribution of the matrix suction to the slope stability gradually becomes obvious and the safety factor of the slope also increases. After reaching the steady state, the safety factor of the slope under different deceleration conditions tends to be a constant and common value.

4.2. Influence of Drop Ratio on Slope Stability

4.2.1. Influence of Drop Ratio on Seepage Field of Slope

The change in the external condition of the falling water level before the slope changes slope stability. In practical engineering, in addition to the change in the falling speed, different drop ratios are involved (L/H, where L refers to the landing height, and H refers to the height from the top to the foot of the slope). To understand the influence of the drop ratio on the seepage field of the slope, Figure S5 shows the pore pressure field in the slope under the same initial water level and the drop ratios of 0.2, 0.4, 0.6, 0.8, and 1.0. Figure S6 shows the pore pressure field in the slope under the same drop ratio for different initial water levels. This pressure field will be analyzed together with safety factor analysis. As can be seen from Figure S5, the larger the drop ratio, the steeper the pore pressure contour line formed in the slope, and the lag of the water level difference inside and outside the slope are more obvious.

4.2.2. Influence of Drop Ratio on Safety Factor of Slope

To investigate the influence of the drawdown of the water level ratio on slope stability, Figure 10 and Figure 11 show the variation in the safety factor of the slope with time under the same initial water level with different drop ratios and under the same drop ratio with different initial water levels. It can be seen from Figure 10 that the larger the drop ratio of the water level in front of the slope, the smaller the safety factor of the slope. When L/H = 1.0, the safety factor of the slope is the smallest.
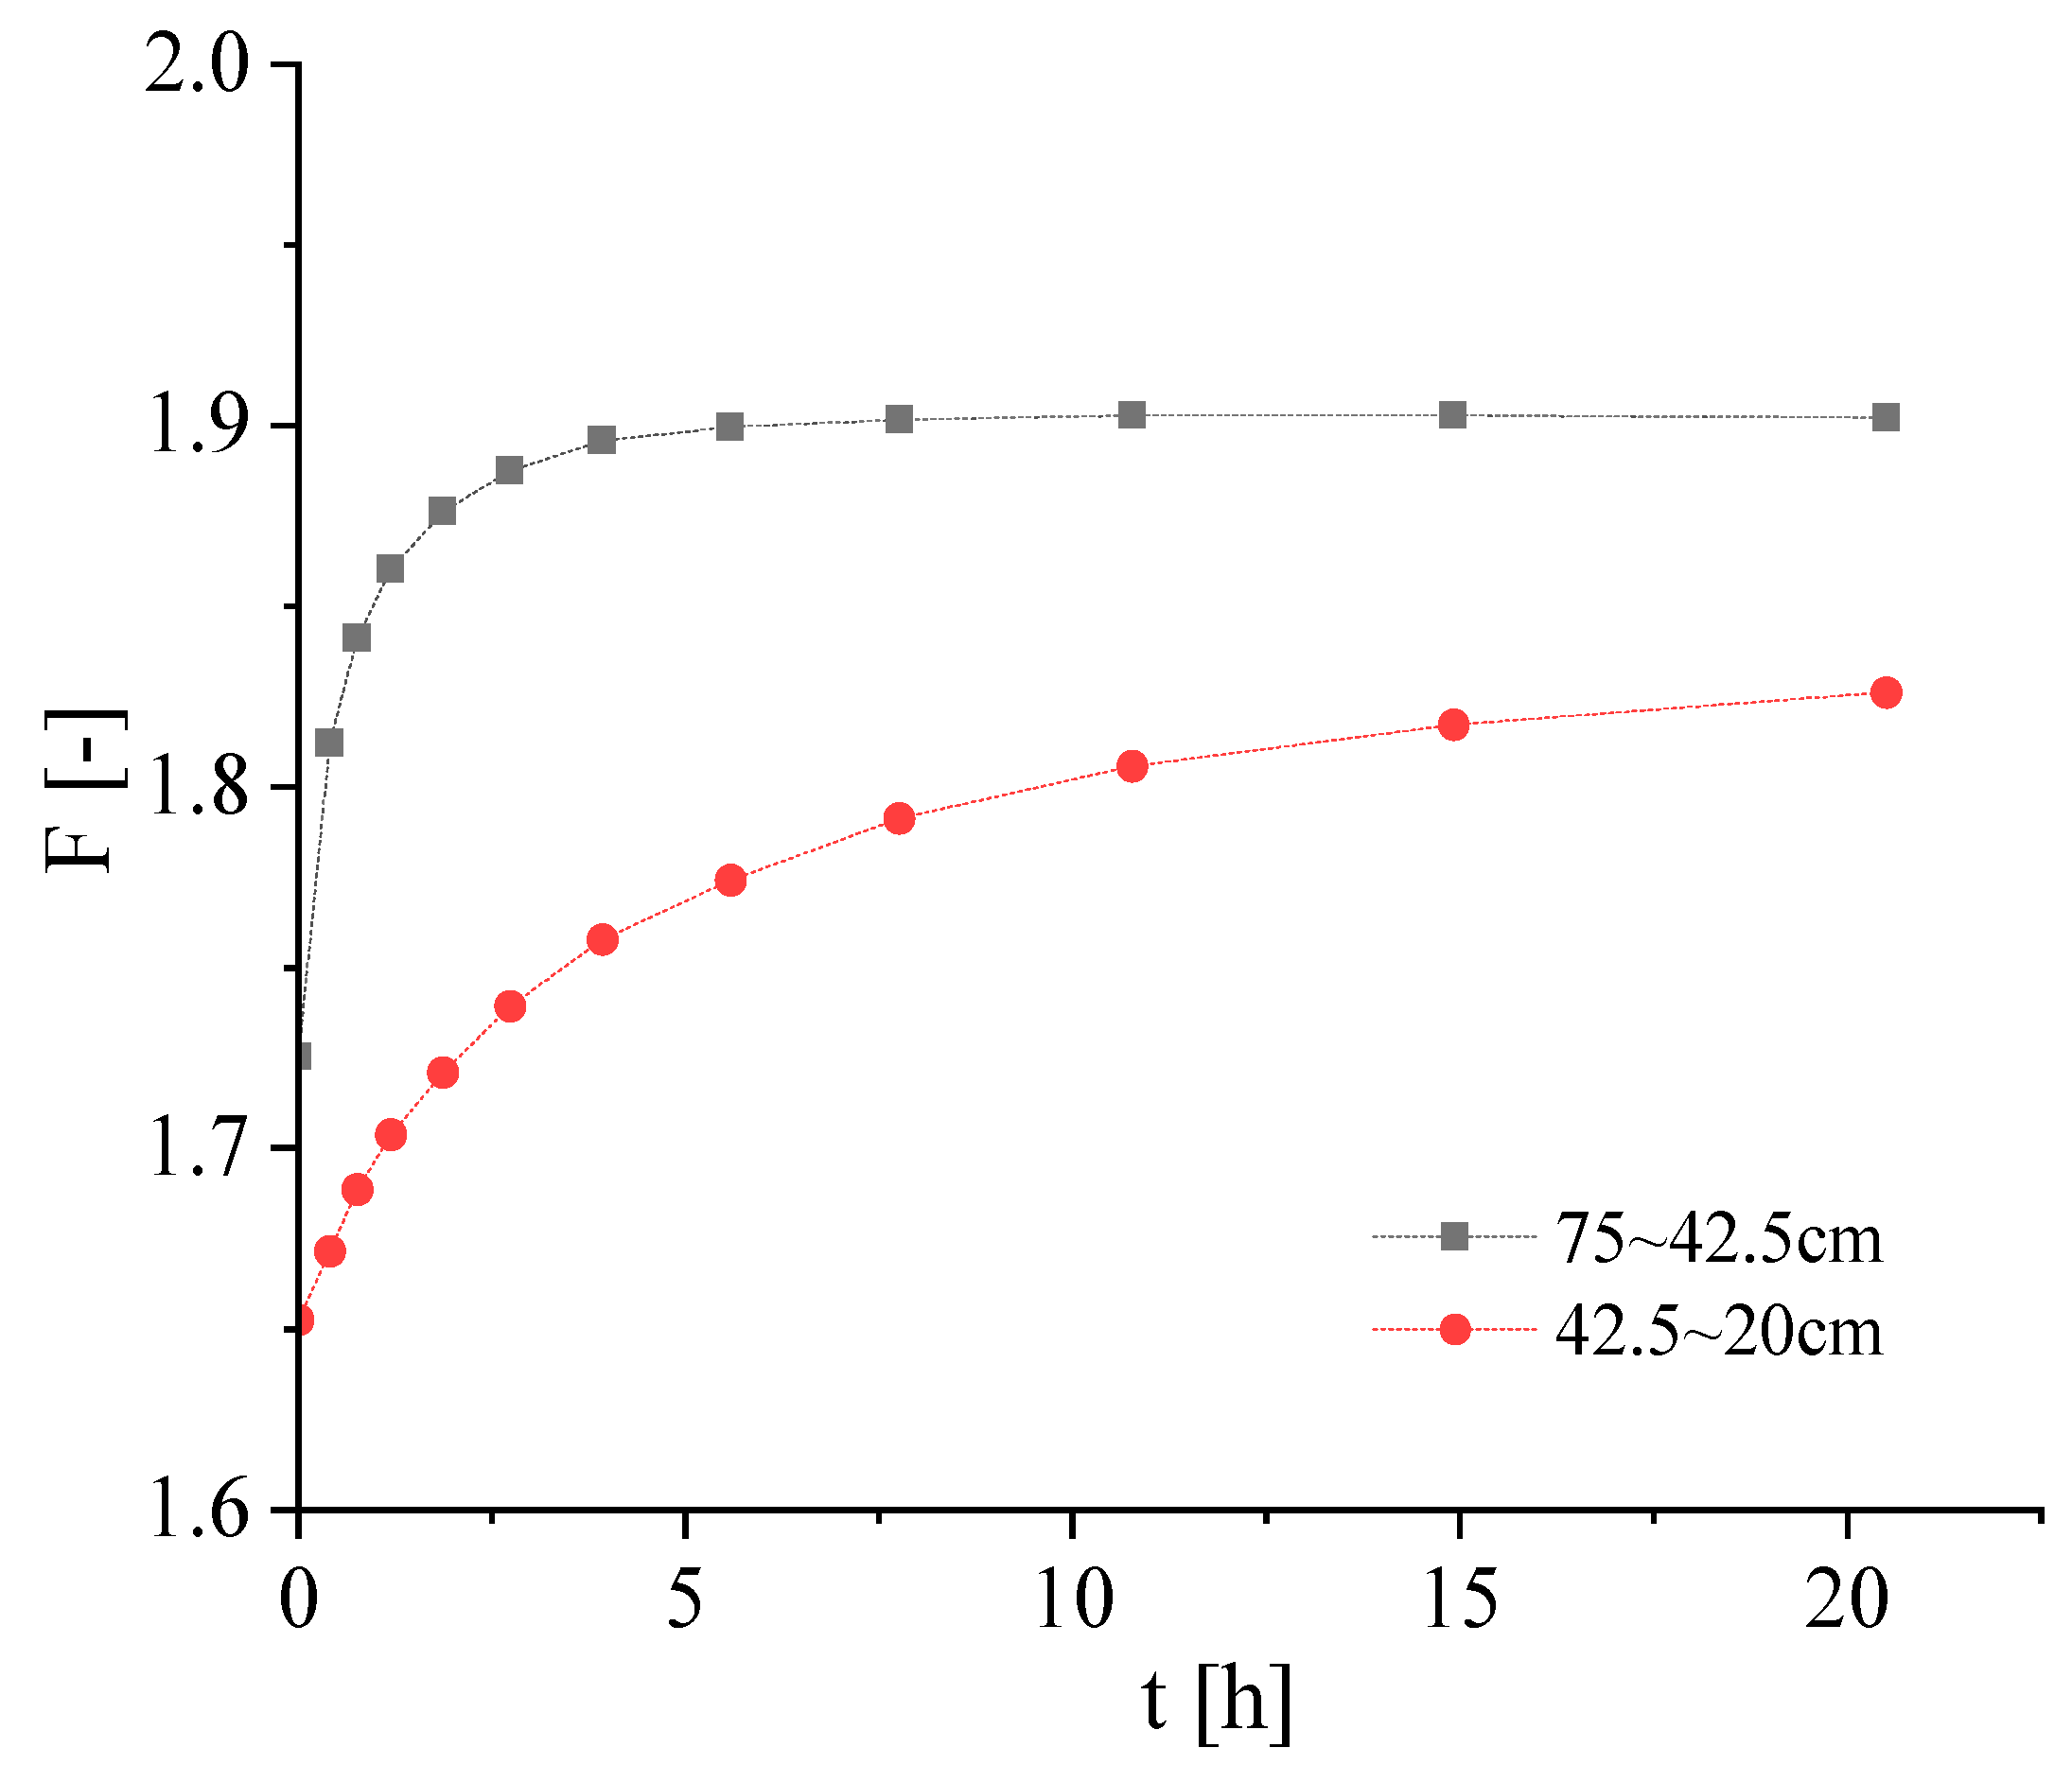
Figure 11 shows the variation in the safety factor of the slope with time after the water level before the slope is stabilized under the different initial water levels (75–42.5 cm and 42.5–20 cm). An examination of Figure S6 and Figure 11 shows that after the water level before the slope is stabilized, with time, the unsaturated area in the slope continues to expand, and the safety factor of the slope shows an upward trend as a whole, finally tending to a constant value. For the same drop ratio, the safety factor of the slope is large under a high initial water level and small under a low initial water level. When the speed at which the water level is constant, the drop ratio is the same, and the initial water level is low; the slope is more prone to instability.

4.3. Influence of Filling Materials on Slope Stability

4.3.1. Influence of Permeability Coefficient on Seepage Field of Slope

The medium sand slope was selected, and the water level before the slope was decelerated at five deceleration speeds: 0.5 cm/s, 0.1 cm/s, 0.05 cm/s, 0.01 cm/s, and 0.001 cm/s. The internal seepage field and slope stability were analyzed. Combined with the hysteresis law of water level inside and outside the three different deceleration downslopes proposed in Section 2, it can be concluded from the change diagram of the seepage field of the slope in Figures S7 and S8 that for medium sand slopes with a large relative permeability coefficient, when the water level falls at the rates of 0.001 cm/s and 0.01 cm/s, the drop is slow. However, when the water level falls at the rates of 0.05 cm/s, 0.1 cm/s, and 0.5 cm/s, it shows an excessive range from a slow drop to a sudden drop. Among these values, when the maximum falling speed is 0.5 cm/s, it is close to a sudden drop. Comparing the variation law of the seepage field of silt in Section 4.1, it is verified once again that a sudden drop is more likely to occur in a slope with a small permeability coefficient when the water level in front of the slope is falling. The hysteresis phenomenon is more obvious; it is easier for seepage to occur when the slope is not stabilized [51].
To further study the influence of the permeability coefficient on the lag difference of water level inside and outside the slope, Figure 12 shows a comparison of water levels at different points inside and outside the medium sand slope with a large permeability coefficient and a silt slope with a small permeability coefficient when the water level falls at a velocity of 0.1 cm/s.
It can be seen from Figure 12 that the two slopes with different permeability coefficients have basically the same pressure difference between the inside and outside of the slope at the position close to the slope point (x = 100 cm). The change in the permeability coefficient has little effect on the pressure difference between the inside of the slope and the outside of the slope near the slope surface, but the closer the position is to the slope, the more obvious it is that the hysteresis phenomenon will occur in the slope with a small permeability coefficient.

4.3.2. Influence of Permeability Coefficient on the Slope Safety Factor

Figure 13 shows the change in the safety factor of the slope with the free water level during the process of drawdown of the water level in the middle sand slope with a large permeability coefficient.
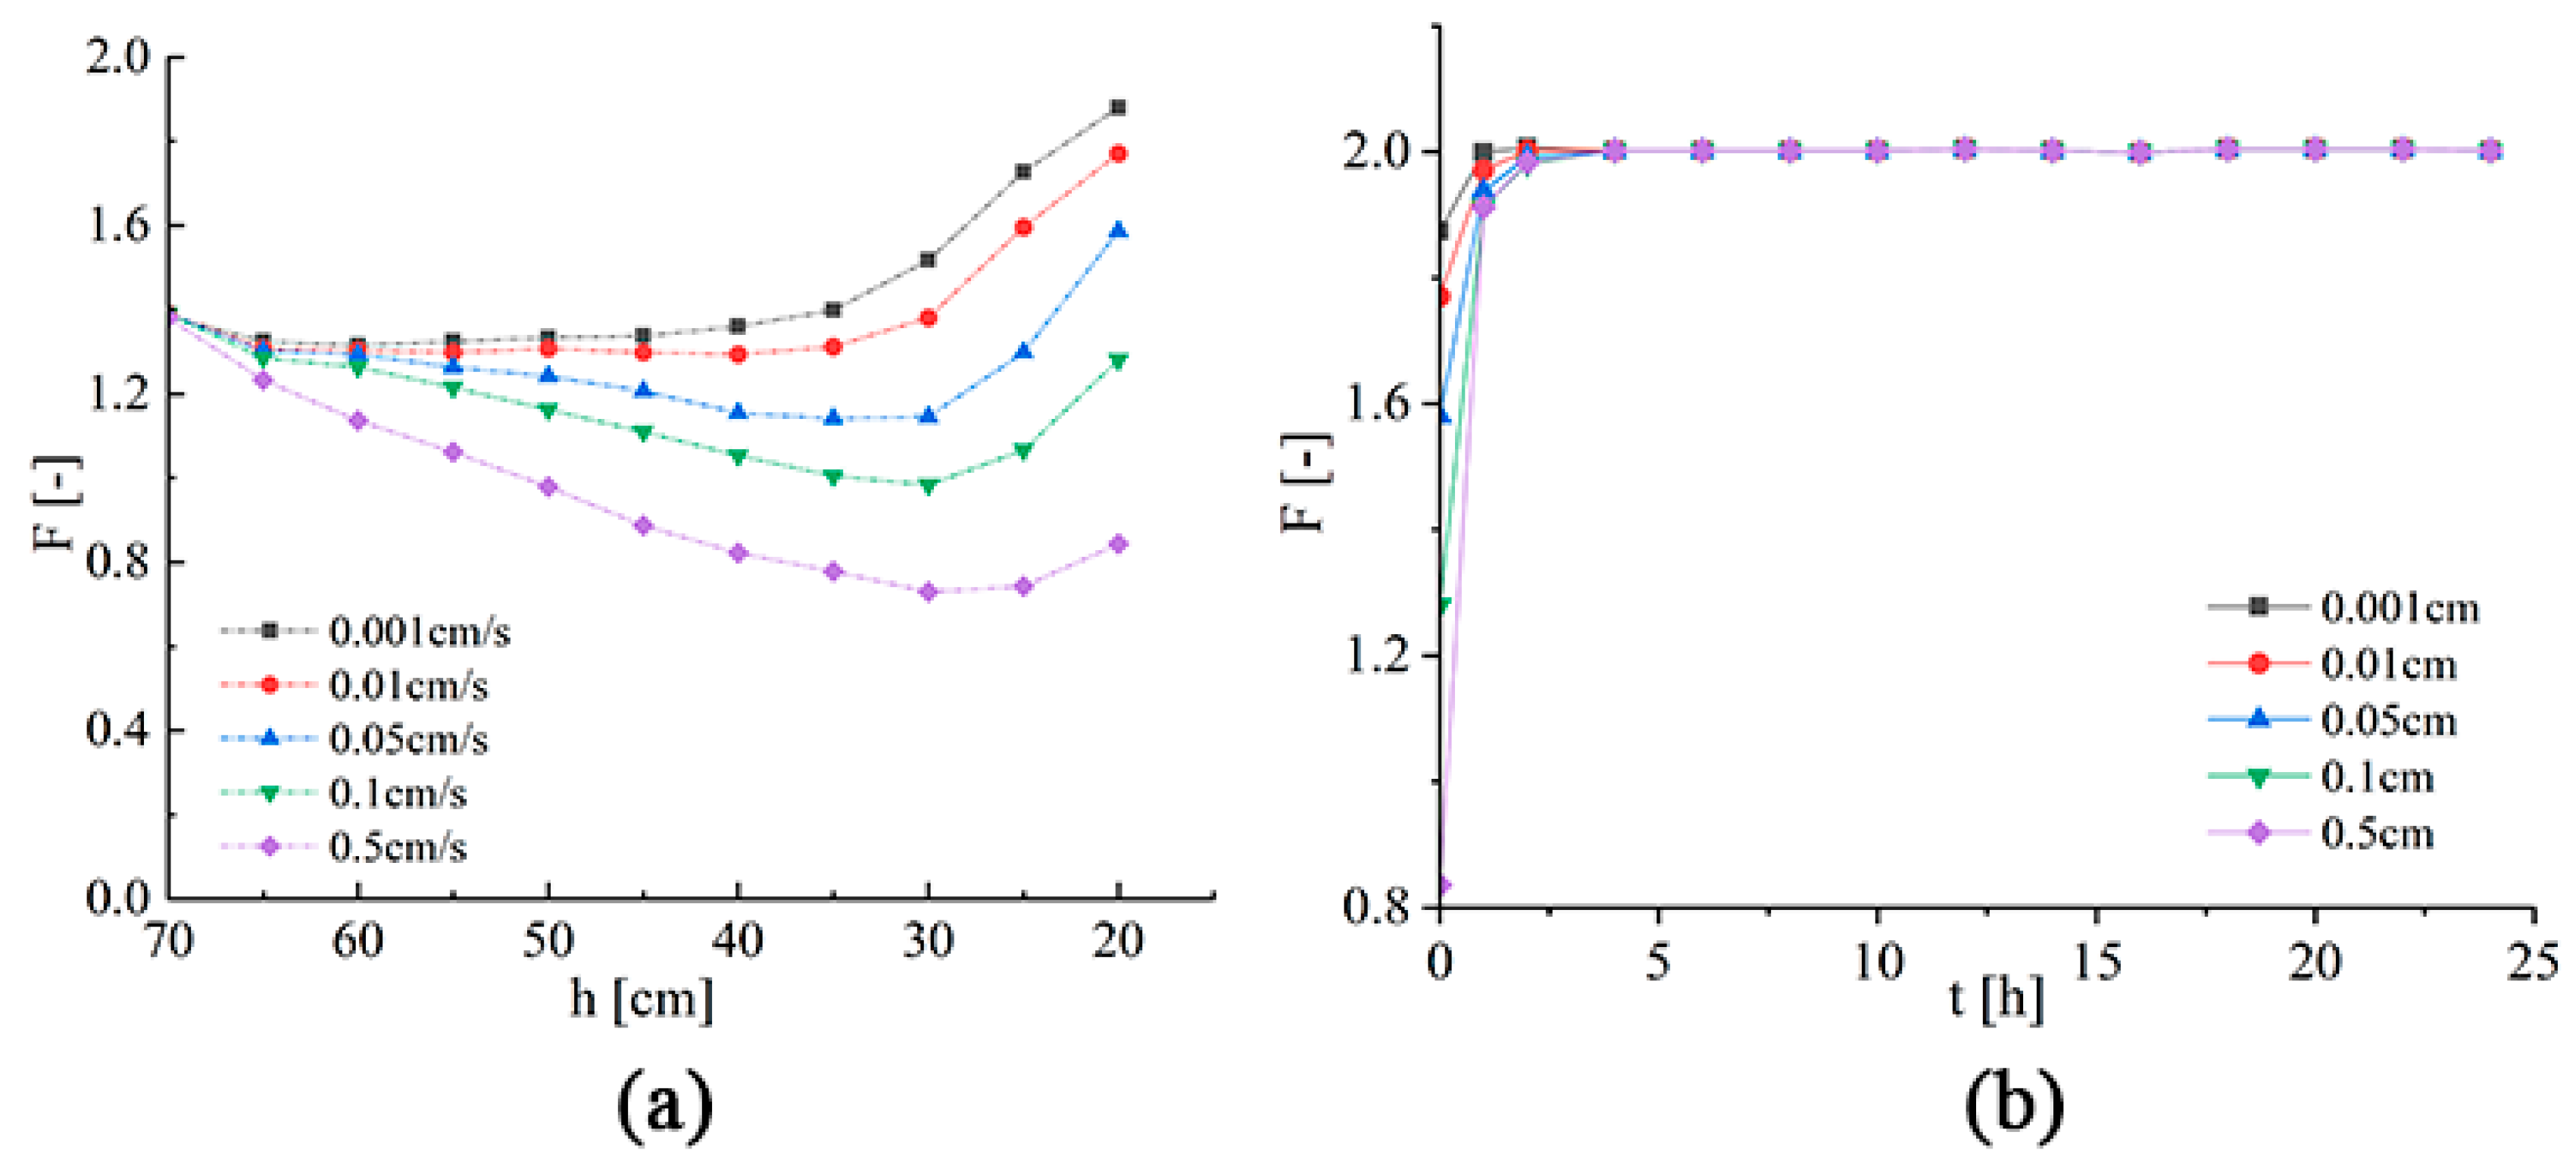
When the water level in front of the slope drops slowly (v = 0.001 cm/s), the minimum safety factor of the slope appears at the water level of 60 cm in front of the slope, which is 80% of the slope height (Figure 13). With the increase in the falling speed of the water level (v = 0.01 cm/s, v = 0.05 cm/s, v = 0.1 cm/s, and v = 0.5 cm/s) before the slope, the minimum safety factor of the slope also changes. Under the four decelerations, the water level inside the slope has different hysteresis values relative to the water level outside the slope. When the minimum safety factor of the slope occurs at different water level fall speeds, the corresponding water levels are relatively similar, and they are all between 30 and 40 cm in front of the slope. The most unfavorable water level is equivalent to 40% to 53% of the slope height. When the deceleration is equal to 0.5 cm/s, the safety factor of the medium sand slope is reduced by 0.65 and the safety factor of the silt slope is reduced by 0.92. The smaller the permeability coefficient, the slower the rate at which the pore pressure in the slope dissipates, and the greater the decline in the slope safety factor.
Figure 13 shows the variation in the safety factor of the slope with time after the water level in front of the slope is stabilized until the seepage in the slope reaches a steady state. The variations in the slope stability with the free water level in the later stage of the water-level drop are similar between the medium sand slope and the silt slope. The principle is that the thrust of the water on the slope in front of the slope no longer changes, resulting in a gradual decrease in the pressure difference and permeability between the inner and outer pores of the slope, the continuous expansion of the saturation area, and the continuous expansion of the contribution of the matrix suction to the slope stability. Therefore, the slope safety factor gradually increases. After reaching the steady-state seepage, the safety factor of the slope under different water level fall speeds tends to a constant value. Comparing the change in slope stability of the medium sand slope in the later stage of the drawdown of the water level in Figure 13 and the change in the slope stability of the silt slope in the later stage of the drawdown of the water level, it can be concluded that due to the good permeability of the medium sand slope, the retention in the slope is low. The pore pressure difference dissipates rapidly with time, and within a short time after the water level before the slope stabilizes, the seepage in the slope reaches a stable state and the slope safety factor does not change.
Different from the silt slope with a small permeability coefficient (where the safety factor first decreases and then increases), in the case of the medium sand slope, the safety factor continuously decreases with the drop in the water level in front of the slope in the process of the drawdown of the water level, which is consistent with the conclusions drawn by some scholars [51,52,53] in the research on the influence of water level changes in front of the slope on the slope stability. Among them, the study performed in Ref. [53] used the traditional saturated soil theory to study the safety factor when the water level in front of the slope drops when the permeability coefficient is a single variable. However, it is not clearly pointed out that the trend that the slope safety factor first decreases and then increases is only applicable to slopes with large permeability coefficients. The study in Ref. [54] pointed out that the fact that the safety factor first decreases and then increases during the drawdown of the water level in front of the slope is only applicable to a slope with a large slope permeability coefficient. However, in practical engineering, the permeability coefficients will be quite different when the soil quality is different, but a single change in the permeability coefficients is not convincing. In this section, the physical and mechanical parameters of medium sand with a large permeability coefficient and silt with a small permeability coefficient measured indoors were selected. A comparison of the variation law of the slope safety factor with the water level before the slope of two different filling materials when the speed at which the water level falls is constant is shown in Figure 9 and Figure 13. It is concluded that (1) for slopes with low permeability, the safety factor of the slope decreases gradually with the drop in the water level in front of the slope, and this law is not affected by the drop speed of the water level in front of the slope and (2) for slopes with high permeability, the safety factor of the slope first decreases and then increases during the water level drop in front of the slope.

5. Practical Application of Modeling Methods

Matrix suction is a special variable in unsaturated soil that changes with a change in the water content in a slope. In saturated soil, the suction of the matrix is zero, and the drop in the water level before the slope makes the original saturated soil transition into unsaturated soil. Therefore, in the analysis of seepage and slope stability, the special variable of matrix suction in unsaturated soil can be considered to make the results more reasonable.
Due to the characteristics of matrix suction in the unsaturated zone, according to the theory of unsaturated soil shear strength, the shear strength of soil will be improved to a certain extent due to matrix suction. To study the influence of matrix suction on slope stability, three drop speeds 0.5 cm/s, 0.05 cm/s, and 0.001 cm/s were selected, representing sudden drop, slow drop–sudden drop, and slow drop, respectively. Under working conditions, the safety factor of the slope was compared and analyzed after the water level in front of the slope dropped. The calculation results according to different classical methods are presented in Table 3.
It can be seen from Table 3 that with an increase in the speed at which the water level in front of the slope falls, the safety factor of the slope gradually decreases, which is the same as the results obtained in the previous analysis (Figure 9 and Figure 13). The safety factor is larger when the influence of matrix suction on slope stability is taken into account than when it is not considered. This is because the effect of matrix suction increases the shear strength of the slope and the safety factor. With a decrease in the speed at which the water level in front of the slope falls, the difference in the safety factor obtained by considering the matrix suction and without considering the matrix suction gradually increases. This is because under the condition of a relatively small deceleration, after the water level before the slope is stabilized, the unsaturated zone formed in the slope is large, and the influence of the matrix suction on the slope stability also increases. It can be seen that when the water level in front of the slope drops slowly, the safety factor of the slope increases to a certain extent when matrix suction is considered. In the engineering safety calculation, its influence on slope safety can be properly considered, and the safety factor when matrix suction is considered is used as a safety reserve.
Comparing different limit equilibrium methods, it can be seen that the Bishop method, which considers the normal force between bars to satisfy the moment balance, and the Morgenstern–Price method, which considers all the interbar forces to satisfy the moment balance and the force balance at the same time, have relatively similar safety factors. The safety factor is relatively small when we consider the normal force between strips and ignore the shear force between strips. The Janbu method only satisfies the force balance condition, and the traditional segment method ignores all the interstrip forces and only satisfies the moment balance equation. This is consistent with [54], as per which, under high pore water pressure, the results obtained by the traditional slicing method are relatively small and have large errors. Under the condition of the drawdown of water levels before the slope, it is more suitable to use the Morgenstern–Price method and the Bishop method for analysis, but in engineering practice, from the perspective of engineering safety, the slope stability obtained by the Janbu method and the traditional slicing method is not suitable for analysis. The results of the analysis should be properly considered.

6. Conclusions

In this paper, the reliability of the numerical model is verified by the test results of two indoor models, one of medium sand and one of silt. Through theoretical analysis combined with the GeoStudio finite element simulation calculation method, the effects of different speeds at which the water level falls, different falling ratios, different initial water levels, different filling materials, and matrix suction on the seepage field of the slope and the stability of the slope are emphatically studied. The following conclusions are drawn:
  • When the water level in front of the slope falls at different speeds, the greater this speed, the greater the downward seepage force formed by the seepage field of the slope to the slope body. When the water level in front of the slope falls at a constant speed, the penetration force is greater at the position closer to the slope.
  • When the speed at which the water level before the slope falls increases, the safety factor of the slope decreases. When the water level in front of the slope falls at different speeds, the change curve of the safety factor is steeper when the speed is more, and the safety factor value of the same water level before the slope is smaller. The safety factor of the slope when the water level falls at a speed of 0.5 cm/s (as studied in this paper) has a maximum falling range of 37% during the water level change process.
  • With an increase in the drop ratio, the safety factor of the slope decreases. When the drop ratio is constant, the loss of stability is worse if the initial water level is lower. Due to the difference in soil mechanical properties, under the condition of the drawdown of water levels in front of the slope, the noncohesive medium sand slope is more prone to instability failure than the cohesive silt slope.
  • When this modeling method is applied to matrix suction, it is found that the effect of matrix suction increases the safety factor of the slope. When the speed of the fall of the water level in front of the slope decreases, after the water level in the front of the slope is stable, the unsaturated area formed in the slope is larger, and the influence of the matrix suction on the stability of the slope also increases.

Supplementary Materials

The following supporting information can be downloaded at: https://www.mdpi.com/article/10.3390/w15020216/s1, Figure S1. Schematic diagram of finite element meshing, Figure S2. Pore pressure distribution in different deceleration slopes (kPa): (a) Initial steady state pore pressure; (b) v = 0.001 cm/s; (c) v = 0.01 cm/s; (d) v = 0.05 cm/s; (e) v = 0.1 cm/s; (f) v = 0.5 cm/s, Figure S3. Distribution of wetting lines in different deceleration slopes, Figure S4. Vector diagram of different speed-down flow speed. (a) v = 0.001 cm/s; (b) v = 0.5 cm/s, Figure S5. Pore pressure distribution in slope with different drop ratios (kPa) (a: initial, b to f: after free water drop), Figure S6. Pore pressure distribution at different initial water levels (kPa): (a) 75–42.5 cm; (b) 42.5–20 cm, Figure S7. Pore pressure distribution in different deceleration slopes (kPa) (a: initial, b to f: after free water drop), Figure S8. Distribution map of wetting lines in the slope.

Author Contributions

Conceptualization, Y.S.; software, K.Y.; validation, Z.L.; investigation, K.Y.; resources, G.W.; data curation, K.Y.; writing—original draft, Y.S.; writing—review & editing, Y.S.; visualization, Z.L.; supervision, R.H.; project administration, G.W. All authors have read and agreed to the published version of the manuscript.

Funding

This research received no external funding.

Informed Consent Statement

Informed consent was obtained from all subjects involved in the study.

Data Availability Statement

All data that support the findings of this study are available from the corresponding author upon reasonable request.

Conflicts of Interest

The authors declare no conflict of interest.

References

  1. Zhang, X.C.; Li, Y.R.; Liu, Y.S.; Huang, Y.X.; Wang, Y.S.; Lu, Z. Characteristics and prevention mechanisms of artificial slope instability in the Chinese Loess Plateau. CATENA 2021, 207, 105621. [Google Scholar] [CrossRef]
  2. Filho, O.A.; Fernandes, M.A. Landslide analysis of unsaturated soil slopes based on rainfall and matric suction data. Bull. Eng. Geol. Environ. 2019, 78, 4167–4185. [Google Scholar] [CrossRef]
  3. Cong, S.Y.; Tang, L.; Ling, X.Z.; Xing, W.Q.; Geng, L.; Li, X.Y.; Li, G.Y.; Li, H. Three-Dimensional Numerical Investigation on the Seepage Field and Stability of Soil Slope Subjected to Snowmelt Infiltration. Water 2021, 13, 2729. [Google Scholar] [CrossRef]
  4. Schorg, A.J.; Romano, S.P. Shallow and deep water aquatic vegetation potential for a midlatitude pool of the Upper Mississippi River System with drawdown. River Res. Appl. 2018, 34, 310–316. [Google Scholar] [CrossRef]
  5. Gan, B.R.; Yang, X.G.; Liao, H.M.; Zhou, J.W. Flood Routing Process and High Dam Interception of Natural Discharge from the 2018 Baige Landslide-Dammed Lake. Water 2020, 12, 605. [Google Scholar] [CrossRef] [Green Version]
  6. Luo, F.Y.; Zhang, G.; Ma, C.H. On the Soil Slope Failure Mechanism Considering the Mutual Effect of Bedrock and Drawdown. Int. J. Geomech. 2021, 21, 04020247. [Google Scholar] [CrossRef]
  7. Sun, D.M.; Zang, Y.G.; Semprich, S. Effects of Airflow Induced by Rainfall Infiltration on Unsaturated Soil Slope Stability. Transp. Porous Media 2015, 107, 821–841. [Google Scholar] [CrossRef]
  8. Wang, Y.X.; Chai, J.R.; Cao, J.; Qin, Y.; Xu, Z.G.; Zhang, X.W. Effects of seepage on a three-layered slope and its stability analysis under rainfall conditions. Nat. Hazards 2020, 102, 1269–1278. [Google Scholar] [CrossRef]
  9. Zhu, C.Q.; Cheng, H.L.; Chen, Z.Y.; Huang, Y. Simulation-based hazard management of a constructed landfill for flow slide scenario. Nat. Hazards 2021, 106, 1867–1878. [Google Scholar] [CrossRef]
  10. Zhu, C.Q.; Huang, Y.; Zhan, L.T. SPH-based simulation of flow process of a landslide at Hongao landfill in China. Nat. Hazards 2018, 93, 1113–1126. [Google Scholar] [CrossRef]
  11. Mekrishu, W.N.; Singh, S.K.; Ningthoujam, P.S.; Piuthaimei, G.Z. A study on the causative and triggering factors of multiple landslides in Lalmati, Nagaland and development of a sinking zone. Himal. Geol. 2022, 43, 73–84. [Google Scholar]
  12. Hou, X.P.; Chen, S.H.; Shahrour, I. Judgement of rapid drawdown conditions in slope stability analysis. Bull. Eng. Geol. Environ. 2021, 80, 4379–4387. [Google Scholar] [CrossRef]
  13. Liu, S.J.; Luo, F.Y.; Zhang, G. Centrifuge model tests on pile-reinforced slopes subjected to drawdown. J. Rock Mech. Geotech. Eng. 2020, 12, 1290–1300. [Google Scholar] [CrossRef]
  14. Sui, W.H.; Zheng, G.S. An experimental investigation on slope stability under drawdown conditions using transparent soils. Bull. Eng. Geol. Environ. 2018, 77, 977–985. [Google Scholar] [CrossRef]
  15. Wang, L.; Sun, D.A.; Li, L. 3D stability of partially saturated soil slopes after rapid drawdown by a new layer-wise summation method. Landslides 2019, 16, 295–313. [Google Scholar] [CrossRef]
  16. Zhou, J.F.; Qin, C.B. Stability analysis of unsaturated soil slopes under reservoir drawdown and rainfall conditions: Steady and transient state analysis. Comput. Geotech. 2022, 142, 104541. [Google Scholar] [CrossRef]
  17. Xue-wu, W.; Shang-jie, X.; Fa-ning, D. Analysis of stability of dam slope during rapid drawdown of reservoir water level. Rock Soil Mech. 2010, 31, 2760–2764. [Google Scholar]
  18. Zhou, J.-W.; Xu, F.-G.; Yang, X.-G.; Yang, Y.-C.; Lu, P.-Y. Comprehensive analyses of the initiation and landslide-generated wave processes of the 24 June 2015 Hongyanzi landslide at the Three Gorges Reservoir, China. Landslides 2016, 13, 589–601. [Google Scholar] [CrossRef]
  19. Moharrami, A.; Hassanzadeh, Y.; Salmasi, F.; Moradi, G.; Moharrami, G. Performance of the horizontal drains in upstream shell of earth dams on the upstream slope stability during rapid drawdown conditions. Arab. J. Geosci. 2014, 7, 1957–1964. [Google Scholar] [CrossRef]
  20. Özer, A.T.; Bromwell, L.G. Stability assessment of an earth dam on silt/clay tailings foundation: A case study. Eng. Geol. 2012, 151, 89–99. [Google Scholar] [CrossRef]
  21. Siacara, A.; Beck, A.T.; Futai, M.M. Reliability analysis of rapid drawdown of an earth dam using direct coupling. Comput. Geotech. 2020, 118, 103336. [Google Scholar] [CrossRef]
  22. Babanouri, N.; Dehghani, H. Investigating a potential reservoir landslide and suggesting its treatment using limit-equilibrium and numerical methods. J. Mt. Sci. 2017, 14, 432–441. [Google Scholar] [CrossRef]
  23. Bhaskar, P.; Puppala, A.J.; Boluk, B. Influence of Unsaturated Hydraulic Properties on Transient Seepage and Stability Analysis of an Earthen Dam. Int. J. Geomech. 2022, 22, 04022105. [Google Scholar] [CrossRef]
  24. Biniyaz, A.; Azmoon, B.; Liu, Z. Coupled transient saturated-unsaturated seepage and limit equilibrium analysis for slopes: Influence of rapid water level changes. Acta Geotech. 2022, 17, 2139–2156. [Google Scholar] [CrossRef]
  25. Xu, J.S.; Yang, X.L. Three-dimensional stability analysis of slope in unsaturated soils considering strength nonlinearity under water drawdown. Eng. Geol. 2018, 237, 102–115. [Google Scholar] [CrossRef]
  26. Cen, W.J.; Li, D.J.; Wang, H. Impact of transient seepage on slope stability of earth-rock dams with geomembrane barrier defects. Environ. Geotech. 2020, 7, 581–590. [Google Scholar] [CrossRef]
  27. Gao, X.C.; Liu, H.L.; Zhang, W.G.; Wang, W.; Wang, Z.Y. Influences of reservoir water level drawdown on slope stability and reliability analysis. Georisk-Assess. Manag. Risk Eng. Syst. Geohazards 2019, 13, 145–153. [Google Scholar] [CrossRef]
  28. Zhou, X.P.; Wei, X.; Liu, C.; Cheng, H. Three-Dimensional Stability Analysis of Bank Slopes with Reservoir Drawdown Based on Rigorous Limit Equilibrium Method. Int. J. Geomech. 2020, 20, 04020229. [Google Scholar] [CrossRef]
  29. Jinlong, L.; Jili, W.; Changwang, L. EFM Simulation on the influence of water level fluctuation on slope stability. Water Power 2007, 33, 41–44. [Google Scholar]
  30. Chen, Y.; Tian, R.; Li, H. Phosphorus transportation in runoff as influenced by cationic non-classic polarization: A simulation study. J. Soils Sediments 2020, 20, 308–319. [Google Scholar] [CrossRef]
  31. Liang, J.X.; Sui, W.H. Sensitivity Analysis of Anchored Slopes under Water Level Fluctuations: A Case Study of Cangjiang Bridge-Yingpan Slope in China. Appl. Sci. 2021, 11, 7137. [Google Scholar] [CrossRef]
  32. Tang, M.G.; Xu, Q.; Yang, H.; Li, S.L.; Iqbal, J.; Fu, X.L.; Huang, X.B.; Cheng, W.M. Activity law and hydraulics mechanism of landslides with different sliding surface and permeability in the Three Gorges Reservoir Area, China. Eng. Geol. 2019, 260, 105212. [Google Scholar] [CrossRef]
  33. Zhang, Z.H.; Huang, X.Y.; Liu, W.; Wang, L. Study on the Hydraulic Parameters of Woshaxi Landslide Soils during Water Level Drawdown of Three Gorges Reservoir. Geofluids 2020, 2020, 6283791. [Google Scholar] [CrossRef]
  34. Song, K.; Yan, E.; Zhang, G.; Lu, S.; Yi, Q. Effect of hydraulic properties of soil and fluctuation velocity of reservoir water on landslide stability. Environ. Earth Sci. 2015, 74, 5319–5329. [Google Scholar] [CrossRef]
  35. Huang, M.S.; Jia, C.Q. Strength reduction FEM in stability analysis of soil slopes subjected to transient unsaturated seepage. Comput. Geotech. 2009, 36, 93–101. [Google Scholar] [CrossRef]
  36. Pakmanesh, M.; Jahromi, S.H.M.; Khosrojerdi, A.; Darvishi, H.H.; Babazadeh, H. Experimental and numerical study of upstream slope stability in an earth dam reservoir under rapid drawdown conditions. Prog. Comput. Fluid Dyn. 2021, 21, 248–260. [Google Scholar] [CrossRef]
  37. Cao, J.T. Numerical simulation study on the slope stability of earth-rock dam considering dynamic action based on complex geological environment. Fresenius Environ. Bull. 2020, 29, 10924–10932. [Google Scholar]
  38. Oh, W.T.; Vanapalli, S.K. Modeling the stress versus settlement behavior of shallow foundations in unsaturated cohesive soils extending the modified total stress approach. Soils Found. 2018, 58, 382–397. [Google Scholar] [CrossRef]
  39. Zeng, L.; Liu, J.; Zhang, J.H.; Bian, H.B.; Lu, W.H. Effect of Colluvial Soil Slope Fracture’s Anisotropy Characteristics on Rainwater Infiltration Process. Adv. Civ. Eng. 2018, 2018, 7351628. [Google Scholar] [CrossRef] [Green Version]
  40. Alateya, H.; Asr, A.A. Numerical investigation into the stability of earth dam slopes considering the effects of cavities. Eng. Comput. 2020, 37, 1397–1421. [Google Scholar] [CrossRef]
  41. Jadid, R.; Montoya, B.M.; Bennett, V.; Gabr, M.A. Effect of repeated rise and fall of water level on seepage-induced deformation and related stability analysis of Princeville levee. Eng. Geol. 2020, 266, 105458. [Google Scholar] [CrossRef]
  42. Jiang, P.; Huang, Y.; Tao, Z.P.; Zhu, J.H.; Wang, N.; Qiao, J.W. Deformation Characteristics and Safety Evaluation of the Throw Filling Soft Clay Cofferdam under Super-Historical Flood Conditions. Adv. Civ. Eng. 2022, 2022, 9578477. [Google Scholar] [CrossRef]
  43. Nagy-Gode, F.K.; Torok, A. Rainfall-Induced or Lake-Water-Level-Controlled Landslide? An Example from the Steep Slopes of Lake Balaton, Hungary. Water 2022, 14, 1169. [Google Scholar] [CrossRef]
  44. Rotaru, A.; Bejan, F.; Almohamad, D. Sustainable Slope Stability Analysis: A Critical Study on Methods. Sustainability 2022, 14, 8847. [Google Scholar] [CrossRef]
  45. Rabie, M. Comparison study between traditional and finite element methods for slopes under heavy rainfall. HBRC J. 2014, 10, 160–168. [Google Scholar] [CrossRef] [Green Version]
  46. Kaczmarek, L.D.; Popielski, P. Selected components of geological structures and numerical modelling of slope stability. Open Geosci. 2019, 11, 208–218. [Google Scholar] [CrossRef]
  47. Mao, C. Seepage Computation Analysis & Control; China Water Resources and Hydropower Press: Beijing, China, 2003. [Google Scholar]
  48. Jia, C.; Huang, M.; Wang, G. Analysis of Stability of Soil Slope During Rapid Drawdown of Water Table. J.-Tongji Univ. 2008, 36, 304. [Google Scholar]
  49. Zucca, M.; Crespi, P.G.; Longarini, N. Seismic vulnerability assessment of an Italian historical masonry dry dock. Case Stud. Struct. Eng. 2017, 7, 1–23. [Google Scholar] [CrossRef] [Green Version]
  50. Lane, P.; Griffiths, D. Assessment or stability of slopes under drawdown conditions. J. Geotech. Geoenviron. Eng. 2000, 126, 443–450. [Google Scholar] [CrossRef]
  51. Nian, T.K.; Wan, S.S.; Jiang, J.C.; Luan, M.T. Finite element analysis of slope stability under drawdown conditions by strength reduction technique. Rock Soil Mech. 2010, 31, 2264–2269. [Google Scholar]
  52. Zheng, Y.-R.; Shi, W.; Kong, W.-X. Calculation of seepage forces and phreatic surface under drawdown conditions. Chin. J. Rock Mech. Eng. 2004, 23, 3203–3210. [Google Scholar]
  53. Zhang, W.-J.; Zhan, L.; Ling, D. Influence of reservoir water level fluctuations on stability of unsaturated soil banks. J.-Zhejiang Univ. Eng. Sci. 2006, 40, 1365. [Google Scholar]
  54. Duncan, J.M. State of the art: Limit equilibrium and finite-element analysis of slopes—Closure. J. Geotech. Geoenviron. Eng. 1997, 123, 894. [Google Scholar] [CrossRef]
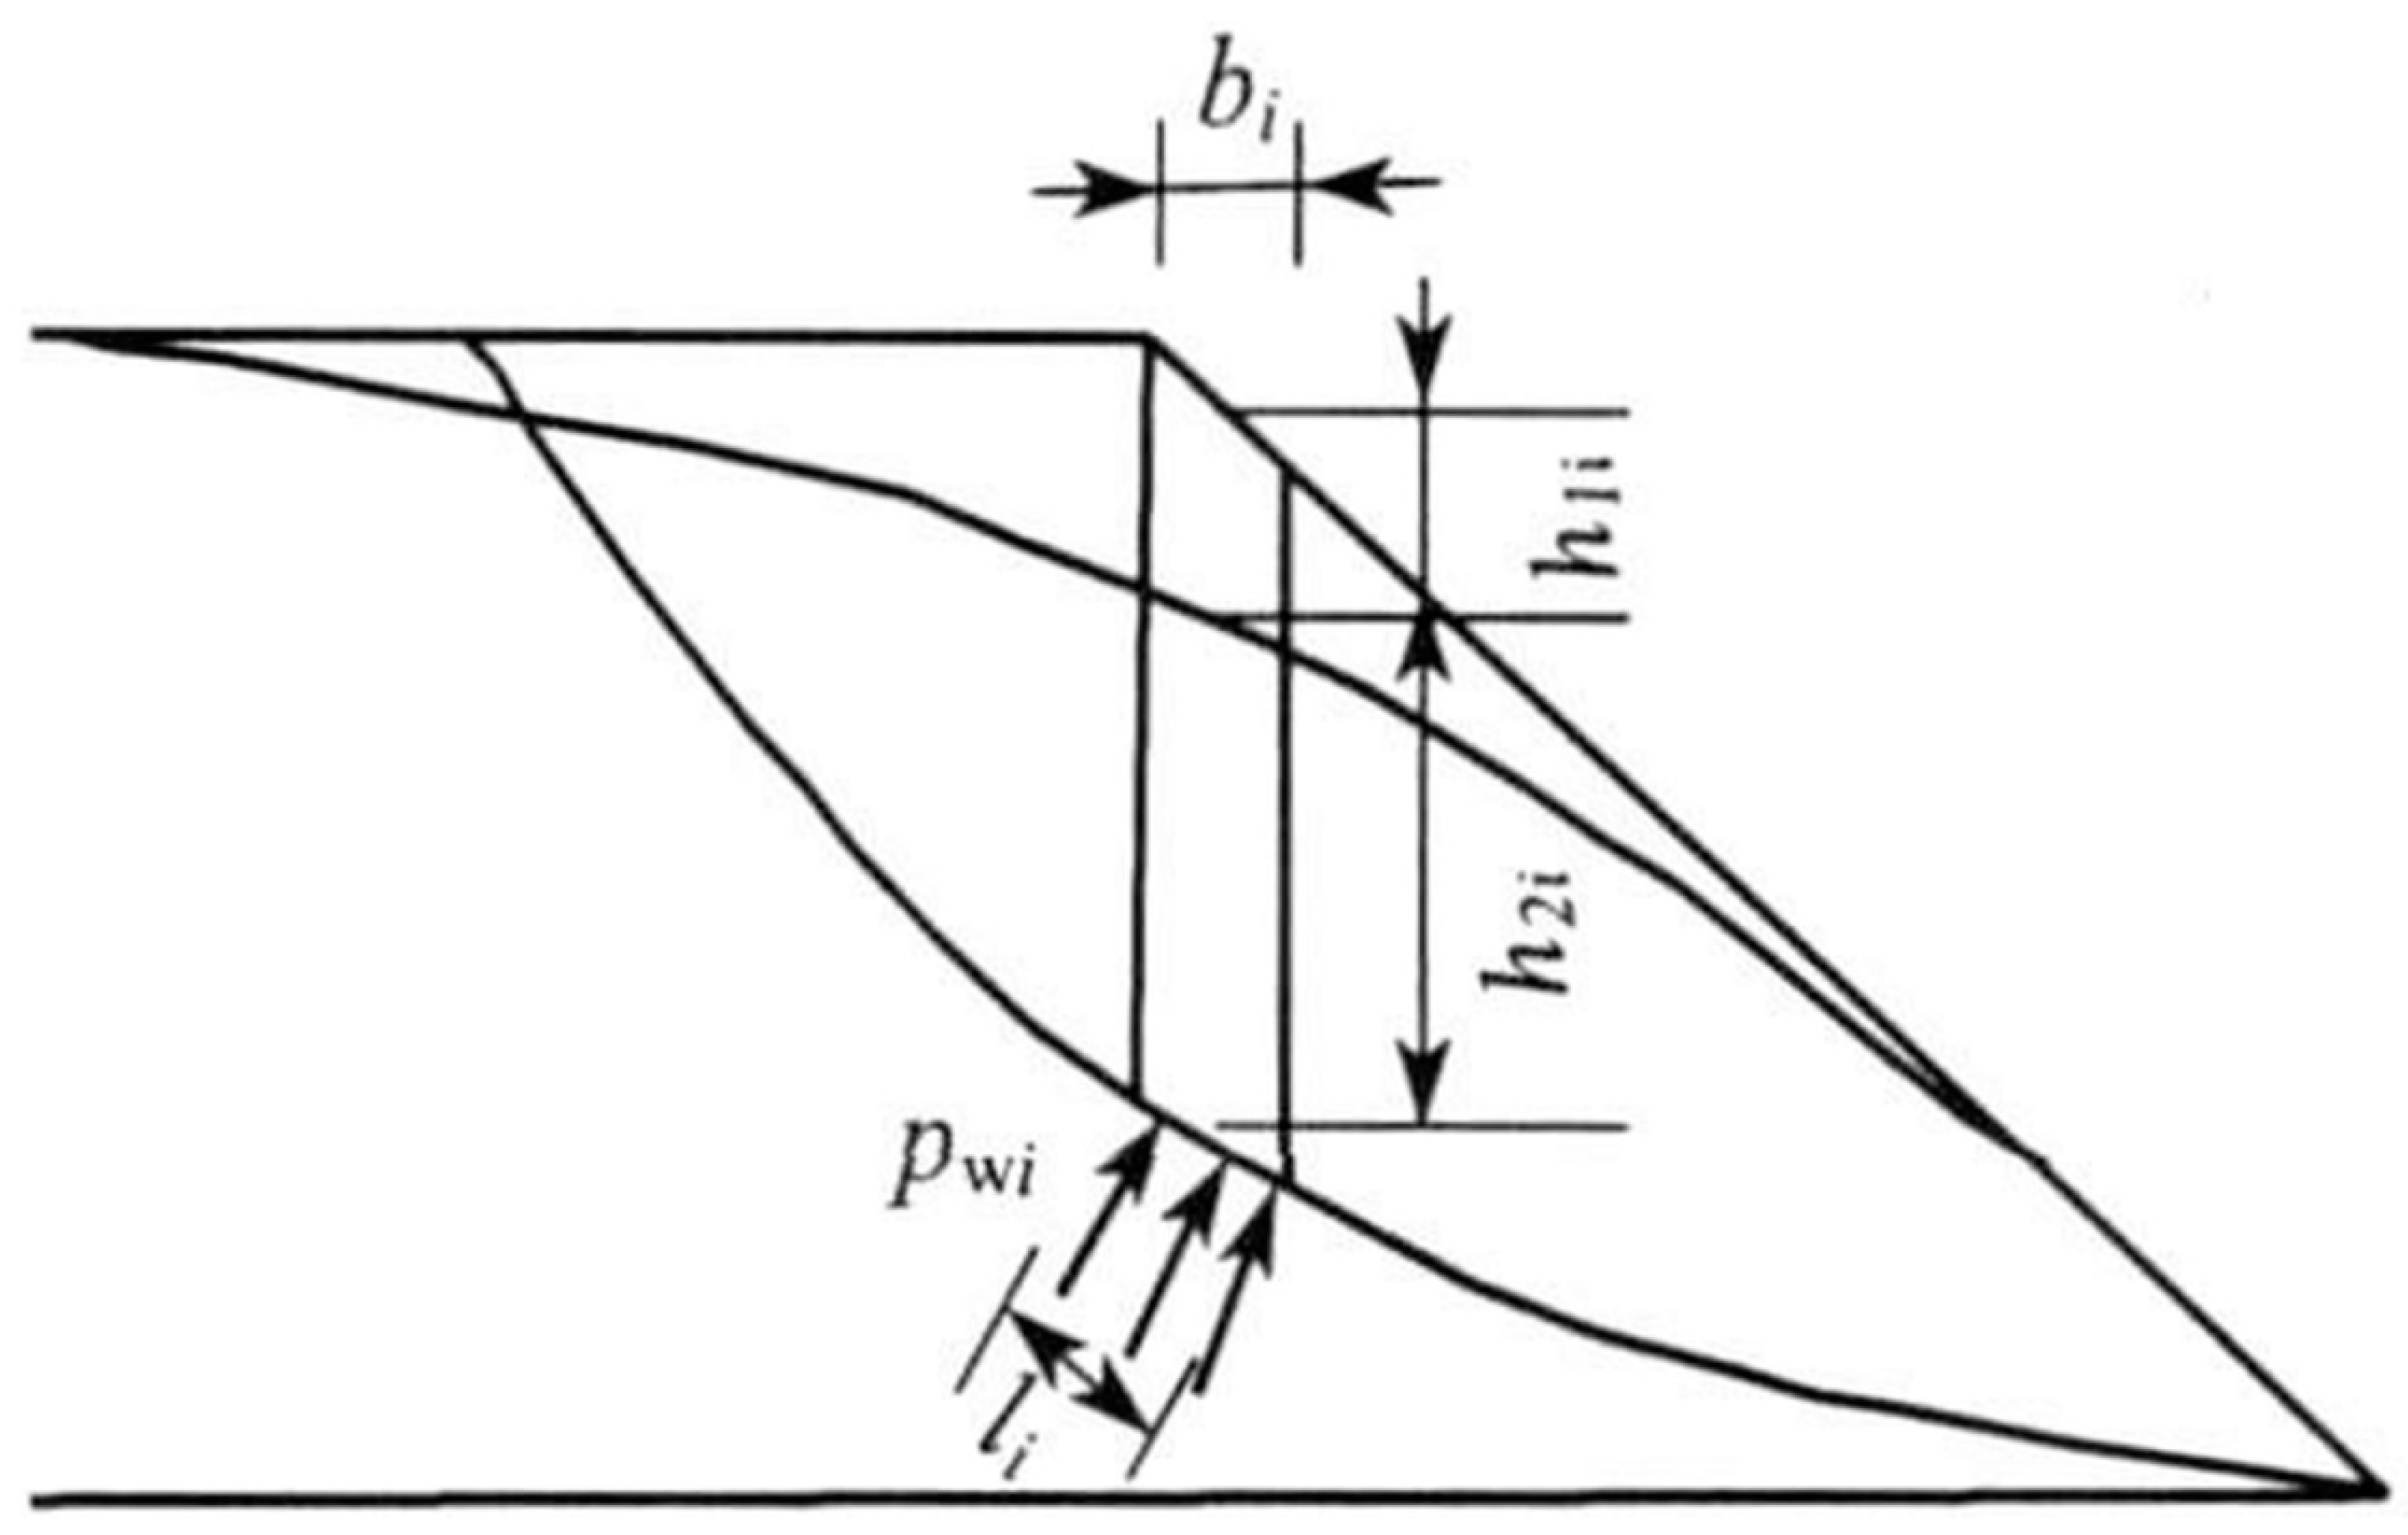
Figure 1. Sketch map for calculation of safety factor.
Water 15 00216 g001
Figure 2. The layout of the model box and marking points: (a) model box; (b) mark point arrangement; (c) instrument burial.
Water 15 00216 g002
Figure 3. Medium sand and silt: (a) medium sand; (b) silt.
Water 15 00216 g003
Figure 4. Micro-osmometer and embedded position map of earth pressure box in model test of medium sand slope (m).
Water 15 00216 g004
Figure 5. Model test of silt slope osmometer, earth pressure box buried location map (m).
Water 15 00216 g005aWater 15 00216 g005b
Figure 6. Slope dimension diagram of an example studied after [50].
Water 15 00216 g006
Figure 7. Comparison of results of different soil model tests and numerical simulation: (a) medium sand; (b) silt.
Water 15 00216 g007
Figure 8. Comparison of water levels inside and outside of the silt slope with different deceleration slopes: (a) x = 230 cm; (b) x = 165 cm; and (c) x = 100 cm.
Water 15 00216 g008
Figure 9. Variation of the safety factor of silt slope with different influence conditions under different water levels: (a) falling speed; (b) time.
Water 15 00216 g009
Figure 10. Changes in slope stability with time for different drop ratios after the water level stabilizes.
Water 15 00216 g010
Figure 11. Changes in slope stability with time at different initial water levels after water level stabilization.
Water 15 00216 g011
Figure 12. Variation of pore pressure at different points in slopes with different materials: (a) x = 100 cm; (b) x = 140 cm; (c) x = 180 cm; (d) x = 220 cm; and (e) x = 250 cm.
Water 15 00216 g012
Figure 13. The safety factor of medium sand slope varies with different influence conditions under different water levels: (a) falling speed and (b) time.
Water 15 00216 g013
Table 1. Physical and mechanical parameters of soil material in model test.
SoilNatural Weight γ (kN/m3)Permeability Coefficient k (cm/s)Cohesion c (kPa)Friction Angle φ (°)
Medium sand19.42.4 × 10−2032
Silt23.01.9 × 10−41.9223
Table 2. Model test part working condition table.
Filling MaterialSlope Ratio (Height: Width)Slope Height (cm)Landing Velocity (cm/s)Drop (cm)
Medium sand1:2750.04354
Silt1:0.7900.1546
Table 3. Comparison of the influence of matrix suction on the safety factor of the slope.
V (cm/s)BishopJanbuOrdinayMorgenstern–Price
YesNoYesNoYesNoYesNo
0.51.5551.5531.4321.4281.4491.4461.5531.550
0.051.6061.5941.4851.4581.4931.4691.6041.592
0.0011.7621.7131.6541.5591.6601.5971.7611.711
Note: “Yes” in the table refers to the calculation result considering the influence of matrix suction, and “No” means the calculation result without considering the influence of matrix suction.
Disclaimer/Publisher’s Note: The statements, opinions and data contained in all publications are solely those of the individual author(s) and contributor(s) and not of MDPI and/or the editor(s). MDPI and/or the editor(s) disclaim responsibility for any injury to people or property resulting from any ideas, methods, instructions or products referred to in the content.