Article

Combining Transcriptomic and Metabolomic Analyses to Investigate the Acute Effects of Microcystin-LR and Nanoplastics of Asian Clams

1
Fishery Machinery and Instrument Research Institute, Chinese Academy of Fishery Sciences, Shanghai 200092, China
2
Key Laboratory of Aquaculture Facilities Engineering, Ministry of Agriculture and Rural Affairs, Shanghai 200092, China
*
Author to whom correspondence should be addressed.
Water 2023, 15(19), 3519; https://doi.org/10.3390/w15193519
Submission received: 24 May 2023 / Revised: 14 August 2023 / Accepted: 29 August 2023 / Published: 9 October 2023
(This article belongs to the Special Issue Aquaculture Water Safety)

Abstract

:
In agricultural and fishery production, the occurrence of cyanobacterial blooms and the contamination of freshwater systems with microplastics have become increasingly important research focuses. However, the individual and combined toxic mechanisms of these two pollutants are not yet fully understood. Therefore, in this study, we analyzed the effects of these two stressors, microcystins (MC) and nanoplastics (NP), on the transcriptome and metabolome of the hepatopancreas of river clams. RNA and metabolites extracted from river clams treated with MC, NP, and a combination of MC and NP were used to construct standardized cDNA libraries, which were then subjected to integrated analysis. Significant enrichment of 49 pathways, 34 pathways, and 44 pathways was observed in the MC group compared to the control group, NP group compared to the control group, and NP-MC group compared to the control group, respectively. In these three experimental groups, we found that the lysosome pathway, which affects immune function and cell apoptosis, was enriched with numerous differentially expressed genes and metabolites. Changes in ATP6N and ADP may impair lysosomal acidification and disrupt normal lysosomal degradation processes, indicating interference with the hepatopancreatic metabolism of pollutants. Interestingly, we observed significant alterations in the cathepsin family, and the downregulation of cathepsin genes, along with the downregulation of ATP6N, implies a potential disruption in lysosomal proteolysis. In the NP-MC group, the downregulation of purine expression levels suggests an impact on the immune system of river clams by NP-MC. In conclusion, while there is some overlap in the damage caused to the hepatopancreas of river clams by MCs, MPs, and the combination of NP-MC, further research is necessary to fully understand their effects.

1. Introduction

The contamination of aquatic ecosystems by nanoplastics (NPs) and harmful algal blooms (HABs) is an increasing concern worldwide [1,2]. NPs are small plastic particles (<5 mm) that accumulate in the environment and can negatively impact aquatic organisms by causing physical damage or ingestion, while HABs produce toxins that can lead to significant harm to human health and ecosystem stability [3,4]. Microcystin-LR (MC-LR), a common toxin produced by cyanobacteria, has been shown to have adverse effects on freshwater organisms, including the Asian clam (Corbicula fluminea) [5]. Predicted environmental concentrations of nanoplastics are ≤1 μg/L; the concentrations of MCs in some marine environments were reported in the range 0.1–20 μg/L [6]. As a filter feeder, C. fluminea is a significant component of freshwater ecosystems and can accumulate harmful substances such as NPs and MC-LR [7]. Therefore, understanding the mechanisms underlying the responses of C. fluminea to these stressors is essential to assess their potential impact on freshwater ecosystems. In this study, we performed an integrated analysis of transcriptomic and metabolomic data to evaluate the responses of the hepatopancreas of C. fluminea to NP and MC-LR stress.
Freshwater aquaculture has been recognized as an important source of animal protein for human consumption. However, the presence of NPs and MC in freshwater systems has raised concerns about their potential risks to aquaculture. NPs are small plastic particles that have become ubiquitous in freshwater systems worldwide, posing a significant threat to aquatic organisms, including fish, shellfish, and crustaceans [8]. On the other hand, MC, a group of toxic cyclic peptides produced by cyanobacteria, have also been detected in freshwater systems and can accumulate in fish and shellfish tissues. The distribution of NPs and MC in freshwater systems has been reported globally. NPs have been found in surface waters, sediments, and biota, with concentrations varying depending on the location, season, and hydrological conditions. MC have been detected in freshwater systems affected by harmful algal blooms, which are becoming more frequent due to eutrophication caused by anthropogenic activities [1,2,3,4,5].
Both NPs and MC can pose significant health risks to aquatic organisms and human consumers of aquaculture products [1,2,3,4]. NPs can cause physical damage, blockage of digestive tracts, and accumulation of toxic substances, leading to reduced growth, reproduction, and survival of aquatic organisms. MC can cause acute or chronic toxicity in fish and shellfish, leading to liver damage, neurotoxicity, and even death [5,6,7,8].
Despite the potential risks, the research on the impacts of NPs and MC on freshwater aquaculture is still limited. Studies have focused on the detection of NPs and MC in aquatic organisms and their environments, but the mechanisms of their toxicity and the response of aquatic organisms to their exposure are not yet fully understood. Therefore, more research is needed to understand the effects of NPs and MC on freshwater aquaculture and to develop effective management strategies to reduce their impacts.
Transcriptomic and metabolomic investigations have become pivotal in examining the reactions of organisms to environmental pressures [9]. The first is the holistic exploration of gene expression in an organism or specific tissue, whereas the latter looks at the production of minute molecules or metabolites by an organism. Both techniques offer an exhaustive insight into the molecular processes that underpin organismal responses to environmental factors. Studying Peneaus vannamei through multiomics analysis uncovers the individual and combined impacts of NPs and di-(2-ethylhexyl) phthalate (DEHP). The combination of NPs and DEHP disrupts the balance of amino acid and lipid metabolism, leading to inflammatory reactions and impairing purine metabolism [10]. In the case of rare minnow (Gobiocypris rarus), exposure to NPs resulted in metabolic shifts within the liver. The findings suggest that NP exposure provoked immune responses, oxidative stress, and disrupted glycolipid and energy metabolism [11].
The hepatopancreas is a vital organ in C. fluminea that plays a crucial role in digestion, nutrient storage, and metabolism [12,13,14]. Therefore, it is an essential target for investigating the effects of NP and MC-LR stress. In this study, we focused on the hepatopancreas of C. fluminea and performed an integrated analysis of transcriptomic and metabolomic data to evaluate the responses of this organ to NP and MC-LR stress. Our results provide insights into the molecular mechanisms underlying the responses of C. fluminea to these stressors and contribute to the understanding of the potential impact of NP and MC-LR contamination on freshwater ecosystems.

2. Materials and Methods

2.1. Procurement and Cultivation of Experimental Subjects

The Asian clam specimens utilized in this research were sourced from Songjiang, Shanghai, China. The clams had an average weight of 6.75 ± 0.22 g and a shell length of 25.28 ± 1.09 mm. Prior to the experiment, the clams were acclimated in a laboratory incubator with freshwater at a temperature range of 25 ± 0.85 °C for a duration of 7 days. Only healthy C. fluminea were selected for the subsequent experiments.

2.2. Collection of Samples for NP and MC Exposure

The experimental clams, C. fluminea, were randomly allocated into four distinct groups, each group having three tanks and each tank having 10 clams: a control group with no exposure to any substances, a group exposed to 320 µg/L of microcystin-LR (≥95) (MC group) (Yuanye, Shanghai, China), a group exposed to 640 mg/L of nanoplastics (NP group) (Zhongtai, Nantong, China), and a group exposed to both 320 µg/L of microcystin-LR and 640 mg/L of nanoplastics (NP-MC group). The nanoplastics used in this experiment were spherical polystyrene plastic particles with a diameter of 20 µm. Post 96 h of exposure, hepatopancreas samples were swiftly extracted under sterile conditions. The replicates (n = 3) were collected from each group for high-throughput transcriptome sequencing and subsequent qRT-PCR. The replicates (n = 7) were collected from each group for metabolomic analyses.

2.3. Sample Processing and Examination

Total RNA was extracted using the Trizol Reagent Kit (YuanYe, Shanghai, China). The quality of RNA was assessed using the Agilent 2100 Bioanalyzer (Agilent Technologies, Palo Alto, CA, USA), and the integrity of RNA was confirmed through RNase-free agarose gel electrophoresis. Subsequently, eukaryotic mRNA was enriched using oligo (dT) magnetic beads, while prokaryotic mRNA was enriched using the Ribo-ZeroTM Magnetic Kit (Epicentre, Madison, WI, USA) to remove rRNA. The enriched mRNA fragments were then fragmented using a lysis buffer, followed by reverse transcription into cDNA using random primers. The cDNA fragments were purified using the QiaQuick PCR Extraction Kit (Qiagen, Venlo, The Netherlands) and further processed through end-repair, adenylation, and ligation to Illumina sequencing adapters. Gel electrophoresis was performed to select the ligated products, which were then amplified by PCR. Sequencing was carried out on the Illumina Novaseq6000 platform by Oebiotech Technology Inc. (Shanghai, China).
A total of 100 mg of accurately weighed sample was transferred to a 1.5 mL Eppendorf tube. Two small steel balls were added to the tube. L-2-chlorophenylalanine (0.3 mg/mL) dissolved in methanol as internal standard and a mixture of methanol and water (4/1, v/v) were added to each sample. Samples were stored at −20 °C for 2 min and then grinded at 60 HZ for 2 min, and the whole samples were extracted by ultrasonic for 10 min in an ice-water bath and stored at −20 °C for 30 min. The extract was centrifuged at 4 °C (13,000 rpm) for 10 min. Supernatant in a glass vial was dried in a freeze concentration centrifugal dryer. The mixture of methanol and water (1/4, vol/vol) was added to each sample and samples were vortexed for 30 s, extracted by ultrasonic for 3 min in an ice-water bath, then placed at −20 °C for 2 h. Samples were centrifuged at 4 °C (13,000 rpm) for 10 min. The supernatants from each tube were collected using crystal syringes, filtered through 0.22 μm microfilters, and transferred to LC vials. The vials were stored at −80 °C until LC-MS analysis. QC samples were prepared by mixing aliquot of all samples to be a pooled sample. [15,16].

2.4. Bioinformatics Analysis

Using the unigenes as the library, the software packages bowtie2 (http://bowtie-bio.sourceforge.net/bowtie2/manual.shtml, accessed on 10 July 2023) and express (Nucleotide BLAST: Search nucleotide databases using a nucleotide query (nih.gov), accessed on 20 March 2023) were used to calculate the expression abundance of each unigene in each sample through the comparison of sequence similarity. The expression of the unigenes was calculated by the fragments per kilobase per million reads (FPKM) method. The DESeq R package (1.8.3) was used to analyze differential expression of control and experimental groups. DESeq provides a statistical program for determining differential expression in digital gene expression data by using a model based on the negative binomial distribution. Benjamini and Hochberg’s approach was used to control the false discovery rate (FDR) to adjust the resulting p-values. Genes with an adjusted p-value < 0.05 found by DESeq were designated as differentially expressed genes (DEGs). The obtained transcriptome libraries undergo clean read filtering, alignment with ribosomal RNA (rRNA), sample correlation analysis (including alignment with the reference genome (Gracilariopsis Chorda), gene abundance quantification, and principal component analysis), as well as GO enrichment analysis and KEGG enrichment analysis of differentially expressed genes (DEGs).
The raw data files (.raw) were imported into the CD database search software. Simple filtering parameters such as retention time and mass-to-charge ratio were applied. Different samples were then peak-aligned based on a retention time deviation of 12 s and a mass deviation of 3 ppm. Subsequently, peak extraction was performed based on set parameters. Meanwhile, the peak area was quantified. Target ions were then integrated, followed by molecular formula prediction through molecular ion peaks and fragment ions and comparison with the mzCloud, mzVault, and Masslist databases. Background ions were removed using blank samples, and the quantification results were normalized. The metabolites were annotated using the Kyoto Encyclopedia of Genes and Genomes (KEGG) database (http://www.genome.jp/kegg/, accessed on 14 January 2023), Human Metabolome database (http://www.hmdb.ca/, accessed on 14 January 2023), and Lipidmaps database (http://www.lipidmaps.org/, accessed on 15 January 2023). The metabolites were analyzed using principal component analysis (PCA) and orthogonal projection to latent structure discriminant analysis (OPLS-DA) at metaX. The statistical significance (p-value) of differences was calculated using univariate analysis (t-test). The metabolites were differential metabolites at VIP > 1, p-value < 0.05, and fold change (FC) ≥ 2 or ≤0.5. Metabolites of interest were filtered using volcano plots created with the log2 (FC) and −log10 (p-value) metabolite data. Clustering heat maps were plotted using the Pheatmap package of R, and the data were normalized using z-scores of the intensity areas of differential metabolites. The correlation between differential metabolites was analyzed by cor () in R (method = Pearson). A p-value < 0.05 was statistically significant, and correlation plots were plotted using the corrplot package in R. The KEGG database was used to analyze the functions of these metabolites and their metabolic path ways. Metabolic pathway enrichment analysis of differential metabolites was performed, and a metabolic pathway was enriched when the ratio was satisfied by x/n > y/N and the p-value was <0.05.
To further evaluate the ability of multiple omics features to distinguish sample groups, a random forest model was constructed using the normalized multi-omics features. The ROC curve was used to assess the model’s classification performance, determining whether the multi-omics features can effectively predict different sample groups. This random forest model can also be utilized for biomarker selection. The correlation analysis of differential substances between different omics can provide insights into the associations across omics. First, we performed filtering on the gene and metabolite data separately. Under the premise of meeting the significance of differential analysis within each omics, we selected the top 1000 data entries with the highest absolute log2 (fold change). If the number of data entries was less than 1000, all data were selected.

2.5. Validation of DEGs by qRT-PCR

We selected 9 DEGs to verify the accuracy of transcriptome sequencing results using qRT-PCR with increased and decreased expression levels, and these DEGs belonged to the pathways that were more affected in high salinity. The RNA samples used for qRT-PCR were the same as those used to construct the transcriptome library. The optimal primers (Table 1) were selected by plotting standard, which could generate single PCR products. Expression of β-actin is more stable than that of other housekeeping genes, so we used it as the endogenous control to verify the success of reverse transcription and to calibrate the cDNA template [17]. The total qRT-PCR reaction contained 500 ng of cDNA, 6.8 μL of RNase-free water, 10 μL of 2× TB Green® Premix Ex Taq™ II (TaKaRa, Kyoto, Japan), and 0.8 μL of each forward and reverse gene-specific primer (10 mM). The cycling parameters included an initial denaturation step at 95 °C for 30 s, followed by 35 cycles at 95 °C for 5 s and 55 °C for 30 s. The relative expression levels of the DEGs were calculated using the 2−ΔΔCT method (K.J. Livak, T.D. Schmittgen, Analysis of relative gene expression data using real-time quantitative PCR and the 2−ΔΔCT method, Methods 25 (4) (2001) 402–408).

3. Results

3.1. Transcriptomic Analysis

3.1.1. DEG Analysis

The sequencing data for the hepatopancreas tissues analyzed in control and experimental groups (MC, NP, and NP-MC) were obtained using Illumina paired-end sequencing technology. Figure 1 shows the changes in mRNA levels of the three experimental groups. In MC vs. control (Figure 1A), expression levels of 8561 genes had changed significantly, with 3525 genes upregulated and 5036 genes downregulated. In NP vs. control (Figure 1B), expression levels of 2043 genes had changed significantly, with 865 genes upregulated and 1178 genes downregulated. The total number of DEGs increased to 1630 in MC vs. NP (Figure 1C) and peaked in NP-MC vs. MC (Figure 1E), with 8432 upregulated and 7669 downregulated genes. In NP-MC vs. control (Figure 1D), 2749 DEGs were identified, with 1940 genes upregulated and 809 genes downregulated. In NP-MC vs. NP (Figure 1F), 7675 DEGs were identified, with 4563 genes upregulated and 3112 genes downregulated. To confirm the accuracy of the transcriptome data, expression levels of nine DEGs were measured by qRT-PCR, and expression patterns were similar to those of the RNA-Seq results of MC vs. control (Figure 2). The PCA analysis demonstrates that samples from the same treatment group cluster together, indicating consistency among samples within each treatment group (Figure S1).

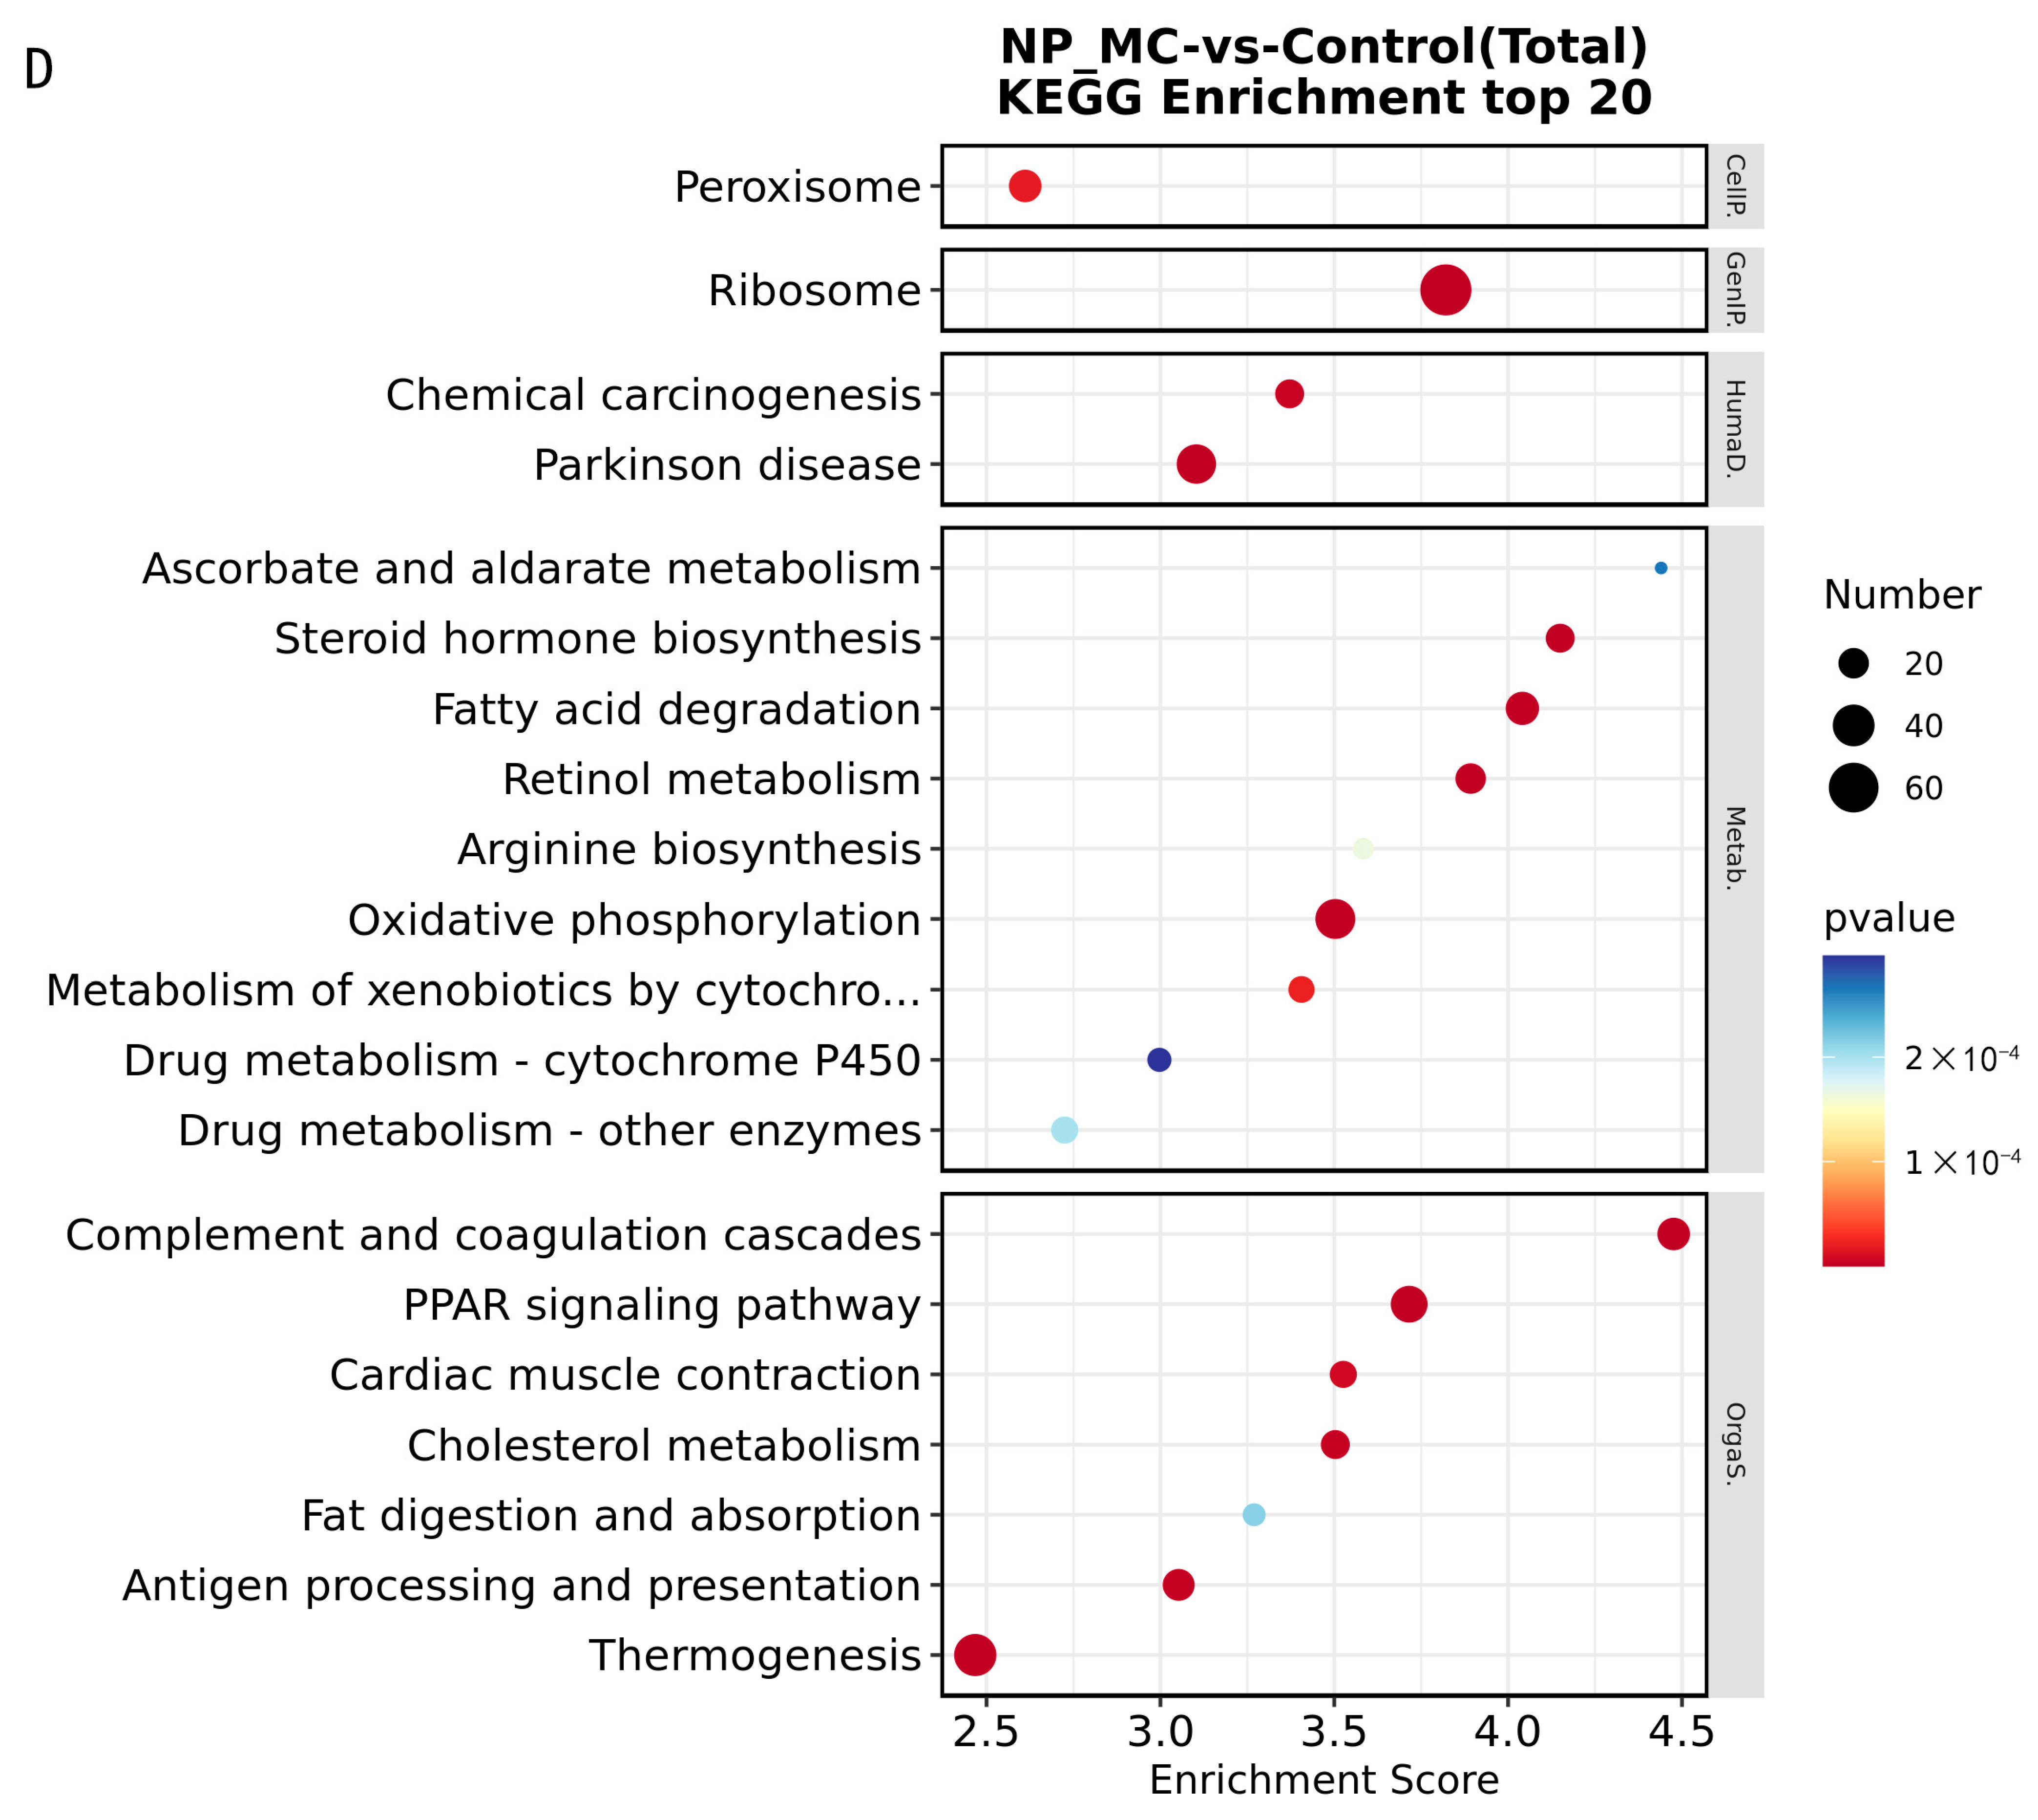
3.1.2. Enrichment Analysis of DEGs

To evaluate the significance of the DEGs, all DEGs identified in hepatopancreas tissues of four groups were assigned GO terms. In the GO analysis of DEGs, there were significant enrichment items under the p-value < 0.05 in MC vs. control, NP vs. control, MC vs. NP, NP-MC vs. control, NP-MC vs. MC, and NP-MC vs. NP, which classified into biological process (BP), cellular component (CC), or molecular function (MF) groups (Figure 3). The largest number of DEGs was assigned to the BP category, followed by CC and MF.
To further evaluate the effect of MC and NP on biochemical pathways, DEGs were mapped using the KEGG database. Some DEGs were involved in the lysosome pathway, TCA cycle pathway, histidine metabolism pathway, and purine metabolism pathway (Figure 4). According to NR annotation, many DEGs were related to immune defense, apoptosis, and the cytoskeleton, including growth arrest and DNA damage-inducible proteins (GADD45), cyclooxygenase 1 (COX1), cyclooxygenase 3 (COX3), caspase-7 (CASP7), caspase-8 (CASP8), Toll-like receptor 1 (TLR1), nuclear factor kappa-B (NF-κB), and TANK binding kinase 1 (TBK1). These results suggest that these genes might promote adaption of Asian clams to MC and NP. The Venn diagram analysis indicates that there are 3216 unique differentially expressed genes in the MC vs. control comparison, 442 unique differentially expressed genes in the NP vs. control comparison, and 491 unique differentially expressed genes in the NP-MC vs. control comparison. (Figure S3).

3.2. Metabolomic Analyses

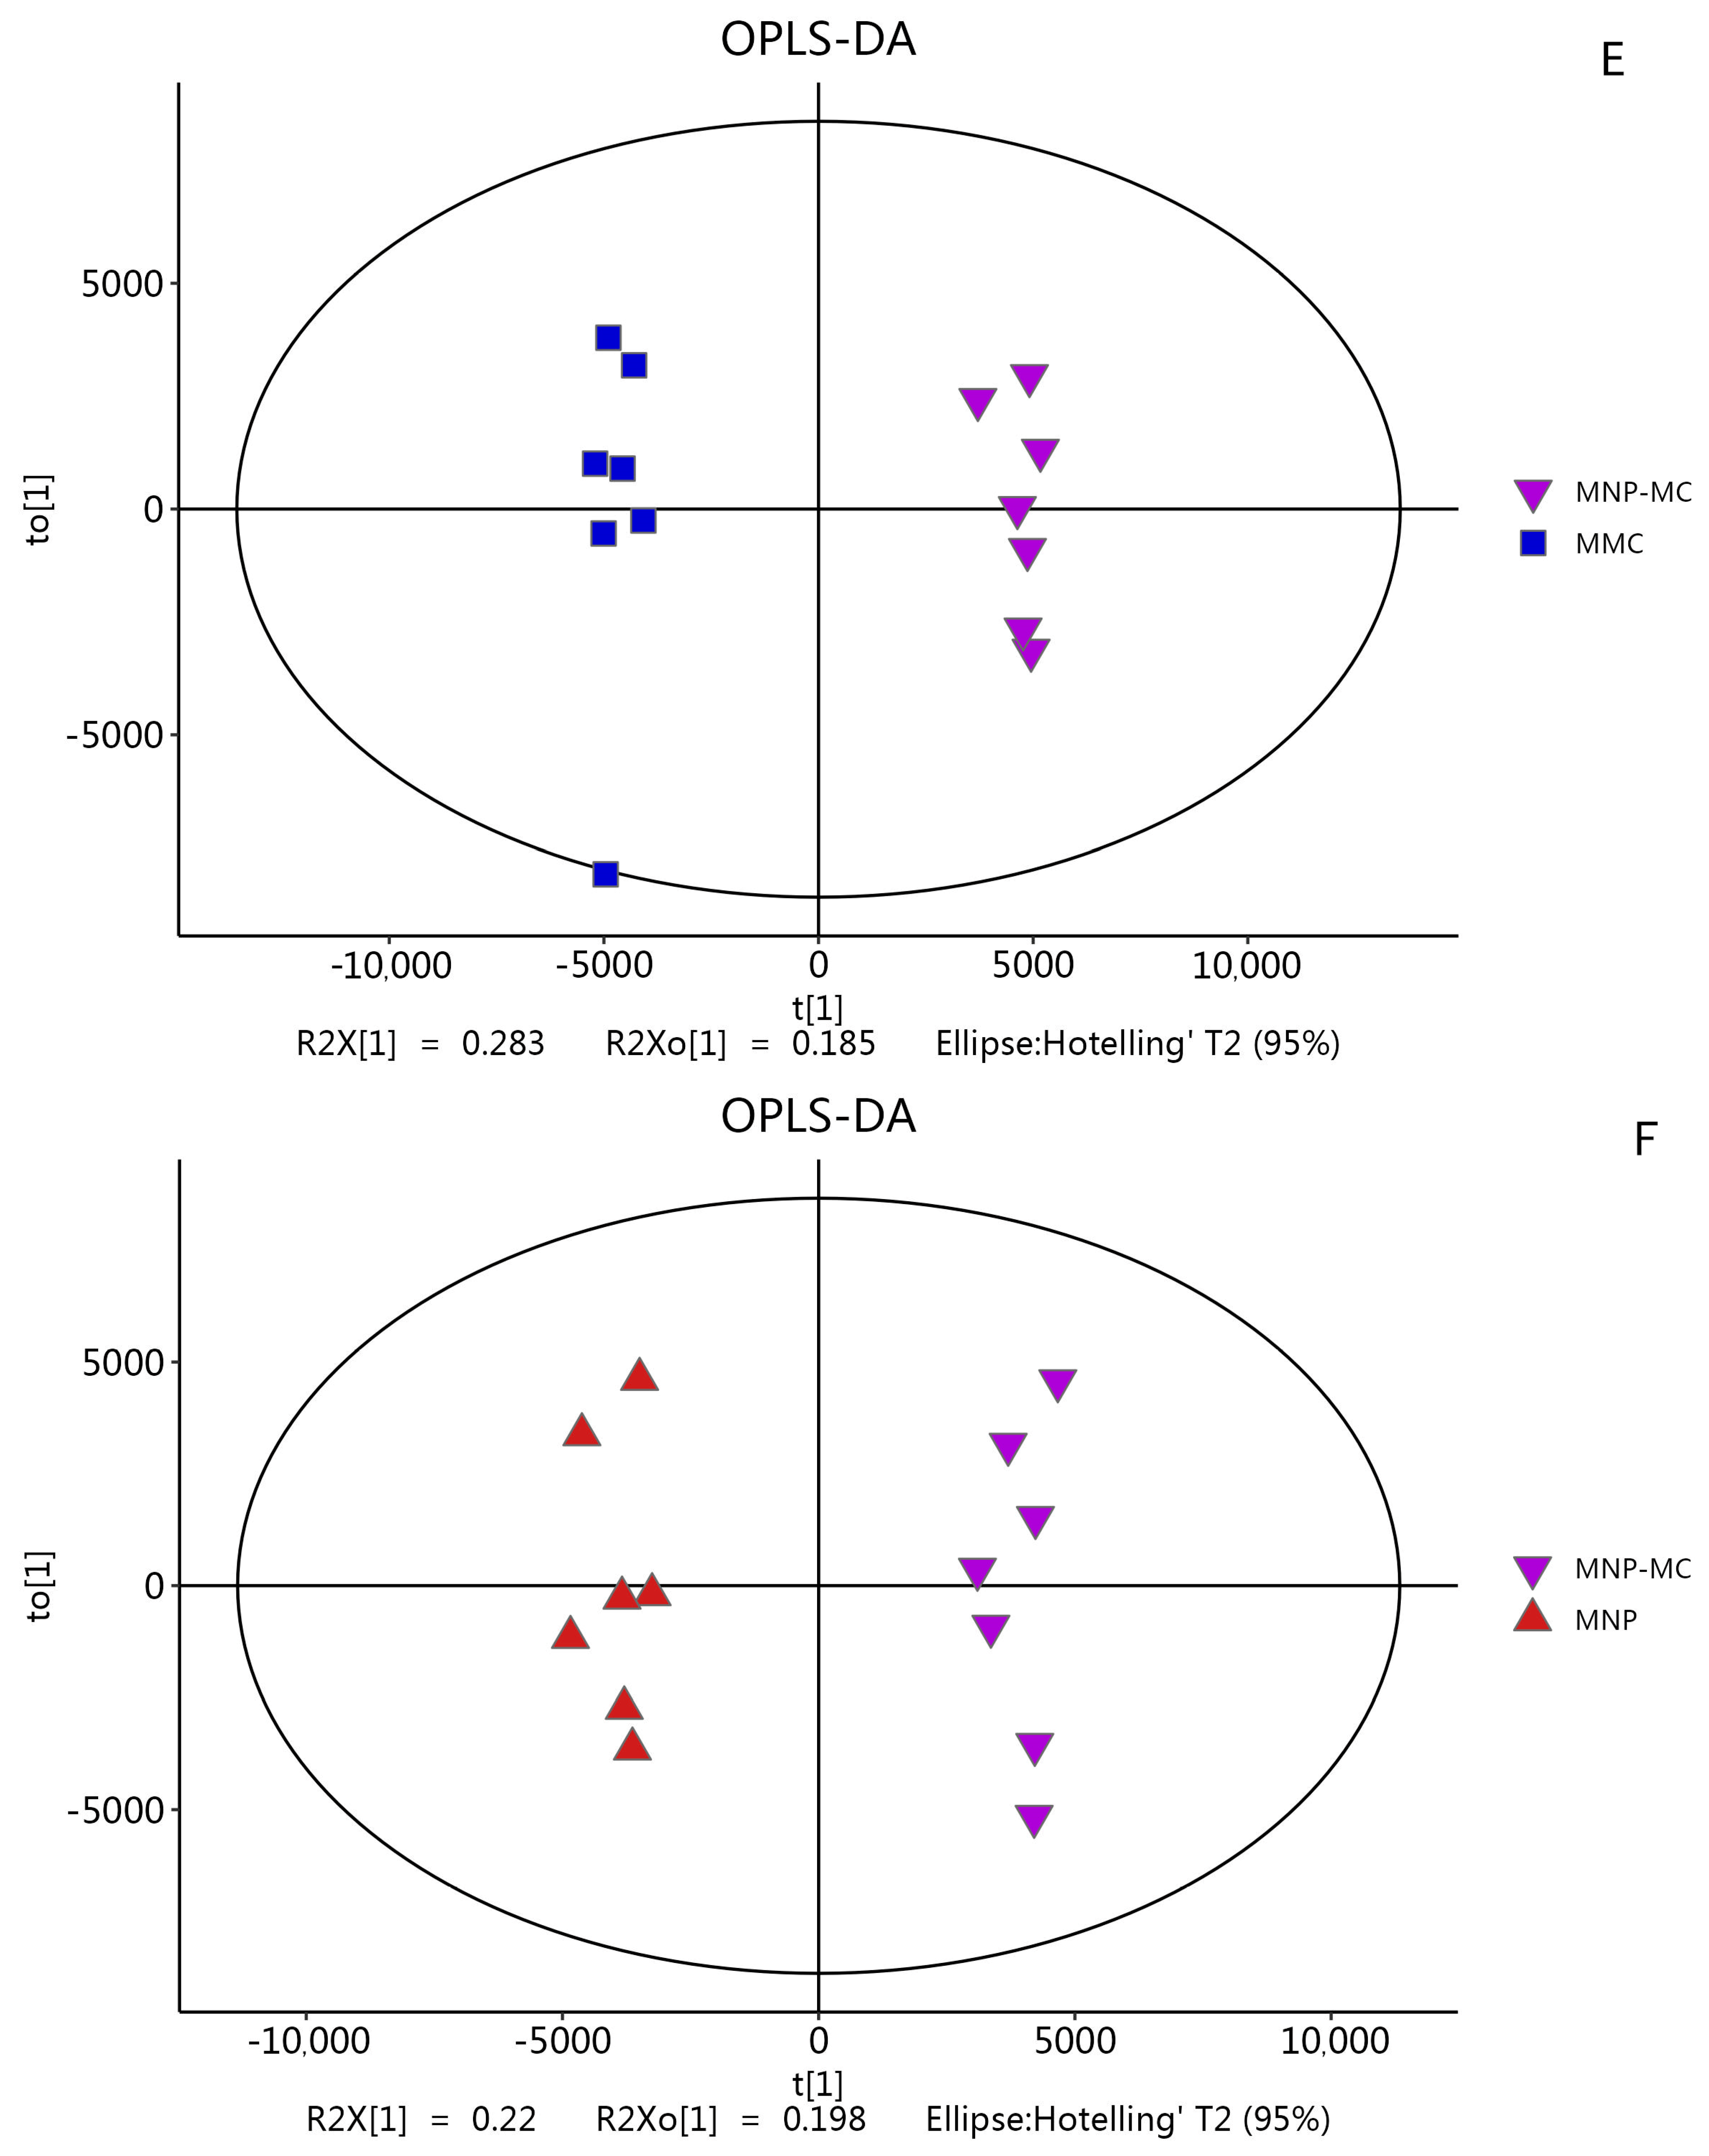
3.2.1. Metabolic Responses to Stress

A total of 5216 metabolites (Table S1) were obtained using LC-MS from the Asian clam hepatopancreas samples. The metabolic data in the hepatopancreas of C. fluminea in MC, NP, and NP-MC groups were analyzed by PCA (Figure S2) and OPLS-DA (Figure 5). These analyses revealed significant differences in metabolism of clams between the three experimental groups. OPLS-DA analysis showed that differences in metabolite concentrations from MC, NP, and NP-MC groups could be characterized based on both identified and unidentified metabolites, and the sample data could be divided into two distinct groups according to contaminants.

3.2.2. Analysis of Different Metabolites

A bidirectional clustering analysis was performed on all differentially expressed metabolites and samples in the liver and pancreas tissues, and the results showed high correlation and good uniformity (Figure 6). Analysis of the metabolomic data from the Asian clam revealed 564 differentially expressed metabolites in MC vs. control, with 332 upregulated metabolites and 232 downregulated metabolites (Figure 7A). In NP vs. control, there were 499 differentially expressed metabolites, with 294 upregulated and 205 downregulated metabolites (Figure 7B). MC vs. NP had 258 differentially expressed metabolites, with 89 upregulated and 469 downregulated metabolites (Figure 7C). In NP-MC vs. control, there were 542 differentially expressed metabolites, with 181 upregulated and 361 downregulated metabolites (Figure 7D). NP-MC vs. MC had 484 differentially expressed metabolites, with 140 upregulated and 344 downregulated metabolites (Figure 7E). Lastly, NP-MC vs. NP had 396 differentially expressed metabolites, with 108 upregulated and 288 downregulated metabolites (Figure 7F). The Venn diagram analysis reveals that there are 45 unique metabolites in the MC vs. control comparison, 42 unique metabolites in the NP vs. control comparison, and 101 unique metabolites in the NP-MC vs. control comparison (Figure S4).

3.3. Integrated Transcriptomic and Metabolomic Analysis

In this study, the genes and metabolites that differed significantly from MC, NP, and NP-MC groups were evaluated based on metabolic pathways defined by the KEGG database. KEGG analysis of the aggregated gene and metabolite data identified the top 30 pathways of each (Figure 8). After multi-omics integration analysis in each comparison group, the top three pathways with the highest number of associated elements mainly focused on carbohydrate metabolism and amino acid metabolism. These pathways include glycolysis/gluconeogenesis, citrate cycle (TCA cycle), alanine, aspartate, and glutamate metabolism, arginine, and proline metabolism, among others (Table 2).

4. Discussion

This study provides a comprehensive analysis of the impact of MC and NP on the hepatopancreas of Asian clams. The results reveal distinct pathway enrichments associated with different treatment groups (MC, NP, and combined NP-MC). Among the affected pathways, several are implicated in immune functions, energy metabolism, and signal transduction, suggesting a broad biological response to MC and NP stress. Interestingly, the combined NP-MC treatment led to the enrichment of certain pathways not observed in the other groups, hinting at a potentially unique interaction between MC and NP at a cellular level.
Pathway mapping analysis was performed to integrate transcriptomic and metabolomic data, which identified key regulatory nodes within these pathways [14,18]. This integrative analysis revealed how specific pathways are modulated under MC and NP stress, shedding light on the potential mechanisms of the clams’ resistance to these environmental stressors. For instance, changes in ATP6N and ADP levels in the lysosome pathway, and MDH1 and L-Malate levels in the citrate cycle (TCA cycle) pathway, suggest they might be important regulatory components in the resistance to MC and NP stress.
Furthermore, the study found significant alterations in gene expression and metabolite levels in pathways such as histidine metabolism, purine metabolism, and phenylalanine metabolism, with key genes and metabolites playing potential roles in the clams’ response to MC and NP stress. The application of KGML pathway mapping provided a comprehensive understanding of inter-pathway connections and shared alterations [19,20], contributing to a deeper understanding of the biological processes and metabolic regulation under MC and MP stress. These findings could serve as a foundation for further functional exploration and targeted interventions for water quality and ecosystem health.

4.1. Analysis of Lysosome Pathway

The lysosome pathway was one of the significantly enriched pathways that were identified to be affected by the exposure to MC and NP in the hepatopancreas of Asian clams. The lysosome pathway plays a crucial role in cellular homeostasis, and disruptions in this pathway may lead to multiple cellular dysfunctions [21]. In the lysosome pathway, the downregulation of ATP6N and the concomitant increase in ADP levels suggest significant perturbations in energy metabolism and lysosomal function in response to MC and NP exposure [22,23,24,25].
ATP6N is a key subunit of the vacuolar ATPase (V-ATPase) complex, which is responsible for acidifying various intracellular compartments, most notably lysosomes [26,27,28]. The ATPase activity of this complex is crucial for maintaining the low pH environment within the lysosomes, which is essential for the optimal function of many lysosomal enzymes involved in the degradation and recycling of various macromolecules [29,30]. The observed downregulation of ATP6N implies a potential impairment in the proton-pumping function of the V-ATPase complex, which could compromise the acidification of lysosomes and disrupt the normal lysosomal degradation processes [31,32].
The observed increase in ADP levels is also highly significant. ADP is a direct product of ATP hydrolysis, the primary reaction providing energy for most cellular processes [33,34,35]. An increase in ADP levels might imply a heightened state of ATP hydrolysis, potentially reflecting an elevated energy demand in cells under MC and NP stress. Moreover, as ATP is also directly utilized by the V-ATPase complex to fuel its proton-pumping activity [36], the downregulation of ATP6N and an increase in ADP levels could be interconnected, with the potential dysregulation of ATPase activity leading to an overconsumption of ATP and subsequent rise in ADP levels.
The downregulation of cathepsin genes within the lysosome pathway suggests another critical aspect of the potential impact of MC and NP on the hepatopancreas of Asian clams.
The cathepsin family of proteins plays a pivotal role in lysosomal proteolysis, which is central to the degradation and recycling of proteins within cells [37]. Their activity is highly dependent on the acidic environment of the lysosome, maintained by the V-ATPase complex that includes ATP6N [38]. The observed downregulation of cathepsin genes, in conjunction with the downregulation of ATP6N, implies a potential disruption in lysosomal proteolysis. With decreased levels of cathepsins, the breakdown of proteins into amino acids could be compromised, leading to a build-up of undigested proteins within the lysosomes [39]. This could not only disrupt the normal functioning of lysosomes, but also potentially lead to cellular toxicity if these undigested proteins accumulate to harmful levels [9]. Moreover, this could also affect the availability of free amino acids within the cell, which could have wider implications for protein synthesis and overall cellular metabolism [40]. Furthermore, cathepsins have been implicated in various cellular processes beyond proteolysis, including apoptosis and autophagy [41]. Downregulation of cathepsin genes could potentially influence these processes, leading to alterations in cell survival and homeostasis under stress conditions induced by MC and NP.
Altogether, these changes suggest that MC and NP exposure could instigate a stress response in the hepatopancreas of Asian clams, which affects their energy metabolism and potentially disrupts their lysosomal function. The alterations in the lysosome pathway highlight the potential impacts of MC and NP on the normal functioning of lysosomes, which could further influence overall cellular homeostasis.

4.2. Analysis of Citrate Cycle/TCA Cycle Pathway

The citrate cycle, also known as the tricarboxylic acid (TCA) cycle, plays a pivotal role in aerobic cellular respiration by generating energy in the form of ATP through the oxidation of acetyl-CoA [42]. The observed downregulation of malate dehydrogenase 1 (MDH1) and decreased levels of L-Malate in this study suggest alterations in the TCA cycle in the hepatopancreas of Asian clams subjected to MC and NP.
MDH1 is an essential enzyme that catalyzes the reversible oxidation of malate to oxaloacetate, a key step in the TCA cycle [43]. Its downregulation could hinder the TCA cycle’s operation, potentially leading to a decrease in energy production, which could contribute to the energy deficit under the stress of MC and NP [44,45]. This may have substantial implications on the clams’ physiological processes and their ability to cope with these environmental stressors. Moreover, L-Malate, the substrate for MDH1, also exhibited a decrease in its levels, corroborating the reduced activity of the MDH1-catalyzed step of the TCA cycle [46]. L-Malate is not only a critical intermediate of the TCA cycle, but also a significant component of many metabolic pathways, including gluconeogenesis and the malate–aspartate shuttle [47]. Its decrease could, therefore, echo broader disruptions in the clams’ metabolic balance. In the proteomic study of resistance to brown ring disease in the Manila clam, the energy metabolism (e.g., TCA cycle), pathogen recognition, and lysosome trafficking enriched 49 significantly accumulated proteins; it may play important and interrelated roles in resistance to infection by Vibrio tapetis in the Manila clam [48]. In the single-cell transcriptomic study of oysters, the crucial role of the tricarboxylic acid (TCA) cycle in immune regulation of blood cells was also emphasized [49].
These results reflect the potential metabolic perturbations induced by MC and NP, particularly in the TCA cycle, which may hamper the clams’ energy production and overall metabolic homeostasis. It highlights the potential compensatory or adaptive mechanisms clams might adopt to withstand the metabolic challenges posed by these environmental pollutants.

4.3. Analysis of Histidine Metabolism Pathway

The histidine metabolism pathway is a critical part of the metabolic network, converting the essential amino acid histidine into various metabolites and signaling molecules [50]. This study found notable shifts in the expression levels of N-Formimino-L-glutamate, L-Histidine, and the enzyme histidine ammonia-lyase in the hepatopancreas of Asian clams exposed to MC and NP. These alterations could have significant impacts on the clams’ metabolic balance and overall health.
The upregulation of N-formimino-L-glutamate across all treatment groups suggests an enhanced activity of the histidine degradation pathway. N-formimino-L-glutamate is an intermediate metabolite in histidine catabolism, acting as a link between histidine degradation and folate-dependent one-carbon metabolic processes [51]. Increased levels of N-formimino-L-glutamate may indicate higher histidine degradation rates, potentially leading to an altered balance of one-carbon metabolism, which is crucial for numerous biological processes, including DNA synthesis, methylation reactions, and amino acid metabolism [52,53,54].
L-histidine, the amino acid substrate for histidine metabolism [55,56], showed contrasting expression patterns among the treatment groups, with upregulation in the MC group and downregulation in the NP and NP-MC groups. As histidine serves as a precursor for key bioactive molecules, such as histamine, its fluctuating levels could influence these derivative pathways. For instance, the study of Ctenopharyngodon Idella [57], Seriola dumerili [58], and Sciaenop ocellatus [55] shows that reduced histidine levels may lead to a diminished histamine production, potentially affecting immune responses and neurotransmission.
The enzyme histidine ammonia-lyase, which initiates the degradation of histidine to urocanate [59], showed downregulation in the MC group. This enzyme is a key regulatory point in histidine metabolism, and its downregulation might impede the normal flow of histidine catabolism. This could result in an accumulation of histidine or a deficiency of its downstream metabolites, potentially disrupting the overall metabolic homeostasis.
In summary, these results suggest that MC and NP exposure significantly affects the histidine metabolism pathway, likely altering the hepatopancreas’ metabolic equilibrium in the Asian clams. These changes could reflect the clams’ adaptive responses to these environmental stressors or signify metabolic dysregulations under stress conditions. These insights can help inform our understanding of how these stressors impact aquatic organisms’ physiology and metabolic health.

4.4. Analysis of Purine Metabolism Pathway

The purine metabolism pathway plays a pivotal role in the metabolism of purine bases, which are fundamental constituents of DNA, RNA, and energy carriers such as ATP. In the present study, the exposure of Asian clams to MC and MP led to a number of changes in gene and metabolite expression in the purine metabolism pathway, which could have profound effects on cellular functions and overall organism health.
The upregulation of adenosine deaminase (ADA) in all three treatment groups is of particular interest, as this enzyme catalyzes the irreversible deamination of adenosine to inosine, a critical step in the degradation of purines [60]. The increased expression of adenosine deaminase might imply an accelerated breakdown of adenosine, which could potentially deplete adenosine pools and impact energy balance, signal transduction processes, and nucleotide synthesis in the clam’s cells [61]. In an experiment where Rhamdia quelen spleen and lymphocytes were stimulated with Pseudomonas aeruginosa, it was observed that the activities of acetylcholinesterase (AChE) and ADA increased in the infected animals compared to the uninfected animals. The increased activities of AChE and ADA resulted in a proinflammatory profile, leading to immune system impairment and contributing to inflammatory damage [62]. In research conducted on hypoxia stress in Lophiosilurus alexandri, it was observed that ADA activity escalated following 24 and 72 h of hypoxia exposure in comparison to the group under normoxic conditions. Moreover, it is critical to underscore that the enzymatic activities of nucleoside triphosphate diphosphohydrolase (NTPDase) and ADA only reverted to their control levels following a recovery period of 72 h [63].
Concurrently, the downregulation of inosine in the MC and NP-MC treatment groups further suggests an increased catabolism of purine bases [64]. As inosine can be metabolized to form hypoxanthine [65], a precursor for the de novo synthesis of purines, its decreased levels could hamper the replenishment of purine nucleotide pools, potentially affecting DNA and RNA synthesis and repair, energy metabolism, and other purine-dependent cellular processes. In studies conducted on juvenile Pagrus major, it was found that dietary supplementation with inosine and inosine monophosphate (IMP) led to an improvement in total serum protein, catalase, and lysozyme activity. Inosine supplementations significantly enhanced intestinal cell vitality. Furthermore, these supplementations had a positive impact on enhancing both freshwater stress and oxidative stress resistances [66]. Inosine also plays a regulatory role in Cherax quadricarinatus, assisting in the resistance against acute hepatopancreatic necrosis disease (AHPND) [65].
The NP-MC treatment group also exhibited a downregulation of xanthine, another intermediate in purine degradation [67]. The implications of this change might be context-dependent, as reduced xanthine levels could lead to decreased uric acid production (potentially reducing antioxidant capacity) or could indicate a compensatory response to maintain purine homeostasis under the dual stress of MC and NP. In studies conducted on Procambarus clarkii [68], Hippocampus abdominalis [69], and Paralichthys olivaceus [70], similar changes in the levels of xanthine were observed.

5. Conclusions

The pollutants MP and MC in water used for aquaculture may pose hazards to aquatic products. A benthic organism, the river clam, serves as an excellent model organism for studying such pollution. In this study, a combined analysis of transcriptomics and metabolomics was conducted to investigate the mechanisms of damage caused by NP and MC contamination in benthic organisms. We discovered significant alterations in energy metabolism-related pathways such as the TCA cycle and purine metabolism, as well as immune-related pathways such as the lysosome pathway, under the stress of MC and NP. Biomarkers such as 3-(2-Hydroxyethyl) histidine and 9S-HpHtrE were identified as potential indicators for assessing the susceptibility of organisms to NP and MC stress.

Supplementary Materials

The following supporting information can be downloaded at: https://www.mdpi.com/article/10.3390/w15193519/s1, Figure S1: PCA plot of transcriptome samples. Figure S2: PCA plot of metabolome samples. Figure S3: Venn analysis of transcriptomic analyses. Figure S4: Venn analysis of metabolomic analyses.; Table S1: Differential Metabolite Statistical Table.

Author Contributions

J.Z.: conceptualization, methodology, writing—original draft. J.W.: data curation, formal analysis. S.L.: visualization. Y.Z.: visualization. X.L.: writing—reviewing and editing, validation. All authors have read and agreed to the published version of the manuscript.

Funding

This research was funded by the National Freshwater Genetic Resource Center (FGRC:18537).

Data Availability Statement

The datasets generated during and/or analyzed during the current study are available from the corresponding author on reasonable request.

Conflicts of Interest

The authors declare no conflict of interest.

References

  1. Marchant, D.J.; Martínez Rodríguez, A.; Francelle, P.; Jones, J.I.; Kratina, P. Contrasting the Effects of Microplastic Types, Concentrations and Nutrient Enrichment on Freshwater Communities and Ecosystem Functioning. Ecotoxicol. Environ. Saf. 2023, 255, 114834. [Google Scholar] [CrossRef] [PubMed]
  2. Hou, C.; Chu, M.L.; Guzman, J.A. Risk Assessment of Harmful Algal Blooms (HAB) Occurrence in the Agroecosystem: A Hydro-Ecologic Modeling Framework and Environmental Risk Matrix. Ecol. Indic. 2022, 145, 109617. [Google Scholar] [CrossRef]
  3. Wells, M.L.; Karlson, B.; Wulff, A.; Kudela, R.; Trick, C.; Asnaghi, V.; Berdalet, E.; Cochlan, W.; Davidson, K.; De Rijcke, M.; et al. Future HAB Science: Directions and Challenges in a Changing Climate. Harmful Algae 2020, 91, 101632. [Google Scholar] [CrossRef]
  4. Sun, Y.; Ji, J.; Tao, J.; Yang, Y.; Wu, D.; Han, L.; Li, S.; Wang, J. Current Advances in Interactions between Microplastics and Dissolved Organic Matters in Aquatic and Terrestrial Ecosystems. TrAC Trends Anal. Chem. 2023, 158, 116882. [Google Scholar] [CrossRef]
  5. Chen, L.; Giesy, J.P.; Adamovsky, O.; Svirčev, Z.; Meriluoto, J.; Codd, G.A.; Mijovic, B.; Shi, T.; Tuo, X.; Li, S.-C.; et al. Challenges of Using Blooms of Microcystis spp. in Animal Feeds: A Comprehensive Review of Nutritional, Toxicological and Microbial Health Evaluation. Sci. Total Environ. 2021, 764, 142319. [Google Scholar] [CrossRef]
  6. Qu, M.; Nida, A.; Kong, Y.; Du, H.; Xiao, G.; Wang, D. Nanopolystyrene at Predicted Environmental Concentration Enhances Microcystin-LR Toxicity by Inducing Intestinal Damage in Caenorhabditis elegans. Ecotoxicol. Environ. Saf. 2019, 183, 109568. [Google Scholar] [CrossRef] [PubMed]
  7. Straquadine, N.R.W.; Kudela, R.M.; Gobler, C.J. Hepatotoxic Shellfish Poisoning: Accumulation of Microcystins in Eastern Oysters (Crassostrea virginica) and Asian Clams (Corbicula fluminea) Exposed to Wild and Cultured Populations of the Harmful Cyanobacteria, Microcystis. Harmful Algae 2022, 115, 102236. [Google Scholar] [CrossRef]
  8. Gao, S.; Wu, Q.; Peng, M.; Zeng, J.; Jiang, T.; Ruan, Y.; Xu, L.; Guo, K. Rapid Urbanization Affects Microplastic Communities in Lake Sediments: A Case Study of Lake Aha in Southwest China. J. Environ. Manag. 2023, 338, 117824. [Google Scholar] [CrossRef] [PubMed]
  9. Liu, H.; Fu, R.; Zhang, Y.; Mao, L.; Zhu, L.; Zhang, L.; Liu, X.; Jiang, H. Integrate Transcriptomic and Metabolomic Analysis Reveals the Underlying Mechanisms of Behavioral Disorders in Zebrafish (Danio rerio) Induced by Imidacloprid. Sci. Total Environ. 2023, 870, 161541. [Google Scholar] [CrossRef]
  10. Shi, Q.Q.; Zhang, X.Q.; Zhang, Z.M.; Wang, N.B.; Liu, H.; Zhang, R.R.; Sun, A.L.; Chen, J.; Shi, X.Z. Transcriptome Sequencing and Metabolite Analysis Reveal the Single and Combined Effects of Microplastics and Di-(2-Ethylhexyl) Phthalate on Peneaus vannamei. Sci. Total Environ. 2023, 867, 161549. [Google Scholar] [CrossRef]
  11. Stephens, A.; Rojo, L.; Araujo-Bernal, S.; Garcia-Carreño, F.; Muhlia-Almazan, A. Cathepsin B from the White Shrimp Litopenaeus vannamei: CDNA Sequence Analysis, Tissues-Specific Expression and Biological Activity. Comp. Biochem. Physiol.—B Biochem. Mol. Biol. 2012, 161, 32–40. [Google Scholar] [CrossRef]
  12. Lu, Y.-P.; Zheng, P.-H.; Zhang, Z.-L.; Zhang, X.-X.; Li, J.-T.; Wang, D.-M.; Xu, J.-R.; Xian, J.-A.; Wang, A.-L. Hepatopancreas Transcriptome Alterations in Red Claw Crayfish (Cherax quadricarinatus) under Microcystin-LR (MC-LR) Stress. Aquac. Rep. 2023, 29, 101478. [Google Scholar] [CrossRef]
  13. Yu, J.; Teng, S.; Yue, X.; Wang, H.; Liu, B. The Toll Pathway and Duox-ROS System Are Required for the Clam Antibacterial Immune Response in the Hepatopancreas. Aquaculture 2023, 574, 739637. [Google Scholar] [CrossRef]
  14. Xu, R.; Zhai, Y.; Yang, J.; Tong, Y.; He, P.; Jia, R. Combined Dynamic Transcriptomics and Metabolomics Analyses Revealed the Effects of Trans-Vp28 Gene Synechocystis sp. PCC6803 on the Hepatopancreas of Litopenaeus vannamei. Fish Shellfish Immunol. 2022, 128, 28–37. [Google Scholar] [CrossRef]
  15. Dunn, W.B.; Broadhurst, D.; Begley, P.; Zelena, E.; Francis-Mcintyre, S.; Anderson, N.; Brown, M.; Knowles, J.D.; Halsall, A.; Haselden, J.N.; et al. Procedures for Large-Scale Metabolic Profiling of Serum and Plasma Using Gas Chromatography and Liquid Chromatography Coupled to Mass Spectrometry. Nat. Protoc. 2011, 6, 1060–1083. [Google Scholar] [CrossRef] [PubMed]
  16. Wilson, I.D.; Gika, H.; Theodoridis, G.; Plumb, R.S.; Shockcor, J.; Holmes, E.; Nicholson, J.K.; Want, E.J. Global Metabolic Profiling Procedures for Urine Using UPLC-MS. Nat. Protoc. 2010, 5, 1005–1018. [Google Scholar]
  17. Zhu, B.; Zhang, Z.; Wang, X.; Zhang, W.; Shi, H.; Song, Z.; Ding, S.; Yang, X. Abnormal Histidine Metabolism Promotes Macrophage Lipid Accumulation under Ox-LDL Condition. Biochem. Biophys. Res. Commun. 2022, 588, 161–167. [Google Scholar] [CrossRef] [PubMed]
  18. Patel, R.K.; Mukesh, J.; Liu, Z. NGS QC Toolkit: A Toolkit for Quality Control of Next Generation Sequencing Data. PLoS ONE 2012, 7, e30619. [Google Scholar] [CrossRef]
  19. Duan, Y.; Xing, Y.; Zhu, X.; Li, H.; Wang, Y.; Nan, Y. Integration of Transcriptomic and Metabolomic Reveals Carbonate Alkalinity Stress Responses in the Hepatopancreas of Litopenaeus vannamei. Aquat. Toxicol. 2023, 260, 106569. [Google Scholar] [CrossRef]
  20. Beltrame, L.; Calura, E.; Popovici, R.; Draghici, S.; Cavalieri, D.; D’Incalci, M. 666 The Biological Connection Markup Language—A Data Format to Visualize, Annotate and Analyze Biological Pathways. Eur. J. Cancer 2012, 48, S158. [Google Scholar] [CrossRef]
  21. Cannataro, M.; Guzzi, P.H.; Agapito, G.; Zucco, C.; Milano, M. (Eds.) Chapter 14—Biological Pathway Analysis; Elsevier: Amsterdam, The Netherlands, 2022; pp. 151–165. ISBN 978-0-12-822952-1. [Google Scholar]
  22. Yao, C.L.; Wu, C.G.; Xiang, J.H.; Li, F.; Wang, Z.Y.; Han, X. The Lysosome and Lysozyme Response in Chinese Shrimp Fenneropenaeus chinensis to Vibrio anguillarum and Laminarin Stimulation. J. Exp. Mar. Biol. Ecol. 2008, 363, 124–129. [Google Scholar] [CrossRef]
  23. Xu, Y.; Pan, H.; Lu, M.; Liu, Q.; Shafique, L.; Peng, J.; Ahmed, T.; Wang, R.; Zhang, H.; Wang, Q.; et al. Analysis of Transcripts and Splice Isoforms in Red Claw Crayfish (Cherax quadricarinatus) Using Single-Molecule Long-Read Sequencing. Aquaculture 2021, 541, 736828. [Google Scholar] [CrossRef]
  24. Huang, J.; Zhang, S.H.; Di, J.; Du, H.; Wei, Q.W. Inactivated Mycobacterium Vaccine Induces Innate Immunity against M. Ulcerans Ecovar Liflandii (MuLiflandii ASM001) Infection in Dabry’s Sturgeon (Acipenser dabryanus). Aquaculture 2019, 512, 734312. [Google Scholar] [CrossRef]
  25. Longarini, E.J.; Dauben, H.; Locatelli, C.; Wondisford, A.R.; Smith, R.; Muench, C.; Kolvenbach, A.; Lynskey, M.L.; Pope, A.; Bonfiglio, J.J.; et al. Modular Antibodies Reveal DNA Damage-Induced Mono-ADP-Ribosylation as a Second Wave of PARP1 Signaling. Mol. Cell 2023, 83, 1743–1760. [Google Scholar] [CrossRef]
  26. Alu, A.; Han, X.; Ma, X.; Wu, M.; Wei, Y.; Wei, X. The Role of Lysosome in Regulated Necrosis. Acta Pharm. Sin. B 2020, 10, 1880–1903. [Google Scholar] [CrossRef]
  27. Cacabelos, R.; Carril, J.C.; Sanmartín, A.; Cacabelos, P. Chapter 6—Pharmacoepigenetic Processors: Epigenetic Drugs, Drug Resistance, Toxicoepigenetics, and Nutriepigenetics. In Translational Epigenetics; Cacabelos, R.B.T.-P., Ed.; Academic Press: Cambridge, MA, USA, 2019; Volume 10, pp. 191–424. ISBN 9780128139394. [Google Scholar]
  28. Li, M.; Zhang, K.; Long, R.; Sun, Y.; Kang, J.; Zhang, T.; Cao, S. ITRAQ-Based Comparative Proteomic Analysis Reveals Tissue-Specific and Novel Early-Stage Molecular Mechanisms of Salt Stress Response in Carex Rigescens. Environ. Exp. Bot. 2017, 143, 99–114. [Google Scholar] [CrossRef]
  29. Cui, Q.; Qiu, L.; Yang, X.; Shang, S.; Yang, B.; Chen, M.; Liu, X.; Chen, B.; Fu, X.; Wang, W.; et al. Transcriptome Profiling of the Low-Salinity Stress Responses in the Gills of the Juvenile Pseudopleuronectes yokohamae. Comp. Biochem. Physiol. Part D Genom. Proteom. 2019, 32, 100612. [Google Scholar] [CrossRef]
  30. Dell’Antone, P. Proton Pump-Linked Mg2+-ATPase Activity in Isolated Rat Liver Lysosomes. Arch. Biochem. Biophys. 1988, 262, 314–325. [Google Scholar] [CrossRef] [PubMed]
  31. Matsumoto, N.; Nakanishi-Matsui, M. Proton Pumping V-ATPase Inhibitor Bafilomycin A1 Affects Rab7 Lysosomal Localization and Abolishes Anterograde Trafficking of Osteoclast Secretory Lysosomes. Biochem. Biophys. Res. Commun. 2019, 510, 421–426. [Google Scholar] [CrossRef]
  32. Han, X.; Tang, Y.; Zhang, Y.; Zhang, J.; Hu, Z.; Xu, W.; Xu, S.; Niu, Q. Impaired V-ATPase Leads to Increased Lysosomal PH, Results in Disrupted Lysosomal Degradation and Autophagic Flux Blockage, Contributes to Fluoride-Induced Developmental Neurotoxicity. Ecotoxicol. Environ. Saf. 2022, 236, 113500. [Google Scholar] [CrossRef]
  33. Collins, M.P.; Forgac, M. Regulation and Function of V-ATPases in Physiology and Disease. Biochim. Biophys. Acta—Biomembr. 2020, 1862, 183341. [Google Scholar] [CrossRef]
  34. Ruprecht, J.J.; King, M.S.; Zögg, T.; Aleksandrova, A.A.; Pardon, E.; Crichton, P.G.; Steyaert, J.; Kunji, E.R.S. The Molecular Mechanism of Transport by the Mitochondrial ADP/ATP Carrier. Cell 2019, 176, 435–447.e15. [Google Scholar] [CrossRef] [PubMed]
  35. Chara, O.; Pafundo, D.E.; Schwarzbaum, P.J. Negative Feedback of Extracellular ADP on ATP Release in Goldfish Hepatocytes: A Theoretical Study. J. Theor. Biol. 2010, 264, 1147–1158. [Google Scholar] [CrossRef] [PubMed]
  36. Springett, R.; King, M.S.; Crichton, P.G.; Kunji, E.R.S. Modelling the Free Energy Profile of the Mitochondrial ADP/ATP Carrier. Biochim. Biophys. Acta—Bioenerg. 2017, 1858, 906–914. [Google Scholar] [CrossRef] [PubMed]
  37. Baars, T.L.; Petri, S.; Peters, C.; Mayer, A. Role of the V-ATPase in Regulation of the Vacuolar Fission–Fusion Equilibrium. Mol. Biol. Cell 2007, 18, 3873. [Google Scholar] [CrossRef] [PubMed]
  38. Dai, L.S.; Sun, Y.; Sun, Y.X.; Zhu, B.J.; Liu, C.L. Characterization and Function of a Cathepsin B in Red Crayfish (Procambarus clarkii) Following Lipopolysaccharide Challenge. Fish Shellfish Immunol. 2016, 56, 162–168. [Google Scholar] [CrossRef] [PubMed]
  39. Shi, Z.; Yang, Y.; Guo, Z.; Feng, S.; Wan, Y. A Cathepsin B/GSH Dual-Responsive Fluorinated Peptide for Effective SiRNA Delivery to Cancer Cells. Bioorg. Chem. 2023, 135, 106485. [Google Scholar] [CrossRef]
  40. Shen, X.B.; Chen, X.; Zhang, Z.Y.; Wu, F.F.; Liu, X.H. Cathepsin C Inhibitors as Anti-Inflammatory Drug Discovery: Challenges and Opportunities. Eur. J. Med. Chem. 2021, 225, 113818. [Google Scholar] [CrossRef]
  41. Lacoue-Labarthe, T.; Le Bihan, E.; Borg, D.; Koueta, N.; Bustamante, P. Paco Acid Phosphatase and Cathepsin Activity in Cuttlefish (Sepia Officinalis) Eggs: The Effects of Ag, Cd, and Cu Exposure. ICES J. Mar. Sci. 2010, 67, 1517–1523. [Google Scholar] [CrossRef]
  42. Aranishi, F.; Mano, N. Response of Skin Cathepsins to Infection of Edwardsiella tarda in Japanese Flounder. Fish. Sci. 2000, 66, 169–170. [Google Scholar] [CrossRef]
  43. Fernie, A.R.; Carrari, F.; Sweetlove, L.J. Respiratory Metabolism: Glycolysis, the TCA Cycle and Mitochondrial Electron Transport. Curr. Opin. Plant Biol. 2004, 7, 254–261. [Google Scholar] [CrossRef]
  44. Nazaret, C.; Heiske, M.; Thurley, K.; Mazat, J.-P. Mitochondrial Energetic Metabolism: A Simplified Model of TCA Cycle with ATP Production. J. Theor. Biol. 2009, 258, 455–464. [Google Scholar] [CrossRef] [PubMed]
  45. Cardoso, L.H.D.; Donnelly, C.; Komlódi, T.; Gnaiger, E. Characterizing Electron Transfer through the Mitochondrial Q-Junction from Fatty Acid Oxidation and TCA Cycle on HEK 293T Cells: Correlation with Respiration. Biochim. Biophys. Acta—Bioenerg. 2022, 1863, 148866. [Google Scholar] [CrossRef]
  46. Sweetlove, L.J.; Beard, K.F.M.; Nunes-Nesi, A.; Fernie, A.R.; Ratcliffe, R.G. Not Just a Circle: Flux Modes in the Plant TCA Cycle. Trends Plant Sci. 2010, 15, 462–470. [Google Scholar] [CrossRef]
  47. Mishra, R.; Shukla, S.P. Endosulfan Effects on Muscle Malate Dehydrogenase of the Freshwater Catfish Clarias Batrachus. Ecotoxicol. Environ. Saf. 2003, 56, 425–433. [Google Scholar] [CrossRef] [PubMed]
  48. Guo, C.; Ye, J.; Song, M.; Peng, X.; Li, H. Poly I:C Promotes Malate to Enhance Innate Immune Response against Bacterial Infection. Fish Shellfish Immunol. 2022, 131, 172–180. [Google Scholar] [CrossRef] [PubMed]
  49. Smits, M.; Artigaud, S.; Bernay, B.; Pichereau, V.; Bargelloni, L.; Paillard, C. A Proteomic Study of Resistance to Brown Ring Disease in the Manila Clam, Ruditapes philippinarum. Fish Shellfish Immunol. 2020, 99, 641–653. [Google Scholar] [CrossRef]
  50. Meng, J.; Zhang, G.; Wang, W.-X. Functional Heterogeneity of Immune Defenses in Molluscan Oysters Crassostrea Hongkongensis Revealed by High-Throughput Single-Cell Transcriptome. Fish Shellfish Immunol. 2022, 120, 202–213. [Google Scholar] [CrossRef] [PubMed]
  51. Wickner, R.B.; Tabor, H. N-Formimino-l-Glutamate Iminohydrolase from Histidine-Adapted Pseudomonas: Purification and properties. J. Biol. Chem. 1972, 247, 1605–1609. [Google Scholar] [CrossRef] [PubMed]
  52. Kaminskas, E.; Kimhi, Y.; Magasanik, B. Urocanase and N-Formimino-l-Glutamate Formiminohydrolase of Bacillus Subtilis, Two Enzymes of the Histidine Degradation Pathway. J. Biol. Chem. 1970, 245, 3536–3544. [Google Scholar] [CrossRef] [PubMed]
  53. Zhang, Z.; Chen, D.; Yu, J.; Su, X.; Li, L. Metabolic Perturbations in Human Hepatocytes Induced by Bis (2-Ethylhexyl)-2,3,4,5-Tetrabromophthalate Exposure: Insights from High-Coverage Quantitative Metabolomics. Anal. Biochem. 2022, 657, 114887. [Google Scholar] [CrossRef] [PubMed]
  54. Hussein, M.; Oberrauch, S.; Allobawi, R.; Cornthwaite-Duncan, L.; Lu, J.; Sharma, R.; Baker, M.; Li, J.; Rao, G.G.; Velkov, T. Untargeted Metabolomics to Evaluate Polymyxin B Toxicodynamics Following Direct Intracerebroventricular Administration into the Rat Brain. Comput. Struct. Biotechnol. J. 2022, 20, 6067–6077. [Google Scholar] [CrossRef] [PubMed]
  55. Michelato, M.; Zaminhan, M.; Boscolo, W.R.; Nogaroto, V.; Vicari, M.; Artoni, R.F.; Furuya, V.R.B.; Furuya, W.M. Dietary Histidine Requirement of Nile Tilapia Juveniles Based on Growth Performance, Expression of Muscle-Growth-Related Genes and Haematological Responses. Aquaculture 2017, 467, 63–70. [Google Scholar] [CrossRef]
  56. Wu, P.; Qu, B.; Feng, L.; Jiang, W.-D.; Kuang, S.-Y.; Jiang, J.; Tang, L.; Zhou, X.-Q.; Liu, Y. Dietary Histidine Deficiency Induced Flesh Quality Loss Associated with Changes in Muscle Nutritive Composition, Antioxidant Capacity, Nrf2 and TOR Signaling Molecules in on-Growing Grass Carp (Ctenopharyngodon idella). Aquaculture 2020, 526, 735399. [Google Scholar] [CrossRef]
  57. Gao, Y.-J.; Liu, Y.-J.; Chen, X.-Q.; Yang, H.-J.; Li, X.-F.; Tian, L.-X. Effects of Graded Levels of Histidine on Growth Performance, Digested Enzymes Activities, Erythrocyte Osmotic Fragility and Hypoxia-Tolerance of Juvenile Grass Carp Ctenopharyngodon idella. Aquaculture 2016, 452, 388–394. [Google Scholar] [CrossRef]
  58. Sarih, S.; Djellata, A.; Roo, J.; Hernández-Cruz, C.M.; Fontanillas, R.; Rosenlund, G.; Izquierdo, M.; Fernández-Palacios, H. Effects of Increased Protein, Histidine and Taurine Dietary Levels on Egg Quality of Greater Amberjack (Seriola dumerili, Risso, 1810). Aquaculture 2019, 499, 72–79. [Google Scholar] [CrossRef]
  59. Furuta, T.; Takahashi, H.; Shibasaki, H.; Kasuya, Y. Reversible Stepwise Mechanism Involving a Carbanion Intermediate in the Elimination of Ammonia from L-Histidine Catalyzed by Histidine Ammonia-Lyase. J. Biol. Chem. 1992, 267, 12600–12605. [Google Scholar] [CrossRef]
  60. Hubert, L.; Sutton, V.R. Chapter 12—Disorders of Purine and Pyrimidine Metabolism. In Clinical Aspects and Laboratory Determination; Garg, U., Smith, L., Eds.; Elsevier: San Diego, CA, USA, 2017; pp. 283–299. ISBN 978-0-12-802896-4. [Google Scholar]
  61. Carballeira, J.D.; Fernandez-Lucas, J.; Quezada, M.A.; Hernaiz, M.J.; Alcantara, A.R.; Simeó, Y.; Sinisterra, J.V. Biotransformations, 3rd ed.; Academic Press: Oxford, UK, 2009; pp. 212–251. ISBN 978-0-12-373944-5. [Google Scholar]
  62. Baldissera, M.D.; Souza, C.F.; Doleski, P.H.; Guarda, N.S.; Moresco, R.N.; Santos, R.C.V.; Baldisserotto, B. Stimulation of Splenic and Lymphocytic Acetylcholinesterase and Adenosine Deaminase Activities in Rhamdia quelen Experimentally Infected with Pseudomonas aeruginosa: Impairment of Immune System. Aquaculture 2017, 473, 417–422. [Google Scholar] [CrossRef]
  63. Baldissera, M.D.; Souza, C.F.; Boaventura, T.P.; Nakayama, C.L.; Baldisserotto, B.; Luz, R.K. Purinergic Signaling as a Potential Target of Hypoxia Stress-Induced Impairment of the Immune System in Freshwater Catfish Lophiosilurus alexandri. Aquaculture 2018, 496, 197–202. [Google Scholar] [CrossRef]
  64. Hossain, M.S.; Koshio, S.; Ishikawa, M.; Yokoyama, S.; Sony, N.M.; Ono, S.; Fujieda, T. Comparison of the Effects of Inosine and Inosine Monophosphate on Growth, Immune Response, Stress Resistance and Gut Morphology of Juvenile Red Sea Bream, Pagrus Major. Aquaculture 2016, 458, 64–74. [Google Scholar] [CrossRef]
  65. Miller, S.G.; Hafen, P.S.; Brault, J.J. Increased Adenine Nucleotide Degradation in Skeletal Muscle Atrophy. Int. J. Mol. Sci. 2020, 21, 88. [Google Scholar] [CrossRef] [PubMed]
  66. Hossain, M.S.; Koshio, S.; Ishikawa, M.; Yokoyama, S.; Sony, N.M.; Dawood, M.A.O.; Kader, M.A.; Bulbul, M.; Fujieda, T. Efficacy of Nucleotide Related Products on Growth, Blood Chemistry, Oxidative Stress and Growth Factor Gene Expression of Juvenile Red Sea Bream, Pagrus Major. Aquaculture 2016, 464, 8–16. [Google Scholar] [CrossRef]
  67. Kambe, J.; Miyata, S.; Li, C.; Yamamoto, Y.; Nagaoka, K. Xanthine-Induced Deficits in Hippocampal Behavior and Abnormal Expression of Hemoglobin Genes. Behav. Brain Res. 2023, 449, 114476. [Google Scholar] [CrossRef]
  68. Xu, R.; Zheng, R.; Wang, Y.; Ma, R.; Tong, G.; Wei, X.; Feng, D.; Hu, K. Transcriptome Analysis to Elucidate the Toxicity Mechanisms of Fenvalerate, Sulfide Gatifloxacin, and Ridomil on the Hepatopancreas of Procambarus clarkii. Fish Shellfish Immunol. 2021, 116, 140–149. [Google Scholar] [CrossRef] [PubMed]
  69. Perera, N.C.N.; Godahewa, G.I.; Lee, S.; Kim, M.-J.; Hwang, J.Y.; Kwon, M.G.; Hwang, S.D.; Lee, J. Manganese-Superoxide Dismutase (MnSOD), a Role Player in Seahorse (Hippocampus abdominalis) Antioxidant Defense System and Adaptive Immune System. Fish Shellfish Immunol. 2017, 68, 435–442. [Google Scholar] [CrossRef] [PubMed]
  70. Ishibe, K.; Osatomi, K.; Hara, K.; Kanai, K.; Yamaguchi, K.; Oda, T. Comparison of the Responses of Peritoneal Macrophages from Japanese Flounder (Paralichthys olivaceus) against High Virulent and Low Virulent Strains of Edwardsiella tarda. Fish Shellfish Immunol. 2008, 24, 243–251. [Google Scholar] [CrossRef]
Figure 1. Pairwise comparisons of the expression levels of DEGs in (A) MC vs. control, (B) NP vs. control, (C) MC vs. NP, (D) NP-MC vs. control, (E) NP-MC vs. MC, and (F) NP-MC vs. NP after MC and NP exposure. Red and green in each picture represent the upregulated and downregulated transcripts, respectively.
Water 15 03519 g001aWater 15 03519 g001b
Figure 2. Validation of MC vs. control RNA-seq profiles using real-time qPCR (mean ± standard deviation, SE; n = 3) and 9 DEGs were selected. β-actin was used as an internal control.
Water 15 03519 g002
Figure 3. Gene ontology (GO) classification of the DEGs in (A) MC vs. control, (B) NP vs. control, (C) MC vs. NP, (D) NP-MC vs. control, (E) NP-MC vs. MC, and (F) NP-MC vs. NP. Green indicates genes enriched in biological process, orange indicates genes enriched in cellular component, blue indicates genes enriched in molecular function. The horizontal axis indicates the number of differentially expressed genes and the vertical axis indicates term names.
Water 15 03519 g003aWater 15 03519 g003bWater 15 03519 g003c
Figure 4. KEGG-enriched top 20 bubble figure for DEGs in different groups: (A) MC vs. control, (B) NP vs. control, (C) MC vs. NP, (D) NP-MC vs. control, (E) NP-MC vs. MC, (F) NP-MC vs. NP. The X-axis indicates the rich factor and the larger the bubble, the greater the number of differentiated genes. The color of the bubble changes from blue to yellow to red; the smaller the value of its enrichment p-value, the greater the saliency.
Water 15 03519 g004aWater 15 03519 g004bWater 15 03519 g004cWater 15 03519 g004dWater 15 03519 g004eWater 15 03519 g004f
Figure 5. OPLS-DA score plots of metabolites in Asian clam hepatopancreas tissues from the (A) MC vs. control, (B) NP vs. control, (C) MC vs. NP, (D) NP-MC vs. control, (E) NP-MC vs. MC, and (F) NP-MC vs. NP groups.
Water 15 03519 g005aWater 15 03519 g005bWater 15 03519 g005c
Figure 6. Heatmap analysis of the metabolites with concentrations that differed from the (A) MC vs. control, (B) NP vs. control, (C) MC vs. NP, (D) NP-MC vs. control, (E) NP-MC vs. MC, and (F) NP-MC vs. NP groups. The color denotes relative abundances of each metabolite, going from less (blue) to more (red).
Water 15 03519 g006aWater 15 03519 g006bWater 15 03519 g006cWater 15 03519 g006d
Figure 7. Pairwise comparisons of the expression levels of DEGs: (A) MC vs. control, (B) NP vs. control, (C) MC vs. NP, (D) NP-MC vs. control, (E) NP-MC vs. MC, (F) NP-MC vs. NP after MC and NP exposure. Red and blue in each picture represent the upregulated and downregulated transcripts, respectively.
Water 15 03519 g007aWater 15 03519 g007b
Figure 8. Key pathways based on transcriptomics and metabolomics analysis. (A) MC vs. control, (B) NP vs. control, (C) MC vs. NP, (D) NP-MC vs. control, (E) NP-MC vs. MC, (F) NP-MC vs. NP. The blue color bar represents the abundance of differentially expressed genes and metabolites enriched along the marked pathway on the horizontal axis.
Water 15 03519 g008aWater 15 03519 g008bWater 15 03519 g008c
Table 1. List of primers used for quantitative RT-PCR validation.
Gene NameForward and Reverse Primer (5′–3′)TM (°C)Amplicon Length (bp)Application Efficiency
β-actinACCTATCTATGAGGGGTACGCC 61136100.2%
AATTTCTCTTTCGGCTGTTGTG58
COX1ATGTTCTATCAATGGGAGC58190102.1%
TCTGAGTAGCGTCGTGGT56
COX3GATTCTTCTGAGCGTTCTAT52187104.3%
TGGTTTCGTTTACCTTCTAT53
GADD45TCGAGTGTGCAAGCTACCTG6014799.8%
CCTTGACAACGTGTATGTCGTT59
TLR1ATACCGCTAAATGTTCCAAG5417999.4%
GTACTGAAAGGCGTGATGTT56
NFKBATTTGGAGGATTGAATGTAG5524099.7%
ATAATGTGAGTTCCGTTGTC52
TBK1AGAACTGCTGAAGGCTGTCAAC61167103.8%
ATTCCTTCTCCTCAAAGCCAAG58
NBR1TGTGAATCCTGCGAGGACAA57184101.6%
CGCCTTCTGGATAGATGGGT59
CASP8ACCTCATAGGCTATTCCACG55155102.7%
GGCTACCTTTCGGTTTACTT54
CASP7CCGACGAAGACAAAGAGGTT5618997.4%
ACTCCATGTTTCCAGCGAAG57
Table 2. Aggregated metabolites and genes in KEGG pathway.
GroupPathway NameUp
Stream
Down
Stream
Kegg Level 2
Glycolysis/Gluconeogenesis117Carbohydrate metabolism
MC-controlCitrate cycle (TCA cycle)314Carbohydrate metabolism
Alanine, aspartate, and glutamate metabolism142Amino acid metabolism
Cysteine and methionine metabolism41Amino acid metabolism
NP-controlArginine and proline metabolism41Metabolism of other amino acids
Glutathione metabolism22Amino acid metabolism
Alanine, aspartate, and glutamate metabolism161Amino acid metabolism
NP-MC
-control
Glycolysis/Gluconeogenesis017Carbohydrate metabolism
Citrate cycle (TCA cycle)113Carbohydrate metabolism
Glycolysis/Gluconeogenesis18Carbohydrate metabolism
NP-MCGlycine, serine, and threonine metabolism26Amino acid metabolism
Alanine, aspartate, and glutamate metabolism71Amino acid metabolism
Alanine, aspartate, and glutamate metabolism104Amino acid metabolism
NP-MC
-MC
Glycine, serine, and threonine metabolism010Amino acid metabolism
Arginine and proline metabolism53Amino acid metabolism
Alanine, aspartate, and glutamate metabolism105Amino acid metabolism
NP-MC
-NP
Glycine, serine, and threonine metabolism110Amino acid metabolism
Glycolysis/Gluconeogenesis110Carbohydrate metabolism
Disclaimer/Publisher’s Note: The statements, opinions and data contained in all publications are solely those of the individual author(s) and contributor(s) and not of MDPI and/or the editor(s). MDPI and/or the editor(s) disclaim responsibility for any injury to people or property resulting from any ideas, methods, instructions or products referred to in the content.

