

Compound Extremes of Droughts and Pluvials: A Review and Exploration of Spatio-Temporal Characteristics and Associated Risks in the Canadian Prairies


Abstract
:1. Introduction and Objectives
2. Methodology
3. Results
3.1. Literature Reviews and Synthesis
3.2. Analysis of the Risks of Past Compound Droughts and Pluvials in the Prairies
3.2.1. Convergence of Findings from Research Regarding Prairie Droughts and Pluvials
3.2.2. Characterization of Compound Droughts and Pluvials in the Prairies Using the SPEI Global Drought Monitor, 2000 to 2022
4. Discussion and Conclusions
Author Contributions
Funding
Data Availability Statement
Acknowledgments
Conflicts of Interest
References
- Tam, B.Y.; Szeto, K.; Bonsal, B.; Flato, G.; Cannon, A.J.; Rong, R. CMIP5 drought projections in Canada based on the Standardized Precipitation Evapotranspiration Index. Can. Water Resour. J. 2019, 44, 90–107. [Google Scholar] [CrossRef]
- Bonsal, B.; Liu, Z.; Wheaton, E.; Stewart, R. Historical and projected changes to the stages and other characteristics of severe Canadian Prairie droughts. Water 2020, 12, 3370. [Google Scholar] [CrossRef]
- Zhang, X.; Flato, G.; Kirchmeier-Young, M.; Vincent, L.; Wan, H.; Wang, X.; Rong, R.; Fyfe, J.; Li, G.; Kharin, V.V. Changes in Temperature and Precipitation Across Canada. In Canada’s Changing Climate Report; Bush, E., Lemmen, D.S., Eds.; Government of Canada: Ottawa, ON, Canada, 2019; Chapter 4; pp. 112–193. [Google Scholar]
- Wittrock, V.; Halliday, R.; Corkal, D.; Johnston, M.; Wheaton, E.; Lettvenuk, J.; Stewart, I.; Bonsal, B.; Geremia, M. Saskatchewan Flood and Natural Hazard Risk Assessment; Prepared for the Saskatchewan Ministry of Government Relations; Revised in December 2018; SRC 14113-2E18; Saskatchewan Research Council: Saskatoon, SK, Canada, 2018; 290p. [Google Scholar]
- Bonsal, B.; Wheaton, E. Atmospheric Circulation Comparison between the 2001 and 2002 and the 1961 and 1988 Canadian Prairie Droughts. Atmosphere-Ocean 2005, 43, 163–172. [Google Scholar] [CrossRef]
- AES Drought Study Group. An Applied Climatology of Drought in the Canadian Prairie Provinces; Report 86–4; Canadian Climate Centre: Downsview, ON, Canada, 1986; 197p. [Google Scholar]
- NOAA NIDIS (National Oceanic and Atmospheric Agency, National Integrated Drought Information System. What Is Drought. Drought Basics. Available online: https://www.drought.gov/what-is-drought/drought-basics (accessed on 15 July 2023).
- Borowski, P.F. Water and Hydropower-Challenges for the economy and enterprises in times of climate change in Africa and Europe. Water 2022, 14, 3631. [Google Scholar] [CrossRef]
- Wheaton, E.; Kulshreshtha, S.; Wittrock, V.; Koshida, G. Dry Times: Lessons from the Canadian Drought of 2001 and 2002. Can. Geogr. 2008, 52, 241–262. [Google Scholar] [CrossRef]
- Agriculture and Agri-Food Canada (AAFC). Prairie Region Drought Assessment, Canadian Drought Monitor; AAFC: Ottawa, ON, Canada, 2022.
- Wheaton, E.; Kulshreshtha, S. Environmental sustainability of agricultural stressed by changing extremes of drought and excess moisture: A conceptual review. Sustainability 2017, 9, 970. [Google Scholar] [CrossRef]
- He, X.; Sheffield, J. Lagged compound occurrence of droughts and pluvials globally over the past seven decades. Geophys. Res. Lett. 2020, 47, e2020GL087924. [Google Scholar] [CrossRef]
- Wittrock, V.; Kulshreshtha, S.; Magzul, L.; Wheaton, E. Adapting to Impacts of Climatic Extremes: Case Stud of the Kainai Blood Indian Reserve, Alberta; Prepared for the Institutional Adaptation to Climate Change Project; Publication No. 11899-6E08; Saskatchewan Research Council: Saskatoon, SK, Canada, 2008; 94p. [Google Scholar]
- Halliday, R. Flooding. In Saskatchewan Flood and Natural Hazard Risk Assessment; Wittrock, V., Halliday, R., Corkal, D., Johnston, M., Wheaton, E., Lettvenuk, J., Stewart, I., Bonsal, B., Geremia, M., Eds.; Prepared for the Saskatchewan Ministry of Government Relations; Revised in December 2018; SRC 14113-2E18; Saskatchewan Research Council: Saskatoon, SK, Canada, 2018; Chapter 6; 290p, Available online: https://publications.saskatchewan.ca/#/products/92658 (accessed on 15 December 2018).
- Public Safety Canada. Canadian Disaster Database. Government of Canada. 2023. Available online: https://www.publicsafety.gc.ca/cnt/rsrcs/cndn-dsstr-dtbs/index-en.aspx (accessed on 25 July 2023).
- Public Safety Canada. 2012 All Hazards Risk Assessment Methodology Guidelines 2012-2-13; Public Safety Canada, Government of Canada: Ottawa, ON, Canada, 2012. [Google Scholar]
- IPCC. Managing the Risks of Extreme Events and Disasters to Advance Climate Change Adaptation; A Special Report of Working Groups I and II of the Intergovernmental Panel on Climate Change; Field, C.B., Barros, V., Stocker, T.F., Qin, D., Dokken, D.J., Ebi, K.L., Mastrandrea, M.D., Mach, K.J., Plattner, G.-K., Allen, S.K., et al., Eds.; Cambridge University Press: Cambridge, UK; New York, NY, USA, 2012; 582p. [Google Scholar]
- Chen, H.; Wang, S. Accelerated transition between dry and wet periods in a warming climate. Geophys. Res. Lett. 2022, 49, e2022GL099766. [Google Scholar] [CrossRef]
- Chen, H.; Wang, S.; Zhu, J.; Wang, D. Projected changes in the pattern of spatially compounding drought and pluvial events over Eastern China under a warming climate. Earth’s Future 2023, 11, e2022EF003397. [Google Scholar] [CrossRef]
- IPCC; Seneviratne, S.I.; Zhang, X.; Adnan, M.; Badi, W.; Dereczynski, C.; Di Luca, A.; Ghosh, S.; Iskandar, I.; Kossin, J.; et al. Weather and Climate Extreme Events in a Changing Climate. In Climate Change 2021: The Physical Science Basis. Contribution of Working Group I to the Sixth Assessment Report of the Intergovernmental Panel on Climate Change; Masson-Delmotte, V., Zhai, P., Pirani, A., Connors, S.L., Pe, C., Berger, S., Caud, N., Chen, Y., Goldfarb, L., Gomis, M.I., et al., Eds.; Cambridge University Press: Cambridge, UK; New York, NY, USA, 2021; pp. 1513–1766. [Google Scholar] [CrossRef]
- Rezvani, R.; RahimiMovaghar, M.; Na, W.; Najafi, M.R. Accelerated lagged compound floods and droughts in Northwest North America under 1.5–4 degrees Global warming levels. J. Hydrol. 2023, 624, 129906. [Google Scholar] [CrossRef]
- Beguería, S.; Vicente-Serrano, S.M.; Angulo-Martínez, M. A multi-scalar global drought data set: The SPEIbase: A new gridded product for the analysis of drought variability and impacts. Bull. Am. Meteorol. Soc. 2010, 91, 1351–1354. [Google Scholar] [CrossRef]
- Taherdoost, H. What are different research approaches? Comprehensive review of qualitative, quantitative and mixed method research, their applications, types and limitations. J. Manag. Sci. Eng. Res. 2022, 5, 53–63. [Google Scholar] [CrossRef]
- Marchildon, G.; Wheaton, E.; Fletcher, A.; Vanstone, J. Extreme drought and excessive moisture conditions in two Canadian watersheds: Comparing the perception of farmers and ranchers with the scientific record. Nat. Hazards 2016, 82, 245–266. [Google Scholar] [CrossRef]
- Szeto, K.; Henson, W.; Stewart, R.; Gascon, G. The catastrophic June 2002 prairie rainstorm. Atmosphere-Ocean 2011, 49, 380–395. [Google Scholar] [CrossRef]
- Shabbar, A.; Bonsal, B.; Szeto, K. Atmospheric and oceanic variability associated with growing season droughts and pluvials on the Canadian Prairies. Atmosphere-Ocean 2011, 49, 339–355. [Google Scholar] [CrossRef]
- Evans, E.; Stewart, R.; Henson, W.; Saunders, K. On precipitation and virga over three locations during the 1999–2004 Canadian Prairie Drought. Atmosphere-Ocean 2011, 49, 366–379. [Google Scholar] [CrossRef]
- Brimelow, J.; Stewart, R.; Hanesiak, J.; Kochtubajda, B.; Szeto, K.; Bonsal, B. Characterization and assessment of the devastating natural hazards across the Canadian Prairie Provinces from 2009 to 2011. Nat. Hazards 2014, 73, 761–785. [Google Scholar] [CrossRef]
- Ma, M.; Wang, W.; Yuan, F.; Ren, L.; Tu, X.; Zang, H. Application of a hybrid multiscalar indicator in drought indentification in Beijing and Guangzhou, China. Water Sci. Eng. 2018, 11, 177–186. [Google Scholar] [CrossRef]
- Begueria, S.; Latorre, B.; Reig, F.; Vicente-Serrano, S. SPEI Global Drought Monitor. 2023. Available online: https://spei.csic.es/map/maps.html#months=1#month=4#year=2023 (accessed on 8 July 2023).
- Bonsal, B.R.; Koshida, G.; O’Brien, E.G.; Wheaton, E. Chapter 3. Droughts. In Threats to Water Availability in Canada; NWRI Scientific Assessment Report Series No. 3 and ACSD Science Assessment Series No. 1; National Water Research Institute: Burlington, ON, Canada, 2004; 128p. [Google Scholar]
- Bonsal, B.R.; Cuell, C. Hydro-climatic variability and extremes over the Athabasca river basin: Historical trends and projected future occurrence. Can. Water Resour. J. 2017, 42, 315–335. [Google Scholar] [CrossRef]
- Bonsal, B.R.; Peters, D.L.; Seglenieks, F.; Rivera, A.; Berg, A. Changes in freshwater availability across Canada. In Canada’s Changing Climate Report; Bush, E., Lemmen, D.S., Eds.; Government of Canada: Ottawa, ON, Canada, 2019; Chapter 6; pp. 261–342. [Google Scholar]
- Gurrapu, S.; Sauchyn, D.J.; Hodder, K.R. Assessment of the hydrological drought risk in Calgary, Canada using weekly river flows of the past millennium. J. Water Clim. Chang. 2022, 13, 1920–1935. [Google Scholar] [CrossRef]
- Sauchyn, D.; Vanstone, J.; Jacques, J.-M.S.; Sauchyn, R. Dendrohydrology in Western Canada and Applications to Water Resource Management. J. Hydrol. 2015, 529, 548–558. [Google Scholar] [CrossRef]
- Kerr, S.A.; Andreichuk, Y.; Sauchyn, D. Comparing paleo reconstructions of warm and cool season streamflow (1400–2018) for the North and South Saskatchewan River sub-basins, Western Canada. Can. Water Resour. 2022, 48, 50–66. [Google Scholar] [CrossRef]
- Basu, S.; Sauchyn, D.J. Future Changes in the Surface Water Balance over Western Canada Using the CanESM5 (CMIP6) Ensemble for the Shared Socioeconomic Pathways 5 Scenario. Water 2022, 14, 691. [Google Scholar] [CrossRef]
- Stewart, R.; Pomeroy, J.; Lawford, R. The Drought Research Initiative: A Comprehensive Examination of Drought over the Canadian Prairies. Atmosphere-Ocean 2011, 49, 297–302. [Google Scholar] [CrossRef]
- Christian, J.; Christian, K.; Basara, J. Drought and Pluvial Dipole Events within the Great Plains of the United States. J. Appl. Meteorol. Climatol. 2015, 54, 1886–1898. [Google Scholar] [CrossRef]
- Ford, T.W.; Chen, L.; Schoof, J.T. Variability and Transitions in Precipitation Extremes in the Midwest United States. J. Hydrometeorol. 2021, 22, 533–545. [Google Scholar] [CrossRef]
- Maxwell, J.T.; Knapp, P.A.; Ortegren, J.T.; Ficklin, D.L.; Soulé, P.T. Changes in the Mechanisms Causing Rapid Drought Cessation in the Southeastern United States. Geophys. Res. Lett. 2017, 44, 12476–12483. [Google Scholar] [CrossRef]
- Martin, E. Future projections of global pluvial and drought event characteristics. Geophys. Res. Lett. 2018, 45, 11913–11920. [Google Scholar] [CrossRef]
- De Luca, P.; Messori, G.; Wilby, R.L.; Mazzoleni, M.; Di Baldassarre, G. Concurrent wet and dry hydrological extremes at the global scale. Earth Syst. Dyn. 2020, 11, 251–266. [Google Scholar] [CrossRef]
- Rashid, M.M.; Wahl, T. Hydrologic risk from consecutive dry and wet extremes at the global scale. Environ. Res. Commun. 2022, 4, 071001. [Google Scholar] [CrossRef]
- Pokharel, B.; Jagannathan, K.A.; Wang, S.Y.; Jones, A.D.; Ullrich, P.; Leung, L.R.; LaPlante, M.; Buddhavarapu, S.; Eklund, J.; Hasenyager, C.; et al. Drought-busting ‘miracles’ in the Colorado River Basin may become less frequent and less powerful under climate warming. ESS Open Arch. 2022, 2022, 121. [Google Scholar] [CrossRef]
- Bonsal, B.R.; Wheaton, E.E.; Meinert, A.; Siemens, E. Characterizing the surface features of the 1999–2005 Canadian Prairie drought in relation to previous severe 20th century events. Atmosphere-Ocean 2011, 49, 320–338. [Google Scholar] [CrossRef]
- Phillips, D. The Day Niagara Falls Ran Dry! Key Porter Books: Toronto, ON, Canada, 1993; 226p. [Google Scholar]
- Hunter, F.; Donald, D.; Johnson, B.; Hyde, W.; Hanesiak, J.; Kellerhas, M.; Hopinson, R.; Oegema, B. The Vanguard torrential storm. Can. Water Resour. J. 2002, 27, 213–227. [Google Scholar] [CrossRef]
- Wittrock, V.; Wheaton, E.; Siemens, E. More Than a Close Call: A Preliminary Assessment of the Characteristics, Impacts of and Adaptations to the Drought of 2009-10 in the Canadian Prairies; Prepared for Environment Canada Adaptation and Impacts Research Division (AIRD); SRC Publication No. 12803-1E10; Saskatchewan Research Council: Saskatoon, SK, Canada, 2010; 124p. [Google Scholar]
- Hopkinson, R. An Overview of 2010 Early Summer Severe Weather Events in Saskatchewan; Custom Climate Services Inc.: Regina, SK, Canada, 2010. [Google Scholar]
- Agriculture and Agri-Food Canada (AAFC). Canadian Drought Monitor. 2023. Available online: https://agriculture.canada.ca/atlas/maps_cartes/canadianDroughtMonitor/en/ (accessed on 15 July 2023).
- Maybank, J.; Bonsal, B.; Jones, K.; Lawford, R.; O’Brien, E.G.; Ripley, E.; Wheaton, E. Drought as a natural disaster. Atmosphere-Ocean 1995, 33, 195–222. [Google Scholar] [CrossRef]
- Vicente-Serrano, S.M.; Beguería, S.; López-Moreno, J.I. A Multi-scalar drought index sensitive to global warming: The Standardized Precipitation Evapotranspiration Index. SPEI. J. Clim. 2010, 23, 1696–1718. [Google Scholar] [CrossRef]
- Wheaton, E.; Bonsal, B.; Wittrock, V. Future Possible Dry and Wet Extremes in Saskatchewan, Canada; Prepared for the Water Security Agency of Saskatchewan; SRC #13462-1E13; Saskatchewan Research Council: Saskatoon, SK, Canada, 2013; 35p. [Google Scholar]


| Reference | Compound Extreme Type | Description /Finding | Temporal and Spatial Patterns | Region | Methods |
|---|---|---|---|---|---|
| Christian 2015 [39] | Drought year followed by a pluvial year (dipole) | Chance of significant pluvial year after a significant drought year about 25% | Autumn to early winter period is critical to transitions Doubling of dry–wet events in more recent observation period 1955–2013 | Northern Great Plains of US | Standard deviations of drought to pluvial transition to define dipoles, hydrological year |
| Martin 2018 [42] | Projections of pluvial and drought characteristics, number, duration, severity | Worsening droughts and pluvials most apparent in N Hemisphere mid latitudes and Americas | Drying regions may see more longer and stronger pluvials Precipitation variability expected to increase globally | Global | SPI 6month, CMIP5 models, severity index using SPEI thresholds and time |
| Maxwell et al., 2017 [41] | Pluvials resulting in drought termination | 73% of droughts ended rapidly in a one-month period | Rapid drought endings are more common than gradual endings | Southeastern US | PDSI, moderate level, percentage of grids, storm classification, trend analyses, oceanic and atmospheric indices |
| He Sheffield 2020 [12] | Lagged compound droughts and pluvials | 11% of droughts followed by pluvials, with rapid transitions | Drought to pluvial transitions have increased in past 30 years | Global, with Western Canada noted to have prominent spatially organized patterns | Event coincidence analyses, SPI 1 month, soil moisture, atmospheric circulations and land-atmosphere feedbacks |
| De Luca et al., 2020 [43] | Concurrent wet and dry extremes | Median wet to dry transition is about 27 months and dry to wet is about 21 months | Land areas affected by extreme dry–wet anomalies are increasing with time | Global | PDSI, 1950–2014, dry–wet ratio, extreme transition time, teleconnections |
| Ford et al., 2021 [40] | Variability and rapid transitions of precipitation extremes | Large areas have had a significant increase in annual SPI range and associated magnitude of transition time | Findings are aligned with flash drought studies indicating a decrease in warning time | Midwest US | SPI, 30, 90 and 180-day scales, 1951–2019, thresholds for transitions |
| Chen Wang 2022 [18] | Transitions between dry and wet periods | Shorter dry-to-wet transitions are projected for 59% of the global land Variabilities accelerated the dry to wet transitions | Strong intensity and rapid transitions found in Eastern Canada and northern US | Global | SPEI 3-month observations 1954–2014, projections using CMIP6 |
| Rashid Wahl 2022 [44] | Consecutive dry and wet extremes | Consecutive dry-to-wet extremes are increasing over time | Numbers of events range from 20–30 in North America, 1901–2015 | Global | PDSI 6 months, multi-hazard risk, copula models, teleconnections |
| Rezvani et al., 2023 [21] | Projected compound droughts and floods (not precipitation) | Frequency of flood to drought events is projected to double at 1.5 °C global warming Transition time projected to increase | Climate warming increases variability, frequency and magnitudes Flood to drought transitions occur more quickly with climate change | Peace, Fraser and Columbia river basins in NW North America | Streamflow records and simulations, threshold method, Empirical Compound Severity Index, CMIP5 |
| Pokharel et al., 2023 [45] | Extreme spring dry-to-wet transitions One to two per decade in observations | Dry-to-wet transitions are likely to slow down and weaken in the future, especially after about 2050 | Dry–wet transitions are more common in the upper than lower basin in the observations | Colorado River Basin | PDSI, PHDI, SPI3 and 6 months, CMIP5 and 6 models, WRF PGW |
| Pluvial | Pluvial Characteristics | Relation to Drought | Region of Pluvial | References Combined |
|---|---|---|---|---|
| Record one-hour rainfall during drought | 250 mm in one hour in May 1961 | Record rainfall in the growth stage of a record drought of 1960–1962 | Southern Saskatchewan | Phillips 1993 [47]; Bonsal et al., 2011 [46] |
| Record eight-hour rainfall during drought | 375 mm in eight hours in July 2000 | Record rainfall in an onset stage (SPI) of record drought of 1999–2005 | Southwest Saskatchewan | Hunter et al., 2002 [48]; Bonsal et al., 2011 [46] |
| Major rainstorm during 1999–2004 drought | Intense rainfall, 8–11 June 2002 Two intense precipitation regions, one in the eastern and the other in the Western Prairies | Pluvial during the driest period of the drought, i.e., the persistence stage (PDSI), early retreat stage (SPI) and only three months after the peak of the drought | Southern Prairies from AB to MB, drought shifted northward | Szeto et al., 2011 [25]; Bonsal et al., 2011 [46] |
| 2010 | Spring and June 2010 Spring 2010 was the wettest in 63 years | Pluvials ended the meteorological drought of 2008–2010 with spring rains in 2010 | Northwest Saskatchewan in 2009, central and southwest Saskatchewan in 2010 | Wittrock et al., 2010 [49]; Hopkinson 2010 [50] |
| 2022 | Excess spring moisture | After a severe drought and heat dome in 2021 | Eastern Saskatchewan especially | AAFC 2023 [51] |
| Dates | Main Areas of Drought | Main Areas of Wet Conditions | Relationships |
|---|---|---|---|
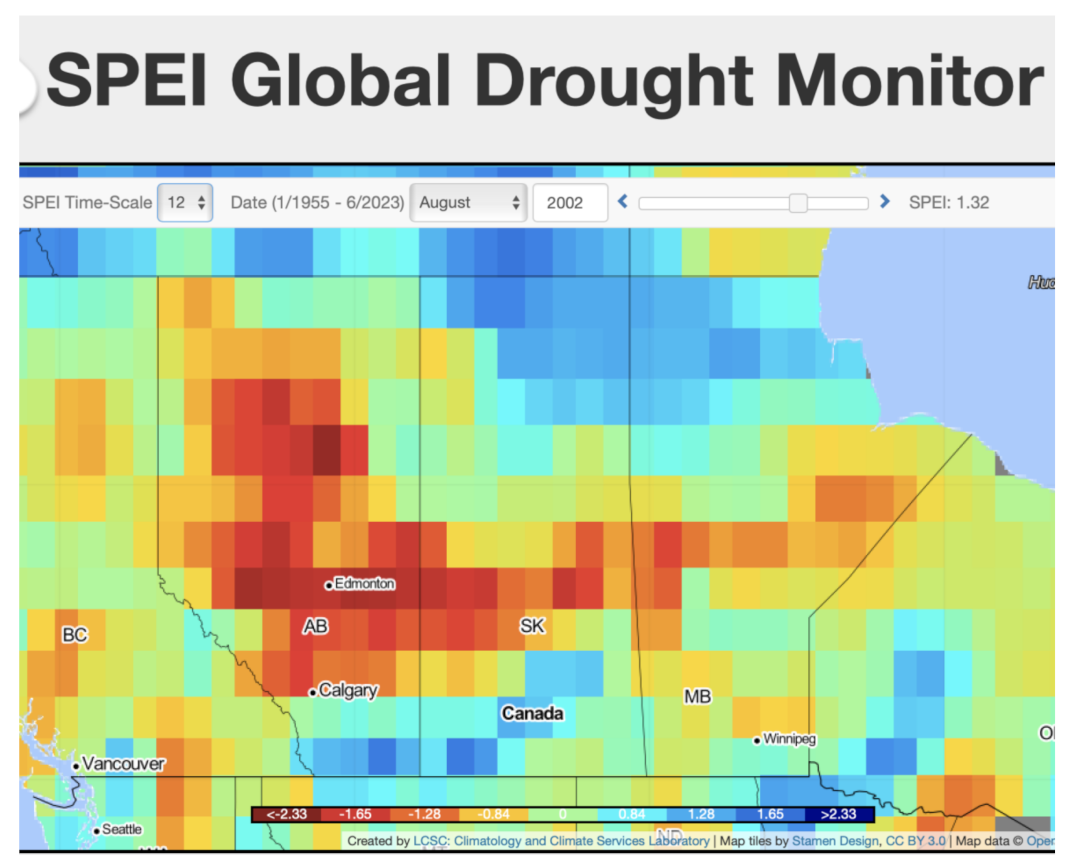
| 2000 | Drought in S AB, most intense at SPEI −2.0 in central AB | Wet with SPEI +1.4 in SE MB | A strong west to east gradient from severe drought in AB to normal in central SK. Boundary between dry-to-wet is oriented N to S and located west of the AB-SK border |
| 2001 | Drought has intensified in AB and is worst in central N SK at SPEI −2.3 | Wetter in much of MB to +1.6 in central MB | The west to east dry-to-wet gradient has intensified and shifted westward. The dry–wet boundary is oriented N to S, and is near the SK-MB border |
| 2002 | Drought is most intense at −2.0 in W AB and drought extends across central SK and into MB | Wet in S AB and central and S SK at +1.6 | Patterns have switched as drought migrated northward. Pattern is dry in central areas of AB and SK and very wet in the south Dry-to-wet boundary is oriented W to E |
| 2009 | Intense drought in central and northern AB at −1.7, and has ended mostly in SK and MB | Near normal conditions in SW AB across to MB with wetter in E MB to +2.2 | West to east dry-to-wet gradient is at the AB-SK border in central areas and into SK Dry-to-wet boundary is more complicated. It is oriented N to S in central areas, and is in western SK Another boundary exists from central to southern SK |
| 2010 | Drought has receded with near normal to drought of −1.5 in W AB | Normal to wet at +2.0 in W AB, wet most of SK to more than +2.3, normal to wet in N MB at more than +2.0 | Severe to extreme wet over much of the Prairies, except western AB Strong dry-to-wet boundary is oriented mostly N to S in central AB |
| 2011 | Some pockets of dry to drought exist in central MB. No large areas of drought | Very wet in S SK at 2.3 in SE, normal to wet in AB | Boundary of dry to normal is along the SK MB border in a mostly N to S alignment |
| 2015 | Extreme drought in AB with worst at −2.2, extending across SK with worst at −1.7 and into MB at −1.4 | NE SK at +1.9 and NW MB are the only wetter regions | Extensive drought across the Prairies Strong dry-to-wet boundary in NE SK with NW to SE orientation |
| 2022 | Drought mostly concentrated in AB and SK at −1.5, with near normal in central and NW AB, near normal to wet in E MB | Wet at +2.2 in E MB | SK drought is sandwiched between near normal in W AB to wet in MB Strongest dry-to-wet boundary is in W MB and is oriented N to S |
Disclaimer/Publisher’s Note: The statements, opinions and data contained in all publications are solely those of the individual author(s) and contributor(s) and not of MDPI and/or the editor(s). MDPI and/or the editor(s) disclaim responsibility for any injury to people or property resulting from any ideas, methods, instructions or products referred to in the content. |
© 2023 by the authors. Licensee MDPI, Basel, Switzerland. This article is an open access article distributed under the terms and conditions of the Creative Commons Attribution (CC BY) license (https://creativecommons.org/licenses/by/4.0/).
Share and Cite
Wheaton, E.; Bonsal, B.; Sauchyn, D. Compound Extremes of Droughts and Pluvials: A Review and Exploration of Spatio-Temporal Characteristics and Associated Risks in the Canadian Prairies. Water 2023, 15, 3509. https://doi.org/10.3390/w15193509
Wheaton E, Bonsal B, Sauchyn D. Compound Extremes of Droughts and Pluvials: A Review and Exploration of Spatio-Temporal Characteristics and Associated Risks in the Canadian Prairies. Water. 2023; 15(19):3509. https://doi.org/10.3390/w15193509
Chicago/Turabian StyleWheaton, Elaine, Barrie Bonsal, and David Sauchyn. 2023. "Compound Extremes of Droughts and Pluvials: A Review and Exploration of Spatio-Temporal Characteristics and Associated Risks in the Canadian Prairies" Water 15, no. 19: 3509. https://doi.org/10.3390/w15193509
APA StyleWheaton, E., Bonsal, B., & Sauchyn, D. (2023). Compound Extremes of Droughts and Pluvials: A Review and Exploration of Spatio-Temporal Characteristics and Associated Risks in the Canadian Prairies. Water, 15(19), 3509. https://doi.org/10.3390/w15193509