Article

Nitrogen and Phosphorus Loading Characteristics of Agricultural Non-Point Sources in the Tuojiang River Basin

1
School of Chemistry and Chemical Engineering, Sichuan University of Arts and Science, Dazhou 635000, China
2
Dazhou Research Academy of Ecology and Environmental Sciences, Dazhou 635000, China
3
School of Environment and Resource, Southwest University of Science and Technology, Mianyang 621000, China
4
Key Laboratory of Green Chemistry, Sichuan Institutes of Higher Education, Zigong 643000, China
*
Author to whom correspondence should be addressed.
Water 2023, 15(19), 3503; https://doi.org/10.3390/w15193503
Submission received: 21 August 2023 / Revised: 18 September 2023 / Accepted: 3 October 2023 / Published: 7 October 2023
(This article belongs to the Special Issue Agricultural Water-Saving Effects of Soil Mulching)

Abstract

:
Agricultural non-point source (ANPS) pollution has emerged as a significant factor influencing water quality within watersheds. Understanding the spatial distribution and composition of ANPS is crucial for effective river water quality management. Based on the statistical data of 28 districts and counties in the Tuojiang River Basin (TJRB), the load distribution characteristics of total nitrogen (TN) and total phosphorus (TP) from ANPS were studied in this work by using the pollutant discharge coefficient method. In 2018, ANPS contributed 60,888.92 tons of TN and 20,085.98 tons of TP to the TJRB. By 2019, the TN load had decreased to 57,155.44 tons, while the TP load increased to 21,659.91 tons. Spatially, TN and TP loads follow a pattern of being lowest in the upstream, intermediate in the downstream, and highest in the middle reaches. Planting sources emerged as the primary contributors to TN and TP loads from ANPS in the TJRB, accounting for 61.43% and 77.39%, respectively. Rural living sources made a lesser contribution, at 20.23% for TN and 9.15% for TP, while poultry and livestock farming sources accounted for 18.34% of TN and 13.46% of TP loads. The analysis of grey water footprint (GWF) and water pollution level (WPL) revealed that TN and TP loads continued to exert significant pressure on the TJRB’s water environment throughout the study period. These findings offer valuable insights for enhancing water quality management in the TJRB.

1. Introduction

In recent years, growing environmental awareness has led to increased efforts to control pollutant emissions and combat water pollution, particularly focusing on addressing point source pollution [1,2,3]. China’s second pollutant survey has revealed that non-point sources (NPS) like agriculture, planting, aquaculture, and rural living have emerged as the primary contributors to total nitrogen (TN) and total phosphorus (TP) pollution in the country’s ecological environment [4,5,6]. Moreover, studies have shown that NPS pollution has become the main source of surface water pollution in global rivers and lakes [7,8,9,10]. Furthermore, China has conducted extensive research on nitrogen and phosphorus pollution and its remediation over the past decades [11,12,13].
Due to the characteristics of NPS pollutants, such as diffusion, spatial heterogeneity, source uncertainty, and regional variations in propagation processes [14], accurately quantifying NPS pollutants and their effects on surrounding water is challenging [15]. Landscape patterns have been identified as a significant factor influencing NPS pollution, with various landscape configurations having notable effects on NPS pollution dynamics [16,17]. For instance, paddy fields can function as both sources and sinks for nitrate [18]. In the context of the Tuojiang River, several studies have highlighted the pervasive issue of nitrogen and phosphorus pollution [19,20,21]. The major contributors to TP emissions in the basin include livestock breeding, agricultural activities, domestic sources, and industrial discharges, with NPS accounting for 3.07 times more water TP than point sources [22]. Wang et al. [23] have proposed the division of watersheds into distinct ecological regions based on hydrological and geostatistical analyses, as well as cluster analysis, to better understand the transport characteristics of NPS pollutants on a catchment scale. Acosta et al. [24] have demonstrated that environmental pressures significantly influence the diffusion and transfer of pollutants within a watershed’s ecological environment. In addressing NPS pollution, conventional control measures have limitations, but large-scale constructed wetlands have emerged as effective bioengineering solutions [25]. Additionally, the implementation of best management practices and appropriate engineering measures has yielded remarkable results in NPS pollution control and nutrient load reduction, garnering widespread recognition as effective approaches [26].
Given the intricate nature of NPS pollution, assessing its impact on the water environment has been an arduous endeavor. Scholars have introduced the concept of the grey water footprint (GWF) to grapple with this challenge [27,28,29,30,31]. The GWF facilitates the conversion of pollutant quantities into equivalent volumes of freshwater, offering a quantitative framework for assessing NPS pollutant characteristics alongside local surface water resources [32]. Feng et al. [33] delved into GWF research in China, focusing on parameters such as chemical oxygen demand (COD), ammonia nitrogen (NH3-N), TN, and TP. Their findings highlighted that the shift in the dominant pollutant from COD to TN in China was largely attributed to increased nitrogen fertilizer usage. Similarly, Aldaya et al. [31] studied surface water in Spain and found that regions with stronger agricultural activities had larger GWF, and about 64% of the nitrogen load originated from agricultural fertilizers. Additionally, some studies have suggested that adopting a multi-parameter GWF approach provides a more precise method for evaluating the impact of NPS pollution on the water environment [34,35,36].
The Tuojiang River is a vital tributary of the upper Yangtze River, and the water resources within the Tuojiang River Basin (TJRB) play a pivotal role in the economic and social development of the entire Sichuan Basin. In the TJRB, industry and agriculture coexist, creating a complex economic landscape alongside significant water environmental challenges. Extensive research has been conducted on pollution sources [20] and water quality [37] in the Tuojiang River, revealing nitrogen and phosphorus areas as the main pollutants [38,39,40]. The presence of nitrogen and phosphorus not only triggers water body eutrophication but also poses a substantial threat to the well-being of residents. For instance, severe phosphorus pollution has afflicted Lake Dianchi, leading to significant ecological and environmental issues [41,42]. However, there is limited information available regarding the composition and characteristics of TN and TP loads from agricultural non-point sources (ANPS) in the TJRB. Investigating the distribution, composition, and characteristics of TN and TP loads from ANPS within the TJRB can help formulate effective management and control measures, improve water resource utilization efficiency, and ensure the environmental security of the basin.
Based on the above considerations and using the statistical data from 28 districts and counties within the TJRB for the years 2018–2019, the primary objectives of this study were as follows: (1) To calculate and analyze the TN and TP loads originating from ANPS in the TJRB using the pollutant discharge coefficient method, while also examining their temporal and spatial variations as well as their composition characteristics. (2) To calculate the characteristics of GWF and Water Pollution Level (WPL) of ANPS in the TJRB based on the total surface water resources.

2. Material and Methods
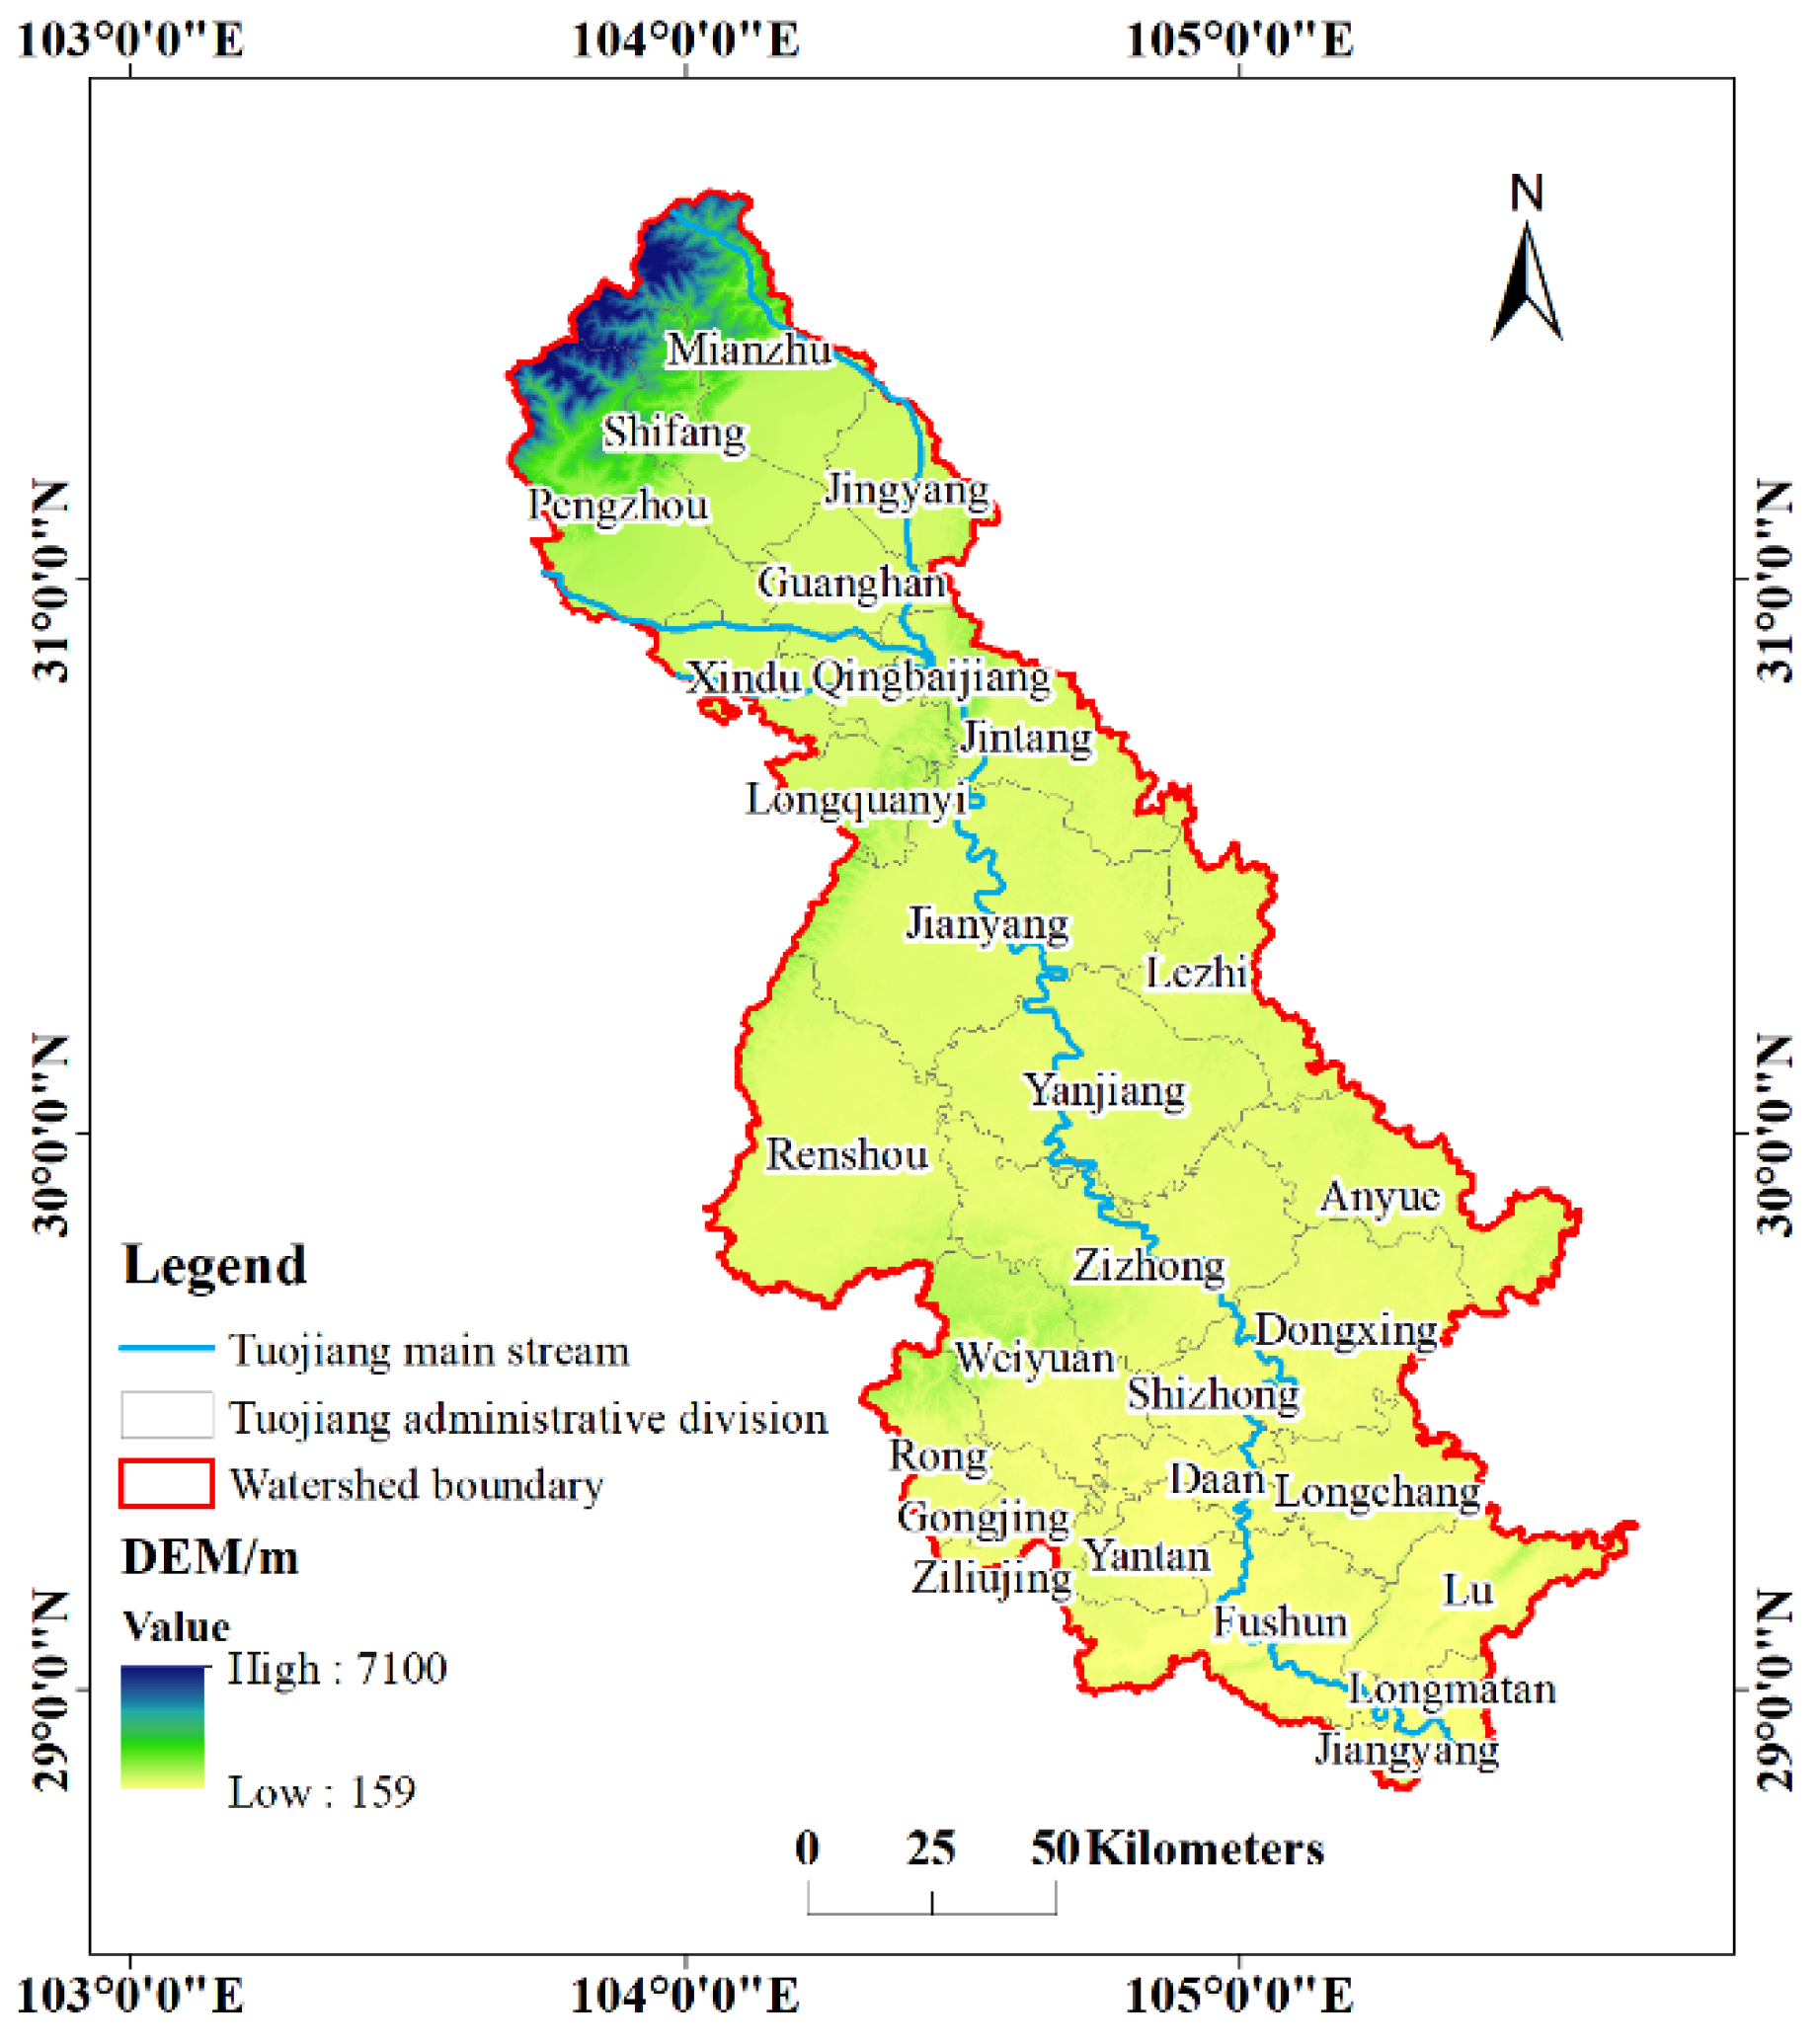
2.1. Study Area

The TJRB (Figure 1) serves as a crucial water source for Sichuan Province and is an integral part of the Yangtze River Economic Belt. It encompasses seven cities, namely Deyang, Chengdu, Meishan, Ziyang, Neijiang, Zigong, and Luzhou, along with 28 county-level administrative regions. Spanning a total length of 627.4 km and covering a drainage area of 27,860 km2, the TJRB stands out as the most densely populated urban area and the most developed industrial and agricultural production region in Sichuan Province [22,37]. The population residing in the TJRB accounts for 26.2% of the entire province, contributing significantly to the region’s total economic output of 30.0%. Land utilization within the TJRB primarily comprises woodland and cultivated land, collectively occupying over 90% of the basin’s total land area [38].

2.2. Data and Parameters

In this work, ANPS TN and TP loads mainly originate from three sources: planting sources, poultry and livestock farming sources, and rural population living sources. The TN and TP loads were estimated using pollutant emission factors and ANPS data. This data primarily includes information about rural populations, total surface water resources, fertilizer application, and livestock production for each district and county in the TJRB for the years 2018 and 2019. The data sources encompass the Sichuan Statistical Yearbook [43,44], the Changjiang and Southwest Rivers Water Resources Bulletin [45,46], Statistical Yearbooks and Water Resources Bulletins of the 28 districts and counties in the TJRB and the statistical bulletin of national economic and social development for these same 28 districts and counties. Based on the China pollution source census dataset [47], combined with existing literature [48], along with the penetration rate of sanitary latrines in rural areas of Sichuan Province, the TN and TP emissions and the loss coefficients into the river for domestic sewage, domestic garbage, human manure, and urine in the TJRB were determined.

2.3. ANPS TN and TP Calculation

Utilizing the pollutant discharge coefficient method and integrating data on fertilizer consumption, rural population, and livestock production in the TJRB, nitrogen and phosphorus emissions from rural living, planting, poultry, and livestock farming sources were calculated.

2.3.1. Planting Source

The emissions of TN and TP from planting sources can be determined using Equations (1) and (2), respectively, while the amounts of TN and TP that enter the river are calculated using Equations (3) and (4), respectively.
FN = NF + CF × 0.3
FP = NP + CF × 0.3
FNR = FN × η
FPR = FP × η
where FN represents the total nitrogen emission of planting source (t), NF represents the amount of nitrogen fertilizer (t), FP represents the total phosphorus emission from planting source (t), NP represents the amount of phosphate fertilizer (t), CF represents the amount of compound fertilizer (t), FNR represents the total nitrogen that enters the river (t), FPR represents the total phosphorus that enters the river (t), η represents the loss coefficient into the river, which is 0.12 [49].

2.3.2. Rural Living Source

Nitrogen and phosphorus production from rural living sources encompasses three components: domestic sewage, solid waste, and human excrement. The TN and TP emissions from rural living sources are represented using Equation (5), and the TN and TP entering the river are described using Equation (6).
DW = PC1 + PC2ρ + PC3
DWR = PC1(1 − φ)μ + PC2λρ + PC3β
where DW represents the TN and TP emissions from rural living sources (kg), while DWR represents the amount of TN and TP entering the river from rural living sources (kg). P denotes the rural population, C1 represents TN and TP emissions in domestic sewage per person per day (g/(person day)), φ represents domestic sewage treatment rate, μ is the coefficient for domestic sewage entering the river, C2 denotes TN and TP content in solid household waste of rural residents, ρ represents the solid waste emission coefficient (kg/(person-year)), λ represents the coefficient of household waste entering the river, C3 stands for TN and TP emissions in human manure and urine (g/(person day)), and β represents the loss coefficient of human excrement into the river.
Based on the China pollution source census dataset [47] and the Sichuan Ecology and Environment Statement [50], C1 for TN and TP in the TJRB was determined to be 1.42 kg/a and 0.107 kg/a, respectively, with a φ value of 25.73%. Additionally, based on references [48,49], C2 was determined to be 0.455% for TN and 0.117% for TP, with a ρ value of 186.15 kg/(person a). TN and TP emissions per capita in human manure were 3.06 kg/a and 0.524 kg/a, respectively. The discharge coefficients of domestic sewage, domestic garbage, and fecal urine into the river were set as μ is 30%, λ is 20%, and β is10%, respectively [47,51].

2.3.3. Poultry and Livestock Farming Source

According to the statistical almanac of each county in the TJRB, the amount of TN and TP load produced by cattle, sheep, poultry, and swine was calculated to represent the pollution load of poultry and livestock farming sources in the basin. The TN and TP emissions of poultry and livestock farming sources are shown in Equation (7), while the amounts of TN and TP in the river are shown in Equation (8).
LFi = ∑QkRik
LFRi = ∑QkRik × α
where LFi represents the TN and TP emission of poultry and livestock farming source (kg), Qk represents the breeding quantity of the k kind of livestock (head), Rik represents the TN or TP emission coefficient of type k livestock (kg/head a), LFRi represents the amount of TN and TP entering the river from poultry and livestock farming source (kg), α represents the loss coefficient into the river of poultry and livestock farming source.
The emissions and discharge coefficients of livestock in the TJRB were determined based on the Second National Survey of Pollution Sources in China [47] and studies [49,52,53], the emissions and discharge coefficients of livestock in the TJRB were determined. Detailed values are provided in Table 1.

2.4. Grey Water Footprint

The GWF is defined as the pollution load divided by the difference between the standard threshold of the parameter and the natural background value [54]. The water quality function zone of the TJRB mandates that water quality meets the standard values set in the third category of the “Environmental Quality Standards for Surface Water” of China. Therefore, when calculating the GWF for ANPS pollution in the TJRB, its standard threshold is defined as the third category water standard value. The GWF is represented by the formula:
GWFi = Li/(CmaxCnat)
where GWFi represents the gray water footprint of TN or TP (m3/a), Li represents the non-point source pollution load of TN or TP (kg/a), and Cmax represents the maximum acceptable concentration of nitrogen and phosphorus pollution in the basin. In this work, it is defined as the third category water standard value. Cnat represents the natural background value of TN and TP in the basin. In this work, Cnat = 0.
Another indicator, WPL, is used to assess the degree of freshwater pollution based on the GWF. It represents the ratio of the GWF to the total water resources in the basin. The interpretation of WPL values is as follows: WPL < 1 indicates that the basin still has the ability to assimilate and absorb pollutants, WPL = 1 indicates that the assimilation capacity of the basin has been exhausted, and WPL > 1 indicates that the assimilation capacity of sewage in the region is insufficient. A larger WPL value indicates a higher degree of water pollution. The formula for calculating WPL is as follows:
WPL = GWF/TR
where TR is the total amount of surface water resources in the region (m3).
The details of the parameters are provided in Table S1.

3. Results

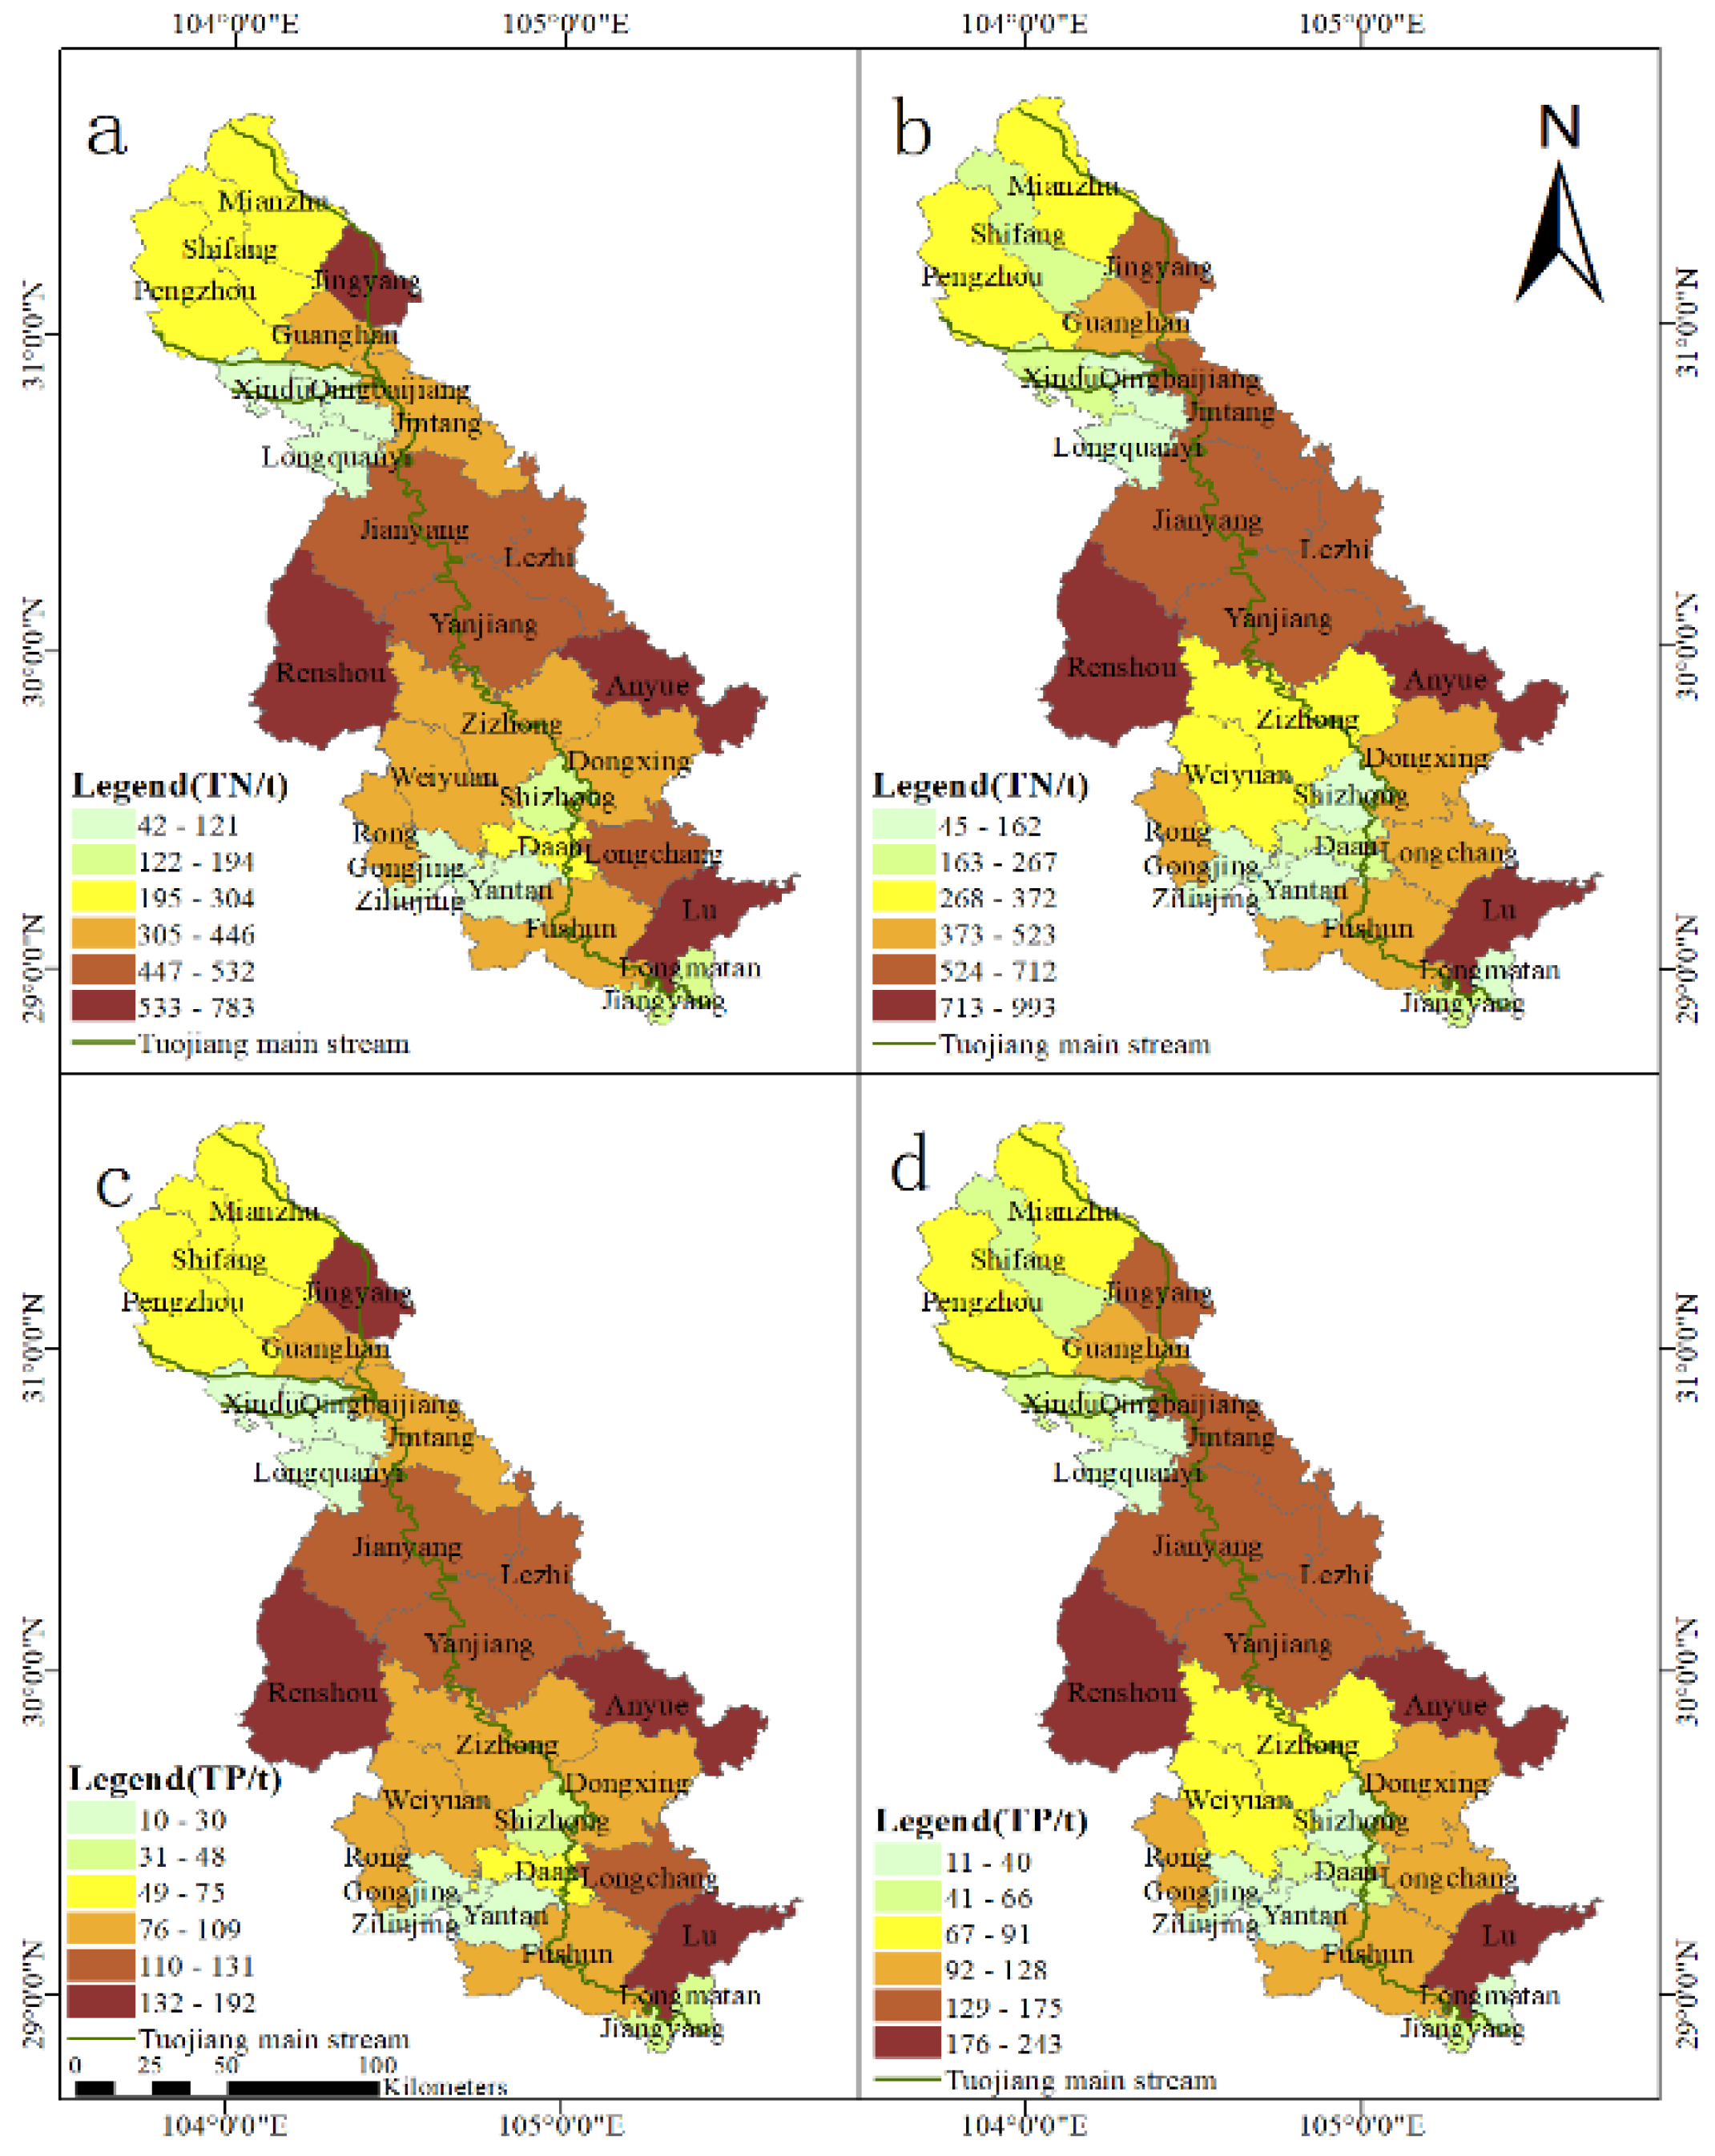
3.1. TN and TP Emissions from ANPS in the TJRB

3.1.1. TN and TP Emissions from Planting Source

The TN load in the TJRB decreased from 38,000 t in 2018 to 36,000 t in 2019, while the TP load increased from 15,000 t to 17,000 t. Figure 2 shows the amount of nitrogen and phosphorus inflow into the TJRB in each district and county.
In 2019, a total of 92.9% of districts and counties in the TJRB showed varying degrees of reduction in TN load, among which Shizhong District, Weiyuan County, Longchang City, and Jiangyang District had the largest reduction, reaching 12.77%, 15.18%, 15.70%, and 15.74%, respectively. In terms of TP load, only 10.7% of districts and counties saw a slight decrease in 2019, but Jiangyang District saw a larger decrease in TP load in 2019, reaching 27.9%. Among the 28 districts and counties, the TN and TP load of Jianyang City, Renshou County, and Zizhong County is much greater than that of other districts and counties. Neijiang, Chengdu, Deyang, Meishan, and Zigong have the highest TN and TP load in the basin. As shown in Figure S1, the contribution rate of each city to TN and TP load did not change significantly (p > 0.05) during the study period.

3.1.2. TN and TP Emissions from Rural Living Source

Figure 3 displays the TN and TP inflow into the TJRB for each district and county from rural living sources. The TN load in the TJRB decreased from 11,712.67 tons in 2018 to 11,217.60 tons in 2019, while the TP load decreased from 1774.8 tons in 2018 to 1699.78 tons in 2019. During the study period, only Luxian County and Yanjiang District showed a slight upward trend in TN and TP load, while the other 26 districts and counties experienced varying degrees of reduction in N and P loads. Jianyang City achieved the most significant reduction, with a decrease of 50.25%. Notably, Renshou County and Anyue County exhibited the highest TN and TP loads, with both counties surpassing 1000 tons of TN and 150 tons of TP during the study period, significantly exceeding the loads in other counties. Conversely, Ziliujing District and Longmatan District had the smallest TN and TP loads from rural living sources, with TN loads below 100 tons and TP loads below 15 tons in both 2018 and 2019.
Table S2 provides the distribution of TN and TP loads from rural living sources in the TJRB. The data in Table S2 reveals that nitrogen and phosphorus loads decreased to varying degrees in most cities of the TJRB in 2019. However, Luzhou saw a slight increase in nitrogen and phosphorus loads. Among the cities, Ziyang and Neijiang had the largest nitrogen and phosphorus loads, each accounting for approximately 20%. In contrast, Deyang, Meishan, and Luzhou had the lowest nitrogen and phosphorus loads, each accounting for less than 10%. This distribution pattern generally aligns with the trend of lower nitrogen and phosphorus loads in the upper and lower reaches and higher loads in the middle reaches.

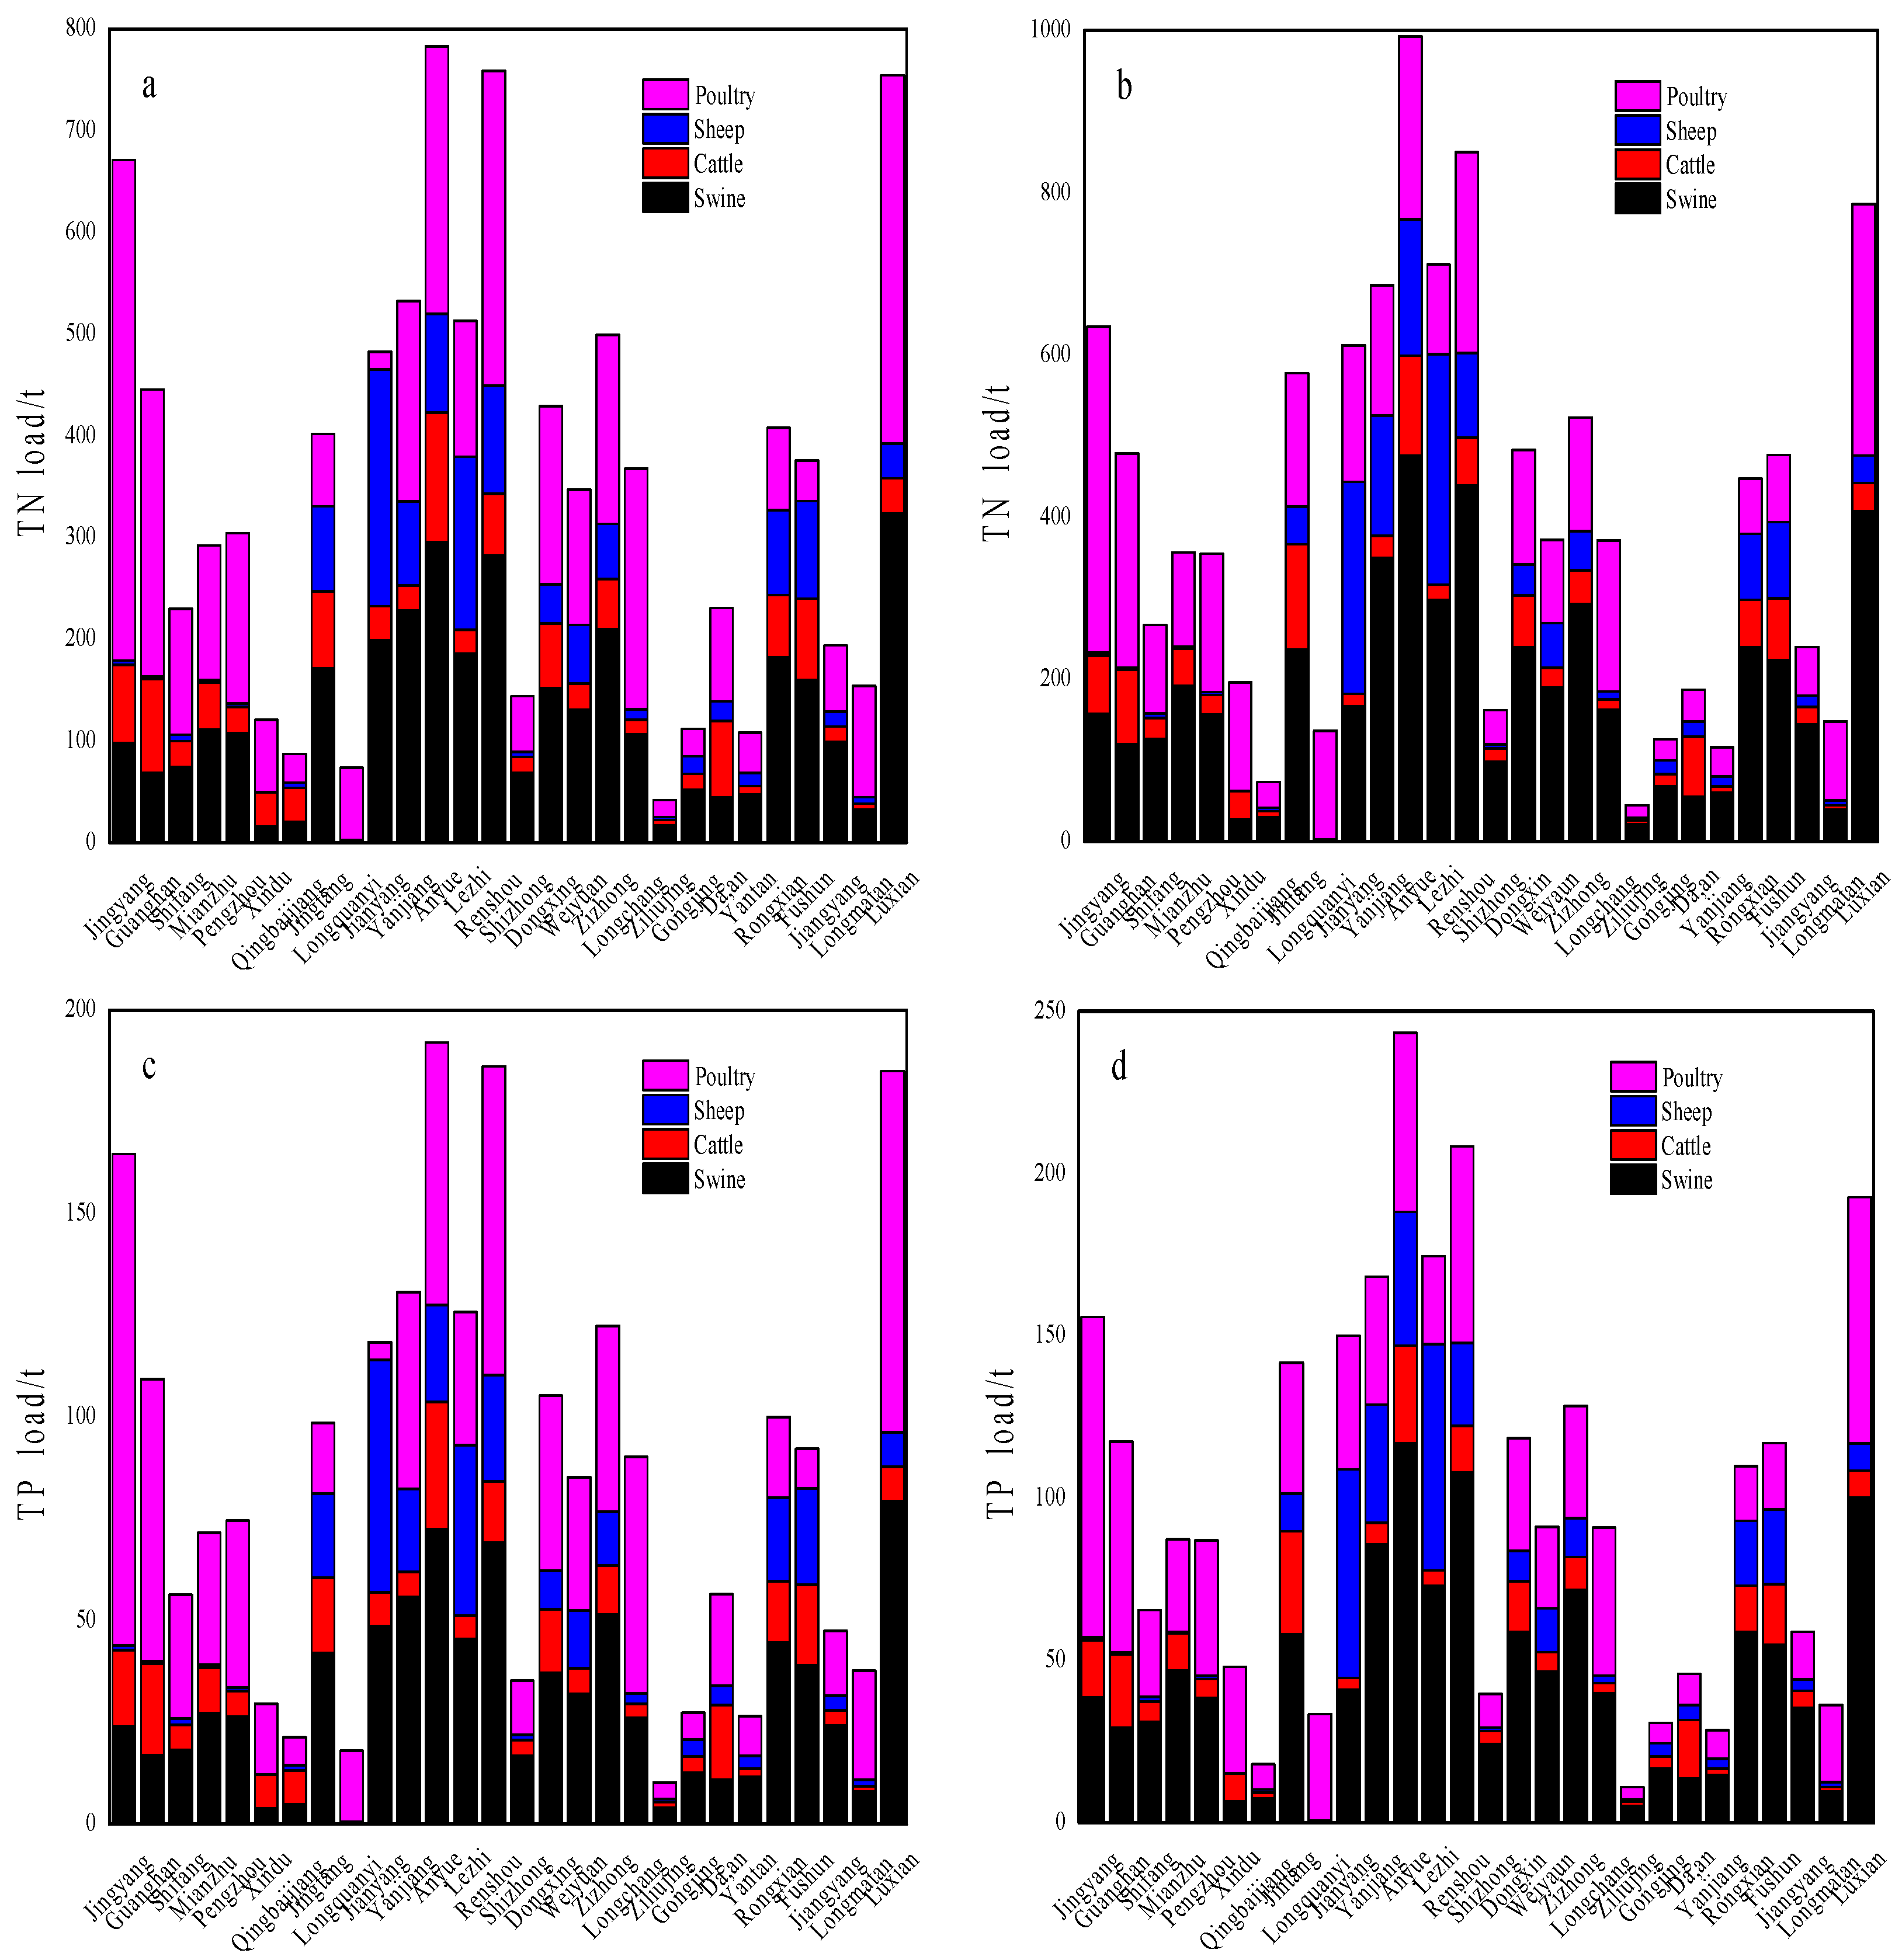
3.1.3. TN and TP Emissions from Poultry and Livestock Farming Source

The quantity of poultry and livestock farming varies greatly among districts and counties in the TJRB, resulting in varying TN and TP loads brought by poultry and livestock farming. The spatial distribution of TN and TP loads in each district and county within the river basin is depicted in Figure 4. In 2018, TN and TP loads from poultry and livestock farming in the TJRB were 11,412 tons and 2798.1 tons, respectively. However, in 2019, these loads decreased to 9860.4 tons for TN and 2417.7 tons for TP. Table S3 provides the proportion of TN and TP loads from poultry and livestock farming in each city within the basin.
In 2019, TN and TP loads from poultry and livestock farming in all cities of the TJRB decreased to varying degrees, with the most significant decreases observed in Chengdu and Ziyang cities, reaching 32.7% and 30.8%, respectively. The largest TN and TP loads from poultry and livestock farming in the TJRB were found in Ziyang, Neijiang, Chengdu, and Deyang. On a more specific level, only Jingyang District, Qingbaijiang District, Da’an District, and Longmatan District witnessed an increase in TN and TP loads in 2019 compared to 2018, while the remaining 85.7% of districts and counties experienced a decreasing trend.
To further explore the composition and characteristics of TN and TP loads from poultry and livestock farming in TJRB, TN and TP loads produced by swine, cattle, sheep, and poultry farming were calculated individually, as shown in Figure 5. TN and TP loads in each district and county within the TJRB were primarily attributed to poultry and swine breeding, followed by sheep and cattle farming. In 2018, TN and TP loads from swine, cattle, sheep, and poultry breeding constituted 42.71%, 10.56%, 10.11%, and 36.62% of the poultry and livestock farming TN and TP loads, respectively. In 2019, these figures shifted to 34.14%, 12.85%, 10.90%, and 42.11%, respectively. In summary, TN and TP loads from swine breeding decreased in 2019 compared to 2018, while TN and TP loads from poultry farming increased by 5.49% in 2019. Furthermore, the proportion of TN and TP loads from cattle and sheep farming exhibited minimal fluctuations during the study period.

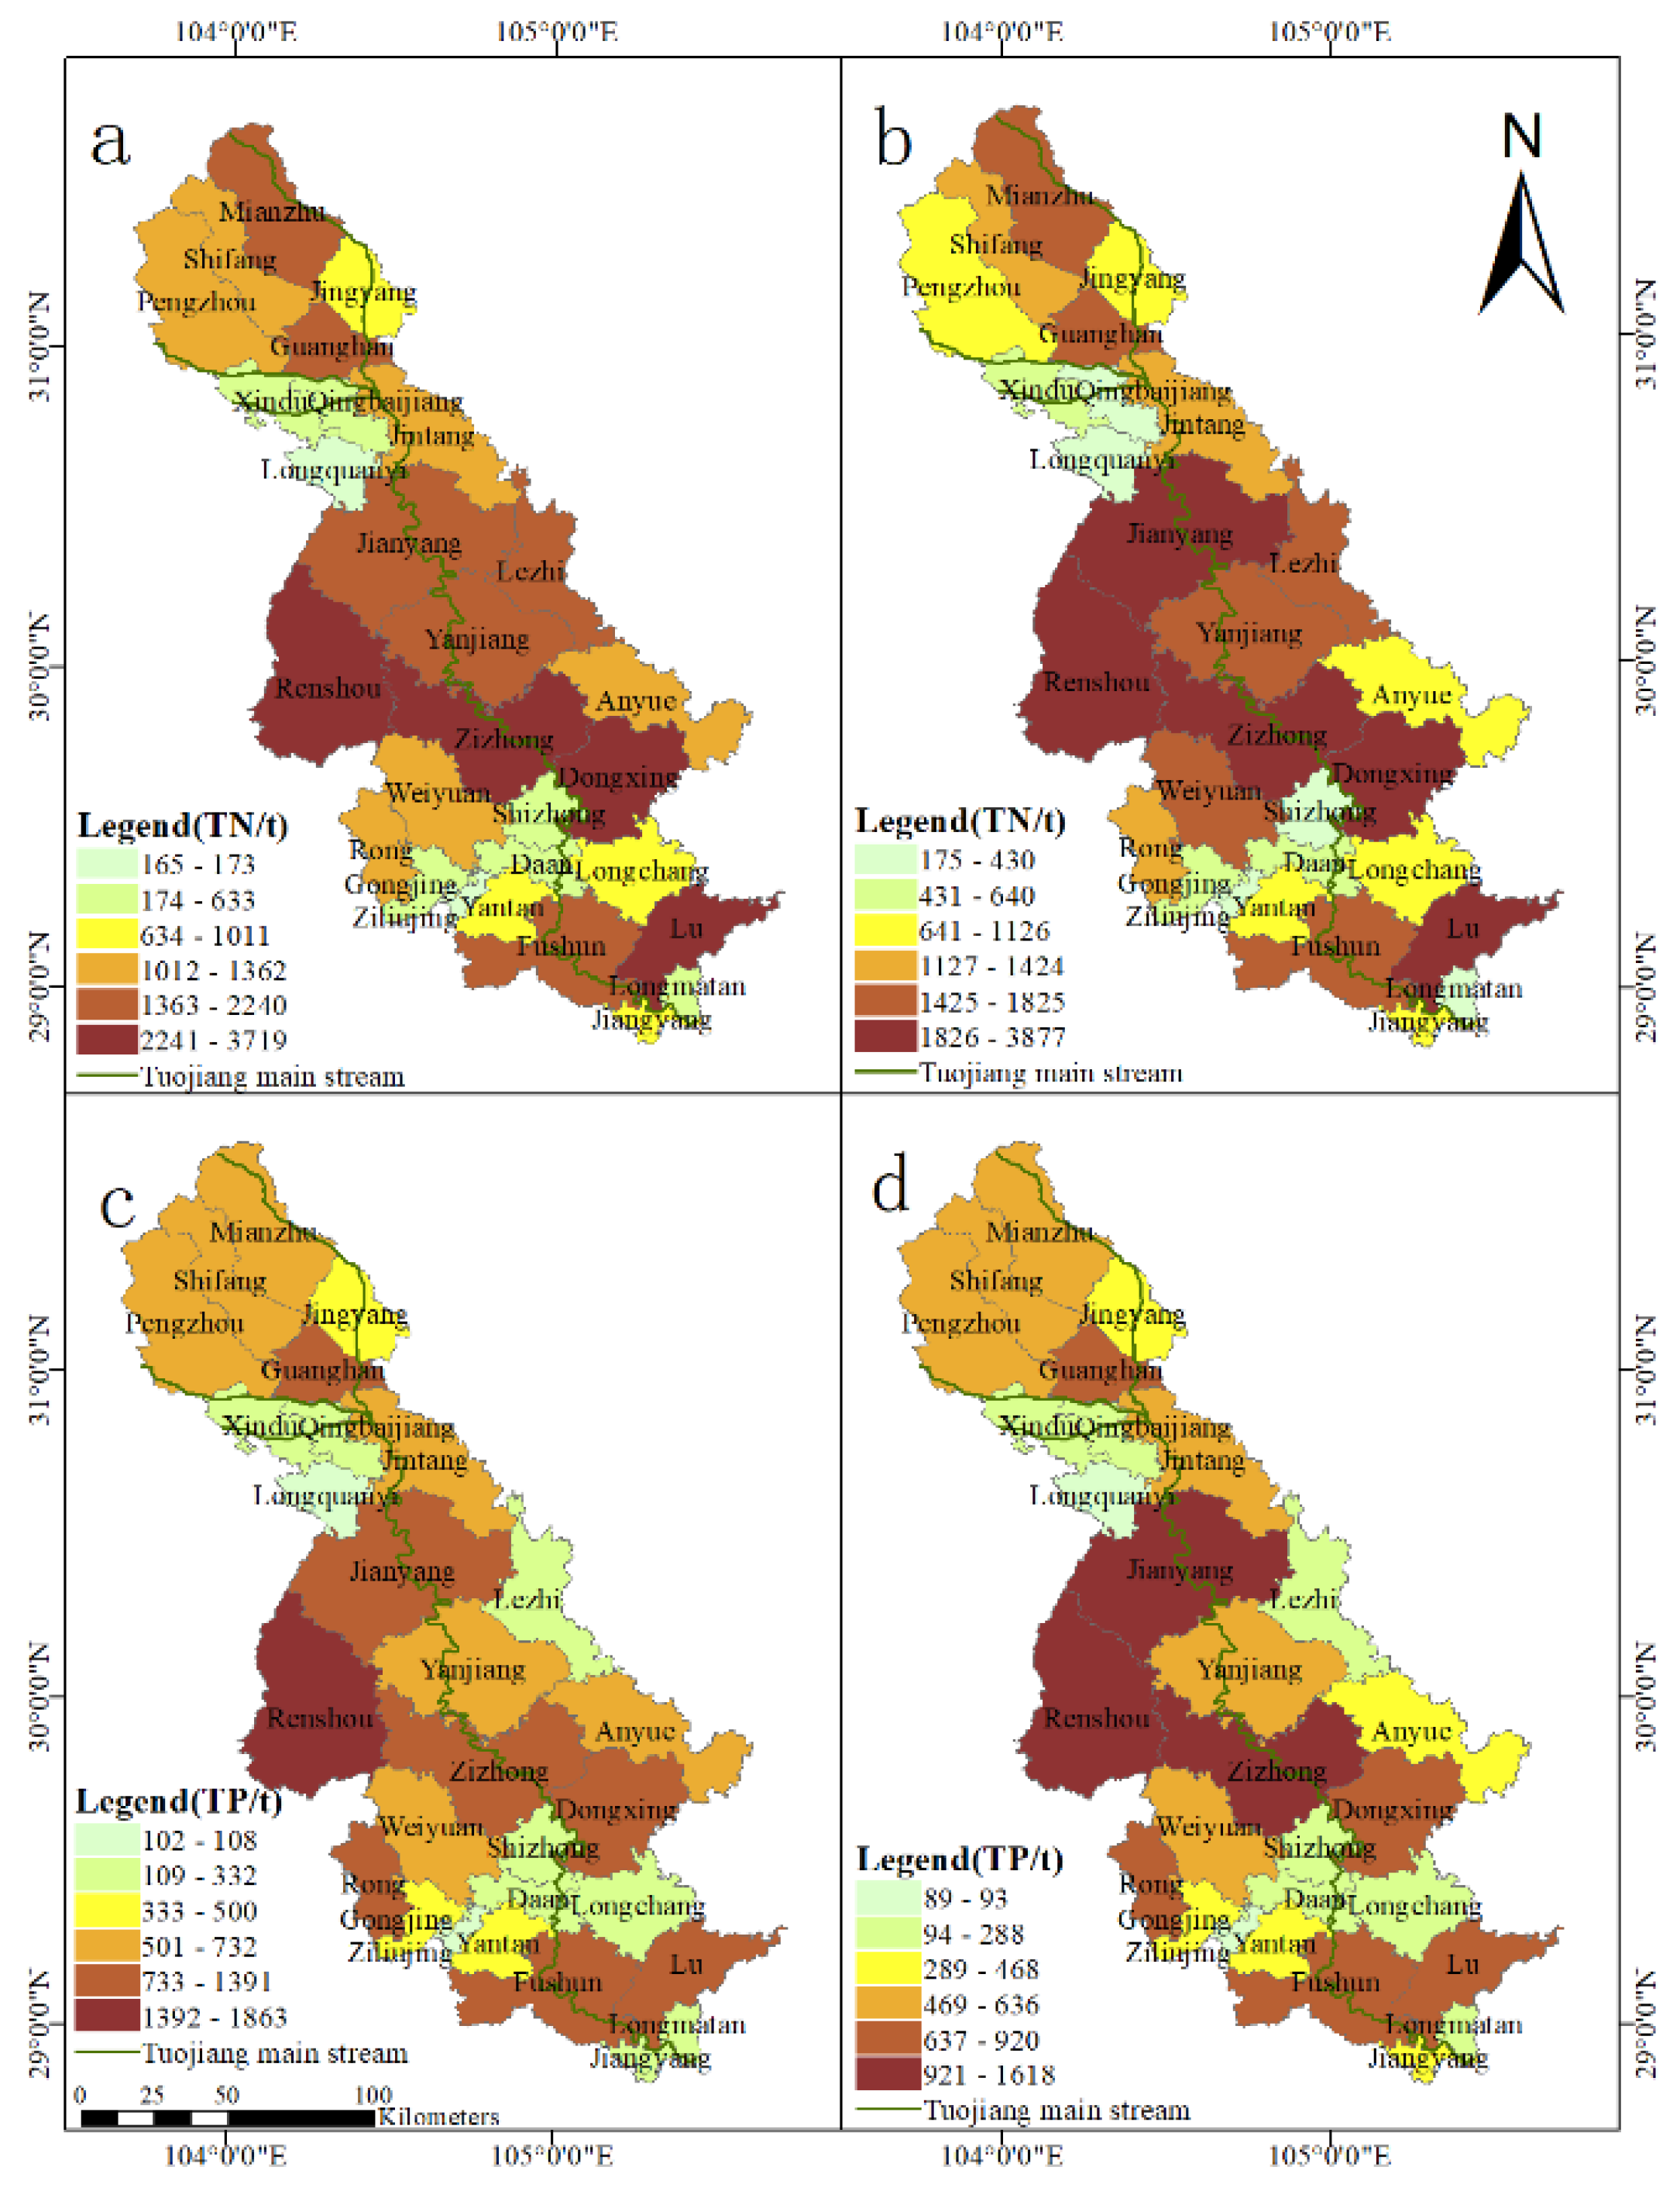
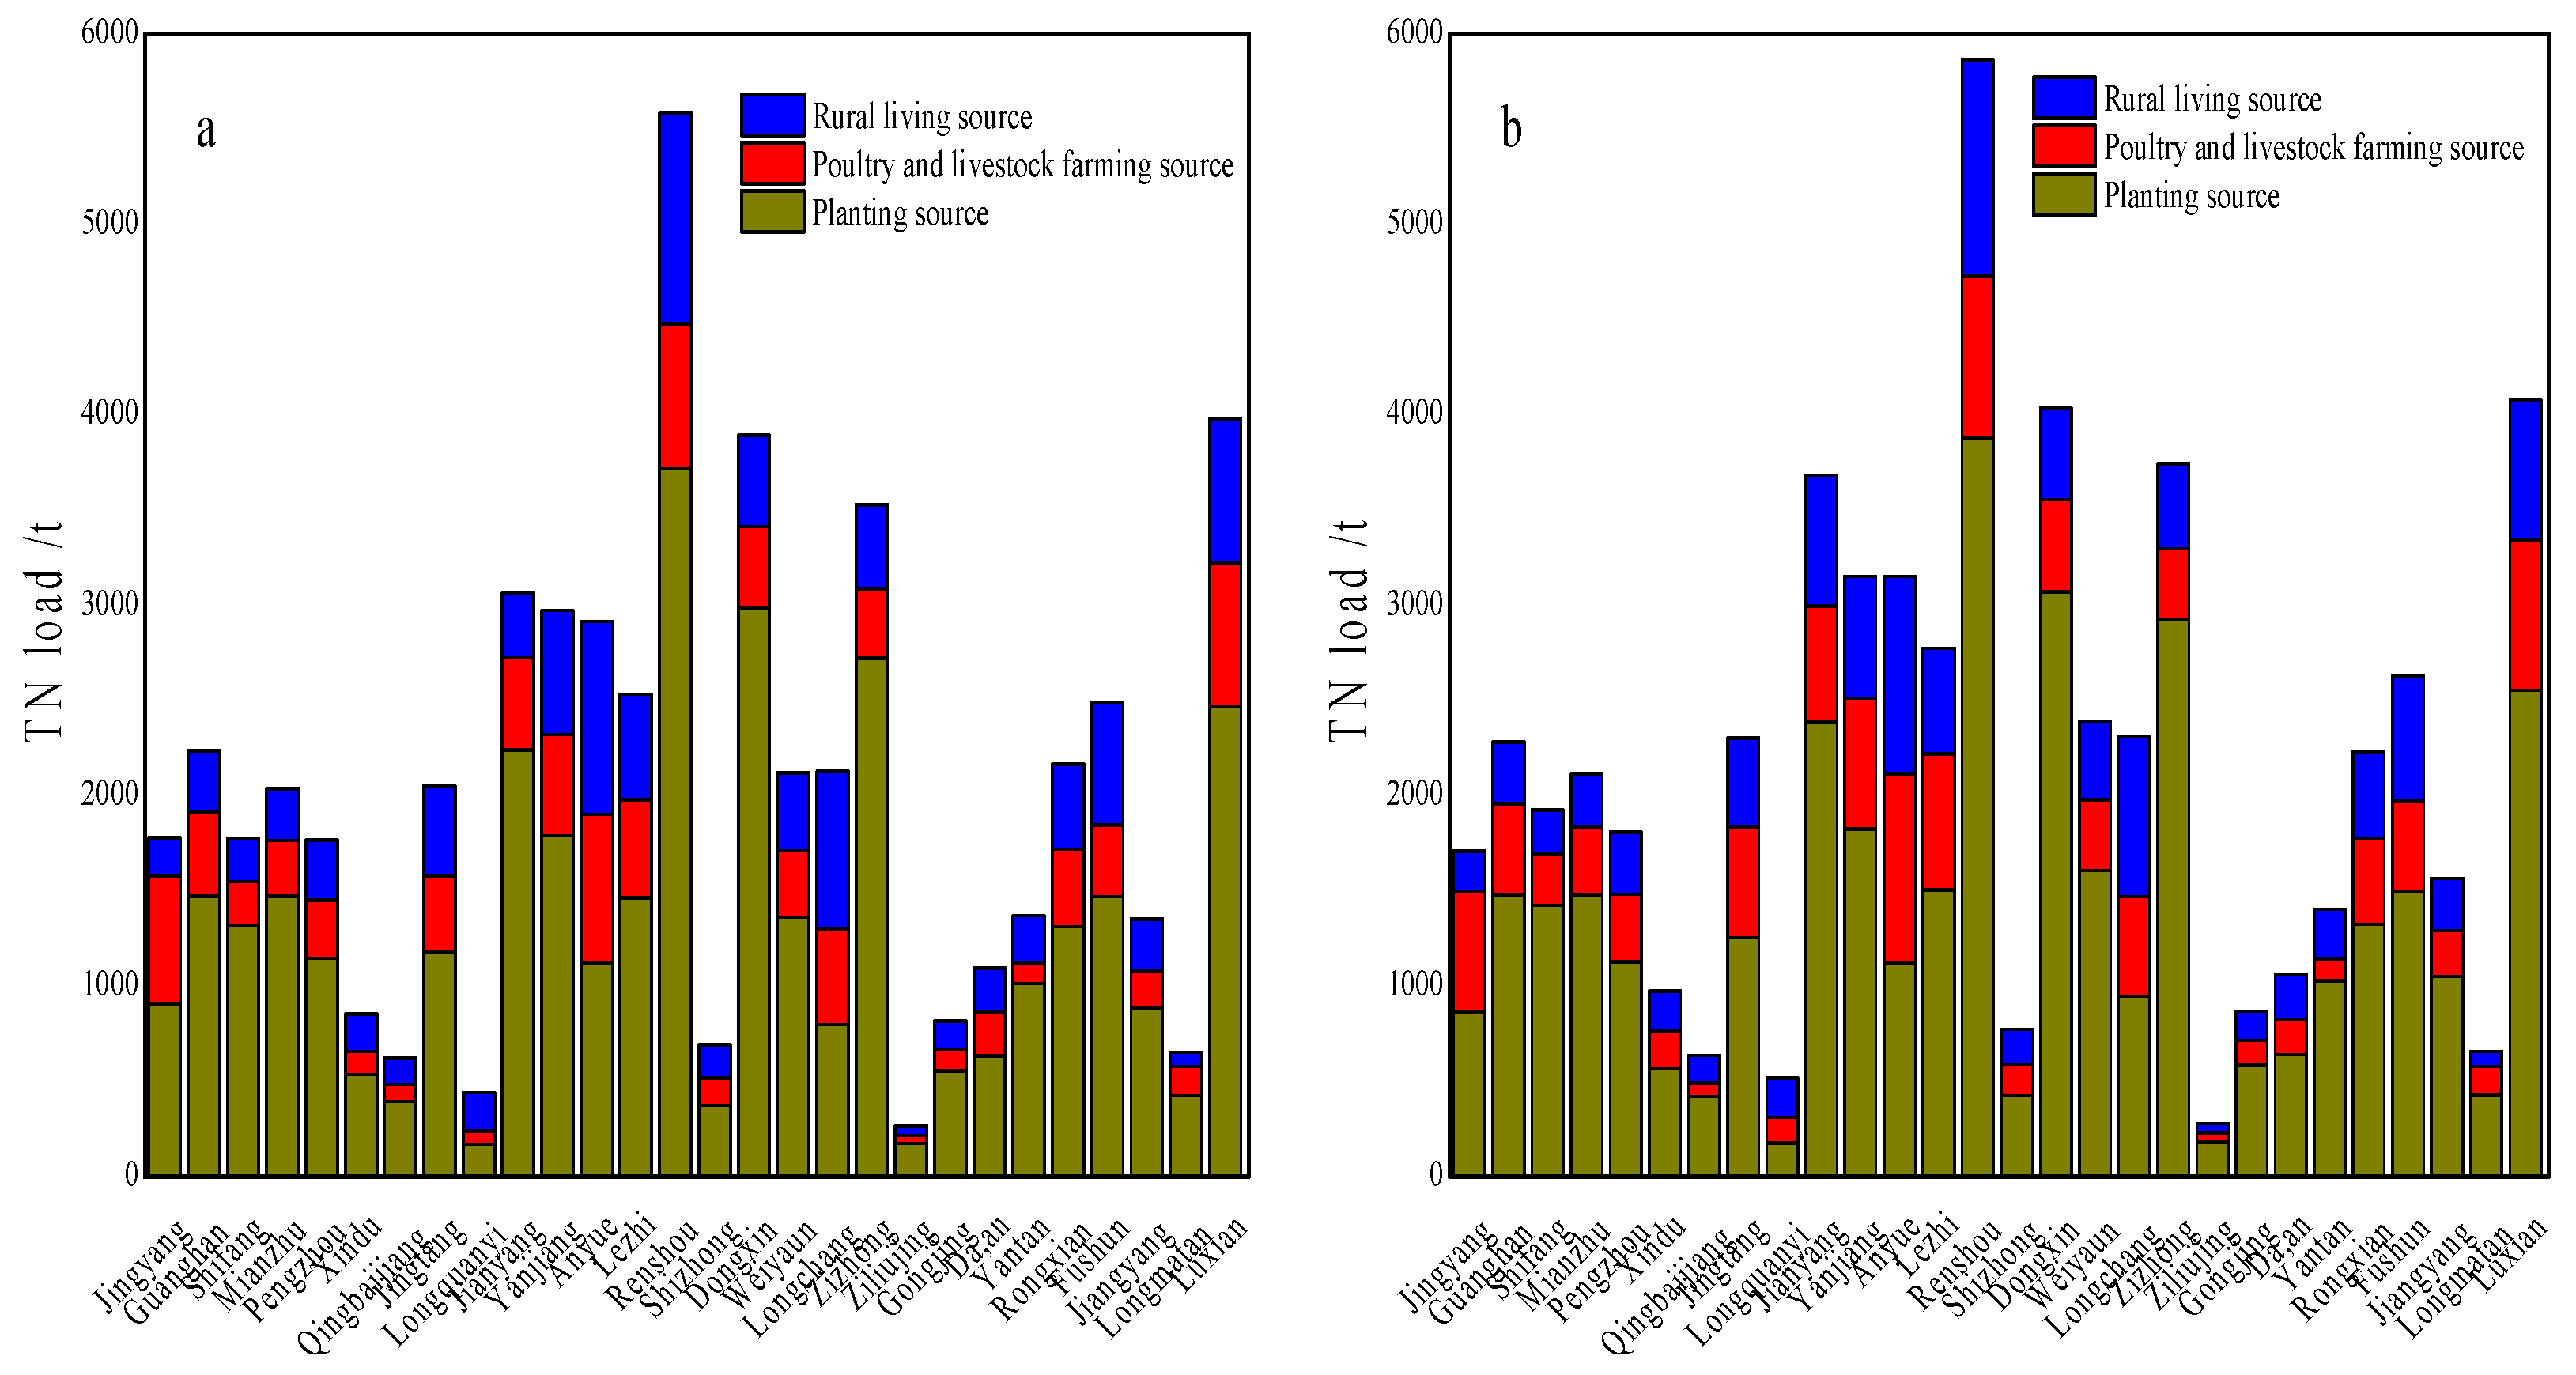
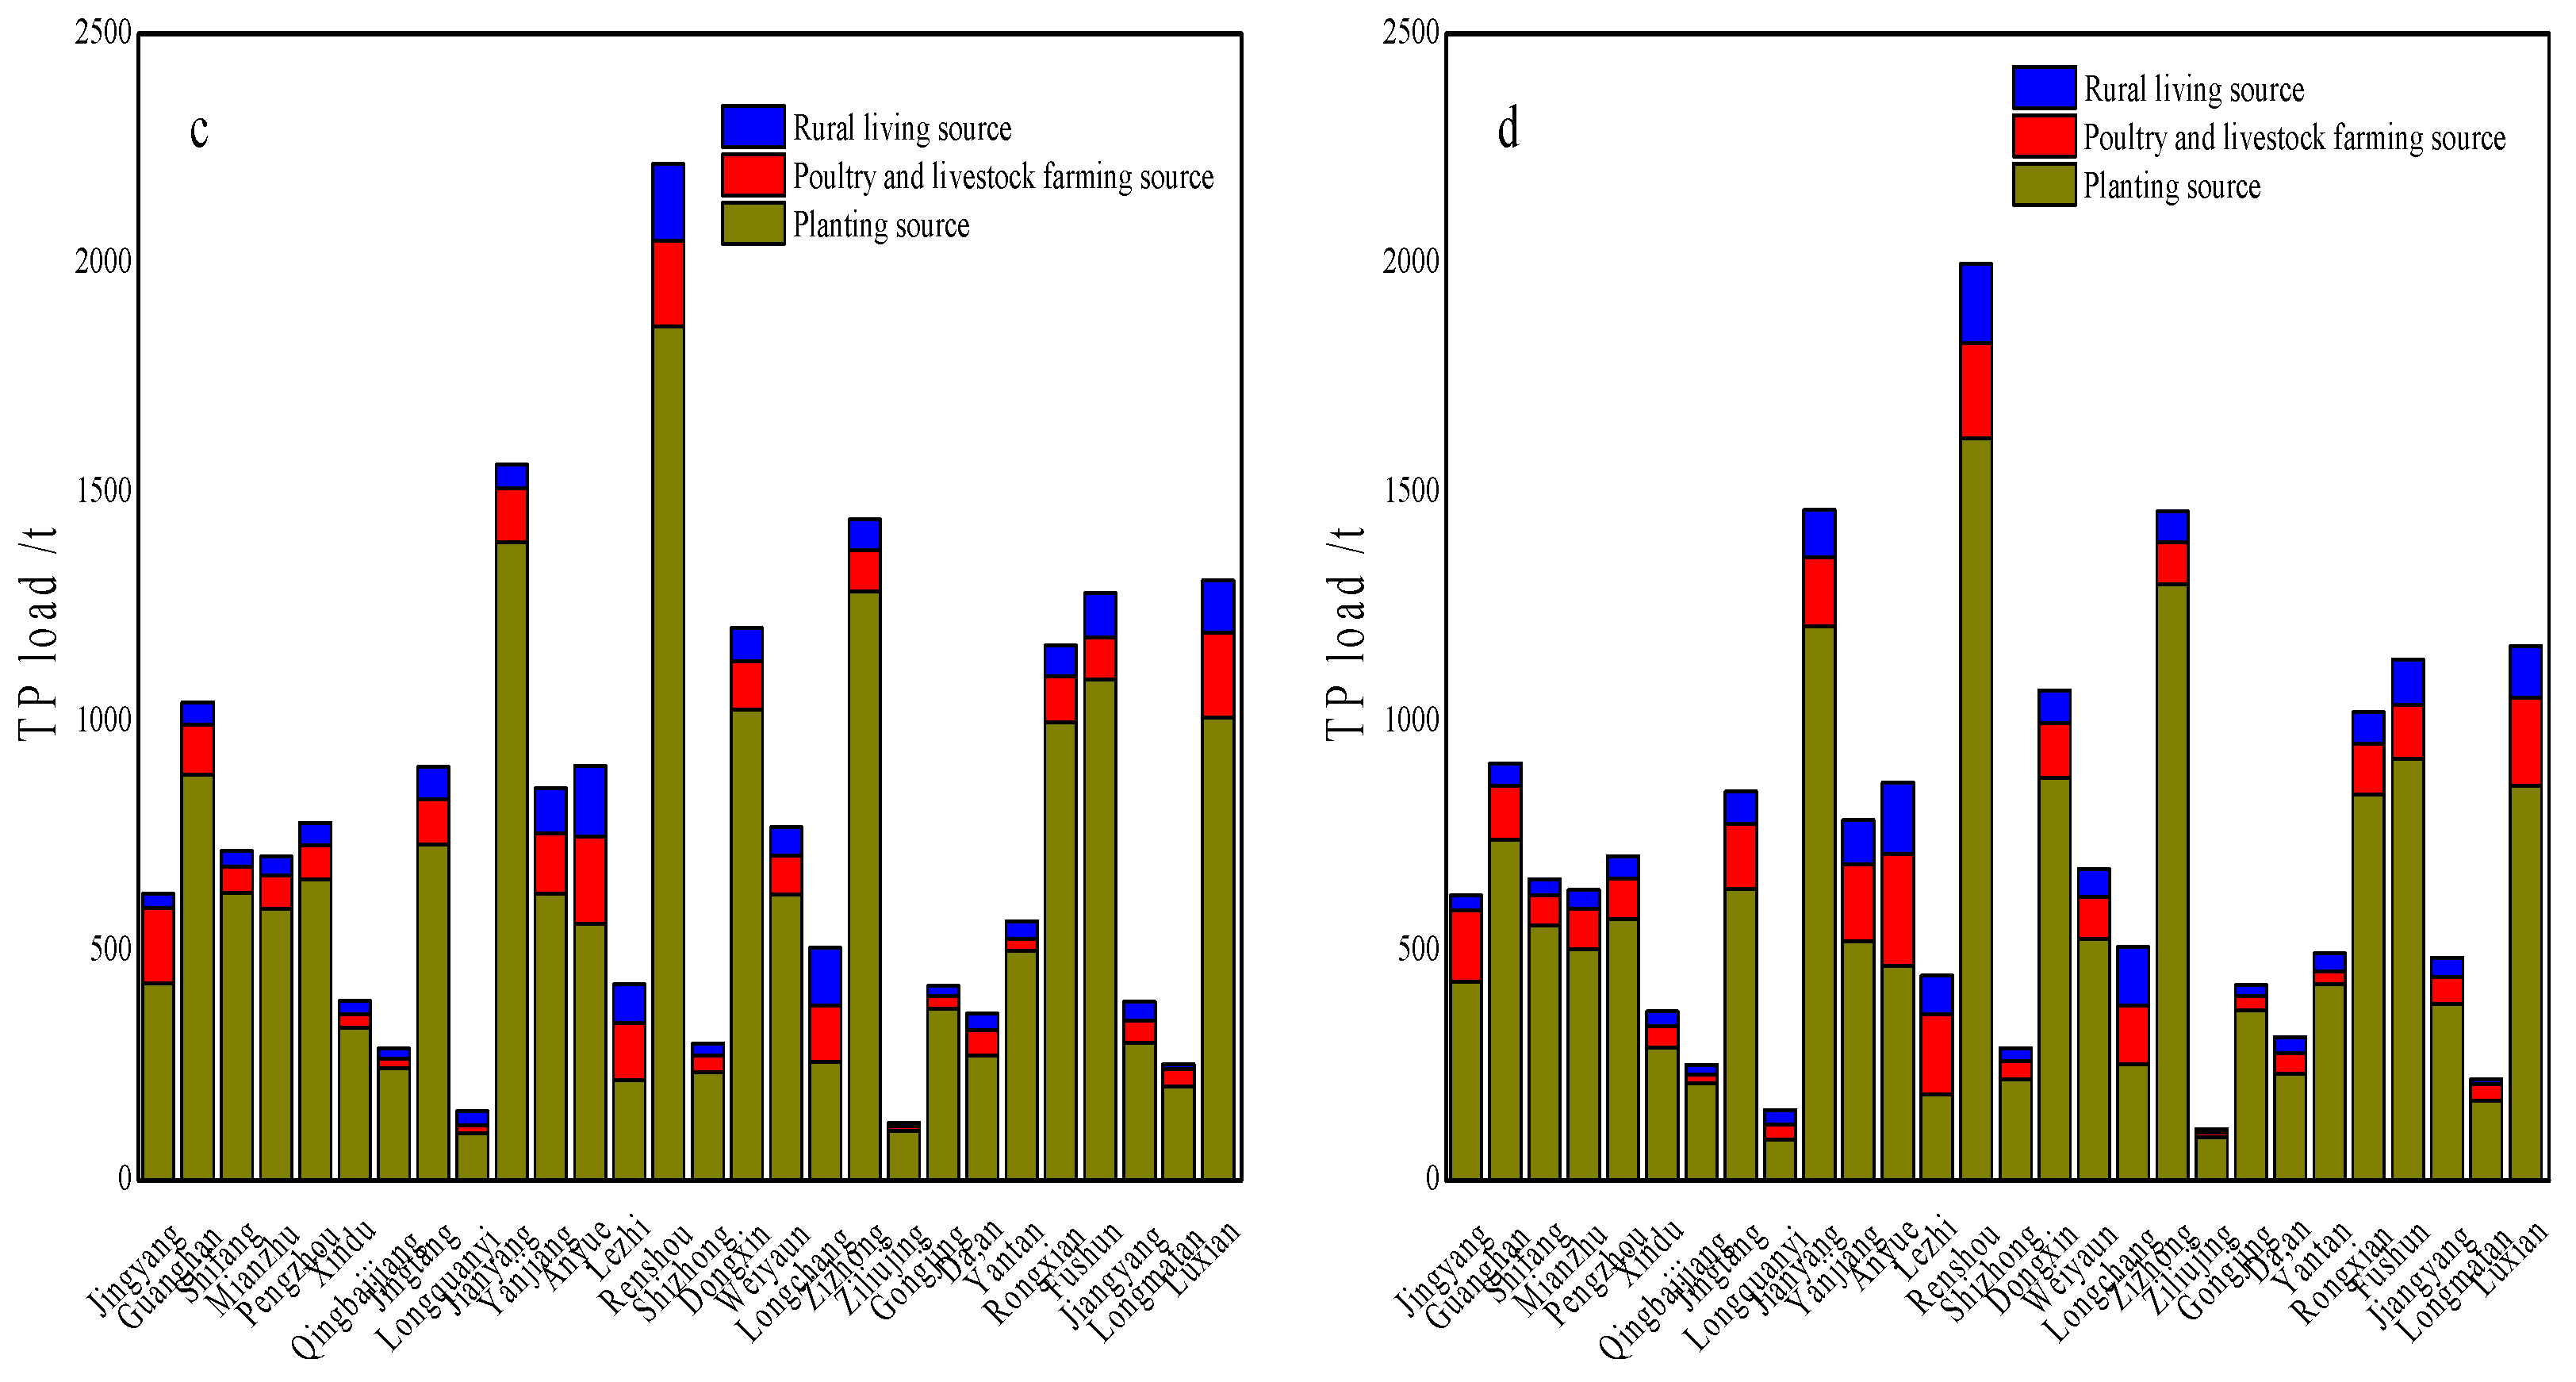
3.1.4. TN and TP Emissions from ANPS

Figure 6 illustrates the spatial distribution of ANPS TN and TP loads within the TJRB. In 2018, the ANPS TN and TP loads in the TJRB amounted to 60,888.92 tons and 20,085.98 tons, respectively. The TN load decreased to 57,155.44 tons in 2019, while the TP load increased to 21,659.91 tons. Throughout this study period, 92.9% of districts and counties witnessed varying degrees of TN load reduction, with Jianyang City registering the most significant decrease at 20.15%. In contrast, only 21.43% of districts and counties experienced a decrease in TP load, with Jiangyang District leading the way at 24.59%. The TN load varied significantly among the districts and counties in the TJRB, with those in the middle and lower reaches showing higher TN loads. In 2018, several districts and counties had TP loads exceeding 1000 tons, including Jianyang City, Renshou County, Dongxing District, Zizhong County, Rongxian County, and Fushun County.
Figure 7 reveals the composition characteristics of TN and TP loads in the TJRB. As observed, the planting source contributes the most to TN load in the TJRB, followed by rural living sources, while poultry and livestock farming sources make the smallest contribution. The TP load distribution follows the order of planting source > poultry and livestock farming source > rural living source. The planting source emerges as the primary contributor to both TN and TP loads from ANPS in the TJRB, with an average contribution of 61.43% and 77.39%, respectively. Conversely, rural living sources account for only 20.23% of TN loads and 9.15% of TP loads on average, while poultry and livestock farming sources contribute 18.34% of TN loads and 13.46% of TP loads on average.

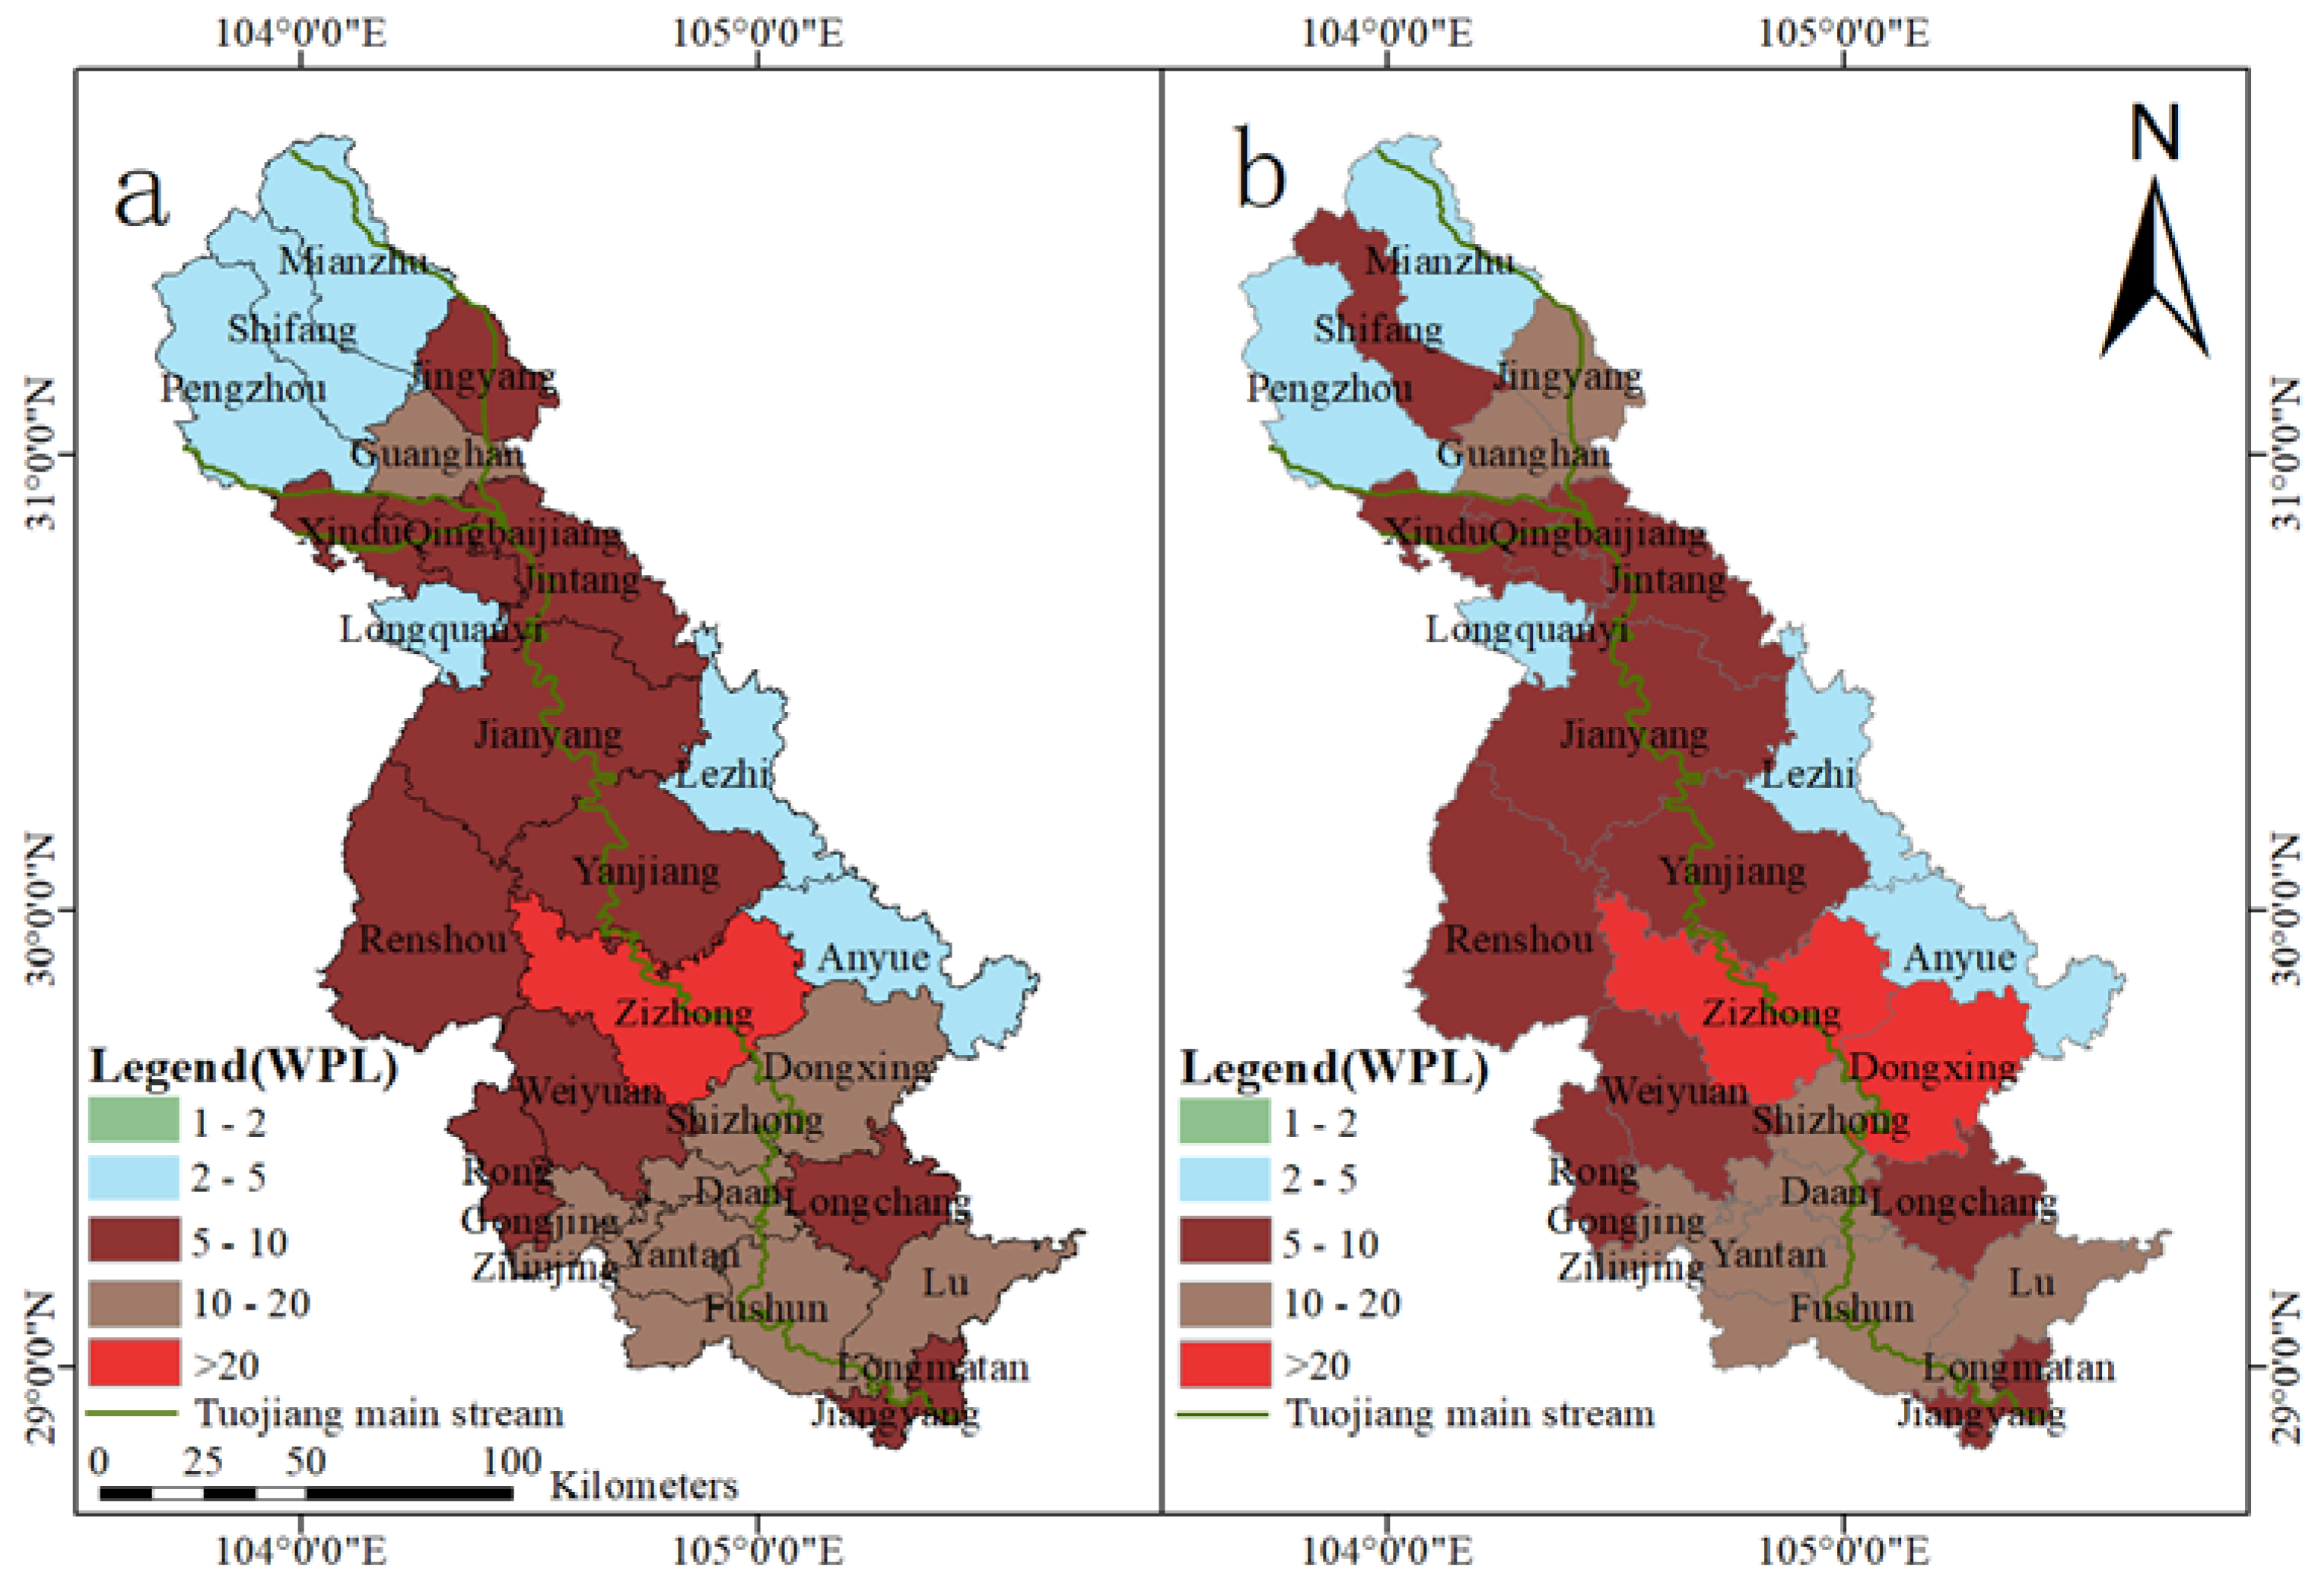
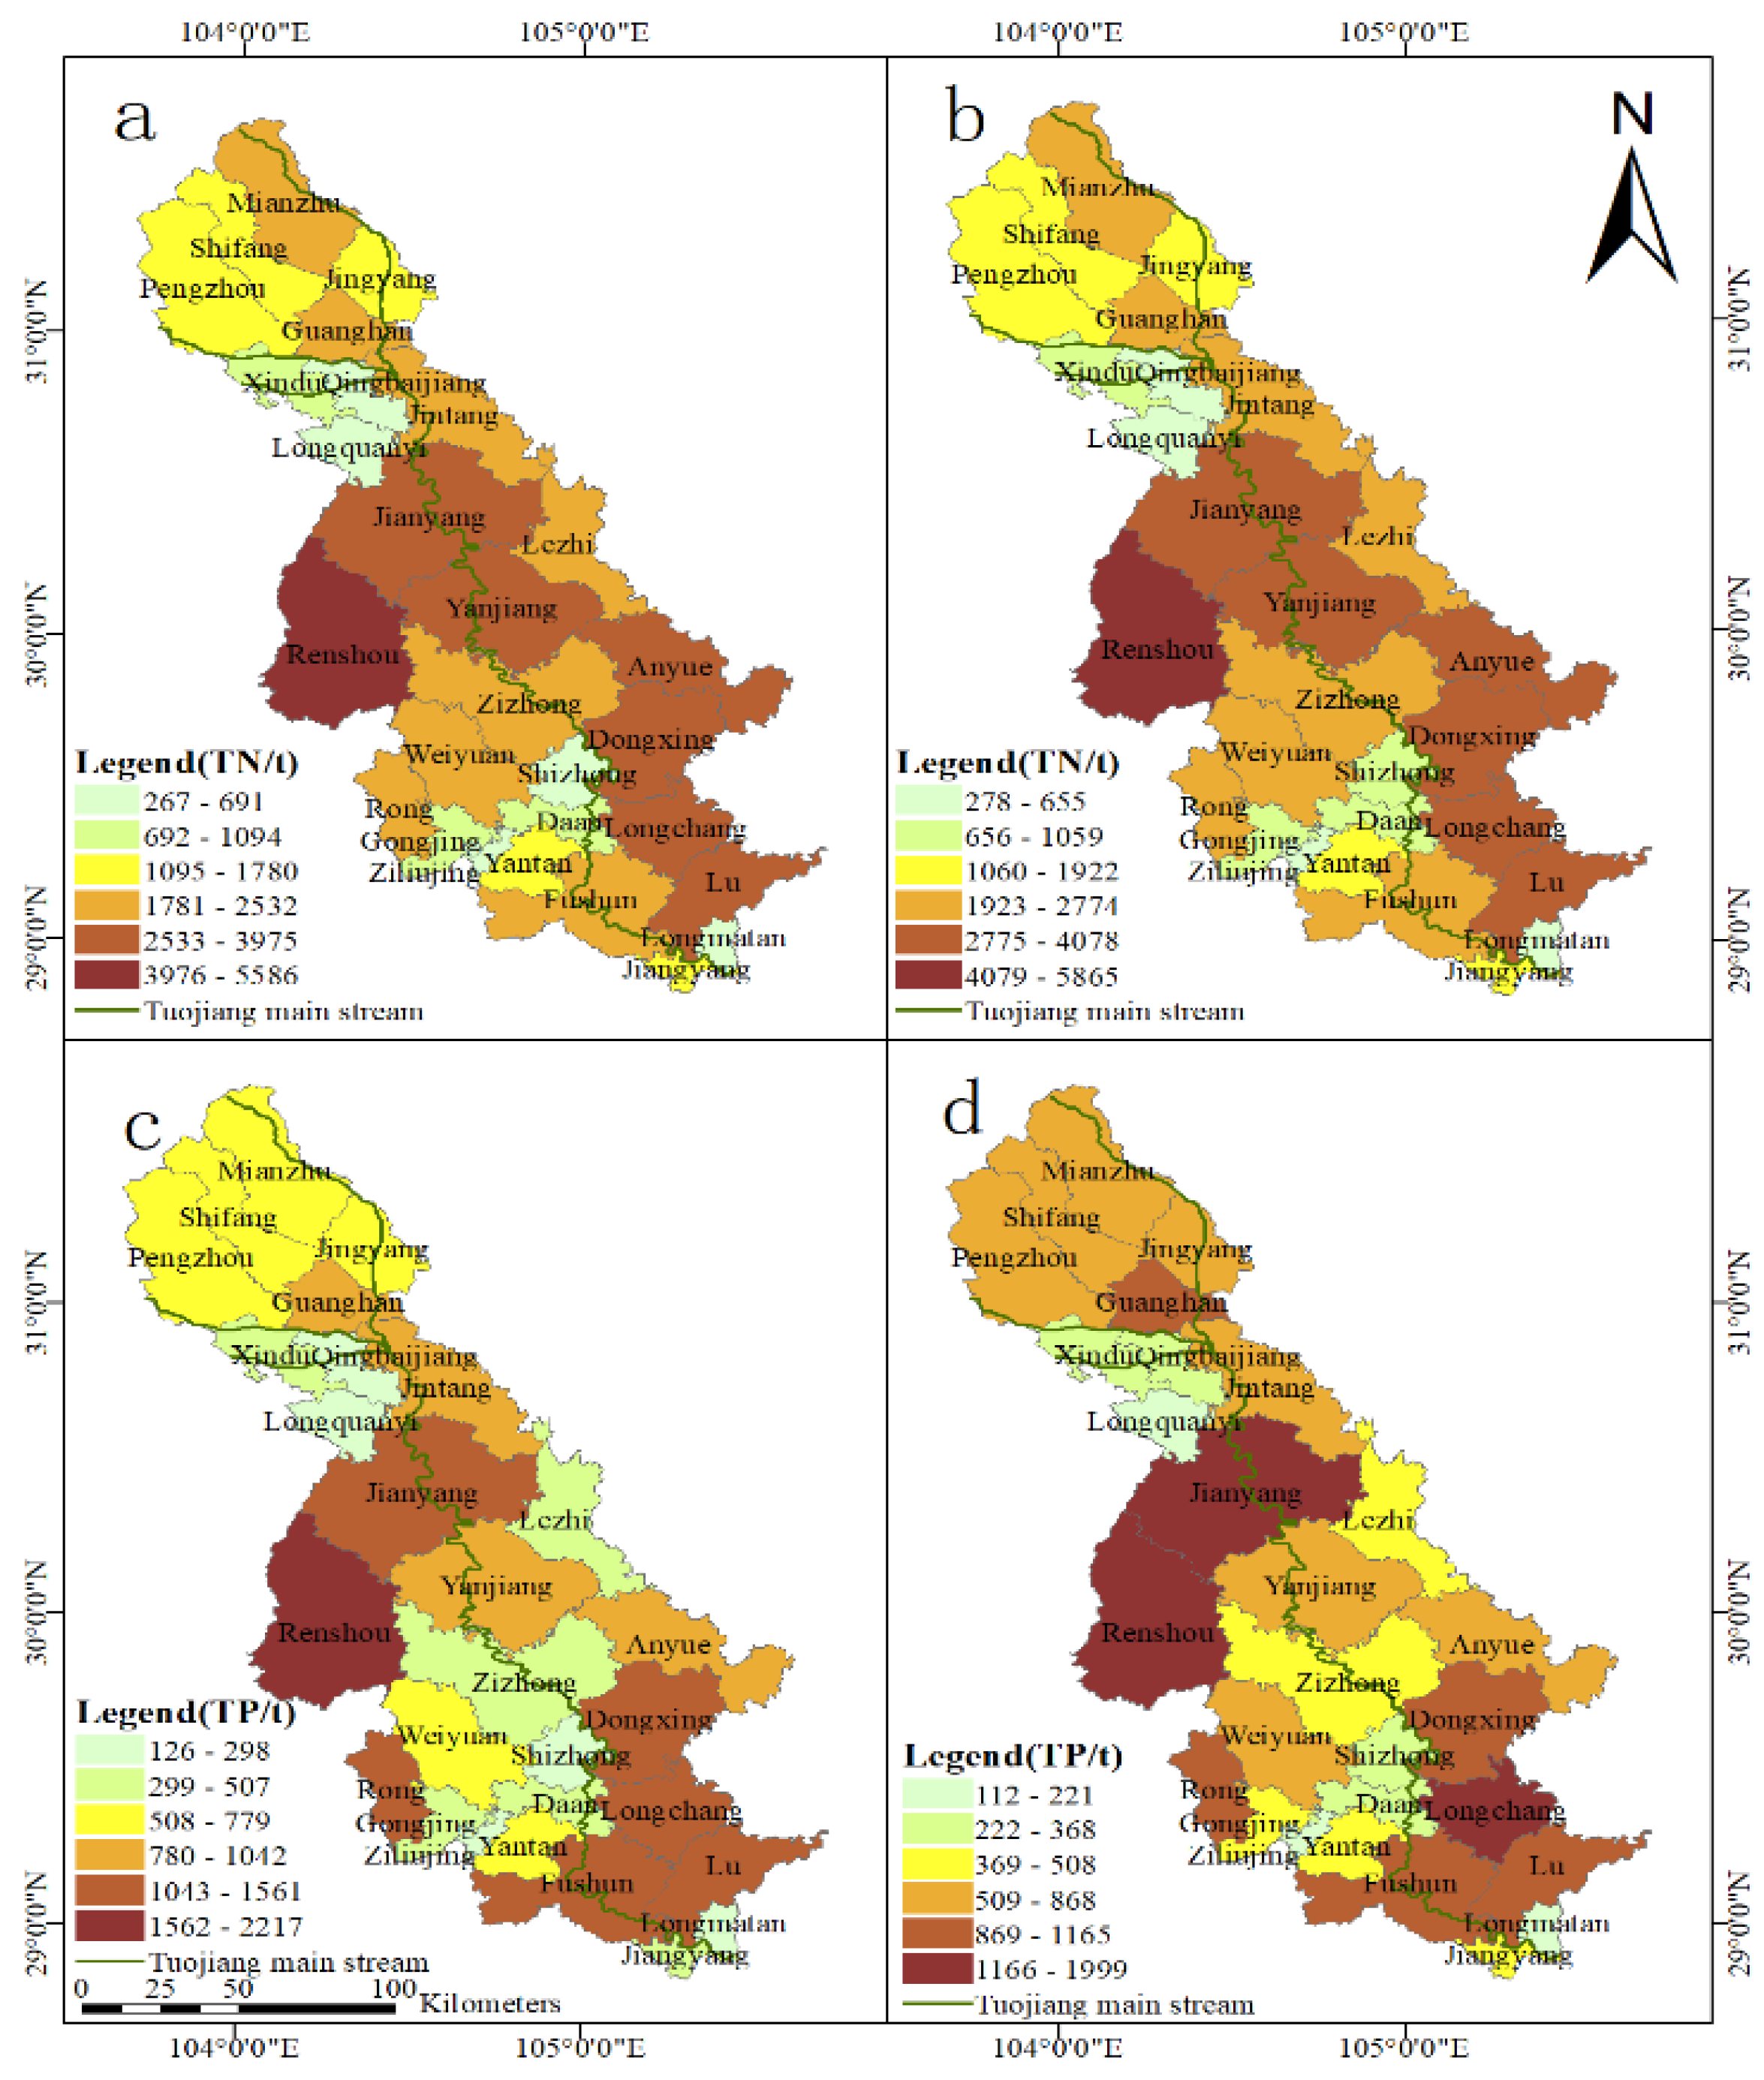
3.2. GWF and WPL of ANPS in the TJRB

3.2.1. GWF and WPL of Planting Source

Table S4 illustrates the GWF of TN and TP of planting sources in the TJRB. Since the GWF of TN was smaller than that of TP, the GWF of TP was adopted for subsequent analyses to evaluate the ANPS TN and TP pollution from the planting source. In 2018, the GWF of the planting source in the TJRB ranged from 4.44 to 8.091 billion m3, with a total of 77.566 billion m3. By 2019, the GWF of the planting source had increased to 87.712 billion m3. From the perspective of distribution characteristics of the GWF in TJRB, it’s worth noting that only 10.71% of districts and counties experienced a reduction in their GWF levels compared to those in 2018.
The spatial variation of WPL from the planting source in 2018 and 2019 in the TJRB is depicted in Figure 8. Notably, the WPL of the planting source across the TJRB consistently exceeded 1, with Lezhi County and Longquanyi District being the only exceptions, registering values less than 2. Conversely, Zizhong County exhibited significantly higher WPL values, reaching 29.23 in 2018 and 29.86 in 2019. These observations underscore the persistence of TP pollution pressure stemming from the planting industry in the Tuojiang River Basin.

3.2.2. GWF and WPL of Rural Living Source

The GWF values for TN and TP of rural living sources in the TJRB are shown in Table S5. Since the GWF for TN was greater than that for TP, the GWF for TN was used to assess nitrogen and phosphorus pollution from rural living sources. In 2018, the GWF for rural living sources in the TJRB amounted to 11.713 billion m3. However, it decreased to 11.218 billion m3 in 2019, with 89.3% of districts and counties in the TJRB experiencing varying degrees of reduction in GWF in 2019. When examining the spatial distribution of GWF, it is notable that Anyue County, situated in the middle reaches of the TJRB, generally exhibited higher values. In contrast, Qingbaijiang District in the upstream and Ziliujing District in the downstream displayed relatively lower GWF values. Specifically, the GWF for Ziliujing and Longmatan Districts did not exceed 100 million m3 throughout the study period.
Figure 9 shows the spatial variation in WPL for rural living sources in the TJRB. The average WPL for the TJRB was 1 in 2018 and decreased to 0.98 in 2019. Interestingly, there is a discernible difference between the spatial distribution of WPL and the TN and TP loads from rural living sources. Specifically, WPL tends to be higher in the middle and lower reaches of the TJRB compared to the upper reaches. This pattern is closely related to the distribution of total surface water resources in the TJRB.

3.2.3. GWF and WPL of Poultry and Livestock Farming Source

The GWF of TN and TP of poultry and livestock farming sources in the TJRB are shown in Table S6. Since the GWF of TP surpassed that of TN, the GWF of TP was employed to assess the nitrogen and phosphorus pollution stemming from poultry and livestock farming sources. The GWF of poultry and livestock farming sources in the TJRB witnessed a decline from 13.990 billion m3 in 2018 to 12.088 billion m3 in 2019, signifying an amelioration in nitrogen and phosphorus pollution attributed to this source during the study period. The spatial distribution of the GWF for poultry and livestock farming sources mirrors that of the rural living source, with higher values observed in the middle reaches and relatively lower ones in the upper and lower reaches of the TJRB.
Figure 10 delineates the spatial variation of WPL originating from the poultry and livestock farming source in the TJRB. In 2018, the WPL across the TJRB ranged from 0.25 to 2.05, with an average of 1.14. Conversely, in 2019, the WPL spanned from 0.35 to 2.65, with an average of 1.07. Notably, Figure 10 illustrates a gradual decline in WPL attributable to the poultry and livestock farming source during the study period, indicating a progressive improvement in TN and TP pollution arising from this source within the TJRB. Furthermore, the spatial distribution of WPL within the poultry and livestock farming source was characterized by lower values in the upper and middle reaches and higher values in the lower reaches.

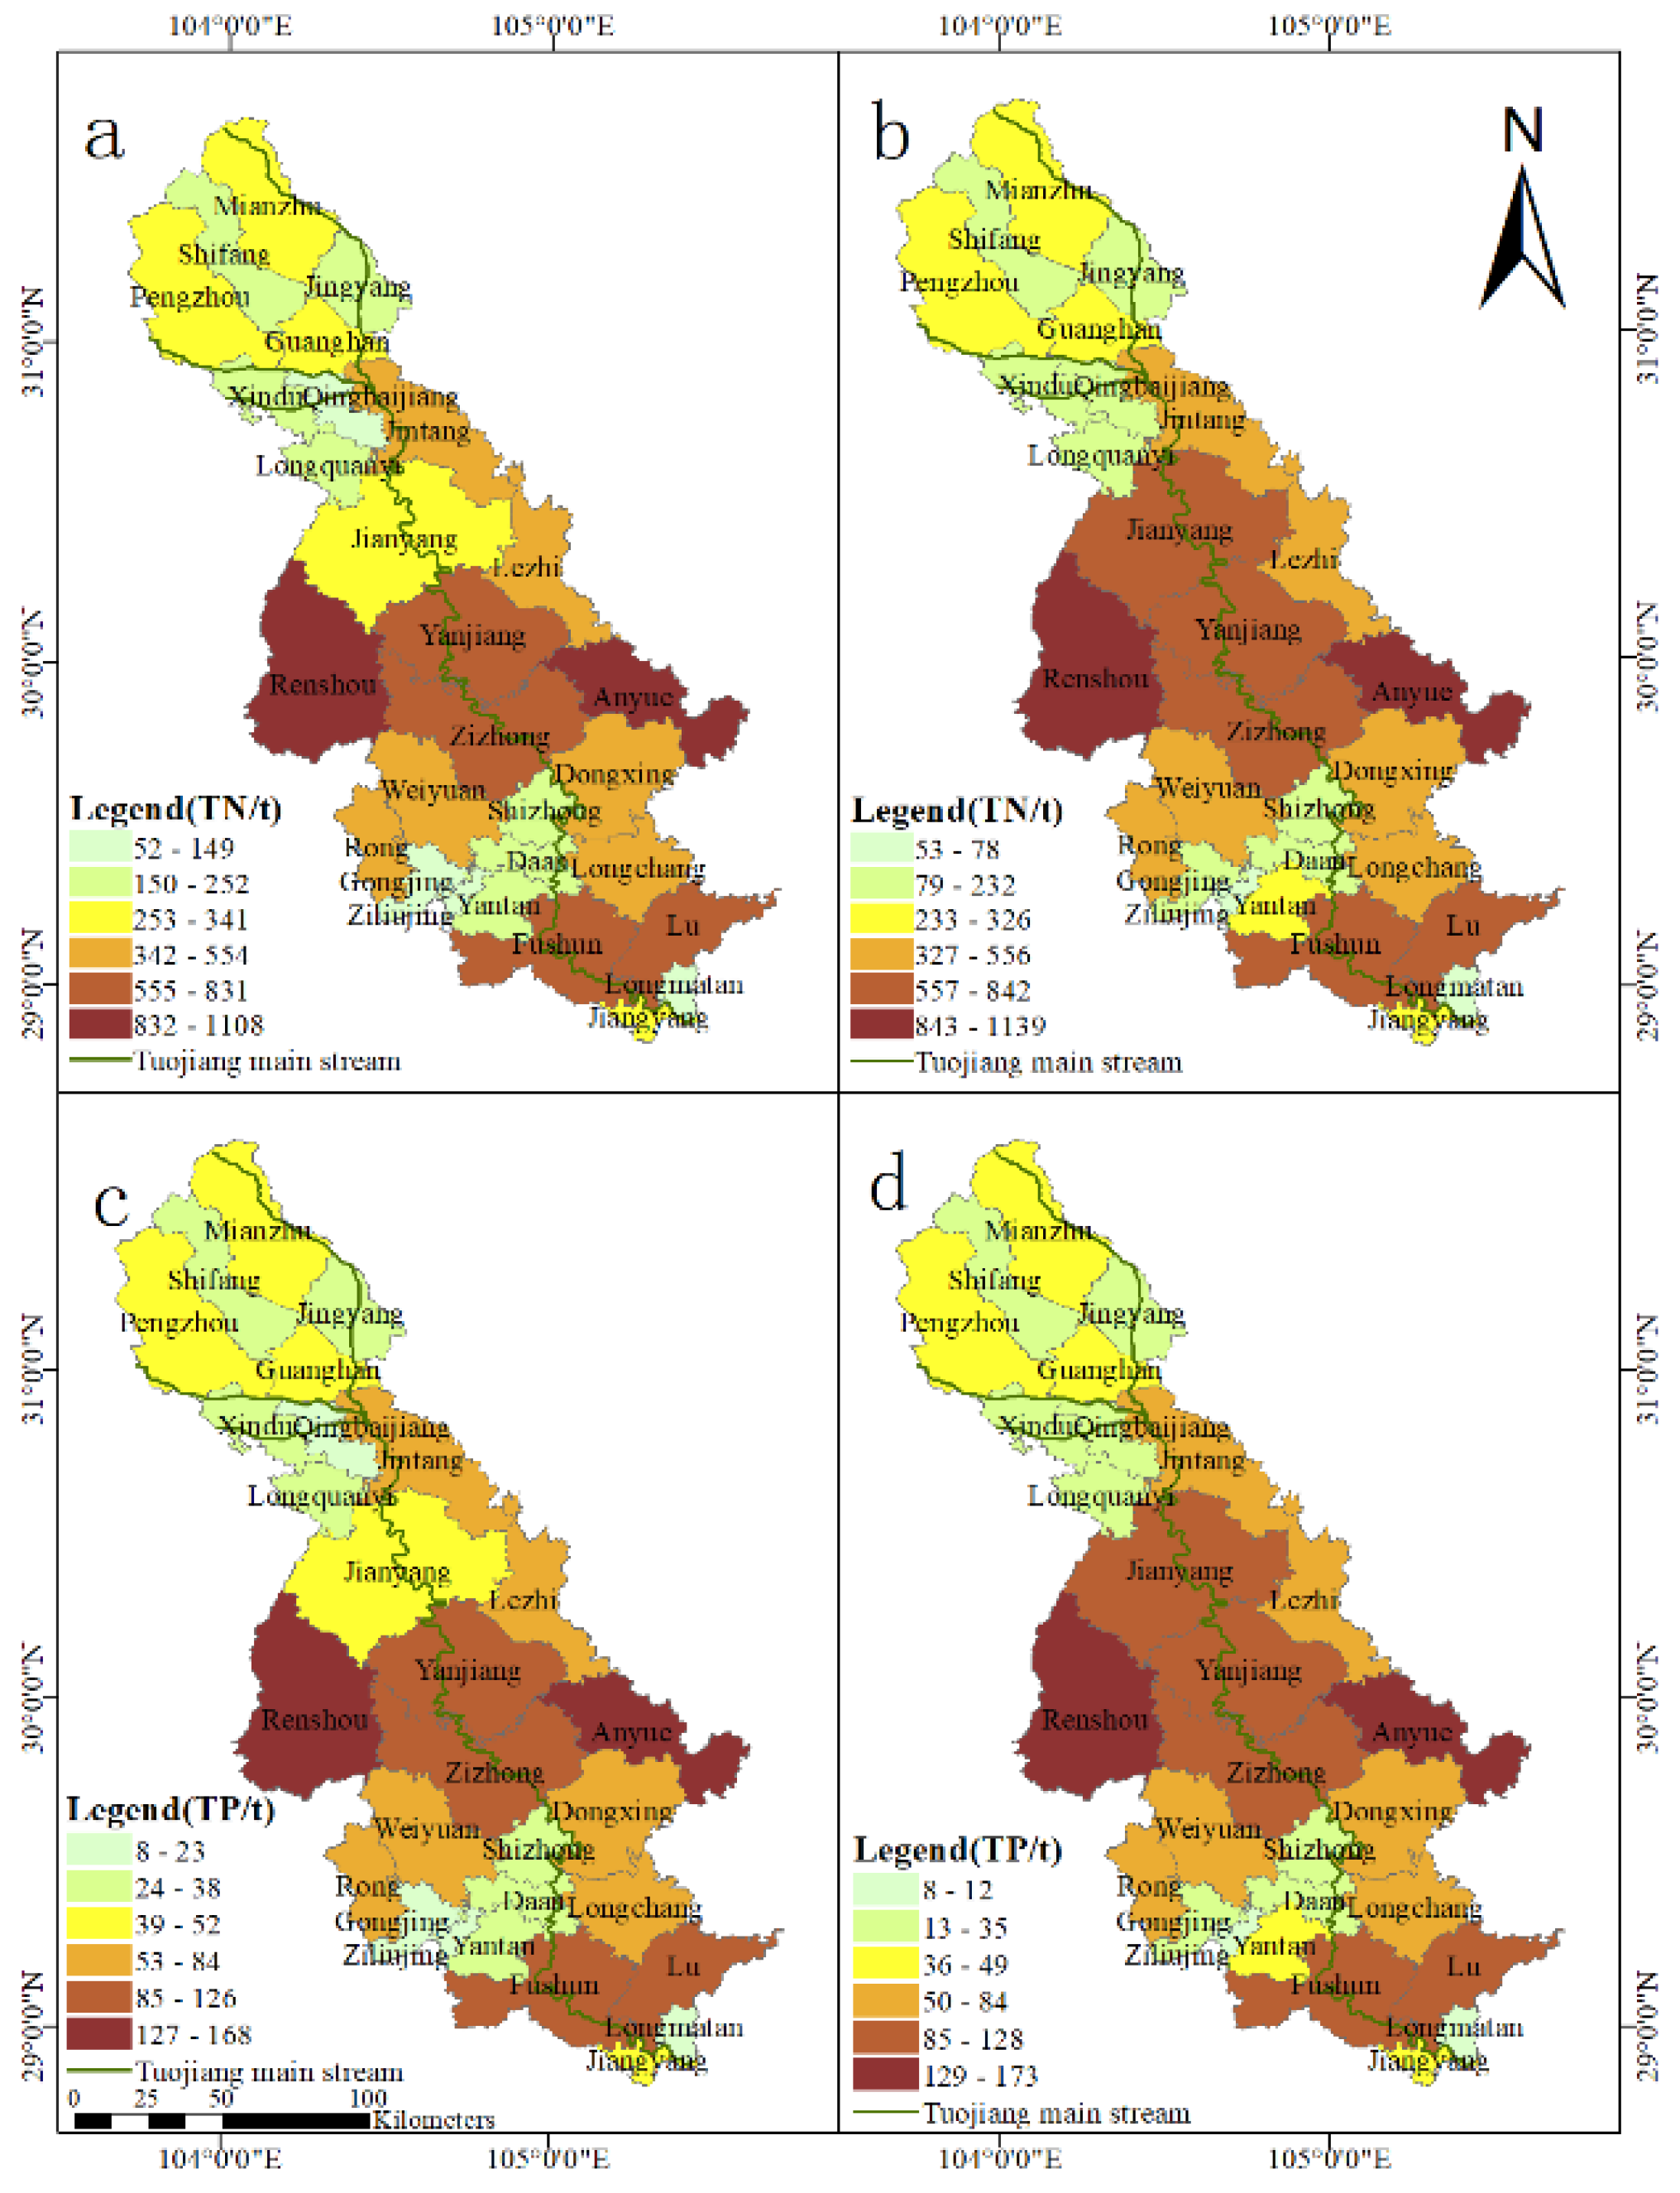
3.2.4. GWF and WPL of ANPS

Table S7 displays the GWF of ANPS in the TJRB. Considering that the GWF of TP was larger than that of TN, the GWF of TP was used to assess ANPS TN and TP pollution in the TJRB. The GWF of ANPS pollution in the TJRB increased from 100.430 billion m3 in 2018 to 108.30 billion m3 in 2019. This increase is primarily attributed to the planting source. Renshou County had the highest GWF during the study period, with figures of 99.95 billion m3 in 2018 and 11.083 billion m3 in 2019. In contrast, Ziliujing and Longquanyi districts maintained GWF levels below 1 billion m3 throughout the study.
Figure 11 illustrates the distribution of WPL for ANPS TN and TP in every district and county within the TJRB. In 2018, the average WPL for all districts and counties in the TJRB stood at 9.22, but this figure rose to 10.02 in 2019. This indicates that the pressure exerted by TN and TP loads on the water environment in the TJRB continued to intensify over the study period. Additionally, all counties displayed WPL values exceeding 1 during this period, signifying that the TJRB’s capacity to absorb nitrogen and phosphorus pollution from ANPS has been depleted.

4. Discussion

4.1. TN and TP Loading Characteristics of ANPS

Studies have highlighted that TP pollution from ANPS in the TJRB surpasses that from point sources by a factor of 3.7 [22]. Concurrently, Xiao et al. [39] have conducted calculations regarding TN pollution loads from ANPS in the TJRB, reaffirming that poultry and livestock farming and planting constitute significant contributors. The findings from this study aligned with prior research, indicating that planting sources primarily account for TN and TP loads from ANPS in the TJRB, with respective average contributions of 61.43% and 77.39%. Given the marked nitrogen and phosphorus pollution induced by anthropogenic activities in the TJRB [21,40,55], the management of nitrogen and phosphorus loads stemming from ANPS assumes paramount importance. Notably, the spatial distribution characteristics of TN and TP loads in the Tuojiang River closely resembled those of nitrogen and phosphorus fertilizers. Additionally, the nitrogen and phosphorus load associated with planting sources has exhibited no significant reduction, likely attributable to farmers’ fertilization practices in the TJRB, which may lack sufficient guidance. The nitrogen and phosphorus load and pollution stemming from the planting source correlate with rainfall and the total surface water resources in the TJRB [23]. Therefore, it is imperative to strengthen fertilizer management, adjust application practices, and formulate guidelines based on local soil characteristics. The nitrogen and phosphorus loads from rural living sources in the TJRB are closely linked to the rural population in each district and county. Additionally, these loads are expected to decrease further as Sichuan Province enhances the rural living environment, providing more households with access to sanitary facilities and improving domestic sewage treatment rates [56]. Poultry and livestock farming is well-developed in the TJRB, contributing significantly to nitrogen and phosphorus pollution, which has led to water quality deterioration in the Tuojiang River [22]. In this study, the contribution of poultry and livestock farming sources to TN and TP loads gradually decreased, and the composition of nitrogen and phosphorus loads from this source changed over the study period. In summary, the study period witnessed an increase in the planting source, a decrease in the poultry and livestock farming source, and a relatively stable rural living source, shaping the composition of ANPS TN and TP loads in the TJRB. The spatial distribution of TN and TP load composition indicates that the heaviest load is in the middle reaches of the TJRB, with smaller loads in the upper and lower reaches.
WPL serves as an indicator of a region’s capacity to absorb and assimilate pollutants. However, the varying pollutant loads and total surface water resources in different districts result in spatial variations of WPL within the TJRB. The spatial distribution of the GWF for ANPS TN and TP loads in the TJRB follows a pattern, with lower values in the upstream areas, intermediate values in the downstream areas, and higher values in the middle reaches. This distribution divergence in GWF and WPL across the basin primarily arises from two factors: differences in TN and TP loads among districts and counties and disparities in the total surface water resources available in each area.

4.2. Damage to Water Quality of Tuojiang River by ANPS

The counties with high TN and TP loads during the study period were primarily situated in the middle and lower reaches of the TJRB. Our earlier research has also demonstrated that TN and TP concentrations in the middle and lower reaches of the Tuojiang River were significantly higher (p < 0.05) than those in the upper reaches [20]. Furthermore, the spatial distribution of areas with high TN and TP concentrations in the Tuojiang River closely mirrored the spatial distribution of TN and TP loading from ANPS. Past studies have consistently identified ANPS as the primary source of pollution in the TJRB [20,38]. TP and TN represent the predominant pollutants in the Tuojiang River, exerting a significant influence on water quality classification. During the study period, TN and TP concentrations exhibited seasonal variations, with higher concentrations recorded during spring and summer compared to autumn and winter. Given that ANPS primarily contributes to TN and TP loads via planting activities, which are concentrated in spring and summer, the seasonal concentration patterns are closely linked to ANPS-driven TN and TP loads.

4.3. Management Strategies and Recommendations

The ANPS nitrogen and phosphorus load in TJRB is significantly influenced by population size, particularly the density of the agricultural population, which results in substantial rural pollutant discharge. The low treatment rate of rural domestic sewage, currently below 30% in TJRB, underscores the need for local decision-making authorities to intensify efforts in controlling domestic pollution and enhancing the environmental awareness of the rural population to ameliorate rural environmental conditions. Moreover, prioritizing source control and pollution management, expediting the development of environmental protection infrastructure, and accelerating the construction of urban and rural domestic waste sewage treatment facilities are recognized as highly effective means to reduce the ANPS nitrogen and phosphorus load in the TJRB. Given that agricultural fertilizer stands as the primary source of nitrogen and phosphorus load in TJRB, government departments should provide guidance on the judicious use and frequency of agricultural fertilizers to prevent excessive usage. Notably, ANPS pollution is inherently challenging to control due to its random, uncertain, and heterogeneous nature. Traditional control measures often fall short of achieving desired outcomes for ANPS pollution. Nevertheless, large-scale constructed wetlands have emerged as effective bioengineering solutions for addressing NPS pollution [25], with best management practices and suitable engineering interventions yielding notable results in reducing nutrient load [26]. Therefore, strengthening the control of ANPS TN and TP loads demands a two-pronged approach: source reduction and the implementation of appropriate management and remediation measures.

5. Conclusions

In this work, the assessment of ANPS pollution in the TJRB was conducted, focusing on TN and TP loads from planting sources, rural living sources, and poultry and livestock farming sources across 28 districts and counties. The analysis delved into the spatial and temporal distribution variations and the compositional structure of TN and TP loads stemming from ANPS. Furthermore, the GWF theory was employed to provide a quantitative assessment of nitrogen and phosphorus pollution levels in different districts and counties within the basin. Key findings include:
(1)
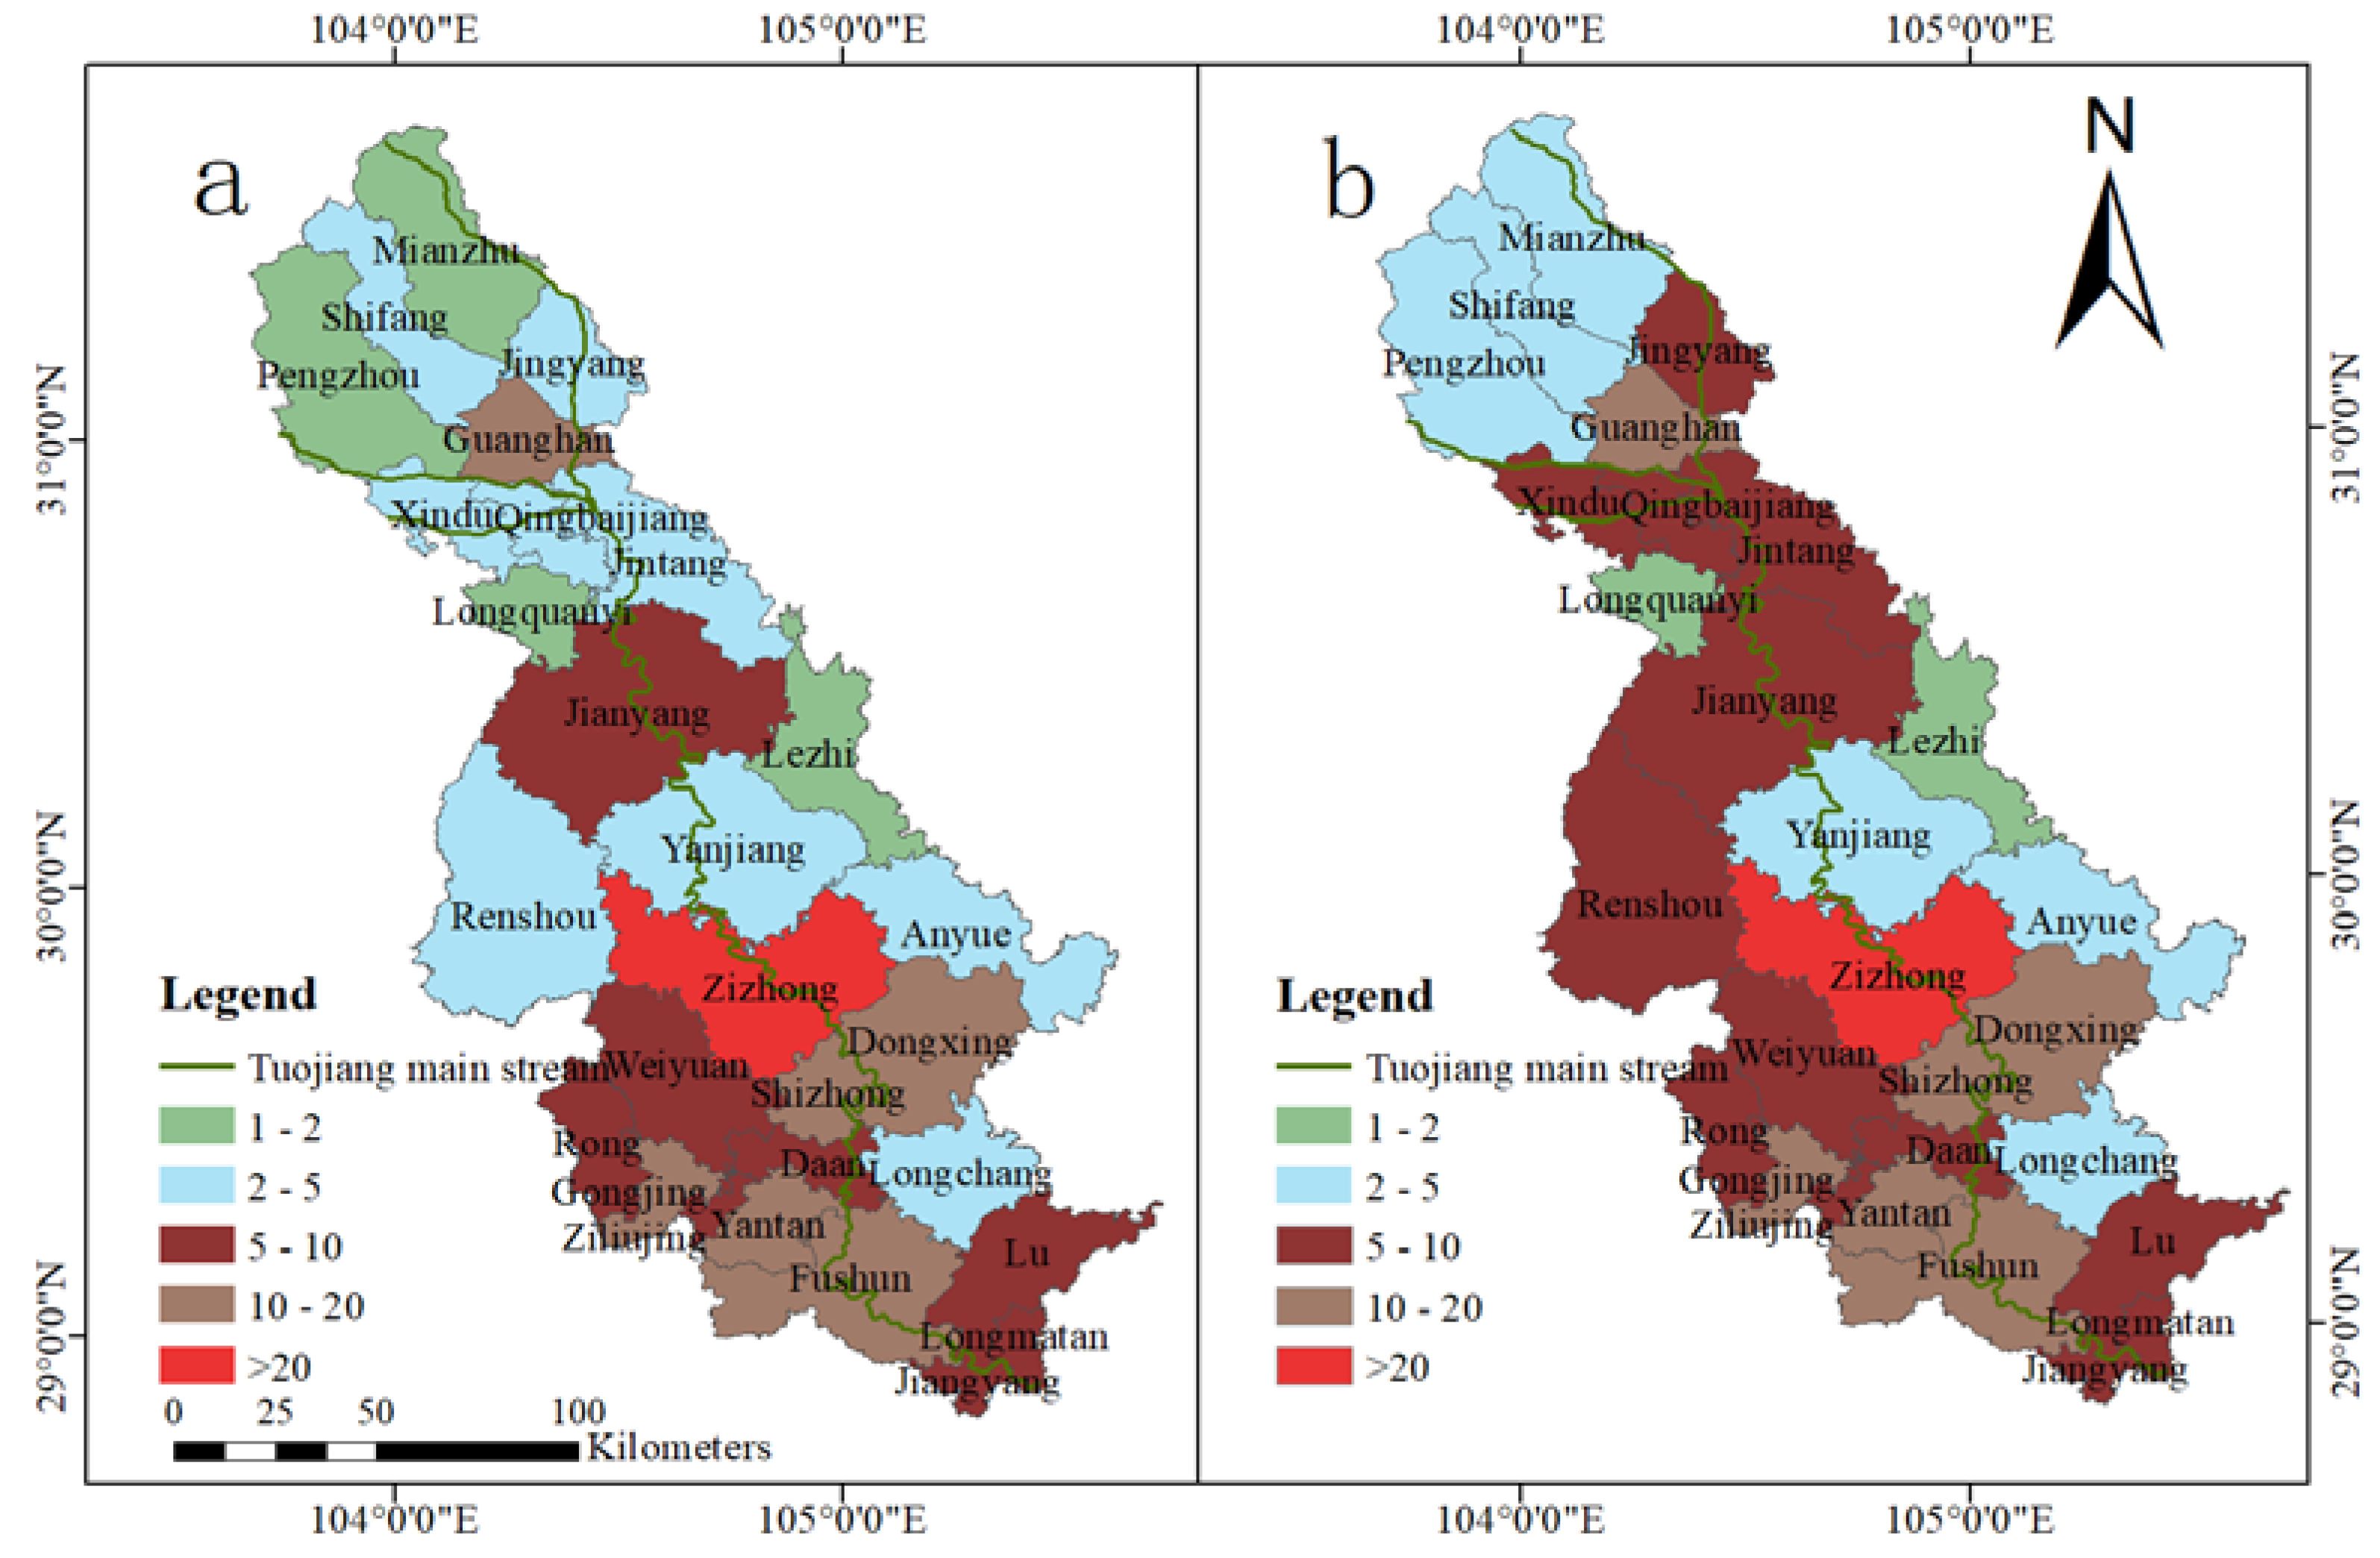
In 2018, the ANPS TN and TP loads in the TJRB totaled 60,888.92 tons and 20,085.98 tons, respectively. Subsequently, while TN loads decreased to 57,155.44 tons in 2019, TP loads increased to 21,659.91 tons. Among the districts and counties, Jianyang City, Renshou County, Dongxing District, and Zizhong County exhibited the heaviest ANPS TN and TP pollution, while Qingbaijiang District, Longquanyi District, Ziliujing District, and Longmatan District experienced relatively lighter ANPS TN and TP pollution levels. The distribution of ANPS TN and TP loads in the TJRB followed the pattern of being lowest in the upstream, intermediate in the downstream, and highest in the middle reaches.
(2)
Planting sources emerged as the primary contributors to TN and TP loads from ANPS in the TJRB, accounting for an average of 61.43% and 77.39%, respectively. In contrast, rural living sources and poultry and livestock farming sources made comparatively smaller contributions, with average percentages of 20.23% and 9.15% for TN loads and 18.34% and 13.46% for TP loads, respectively.
(3)
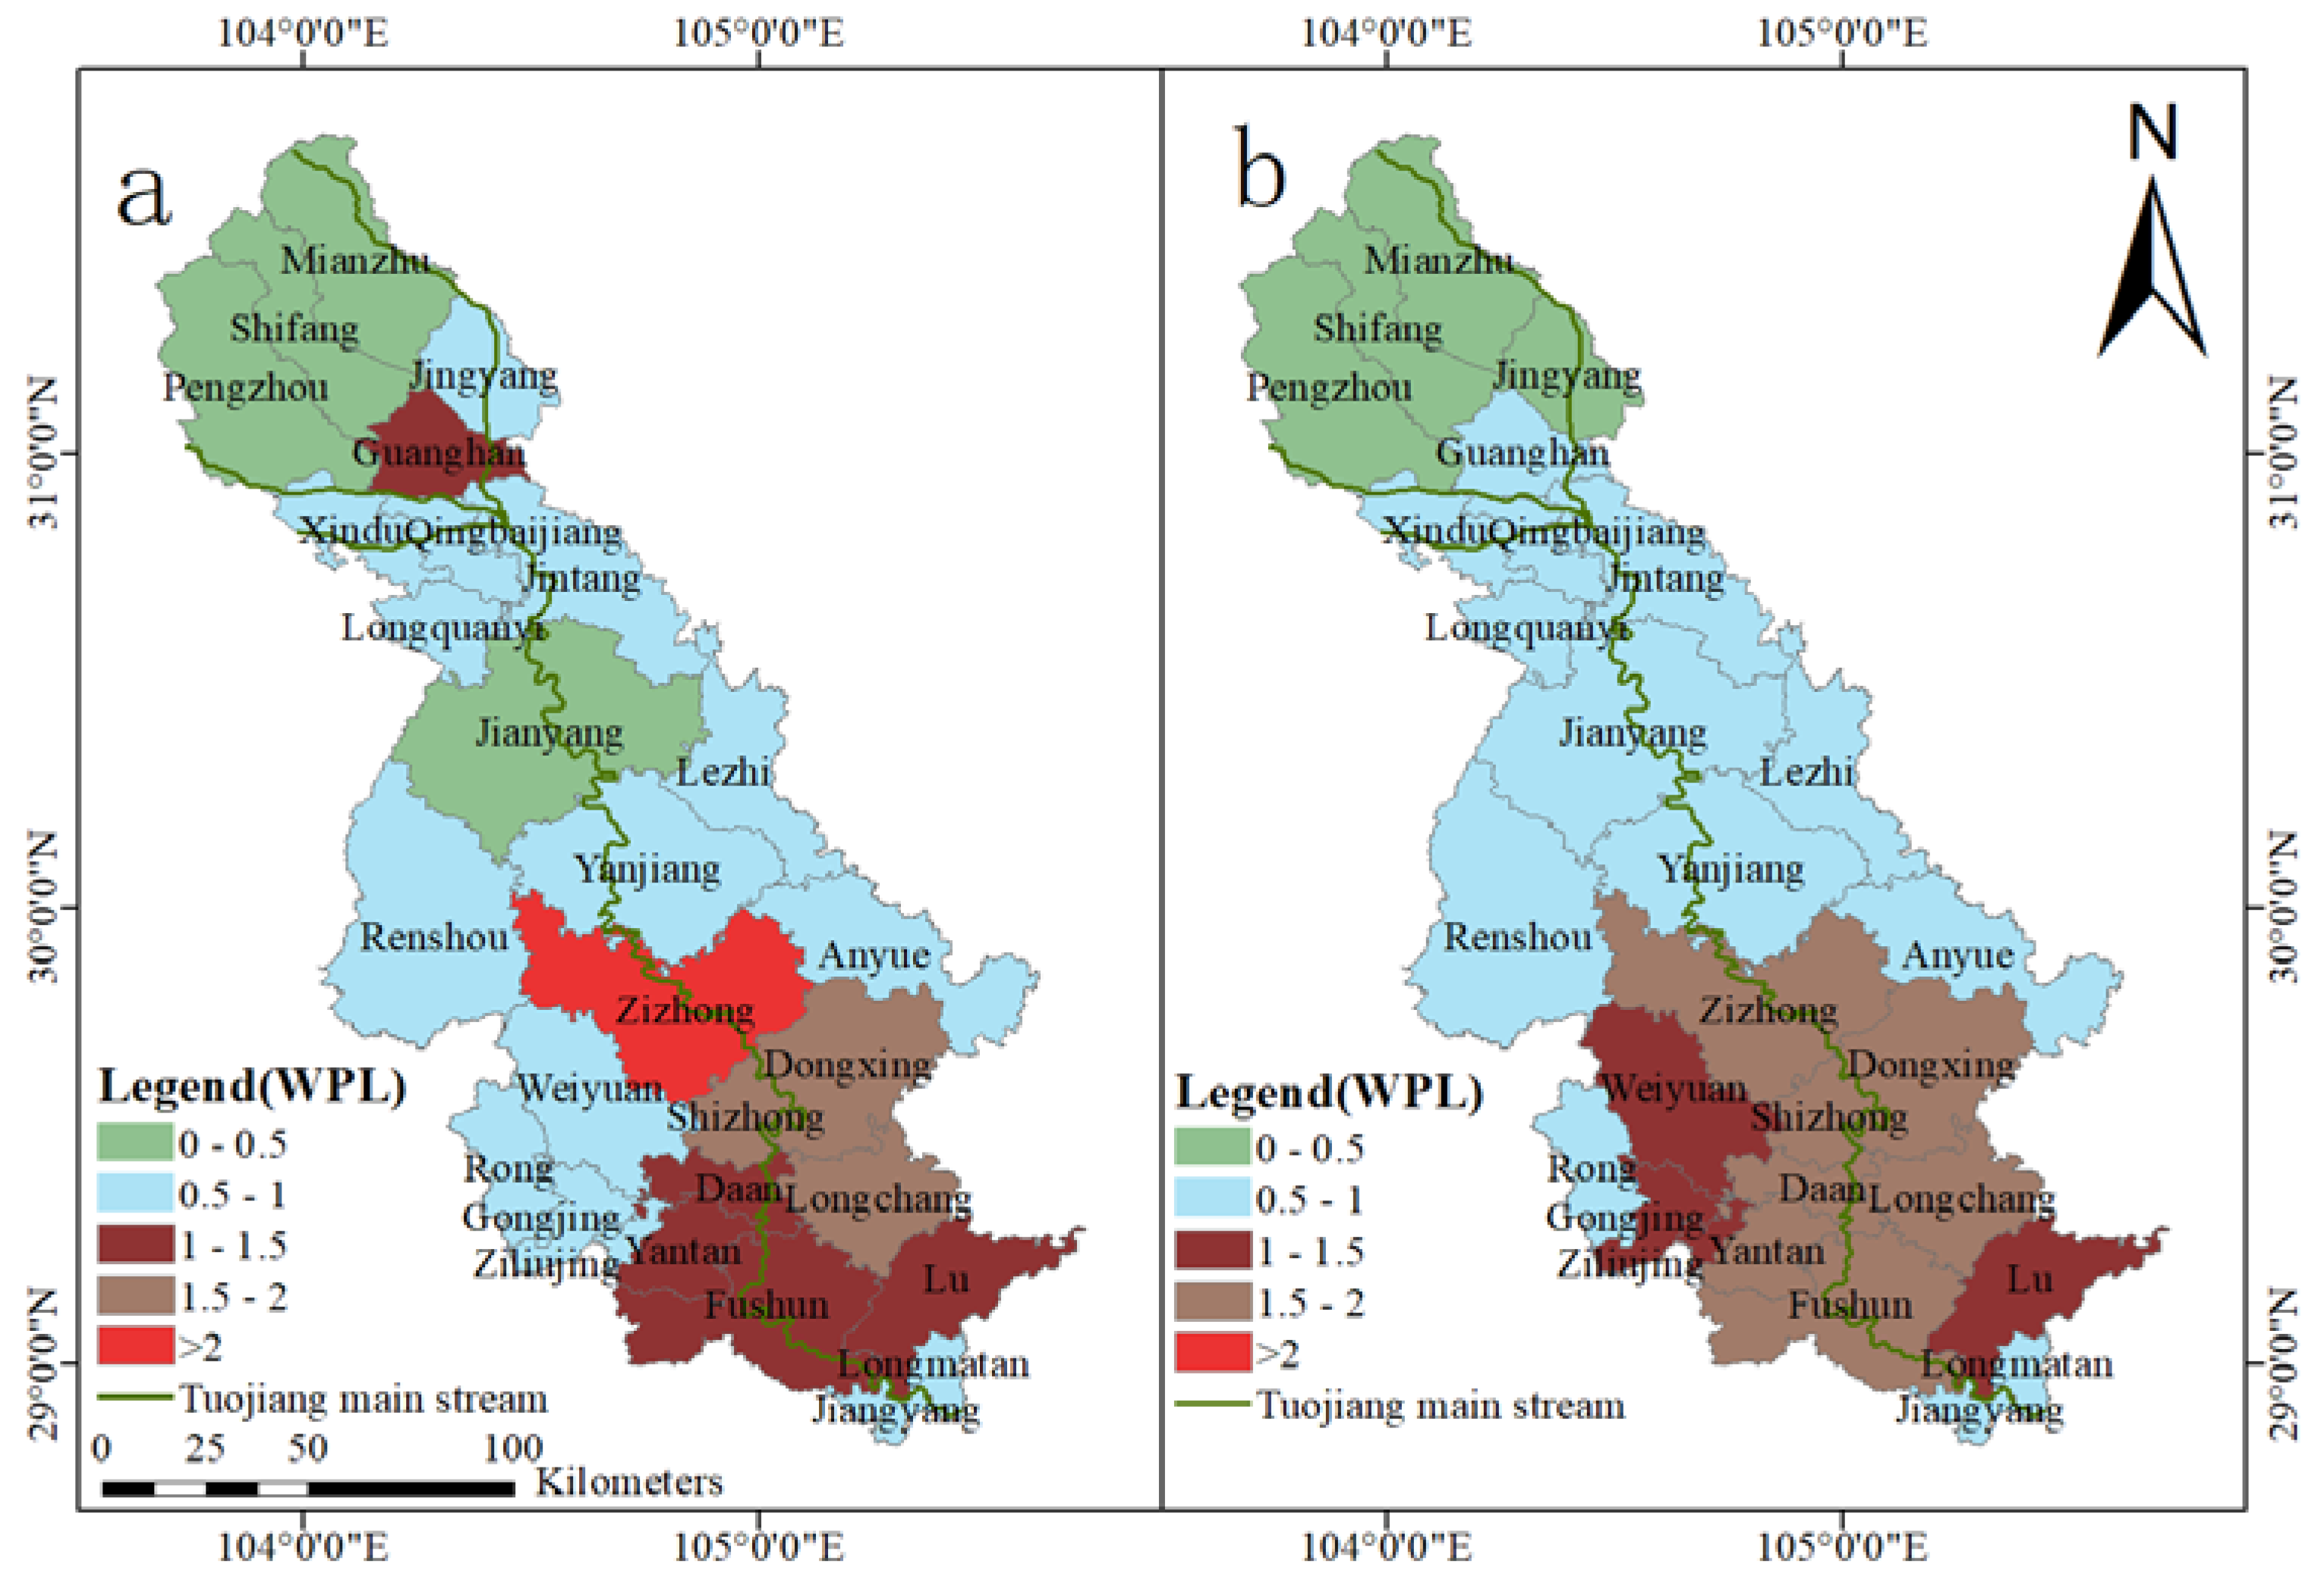
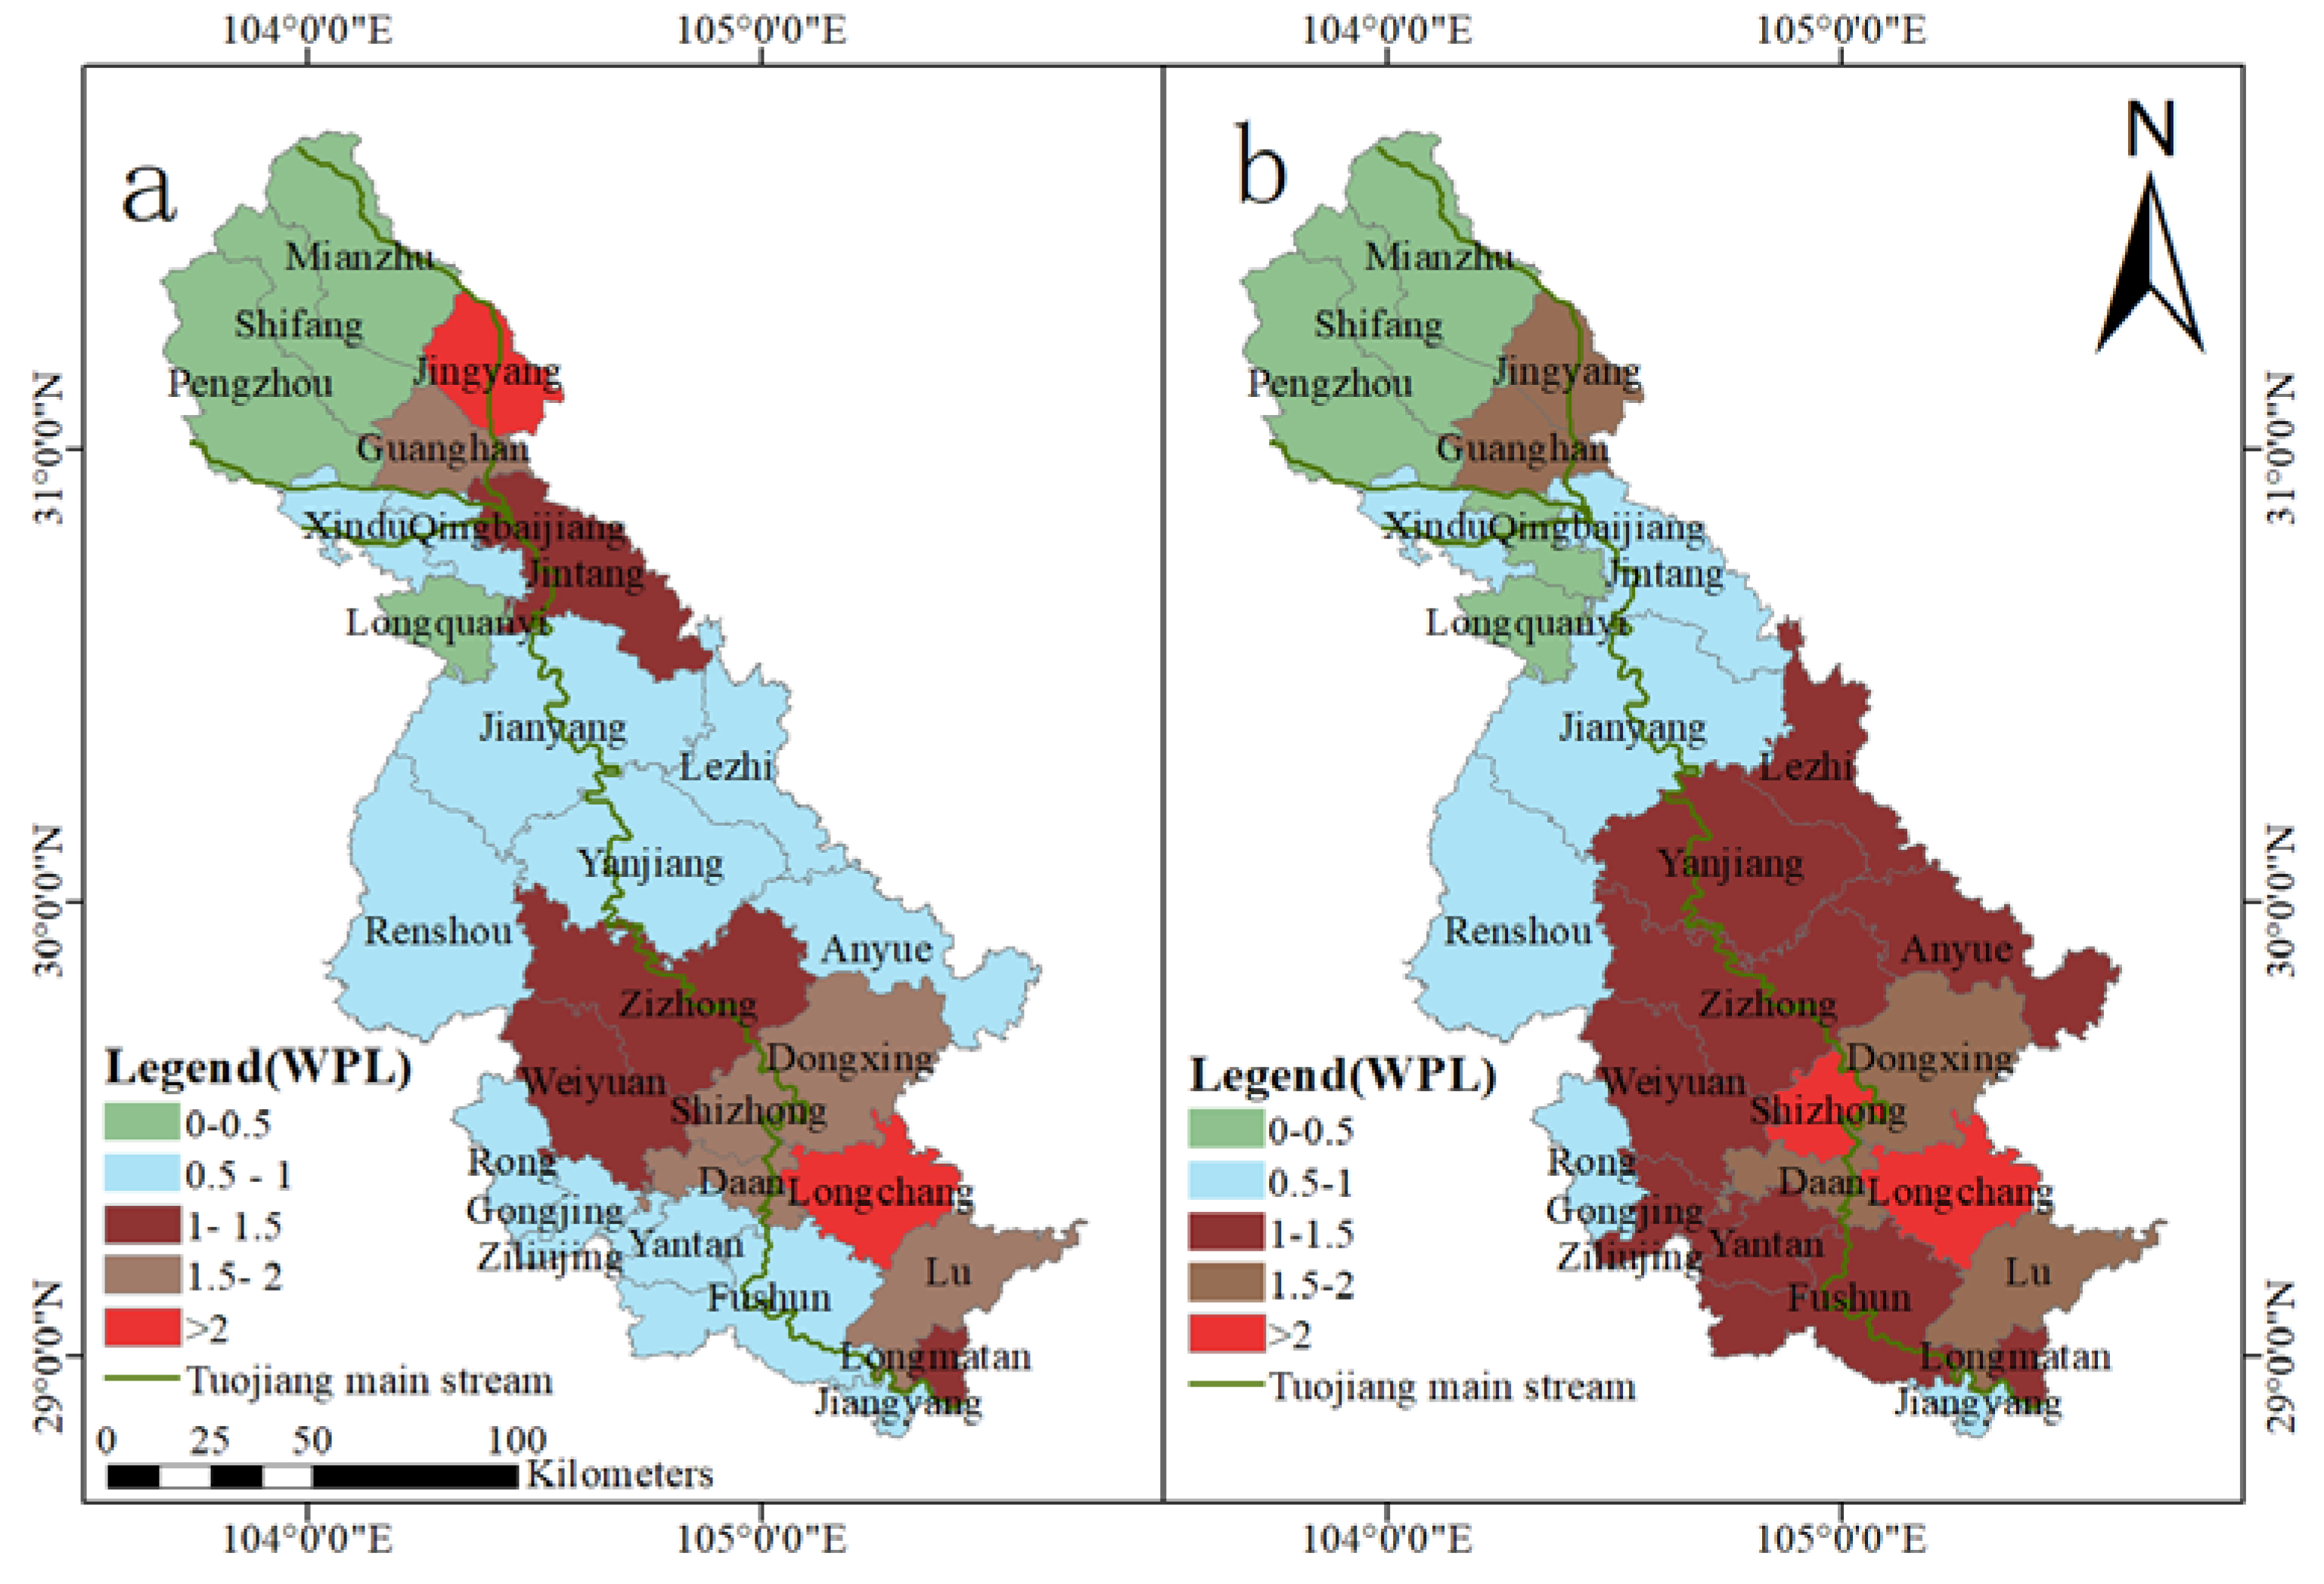
The analysis employing GWF and WPL indicators pointed to a continual rise in water environment pressure caused by TN and TP loads in the TJRB during the study period. Additionally, the WPL value of all the counties exceeded 1, indicating that the absorption capacity of the TJRB to the TN and TP loads from ANPS had been exhausted.

Supplementary Materials

The following supporting information can be downloaded at: https://www.mdpi.com/article/10.3390/w15193503/s1.

Author Contributions

D.F.: Methodology, Conceptualization, Analysis, Writing—Original Draft. Y.G.: Data Analysis, Writing—Review and Editing. C.C.: Data collection and collation, Methodology. X.G.: Conceptualization, Data Collection, and Analysis. H.L.: Conceptualization, Data Collection and Analysis. S.C.: Methodology, Conceptualization, Writing—Review and Editing, Supervision. J.R.: Data Collection and Collation. B.H.: Data Collection and Collation, Charting. All authors have read and agreed to the published version of the manuscript.

Funding

This work was supported by the Foundation of Science and Technology of Dazhou (No. 22ZDYF0057, No. 20ZDYF0015), the Opening Project of Key Laboratory of Green Chemistry of Sichuan Institutes of Higher Education (No. LYJ2201), the Key Laboratory of Exploitation and Study of Distinctive Plants in Education Department of Sichuan Province (No. TSZW2105), Special Foundation of Sichuan University of Arts and Science (No. 2022QD079), College Student Innovation and Entrepreneurship Project of Sichuan Province (No. S202210644037, No. S202210644052, No. X2022Z029).

Informed Consent Statement

This article does not contain any studies with human participants or animals performed by any of the authors.

Data Availability Statement

Data in this study are available from the corresponding author upon reasonable request.

Conflicts of Interest

The authors declare that they have no known competing financial interests or personal relationships that could have appeared to influence the work reported in this paper.

References

  1. Wang, G.; Li, J.; Sun, W.; Xue, B.; Lan, A.Y.; Liu, T. Non-point source pollution risks in a drinking water protection zone based on remote sensing data embedded within a nutrient budget model. Water Res. 2019, 157, 238–246. [Google Scholar] [CrossRef]
  2. Zou, L.L.; Liu, Y.S.; Wang, Y.S.; Hu, X.D. Assessment and analysis of agricultural non-point source pollution loads in China: 1978–2017. J. Environ. Manag. 2020, 263, 110400. [Google Scholar] [CrossRef] [PubMed]
  3. Wang, C.; Zhang, H.; Xin, X.K.; Li, J.; Jia, H.Y.; Wen, L.Q.; Yin, W. Water level-driven agricultural nonpoint source pollution dominated the ammonia variation in China’s second largest reservoir. Environ. Res. 2022, 215, 114367. [Google Scholar] [CrossRef]
  4. Wang, M.; Zhang, Y.T.; Li, Q.C.; Jia, R.B.; Li, J.; Wang, Y.; Jiao, M. Simulation and optimal management of non-point source pollution in Zhaohe small watershed in Anhui province. Bull. Soil Water Conserv. 2017, 41, 127–136. (In Chinese) [Google Scholar]
  5. Guo, Y.Z.; Wang, X.Y.; Zhou, L.L.; Zheng, W.X. Configuration and efficiency evaluation of the best management practices to control nitrogen loss in the watershed. China Environ. Sci. 2021, 41, 860–871. (In Chinese) [Google Scholar]
  6. Xiang, S.; Wan, L.; Pang, Y. Spatial-temporal variation of inflow river water quality under land use effect. J. Agro-Environ. Sci. 2020, 39, 160–170. (In Chinese) [Google Scholar]
  7. Nguyen, K.T. Formal versus informal system to mitigate non-point source pollution: An experimental investigation. J. Agric. Econ. 2020, 71, 838–852. [Google Scholar] [CrossRef]
  8. Wu, Y.H.; Liu, J.Z.; Shen, R.F.; Fu, B. Mitigation of nonpoint source pollution in rural areas: From control to synergies of multi ecosystem services. Sci. Total Environ. 2017, 607–608, 1376–1380. [Google Scholar] [CrossRef]
  9. Xu, B.W.; Niu, Y.R.; Zhang, Y.N.; Chen, Z.F.; Zhang, L. China’s agricultural non-point source pollution and green growth: Interaction and spatial spillover. Environ. Sci. Pollut. Res. 2022, 29, 60278–60288. [Google Scholar] [CrossRef]
  10. Yan, R.; Li, L.; Gao, J. Framework for quantifying rural NPS pollution of a humid lowland catchment in Taihu Basin, eastern China. Sci. Total Environ. 2019, 688, 983–993. [Google Scholar] [CrossRef]
  11. Jiang, S.Y.; Hu, H.; Sheng, H.; Jarvie, H.P.; Liu, X.; Zhang, Y.; Yuan, Z.W.; Zhang, L.; Liu, X.W. Phosphorus footprint in China over the 1961–2050 period: Historical perspective and future prospect. Sci. Total Environ. 2019, 650, 687–695. [Google Scholar] [CrossRef] [PubMed]
  12. Liu, X.W.; Yuan, Z.W.; Liu, X.; Zhang, Y.; Hu, H.; Jiang, S.Y. Historic trends and future prospects of waste generation and recycling in China’s phosphorus cycle. Environ. Sci. Technol. 2020, 54, 5131–5139. [Google Scholar] [CrossRef] [PubMed]
  13. Yuan, Z.W.; Pang, Y.J.; Gao, J.Q.; Liu, X.; Sheng, H.; Zhuang, Y.J. Improving quantification of rainfall runoff pollutant loads with consideration of path curb and field ridge. Resour. Environ. Sustain. 2021, 6, 100042. [Google Scholar] [CrossRef]
  14. Xue, B.L.; Zhang, H.W.; Wang, G.Q.; Sun, W.C. Evaluating the risks of spatial and temporal changes in nonpoint source pollution in a Chinese river basin. Sci. Total Environ. 2022, 807, 151726. [Google Scholar] [CrossRef]
  15. Chahor, Y.; Casalí, J.; Gimenez, R.; Bingner, R.L.; Campo, M.A.; Goni, M. Evaluation of the AnnAGNPS model for predicting runoff and sediment yield in a small mediterranean agricultural watershed in Navarre (Spain). Agric. Water Manag. 2014, 134, 24–37. [Google Scholar] [CrossRef]
  16. Chen, Y.H.; Wen, X.W.; Wang, B.; Nie, P.Y. Agricultural pollution and regulation: How to subsidize agriculture. J. Clean. Prod. 2017, 164, 258–264. [Google Scholar] [CrossRef]
  17. Xie, X.; Fang, B.; Xu, H.Z.; He, S.S.; Xin, L. Study on the coordinated relationship between Urban Land use efficiency and ecosystem health in China. Land Use Policy 2021, 102, 105235. [Google Scholar] [CrossRef]
  18. Li, L.; Gou, M.; Wang, N.; Ma, W.; La, L. Landscape configuration mediates hydrology and nonpoint source pollution under climate change and agricultural expansion. Ecol. Indic. 2021, 129, 107959. [Google Scholar] [CrossRef]
  19. Peng, J.Y.; Tong, H.J.; Liu, X.C.; Feng, Y.; Zhu, Y.M.; Wu, Y.; Chu, Z.S.; Zheng, B.H. Comprehensive evaluation of water resources and environmental carrying capacity based on dualistic water cycle analysis and its application in the Tuo River Basin, China. Ecol. Indic. 2023, 146, 109897. [Google Scholar] [CrossRef]
  20. Fu, D.; Wu, X.F.; Chen, Y.C.; Yi, Z.Y. Spatial variation and source apportionment of surface water pollution in the Tuo River, China, using multivariate statistical techniques. Environ. Monit. Assess. 2020, 192, 745. [Google Scholar] [CrossRef]
  21. Cui, M.; Guo, Q.J.; Wei, R.F.; Wei, Y.J. Anthropogenic nitrogen and phosphorus inputs in a new perspective: Environmental loads from the mega economic zone and city clusters. J. Clean. Prod. 2020, 283, 124589. [Google Scholar] [CrossRef]
  22. Liu, D.D.; Bai, L.; Qiao, Q.; Zhang, Y.; Li, X.Y.; Zhao, R.N.; Liu, J.Y. Anthropogenic total phosphorus emissions to the Tuojiang River Basin, China. J. Clean. Prod. 2021, 294, 126325. [Google Scholar] [CrossRef]
  23. Wang, H.; Xu, Y.L.; Zhang, Q.; Lin, C.W.; Zhai, L.M.; Liu, H.T.; Pu, B. Emission characteristics of nitrogen and phosphorus in a typical agricultural small watershed in Tuojiang River Basin. Environ. Sci. 2020, 41, 4547–4554. (In Chinese) [Google Scholar]
  24. Acosta, A.B.; Chu, M.L.; Huang, C. Impacts of environmental stressors on nonpoint source pollution in intensively managed hydrologic systems. J. Hydrol. 2019, 579, 124056. [Google Scholar] [CrossRef]
  25. Zhao, H.Y.; Piccone, T. Large scale constructed wetlands for phosphorus removal, an effective nonpoint source pollution treatment technology. Ecol. Eng. 2020, 145, 105711. [Google Scholar] [CrossRef]
  26. Green, L.; Magel, C.; Brown, C. Management pathways for the successful reduction of nonpoint source nutrients in coastal ecosystems. Reg. Stud. Mar. Sci. 2021, 45, 101851. [Google Scholar] [CrossRef]
  27. Chapagain, A.K.; Hoekstra, A.Y.; Savenije, H.H.G.; Gautam, R. The water footprint of cotton consumption: An assessment of the impact of worldwide consumption of cotton products on the water resources in the cotton producing countries. Ecol. Econ. 2006, 60, 186–203. [Google Scholar] [CrossRef]
  28. Karandish, F. Applying grey water footprint assessment to achieve environmental sustainability within a nation under intensive agriculture: A high-resolution assessment for common agrochemicals and crops. Environ. Earth Sci. 2019, 78, 200. [Google Scholar] [CrossRef]
  29. Miglietta, P.P.; Toma, P.; Fanizzi, F.P.; Donno, A.; Coluccia, B.; Migoni, D.; Bagordo, F.; Serio, F. A Grey water footprint assessment of groundwater chemical pollution: Case study in Salento (southern Italy). Sustainability 2017, 9, 799. [Google Scholar] [CrossRef]
  30. Zhao, X.; Liao, X.; Chen, B.; Tillotson, M.R.; Guo, W.; Li, Y. Accounting global grey water footprint from both consumption and production perspectives. J. Clean. Prod. 2019, 225, 963–971. [Google Scholar] [CrossRef]
  31. Aldaya, M.M.; Rodriguez, C.I.; Fernandez-Poulussen, A.; Merchan, D.; Beriain, M.J.; Llamas, R. Grey water footprint as an indicator for diffuse nitrogen pollution: The case of Navarra, Spain. Sci. Total Environ. 2020, 698, 134338. [Google Scholar] [CrossRef] [PubMed]
  32. Hoekstra, A.Y.; Mekonnen, M.M. The water footprint of humanity. Proc. Natl. Acad. Sci. USA 2012, 109, 3232–3237. [Google Scholar] [CrossRef] [PubMed]
  33. Feng, H.Y.; Sun, F.Y.; Liu, Y.Y.; Zeng, P.; Deng, L.Z.; Che, Y. Mapping multiple water pollutants across China using the grey water footprint. Sci. Total Environ. 2021, 785, 147255. [Google Scholar] [CrossRef]
  34. Yu, C.X.; Yin, X.N.; Li, H.; Yang, Z.F. A hybrid water-quality-index and grey water footprint assessment approach for comprehensively evaluating water resources utilization considering multiple pollutants. J. Clean. Prod. 2020, 742, 140553. [Google Scholar] [CrossRef]
  35. Muratoglu, A. Grey water footprint of agricultural production: An assessment based on nitrogen surplus and high-resolution leaching runoff fractions in Turkey. Sci. Total Environ. 2020, 785, 147255. [Google Scholar] [CrossRef]
  36. Zhang, Y.; Liu, X.J.; You, L.Z.; Zhang, F.S. Improving potential of nitrogen linked gray water footprint in China’s intensive cropping systems. J. Clean. Prod. 2020, 269, 122307. [Google Scholar] [CrossRef]
  37. Fu, D.; Chen, S.; Chen, Y.C.; Yi, Z.Y. Development of modified integrated water quality index to assess the surface water quality: A case study of Tuo River, China. Environ. Monit. Assess. 2022, 194, 333. [Google Scholar] [CrossRef] [PubMed]
  38. Xiao, Y.T.; Chen, S.; Fan, M. Temporally and Spatially varied characteristics of pollution load in Tuojiang River Basin. Acta Sci. Circumstantiae 2021, 41, 1981–1995. (In Chinese) [Google Scholar]
  39. Xiao, Y.T.; Yao, J.; Chen, S.; Fan, M. Temporal and spatial evolution of non-point source pollution load of total nitrogen in Tuojiang River Basin. Environ. Sci. 2021, 42, 3773–3784. (In Chinese) [Google Scholar]
  40. Zhang, W.Q.; Jin, X.; Cao, H.M.; Zhao, Y.; Shan, B.Q. Water quality in representative tuojiang river network in southwest China. Water 2018, 10, 864. [Google Scholar] [CrossRef]
  41. Yan, K.; Xu, J.C.; Gao, W.; Li, M.J.; Yuan, Z.W.; Zhang, F.S.; Elser, J. Human perturbation on phosphorus cycles in one of China’s most eutrophicated lakes. Resour. Environ. Sustain. 2021, 4, 100026. [Google Scholar] [CrossRef]
  42. Yan, K.; Yuan, Z.W.; Goldberg, S.; Gao, W.; Ostermann, A.; Xu, J.C.; Zhang, F.S.; Elser, J. Phosphorus mitigation remains critical in water protection: A review and meta-analysis from one of China’s most eutrophicated lakes. Sci. Total Environ. 2019, 689, 1336–1347. [Google Scholar] [CrossRef] [PubMed]
  43. National Bureau of Statistics of China. Sichuan Statistical Yearbook; China Statistics Press: Beijing, China, 2019; Available online: https://www.chinayearbooks.com/sichuan-statistical-yearbook-2019.html (accessed on 2 October 2023). (In Chinese)
  44. National Bureau of Statistics of China. Sichuan Statistical Yearbook; China Statistics Press: Beijing, China, 2020; Available online: https://www.chinayearbooks.com/sichuan-statistical-yearbook-2020.html (accessed on 2 October 2023). (In Chinese)
  45. Changjiang Water Resources Commission of the Ministry of Water Resources. Changjiang and Southwest Rivers Water Resources Bulletin, 1st ed.; ChangJiang Press: Wuhan, China, 2019. (In Chinese) [Google Scholar]
  46. Changjiang Water Resources Commission of the Ministry of Water Resources. Changjiang and Southwest Rivers Water Resources Bulletin, 2nd ed.; ChangJiang Press: Wuhan, China, 2020. (In Chinese) [Google Scholar]
  47. China Pollution Source Census. Handbook of Emission Factors of Domestic Pollution Sources for the Second National Pollution Source Census; China Water Risk: Hong Kong, China, 2019. (In Chinese) [Google Scholar]
  48. Guo, X.X.; Zhang, H.; Yang, R.X. Pollutant loads and environmental risks of livestock production based on arable land carrying capacity—A case study in Sichuan Province. Bull. Soil Water Conserv. 2019, 39, 226–232. (In Chinese) [Google Scholar]
  49. Yang, J.; Wang, Y.D.; Fang, S.Q.; Qiang, Y.F.; Liang, J.P.; Yang, G.H.; Feng, Y.Z. Evaluation of livestock pollution and its effects on a water source protection area in China. Environ. Sci. Pollut. Res. 2020, 27, 18632–18639. [Google Scholar] [CrossRef]
  50. Department of Ecology and Environment Sichuan Province. Sichuan Ecology and Environment Statement 2019; Department of Ecology and Environment Sichuan Province: Chengdu, China, 2020. (In Chinese) [Google Scholar]
  51. Qi, X.Y. Estimation and Assessment of Diffused Pollution Load in Upper Reaches of Liao River. Master’s Thesis, LiaoNing University, Shenyang, China, 2019. (In Chinese). [Google Scholar]
  52. Chen, H.; Teng, Y.; Wang, J. Load estimation and source apportionment of nonpoint source nitrogen and phosphorus based on integrated application of SLURP model, ECM, and RUALE-a case study in the Jinjiang River, China. Environ. Monit. Assess. 2013, 185, 2009–2021. [Google Scholar] [CrossRef]
  53. Wu, L.; Gao, J.E.; Ma, X.Y.; Li, D. Application of modified export coefficient method on the load estimation of non-point source nitrogen and phosphorus pollution of soil and water loss in semiarid regions. Environ. Sci. Pollut. Res. 2015, 22, 10647–10660. [Google Scholar] [CrossRef]
  54. Hoekstra, A.Y.; Chapagain, A.K.; Aldaya, M.M.; Mekonnen, M.M. The Water Footprint Assessment Manual: Setting the Global Standard; Earthscan: London, UK, 2011. [Google Scholar]
  55. Powers, S.M.; Bruulsema, T.W.; Burt, T.P.; Chan, N.I.; Elser, J.J.; Haygarth, P.M.; Howden, N.J.K.; Jarvie, H.P.; Lyu, Y.; Peterson, H.M.; et al. Long-term accumulation and transport of anthropogenic phosphorus in three river basins. Nat. Geosci. 2016, 9, 353. [Google Scholar] [CrossRef]
  56. Hu, Y.; Long, C.M.; Wang, Y.C.; Kerkez, B.; Scavia, D. Urban total phosphorus loads to the st. Clair-detroit river system. J. Great Lakes Res. 2019, 45, 1142–1149. [Google Scholar] [CrossRef]
Figure 1. Distribution of Tuojiang River Basin and 28 districts and counties.
Water 15 03503 g001
Figure 2. The distribution of TN and TP loads from planting source, (a,c): 2019; (b,d): 2018.
Water 15 03503 g002
Figure 3. The distribution of TN and TP loads from rural living sources, (a,c): 2019; (b,d): 2018.
Water 15 03503 g003
Figure 4. Spatial distribution of nitrogen and phosphorus loads in poultry and livestock farming source of the TJRB, (a,c): 2019; (b,d): 2018.
Water 15 03503 g004
Figure 5. Composition of TN and TP loads of the poultry and livestock farming source in the TJRB, (a,c): 2019; (b,d): 2018.
Water 15 03503 g005
Figure 6. The spatial distribution of ANPS TN and TP loads, (a,c): 2019; (b,d): 2018.
Water 15 03503 g006
Figure 7. The composition characteristics of ANPS TN and TP loads, (a,c): 2019; (b,d): 2018.
Water 15 03503 g007aWater 15 03503 g007b
Figure 8. The spatial change of WPL of planting source in the TJRB, (a): 2018; (b): 2019.
Water 15 03503 g008
Figure 9. The spatial variation of WPL of the rural living source in the TJRB, (a): 2019; (b): 2018.
Water 15 03503 g009
Figure 10. The spatial variation of WPL of the poultry and livestock farming source, (a): 2019; (b): 2018.
Water 15 03503 g010
Figure 11. The WPL distribution of ANPS TN and TP of the TJRB, (a): 2018; (b): 2019.
Water 15 03503 g011
Table 1. TN and TP emissions coefficient and loss coefficient into the river of livestock and poultry farming source.
Emission Coefficient of TN (g/Head Day)Loss Coefficient into the River of TN (%)Emission Coefficient of TP (g/Head Day)Loss Coefficient into the River of TP (%)
Swine19.745.254.845.25
Cattle104.15.6810.175.5
Sheep14.915.31.995.2
Poultry0.968.470.158.42
Disclaimer/Publisher’s Note: The statements, opinions and data contained in all publications are solely those of the individual author(s) and contributor(s) and not of MDPI and/or the editor(s). MDPI and/or the editor(s) disclaim responsibility for any injury to people or property resulting from any ideas, methods, instructions or products referred to in the content.

