Technical Note

The Effect of Salinity on N2O Emissions during Domestic Wastewater Partial Nitrification Treatment in a Sequencing Batch Reactor

1
Department of Municipal Engineering, Yancheng Institute of Technology, Yancheng 224051, China
2
National Engineering Laboratory for Advanced Municipal Wastewater Treatment and Reuse Technology, Engineering Research Center of Beijing, Beijing University of Technology, Beijing 100124, China
*
Author to whom correspondence should be addressed.
Water 2023, 15(19), 3502; https://doi.org/10.3390/w15193502
Submission received: 15 August 2023 / Revised: 15 September 2023 / Accepted: 4 October 2023 / Published: 7 October 2023
(This article belongs to the Section Wastewater Treatment and Reuse)

Abstract

:
Previous studies have highlighted the salinization caused by the use of seawater to flush toilets and industrial wastewater entering the urban wastewater systems in coastal areas. Thus, in this study, the effect of salinity on N2O emissions during the partial nitrification process, as well as the emission mechanism, was investigated using a partial nitrification system of wastewater as the research object. The results showed that (1) the increase in salinity decreased the oxidation rate of NH4+ and the formation rate of NO2 during partial nitrification; (2) the increase in salinity increased the N2O emissions during NH4+ oxidation and NH2OH oxidation and decreased the formation rate of NO2-N during hydroxylamine oxidation; (3) the total N2O emissions during hydroxylamine oxidation were less than those during ammonia nitrogen oxidation, and a greater amount of NO2 was reduced to N2 instead of N2O during hydroxylamine oxidation; and (4) a novel finding was that, during partial nitrification with the available organic matter, the N2O emissions via heterotrophic denitrification by heterotrophic bacteria should not be ignored, and the increase in salinity can increase the N2O emissions generated via heterotrophic denitrification. These results would provide a theoretical basis for reducing the N2O emissions in the wastewater treatment process.

1. Introduction

Recent years have witnessed rapid economic development in the coastal areas of China, with an increased population density and greater demand for fresh water, along with a severe shortage of water. Thus, seawater utilization is considered as critical to alleviating the shortage of freshwater resources in coastal areas. Seawater flushing [1], as an important means of seawater utilization, has been paid more and more attention; however, the resultant salt-containing wastewater treatment needs more focus for urban wastewater treatment. In addition, this high-salt industrial wastewater has been shown to enter the municipal wastewater network due to its non-standard discharge, resulting in a change in the salinity of municipal wastewater, along with an increase in the salt load of the wastewater plant. This increase in salinity has the potential to affect the nitrogen removal efficiency of biological wastewater treatment, because salinity can cause changes in the metabolic enzymes and cell structure in microorganisms [2,3].
Currently, the studies on the influence of salinity on the wastewater treatment process at home and abroad have mostly been limited to the analysis of the influence of salinity on the traditional nitrification and denitrification of wastewater. In addition, the studies investigating the influence of salinity on the changes in nitrogen and phosphorus contents in the wastewater treatment process have mainly been focused on evaluating its impact on N2O production and rarely on its mechanism in the nitrification and denitrification process. N2O is a super greenhouse gas, with a greenhouse effect of 300 times that of CO2 [4]; it is also associated with the occurrence of the ozone hole [5]. N2O can be produced in both the nitrification and denitrification processes of wastewater biological treatment. Currently, there are many studies on the influence of salinity on N2O in the denitrification process, but there is a scarcity of research on the influence of salinity on N2O in the nitrification process and its mechanism.
In the nitrification process of wastewater biological treatment, N2O is produced mainly during the oxidation of NH3 by Ammonia-Oxidizing Bacteria (AOB) to NO2 [5,6]. In this process, there are three possible production paths: (1) N2O is the byproduct of the incomplete oxidation of hydroxylamine in the oxidation process [7,8,9,10]; (2) N2O is the product of the autotrophic denitrification of AOB using NO2 as an electron acceptor [8,11]; and (3) the chemical reaction of NH2OH with NO2 or O2 can also produce partial N2O [12,13]. Additionally, similar to the denitrification process, N2O might also be produced during nitrification due to the denitrification of heterotrophic bacteria [14]. However, there have been no studies documenting the influence of salinity on the N2O produced by heterotrophic denitrification during nitrification.
Partial nitrification is a novel process for wastewater treatment in practical engineering. Compared to whole-process nitrification, the partial biological nitrogen removal process offers several advantages, such as reducing oxygen supply by 25%, saving carbon sources by 40%, reducing sludge production by approximately 50%, shortening the reaction time, and reducing the reactor volume [15]. However, in the partial nitrification process of the AOB enrichment system, the yield of N2O is higher than that of the whole-process nitrification system because the end product of NH3 oxidation is NO2 rather than NO3, and because NO2 is a receptor for autotrophic denitrification and reacts with NH2OH [16]. This study investigated the effect and mechanism of salinity on the N2O production in short-cut nitrification system sludge enriched with AOB. The results would provide a theoretical basis for the reduced emissions of N2O in the wastewater treatment process under the background of “carbon neutrality”.

2. Methods

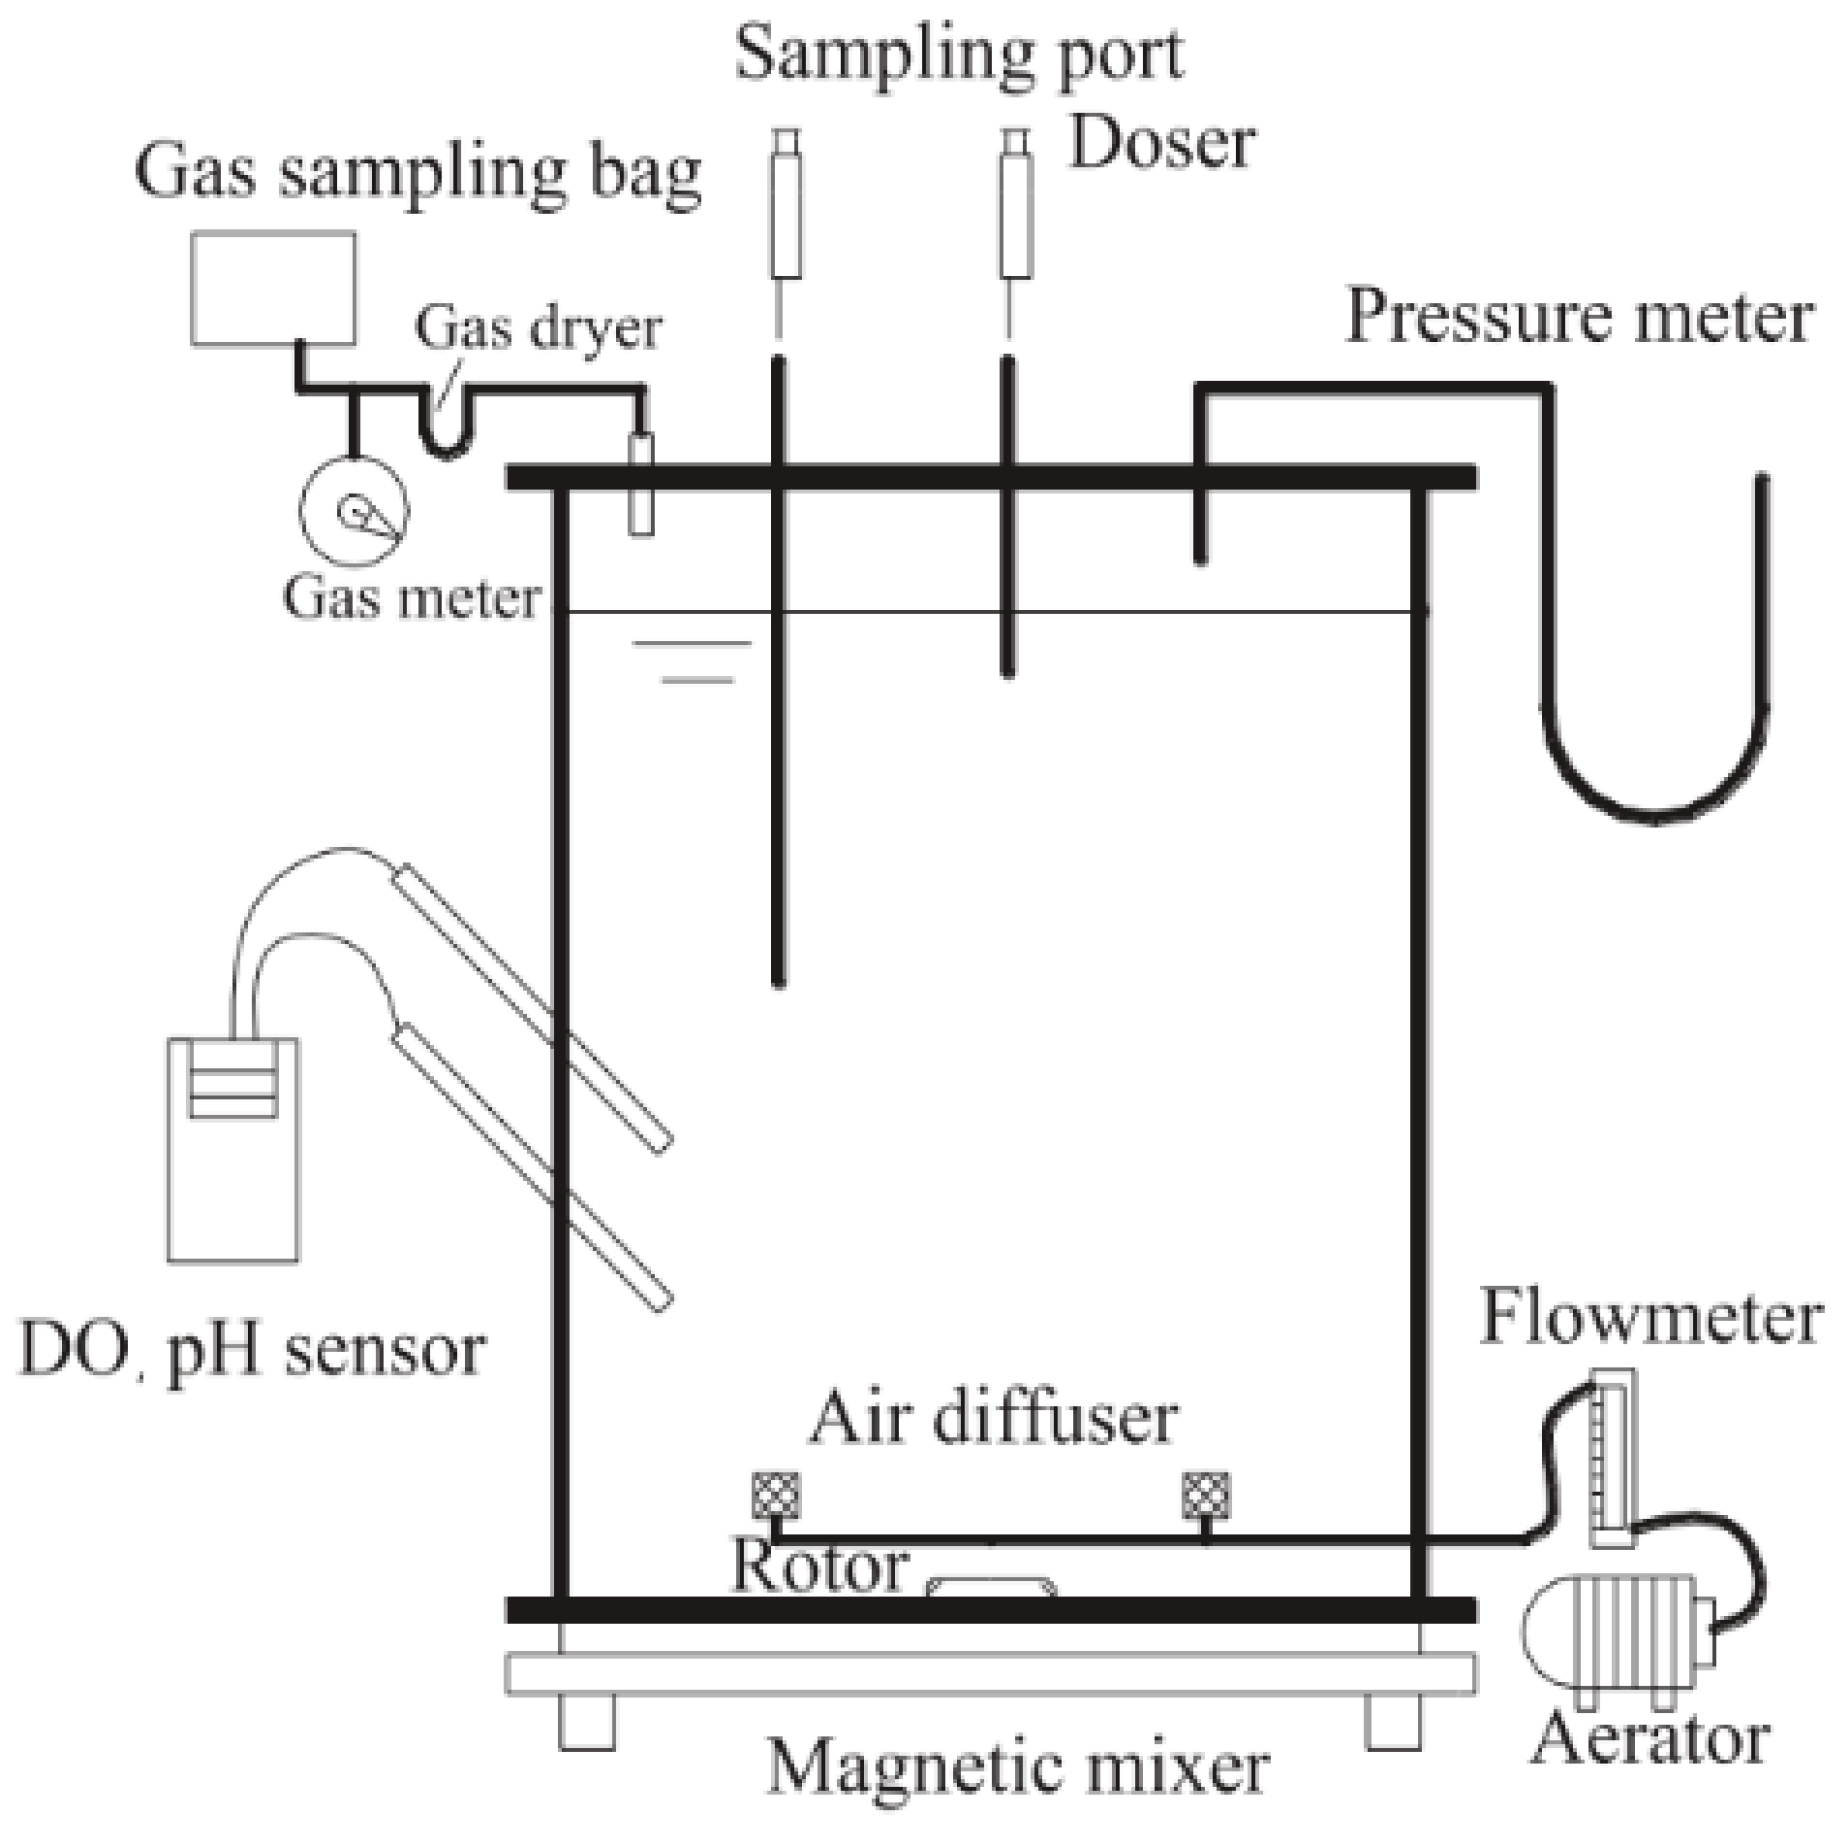
2.1. Sludge, Wastewater, and SBR (Sequencing Batch Reactor) Operations

A 12 L SBR was used for cultivating the partial nitrification sludge. Table 1 shows the index of domestic wastewater inflow. The partial nitrification operation mode was as follows: the average operational cycle (420 min), including feeding (30 min), aeration (240 min), anoxic denitrification (120 min), and settling (30 min), three cycles per day, with the DO at 1 mg/L and Mixed Liquid Suspended Solids (MLSS) at 3000 mg/L. The Sludge Retention Time (SRT) was 11 days, and the running temperature was 30 °C. The effluent’s composition consisted of NH4+-N, NO2-N, and NO3-N, which were all <1 mg/L. The sludge taken from the SBR was aerated for 12 h, followed by repeated washing. The effluent’s COD was less than 50 mg/L and could not be oxidized further.

2.2. Batch Test Rules

Figure 1 shows the experimental batch test reactor. The effective volume of the reactor was 3 L. At the beginning of each batch test, 1 L of concentrated sludge was added into the reactor, followed by 2 L of wastewater, and the Mixed Liquor Suspended Solids (MLSS) was controlled at 3000 mg/L. The nitrogen compounds, DO, and pH levels were then adjusted for the batch set upon commencing the operation (Table 2). The running time for the batch tests was 180 min.

2.3. Detection Method

The NH4+-N, NO2-N, and NO3-N were measured according to methods described in previous studies [17]. The DO, pH, and T were measured using an oxygen, pH, and temperature meter (WTW 340i, WTW Company, Munich, Germany), and the temperature and DO were controlled using an appropriate sensor and PLC, respectively. The Mixed Liquid Suspended Solids concentration was measured at the beginning and end of each test to obtain an average value, which was used for the calculation of the NH4+-N oxidation rate, NOx-N production rate, and N2O emission rate. The total N2O production comprised the N2O emitted in the gaseous phase (emission gas N2O) and the N2O dissolved in the mixed liquid phase (dissolved N2O). The N2O concentrations in the gas samples were analyzed in triplicate using a gas chromatograph (Agilent 6890N, Santa Clara, CA, USA). The overhead space method was used to analyze the dissolved N2O. Water and N2O samples were taken at 30 min intervals.

3. Results and Discussion

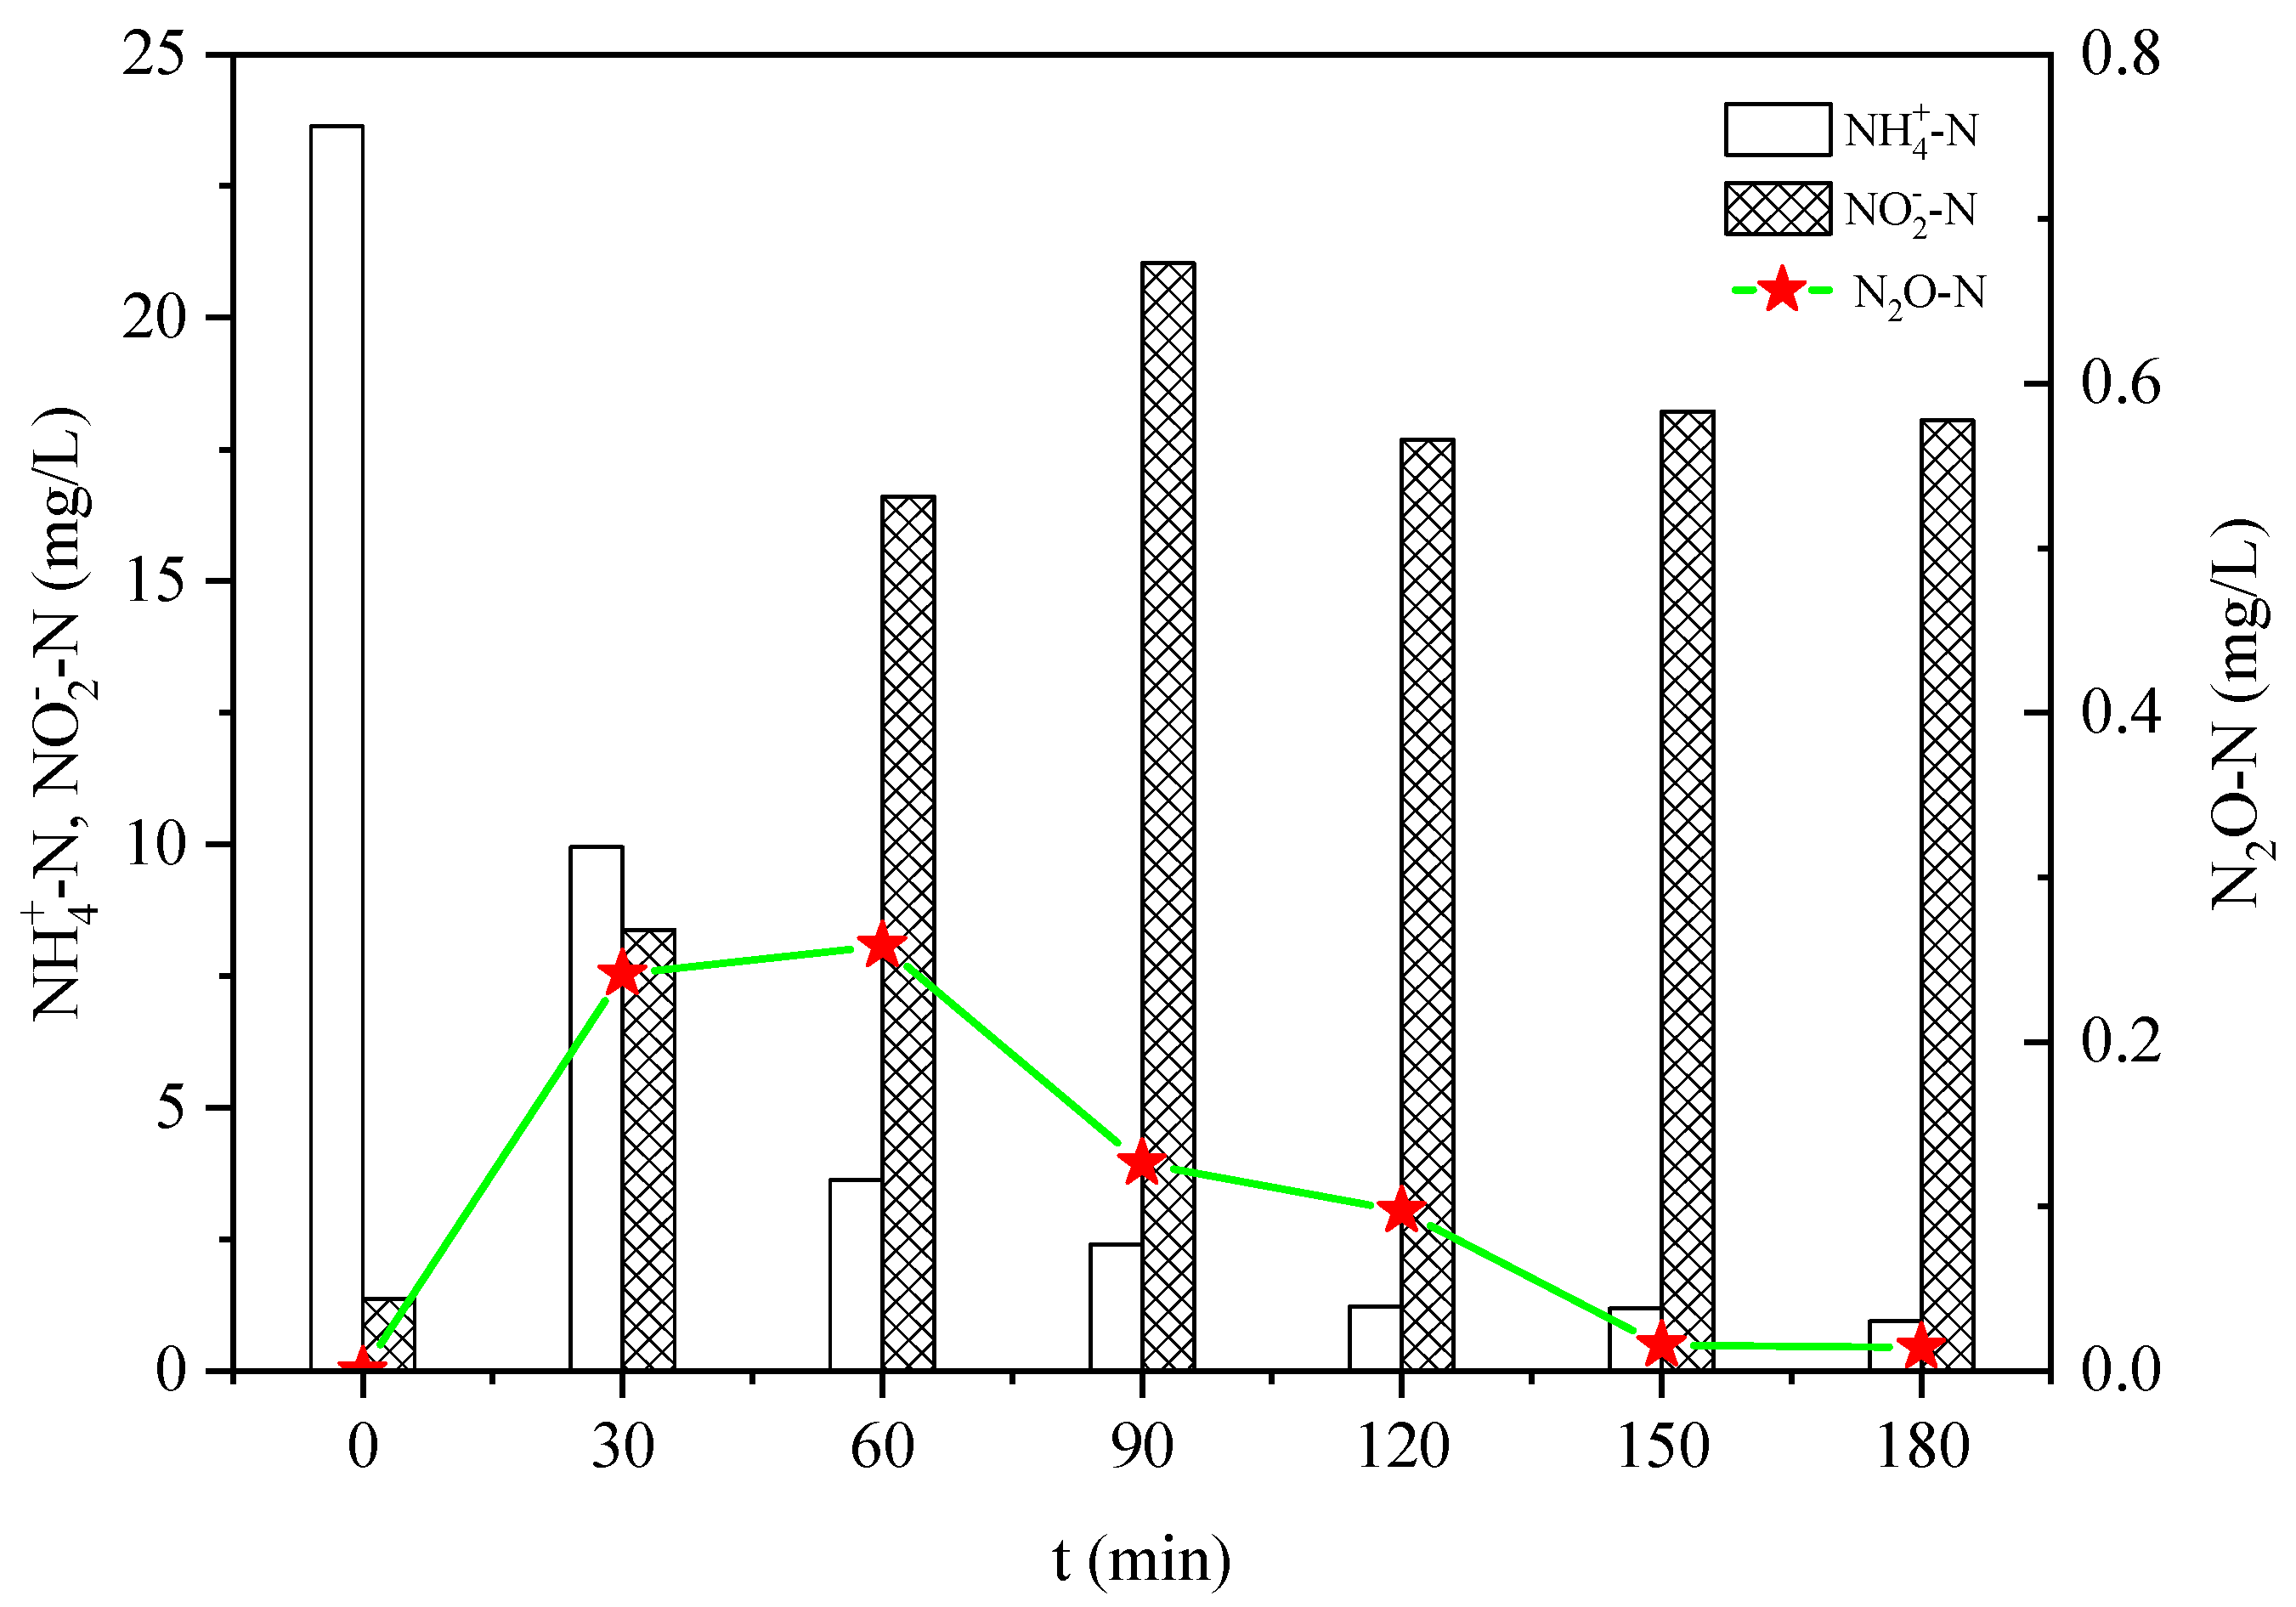
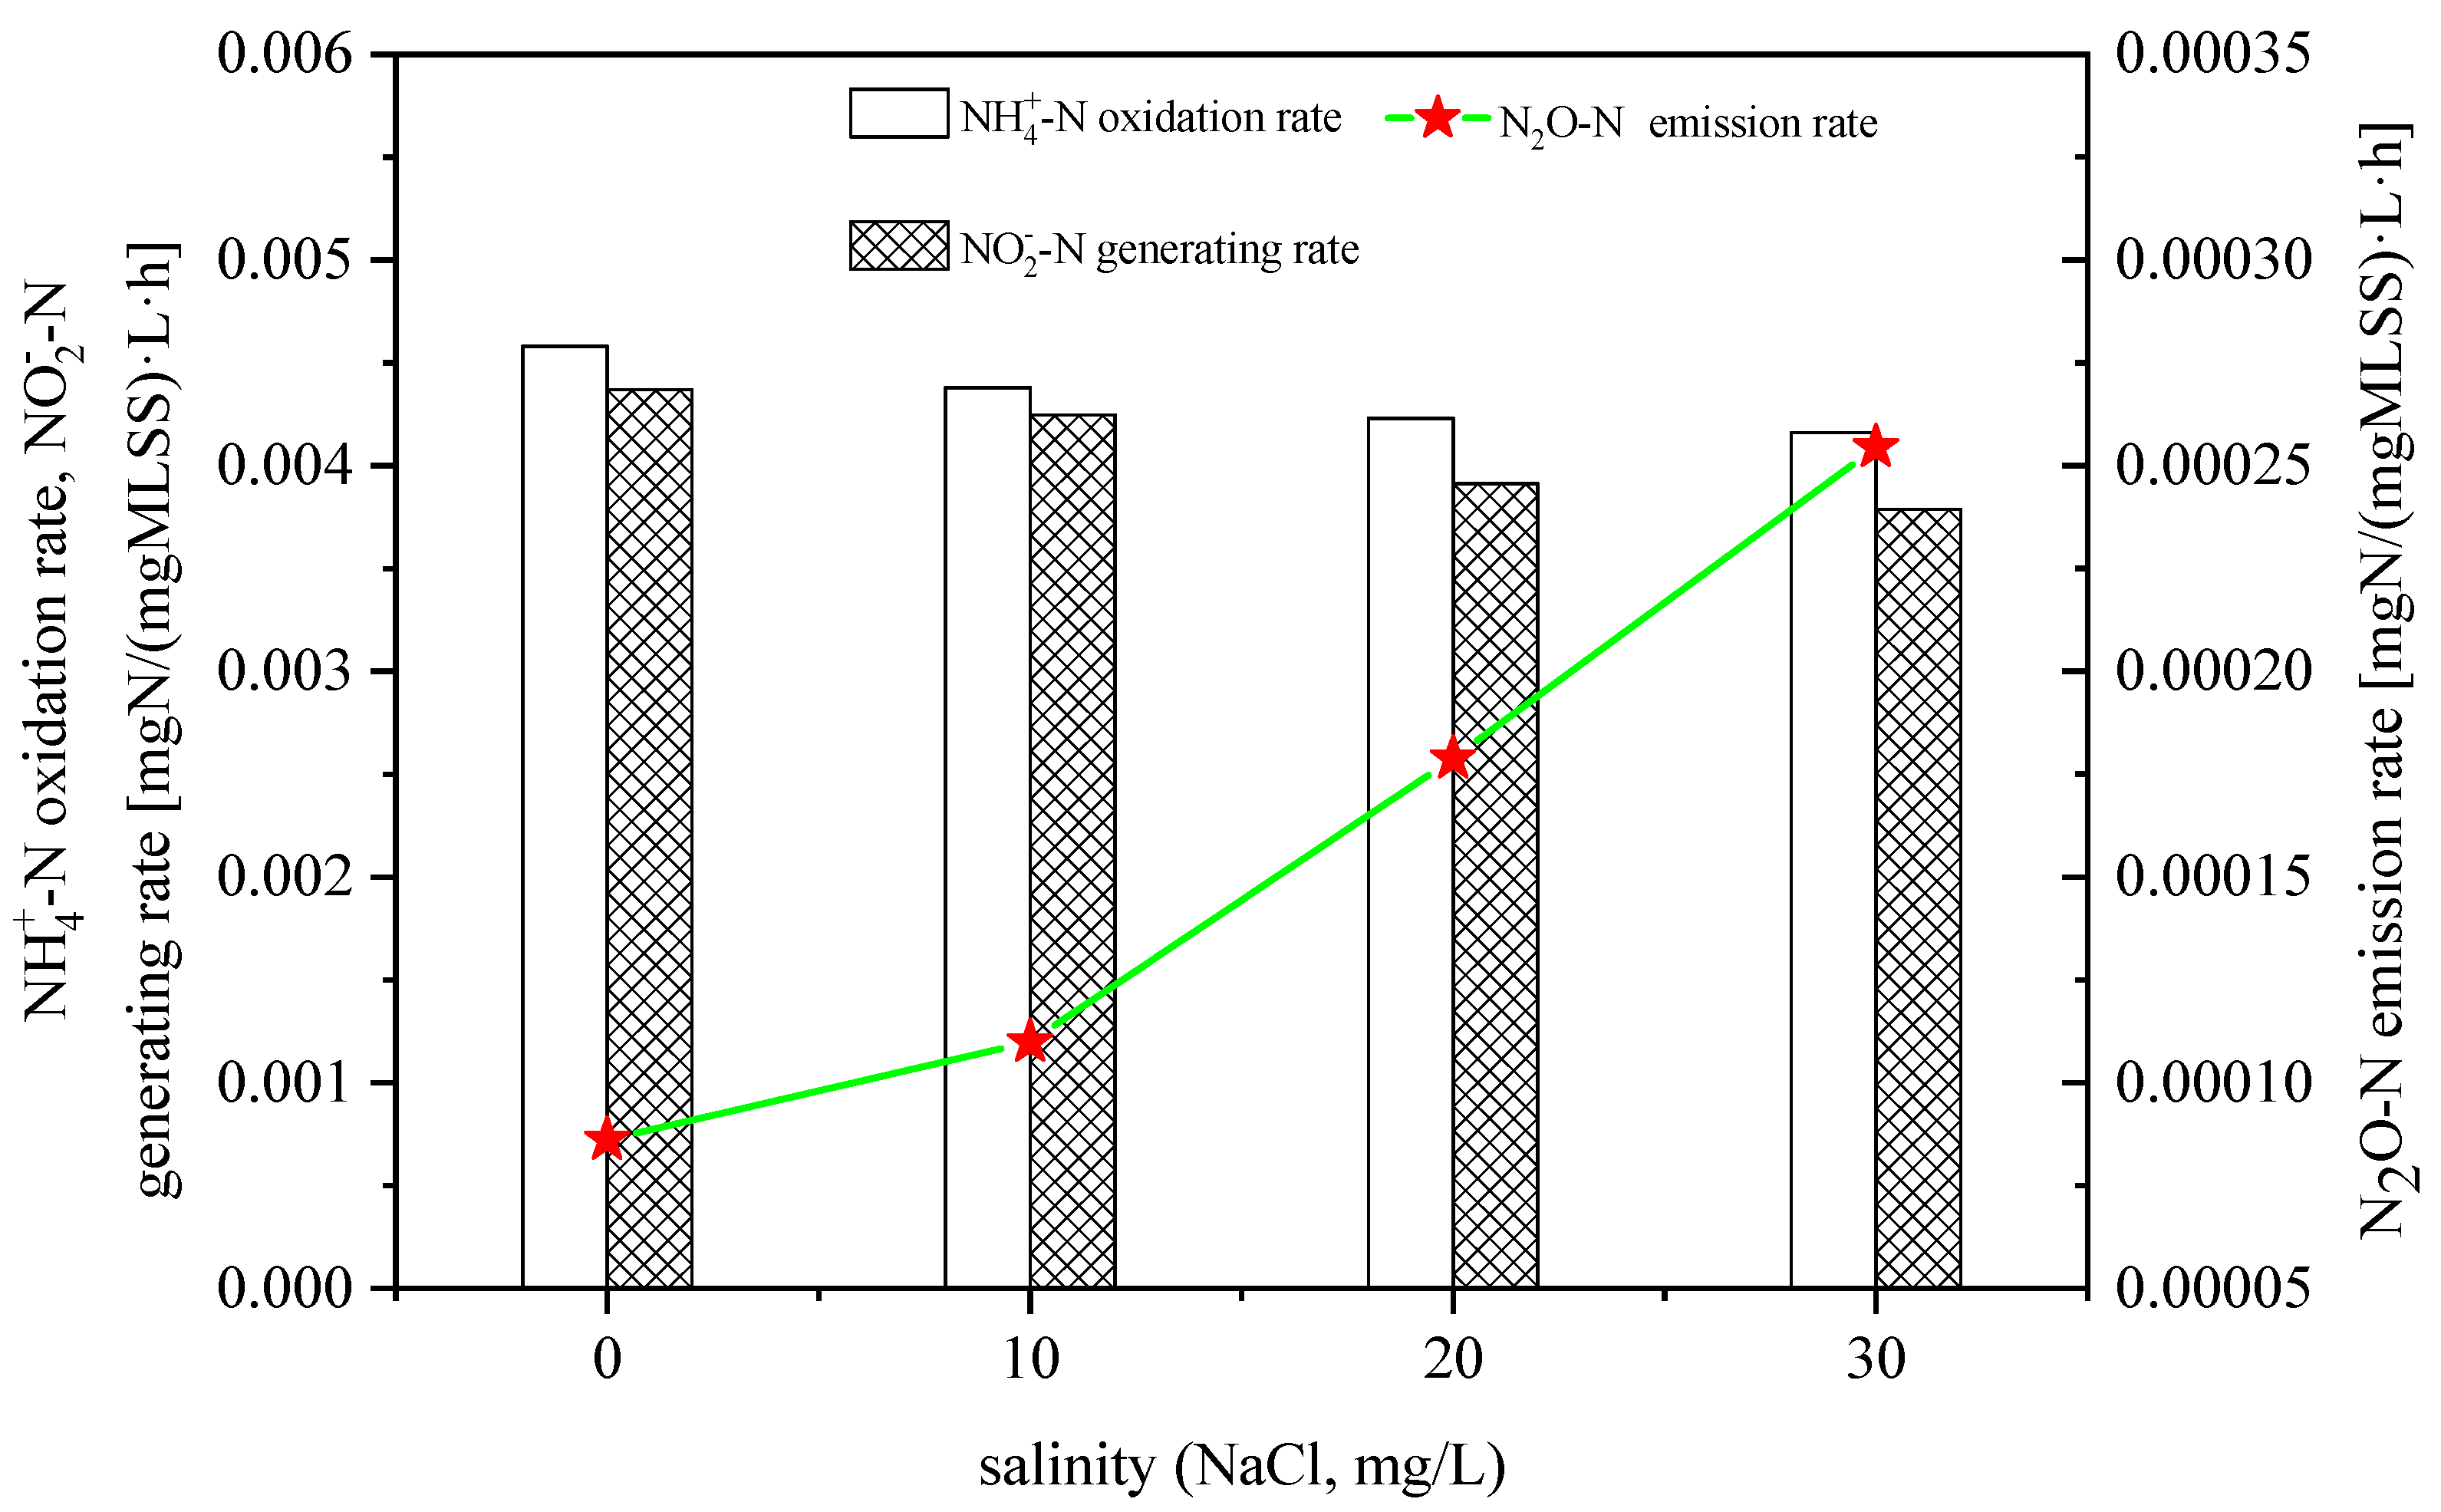
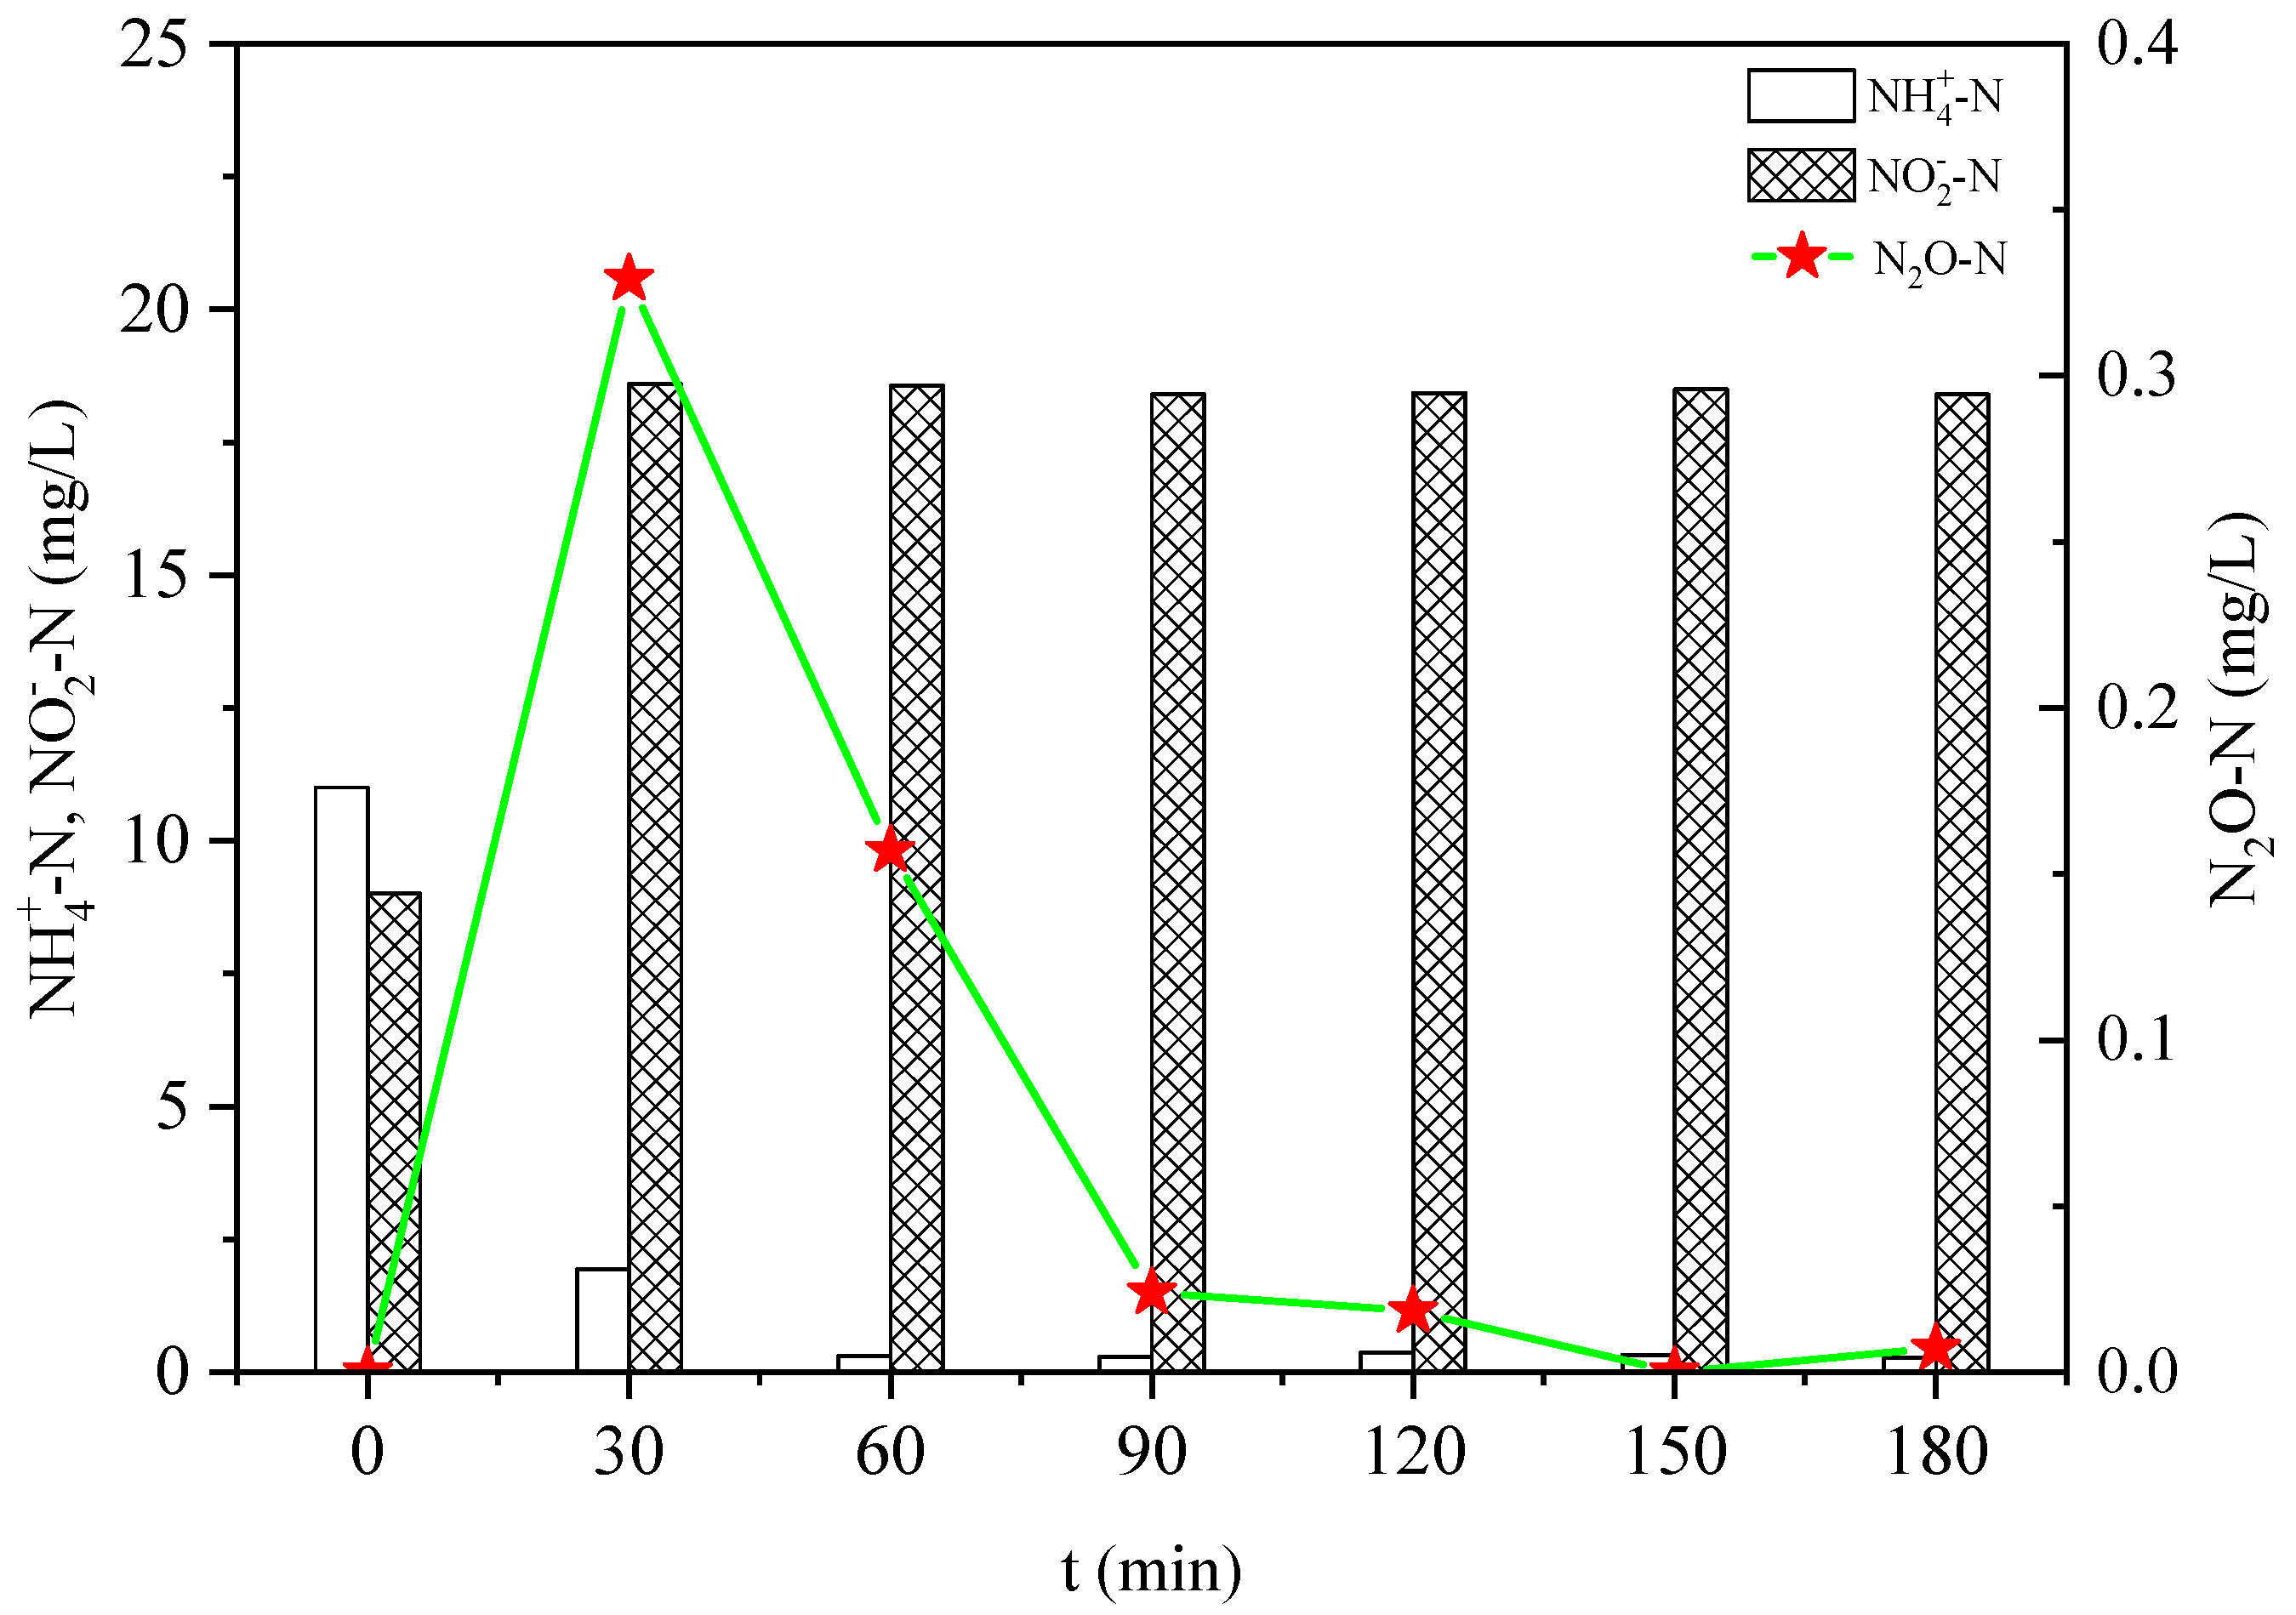
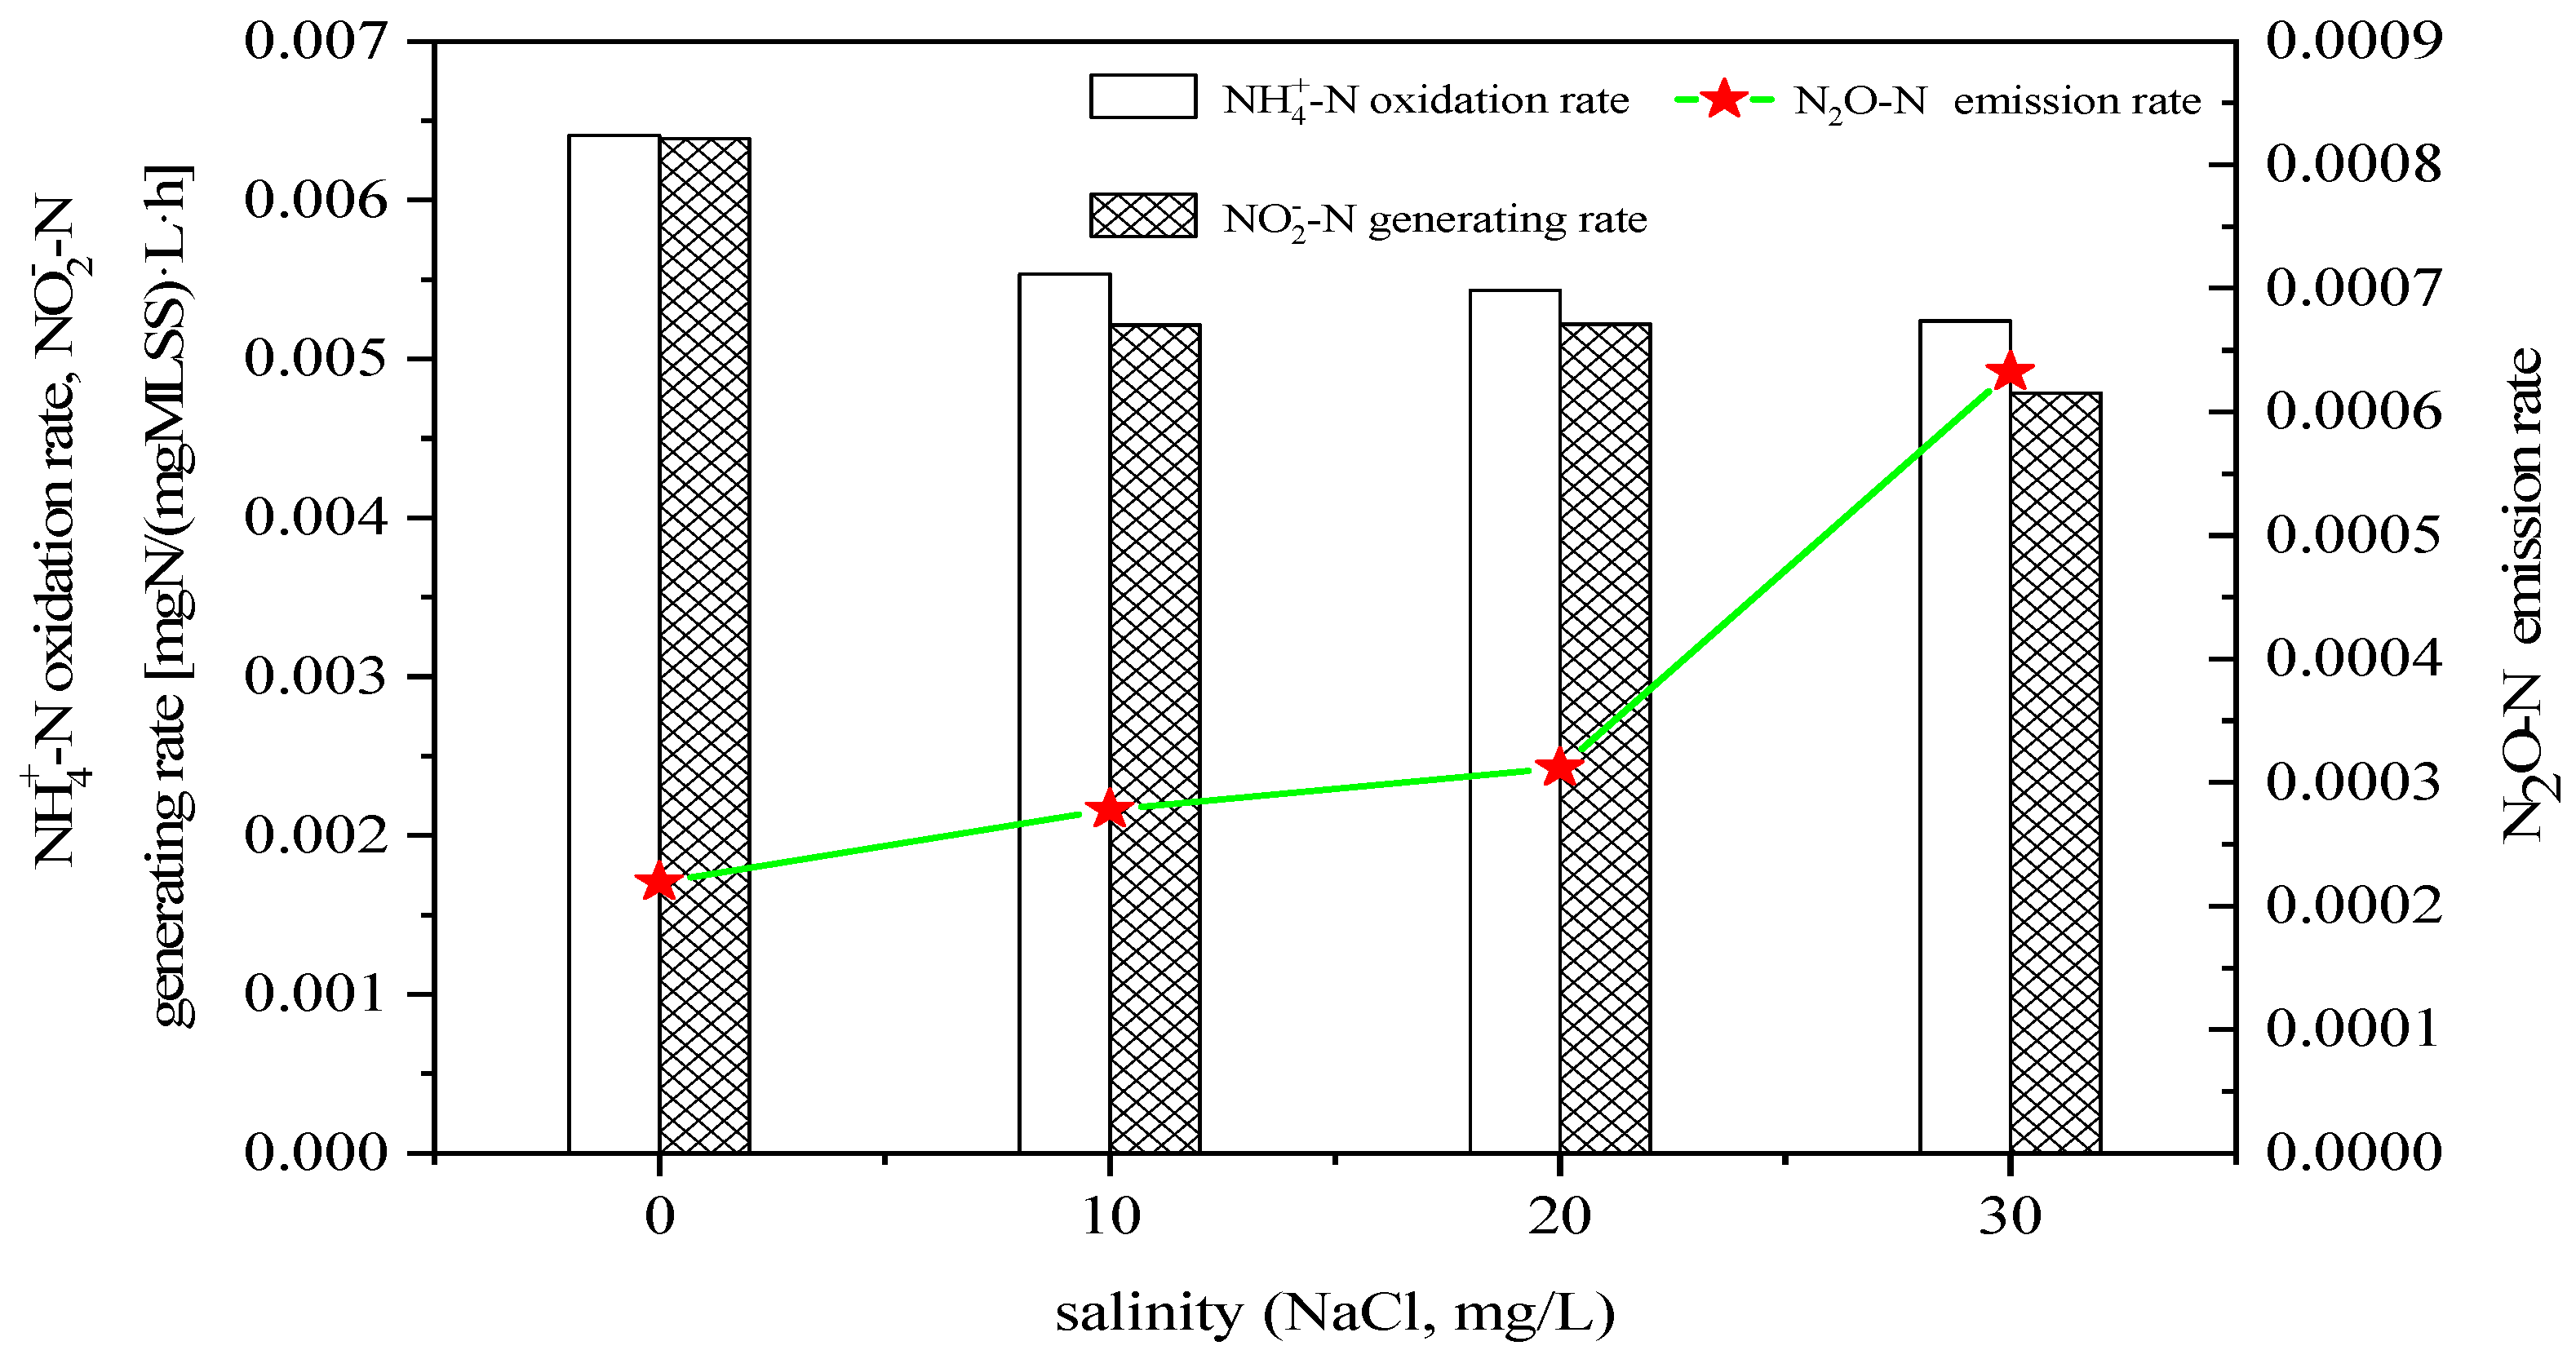
3.1. Effect of Salinity on N2O Emissions in Ammonia Nitrogen Oxidation Process

Figure 2 shows the changes in the nitrogen levels (initial NH4+-N = 20 mg/L) at salinity: 0 mg/L NaCl. The oxidation of NH4+ caused N2O to reach its maximum value (0.26 mg/L) at 60 min. Next, with the gradual completion of NH4+ oxidation, even though there was still a high amount of NO2-N produced in the system, the output of N2O gradually decreased and tended to 0. This indicated that, during the oxidation of NH4+, the NH4+ oxidation process was the source of the electrons produced by the N2O. When the oxidation of NH4+ ended, NO2 could not be denitrified due to the high concentration of no electron donor in the system. During the reaction time of 180 min, the total yield of N2O was 0.75 mg/L.
Figure 3 shows the rate of the nitrogen change in organic-free water (effluent +20 mg/L NH4+-N) under varying salinity gradients. With a gradual increase in the concentration of NaCl in the system from 0 mg/L to 30 mg/L, the oxidation rate of NH4+ and the formation rate of NO2-N showed downward trends. However, the rate of N2O emissions increased from 0.08 mgN/(gMLSS·L·h) to 0.25 mgN/(gMLSS·L·h). This indicated that the increase in salinity increased the N2O emissions in the NH4+ oxidation process of the AOB enrichment system.
During the oxidation of NH3, NH3 is first oxidized to NH2OH under the action of AOB, and then NH2OH is oxidized to NO2 [18]. The first step in this process is catalyzed by ammonia oxidase (AMO), where molecular oxygen acts as an electron acceptor [7]. The second step is performed under the action of hydroxylamine oxidase (HAO), where molecular oxygen is the primary electron acceptor [7]. The current literature has shown that the effect of N2O on AOB might be caused by the following two ways: (1) N2O as a product of the autotrophic denitrification of AOB using NO2 as an electron acceptor [8,11]; or (2) N2O as a byproduct of the incomplete oxidation of hydroxylamine [7,8,9,10]. In the first pathway of N2O production, NO2 is reduced to N2O by NO in the presence of copper-containing enzymes, NO2 reductase and NO reductase. With an increase in salinity, the ammonia oxidation rate and NO2 formation rate both decreased, indicating that the increase in salinity inhibited the nitrification of AOB, which could have been due to the fact that salinity inhibited both AMO and HAO during the oxidation of NH3, resulting in incomplete NH3. The ammonia oxidation rate in the system was always found to be greater than the NO2 generation rate under different gradient salinification, indicating that a part of the generated NO2 was denitrified during NO2 generation (Figure 3). With an increase in salinity, the ammonia oxidation rate and NO2 production rate both decreased, but the N2O emission rate increased, indicating that salinity had an inhibitory effect on the reduction in N2O. The mechanism of action might involve the inhibitory effect of salinity on N2O reductase.

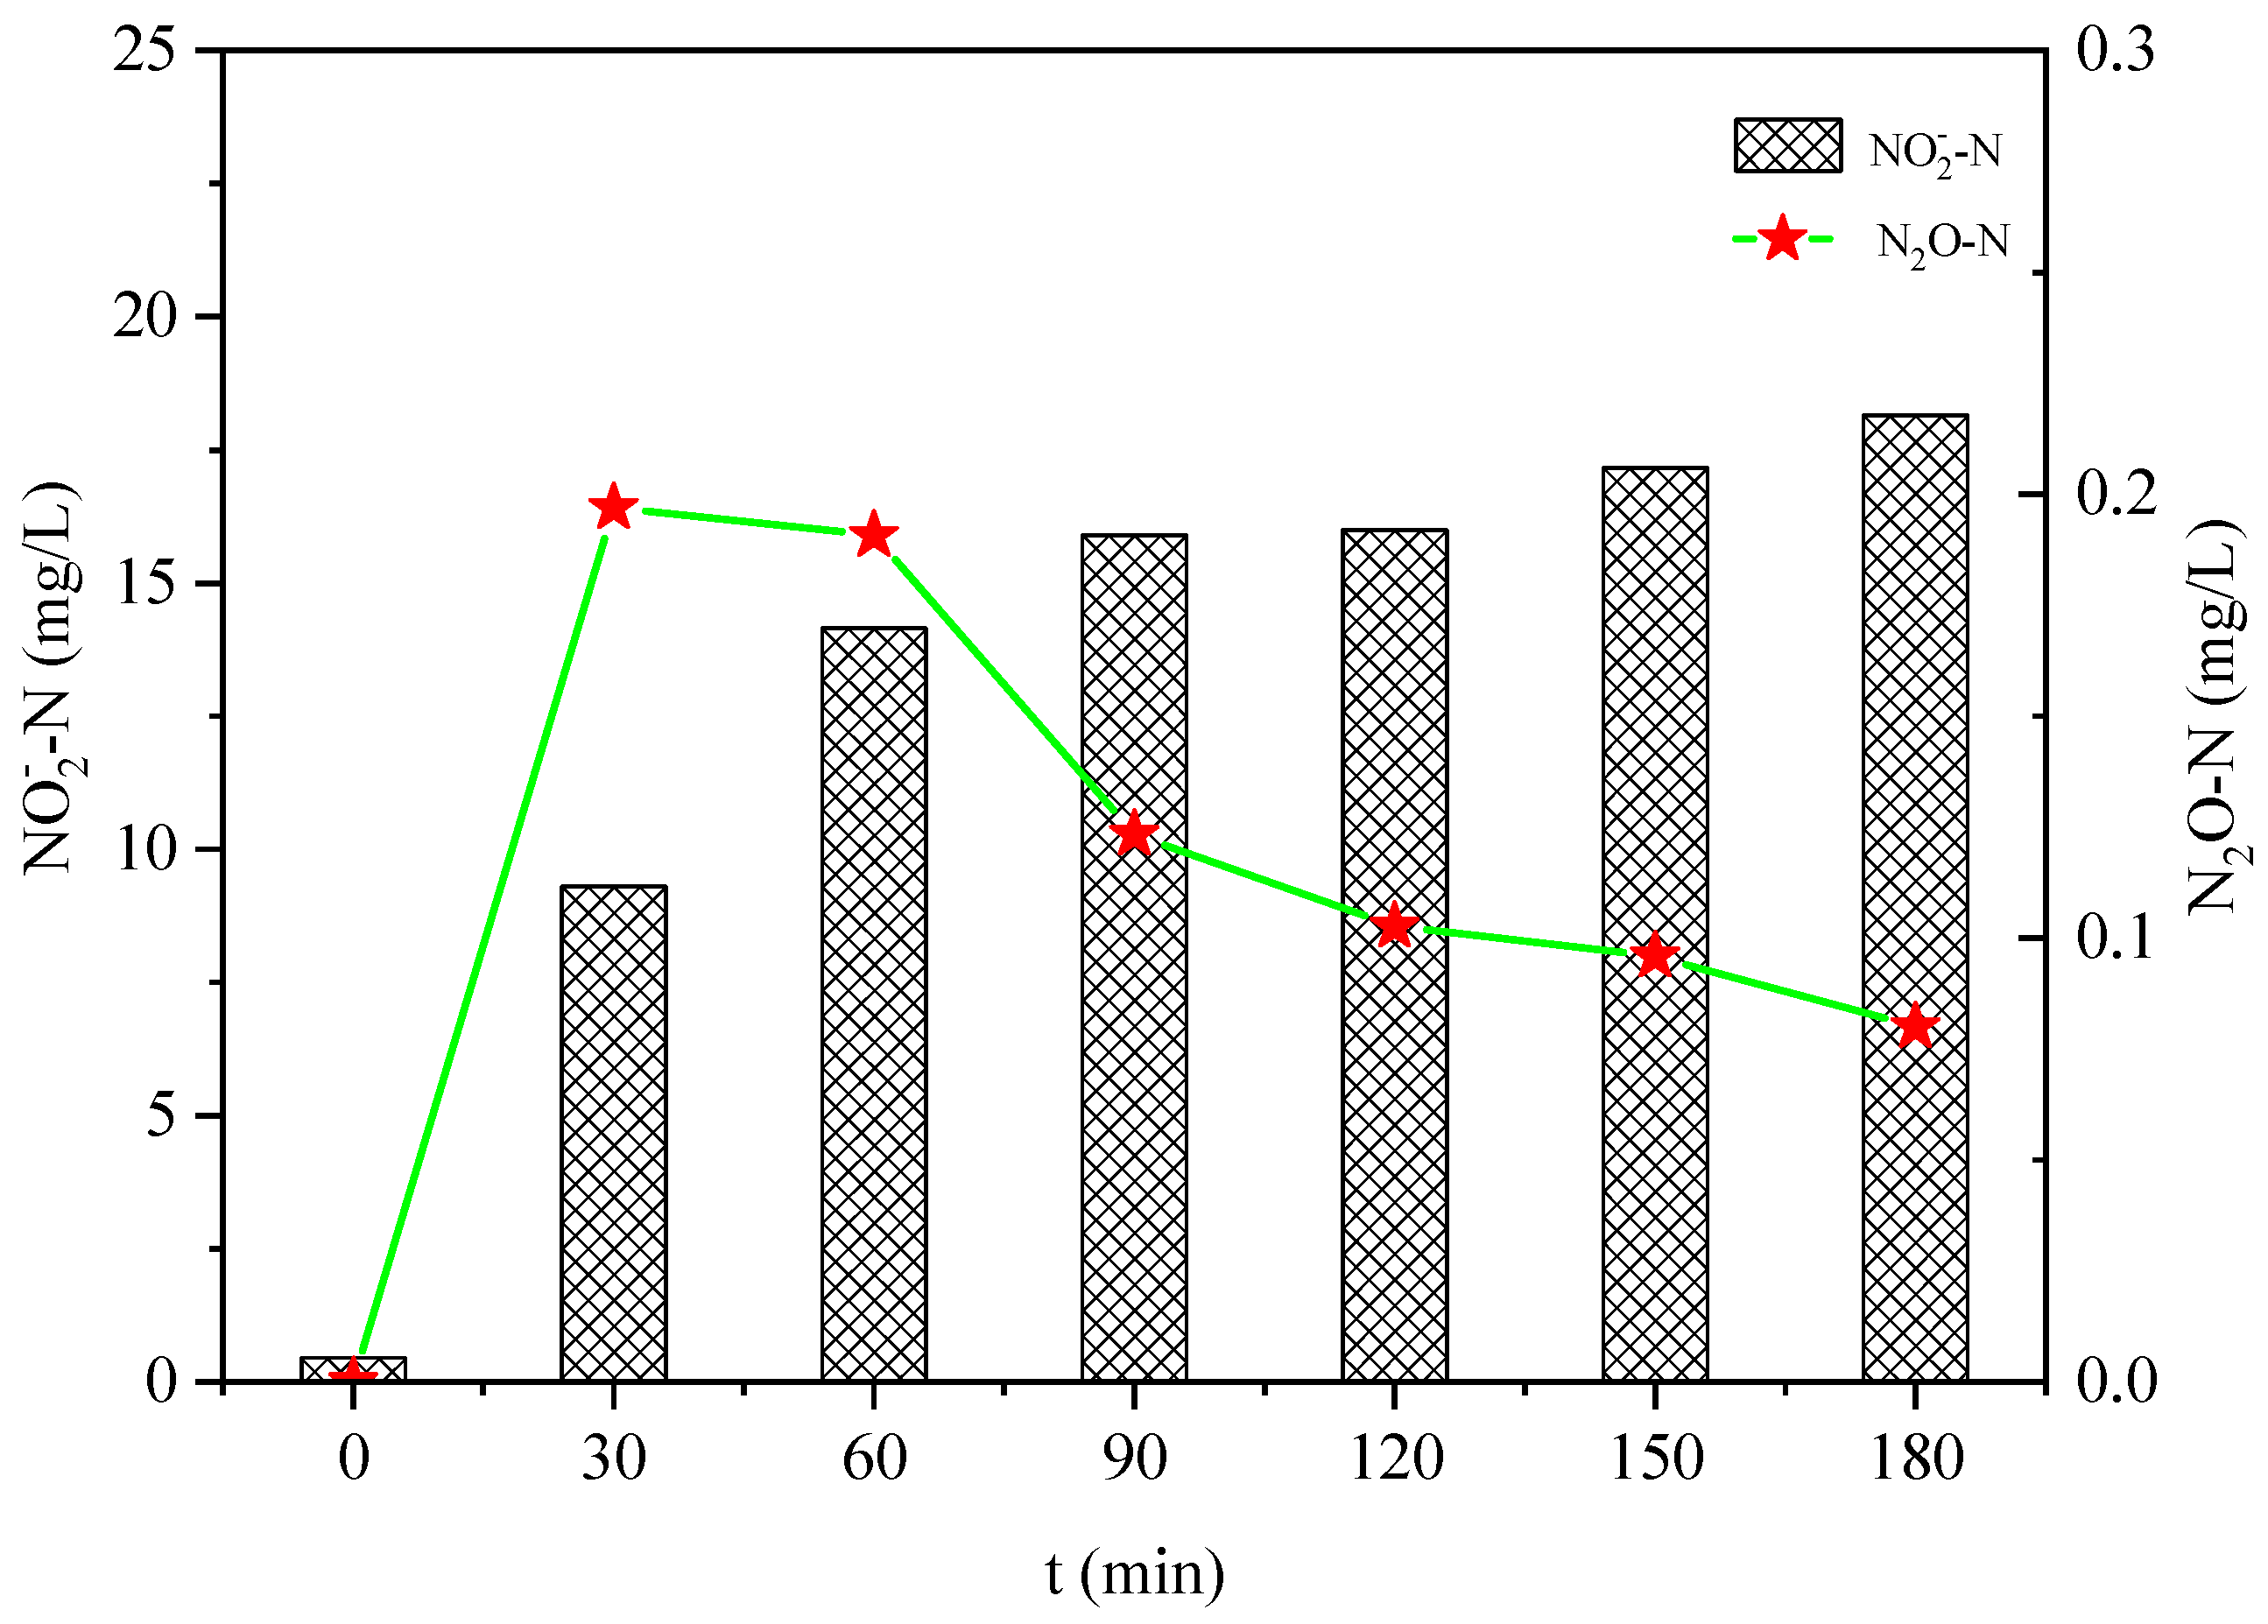
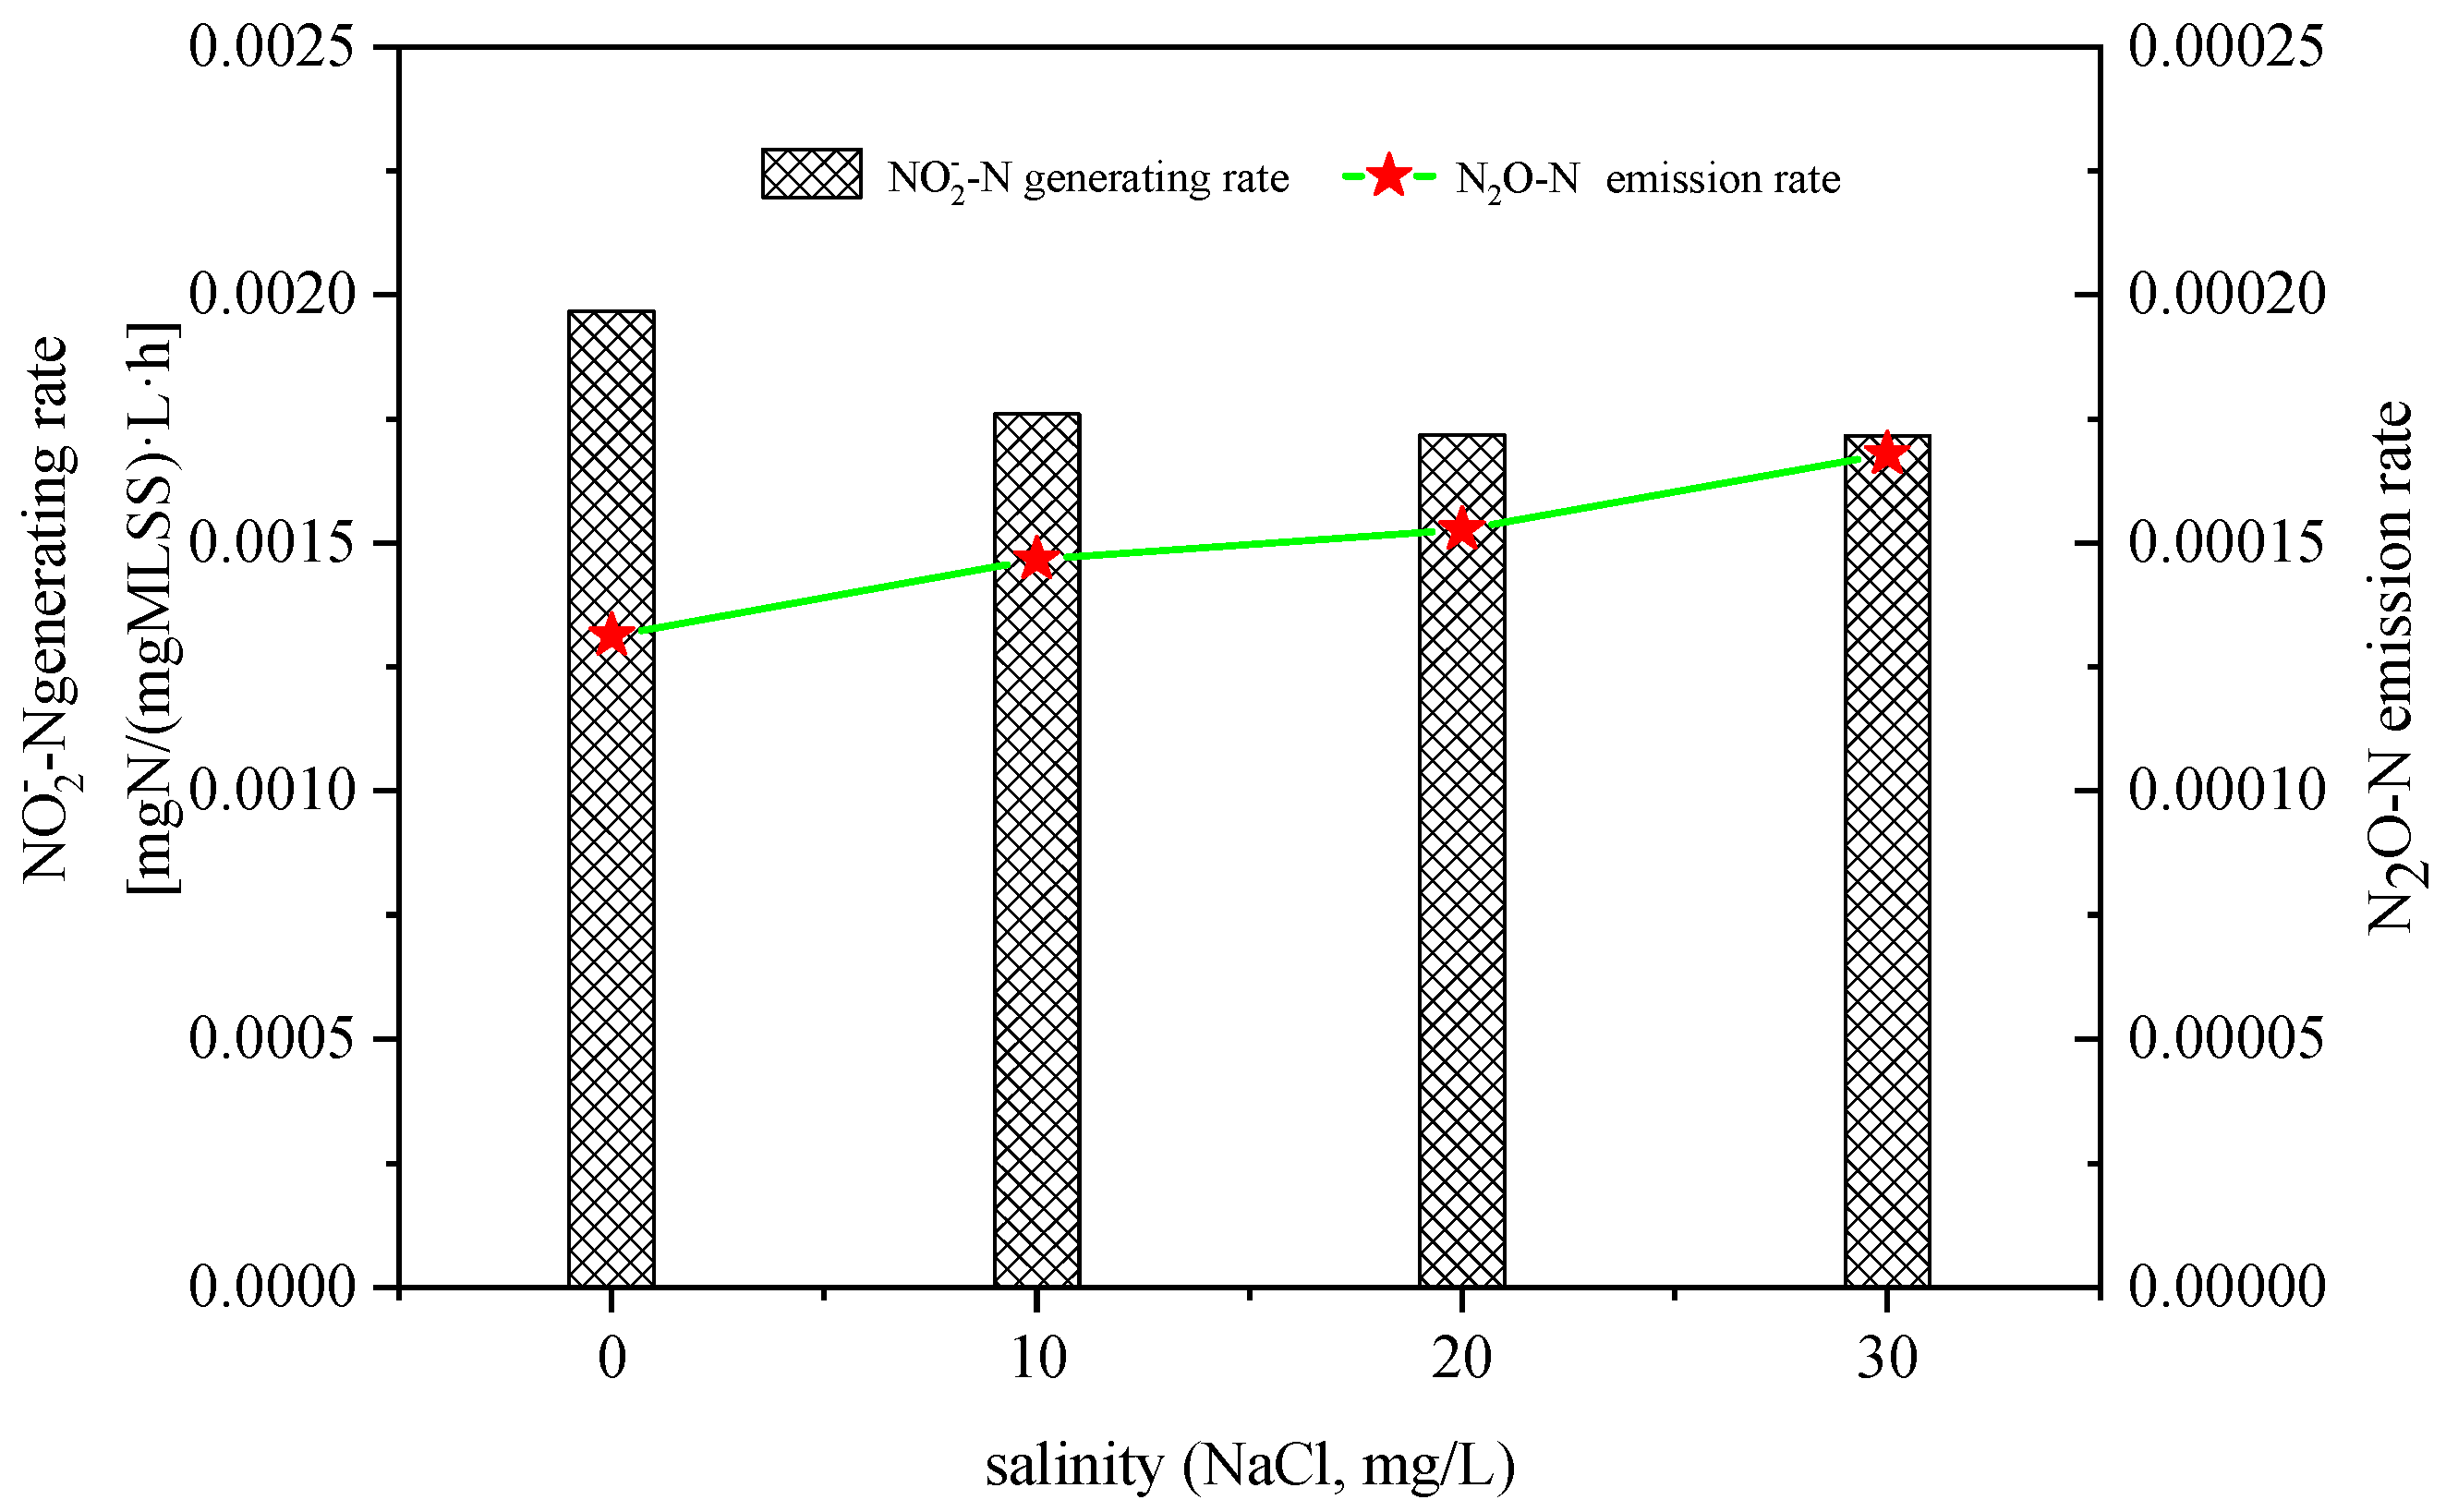
3.2. Effect of Salinity on N2O Emissions in the Hydroxylamine Oxidation Process

Figure 4 shows the change in N2O during the initial addition of 20 mg/L of NH2OH-N when the salinity was 0. When 20 mg/L of NH2OH-N was initially added to the outflow water, the maximum yield of N2O (0.20 mg/L) appeared at 30 min, and the speed of reaching the maximum yield was faster than that of NH4+ alone, which could have been due to the fact that, compared to NH4+, the oxidation from NH2OH was one step less than the oxidation from NH4+. Furthermore, the NO2 levels continued to increase as the reaction progressed, which indicated that NH2OH was being continuously oxidized. With the continuous oxidation of NH2OH, the emissions of N2O decreased in turn. During the reaction time of 180 min, the total yield of N2O was 1.19 mg/L.
Figure 5 shows the trend in the variation of N2O during the oxidation of NH2OH at salinity = 0. With a gradual increase in salinity from 0 mg/L to 30 mg/L, the rate of NO2 generation showed a downward trend, i.e., 0.00197 mgN/(gMLSS·L·h) and 0.00172 mgN/(gMLSS·L·h) at 0 mg/L and 30 mg/L, respectively. The N2O emission rate increased from 0.13 mgN/(gMLSS·L·h) at a salinity of 0 mg/L to 0.17 mgN/(gMLSS·L·h) at a salinity of 30 mg/L. This suggested that an increase in salinity increased the N2O emissions in the hydroxylamine oxidation process with the salinity load.
Figure 2 and Figure 4 show that the total amount of N2O emissions with the initial addition of 20 mg/L of NH2OH in the outflow water was more than that produced by the initial addition of 20 mg/LNH4+, which was the same as that reported by Kim [11] and Wunderlin [19]. The study by Kim reported that four electrons were produced during the NO2 oxidation by NH2OH from HAO, of which two electrons were consumed during the NH4+ oxidation to NH2OH from AMO; thus, only two electrons were used for the autotrophic denitrification of NO2.
However, when NH2OH was used as a nitrification substrate, all four electrons were used for the autotrophic denitrification of NO2, resulting in a greater N2O production. The NO2 production rate showed a downward trend under four salinity gradients, indicating that the nitrification with NH2OH as substrate was inhibited, which could have been due to the salinity-induced inhibition of hydroxylamine oxidase (HAO) (Figure 5). When NO2 decreased with an increase in salinity, the N2O emissions increased with an increase in salinity, which could have been due to the inhibitory effect of salinity on N2O reductase during the autotrophic denitrification of AOB using NO2 as an electron acceptor.

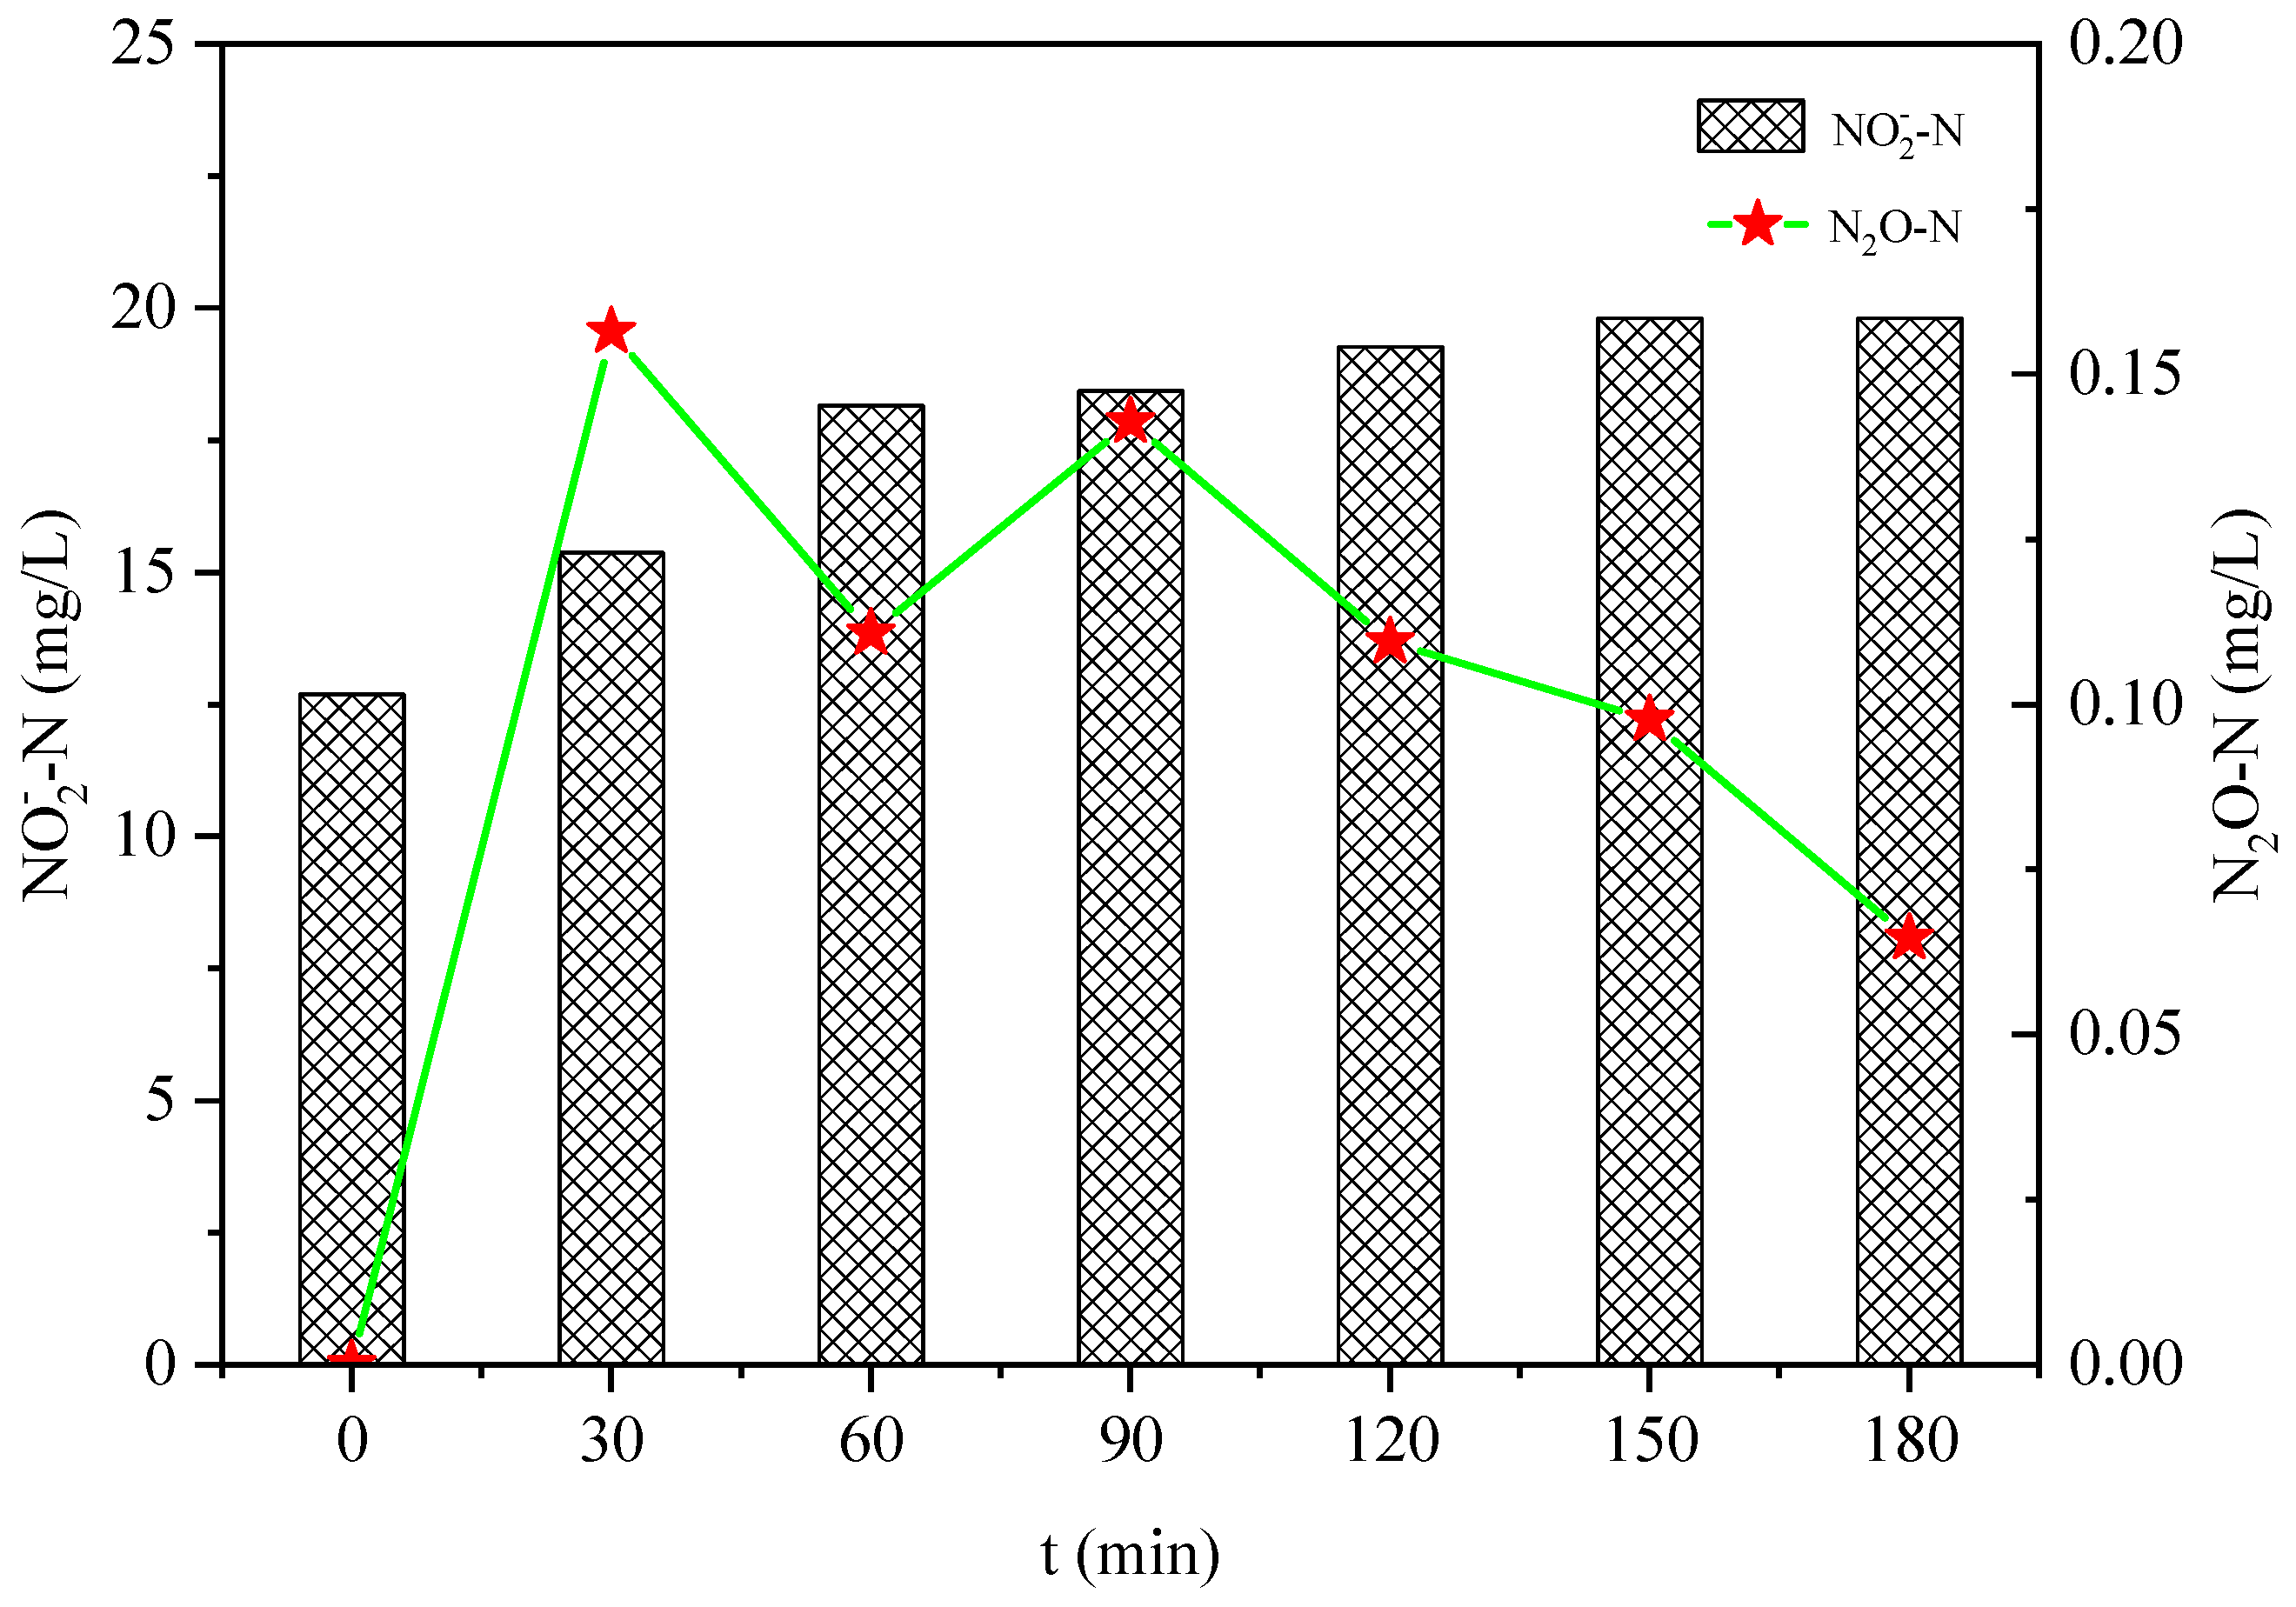
3.3. Effect of Salinity on N2O Emissions in the Autotrophic Denitrification Process

Figure 6 shows the variation trend in N2O during the autotrophic denitrification at salinity = 0. In this experiment, 10 mg/L of NH4+-N and 10 mg/L of NO2-N were added to the mud–water mixture of the partial nitrification effluent, and then nitrification was performed at 0.5 mg/L DO. With the oxidation of NH4+-N, N2O rapidly reached its maximum value (0.33 mg/L) at 30 min. In this reaction process, both the N2O emissions due to the oxidation of NH4+-N itself and the electrons provided by the oxidation of NH4+-N were used to conduct denitrification, with the addition of NO2 as an electron acceptor. In the whole reaction process, the total N2O emissions were 0.54 mg/L. The study by Kim [11] showed that the autotrophic denitrification of AOB in the nitrification process is the primary pathway for N2O emissions. Therefore, in this experiment, the effect of salinity on the N2O emissions during autotrophic denitrification was mainly affected.
Figure 7 shows the variation trend in N2O in autotrophic denitrification under the influence of salinity. There was a decrease in the oxidation rate of NH4+-N with an increase in salinity, and the formation rate of NO2-N also decreased with an increase in salinity. There was a successive increase in the emission rate of N2O-N with an increase in the salinity load. At salinity = 0 mg/L, 10 mg/L, 20 mg/L, and 30 mg/L, the values were 0.22 mgN/(gMLSS·L·h), 0.28 mgN/(gMLSS·L·h), 0.31 mgN/(gMLSS·L·h), and 0.63 mgN/(gMLSS·L·h). At salinity (0 mg/L to 20 mg/L), the rate of N2O emissions increased relatively slowly. At salinity = 30 mg/L, the formation rate of N2O-N rapidly increased to 0.63 mgN/(gMLSS·L·h). This indicated that an increase in salinity resulted in an increase in N2O emissions during partial nitrification.
Figure 8 shows the variation trend in N2O during autotrophic denitrification (10 mg/LNH2OH-N and 10 mg/L NaNO2-N) under the influence of salinity. There was a rapid increase in N2O-N to 0.16 mg/L at 30 min. The NaNO2 levels increased during the whole reaction process, which indicated that NH2OH was continuously oxidized by microorganisms. As the reaction progressed, there was an insignificant increase in NO2-N, and the N2O emissions were stabilized and gradually declined, which indicated that the presence of NH2OH was critical for the N2O emissions. During the whole reaction process, the total N2O emissions were 0.68 mg/L.
Figure 9 shows the variations in the nitrogen rate during autotrophic denitrification (10 mg/LNH2OH-N and 10 mg/L NaNO2-N) under the influence of salinity. The formation rate of NO2-N decreased with an increase in salinity. At salinity = 0 mg/L, 10 mg/L, 20 mg/L, and 30 mg/L NaCl, the formation rates of NO2-N were as follows: 0.79 mgN/(gMLSS·L·h), 0.75 mgN/(gMLSS·L·h), 0.71 mgN/(gMLSS·L·h), and 0.69 mgN/(gMLSS·L·h), respectively. However, the N2O emission rate showed a gradual upward trend, with N2O production rates of 0.10 mgN/(gMLSS·L·h), 0.11 mgN/(gMLSS·L·h), 0.12 mgN/(gMLSS·L·h), and 0.18 mgN/(gMLSS·L·h), respectively. At salinity levels of < 30 mg/L, the increasing trend of N2O was not apparent, but at salinity = 30 mg/L, the N2O rapidly increased to 0.18 mgN/(gMLSS·L·h).
For nitrification using NH4+ and NH2OH as substrates, the formation rate of NO2 showed a downward trend, but the N2O emissions increased with an increase in salinity. This indicated that high levels of salinity had an inhibitory effect on N2O reductase; consequently, the N2O emissions of AOB in autotrophic denitrification with NO2 as an electron acceptor could not be further reduced, in turn increasing N2O emissions.

3.4. Effect of Salinity on N2O Emissions of Heterotrophic Denitrification during the Nitrification Process

Figure 10 shows the variation in the N2O emissions during heterotrophic denitrification under the influence of salinity. When 20 mg/L of NH2OH-N was added to the partial nitrification effluent, the N2O of the nitrification process mainly resulted from the self-oxidation of NH2OH and autotrophic denitrification of AOB. However, when 20 mg/L of NH2OH-N and ATU were added to the influent, the nitrification began with the oxidation of NH2OH, because ATU could completely inhibit the oxidation of NH4+. However, since there was a greater amount of biostable organic matter in the inlet than in the effluent, the available organic matter might have affected the N2O emissions during nitrification. The total N2O yield of the influent water used as test water was reduced from that of the effluent water. The N2O emissions after the reduction were not 0, which could have been due to the denitrification of NO2 by heterotrophic bacteria using organic matter during the nitrification (Figure 10). When in the effluent water, the N2O emissions of the NH2OH oxidation and AOB autotrophic denitrification increased with an increase in salinity, and the values under four salinity gradients were 0.79 mg/L, 1.02 mg/L, 1.08 mg/L, and 1.19 mg/L, respectively. The N2O emissions due to the denitrification of heterotrophic bacteria also increased with an increase in salinity, and the values were 0.017 mg/L, 0.024 mg/L, 0.044 mg/L, and 0.067 mg/L, respectively. The ratios of the N2O emissions due to heterotrophic denitrification to the total N2O emissions of the influent as the test object were: 2.1%, 2.3%, 3.9%, and 5.4%, respectively. During nitrification, the N2O produced by heterotrophic denitrification could not be ignored, and the effect of the N2O emissions due to heterotrophic denitrification was enhanced at a high salinity. This could have been due to the inhibitory effect of salinity on N2O reductase.

4. Conclusions

This study investigated the AOB enrichment system cultured in actual domestic wastewater along with the influence of salinity on N2O emissions in a partial nitrification system and their mechanism. The following conclusions were drawn:
(1)
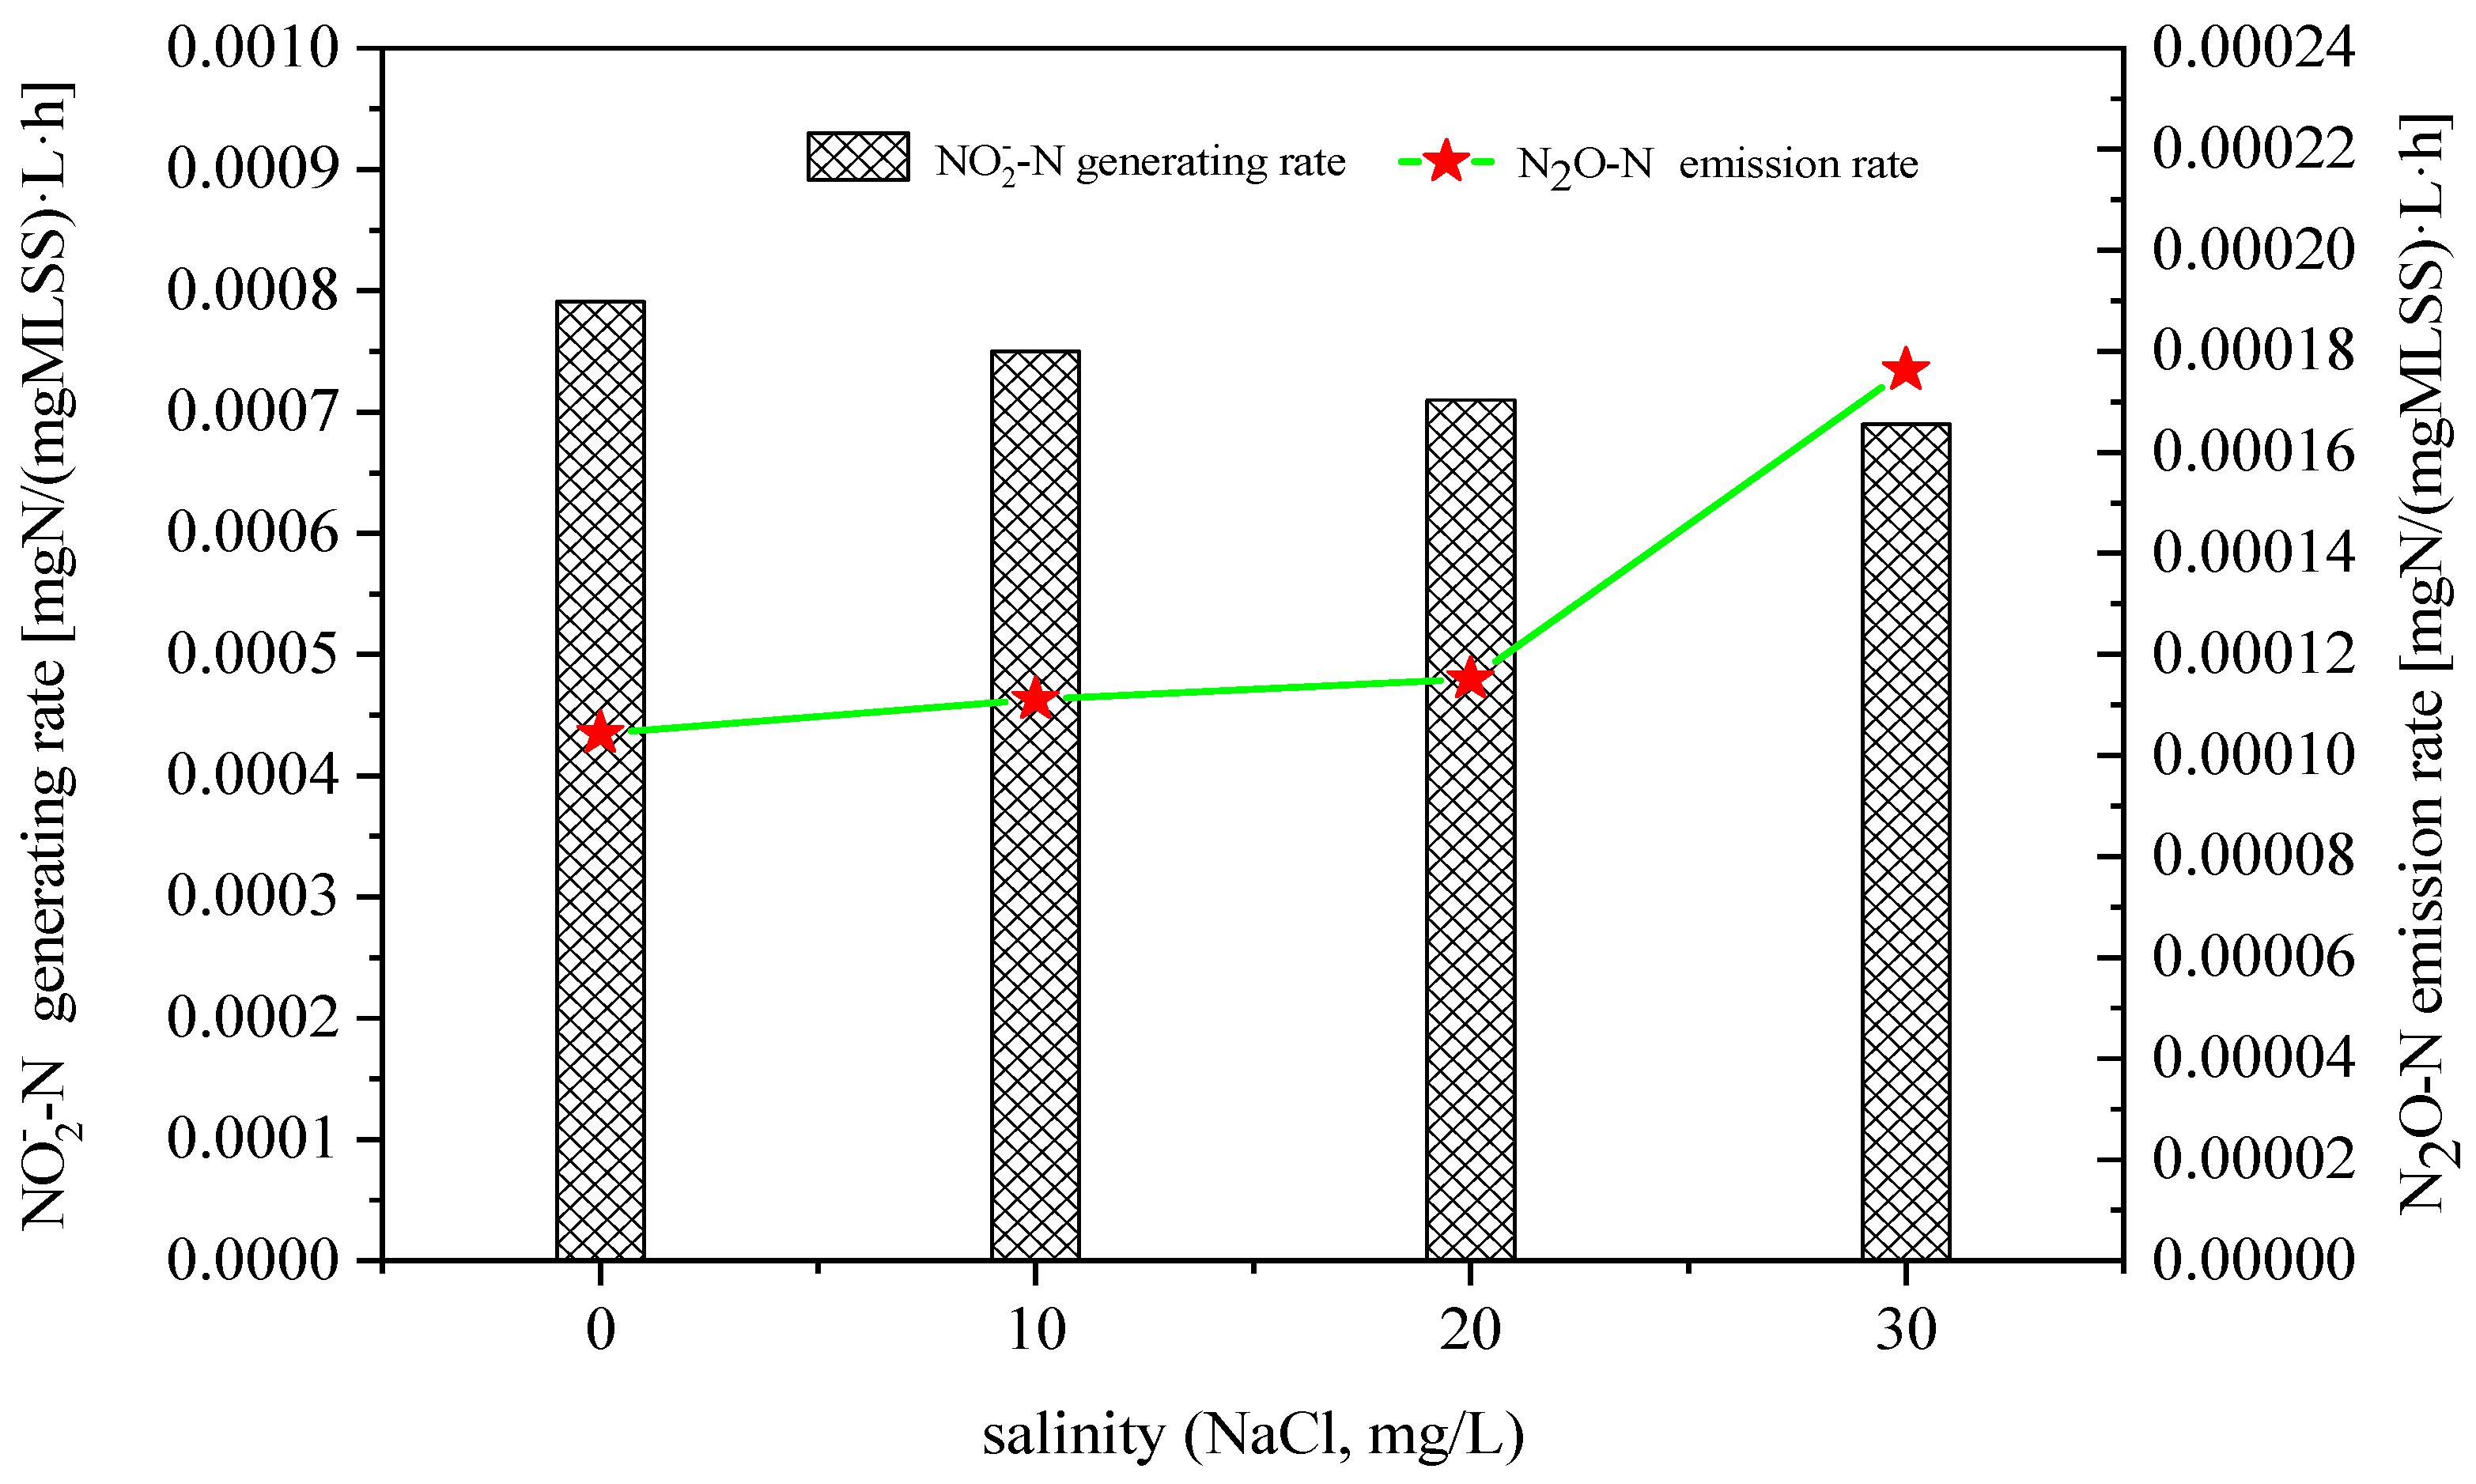
The increase in salinity decreased the oxidation rate of NH4+ and the formation rate of NO2 during the reaction.
(2)
The increase in salinity increased the N2O emissions during the oxidation of NH4+ and NH2OH, and decreased the production rate of NO2-N during the oxidation of hydroxylamine.
(3)
The total amount of N2O emissions in the hydroxylamine oxidation process was less than that during ammonia nitrogen oxidation, and more NO2 might have been reduced to N2 instead of N2O during hydroxylamine oxidation.
(4)
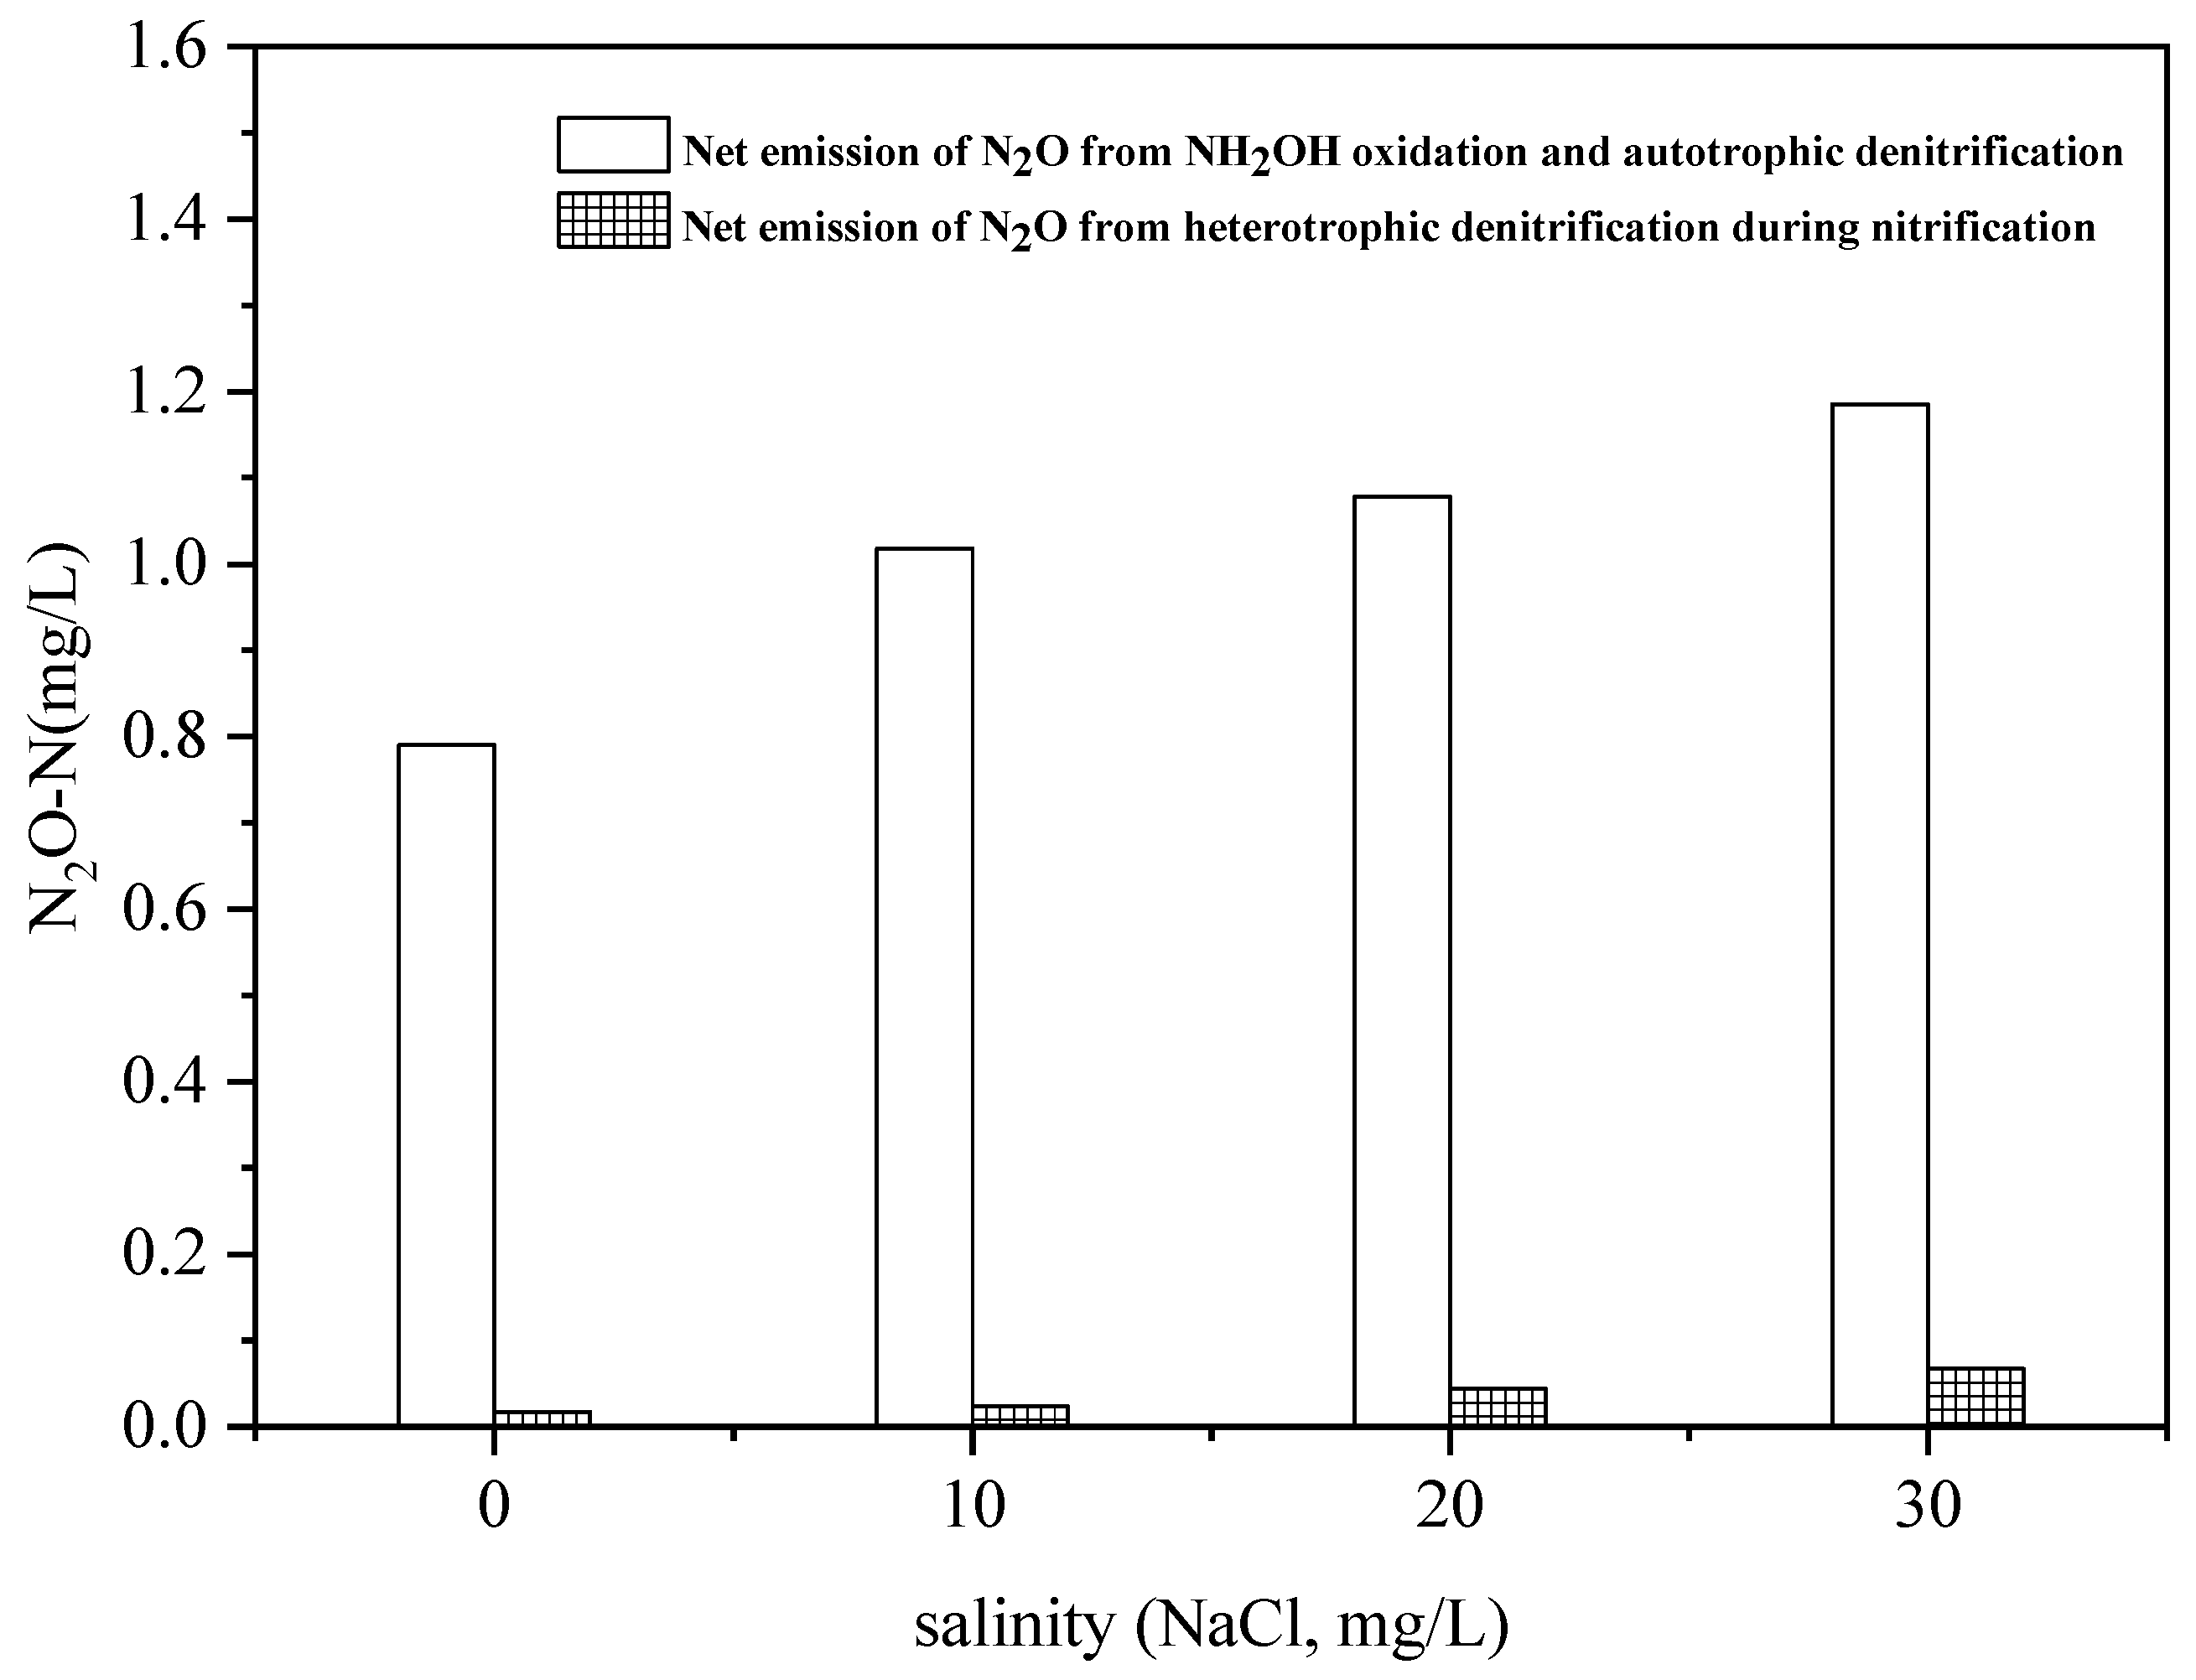
During partial nitrification with the available organic matter, the N2O emissions due to heterotrophic denitrification by heterotrophic bacteria could not be ignored, and the increase in salinity could increase the amount of N2O emissions due to heterotrophic denitrification.

Author Contributions

P.L.: Investigation, Sampling, Data curation, Writing—original draft; Y.L. and Y.W.: review & editing; S.W.: Resources, Funding acquisition; Y.P.: Supervision, Visualization. S.W. and P.L.: Resources, Funding acquisition. All authors have read and agreed to the published version of the manuscript.

Funding

This research project was financially supported by National Key R&D Program of China (Grant No. 2021YFC3200601), Yancheng Institute of Technology’s Start-up Research Fund (1542036) and Innovation and Enterprise Program for College Students (15100211).

Data Availability Statement

The original data is backed up on my computer, ready for investigation.

Conflicts of Interest

The authors declare that they have no known competing financial interests or personal relationships that could have appeared to influence the work reported in this paper.

References

  1. Wu, Z.; Zhang, G. The practice of flushing toilets with seawater in Hong Kong. Water Supply Drain. China 2000, 16, 49–50. [Google Scholar]
  2. Zhang, Z.; Sato, Y.; Dai, J.; Chui, H.K.; Daigger, G.; Van Loosdrecht, M.C.M.; Chen, G. Flushing Toilets and Cooling Spaces with Seawater Improve Water-Energy Securities and Achieve Carbon Mitigations in Coastal Cities. Environ. Sci. Technol. 2023, 57, 5068–5078. [Google Scholar] [CrossRef] [PubMed]
  3. Cantelon, J.A.; Guimond, J.A.; Robinson, C.E.; Michael, M.A.; Kurylyk, B.L. Vertical Saltwater Intrusion in Coastal Aquifers Driven by Episodic Flooding: A Review. Water Resour. Res. 2022, 58, 43–1397. [Google Scholar] [CrossRef]
  4. IPCC. Climate Change 2021: The Scientific Basis; Cambridge University Press: Cambridge, MA, USA, 2021. [Google Scholar]
  5. Kampschreur, M.J.; Temmink, H.; Kleerebezem, R.; Jetten, M.S.; van Loosdrecht, M.C. Nitrous oxide emission during wastewater treatment. Water Res. 2009, 43, 4093–4103. [Google Scholar] [CrossRef] [PubMed]
  6. Tallec, G.; Gamier, J.; Billen, G.; Gousailles, M. Nitrous oxide emissions from secondary activated sludge in nitrifying conditions of urban wastewater treatment plants: Effect of oxygenation level. Water Res. 2006, 40, 2972–2980. [Google Scholar] [CrossRef] [PubMed]
  7. Arp, D.J.; Stein, L.Y. Metabolism of inorganic N compounds by ammonia-oxidizing bacteria. Crit. Rev. Biochem. Mol. Biol. 2003, 38, 471–495. [Google Scholar] [CrossRef] [PubMed]
  8. Chandran, K.; Stein, L.Y.; Klotz, M.G.; van Loosdrecht, M.C.M. Nitrous oxide production by lithotrophic ammonia-oxidizing bacteria and implications for engineered nitrogen-removal systems. Biochem. Soc. Trans. 2011, 39, 1832–1837. [Google Scholar] [CrossRef]
  9. Law, Y.; Ni, B.J.; Lant, P.; Yuan, Z. N2O production rate of an enriched ammonia oxidizing bateria culture exponentially correlates to its ammonia oxidation rate. Water Res. 2012, 46, 3409–3419. [Google Scholar] [CrossRef]
  10. Stein, L.Y. Surveying N2O-producing pathways in bacteria. In Methods Enzymology: Research on Nitrification and Related Processes; Klotz, M.G., Ed.; Academic Press: Edmonton, AB, Canada, 2010; pp. 131–152. [Google Scholar]
  11. Kim, S.; Miyahara, M.; Fushinobu, S.; Wakagi, T.; Shoun, H. Nitrous oxide emission from nitrifying activated sludge dependent on denitrification by ammonia-oxidizing bacteria. Bioresour. Technol. 2010, 101, 3958–3963. [Google Scholar] [CrossRef] [PubMed]
  12. Taseli, B.K. Greenhouse gas emissions from a horizontal subsurface-flow constructed wetland for wastewater treatment in small villages. Glob. Nest J. 2020, 22, 192–196. [Google Scholar]
  13. Chen, X.; Zhang, S.; Liu, J.; Wang, J.; Xin, Y.; Sun, X.; Xia, X. Tracing Microbial Production and Consumption Sources of N2O in Rivers on the Qinghai-Tibet Plateau via Isotopocule and Functional Microbe Analyses. Environ. Sci. Technol. 2023, 57, 1520–5851. [Google Scholar] [CrossRef] [PubMed]
  14. Wang, Q.L.; Jiang, G.; Ye, L.; Pijuan, M.; Yuan, Z. Heterotrophic denitrification plays an important role in N2O production from nitritation reactors treating anaerobic sludge digestion liquor. Water Res. 2014, 62, 202–210. [Google Scholar] [CrossRef] [PubMed]
  15. Soliman, M.; Eldyasti, A. Ammonia-Oxidizing Bacteria (AOB): Opportunities and applications-a review. Rev. Environ. Sci. Biotechnol. 2018, 17, 285–321. [Google Scholar] [CrossRef]
  16. Ahn, J.H.; Kwan, T.; Chandran, K. Comparison of Partial and Full Nitrification Processes Applied for Treating High-Strength Nitrogen Wastewaters: Microbial Ecology through Nitrous Oxide Production. Environ. Sci. Technol. 2011, 45, 2734–2740. [Google Scholar] [CrossRef] [PubMed]
  17. APHA. Standard Methods for the Examination of Water and Wastewater; Port City Press: Baltimore, MA, USA, 1998. [Google Scholar]
  18. Lin, W.; Ding, J.J.; Li, Y.J.; Zheng, Q.; Zhuang, S.; Zhang, D.; Zhou, W.; Qi, Z.; Li, Y. Determination of N2O reduction to N-2 from manure-amended soil based on isotopocule mapping and acetylene inhibition. Atmos. Environ. 2021, 224, 1352–2310. [Google Scholar] [CrossRef]
  19. Wunderlin, P.; Mohn, J.; Joss, A.; Emmenegger, L.; Siegrist, H. Mechanisms of N2O production in biological wastewater treatment under nitrifying and denitrifying conditions. Water Res. 2012, 46, 1027–1037. [Google Scholar] [CrossRef]
Figure 1. Schematic diagram of batch-mode SBR system.
Water 15 03502 g001
Figure 2. The variations in N2O during NH4+ oxidation (0 mg/L NaCl), Batch Test Rules 1.
Water 15 03502 g002
Figure 3. The variations in N conversion rates during NH4+ oxidation under different salinity gradients.
Water 15 03502 g003
Figure 4. The variations in N2O during NH2OH oxidation (0 mg/L NaCl), Batch Test Rules 2.
Water 15 03502 g004
Figure 5. The variations in N conversion rates during NH2OH oxidation under different salinity gradients.
Water 15 03502 g005
Figure 6. The variations in N2O during autotrophic denitrification (10 mg/L NH4+-N, 10 mg/L NaNO2-N at initial reaction, 0 mg/L NaCl), Batch Test Rules 3.
Water 15 03502 g006
Figure 7. The variations in N conversion rates during autotrophic denitrification (10 mg/L NH4+-N, 10 mg/L NaNO2-N at initial reaction, 0 mg/L NaCl) under different salinity gradients.
Water 15 03502 g007
Figure 8. The variations in N2O during autotrophic denitrification (10 mg/L NH2OH-N, 10 mg/L NaNO2-N at initial reaction, 0 mg/L NaCl) under different salinity gradients, Batch Test Rules 4.
Water 15 03502 g008
Figure 9. The variations in N conversion rates during autotrophic denitrification (10 mg/L NH2OH--N, 10 mg/L NaNO2-N at initial reaction, 0 mg/L NaCl) under different salinity gradients.
Water 15 03502 g009
Figure 10. The variations in N2O during heterotrophic denitrification under different salinity gradients, (Batch Test Rules 5, 6).
Water 15 03502 g010
Table 1. The quality of real domestic wastewater.
COD
(mg/L)
NH4+-N
(mg/L)
NO2-N
(mg/L)
NO3-N
(mg/L)
TN
(mg/L)
pHAlkalinity
Minimum8839.60056.46.9262
Maximum27691.22.81.298.57.7343
Average18265.41.40.677.47.3303
Table 2. Batch test rules.
Batch Test NumberSalinity (mg/L NaCl)Sludge-Water
Mixture Type
Initial pHATU
(mg/L)
NH4+-N
(mg/L)
NH2OH-N
(mg/L)
NO2-N
(mg/L)
DO
(mg/L)
10Partial nitrification sludge/effluent7.5 20 0.5
107.5 20 0.5
207.5 20 0.5
307.5 20 0.5
20Partial nitrification sludge/effluent7.5 20 0.5
107.5 20 0.5
207.5 20 0.5
307.5 20 0.5
30Partial nitrification sludge/effluent7.5 10 100.5
107.5 10 100.5
207.5 10 100.5
307.5 10 100.5
40Partial nitrification sludge/effluent7.5 10100.5
107.5 10100.5
207.5 10100.5
307.5 10100.5
50Partial nitrification sludge/inflow7.520 20 0.5
107.520 20 0.5
207.520 20 0.5
307.520 20 0.5
60Partial nitrification sludge/effluent7.520 20 0.5
107.520 20 0.5
207.520 20 0.5
307.520 20 0.5
Note(s): ATU: Allylthiourea, an ammonia nitrogen oxidation inhibitor.
Disclaimer/Publisher’s Note: The statements, opinions and data contained in all publications are solely those of the individual author(s) and contributor(s) and not of MDPI and/or the editor(s). MDPI and/or the editor(s) disclaim responsibility for any injury to people or property resulting from any ideas, methods, instructions or products referred to in the content.

