Abstract
This study focuses on evaluating the efficacy of biofilm-enhanced natural zeolite for the purification of slaughterhouse wastewater. The investigation encompasses four distinct treatment methods: employing natural zeolite without biofilm, integrating biofilm into 1–2 mm particle size natural zeolite, enhancing biofilm in less than 4 mm particle size natural zeolite, and introducing biofilm in less than 8 mm particle size natural zeolite. The outcomes underscore the substantial improvement brought about by biofilm incorporation. For instance, within the natural zeolite treatment system without biofilm, the final effluent retained 28 NTU of turbidity. In contrast, utilizing the <8 mm particle size with biofilm resulted in 3.2 NTU of turbidity in the treated effluent, 2.45 NTU for the <4 mm particle size with biofilm, and 1.02 NTU for the 1–2 mm particle size zeolite system with biofilm. Notably, the achieved removal rates were significant, reaching 79.88% for natural zeolite without biofilm, 97.69% for the <8 mm particle size with biofilm, 99.27% for the <4 mm particle size with biofilm, and 98.24% for the 1–2 mm particle size zeolite system with biofilm. It is noteworthy that the removal efficiencies varied from 50 to 100% for wastewater samples subjected to the treatment system without biofilm, 65.7–100% with the <8 mm particle size biofilm, 71.4–100% with the <4 mm particle size biofilm, and 71.7–100% with the 1–2 mm particle size zeolite system biofilm. These findings collectively emphasize the pivotal role of biofilm in enhancing treatment outcomes, presenting a promising avenue for optimizing wastewater treatment efficiency.
1. Introduction
The global rise in population has resulted in a growing need for food, particularly meat, which is a primary protein source. The production of meat involves a significant step known as slaughtering [1]. Regrettably, this phase is linked to substantial water usage, leading to the generation of substantial quantities of wastewater. It is crucial to note that these considerable wastewater volumes contain a notable concentration of pollutants, rendering them extremely perilous [2]. Without adequate treatment prior to disposal, these wastewater releases pose a substantial risk to both human wellbeing and the overall environment [3]. Slaughterhouse wastewater exhibits a range of distinctive characteristics, including a high organic load rich in organic matter such as blood, fats, proteins, and animal tissues. The wastewater also contains suspended solids, such as bone fragments, hair, skin, and other solid waste materials, potentially resulting in high total suspended solids (TSS) levels [4]. With significant quantities of fats, oils, and grease, slaughterhouse wastewater poses the risk of forming grease deposits and blockages in pipelines and treatment equipment if not properly managed [5]. Moreover, the presence of decomposing organic matter and animal tissues in the wastewater gives rise to strong and offensive odors that can impact the surrounding environment if not controlled [6]. The wastewater may harbor pathogens, bacteria, and microorganisms from the animals being processed, necessitating the implementation of disinfection measures to mitigate health risks [7]. Elevated levels of nitrogen and phosphorus compounds, stemming from the breakdown of proteins and organic materials in the wastewater, contribute to nutrient pollution if untreated. The composition of the wastewater varies based on factors such as animal type, processing methods, and time of day or season, and the flow rates can fluctuate significantly, particularly during slaughter operations, posing design and operational challenges for treatment systems [8]. Due to its complex and highly organic nature, treating slaughterhouse wastewater can be demanding, requiring effective and cost-efficient treatment approaches to achieve the desired purification level [9].
Considerable endeavors have been directed towards wastewater treatment research, aiming to assess the efficacy of diverse treatment technologies in the pursuit of environmental sustainability [10,11,12]. The assessed strategies for treatment generally align with three core classifications: physical treatment methodologies, chemical treatment approaches, and biological treatment systems. Physical treatment systems encompass filtration-based technologies, notably membrane-based systems that utilize ultrafiltration or microfiltration for solid removal in wastewater treatment [13]. These membranes can be incorporated into the biological wastewater treatment process, either as a separate unit or as an operation following the biological step [14]. For instance, Ruigómez et al. [15] investigated the application of intermittent rotating hollow fiber modules in direct membrane filtration for wastewater treatment. The results revealed a significant augmentation in flux, demonstrating a direct correlation between threshold flux (ranging between 12 and 32 L·h−1·m−2) and rotational velocity. Chemical wastewater treatment involves employing diverse chemicals to facilitate the elimination, alteration, or neutralization of pollutants present in wastewater. An example is the study by Jimenez et al. [16], who investigated advanced oxidation processes for wastewater treatment, revealing a 74% TOC removal efficiency in ozone treatment under optimal conditions: 4 g/h ozone, 500 mg/L H2O2, and pH 10 over a 2-h treatment duration. On the other hand, biological wastewater treatment harnesses microorganisms such as bacteria, fungi, and algae to biologically degrade and convert organic and inorganic pollutants into less harmful substances [17,18,19]. This method capitalizes on the inherent metabolic capabilities of microorganisms, rendering it an eco-friendly and sustainable approach. As demonstrated by Harb et al. [20], anaerobic systems exhibited proficiency in degrading persistent compounds such as sulfamethoxazole, trimethoprim, clozapine, triclocarban, and amitriptyline, achieving removal rates exceeding 80%. Furthermore, the utilization of natural zeolite in wastewater treatment has garnered considerable attention and interest [21,22,23,24].
Despite the established utilization of zeolite materials in wastewater treatment, the heterogeneous and intricate composition of wastewater, particularly in cases such as slaughterhouse wastewater, necessitates ongoing enhancements in terms of efficacy, spatial requirements, energy consumption, permeate quality, and technical expertise [25]. Furthermore, continuous advancements are being made in modifying natural zeolite modules and material configurations to amplify their selectivity in addressing specific pollutants, a significant challenge in the context of natural zeolite’s application in wastewater treatment. One promising avenue involves the integration of natural zeolite with complementary treatment methodologies, such as biofilm, displaying remarkable potential for elevating the efficiency of natural zeolite in wastewater treatment. This fusion has emerged as a pivotal research focus in both current and prospective investigations within the realm of wastewater treatment. Biofilm, within the context of wastewater treatment, denotes a multifaceted and dynamic community of microorganisms that adhere to surfaces, forming a gelatinous, framework-like structure composed of bacteria, fungi, algae, and other microorganisms [26]. This biofilm formation stems from the colonization of microorganisms on submerged surfaces within wastewater, including treatment tank walls, pipelines, and other structural components [27].
The biofilm structure creates a protective habitat for microorganisms, enabling their survival in challenging conditions and fostering symbiotic interactions. Within wastewater treatment, biofilms play a pivotal role by aiding in the elimination of pollutants through diverse mechanisms: the biofilm matrix serves as an adsorbent, luring and capturing particles and contaminants from the wastewater, while the microorganisms within the biofilm also absorb dissolved pollutants [28]. Microbes within the biofilm are instrumental in breaking down organic matter and pollutants in the wastewater, employing enzymatic activities to convert complex contaminants into simpler, less harmful substances. Furthermore, biofilms facilitate nutrient cycling by assimilating nutrients from the wastewater and releasing beneficial metabolic byproducts [29]. As emphasized earlier, despite ongoing research in the realm of natural zeolite applications for wastewater treatment, there remains a noticeable dearth of information regarding their suitability for addressing the unique challenges posed by poultry slaughterhouse wastewater. It is crucial to recognize that the performance of any wastewater treatment system hinges significantly upon the specific characteristics of the wastewater it is designed to treat. With this in mind, it becomes evident that tailoring treatment strategies to the intricacies of poultry slaughterhouse wastewater is a complex and understudied endeavor. Transitioning to the realm of biofilm augmentation, it is essential to underscore that the proficiency with which a biofilm can be cultivated is intrinsically linked to the inherent properties and components of the wastewater chosen as the substrate for biofilm development. Regrettably, the available information regarding the effectiveness of poultry slaughterhouse wastewater as a medium for stimulating biofilm growth remains conspicuously limited. This knowledge gap underscores the pressing need for comprehensive investigations that explore the dynamic interplay between poultry slaughterhouse effluents and biofilm formation processes, ultimately facilitating the development of efficient and tailored wastewater treatment approaches in this context.
This investigation delves into the efficacy of a biofilm-enhanced natural zeolite for the purification of slaughterhouse wastewater. The study examines natural zeolite with three distinct particle sizes, augmented with biofilm, with a focus on their aptitude for wastewater treatment. A thorough and exhaustive assessment covers a diverse array of 15 water quality metrics, embracing factors such as turbidity, coloration, chlorides, sulfates, zinc levels, overall hardness, calcium content, manganese concentrations, fluorides, nickel content, cadmium traces, nitrates, cyanide presence, lead levels, and the inclusion of arsenic. Additionally, the study encompasses the creation of water quality indices as an integral component within a holistic initiative to comprehensively characterize the state of water quality.
2. Materials and Methods
2.1. Wastewater Samples Characterization
Wastewater specimens were procured from the slaughterhouse situated within the Izhevsk poultry farm in Kazakhstan, at an approximate distance of 70 km from the capital city of Nur-Sultan (located at 51°10′ N and 71°26′ E). These specimens were collected both prior to and after undergoing treatment, procured through the utilization of 5-L plastic receptacles that had been meticulously cleansed with deionized water prior to deployment. Each gathered sample was attentively preserved at a stable temperature of 4 °C until subjected to the meticulous analytical procedure. Within the experimental phase, an exhaustive analysis encompassed a comprehensive evaluation of 15 distinct parameters pertaining to water quality. These parameters ranged from turbidity, colors, chlorides, sulfates, zinc, total hardness, calcium, manganese, fluorides, nickel, cadmium, nitrates, cyanides, and lead, as well as arsenic.
A diverse range of water quality parameters underwent assessment, employing distinct methodologies and instrumentation. Turbidity was evaluated through the application of turbidimetry, utilizing a specialized turbidimeter to precisely quantify the intensity of light dispersion caused by suspended particles within the water. The determination of color was facilitated by employing spectrophotometry, which involved utilizing a spectrophotometer to gauge the absorption of specific light wavelengths, thereby providing insight into the color intensity of the water sample. Chloride levels were analyzed by employing ion-selective electrode techniques [30], alongside an electrode, complemented by the introduction of a silver nitrate solution to identify the appearance of a color alteration signifying the endpoint. Sulfate concentrations were quantified using colorimetric analysis, utilizing a colorimeter in tandem with a solution containing barium chloride, wherein the observed change in color denoted sulfate content. Zinc concentration assessments were conducted through the utilization of inductively coupled plasma mass spectrometry (ICP-MS) [31], harnessing the capabilities of ICP-MS instruments to precisely determine zinc concentrations. For the analysis of total hardness and calcium, complexometric titration on a titrator was employed, wherein ethylenediaminetetraacetic acid (EDTA) served as a reagent to elicit a color transformation at the titration endpoint, indicating the concentration of these ions. The quantification of manganese concentrations was achieved through the utilization of ICP-MS methodologies. Fluoride levels were meticulously scrutinized using ion-selective electrode techniques, involving an electrode in conjunction with the application of zirconium xylenol orange reagent, thus enabling the measurement of color change. Meanwhile, the quantification of nickel and cadmium levels was undertaken through the application of ICP-MS techniques. Nitrates were identified through colorimetric assessment, utilizing a colorimeter and Griess reagent to induce a proportional color shift, providing information about nitrate concentration. The analysis of cyanides entailed colorimetric procedures using a colorimeter equipped with pyridine-barbituric acid reagent, leading to the generation of an observable color shift. Finally, the quantification of lead and arsenic concentrations involved the application of ICP-MS methods, thereby enabling the precise determination of these specific elements within the water samples.
2.2. Biofilm Experimental Setup
The investigation centered around a naturally occurring clinoptilolite-rich zeolite in this study, presenting itself in three distinct particle sizes. The initial category encompassed zeolite materials within the size range of 1–2 mm, followed by a second group with particle sizes under 4 mm, and a final assembly with particle sizes less than 8 mm. Comprising a microporous arrangement of silica and alumina tetrahedra, these zeolite materials were procured from Himiya I Tehnologiya, TOO, Almaty, Kazakhstan. The raw zeolite underwent a meticulous process involving crushing, sieving to achieve the designated sizes, and subsequent thorough washing with distilled water to eliminate impurities. At the core of this investigation, the primary focus revolved around the comprehensive analysis of the zeolitic material’s prowess in purifying wastewater. This scrutiny extended across the spectrum of raw wastewater sourced specifically from the Vingunguti slaughterhouse located in Dar es Salaam. The creation of a cylindrical zeolite biofilm reactor for wastewater treatment involved a multi-step process, starting with the design and planning. The reactor’s functionality and suitability were ensured through considerations of flow rate, contaminants, and treatment goals. A pivotal choice was made regarding standalone or integrated operation. Subsequently, reactor dimensions were determined, factoring in treatment capacity and space constraints, while PVC materials were meticulously chosen for construction. The construction phase saw the assembly of the cylindrical chamber using selected materials to guarantee structural integrity and efficient water flow. A perforated base was ingeniously incorporated to facilitate downward water circulation while averting zeolite filter saturation. Internally, the chamber was compartmentalized to strategically house zeolite material, optimizing water flow and biofilm interaction. Air diffusers or an aeration system at the base fostered continuous air infusion for favorable biofilm growth. Transitioning to the operational setup, zeolite material was introduced to cylindrical submodules designed for downward water flow without zeolite saturation. As wastewater entered, a dynamic transition to upward flow occurred through the zeolite mass within each submodule, driven by aeration that induced water ascent. Compressed air supply to air diffusers was facilitated by a strategically positioned source. The entire device underwent a month-long air circulation, fostering biofilm growth. The reactor’s innovative design embodied the fusion of a moving bed biofilm reactor and a sequencing batch reactor, seamlessly orchestrating nitrification and denitrification within its chamber through precise aeration adjustments.
Natural zeolites were carefully introduced into the cylindrical compartments of the submodules. These submodules featured a distinctive design, with tubular and perforated bases specifically engineered to guide the downward movement of water without oversaturating the zeolite filter material. As the wastewater made its initial entry into the lower submodule, a dynamic transformation occurred. The flow, once downward, transitioned into an upward surge, driven by the inherent properties of the zeolite material. This transition was facilitated by the strategic deployment of aeration, which not only aided the upward movement, but also fostered the circulation of water through the filter. A critical component of this setup was the expert orchestration of a continuous supply of compressed air to the air diffusers. This essential mechanism was seamlessly executed through a compressed air source strategically positioned at the base of the filter. This careful balance of forces and components formed the backbone of the device’s functionality during a comprehensive 30-day phase of air circulation, which played a pivotal role in the overall purification process. The equipment, a harmonious synergy of a moving bed biofilm reactor and a sequencing batch reactor, showcased its mettle in the realm of conventional wastewater treatment methodologies. However, what set this innovation apart was its remarkable ability to seamlessly execute both nitrification and denitrification processes within the confines of a single chamber. This ingenious versatility was achieved through meticulous calibration of aeration, fine-tuned to perfection in the elements that held the zeolite, leading to a transformative performance within the system. A specified volume of activated zeolite was fully immersed in both unaltered and contaminated wastewater, a process that spanned an uninterrupted duration of 30 days. Throughout this extended period, the purification process found a stalwart ally in the form of continuous aeration. This vital process was thoughtfully managed by a compressed air pump, ensuring a consistent air flow maintained at an unwavering rate of 0.45 L/min. This orchestrated rhythm of aeration proved to be an unwavering companion, guiding the entirety of the experimental journey toward insightful conclusions and innovative revelations in wastewater treatment.
2.3. Zeolite Material Characterization
Characterizing natural zeolite material before and after biofilm formation is essential for understanding the structural and chemical changes that occur during microbial colonization. To achieve this, a Confocal Laser Scanning Microscope (CLSM) (Beijing Chinde Technology Ltd., Beijing, China) was employed as a powerful tool for high-resolution imaging and analysis. Before biofilm formation, the natural zeolite material was subjected to CLSM analysis to establish its baseline characteristics. The CLSM allowed for the examination of the zeolite’s surface topography, particle size distribution, and internal pore structure. Following biofilm formation, the same zeolite sample was analyzed using CLSM to assess the impact of microbial colonization. The CLSM images captured the spatial distribution of the biofilm on the zeolite surface, revealing the extent of microbial attachment and biofilm thickness. This characterization process allowed for a comprehensive evaluation of how the natural zeolite’s surface properties had been altered by the presence of the biofilm.
The natural zeolite materials utilized in this study have been succinctly presented in Table 1, along with their respective material characteristics. It is worth noting that the information regarding these parameters was sourced from the vendor (Himiya I Tehnologiya, TOO, Almaty, Kazakhstan). Notably, the natural zeolite samples exhibited elevated concentrations of SiO2 and Al2O3, as clearly evidenced in the data presented in Table 1.

Table 1.
Properties of the natural zeolite used in the study.
2.4. The Utilized Statistical Approaches
2.4.1. Analysis of Variance
In the context of this study, the adoption of single-factor analysis of variance (ANOVA) was employed as a strategic tool to discern the existence of statistically significant disparities within the intricate matrix of water quality data. It is of paramount importance to accentuate that this methodological approach meticulously evaluates the magnitude of divergence intrinsic to each cluster of water quality data, thoughtfully culled from their individualized cohorts. The evaluation of statistical significance was meticulously executed through a meticulous juxtaposition of the computed p-values against the well-defined alpha threshold, a priori set at 0.05. It merits explicit mention that, even in instances where the null hypothesis retains its veracity, the alpha value epitomizes the probability of its prospective repudiation. The veracity of the null hypothesis subsists in cases where the resultant p-value eclipses the stipulated alpha threshold. Speaking to the nuanced role of the p-value, it serves as an exquisite indicator of the likelihood of attaining an outcome more exceptionally divergent from the outcomes of the experimental venture [32,33].
2.4.2. t-Test Analysis
The employment of the t-test stood as another crucial statistical approach utilized in this investigation. Moreover, it played a substantial part in evaluating the statistical significance of mean differences between the two separate groups linked with each parameter being studied, influenced by the respective treatment methodologies. The T-value arises as a descriptor of the degree to which variations within the datasets deviate from each other. Similarly, an elevated T-value indicates a more prominent indication that the null hypothesis might not remain valid (in the context of a two-sample comparison assuming equivalent variances) [34].
2.4.3. Correlation Analysis
Additionally, the research aimed to explore potential interrelationships among various water quality parameters, seeking to unveil the extent to which one parameter might serve as a reliable indicator or exert influence on another. Furthermore, the study delved into the intricate connections between different parameters, particularly their impact on the overall effectiveness of the systems under investigation. The scale indicating the strength of the relationship between variables is as follows: a range of 0–0.29 signifies a low relationship, 0.3–0.49 represents a moderate relationship, 0.5–0.69 suggests a considerable relationship, and a range of 0.7–1 indicates a substantial relationship.
2.4.4. Water Quality Analysis Based on Indices
The formulation of Water Quality Indices (WQIs) encompassed the amalgamation of an extensive array of 15 discrete water quality parameters. The application of the WQI methodology facilitated the integration of these 15 parameters into a coherent composite index, effectively streamlining the process of assessing the comprehensive efficacy of treatment methodologies, which encompassed both synthetic and natural zeolite approaches. The systematic procedure for devising the WQIs is elucidated through Equations (1)–(4). The initial phase involved assigning a weight (wi) to each parameter, rated on a scale of 0–7. A weight of 0 indicated minimal impact, while a weight of 7 indicated a significant influence on water quality. The weight assignment methodology was constructed based on the perceived effect of the water quality measurements on their intended application. Drawing inspiration from the Water Quality Index established by the National Sanitation Foundation [35], the factors in this particular study were allocated specific weights. The calculation of the relative weight (Rw) was performed by dividing each parameter’s weight by the total sum of all assigned weights. This procedure is outlined in Equation (1) [25,36]:
During the formulation of the WQI, ‘n’ symbolizes the number of parameters being studied, ‘Rw’ stands for the designated relative weight, and ‘wi’ (distinctly in lowercase) indicates the weight attributed to each specific parameter. Another pivotal step entailed the calculation of a quality rating scale (Rs) for each selected water quality parameter. This was accomplished by dividing the concentration of each parameter by its associated recommended guideline value, aligned with globally accepted standards, followed by the multiplication of the outcome by 100 [25,36]:
Within this framework, the denotation for quality rating is symbolized as Rs, the concentration pertaining to each distinct parameter is expressed as Ci, and, for every measurement instance, the reference standard is indicated by Si. In order to derive the comprehensive WQI, the determination of the sub-index (SIi) for each specific parameter was a requisite step, as outlined explicitly in Equation (3) [25,36]:
In the end, the cumulative total of the sub-indices originating from the assessment of every scrutinized parameter was utilized to construct the comprehensive and overarching Water Quality Index (WQI) [25,36]:
In this context, SIi denotes the sub-index corresponding to the ith parameter. The distribution of weights and relative weights can be found in Table 2.
Table 2.
Weights and proportional weights assigned to the analyzed factors.
The units are mg/L, except for color, which is measured in Pt-scale, and turbidity, which is measured in NTU.
The classifications for status value, including “excellent water”, “good water”, “poor water”, “very bad water”, and “water unsuitable for drinking”, were employed to delineate the projected WQI values [37,38]. The classifications for water quality were outlined as follows: “excellent water” with values less than 50, “good water” ranging between 50 and 100, “poor water” ranging from 100–200, “very poor water” spanning 200–300, and “water unsuitable for drinking” with values exceeding 300.
3. Results
3.1. Wastewater Characterization
Wastewater characterization plays a pivotal role in establishing a comprehensive understanding of the wastewater’s fundamental qualities before its integration into a study. Emphasizing its significance, it is essential to recognize that the effectiveness of any treatment system hinges on the specific makeup of the wastewater. Notably, the composition of wastewater exhibits variability contingent upon its source. This variability underscores the necessity for thorough characterization as a precursor to informed analysis. In pursuit of this objective, Table 3 succinctly encapsulates the core attributes of the wastewater that have been harnessed within the scope of this investigation. At the forefront of these attributes is the average turbidity value, measured at approximately 139.2 NTU, with a minimum turbidity value of 73 NTU being the lowest recorded during the study period. Conversely, a maximum turbidity value of 197 NTU highlights the upper extent of turbidity observed. Further exploration reveals that the average color concentration in the wastewater rests at an approximate value of 1744.2 Pt-scale. Meanwhile, chloride concentrations manifest around 305.3 mg/L on average, whereas sulfate content stands at an average of 565.17 mg/L. Notably, zinc emerges with an average concentration of approximately 2.97 mg/L from the wastewater. Moreover, the wastewater showcases an average total hardness concentration of 281 mg/L, accompanied by an average calcium concentration of 72.5 mg/L. Manganese presence, indicative of the water’s inherent complexity, registers an average concentration of 0.762 mg/L. A parallel investigation into fluoride levels within the wastewater exposes an average concentration of 4.1 mg/L. Examining nickel concentration yields an average value of 0.613 mg/L, while cadmium concentration demonstrates an average of 0.004 mg/L. Expanding this analysis to include other vital components, nitrates exhibit an average concentration of 25.6 mg/L, while cyanides hold an average concentration of 0.013 mg/L. The presence of lead is marked by an average concentration of 0.02 mg/L. Equally noteworthy is the presence of arsenic, where the average concentration is measured at 0.003 mg/L. Inextricably linked to each facet is the intrinsic value of wastewater characterization, acting as a compass to navigate the complexities of water quality and its potential implications across various contexts.
Table 3.
Summary of the wastewater characteristics.
3.2. Zeolite Material Characterization
Based on the observations made through the utilization of the CLSM (Figure 1), it was determined that a substantial portion of the zeolite surface, specifically 84.2%, had become encased by the biofilm, leaving a distinct 15.8% of the surface area devoid of any biofilm coverage. This outcome underscores the significant impact of microbial colonization on the zeolite material. Notably, the composition analysis of the biofilm revealed its primary constituents, with polysaccharides comprising the predominant portion at 80.5%, indicating the presence of substantial extracellular polymeric substances (EPS). Additionally, bacterial cells accounted for 8.2% of the biofilm composition, shedding light on the microbial community’s contribution to the overall structure. This information gleaned from CLSM not only quantifies the extent of biofilm coverage, but also elucidates the biofilm’s chemical composition, contributing to a comprehensive understanding of the dynamic interplay between zeolite and microbial biofilms. The high prevalence of polysaccharides in the biofilm suggests the potential for enhanced adsorption and sequestration of contaminants by the zeolite-biofilm composite, given the known affinity of polysaccharides for a wide range of pollutants. Moreover, the presence of bacterial cells within the biofilm could facilitate biodegradation processes, making this composite material a promising candidate for pollutant removal and remediation efforts.
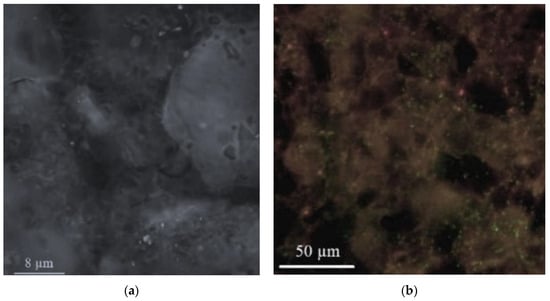
Figure 1.
Zeolite material characterization (a) before biofilm enhancement and (b) after biofilm enhancement.
3.3. Removal Efficiency
Figure 2 depicts a concise overview of the removal efficiencies obtained from the investigation of four distinct treatment approaches: natural zeolite without biofilm, natural zeolite with biofilm and particle sizes of 1–2 mm, less than 4 mm, and less than 8 mm. The graphical representation clearly highlights the substantial enhancement in treatment system performance facilitated by the presence of biofilm. Notably, the incorporation of biofilm led to remarkable improvements across all treatment scenarios. An examination of Figure 2 illustrates the profound impact of biofilm on treatment efficacy. For instance, when subjecting wastewater to the natural zeolite treatment system with biofilm, a notable reduction is observed. Specifically, after treatment, 28 NTU of turbidity remained in the final effluent. However, by implementing the <8 mm particle size zeolite with biofilm, this value significantly decreased to 3.2 NTU, indicating a marked improvement in treated effluent clarity. Similarly, the <4 mm particle size zeolite with biofilm achieved a turbidity level of 2.45 NTU in the treated effluent, while the 1–2 mm particle size zeolite system with biofilm exhibited an even lower value of 1.02 NTU. That is to say that, when biofilm was not present, the natural zeolite system attained a 79.88% turbidity removal rate. In contrast, the incorporation of biofilm led to notable improvements in removal rates. Specifically, when biofilm was introduced, the system using particles smaller than 8 mm achieved a remarkable 97.69% removal rate for turbidity. This was closely followed by the system utilizing particles smaller than 4 mm, which achieved a 98.24% removal rate. Notably, the system with particle sizes ranging from 1 to 2 mm demonstrated the highest performance, achieving an exceptional 99.27% removal rate for turbidity. These findings underscore the significant role of biofilm in augmenting treatment efficiency across various particle sizes. The assessment of nitrates removal efficiency presents a similar trend. Natural zeolite without biofilm achieved a nitrates removal efficiency of 68.77%, while biofilm integration in the 1–2 mm particle size system achieved a higher efficiency of 90.47%. Similarly, the <4 mm particle size system exhibited a nitrates removal efficiency of 95.94%, and the <8 mm particle size system demonstrated an efficiency of 96.88%. In the case of nickel removal efficiency, the presence of biofilm yielded significant improvements. Natural zeolite without biofilm achieved a nickel removal efficiency of 67.39%, whereas the 1–2 mm particle size system with biofilm, the <4 mm particle size system with biofilm, and the <8 mm particle size system with biofilm achieved remarkably higher efficiencies of 93.48%, 93.48%, and 90.22%, respectively. In summation, the results reveal a consistent trend of enhanced removal efficiencies facilitated by biofilm incorporation across all particle size scenarios. Notably, the treatment systems achieved removal efficiencies ranging from 50–100% without biofilm, 65.7–100% with the <8 mm particle size biofilm, 71.4–100% with the <4 mm particle size biofilm, and 71.7–100% with the 1–2 mm particle size zeolite system biofilm. These findings collectively underscore the pivotal role of biofilm in optimizing treatment outcomes, presenting a promising avenue for improved wastewater treatment efficiency.
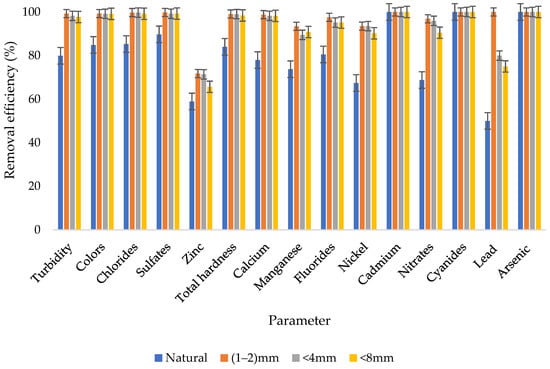
Figure 2.
Summary of the removal efficiencies.
3.4. Percent Compliance
The concentrations within the collected samples were subjected to a comprehensive comparison against internationally recognized water quality standards established by the World Health Organization (WHO) for potable water. As demonstrated in Table 4, the outcomes clearly reveal that a significant number of water quality parameters within the untreated wastewater did not meet the established benchmarks for safe drinking water. This disparity highlights the need for effective treatment strategies to align the water quality with the stipulated standards. However, upon closer examination, it becomes evident that the introduction of natural zeolite treatment without biofilm did lead to noteworthy improvements in some parameters. Despite the commendable removal efficiency achieved in this case, certain parameters, including turbidity, color, calcium, and nickel, still remained non-compliant with the established standards. These results underscore the importance of holistic treatment approaches that not only focus on achieving high removal efficiencies, but also prioritize achieving water quality that adheres to regulatory guidelines. Interestingly, a pivotal shift is observed when the samples underwent treatment involving different particle sizes in combination with biofilm. Specifically, when subjected to the (1–2) mm, <4 mm, and <8 mm particle size systems with biofilm, the treated effluent demonstrated compliance with all established water quality standards across various parameters. This transformation in the treatment outcomes suggests the potential of integrating biofilm and appropriate particle sizes to achieve a harmonious balance between effective contaminant removal and the attainment of safe and compliant water quality. In essence, the results underscore the complexity of achieving water quality standards through wastewater treatment. While the natural zeolite treatment without biofilm achieved removal efficiency improvements, it was not always sufficient to meet the stringent standards. However, the combination of biofilm and optimized particle sizes displayed the ability to consistently bring treated effluent in line with regulatory requirements. These findings not only highlight the significance of efficient removal processes, but also emphasize the necessity of comprehensive treatment strategies that prioritize the attainment of safe and compliant drinking water. This provides valuable insights for future wastewater treatment endeavors, underscoring the importance of holistic approaches in achieving water quality goals.
Table 4.
Summary of the percent compliance results.
3.5. Analysis Using the Water Quality Index
Table 5 furnishes an overview of the sub-indices crucial to the formulation of comprehensive water quality indices. Upon careful analysis of Table 5, it becomes evident that calcium emerged as the parameter exerting the most significant influence, evident by its highest contribution of 120.75, towards shaping the aggregated water quality index for the untreated wastewater. This pattern persisted even in the case of the effluent treated using natural zeolite without biofilm, where calcium retained its prominence with a contribution of 11.2. However, an intriguing shift occurs when observing the effluent treated by the <8 mm particle size system with biofilm. Here, zinc assumes a prominent role, reflecting the highest contribution of 1.67 towards the aggregated water quality index. This transition in influential parameters underscores the dynamic interplay between treatment methodologies and their effect on the resultant water quality index.
Table 5.
Summary of the sub-indices as part of the water quality indices development.
Table 6 presents an overview of the overall water quality indices. Using the analyzed water quality parameters, the assessment of wastewater resulted in a water quality index of 321.71, categorizing it as unsuitable for drinking due to its status. Employing the natural zeolite treatment without biofilm yielded a water quality index of 62.01, placing it within the realm of good water quality. Furthermore, the 1–2 mm particle size (7.18), <4 mm (13.56), and <8 mm (17.09) treatment systems all fell within the excellent water quality range.
Table 6.
Summary of the general water quality indices.
3.6. Analysis of Variance
Table 7 provides a succinct yet comprehensive panorama of the ANOVA findings, encompassing a comprehensive spectrum of variables including wastewater, effluent treated by natural zeolite without biofilm, and the diverse particle size scenarios (1–2 mm, <4 mm, and <8 mm) integrated with biofilm, all intricately woven into the variance analysis. This holistic approach to the assessment adds layers of complexity and depth to the exploration of concentration differences. The rich insights harvested from Table 7 are illuminated by a prominent p-value of 0.028, which stands as a testament to the analytical rigor of the study. The significance of this numerical revelation is pronounced, given its position beneath the well-established threshold of 0.05 (alpha value), providing statistical confirmation of meaningful concentration disparities arising from the comparative scrutiny. This observed statistical significance resonates across the spectrum of examined samples, echoing the presence of substantive differences in the concentrations. The alignment between these outcomes and established statistical norms not only validates the meticulousness of the analysis, but also buttresses the findings’ credibility. Such insights cast a spotlight on the intricacies of water treatment dynamics and reaffirm the study’s overarching message–that variations in concentrations exist across diverse treatment scenarios.
Table 7.
Summary of the ANOVA results with wastewater.
Table 8 serves as a succinct compilation of the ANOVA outcomes, strategically directing attention towards treated effluents while excluding the wastewater element from the analysis. Within this framework, the insights gleaned from Table 8 are particularly illuminating, revealing a calculated p-value of 0.049. This significant finding is below the established threshold of 0.05 (alpha value), thus accentuating the meaningfulness of the observed disparities in concentrations when subjected to comparison. The implications of this statistical revelation are profound, substantiating the presence of discernible distinctions among the meticulously examined samples. The p-value’s alignment with established statistical norms not only attests to the rigor of the analysis, but also underscores the robustness of the findings. This outcome adds an extra layer of confidence to the study’s conclusions, further reinforcing the narrative of distinctive differences in concentrations across the studied treatment scenarios.
Table 8.
Summary of the ANOVA results without wastewater.
Table 9 offers a compact overview of the outcomes derived from t-test analyses. In this analysis, distinct pairs of sample groups were compared, encompassing wastewater versus effluent treated by natural zeolite, as well as various combinations involving effluent treated by different particle sizes with and without biofilm. Upon examination of Table 9, it becomes evident that no significant disparity was observed between wastewater samples and the effluent treated by natural zeolite without biofilm, indicated by a p-value of 0.145. However, notable improvements in p-values are observed as comparisons extend to effluent samples treated by natural zeolite enhanced with biofilm, encompassing different particle sizes.
Table 9.
Overview of the outcomes derived from the t-test analysis.
3.7. Correlation Analysis
Table 10 offers a concise overview of the findings obtained from the correlation analysis. The results in Table 10 underscore notable relationships among various parameters. Notably, there is a remarkably strong correlation between calcium and total hardness, demonstrated by a correlation coefficient of 0.841. Similarly, a pronounced correlation is evident between total hardness and chlorides, with a high correlation coefficient of 0.962. An intriguing observation pertains to the relationship between color and turbidity, revealing a substantial correlation coefficient of 0.892 between these attributes. Elevated zinc levels are associated with greater turbidity, indicated by their strong positive correlation of 0.723. Total hardness shows significant positive correlations with multiple parameters, including chlorides (0.962), sulfates (0.834), zinc (0.749), calcium (0.841), and nitrates (0.616), suggesting its susceptibility to mineral and ion influences. Fluorides demonstrate positive correlations with colors (0.650), nickel (0.630), and nitrates (0.787), suggesting potential relationships. Similarly, nickel exhibits positive correlations with colors (0.798) and nitrates (0.273), implying shared influences. Nitrates display correlations with sulfates (0.459), zinc (0.413), total hardness (0.616), calcium (−0.467), and nickel (0.273), signifying diverse contributors to their presence. This highlights the interconnected nature of these water quality parameters and hints at potential underlying mechanisms that contribute to their mutual variations. The insights gleaned from this analysis shed light on the complex interplay between different variables in the water composition, further enriching our understanding of their relationships and implications.
Table 10.
Synopsis of the correlation analysis findings.
4. Discussion
The results presented underscore the critical role of wastewater characterization in developing a comprehensive understanding of its fundamental properties prior to its integration into a study. The significance of this process is highlighted by its direct impact on the efficiency of treatment systems. Indeed, the efficacy of any treatment system is intrinsically tied to the specific composition of the wastewater under consideration [39]. This emphasis on wastewater composition serves as a reminder of the intricate relationship between treatment processes and the nature of the wastewater itself. A key observation is the inherent variability in wastewater composition stemming from its diverse sources. This variability underlines the importance of meticulous characterization as a preliminary step, ensuring that subsequent analyses are grounded in accurate data [40]. This aligns with the principle that informed decision-making and insightful analysis can only be achieved through a firm grasp of the raw material–in this case, the wastewater. The average turbidity value, an indicator of suspended particles, reveals itself as 139.2 NTU, with the study’s lowest recorded turbidity value at 73 NTU. Significantly, an upper threshold of 197 NTU highlights the extent of turbidity variation. The guidelines established by the WHO advocate for a permissible upper limit of 5 NTU for turbidity in potable water. Turbidity functions as a gauge of the opaqueness or haziness within water due to the inclusion of suspended particles. This criterion of 5 NTU has been instituted to guarantee that drinking water maintains a visually transparent and pleasing quality. Elevated turbidity levels possess the potential to influence the visual clarity of water, while also potentially signaling the existence of additional particles, microorganisms, or impurities [41]. Further delving into the analysis, the average color concentration, representing aesthetic quality, settles around 1744.2 Pt-scale. Chloride and sulfate concentrations, constituting key chemical indicators, present averages of 305.3 mg/L and 565.17 mg/L, respectively. The WHO has recommended a maximum allowable concentration of sulfates (SO42−) in drinking water of 250 mg/L (milligrams per liter) [42]. The presence of zinc, a common trace element, is notable, with an average concentration of 2.97 mg/L. The WHO has recommended a maximum allowable concentration of zinc (Zn) in drinking water of 3 mg/L (milligrams per liter) [43]. Furthermore, the complex nature of the wastewater is captured in the delineation of its total hardness (281 mg/L) and calcium concentration (72.5 mg/L) averages. Extremely low or exceptionally high levels of calcium (Ca) and magnesium (Mg), or overall water hardness, have been practically acknowledged as the underlying reasons behind issues such as water corrosion, scaling, or altered taste in drinking water [44]. Additionally, the identification of manganese, often indicative of natural sources, is reflected, with an average concentration of 0.762 mg/L. The WHO has recommended a maximum allowable concentration of manganese (Mn) in drinking water of 0.4 mg/L (milligrams per liter) [45].
Upon closer examination of fluoride content, the analysis discloses an average concentration of 4.1 mg/L. It is noteworthy that the WHO has delineated a maximum admissible level for fluoride (F-) within drinking water, stipulating a threshold of 1.5 mg/L (milligrams per liter). This prescribed standard is underpinned by the paramount goal of averting dental fluorosis, an aesthetic concern that can arise due to prolonged exposure to elevated fluoride levels during tooth development. It is worth emphasizing that the WHO’s directive is meticulously crafted to encompass both the advantageous aspects of fluoride for dental health and the conceivable hazards linked to undue fluoride exposure. Notably, fluoride is frequently judiciously introduced into potable water in meticulously regulated quantities, thereby contributing to the combat against tooth decay while steering clear of potential overexposure concerns [46]. Nickel content and cadmium concentration emerge, with averages of 0.613 mg/L and 0.004 mg/L, respectively. The WHO has recommended a maximum allowable concentration of cadmium (Cd) in drinking water of 0.003 mg/L, which is equivalent to 3 µg/L (micrograms per liter). Cadmium is a toxic heavy metal that can have serious health implications, and its presence in drinking water should be minimized to prevent adverse health effects [47]. Expanding the analysis to encompass essential components, nitrates register an average concentration of 25.6 mg/L, drawing attention to their potential environmental impact. The WHO has recommended a maximum allowable concentration of nitrates (NO3−) in drinking water of 50 mg/L (milligrams per liter) as nitrate-nitrogen (NO3-N). This guideline is established to prevent methemoglobinemia, also known as “blue baby syndrome”, which can affect infants when nitrates are converted to nitrites in the body. It is important to note that nitrate contamination of drinking water can be a significant concern, especially in areas with agricultural activities or improper waste disposal. Excessive nitrate levels can impact water quality and pose health risks [48].
Meanwhile, the presence of cyanides is documented, with an average concentration of 0.013 mg/L, reinforcing the significance of monitoring such compounds. The WHO has recommended a maximum allowable concentration of cyanides in drinking water of 0.07 mg/L (milligrams per liter) as free cyanide. This guideline is established to prevent potential acute health effects associated with exposure to cyanide compounds. Cyanides are highly toxic and can pose serious health risks even at low concentrations. It is important to prevent cyanide contamination of drinking water to ensure public health and safety [49]. Lead, a well-known environmental concern, manifests at an average concentration of 0.02 mg/L. The WHO has recommended a maximum allowable concentration of lead (Pb) in drinking water of 0.01 mg/L (milligrams per liter) or 10 µg/L (micrograms per liter). Lead is a toxic heavy metal that can have serious health effects, particularly on the neurological development of young children and fetuses [50]. The presence of arsenic, even at a concentration of 0.003 mg/L, requires careful attention, given its toxicity. The WHO has recommended a maximum allowable concentration of arsenic (As) in drinking water of 0.01 mg/L (milligrams per liter) or 10 µg/L (micrograms per liter). Arsenic is a highly toxic element that can pose significant health risks even at low concentrations [51].
Also, the presented results shed light on the significant impact of biofilm integration in enhancing the efficiency of wastewater treatment using different zeolite particle sizes. Notably, when the natural zeolite treatment system was combined with biofilm, a substantial reduction in turbidity was observed in the treated effluent, underscoring the positive influence of biofilm on improving water clarity. In particular, the initial turbidity level of the wastewater, prior to treatment, was reduced to 28 NTU after undergoing treatment with the natural zeolite system equipped with biofilm. This indicates that the treatment process aided in removing a significant portion of suspended particles and contaminants, leading to an improvement in effluent quality. Remarkably, the implementation of a smaller zeolite particle size, specifically the <8 mm particle size zeolite with biofilm, resulted in a pronounced enhancement in treated effluent clarity. The turbidity level plummeted to a mere 3.2 NTU, signifying a substantial reduction in suspended particulate matter. This notable improvement underscores the efficiency of the treatment process when biofilm is introduced, enhancing the removal of turbidity-inducing particles. The results from employing even smaller zeolite particle sizes continued to demonstrate the positive impact of biofilm. The <4 mm particle size zeolite system with biofilm achieved an impressive turbidity level of 2.45 NTU in the treated effluent. The most notable reduction in turbidity, however, was evident in the 1–2 mm particle size zeolite system with biofilm, where the turbidity level reached an impressively low value of 1.02 NTU. This outcome indicates that the combination of biofilm and the appropriately chosen zeolite particle size effectively removed a substantial portion of suspended particles, leading to an exceptionally clear treated effluent. The reduction in turbidity levels demonstrates the substantial removal of suspended particles, which can impact water quality and aesthetics. Moreover, the quantified removal rates presented in the results provide compelling evidence of the pivotal role played by biofilm in enhancing the overall performance of wastewater treatment systems. The impact of biofilm is vividly demonstrated through a comparative analysis of treatment scenarios with and without its presence. In instances where biofilm was not present, the natural zeolite system managed to remove 79.88% of turbidity. Conversely, the inclusion of biofilm led to remarkable enhancements in removal rates. Specifically, when biofilm was integrated, the system employing particles smaller than 8 mm achieved an impressive removal rate of 97.69% for turbidity. This was closely followed by the system utilizing particles smaller than 4 mm, which attained a removal rate of 98.24%. Notably, the smallest particle size system, ranging from 1–2 mm, exhibited the highest performance, achieving an exceptional turbidity removal rate of 99.27%. Comparable successes in utilizing biofilm for reducing turbidity have also been documented in existing literature. For instance, Cossey et al. [52] conducted a study on the use of biofilms to reduce turbidity in end pit lakes associated with oil sands. They were able to achieve a removal efficiency of up to 95%.
The analysis of nitrates removal efficiency followed a similar pattern, reinforcing the positive impact of biofilm integration. When biofilm was absent, the natural zeolite system achieved a nitrates removal efficiency of 68.77%. However, the presence of biofilm led to significant improvements in nitrates removal across different particle sizes. For instance, the 1–2 mm particle size system with biofilm demonstrated a notably higher efficiency of 90.47%, showcasing how biofilm contributes to a more efficient removal of nitrates from the wastewater. Parallel to these findings, the <4 mm particle size system exhibited a nitrates removal efficiency of 95.94%, while the <8 mm particle size system achieved an impressive efficiency of 96.88% with biofilm incorporation. These consistent trends underscore the reliability and versatility of biofilm in enhancing the removal of specific contaminants, leading to improved water quality. Comparing treatment scenarios, the absence of biofilm in the natural zeolite system yielded a nickel removal efficiency of 67.39%. In stark contrast, the incorporation of biofilm into the 1–2 mm particle size system, the <4 mm particle size system, and the <8 mm particle size system resulted in marked improvements. Specifically, these scenarios achieved remarkably higher nickel removal efficiencies of 93.48%, 93.48%, and 90.22%, respectively. This disparity in removal efficiencies underscores the positive influence of biofilm, which enables a more efficient capture and removal of nickel contaminants from the wastewater. Collectively, the results signify a consistent trend of enhanced removal efficiencies resulting from the strategic integration of biofilm. The observed improvements are consistent across all particle size scenarios, reaffirming the pivotal role of biofilm in optimizing treatment outcomes. Notably, the treatment systems exhibited removal efficiencies spanning a significant range: from 50–100% without biofilm, from 65.7–100% with the <8 mm particle size biofilm, from 71.4–100% with the <4 mm particle size biofilm, and from 71.7–100% with the 1–2 mm particle size zeolite system biofilm. Based on the outcomes, it can be concluded that the introduction of biofilm notably boosts removal rates and effectiveness, thereby serving as a valuable asset in customizing treatment methods for optimal elimination of contaminants. The data additionally reinforces the idea that biofilm can be strategically integrated to enhance the capabilities of pre-existing wastewater treatment setups, ultimately aiding in the enhancement of water quality and environmental sustainability. Gou et al. [53] investigated the practicality of employing an inventive algal-bacterial biofilm reactor for highly effective domestic wastewater treatment. Remarkably, this system achieved a 90% reduction in both chemical oxygen demand and ammonium levels within a retention period of 12 h. In summation, the results clearly highlight that biofilm has a profound positive impact on treatment performance.
Through the evaluation of water quality parameters, the analysis of wastewater yielded a notably high water quality index of 321.71, indicating its unsuitability for drinking purposes based on its status. This underscores the presence of considerable contaminants and pollutants within the untreated or minimally treated wastewater, underscoring the need for substantial treatment interventions to render it safe for consumption. Conversely, when the natural zeolite treatment without biofilm was employed, a substantially lower water quality index of 62.01 was attained, positioning it within the realm of good quality water. This outcome reflects the effectiveness of the treatment approach in mitigating contaminants, leading to improved water quality. Further enhancing the treatment efficacy, the implementation of different particle size systems showcased impressive results. The 1–2 mm particle size system achieved a notably excellent water quality index of 7.18, suggesting a remarkable reduction in contaminants and a substantial enhancement in water quality. Similarly, the <4 mm and <8 mm particle size systems exhibited even higher water quality indices of 13.56 and 17.09, respectively, both falling within the excellent water quality range. In various scholarly works, water quality indices have proven to be immensely valuable for interpreting the condition of water quality [54,55,56].
The strong positive correlation of 0.892 between turbidity and colors signifies that heightened turbidity levels correspond to increased water coloration, potentially arising from shared particulate matter or suspended solids. Conversely, the relatively low correlation coefficient of 0.152 between chlorides and turbidity suggests a weak positive relationship, indicating a limited influence of chlorides on turbidity levels. The moderate positive correlation of 0.844 between sulfates and chlorides implies that specific sources contribute to both sulfate and chloride concentrations, engendering correlated behavior. A similar pattern is observed between zinc and turbidity, which share a strong positive correlation of 0.723, suggesting that elevated zinc levels align with greater turbidity. Total hardness presents noteworthy positive correlations with various parameters, including chlorides (0.962), sulfates (0.834), zinc (0.749), calcium (0.841), and nitrates (0.616), implying its susceptibility to influence from these factors due to mineral and ion presence. Moreover, fluorides display positive correlations with colors (0.650), nickel (0.630), and nitrates (0.787), hinting at potential relationships between fluoride levels and these attributes. Similarly, nickel exhibits positive correlations with colors (0.798) and nitrates (0.273), implying common influences or mechanisms impacting their concentrations. Nitrates showcase correlations with multiple parameters, including sulfates (0.459), zinc (0.413), total hardness (0.616), calcium (−0.467), and nickel (0.273), indicating diverse contributors to nitrate presence. Collectively, the correlation matrix illuminates the intricate web of connections between these water quality parameters. Strong and moderate correlations signify shared origins or interactions among parameters, while weak correlations denote limited effects between specific pairs. This comprehension is instrumental in identifying potential trends and sources of variability in water quality attributes.
Collectively, the results highlight the critical role that different treatment approaches play in shaping water quality indices. The contrast between the untreated wastewater, the treated effluent natural zeolite system without biofilm, and the varied particle size treatments with biofilms illustrates the potential of tailored interventions to substantially improve water quality. These findings not only provide valuable insights for effective water treatment strategies, but also emphasize the importance of these strategies in ensuring safe and potable water for various applications.
5. Conclusions
The research successfully assessed the efficacy of biofilm-enhanced natural zeolite in treating slaughterhouse wastewater through a comprehensive investigation of four treatment approaches: natural zeolite without biofilm, biofilm integration into 1–2 mm particle size natural zeolite, biofilm enhancement in less than 4 mm particle size natural zeolite, and biofilm introduction in less than 8 mm particle size natural zeolite. The results unequivocally demonstrated significant enhancements achieved through biofilm incorporation, notably improving treatment performance. For instance, without biofilm, the natural zeolite system left 28 NTU of turbidity in the final effluent. Conversely, employing particle sizes of the <8 mm particle size with biofilm resulted in 3.2 NTU of turbidity, the <4 mm particle size with biofilm achieved 2.45 NTU, and the 1–2 mm particle size zeolite system with biofilm reached 1.02 NTU in the treated effluent. Furthermore, removal rates were remarkable, measuring 79.88% for natural zeolite without biofilm, 97.69% for the <8 mm particle size with biofilm, 99.27% for the <4 mm particle size with biofilm, and 98.24% for the 1–2 mm particle size zeolite system with biofilm. This study also revealed varying removal efficiencies ranging from 50–100% for untreated wastewater, 65.7–100% for the <8 mm particle size biofilm, 71.4–100% for the <4 mm particle size biofilm, and 71.7–100% for the 1–2 mm particle size zeolite system with biofilm. Additionally, the results emphasized the disparities between untreated wastewater and safe drinking water standards in terms of water quality parameters, underscoring the need for effective treatment strategies to meet regulatory benchmarks. The water quality index, initially at 321.71, categorized the wastewater as unsuitable for consumption due to contaminants. However, treatment with natural zeolite without biofilm improved the index to 62.01, indicating a shift towards good quality water. Notably, the treatment methods involving different particle sizes achieved encouraging outcomes, with the 1–2 mm particle size system achieving an index of 7.18, and the <4 mm and <8 mm systems excelling further, with indices of 13.56 and 17.09, respectively. These collective findings emphasize the pivotal role of biofilm in enhancing treatment outcomes and present a promising avenue for optimizing wastewater treatment efficiency.
Author Contributions
Conceptualization, T.M.; Methodology, T.M.; Formal analysis, A.K.; Investigation, T.M. and A.K.; Resources, T.B., D.G., Z.A., A.S., D.N., G.O. and K.G.; Data curation, T.M., T.B., D.G., Z.A., A.S., D.N., G.O. and K.G.; Writing—original draft, T.M.; Writing—review & editing, T.M.; Supervision, K.M.; Project administration, K.M.; Funding acquisition, K.M. All authors have read and agreed to the published version of the manuscript.
Funding
This research was funded by the Science Committee of the Ministry of Science and Higher Education of the Republic of Kazakhstan (Grant No. AP14972646), «Development of green technology of groundwater treatment for drinking purposes using natural zeolites of Kazakhstan», for the years 2022–2024.
Data Availability Statement
The data supporting the findings of this study are available upon reasonable request from the corresponding author.
Conflicts of Interest
The authors declare no conflict of interest. The funders had no role in the design of the study; in the collection, analyses, or interpretation of data; in the writing of the manuscript; or in the decision to publish the results.
References
- Kim, J.; Kwon, Y.K.; Kim, H.W.; Seol, K.H.; Cho, B.K. Robot Technology for Pork and Beef Meat Slaughtering Process: A Review. Animals 2023, 13, 651. [Google Scholar] [CrossRef]
- Mkilima, T.; Bazarbayeva, T.; Assel, K.; Nurmukhanbetova, N.; Ostretsova, I.; Khamitova, A.; Makhanova, S.; Sergazina, S. Pore Size in the Removal of Phosphorus and Nitrogen from Poultry Slaughterhouse Wastewater Using Polymeric Nanofiltration Membranes. Water 2022, 14, 2929. [Google Scholar] [CrossRef]
- Zieliński, W.; Korzeniewska, E.; Harnisz, M.; Drzymała, J.; Felis, E.; Bajkacz, S. Wastewater Treatment Plants as a Reservoir of Integrase and Antibiotic Resistance Genes—An Epidemiological Threat to Workers and Environment. Environ. Int. 2021, 156, 106641. [Google Scholar] [CrossRef] [PubMed]
- Bustillo-Lecompte, C.F.; Mehrvar, M. Slaughterhouse Wastewater Characteristics, Treatment, and Management in the Meat Processing Industry: A Review on Trends and Advances. J. Environ. Manag. 2015, 161, 287–302. [Google Scholar] [CrossRef] [PubMed]
- Husam, A.-N.; Nassar, A. Slaughterhouses Wastewater Characteristics in the Gaza Strip. J. Water Resour. Prot. 2019, 11, 844–851. [Google Scholar] [CrossRef]
- Aleksić, N.; Nešović, A.; Šušteršič, V.; Gordić, D.; Milovanović, D. Slaughterhouse Water Consumption and Wastewater Characteristics in the Meat Processing Industry in Serbia. Desalin. Water Treat. 2020, 190, 98–112. [Google Scholar] [CrossRef]
- Sib, E.; Lenz-Plet, F.; Barabasch, V.; Klanke, U.; Savin, M.; Hembach, N.; Schallenberg, A.; Kehl, K.; Albert, C.; Gajdiss, M.; et al. Bacteria Isolated from Hospital, Municipal and Slaughterhouse Wastewaters Show Characteristic, Different Resistance Profiles. Sci. Total Environ. 2020, 746, 140894. [Google Scholar] [CrossRef]
- Ng, M.; Dalhatou, S.; Wilson, J.; Kamdem, B.P.; Temitope, M.B.; Paumo, H.K.; Djelal, H.; Assadi, A.A.; Nguyen-Tri, P.; Kane, A. Characterization of Slaughterhouse Wastewater and Development of Treatment Techniques: A Review. Processes 2022, 10, 1300. [Google Scholar] [CrossRef]
- Aziz, A.; Basheer, F.; Sengar, A.; Irfanullah; Khan, S.U.; Farooqi, I.H. Biological Wastewater Treatment (Anaerobic-Aerobic) Technologies for Safe Discharge of Treated Slaughterhouse and Meat Processing Wastewater. Sci. Total Environ. 2019, 686, 681–708. [Google Scholar] [CrossRef]
- Mohsenpour, S.F.; Hennige, S.; Willoughby, N.; Adeloye, A.; Gutierrez, T. Integrating Micro-Algae into Wastewater Treatment: A Review. Sci. Total Environ. 2021, 752, 142168. [Google Scholar] [CrossRef]
- Sukmana, H.; Bellahsen, N.; Pantoja, F.; Hodur, C. Adsorption and Coagulation in Wastewater Treatment—Review. Prog. Agric. Eng. Sci. 2021, 17, 49–68. [Google Scholar] [CrossRef]
- Jain, K.; Patel, A.S.; Pardhi, V.P.; Flora, S.J.S. Nanotechnology in Wastewater Management: A New Paradigm Towards Wastewater Treatment. Molecules 2021, 26, 1797. [Google Scholar] [CrossRef] [PubMed]
- Hube, S.; Eskafi, M.; Hrafnkelsdóttir, K.F.; Bjarnadóttir, B.; Bjarnadóttir, M.Á.; Axelsdóttir, S.; Wu, B. Direct Membrane Filtration for Wastewater Treatment and Resource Recovery: A Review. Sci. Total Environ. 2020, 710, 136375. [Google Scholar] [CrossRef]
- Alfonso-Muniozguren, P.; Serna-Galvis, E.A.; Bussemaker, M.; Torres-Palma, R.A.; Lee, J. A Review on Pharmaceuticals Removal from Waters by Single and Combined Biological, Membrane Filtration and Ultrasound Systems. Ultrason. Sonochem. 2021, 76, 105656. [Google Scholar] [CrossRef] [PubMed]
- Ruigómez, I.; González, E.; Rodríguez-Gómez, L.; Vera, L. Direct Membrane Filtration for Wastewater Treatment Using an Intermittent Rotating Hollow Fiber Module. Water 2020, 12, 1836. [Google Scholar] [CrossRef]
- Jiménez, S.; Andreozzi, M.; Micó, M.M.; Álvarez, M.G.; Contreras, S. Produced Water Treatment by Advanced Oxidation Processes. Sci. Total Environ. 2019, 666, 12–21. [Google Scholar] [CrossRef] [PubMed]
- Chen, G.; Bai, R.; Zhang, Y.; Zhao, B.; Xiao, Y. Application of Metagenomics to Biological Wastewater Treatment. Sci. Total Environ. 2022, 807, 150737. [Google Scholar] [CrossRef]
- Sundui, B.; Ramirez Calderon, O.A.; Abdeldayem, O.M.; Lázaro-Gil, J.; Rene, E.R.; Sambuu, U. Applications of Machine Learning Algorithms for Biological Wastewater Treatment: Updates and Perspectives. Clean Technol. Environ. Policy 2021, 23, 127–143. [Google Scholar] [CrossRef]
- Tang, X.; Fan, C.; Zeng, G.; Zhong, L.; Li, C.; Ren, X.; Song, B.; Liu, X. Phage-Host Interactions: The Neglected Part of Biological Wastewater Treatment. Water Res. 2022, 226, 119183. [Google Scholar] [CrossRef]
- Harb, M.; Lou, E.; Smith, A.L.; Stadler, L.B. Perspectives on the Fate of Micropollutants in Mainstream Anaerobic Wastewater Treatment. Curr. Opin. Biotechnol. 2019, 57, 94–100. [Google Scholar] [CrossRef]
- Senila, L.; Hoaghia, A.; Moldovan, A.; Török, I.A.; Kovacs, D.; Simedru, D.; Tomoiag, C.H.; Senila, M. The Potential Application of Natural Clinoptilolite-Rich Zeolite as Support for Bacterial Community Formation for Wastewater Treatment. Materials 2022, 15, 3685. [Google Scholar] [CrossRef]
- Ahmed, A.T.; Almohamadi, H. Chemical and Microstructural Studies for Using Natural Zeolite in Advanced Wastewater Treatment. Int. J. Environ. Sci. Technol. 2023, 20, 6491–6498. [Google Scholar] [CrossRef]
- Tasić, Ž.Z.; Bogdanović, G.D.; Antonijević, M.M. Application of Natural Zeolite in Wastewater Treatment: A Review. J. Min. Metall. A Min. 2019, 55, 67–79. [Google Scholar] [CrossRef]
- Wang, S.; Peng, Y. Natural Zeolites as Effective Adsorbents in Water and Wastewater Treatment. Chem. Eng. J. 2010, 156, 11–24. [Google Scholar] [CrossRef]
- Meiramkulova, K.; Kydyrbekova, A.; Devrishov, D.; Nurbala, U.; Tuyakbayeva, A.; Zhangazin, S.; Ualiyeva, R.; Kolpakova, V.; Yeremeyeva, Y.; Mkilima, T. Comparative Analysis of Natural and Synthetic Zeolite Filter Performance in the Purification of Groundwater. Water 2023, 15, 588. [Google Scholar] [CrossRef]
- Acevedo Alonso, V.; Kaiser, T.; Babist, R.; Fundneider, T.; Lackner, S. A Multi-Component Model for Granular Activated Carbon Filters Combining Biofilm and Adsorption Kinetics. Water Res. 2021, 197, 117079. [Google Scholar] [CrossRef]
- Liu, X.; Ji, B.; Li, A. Enhancing Biolipid Production and Self-Flocculation of Chlorella Vulgaris by Extracellular Polymeric Substances from Granular Sludge with CO2 Addition: Microscopic Mechanism of Microalgae-Bacteria Symbiosis. Water Res. 2023, 236, 119960. [Google Scholar] [CrossRef]
- Xing, Y.; Luo, X.; Liu, S.; Wan, W.; Huang, Q.; Chen, W. A Novel Eco-Friendly Recycling of Food Waste for Preparing Biofilm-Attached Biochar to Remove Cd and Pb in Wastewater. J. Clean. Prod. 2021, 311, 127514. [Google Scholar] [CrossRef]
- Madadi, R.; Bester, K. Fungi and Biochar Applications in Bioremediation of Organic Micropollutants from Aquatic Media. Mar. Pollut. Bull. 2021, 166, 112247. [Google Scholar] [CrossRef]
- Buehler, M.G.; Kounaves, S.P.; Martin, D.P.; West, S.J.; Kuhlman, G.M. Designing a Water-Quality Monitor with Ion Selective Electrodes. In Proceedings of the 2001 IEEE Aerospace Conference Proceedings (Cat. No.01TH8542), Big Sky, MT, USA, 10–17 March 2001; Volume 1, pp. 1/331–1/337. [Google Scholar]
- Wilschefski, S.; Baxter, M. Inductively Coupled Plasma Mass Spectrometry: Introduction to Analytical Aspects. Clin. Biochem. Rev. 2019, 40, 115–133. [Google Scholar] [CrossRef]
- Utepov, Y.B.; Aldungarova, A.K.; Mkilima, T.; Pidal, I.M.; Tulebekova, A.S.; Zharassov, S.Z.; Abisheva, A.K. Dynamics of Embankment Slope Stability under Combination of Operating Water Levels and Drawdown Conditions. Infrastructures 2022, 7, 65. [Google Scholar] [CrossRef]
- Meiramkulova, K.; Devrishov, D.; Adylbek, Z.; Kydyrbekova, A.; Zhangazin, S.; Ualiyeva, R.; Temirbekova, A.; Adilbektegi, G.; Mkilima, T. The Impact of Various LED Light Spectra on Tomato Preservation. Sustainability 2023, 15, 1111. [Google Scholar] [CrossRef]
- Meiramkulova, K.; Devrishov, D.; Kakabayev, A.; Marzanov, N.; Kurmanbayeva, A.; Adilbektegi, G.; Marzanova, S.; Kydyrbekova, A.; Mkilima, T. Investigating the Influence of Fly Attractant on Food Waste Recovery through Fly Larvae Production. Sustainability 2022, 14, 10494. [Google Scholar] [CrossRef]
- Said, A.; Stevens, D.K.; Sehlke, G. An Innovative Index for Evaluating Water Quality in Streams. Environ. Manag. 2004, 34, 406–414. [Google Scholar] [CrossRef]
- Meiramkulova, K.; Zorpas, A.A.; Orynbekov, D.; Zhumagulov, M.; Saspugayeva, G.; Kydyrbekova, A.; Mkilima, T.; Inglezakis, V.J. The Effect of Scale on the Performance of an Integrated Poultry Slaughterhouse Wastewater Treatment Process. Sustainability 2020, 12, 4679. [Google Scholar] [CrossRef]
- Bhatnagar, A.; Devi, P.; George, M.P. Impact of Mass Bathing and Religious Activities on Water Quality Index of Prominent Water Bodies: A Multilocation Study in Haryana, India. Int. J. Ecol. 2016, 2016, 2915905. [Google Scholar] [CrossRef]
- Alobaidy, A.H.M.J.; Abid, H.S.; Maulood, B.K. Application of Water Quality Index for Assessment of Dokan Lake Ecosystem, Kurdistan Region, Iraq. J. Water Resour. Prot. 2010, 2, 792–798. [Google Scholar] [CrossRef]
- Mkilima, T. Treatment of Livestock Slaughterhouse Wastewater by the Electrochemical Method Using Stainless Steel and Copper Electrodes. Environ. Qual. Manag. 2022, 32, 367–379. [Google Scholar] [CrossRef]
- Ravndal, K.T.; Opsahl, E.; Bagi, A.; Kommedal, R. Wastewater Characterisation by Combining Size Fractionation, Chemical Composition and Biodegradability. Water Res. 2018, 131, 151–160. [Google Scholar] [CrossRef]
- Soros, A.; Amburgey, J.E.; Stauber, C.E.; Sobsey, M.D.; Casanova, L.M. Turbidity Reduction in Drinking Water by Coagulation-Flocculation with Chitosan Polymers. J. Water Health 2019, 17, 204–218. [Google Scholar] [CrossRef]
- Quintana-Baquedano, A.A.; Sanchez-Salas, J.L.; Flores-Cervantes, D.X. A Review of Technologies for the Removal of Sulfate from Drinking Water. Water Environ. J. 2023. [Google Scholar] [CrossRef]
- Venable, F.P. Zinc in Drinking Water. J. Am. Chem. Soc. 1884, 6, 214–216. [Google Scholar] [CrossRef]
- Kozisek, F. Regulations for Calcium, Magnesium or Hardness in Drinking Water in the European Union Member States. Regul. Toxicol. Pharmacol. 2020, 112, 104589. [Google Scholar] [CrossRef] [PubMed]
- Kullar, S.S.; Shao, K.; Surette, C.; Foucher, D.; Mergler, D.; Cormier, P.; Bellinger, D.C.; Barbeau, B.; Sauvé, S.; Bouchard, M.F. A Benchmark Concentration Analysis for Manganese in Drinking Water and IQ Deficits in Children. Environ. Int. 2019, 130, 104889. [Google Scholar] [CrossRef] [PubMed]
- Aggeborn, L.; Öhman, M. The Effects of Fluoride in Drinking Water. J. Polit. Econ. 2021, 129, 465–491. [Google Scholar] [CrossRef]
- Decharat, S.; Pan-In, P. Risk Assessment of Lead and Cadmium in Drinking Water for School Use in Nakhon Si Thammarat Province, Thailand. Environ. Health Toxicol. 2020, 35, e2020002. [Google Scholar] [CrossRef] [PubMed]
- Lowe, C.; Kurscheid, J.; Lal, A.; Sadler, R.; Kelly, M.; Stewart, D.; Laksono, B.; Amaral, S.; Gray, D. Health Risk Assessment for Exposure to Nitrate in Drinking Water in Central Java, Indonesia. Int. J. Environ. Res. Public Health 2021, 18, 2368. [Google Scholar] [CrossRef]
- Kumar Meher, A.; Labhsetwar, N.; Bansiwal, A. An Improved Method for Direct Estimation of Free Cyanide in Drinking Water by Ion Chromatography-Pulsed Amperometry Detection (IC-PAD) on Gold Working Electrode. Food Chem. 2018, 240, 131–138. [Google Scholar] [CrossRef]
- Jarvis, P.; Fawell, J. Lead in Drinking Water—An Ongoing Public Health Concern? Curr. Opin. Environ. Sci. Health 2021, 20, 100239. [Google Scholar] [CrossRef]
- Shakya, A.; Dodson, M.; Artiola, J.F.; Ramirez-Andreotta, M.; Root, R.A.; Ding, X.; Chorover, J.; Maier, R.M. Arsenic in Drinking Water and Diabetes. Water 2023, 15, 1751. [Google Scholar] [CrossRef]
- Cossey, H.L.; Anwar, M.N.; Kuznetsov, P.V.; Ulrich, A.C. Biofilms for Turbidity Mitigation in Oil Sands End Pit Lakes. Microorganisms 2021, 9, 1443. [Google Scholar] [CrossRef] [PubMed]
- Gou, Y.; Yang, J.; Fang, F.; Guo, J.; Ma, H. Feasibility of Using a Novel Algal-Bacterial Biofilm Reactor for Efficient Domestic Wastewater Treatment. Environ. Technol. 2020, 41, 400–410. [Google Scholar] [CrossRef] [PubMed]
- Ewaid, S.; Abed, S.; Al-Ansari, N.; Salih, R. Development and Evaluation of a Water Quality Index for the Iraqi Rivers. Hydrology 2020, 7, 67. [Google Scholar] [CrossRef]
- Tyagi, S.; Sharma, B.; Singh, P.; Dobhal, R. Water Quality Assessment in Terms of Water Quality Index. Am. J. Water Resour. 2020, 1, 34–38. [Google Scholar] [CrossRef]
- Uddin, M.G.; Nash, S.; Olbert, A.I. A Review of Water Quality Index Models and Their Use for Assessing Surface Water Quality. Ecol. Indic. 2021, 122, 107218. [Google Scholar] [CrossRef]
Disclaimer/Publisher’s Note: The statements, opinions and data contained in all publications are solely those of the individual author(s) and contributor(s) and not of MDPI and/or the editor(s). MDPI and/or the editor(s) disclaim responsibility for any injury to people or property resulting from any ideas, methods, instructions or products referred to in the content. |
© 2023 by the authors. Licensee MDPI, Basel, Switzerland. This article is an open access article distributed under the terms and conditions of the Creative Commons Attribution (CC BY) license (https://creativecommons.org/licenses/by/4.0/).